Simultaneous two-photon imaging and photo-stimulation with structured light illumination
12
Simultaneous two-photon imaging and photo- stimulation with structured light illumination Marco Dal Maschio, Francesco Difato, Riccardo Beltramo, Axel Blau, Fabio Benfenati, and Tommaso Fellin* Dept. of Neuroscience and Brain Technologies, Italian Institute of Technology, Via Morego 30, 16163 Genova, Italy * [email protected] Abstract: Holographic microscopy is increasingly recognized as a promising tool for the study of the central nervous system. Here we present a “holographic module”, a simple optical path that can be combined with commercial scanheads for simultaneous imaging and uncaging with structured two-photon light. The present microscope is coupled to two independently tunable lasers and has two principal configurations: holographic imaging combined with galvo-steered uncaging and holographic uncaging combined with conventional scanning imaging. We applied this flexible system for simultaneous two-photon imaging and photostimulation of neuronal cells with complex light patterns, opening new perspectives for the study of brain function in situ and in vivo. © 2010 Optical Society of America OCIS codes: (090.1995) Digital holography; (180.2520) Fluorescence microscopy; (070.6120) Spatial light modulators; (180.4315) Nonlinear microscopy. References and links 1. R. H. Kramer, D. L. Fortin, and D. Trauner, “New photochemical tools for controlling neuronal activity,” Curr. Opin. Neurobiol. 19(5), 544–552 (2009). 2. P. Saggau, “New methods and uses for fast optical scanning,” Curr. Opin. Neurobiol. 16(5), 543–550 (2006). 3. A. Bednarkiewicz, M. Bouhifd, and M. P. Whelan, “Digital micromirror device as a spatial illuminator for fluorescence lifetime and hyperspectral imaging,” Appl. Opt. 47(9), 1193–1199 (2008). 4. M. G. Gustafsson, L. Shao, P. M. Carlton, C. J. Wang, I. N. Golubovskaya, W. Z. Cande, D. A. Agard, and J. W. Sedat, “Three-dimensional resolution doubling in wide-field fluorescence microscopy by structured illumination,” Biophys. J. 94(12), 4957–4970 (2008). 5. B. E. Losavio, V. Iyer, and P. Saggau, “Two-photon microscope for multisite microphotolysis of caged neurotransmitters in acute brain slices,” J. Biomed. Opt. 14(6), 064033 (2009). 6. C. Lutz, T. S. Otis, V. DeSars, S. Charpak, D. A. DiGregorio, and V. Emiliani, “Holographic photolysis of caged neurotransmitters,” Nat. Methods 5(9), 821–827 (2008). 7. V. Nikolenko, B. O. Watson, R. Araya, A. Woodruff, D. S. Peterka, and R. Yuste, “SLM microscopy: scanless two-photon imaging and photostimulation with spatial light modulators,” Front Neural Circuits 2, 5 (2008). 8. T. L. Kelly, and J. Munch, “Phase-aberration correction with dual liquid-crystal spatial light modulators,” Appl. Opt. 37(22), 5184–5189 (1998). 9. K. D. Wulff, D. G. Cole, R. L. Clark, R. Dileonardo, J. Leach, J. Cooper, G. Gibson, and M. J. Padgett, “Aberration correction in holographic optical tweezers,” Opt. Express 14(9), 4170–4175 (2006). 10. D. R. Burnham, and D. McGloin, “Holographic optical trapping of aerosol droplets,” Opt. Express 14(9), 4176– 4182 (2006). 11. D. Cojoc, F. Difato, E. Ferrari, R. B. Shahapure, J. Laishram, M. Righi, E. M. Di Fabrizio, V. Torre, and L. Mei, “Properties of the force exerted by filopodia and lamellipodia and the involvement of cytoskeletal components,” PLoS ONE 2(10), e1072 (2007). 12. M. Zahid, M. Vélez-Fort, E. Papagiakoumou, C. Ventalon, M. C. Angulo, V. Emiliani, and F. Tell, “Holographic photolysis for multiple cell stimulation in mouse hippocampal slices,” PLoS ONE 5(2), e9431 (2010). 13. N. Ji, H. Shroff, H. Zhong, and E. Betzig, “Advances in the speed and resolution of light microscopy,” Curr. Opin. Neurobiol. 18(6), 605–616 (2008). 14. G. Losi, K. Prybylowski, Z. Fu, J. H. Luo, and S. Vicini, “Silent synapses in developing cerebellar granule neurons,” J. Neurophysiol. 87(3), 1263–1270 (2002). 15. G. J. Brakenhoff, G. W. Wurpel, K. Jalink, L. Oomen, L. Brocks, and J. M. Zwier, “Characterization of sectioning fluorescence microscopy with thin uniform fluorescent layers: Sectioned Imaging Property or SIPcharts,” J. Microsc. 219(Pt 3), 122–132 (2005). #128503 - $15.00 USD Received 26 May 2010; revised 29 Jul 2010; accepted 7 Aug 2010; published 18 Aug 2010 (C) 2010 OSA 30 August 2010 / Vol. 18, No. 18 / OPTICS EXPRESS 18720
Transcript of Simultaneous two-photon imaging and photo-stimulation with structured light illumination
Simultaneous two-photon imaging and photo-
stimulation with structured light illumination
Marco Dal Maschio, Francesco Difato, Riccardo Beltramo, Axel Blau, Fabio Benfenati,
and Tommaso Fellin*
Dept. of Neuroscience and Brain Technologies, Italian Institute of Technology, Via Morego 30, 16163 Genova, Italy
Abstract: Holographic microscopy is increasingly recognized as a
promising tool for the study of the central nervous system. Here we present
a “holographic module”, a simple optical path that can be combined with
commercial scanheads for simultaneous imaging and uncaging with
structured two-photon light. The present microscope is coupled to two
independently tunable lasers and has two principal configurations:
holographic imaging combined with galvo-steered uncaging and
holographic uncaging combined with conventional scanning imaging. We
applied this flexible system for simultaneous two-photon imaging and
photostimulation of neuronal cells with complex light patterns, opening new
perspectives for the study of brain function in situ and in vivo.
© 2010 Optical Society of America
OCIS codes: (090.1995) Digital holography; (180.2520) Fluorescence microscopy; (070.6120)
Spatial light modulators; (180.4315) Nonlinear microscopy.
References and links
1. R. H. Kramer, D. L. Fortin, and D. Trauner, “New photochemical tools for controlling neuronal activity,” Curr.
Opin. Neurobiol. 19(5), 544–552 (2009).
2. P. Saggau, “New methods and uses for fast optical scanning,” Curr. Opin. Neurobiol. 16(5), 543–550 (2006).
3. A. Bednarkiewicz, M. Bouhifd, and M. P. Whelan, “Digital micromirror device as a spatial illuminator for
fluorescence lifetime and hyperspectral imaging,” Appl. Opt. 47(9), 1193–1199 (2008).
4. M. G. Gustafsson, L. Shao, P. M. Carlton, C. J. Wang, I. N. Golubovskaya, W. Z. Cande, D. A. Agard, and J. W.
Sedat, “Three-dimensional resolution doubling in wide-field fluorescence microscopy by structured
illumination,” Biophys. J. 94(12), 4957–4970 (2008).
5. B. E. Losavio, V. Iyer, and P. Saggau, “Two-photon microscope for multisite microphotolysis of caged
neurotransmitters in acute brain slices,” J. Biomed. Opt. 14(6), 064033 (2009).
6. C. Lutz, T. S. Otis, V. DeSars, S. Charpak, D. A. DiGregorio, and V. Emiliani, “Holographic photolysis of caged
neurotransmitters,” Nat. Methods 5(9), 821–827 (2008).
7. V. Nikolenko, B. O. Watson, R. Araya, A. Woodruff, D. S. Peterka, and R. Yuste, “SLM microscopy: scanless
two-photon imaging and photostimulation with spatial light modulators,” Front Neural Circuits 2, 5 (2008).
8. T. L. Kelly, and J. Munch, “Phase-aberration correction with dual liquid-crystal spatial light modulators,” Appl.
Opt. 37(22), 5184–5189 (1998).
9. K. D. Wulff, D. G. Cole, R. L. Clark, R. Dileonardo, J. Leach, J. Cooper, G. Gibson, and M. J. Padgett,
“Aberration correction in holographic optical tweezers,” Opt. Express 14(9), 4170–4175 (2006).
10. D. R. Burnham, and D. McGloin, “Holographic optical trapping of aerosol droplets,” Opt. Express 14(9), 4176–
4182 (2006).
11. D. Cojoc, F. Difato, E. Ferrari, R. B. Shahapure, J. Laishram, M. Righi, E. M. Di Fabrizio, V. Torre, and L. Mei,
“Properties of the force exerted by filopodia and lamellipodia and the involvement of cytoskeletal components,”
PLoS ONE 2(10), e1072 (2007).
12. M. Zahid, M. Vélez-Fort, E. Papagiakoumou, C. Ventalon, M. C. Angulo, V. Emiliani, and F. Tell, “Holographic
photolysis for multiple cell stimulation in mouse hippocampal slices,” PLoS ONE 5(2), e9431 (2010).
13. N. Ji, H. Shroff, H. Zhong, and E. Betzig, “Advances in the speed and resolution of light microscopy,” Curr.
Opin. Neurobiol. 18(6), 605–616 (2008).
14. G. Losi, K. Prybylowski, Z. Fu, J. H. Luo, and S. Vicini, “Silent synapses in developing cerebellar granule
neurons,” J. Neurophysiol. 87(3), 1263–1270 (2002).
15. G. J. Brakenhoff, G. W. Wurpel, K. Jalink, L. Oomen, L. Brocks, and J. M. Zwier, “Characterization of
sectioning fluorescence microscopy with thin uniform fluorescent layers: Sectioned Imaging Property or
SIPcharts,” J. Microsc. 219(Pt 3), 122–132 (2005).
#128503 - $15.00 USD Received 26 May 2010; revised 29 Jul 2010; accepted 7 Aug 2010; published 18 Aug 2010(C) 2010 OSA 30 August 2010 / Vol. 18, No. 18 / OPTICS EXPRESS 18720

16. E. Papagiakoumou, V. de Sars, D. Oron, and V. Emiliani, “Patterned two-photon illumination by spatiotemporal
shaping of ultrashort pulses,” Opt. Express 16(26), 22039–22047 (2008).
17. C. Maurer, S. Khan, S. Fassl, S. Bernet, and M. Ritsch-Marte, “Depth of field multiplexing in microscopy,” Opt.
Express 18(3), 3023–3034 (2010).
18. G. Sinclair, J. Leach, P. Jordan, G. Gibson, E. Yao, Z. Laczik, M. Padgett, and J. Courtial, “Interactive
application in holographic optical tweezers of a multi-plane Gerchberg-Saxton algorithm for three-dimensional
light shaping,” Opt. Express 12(8), 1665–1670 (2004).
19. V. Emiliani, D. Cojoc, E. Ferrari, V. Garbin, C. Durieux, M. Coppey-Moisan, and E. Di Fabrizio, “Wave front
engineering for microscopy of living cells,” Opt. Express 13(5), 1395–1405 (2005).
20. M. Fricke, and T. Nielsen, “Two-dimensional imaging without scanning by multifocal multiphoton microscopy,”
Appl. Opt. 44(15), 2984–2988 (2005).
1. Introduction
A rapidly increasing number of new optical tools for the study of brain function is becoming
available to neuroscientists. These tools include, among others, fluorescent and photo-
switchable molecules, caged compounds, light-activated ion channels and pumps [1]. In
parallel with the increasing size of this “optical toolbox” for brain circuit investigation, there
is a growing need for optical techniques that allow the illumination of the biological sample
with precise, yet complex, spatial patterns. For example, many applications require the
fast/simultaneous monitoring/stimulation of different regions of interest (ROIs) in the field of
view [2]. A number of different approaches including digital micromirror devices (DMDs),
multibeam illumination, acusto optic deflectors (AODs) and liquid crystal on silicon spatial
light modulators (LCOS-SLMs) have been developed to achieve this goal [3–7]. Among
these, LCOS-SLMs, which shape the laser wave-front by modulating the phase of the incident
light, are increasingly recognized as a very promising approach to generate structured light
illumination.
LCOS-SLMs are composed of a high density matrix of liquid crystal pixels. By regulating
the orientation of the liquid crystals within each pixel, it is possible to finely modulate the
phase of the light impinging on the LCOS-SLM. The whole active area of a spatial light
modulator can be configured via software with a diffractive optical element (DOE) which
results in the desired pattern of illumination at the sample plane. The LCOS-SLMs generally
have a limited diffraction efficiency compared to phase plates (about 40% vs 85%), and a
lower refresh rate with respect to DMDs (180 frames/s vs 13 kframes/s). Nonetheless, LCOS-
SLMs offer the opportunity to generate arbitrary DOEs using the whole numerical aperture of
the objective, without affecting the total amount of light power delivered to the sample.
Moreover, commercial LCOS-SLMs with proper optical windows covering the wavelengths
ranging from UV to IR are readily available.
Initially used for aberration correction optics and optical-tweezer applications [8–11],
holographic microscopy using LCOS-SLMs has been recently applied to functional studies of
neuronal physiology with very encouraging results. Patterned uncaging of caged-glutamate in
combination with electrophysiology has been performed in brain slice preparation either by
using single [6] or two-photon excitation [7]. Fast glutamatergic currents of various amplitude
and kinetics could be elicited by patterned light illumination of various neuronal structures
including spines, portions of dendrites and cell bodies. Moreover, a very recent study
extended these initial findings and combined single photon holographic uncaging with HiLo
(high frequency/low frequency) sequential acquisition microscopy to study the response of
neuronal and glial cells to glutamate photolysis in hippocampal slices [12]. Besides uncaging,
holographic illumination with LCOS-SLMs has also been used for fast, scanless imaging of
neuronal fluorescence signals [7], thus improving the time resolution of low invasive imaging
techniques [13].
Despite these results show the potential of holographic microscopy for the investigation of
neuronal circuits, this approach has still very limited diffusion in Neuroscience laboratories
due to the lack of commercially available holographic microscopes and the need to develop
customed, optical apparatus.
#128503 - $15.00 USD Received 26 May 2010; revised 29 Jul 2010; accepted 7 Aug 2010; published 18 Aug 2010(C) 2010 OSA 30 August 2010 / Vol. 18, No. 18 / OPTICS EXPRESS 18721

In this paper we present a “holographic module”, a compact, simple optical path that can
be easily implemented with commercial scanheads to allow spatial shaping of laser light. The
combination of the holographic module with a Prairie Ultima IV scanhead (Prairie
Technologies, Madison WI) constitutes a holographic microscope capable of simultaneous
two-photon imaging and uncaging using two independent laser sources at different
wavelengths. The present set-up gives the opportunity to combine the intrinsic three-
dimensional spatial resolution of a non-linear imaging system with the possibility to
simultaneously access arbitrary regions of the sample in time and space. We show that this
microscope represents a flexible optical set-up with multiple experimental configurations that
can be applied to the study of neuronal tissue. Given the enhanced tissue penetration depth of
infrared radiation compared to visible light, this system opens new vistas in the application of
holographic microscopy to the investigation of the central nervous system both in situ and in
vivo.
2. Materials and methods
2.1 Optical setup
The optical set up is composed of two mode-locked Ti:Sapphire laser sources (one Ultra and
one Ultra II Chameleon, Coherent, Milan, Italy), the “holographic module” (Fig. 1A-B, pink
area), a commercial Prairie Ultima IV scanhead (Fig. 1A-B, blue area, Prairie, Madison, WI)
and an upright epifluorescence microscope (BX61 Olympus, Milan, Italy).
Fig. 1. Schematic representation of the two experimental configurations of the optical set-up.
A) The imaging beam (solid red line) coming from a Coherent Ultra II Chameleon laser is
deflected by a flipping mirror (FM1), reshaped and modulated by the “holographic module”
(pink area of the optical layout) and then directed to a commercial Prairie Ultima IV scanhead
(blue area of the optical layout) coupled with a motorized Olympus BX61 microscope. A first
telescope (L1 and L2) is used to reshape the laser beam to fit the Hamamatsu LCOS-SLM
active window, while the lenses L3 and L4 form a second telescope that optimizes the beam
size according to the dimensions of the mirrors inside the scanhead. A half wave plate (λ/2) is
placed before the LCOS-SLM to modulate the beam polarization (see Methods section). A
small piece of aluminum foil (ZB) mounted on a glass coverslip is placed at the focal plane of
the second telescope (between L3 and L4) to reflect the zero order light (see description of the
optical set up in the main text). Legend: PC1, pockel cell of the imaging beam; PC2, pockel cell
of the uncaging beam; M1, turning mirror; λ/2, half wave plate; L1, plano-convex lens (f = 30
mm); L2, plano-convex lens (f = 100 mm); SLM, spatial light modulator; L3, plano-convex
lens (f = 300 mm); M2, turning mirror; M3, turning mirror; ZB, zero order block; L4, plano-
convex lens (f = 100 mm); PBS1, polarizing beam splitter; GM1, galvo mirror of imaging
beam; M4, turning mirror; DM0, 760 nm long-pass dichroic mirror; L5, proprietary scan lens (f
= 75 mm); DM1, 660 nm short-pass dichroic mirror; L6, proprietary tube lens (f = 180 mm);
DM2, 660 nm long-pass dichroic mirror; DM3, 575 nm long-pass dichroic mirror; PMT1,
photomultiplier #1; PMT2, photomultiplier #2; CCD1, CCD camera; GM2, galvo mirror of the
uncaging beam; OBJ, microscope objective. (B) The uncaging beam (dashed black line)
coming from a Coherent Chameleon Ultra laser is deflected by a flipping mirror (FM2) in the
#128503 - $15.00 USD Received 26 May 2010; revised 29 Jul 2010; accepted 7 Aug 2010; published 18 Aug 2010(C) 2010 OSA 30 August 2010 / Vol. 18, No. 18 / OPTICS EXPRESS 18722

“holographic module”. Beam path is the same as described in A) except that the laser light is
deflected by a mirror (M6) into the uncaging pathway of the Prairie scanhead. The plano-
convex lens L4 (f = 100 mm) is, in this experimental configuration, moved to the uncaging
path. The blue circles point to the optical elements that are different between the configuration
displayed in A) and that shown in B). Legend: FM2, flipping mirror; M6 turning mirror.
The “holographic module” is composed of seven principal parts: i) Flipping mirrors
(FM1, FM2 in Fig. 1A-B, PF10-03-P01 Thorlabs, Newton, NJ). This couple of mirrors is used
for deflecting either one or the other laser beam onto the holographic path. When structured
illumination is desired in the imaging or uncaging paths, the flipping mirror FM1 or FM2 are
flipped up respectively. Figure 1A shows the microscope in the configuration in which
holographic illumination is performed in the imaging path (solid red line). Figure 1B shows
the alternative configuration in which holographic illumination is applied to the uncaging
beam (dashed black line), while the imaging beam (solid red line) is directed to the scanhead
scanning mirrors. When no holographic illumination is required in either one of the laser
beams, both flipping mirrors (FM1 and FM2) stay in the down position. ii) Periscope. A
series of mirrors (PS3 in Fig. 1, BB1-E03 Thorlabs, Newton, NJ) is used to bring the light
from the plane of the optical table to that of the input port of the scanhead. iii) Half wave plate
(λ/2 in Fig. 1, RAC 5.2.10 achromatic λ/2 retarder - B. Halle Nachfl GMBH). The LCOS-
SLM is sensitive to the polarization of the incident light. It acts as a phase-only modulator for
light linearly polarized in the direction corresponding to the liquid crystal orientation. The
half-wave plate has thus to be properly rotated in order to match the LCOS-SLM optimal
orientation. iv) Primary telescope. A pair of plano-convex lenses (L1 and L2 in Fig. 1, IR
doublets, Thorlabs, Newton, NJ) is used to resize the laser beam to fill the active window of
the LCOS-SLM. Using this approach, we spread the beam power throughout the maximum
number of pixels available on the LCOS-SLM chip, to exploit the highest frequency content
of the computer-generated diffractive optical element (DOE). v) LCOS-SLM. We used a
reflective X10468-07 LCOS-SLM (Hamamatsu, Milan, Italy) with the following
characteristics: pixel resolution, 800x600; active area dimension, 16 x 12 mm2; pixel
dimension, 20x20 µm2; wavelength range, 680-1100 nm; pixel fill factor, 95%; phase
modulation, 0-2π; refresh rate, 60 Hz. The LCOS-SLM is controlled by means of a modified
version of the open-source Labview-based software released by the Optics Group of the
Physics Department of the University of Glasgow
(http://www.physics.gla.ac.uk/Optics/projects/tweezers/software/; see section 2.2 for details)
and interfaced with a computer via a DVI connection. With respect to the direction normal to
the LCOS-SLM plane the reflective angle is 9.5°. vi) Secondary telescope. It reshapes the
laser beam to fit the dimensions of the mirrors inside the scanhead conjugating the LCOS-
SLM to the objective back focal plane. It is composed of two plano-convex lenses (L3 and L4
in Fig. 1A-B, IR doublets, Thorlabs, Newton, NJ). vii) Zero order block. To remove the
straight light of the “zero order” component, a small piece of aluminum foil is mounted on a
glass coverslip and placed at the Fourier plane of the first lens of the secondary telescope (ZB,
between L3 and L4, see Fig. 1).
With the exception of the flipping mirrors (FM1 and FM2) and of the first mirror of the
periscope, which are mounted on the optical table, all the remaining parts of the “holographic
module” are mounted on a single breadboard elevated to the plane of the scanhead. The
physical dimensions of the “holographic module” are: 60 x 30 x 18 cm3 (L x W x H). We
measured the broadening of femtosecond pulses at the sample plane with an Olympus 20X,
objective and a CARPE autocorrelator (APEBerlin, Berlin, Germany). In the 760-980 nm
range, the average group velocity dispersion (GVD) introduced by the “holographic module”
is approximately 20000 fs2.
The Ultima IV Prairie scanhead has two sets of galvo mirrors. GM1 in Fig. 1 are scanning
mirrors for the imaging beam while GM2 are beam steering mirrors for the uncaging beam.
#128503 - $15.00 USD Received 26 May 2010; revised 29 Jul 2010; accepted 7 Aug 2010; published 18 Aug 2010(C) 2010 OSA 30 August 2010 / Vol. 18, No. 18 / OPTICS EXPRESS 18723

The two beams are then combined by a dichroic mirror DM0 and reshaped to match the pupil
aperture of the microscope objective (L5 and L6 in Fig. 1A-B).
DM1 in Fig. 1 is a short-pass dichroic mirror (FF670-SDi01, Semrock) which reflects two-
photon excitation light onto the sample and allows the detection of emitted fluorescence
(green line in Fig. 1) via a CCD camera (ORCA R2 Hamamatsu, Milan, Italy). An IR
blocking filter (ET750sp-2p8, Chroma) in combination with specific emission filters is
positioned in front of the camera for fluorescence imaging. Alternatively, when traditional
scanning fluorescence microscopy is required, the dichroic mirror DM2 is inserted in the
emission path to deflect fluorescence signals to the two photomultipliers tubes (PMTs).
The switch between the configuration shown in Fig. 1A and that displayed in Fig. 1B is
essentially limited to three steps (circled in blue in Fig. 1B), namely: 1) Turn down the
flipping mirror (FM1) in the imaging path and turn up the flipping mirror (FM2) in the
uncaging path. 2) Move the lens L4 of the secondary telescope from the imaging to the
uncaging path. 3) Position the mirror M6 to deflect the holographic uncaging beam onto the
uncaging galvos (GM2).
2.2 Generation of the diffractive optical element (DOE)
In order to generate appropriate DOEs, the SLM is controlled via personal computer by a
modified version of the Labview-based software “Blue Tweezers” (released by the Optic
Group, Department of Physics, University of Glasgow; http://www.physics.gla.ac.uk/Optics/
projects/tweezers/software/). The modified software allows the calibration of the field of view
in which holographic illumination can be performed (“holographic field”) with respect to the
fields of view of the image-acquisition devices (PMTs and CCD camera). Once this
calibration procedure is performed, various regions of interest with arbitrary shapes can be
defined based on the images acquired with the camera or with the PMTs, depending on the
configuration used (Fig. 1A or Fig. 1B respectively). Images are transformed into binary
masks and used as input matrices for the Gerchberg-Saxton algorithm adopted for the
generation of the DOEs.
2.3 Neuronal cell preparation
All the experimental protocols were approved by the Italian Ministry of Health. Primary
neuronal cultures from the hippocampus were prepared from neonatal E18 C57BL6/J mice.
Blocks of tissue from the hippocampus were removed and chopped. Cells were dissociated in
trypsin (0,125 mg/ml) and then placed on poly-D-lysine-coated (100 µg/ml; Sigma) glass
coverslips at a density of 5x10⁴ cells per dish. Cells were incubated with Neurobasal medium
supplemented with 10% fetal bovine serum, penicillin/streptomycin (104 units/ml penicillin;
104 µg/ml streptomycin) and glutamine (200 mM, Invitrogen, Milan, Italy). After three hours
the medium was replaced with Neurobasal medium supplemented with B27 (Invitrogen,
Milan, Italy), penicillin/streptomycin (104 units/ml penicillin; 10
4 µg/ml streptomycin) and
glutamine (200 mM, Invitrogen, Milan, Italy). Cerebellar granule cells used for the
experiments displayed in Fig. 6 were prepared as described in [14]. Cells were used at 10-15
days in vitro and incubated with 1.5 µM Fluo-4 for 30 minutes in HEPES buffered saline
before recording. Fluo-4 fluorescence was excited at 830 nm and filtered by an emission filter
(530/50 nm Chroma). MNI-glutamate (1.5 mM, Tocris, Bristol, UK) was added to the
extracellular saline before performing the uncaging experiment.
3. Results
We first characterized the properties of the holographic optical path. As shown in Fig. 2,
different holograms could be generated with the SLM on either the imaging or the uncaging
lasers, resulting in complex patterns of illumination in the sample plane. We observed the
shaping of the laser beam either by imaging the two-photon light reflected by a mirror
positioned at the sample plane (Fig. 2C) or by measuring the fluorescence emitted by a
#128503 - $15.00 USD Received 26 May 2010; revised 29 Jul 2010; accepted 7 Aug 2010; published 18 Aug 2010(C) 2010 OSA 30 August 2010 / Vol. 18, No. 18 / OPTICS EXPRESS 18724

homogeneous 115 nm thick layer of fluorescein and perylenediimid (Fig. 2D) [15]. Multiple
spots (Fig. 2, top) or arbitrary shapes of various dimensions (Fig. 2, middle and bottom) could
be generated, resulting in the illumination of desired regions of interest (ROIs) in the field of
view.
Fig. 2. Two-photon structured light illumination. A) Example of light patterns that can be
projected onto the sample plane. Four diffraction-limited spots positioned at the four corners of
the field of view (top image), four rectangular shapes (middle panel) and a donut-like shape
(bottom image) are shown. (B) Computer-generated DOEs corresponding to the different light
patterns shown in (A) are sent to the LCOS-SLM. Given that the LCOS-SLM is a phase-only
modulator, black/white shades on the panel correspond to 0-2 π phase modulation. (C) Two-
photon excitation light reflected by a mirror positioned in the focal plane of the objective
measured for the different illumination patterns shown in (A). Scale bar 20 µm. (D)
Fluorescence signals from a 115 nm thick layer of fluorescein and perylenediimid generated by
the two-photon excitation patterns shown in (A). Scale bar 20 µm. These data were obtained
with the instrument in the configuration shown in Fig. 1A but similar results were gathered
when the uncaging laser was deflected into the “holographic module” (configuration shown in
Fig. 1B). The objective used was an Olympus 20X. (E) Line profiles showing the variation of
light within different holographic shapes. Profiles shown in E correspond to the red lines
shown in (D). Values on the x axis are expressed in µm while the y axis shows normalized
intensity values in arbitrary units.
The intensity profile of large spots was characterized by sharp edges with relatively large
variation (~60% for a circular shape of 8 µm diameter) within the spot (see also Fig. 2E).
Noteworthy, enlarging the spot size (Fig. 2, middle) decreased the density of photons in the
imaged area but still maintained a sufficient two-photon excitation probability to induce
fluorescence emission. We performed structured illumination with a number of different
Olympus objectives from a 20X (XLUMPLFL20XW, 0.95 NA) to a 40X (LUMPLFL40XW,
0.8 NA) and a 60X (LUMFL, 1.1 NA). The area where holographic shaping of light could be
achieved was a subregion of the field of view the dimensions of which depended on the
objective used. For a 20X (0.95 NA) objective, which was mostly used to perform the
experiments described in this study, the holographic field had a diameter of ~150 µm.
In our experimental configuration, approximately 29% of the incoming light went in the
un-diffracted “zero order” component. As previously reported [7], for most experiments we
adopted the configuration in which the zero order beam was in the center of the field of view
and was blocked by a small reflecting piece of aluminum foil positioned in the Fourier plane
of the first lens of the secondary telescope (see Fig. 1). This plane is conjugated to the plane
of the sample and the removal of the zero order by reflection in the conjugated plane caused
#128503 - $15.00 USD Received 26 May 2010; revised 29 Jul 2010; accepted 7 Aug 2010; published 18 Aug 2010(C) 2010 OSA 30 August 2010 / Vol. 18, No. 18 / OPTICS EXPRESS 18725

the appearance of a negligible dark region (< 8 µm in radius) in the center of the field of view.
Given that we have control of the relative position of the sample with respect to the
holographic beam, this does not represent an experimental constraint. The holographic optical
path, including the block of the “zero order” beam, had an overall transmission efficiency of
about 40% resulting in a maximum power delivered to the sample of about 200 mW (at 720
nm). This value represents an upper limit to the number and size of holographic spots that
could be generated in the field of view, given that this value of power had to be distributed
between the different holographic shapes and that a certain amount of power (see also Fig. 5-
6) was required to generate two-photon excitation/uncaging for each single holographic shape.
Fig. 3. Axial dimension of structured light and point spread function of the holographic
microscope. A-C) x-y (top) and x-z (bottom) profiles for illumination of a 115 nm thick film of
fluorescein and perylenediimid with three circular shapes of different diameter. Scale bars: 10
µm. D-E) The intensity profile in the axial direction is generated for five different patterns of
illumination (D). The full width (in the axial direction) at half maximum (FWHM) is then
measured and plotted as a function of the x dimension of the light pattern (E). Note that the x
dimension is calculated as the width of the intensity profile (in the x direction) at a threshold
level set to 5 times the standard deviation of the background. F-G) Intensity profiles in the x-y
(F) and z (G) directions of sub-resolved (20 nm) fluorescent beads excited at 830 nm with the
imaging beam passing (holo, red trace) and not passing (no holo, black trace) through the
“holographic module”. Each trace is the average of four measurements on different beads.
These recordings were performed with a 60X, water immersion objective with a numerical
aperture of 1.1.
We also characterized the axial dimension of the shaped beam. The axial propagation of
circular shapes of different diameters is shown in Fig. 3A-D (images acquired with a 20X
objective). As previously shown for single [6] and two-photon excitation [16], we confirmed
the linear relationship between the x-y dimension of the holographic shape and the axial
propagation (FWHM, Fig. 3E). Moreover, light impinging on different radial regions of the
“holographic field” propagated similarly in the axial direction (data not shown). Importantly,
the introduction of the “holographic module” did not significantly affect the point spread
function (PSF) of the microscope (Fig. 3F-G).
We implemented our software to utilize images acquired either with the scanning two-
photon system or with wide-field camera to generate the desired pattern of illumination (see
method section 2.2). Once the two-photon or epifluorescence images were acquired, ROIs
were generated, and used as a mask to create complex patterns of excitation in our sample
plane according to the geometry of the biological sample. Figure 4A shows the
epifluorescence image of a Fluo-4 loaded neuron. The image was then binarized (Fig. 4B-B2)
according to specific ROIs corresponding to different portions of the cell, and used to generate
a phase hologram (Fig. 4C-C2) to illuminate only the selected regions. Figure 4D-D2 shows
#128503 - $15.00 USD Received 26 May 2010; revised 29 Jul 2010; accepted 7 Aug 2010; published 18 Aug 2010(C) 2010 OSA 30 August 2010 / Vol. 18, No. 18 / OPTICS EXPRESS 18726

the Fluo-4 fluorescence image obtained with holographic two-photon illumination according
to the ROIs defined in Fig. 4B-B2.
Fig. 4. Illumination of a neuronal cell with complex light patterns. A) A two-photon
fluorescence image of a Fluo-4-loaded neuron is acquired with the CCD camera (CCD1 in Fig.
1). Scale bar: 10 µm. B-C) Binary images containing only the regions of interest corresponding
to the cell body (B1) or the neuronal processes (B and B2) are created a posteriori from the
image shown in (A) and used to generate the DOEs displayed in C-C2). Scale bar: 10 µm. D-
D2) Fluorescence images obtained with holographic illumination with the patterns shown in (B-
B2). Scale bar: 10 µm.
To demonstrate the suitability of the presented holographic microscope for simultaneous
two-photon imaging and uncaging on living cells in the two experimental configurations
described in Fig. 1, we measured cytosolic Ca2+
signals in neuronal cultures while uncaging
MNI-glutamate. We first used the experimental configuration in which holographic imaging is
combined with galvo-steered uncaging (Fig. 1A). An image of Fluo-4 fluorescence (Fig. 5A)
was first acquired with the two-photon scanning system and used to generate a desired DOE.
The DOE shaped the imaging beam to illuminate only specific ROIs in the field of view
corresponding to different cells or different portions of a given cell (nine green spots in Fig.
5A; average power of the imaging laser/spot, < 4 mW; λ = 830 nm).
#128503 - $15.00 USD Received 26 May 2010; revised 29 Jul 2010; accepted 7 Aug 2010; published 18 Aug 2010(C) 2010 OSA 30 August 2010 / Vol. 18, No. 18 / OPTICS EXPRESS 18727
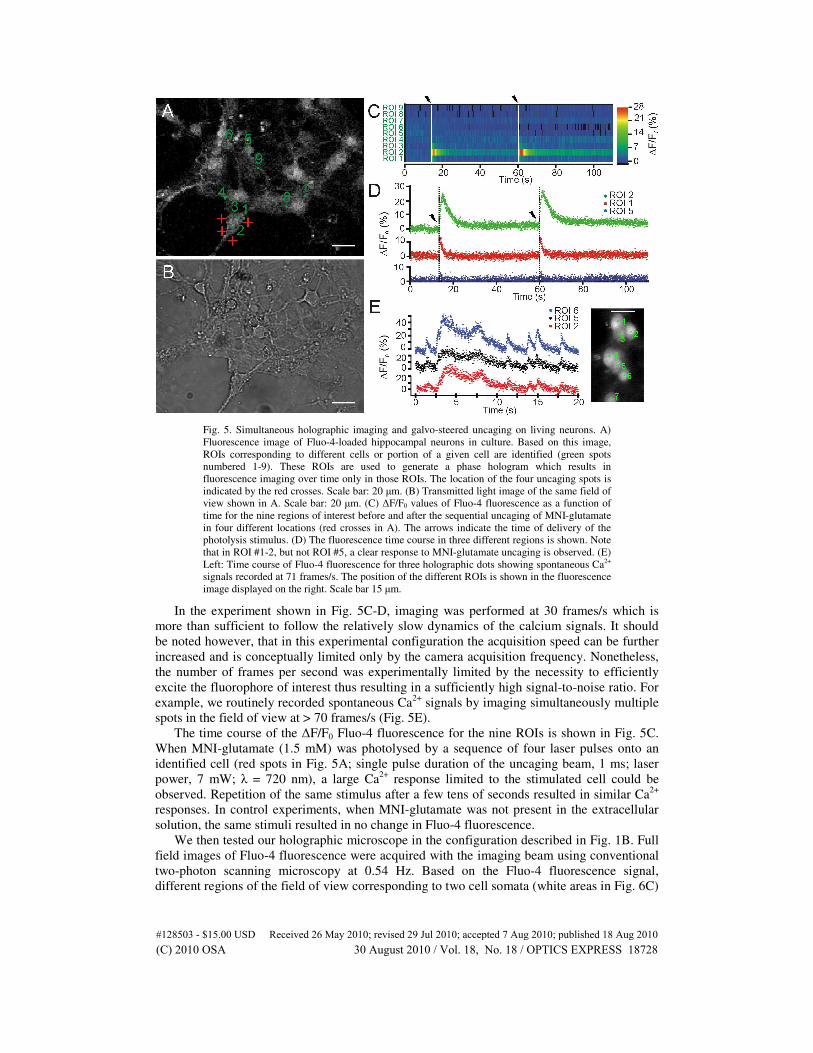
Fig. 5. Simultaneous holographic imaging and galvo-steered uncaging on living neurons. A)
Fluorescence image of Fluo-4-loaded hippocampal neurons in culture. Based on this image,
ROIs corresponding to different cells or portion of a given cell are identified (green spots
numbered 1-9). These ROIs are used to generate a phase hologram which results in
fluorescence imaging over time only in those ROIs. The location of the four uncaging spots is
indicated by the red crosses. Scale bar: 20 µm. (B) Transmitted light image of the same field of
view shown in A. Scale bar: 20 µm. (C) ∆F/F0 values of Fluo-4 fluorescence as a function of
time for the nine regions of interest before and after the sequential uncaging of MNI-glutamate
in four different locations (red crosses in A). The arrows indicate the time of delivery of the
photolysis stimulus. (D) The fluorescence time course in three different regions is shown. Note
that in ROI #1-2, but not ROI #5, a clear response to MNI-glutamate uncaging is observed. (E)
Left: Time course of Fluo-4 fluorescence for three holographic dots showing spontaneous Ca2+
signals recorded at 71 frames/s. The position of the different ROIs is shown in the fluorescence
image displayed on the right. Scale bar 15 µm.
In the experiment shown in Fig. 5C-D, imaging was performed at 30 frames/s which is
more than sufficient to follow the relatively slow dynamics of the calcium signals. It should
be noted however, that in this experimental configuration the acquisition speed can be further
increased and is conceptually limited only by the camera acquisition frequency. Nonetheless,
the number of frames per second was experimentally limited by the necessity to efficiently
excite the fluorophore of interest thus resulting in a sufficiently high signal-to-noise ratio. For
example, we routinely recorded spontaneous Ca2+
signals by imaging simultaneously multiple
spots in the field of view at > 70 frames/s (Fig. 5E).
The time course of the ∆F/F0 Fluo-4 fluorescence for the nine ROIs is shown in Fig. 5C.
When MNI-glutamate (1.5 mM) was photolysed by a sequence of four laser pulses onto an
identified cell (red spots in Fig. 5A; single pulse duration of the uncaging beam, 1 ms; laser
power, 7 mW; λ = 720 nm), a large Ca2+
response limited to the stimulated cell could be
observed. Repetition of the same stimulus after a few tens of seconds resulted in similar Ca2+
responses. In control experiments, when MNI-glutamate was not present in the extracellular
solution, the same stimuli resulted in no change in Fluo-4 fluorescence.
We then tested our holographic microscope in the configuration described in Fig. 1B. Full
field images of Fluo-4 fluorescence were acquired with the imaging beam using conventional
two-photon scanning microscopy at 0.54 Hz. Based on the Fluo-4 fluorescence signal,
different regions of the field of view corresponding to two cell somata (white areas in Fig. 6C)
#128503 - $15.00 USD Received 26 May 2010; revised 29 Jul 2010; accepted 7 Aug 2010; published 18 Aug 2010(C) 2010 OSA 30 August 2010 / Vol. 18, No. 18 / OPTICS EXPRESS 18728

were selected and used to generate holographic photolysis only in those specific areas (regions
delimited by red lines in Fig. 6D).
Fig. 6. Simultaneous scanning fluorescence imaging and holographic uncaging. A) Bright field
image of cerebellar granule cells in culture. Scale bar: 10 µm. (B) Epifluorescence image
displaying Fluo-4 loaded neurons in the same field of view shown in A). Based on this image,
an image mask (C) is generated to shape the laser wave front of the uncaging beam. (D) While
uncaging is performed simultaneously on two identified cells (areas delimited by red lines),
imaging is performed with conventional scanning microscopy at 0.54 Hz. ROIs (numbered
from 1 to 7) corresponding to different cells are shown in green. E-F) Time course of ∆F/F0
values of Fluo-4 fluorescence in the 7 ROIs displayed in D) before and after the application of
the holographic uncaging stimulus. Note the clear response of the neurons (ROIs #2 and #3)
upon which MNI-glutamate was holographically uncaged. The arrows indicate the time of
delivery of the photolysis stimulus.
Laser power of the uncaging beam (at 720 nm) was 0.26 mW/µm2, while the pulse
duration was 50 ms. Figure 6E-F show the time course of the ∆F/F0 Fluo-4 fluorescence in 7
circular ROIs (green spots in Fig. 6D, numbered 1 through 7) before and after holographic
photolysis of MNI-glutamate with the illumination pattern shown in Fig. 6C. Ca2+
signals in
the selected cells (ROI #2 and #3) were observed upon MNI-glutamate uncaging. After the
first photolysis event, delivery of a second identical stimulus resulted in similar neuronal
responses (Fig. 6E-F). Importantly, in control experiments where MNI-glutamate was absent
from the extracellular solution, the same stimulus used to uncage MNI-glutamate had no
effect on Fluo-4 signals (data not shown).
4. Discussion
In this study we present a new optical set-up for simultaneous two-photon imaging and
uncaging with structured light illumination. The core of our system is the “holographic
module”, a simple and compact optical path that shapes the Gaussian distribution of the two-
photon beam by using a reflective LCOS-SLM. We propose the “holographic module” as an
effective add-on to commercial non-linear microscopes for the illumination of biological
samples with complex light patterns. We demonstrate that the implementation of a Prairie
Ultima IV scanhead with the “holographic module” results in a flexible optical systems with
two main experimental configurations for simultaneous two-photon imaging, uncaging and
holography. In the first configuration, fast holographic imaging combined with point uncaging
can be performed; in the second, conventional scanning imaging is combined with
holographic uncaging. Both configurations were tested to study Ca2+
responses in living
neurons following caged-glutamate photolysis, proving the potential of this new optical
#128503 - $15.00 USD Received 26 May 2010; revised 29 Jul 2010; accepted 7 Aug 2010; published 18 Aug 2010(C) 2010 OSA 30 August 2010 / Vol. 18, No. 18 / OPTICS EXPRESS 18729

system for the study of neuronal function with holographic illumination generated by a
LCOS-SLM.
Besides the use of LCOS-SLMs, different experimental strategies have been introduced
for illuminating biological samples with complex light patterns. These approaches include
digital micromirror devices (DMDs) [3], multibeam illumination [4] and acusto optic
deflectors (AODs) [5]. LCOS-SLM technology presents advantages with respect to DMDs as
the latter modulates the amplitude and not the phase of the incident beam, thus leading to
significant power loss. Moreover, unlike DMDs, the DOE generated with LCOS-SLMs make
use of the whole numerical aperture of the objective and may allow the simultaneous
illumination of distinct regions of interest at different axial positions [17–19]. Illumination of
the sample with multiple beams impinging on the back-aperture of the objective with different
angles can provide simultaneous monitoring of multiple regions of interest (ROIs) in the field
of view [20]. Nonetheless, given that any ROI requires the design of a specific optical path, it
is clear that this approach is limited to a small number of ROIs and does not offer the
flexibility of the LCOS-SLM in shaping the laser light to a desired pattern. On the other hand,
LCOS-SLMs present advantages also when compared with AODs. LCOS-SLMs allow the
simultaneous illumination of different portion of the field of view while AODs steer the laser
beam needing a few microseconds to travel from one position to the other. Moreover, AODs
allow fast positioning, but not shaping, of the laser beam and usually require pre-chirping.
Altogether LCOS-SLMs represent a valid and relatively inexpensive approach for sculpting
two-photon illumination.
It is important to note that, in order to holographically illuminate specific regions of a
biological sample with high precision in light localization, it is necessary to couple the
holographic path with a high resolution imaging system such as a confocal or HiLo
microscopes [12]. By using non-linear excitation, our approach takes advantage of the
intrinsic “confocality” of two-photon excitation to acquire thin optical sections of the sample
for the generation of our DOEs without the need for image processing.
There are different ways to further improve the optical design of our microscope. In the
experiments presented in this paper, we used 830 nm laser light for imaging and 720 nm laser
illumination for uncaging, but in principle any wavelength in the tunable range of the two
laser sources (680-1080 nm for the Chameleon, Ultra II, Coherent) can be used on either one
of the optical paths. If different wavelengths are needed, only the combining dichroic mirror
(DM0 in Fig. 1) has to be changed. This requires a set of dichroic mirrors with different cut-
off wavelengths to match those used experimentally. As a potential alternative solution, DM0
could be replaced by a polarizing beam splitter. Given that the holographic beam is polarized
in the horizontal plane, a half-wave plate could be placed in the non-holographic beam and
rotated to obtain light polarized in the plane perpendicular to that of the holographic beam. An
additional possibility is the use a 50:50 beam splitter which, nonetheless, would result in a
50% net power loss on either beams. Both options would give the flexibility of working with
any wavelength in the tunable range of the two laser sources without the need of changing the
dichroic DM0. This is going to be particularly useful when, for example, photostimulation
requires longer wavelengths than imaging. An additional improvement would regard the
“holographic module” which could be easily duplicated allowing the simultaneous sculpting
of the laser wavefront on both the imaging and the uncaging beams.
While optical approaches have proved to be a fundamental tool for the study of brain
function, the possibility to simultaneously illuminate multiple regions of a field of view with
complex shapes promises to bring the optical investigation of neuronal networks to its next
level of complexity. The diffusion of optical set-ups that allow spatial shaping of laser light is,
however, still very limited in experimental Neuroscience. The microscope described herein is
unique in combining two-photon imaging and uncaging with holography. The core of our
system, the “holographic module”, is designed to be a compact, plug-in optical path that can
be easily implemented on commercial scanning microscopes. This system can be used for
#128503 - $15.00 USD Received 26 May 2010; revised 29 Jul 2010; accepted 7 Aug 2010; published 18 Aug 2010(C) 2010 OSA 30 August 2010 / Vol. 18, No. 18 / OPTICS EXPRESS 18730

simultaneous scanning imaging of Ca2+
dyes and holographic photostimulation of opsins,
caged compounds or photo-switchable proteins leading to fundamental advancements in our
understanding of neuronal network function at cellular and subcellular resolution. At the same
time, the present microscope will allow fast, fluorescence imaging with two-photon excitation
in user-defined regions of interest and in combination with spot uncaging. These applications,
together with the observation that two-photon light penetrates deeper in biological tissue and
that some opsins are excitable at two-photon, open new perspectives in the use of the present
technology for in vivo studies.
Acknowledgments
We thank F. Succol for cell culture preparation and the Group of Optics, Department of
Physics, Glasgow University for the freeware software. We are grateful to D. Cojoc, A.
Diaspro, E. Di Fabrizio and M. Szulczewski, for critical reading of and helpful comments on
the manuscript. This work was supported by grants from MIUR PRIN program to F.
Benfenati, Telethon-Italy (GGP09134 to F. Benfenati and GGP10138 to T. Fellin) and by the
San Paolo “Programma in Neuroscienze” grant to F. Benfenati and T. Fellin. M. Dal Maschio
and F. Difato contributed equally to this work.
#128503 - $15.00 USD Received 26 May 2010; revised 29 Jul 2010; accepted 7 Aug 2010; published 18 Aug 2010(C) 2010 OSA 30 August 2010 / Vol. 18, No. 18 / OPTICS EXPRESS 18731