Simultaneous identification of natural dyes in the collection of drawings and maps from The Royal...
9
Ana López-Montes 1 Rosario Blanc García 2 Teresa Espejo 1 José F. Huertas-Perez 2 Alberto Navalón 2 José Luis Vílchez 2 1 Department of Painting, Faculty of Fine Art, University of Granada, Granada, Spain 2 Department of Analytical Chemistry, Faculty of Sciences, University of Granada, Granada, Spain Received July 20, 2006 Revised October 16, 2006 Accepted October 16, 2006 Research Article Simultaneous identification of natural dyes in the collection of drawings and maps from The Royal Chancellery Archives in Granada (Spain) by CE A simple and rapid capillary electrophoretic method with UV detection (CE–UV) has been developed for the identification of five natural dyes namely, carmine, indigo, saffron, gam- boge and Rubia tinctoria root. The separation was performed in a fused-silica capillary of 64.5 cm length and 50 mm id. The running buffer was 40 mM sodium tetraborate buffer solution (pH 9.25). The applied potential was 30 kV, the temperature was 257C and detec- tions were performed at 196, 232, 252, 300 and 356 nm. The injections were under pressure of 50 mbar during 13 s. The method was applied to the identification of carminic acid, gambogic acid, crocetin, indigotin, alizarin and purpurin in the collection of drawings and maps at the Royal Chancellery Archives in Granada (Spain). The method was validated by using HPLC as a reference method. Keywords: CE / Dyes / Graphic documents DOI 10.1002/elps.200600446 Electrophoresis 2007, 28, 1243–1251 1243 1 Introduction The main goal in art conservation and restoration is to pre- sent the artwork as the artist intended it to be seen. One of the great challenges in the preservation of old artwork is the investigation of the technique and the material composition used by the artists because this knowledge is essential to use the adequate procedure to restore and preserve the artwork. This is an interdisciplinary task between curators and re- search scientists. Color has always been an important element in the cul- tures of people all over the world. The natural coloring agents are of inorganic (pigments) or organic (dyes) origin. Dyes can be found directly in extracts from natural species (plant, animal) or become colored after various chemical reactions, such as complexation with metals, hydrolysis or oxidation. The identification of the coloring agents in the paint lay- ers of artworks is a complex task due to the simultaneous presence of dyes, pigments, other minerals, polysaccharides, proteins, oils and/or resins. The rich matrix composition mostly creates the necessity for preliminary separation of the components of dyes prior to their identification. Various analytical techniques have been used for the identification of active coloring agents, e.g. spectrophotometry in the UV, Vis and IR regions [1–3], Raman spectrometry [4], fluorescence spectrometry [5], HPLC with UV-Vis diode array detection and fluorescence detection [6–9], HPLC with MS detection [10], CE with UV-Vis diode array detection and electrospray MS detection [11], pyrolysis-GC/MS and abrasive voltam- metry [12–14] and voltammetry [15]. CE has proven to be a very powerful tool for the charac- terization of inorganic and organic compounds since its introduction by Jorgeson and Lukacs in the early 1980s. This is a fast technique allowing the combination of short analysis times and high separation efficiency for the analysis. CE has proved to be an excellent alternative to HPLC. The resolution of CE procedures is greater than that of HPLC and the pre- cision is of the same order. CE is less costly than HPLC and requires only modest quantities of samples. The concentra- tion sensitivity of UV-Vis absorbance detection in CE is, however, relatively poor compared with that in HPLC. The methods of analysis for the identification of dyes must be highly selective and sensitive because of the com- plexity of the matrices and the limited quantity of sample available in the case of graphic documents and archive materials. Hereby, CE is the technique selected for develop- ing a new method to identify natural dyes in graphics docu- ments. The sampling process is really a crucial step here as the reliability of an analytical result is often conditioned by the quality of the sample taken. Further, if the object of the anal- Correspondence: Professor Rosario Blanc García, Research Group of Analytical Chemistry and Life Sciences, Department of Analytical Chemistry, Faculty of Sciences, University of Granada, Avda. Fuentenueva s/n, E-18071 Granada, Spain E-mail: [email protected] Fax: 134-958-243328 © 2007 WILEY-VCH Verlag GmbH & Co. KGaA, Weinheim www.electrophoresis-journal.com
-
Upload
independent -
Category
Documents
-
view
3 -
download
0
Transcript of Simultaneous identification of natural dyes in the collection of drawings and maps from The Royal...

Ana López-Montes1
Rosario Blanc García2
Teresa Espejo1
José F. Huertas-Perez2
Alberto Navalón2
José Luis Vílchez2
1Department of Painting,Faculty of Fine Art,University of Granada,Granada, Spain
2Department of AnalyticalChemistry,Faculty of Sciences,University of Granada,Granada, Spain
Received July 20, 2006Revised October 16, 2006Accepted October 16, 2006
Research Article
Simultaneous identification of natural dyesin the collection of drawings and maps fromThe Royal Chancellery Archives in Granada(Spain) by CE
A simple and rapid capillary electrophoretic method with UV detection (CE–UV) has beendeveloped for the identification of five natural dyes namely, carmine, indigo, saffron, gam-boge and Rubia tinctoria root. The separation was performed in a fused-silica capillary of64.5 cm length and 50 mm id. The running buffer was 40 mM sodium tetraborate buffersolution (pH 9.25). The applied potential was 30 kV, the temperature was 257C and detec-tions were performed at 196, 232, 252, 300 and 356 nm. The injections were under pressureof 50 mbar during 13 s. The method was applied to the identification of carminic acid,gambogic acid, crocetin, indigotin, alizarin and purpurin in the collection of drawings andmaps at the Royal Chancellery Archives in Granada (Spain). The method was validated byusing HPLC as a reference method.
Keywords:
CE / Dyes / Graphic documents DOI 10.1002/elps.200600446
Electrophoresis 2007, 28, 1243–1251 1243
1 Introduction
The main goal in art conservation and restoration is to pre-sent the artwork as the artist intended it to be seen. One ofthe great challenges in the preservation of old artwork is theinvestigation of the technique and the material compositionused by the artists because this knowledge is essential to usethe adequate procedure to restore and preserve the artwork.This is an interdisciplinary task between curators and re-search scientists.
Color has always been an important element in the cul-tures of people all over the world. The natural coloring agentsare of inorganic (pigments) or organic (dyes) origin. Dyescan be found directly in extracts from natural species (plant,animal) or become colored after various chemical reactions,such as complexation with metals, hydrolysis or oxidation.
The identification of the coloring agents in the paint lay-ers of artworks is a complex task due to the simultaneouspresence of dyes, pigments, other minerals, polysaccharides,proteins, oils and/or resins. The rich matrix compositionmostly creates the necessity for preliminary separation of thecomponents of dyes prior to their identification. Various
analytical techniques have been used for the identification ofactive coloring agents, e.g. spectrophotometry in the UV, Visand IR regions [1–3], Raman spectrometry [4], fluorescencespectrometry [5], HPLC with UV-Vis diode array detectionand fluorescence detection [6–9], HPLC with MS detection[10], CE with UV-Vis diode array detection and electrosprayMS detection [11], pyrolysis-GC/MS and abrasive voltam-metry [12–14] and voltammetry [15].
CE has proven to be a very powerful tool for the charac-terization of inorganic and organic compounds since itsintroduction by Jorgeson and Lukacs in the early 1980s. Thisis a fast technique allowing the combination of short analysistimes and high separation efficiency for the analysis. CE hasproved to be an excellent alternative to HPLC. The resolutionof CE procedures is greater than that of HPLC and the pre-cision is of the same order. CE is less costly than HPLC andrequires only modest quantities of samples. The concentra-tion sensitivity of UV-Vis absorbance detection in CE is,however, relatively poor compared with that in HPLC.
The methods of analysis for the identification of dyesmust be highly selective and sensitive because of the com-plexity of the matrices and the limited quantity of sampleavailable in the case of graphic documents and archivematerials. Hereby, CE is the technique selected for develop-ing a new method to identify natural dyes in graphics docu-ments.
The sampling process is really a crucial step here as thereliability of an analytical result is often conditioned by thequality of the sample taken. Further, if the object of the anal-
Correspondence: Professor Rosario Blanc García, ResearchGroup of Analytical Chemistry and Life Sciences, Department ofAnalytical Chemistry, Faculty of Sciences, University of Granada,Avda. Fuentenueva s/n, E-18071 Granada, SpainE-mail: [email protected]: 134-958-243328
© 2007 WILEY-VCH Verlag GmbH & Co. KGaA, Weinheim www.electrophoresis-journal.com

1244 A. López-Montes et al. Electrophoresis 2007, 28, 1243–1251
ysis is an artefact, there are two important steps in the sam-pling process in order to respect its physical integrity: (i) thetechnique for taking samples should be nondestructive and(ii) the amount of sample taken should be minimum. Abrush imbibed with the proper solvent leads to amounts ofsample taken being a minimum and keeps the physicalintegrity of an artefact almost in their totality [9]. Samplepreparation is then easier, the dye extracted with the brushbeing adequately dissolved, the solution being centrifugedand injected into the CE.
We wished to identify the natural components of dyespresent in historical maps and drawings using a new CE-DAD method. The proposed method has been applied tothe historical maps belonging to The Royal ChancelleryArchives in Granada and the selected natural dyes are car-minic acid, indigotin, crocetin, gambogic acid, alizarin andpurpurin.
Carminic acid is a b-C-glycopyranosyl anthraquinonederivative which is extracted from a cochineal (Coccus cacti), atropical American insect that feeds on certain species of cac-tus [16]. Carminic acid is the principal component of thisinsect, which may represent up to 20% of the total insectfemale body mass. This is the substance that produces thered color named carmine.
Saffron is the dried stigmas of the flowers of Crocus sati-vus L. The saffron-colored compounds are crocins, a family ofunusual water-soluble carotenoids named crocetin [17]. Saf-fron provides an appreciable yellow coloring.
Rubia tinctorum is a plant of the Rubiacea family, whichgrows in South America and Europe. Madder is the usualname for this dye from the plant. Alizarin and purpurin arecoloring agents and are found in the roots of R. tinctorum.Both of them are anthraquinones [11].
Indigo is obtained from some plants of the Indigoferafamily. Plants of this family have been found in Africa, Asia,East India, South America, China, Korea and Europe. In thiswork indigo from Insatis tinctoria has been studied. Theprocess for obtaining this dye is very complex. The identifi-cation of indigotin (coloring agent of indigo dye) is difficultowing to the low stability and solubility of the compounds[18].
Gamboge is a resin from Garcinia hamburü, of theGutiferae family, grown in Southeast Asia. The plant con-tains 70–80% of gambigic acid. This substance produces theyellow color [19].
The structures of the coloring agents studied are pre-sented in Fig. 1.
The Royal Chancellery Archives in Granada hold the col-lections of the institution known as the ‘Real Audiencia yChancillería de Granada’ (1494–1835). The Royal Chancellerywas constituted by Isabel I de Castilla and her husband Fer-nanado II de Aragón, the ‘Reyes Catolicos’ as the High Courtof Justice, some part of high court of appeal, for cases pre-viously heard in the local courts of justice. The collections ofthe Chancellery are then of paramount value for the historyof law and jurisprudence, besides representing a vast Figure 1. Chemical structures of the natural dyes studied.
© 2007 WILEY-VCH Verlag GmbH & Co. KGaA, Weinheim www.electrophoresis-journal.com

Electrophoresis 2007, 28, 1243–1251 CE and CEC 1245
source of data and information relevant to historical researchon economic, social and religious ideas as well as local his-tory. The maps and drawings which form the existing collec-tion constitute a part of the legal proceedings, as part of theproofs, or testified evidence, the obtaining of which wasentrusted to the recipient. Expert draughtsmen were chosenfor their skills in their knowledge of a determined subject:masters in the art of architecture or building, alamines,stonemasons, surveyors, masters in the art of painting, alongwith an extensive network of professional experts. Thesemaps and drawings helped to reach qualified judgements.An elaborate system of numbers and letters was used tocodify possessions, property, geographical features, roads,etc. with details of the elevation or ground plans of a building.They were incorporated into the lawsuits by virtue of a RoyalRecipient Provision at the request of one of the parties for thepreparation of the maps. They were then an element ofinestimable reference value for attorneys, public prosecutors,and judges to pass sentence. Consequently, their study andanalysis is considered essential for their preservation andrestoration.
The maps and drawings analyzed come from differentplaces of Andalucia (Spain) from the 16th to the 19th centuryand can be dated accurately.
2 Materials and methods
2.1 Instrumentation and software
Electrophoresis was performed with an HP3D CE instru-ment (Agilent Technologies, Waldbronn, Germany) equip-ped with a DAD, a thermostated column cartridge, a high-voltage built-in power supply and an autosampler. The soft-ware package HP ChemStation version A.0901 was used foracquisition and subsequent processing of eletrophero-grams.
Separations were carried out in fused-silica capillaries(64.5 cm650 mm id) with a capillary inlet to detector dis-tance of 56 cm. An Agilent 8453E (Waldbronn, Germany)UV-Vis spectrophotometer was used to record the absorb-ance spectra of natural dyes.
The chromatographic system consisted of an Agilent1100 series HPLC (Agilent Technologies, Palo Alto, CA,USA) equipped with a quaternary pump, an online degasser,an autosampler, an automatic injector, a thermostated col-umn compartment and a DAD connected online. The chro-matographic system was controlled by ChemStation for LC3D (Agilent) software package.
Chromatographic separations of studied compoundswere achieved on a Luna 5 mm NH2 100a column(250 mm64.6 mm id, 5 mm particle) from Phenomenex(Torrance, CA, USA). The column was protected witha NH2 amine-aminopropyl (Phenomenex) precolumn(4 mm63 mm id).
All pH measurements were made with a Crison (CrisonInstruments SA, Barcelona, Spain) combined glass-satu-rated calomel electrode using a Crison 2000 digital pH-meterearlier calibrated.
An ultrasonic bath from Selecta (Barcelona, Spain) wasused for dissolved dyes, nylon filters with 0.20 mm pore size(Supelco, Bellefonte, PA, USA).
2.2 Reagents
All reagents were of analytical grade, unless stated otherwise.Water was purified by means of a Milli-Q plus system (Milli-pore, Bedford, MA, USA).
The natural dyes used as reference substances wereobtained from different natural sources: carminic acid fromCoccus cacti insect, indigotin from Isatis tinctoria pressedleaf, crocetin from Crocus sativus L. stigmas, gambogic acidfrom Garcinia hanburü resin and alizarin and purpurinfrom Rubia tinctorum root. C. cacti insects, I. tinctoria pres-sed leaf, C. sativus L. stigmas, G. hanburü resin and R. tinc-torum root were supplied by Kremer-Pigmente (Krakow,Poland). Alizarin from Merck (Darmstadt, Germany) andpurpurin from Fluka (Buchs, Switzerland) were used as astandard to obtain the spectra and identify electro-pherograms of R. tinctorum root.
The solvents methanol, ethanol, ACN, 1-propanol,2-propanol and acetic acid (all were of HPLC-hipergradientgrade), hydrochloric acid 37% (ANALPUR grade) and ortho-phosphoric acid were acquired from Panreac (Barcelona,Spain) and TFA (99%) from Merck.
Sodium tetraborate decahydrate and ammonium acetatewere obtained from Sigma Aldrich (St. Louis, MO, USA),sodium dihydrogen phosphate 1-hydrate, ammonium chlo-ride and sodium hydroxide from Panreac and SDS fromFluka.
Buffer solutions of the required pH value used for HPLCreference method were made from 10 mM sodium phos-phate (Panreac) solution and 10 mM o-phosphoric acid(Panreac) solution.
2.3 Extraction procedure
2.3.1 Reference substance
The reference substances were obtained by extraction fromdifferent sources described above using the adequate solvent.Carminic acid, alizarin, purpurin and crocetin were extractedwith deionized water at 307C for 15 min. Then, the coloredsolution was filtered with filter paper. The extract was evapo-rated to dryness and dissolved in 0.1 M SDS. Although ali-zarin and purpurin are extracted from Rubia tinctoria rootquickly with higher temperature, purpurin could not beextracted, and the colored solution could turn dark. Gambo-gic acid was extracted with methanol in an ultrasonic bath in20 min. The extracts were evaporated to dryness and alsodissolved in 0.1 M SDS. Indigotin was extracted using acetic
© 2007 WILEY-VCH Verlag GmbH & Co. KGaA, Weinheim www.electrophoresis-journal.com

1246 A. López-Montes et al. Electrophoresis 2007, 28, 1243–1251
acid 17.5 M in an ultrasonic bath for 45 min (the solutionwas blue). Then, the extracts, as the other dyes, were filtered,evaporated to dryness and dissolved in 0.1 M SDS. The finalsolution was purple and the polarity and solubility changed.
2.3.2 Extraction of sample from maps
Extractions of dyes from samples was carried out using themethod proposed by Blanc et al. [9]. The extraction was per-formed using a brush imbibed with 0.1 M SDS and applyingdirectly onto the map. The extract transferred on the brushfrom the paper-contained particles and SDS-soluble com-pounds coming from the coloring film. The extracts weretransferred to 0.1 M SDS and sonicated for 45 min. Thesolutions were centrifuged at 2000 rpm for 5 min beforebeing injected into the capillary.
The samples were always evaporated to dryness in orderto preconcentrate. Then, they were dissolved with a littledrop of 0.1 M SDS solution.
2.4 Electrophoretic procedure
CE separation was carried out on a fused-silica capillary(50 mm id, total length 64.5 cm, a detection window was cre-ated at 56 cm from the capillary inlet). When a new capillarywas used, it was preconditioned by rinsing with 1 M NaOHfor 20 min at 607C, followed by a 5-min rinse with deionizedwater and 20 min with buffer. For the following analyses thecapillary was rinsed with 0.1 M NaOH for 5 min at 257C,followed by a 3-min flush with deionized water to ensuregood repeatability. The capillary was equilibrated with therunning buffer (40 mM tetraborate of pH 9.25) for 15 minbefore each sample injection.
Samples were injected hydrodynamically in the anodicend of the capillary with a pressure mode (50 mbar) for 13 s.Electrophoretic separation was performed at 30 kV for15 min, resulting in a current of about 60 mA. The tempera-ture of the capillary was constant at 257C. After each analysis,the capillary was rinsed for 3 min with deionized water anddried with air for 2 min.
All solutions, buffers and samples were filtered througha 0.20 mm membrane filter. The running buffer was changedafter three runs. UV detection was carried out monitoring at232, 252, 300, 356 and 196 nm. The wavelengths wereselected from the spectrum of each dye. DAD was used overthe range of 190–600 nm to achieve spectral data.
3 Results and discussion
To determine the optimum conditions for CE method,experimental and instrumental variables were investigated.
3.1 Effect of experimental variables in the CE method
In the first step, several electrophoretic media were investi-gated varying the buffer running at different pH in the rangeof 3–11 in steps of 1.5 U. The alkaline buffer was found to bethe unique medium effective for resolving a mixture of thestudied dyes. Each dye was examined individually by CE andwith the spectrum obtained of each electrophoretic peak.
The effect of pH was tested by adjusting the buffer(40 mM tetraborate) pH between 8 and 10 (in steps of 0.4) byadding a proper amount of 1.0 M HCl or 1.0 M NaOH. Weobserved (Fig. 2) that at pH values lower than 9.2, the analy-sis times were shorter, but the resolution for the compoundsstudied was worse. At pH values higher than 9.2, the analysistime was longer. At pH value 9.2, the resolution for the peakswas good and the analysis time was shorter. Therefore, weselected a pH value 9.2 as the optimum pH value.
Three different buffers were tested: sodium tetraboratedecahydrate, ammonium chloride and ammonium acetate.All of them were prepared at pH 9.2. With ammonium chlo-ride and ammonium acetate the current was extremely high.Sodium tetraborate was therefore selected as the buffer be-cause it gave the best resolution in a satisfactory time.
Figure 2. Electropherograms of a mixture of natural dyes studiedat different pH values. Peak 1: alizarin; peak 2: purpurin; peak 3:indigotin; peak 4: carminic acid; peak 5: crocetin; peak 6: gambo-gic acid.
© 2007 WILEY-VCH Verlag GmbH & Co. KGaA, Weinheim www.electrophoresis-journal.com
Electrophoresis 2007, 28, 1243–1251 CE and CEC 1247
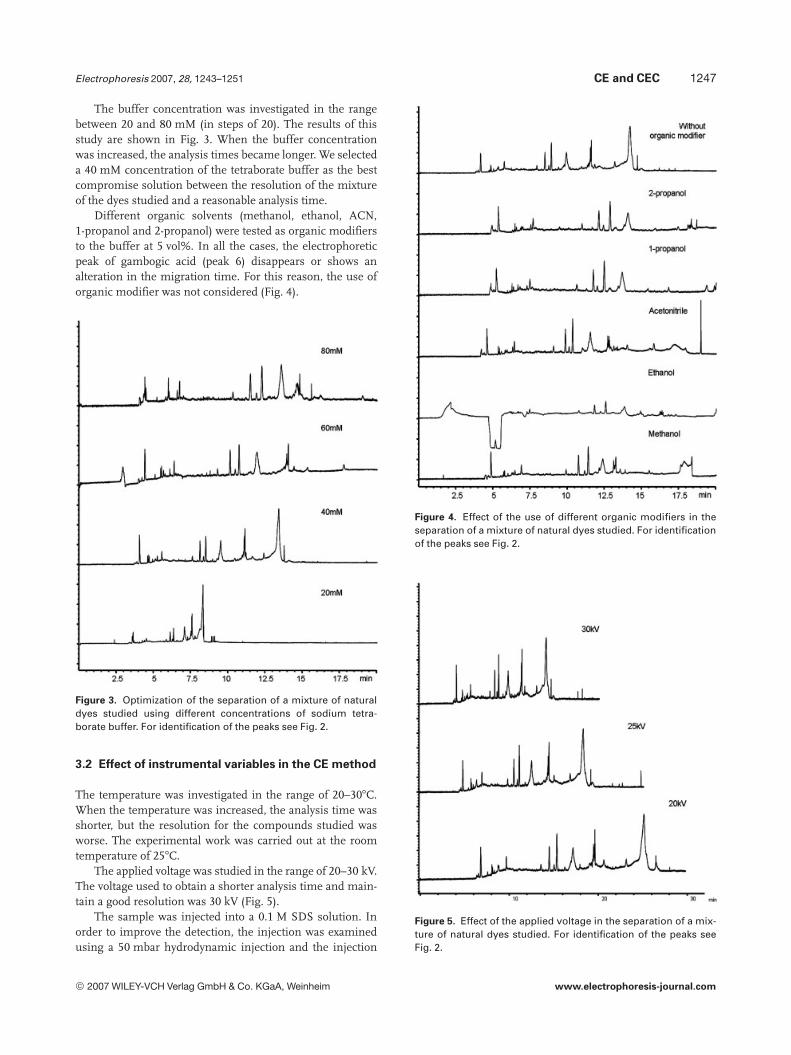
The buffer concentration was investigated in the rangebetween 20 and 80 mM (in steps of 20). The results of thisstudy are shown in Fig. 3. When the buffer concentrationwas increased, the analysis times became longer. We selecteda 40 mM concentration of the tetraborate buffer as the bestcompromise solution between the resolution of the mixtureof the dyes studied and a reasonable analysis time.
Different organic solvents (methanol, ethanol, ACN,1-propanol and 2-propanol) were tested as organic modifiersto the buffer at 5 vol%. In all the cases, the electrophoreticpeak of gambogic acid (peak 6) disappears or shows analteration in the migration time. For this reason, the use oforganic modifier was not considered (Fig. 4).
Figure 3. Optimization of the separation of a mixture of naturaldyes studied using different concentrations of sodium tetra-borate buffer. For identification of the peaks see Fig. 2.
3.2 Effect of instrumental variables in the CE method
The temperature was investigated in the range of 20–307C.When the temperature was increased, the analysis time wasshorter, but the resolution for the compounds studied wasworse. The experimental work was carried out at the roomtemperature of 257C.
The applied voltage was studied in the range of 20–30 kV.The voltage used to obtain a shorter analysis time and main-tain a good resolution was 30 kV (Fig. 5).
The sample was injected into a 0.1 M SDS solution. Inorder to improve the detection, the injection was examinedusing a 50 mbar hydrodynamic injection and the injection
Figure 4. Effect of the use of different organic modifiers in theseparation of a mixture of natural dyes studied. For identificationof the peaks see Fig. 2.
Figure 5. Effect of the applied voltage in the separation of a mix-ture of natural dyes studied. For identification of the peaks seeFig. 2.
© 2007 WILEY-VCH Verlag GmbH & Co. KGaA, Weinheim www.electrophoresis-journal.com
1248 A. López-Montes et al. Electrophoresis 2007, 28, 1243–1251
time was varied between 5 and 15 s. When the injectiontime was increased, the peak height increased, but the peakshape was not adequate. Therefore, the injection time of13 s is a compromise between the peak height and the peakshape.
3.3 Application and validation of the method
The reported investigations were carried out in two stages.Firstly, electrophoretic measurements were carried out fornatural dyes collected from various sources and the elec-trophoretic procedure was applied. Then CE data wererecorded for extracts of dyes from historical maps. Identi-fication of dyes was based on migration time and theircomparison with reference substances as well as on UV-Visspectra recorded for sample extracts and reference sub-stances. Identity of UV-Vis spectra was confirmed whenagreement between their maxima was obtained within61 nm.
3.3.1 EC of natural dyes
Electrophoretic identification of natural dyes was carried outwith the use of these substances purchased from differentnatural sources previously indicated. Electropherogramsobtained for solutions of natural dyes are shown in Fig. 6 to-gether with the UV-Vis spectra corresponding to identifiedchemical species.
The UV-Vis spectra were obtained at electropherogrampeaks and are similar to those spectra obtained for referencesubstances. The complete list of examined natural dyes to-gether with their migration times in the electrophoreticconditions used and spectrophotometric data are shown inTable 1.
The optimum electropherogram obtained for a mixtureof the dyes studied under optimized conditions is pre-sented in Fig. 7. It shows that the electrophoretic proce-dure selected is adequate for the separation of the analytesinvolved. The time for one analysis was approximately14 min. This method is quicker than the HPLC method,which for the same mixture standard analysis runs ataround 45 min [9].
Table 1. Electropherographic migration time and absorptionmaxima for the studied dyes
Dye Migrationtime (min)
Peakno.
Absorption (nm) Naturalsource
Alizarin 4.0 1 201, 252, 280, 430 R. tinctorumPurpurin 5.4 2 205, 257, 489, 521 R. tinctorumIndigotin 8.0 3 227, 294, 608 I. tinctoriaCarminic acid 9.4 4 206, 234, 284, 334,
521, 563C. cacti
Crocetin 10.3 5 259, 431 C. sativus L.Gambogic acid 13.1 6 205, 236, 282,
290, 364Garcinia
hanbüru
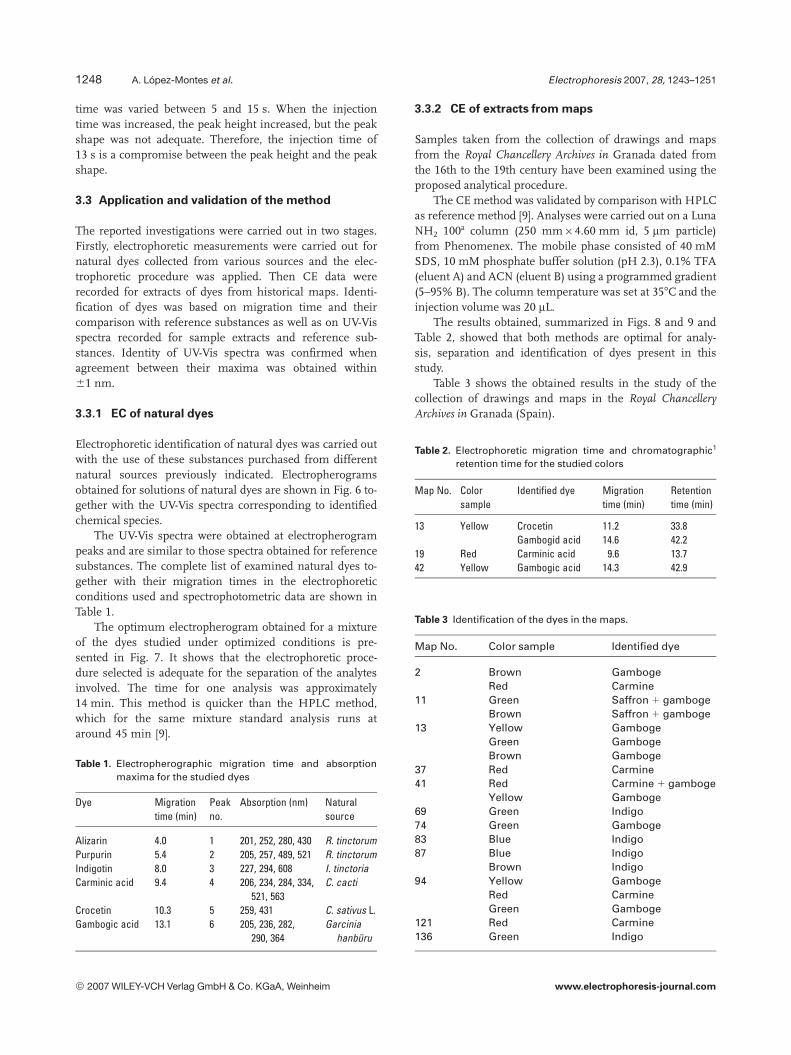
3.3.2 CE of extracts from maps
Samples taken from the collection of drawings and mapsfrom the Royal Chancellery Archives in Granada dated fromthe 16th to the 19th century have been examined using theproposed analytical procedure.
The CE method was validated by comparison with HPLCas reference method [9]. Analyses were carried out on a LunaNH2 100a column (250 mm64.60 mm id, 5 mm particle)from Phenomenex. The mobile phase consisted of 40 mMSDS, 10 mM phosphate buffer solution (pH 2.3), 0.1% TFA(eluent A) and ACN (eluent B) using a programmed gradient(5–95% B). The column temperature was set at 357C and theinjection volume was 20 mL.
The results obtained, summarized in Figs. 8 and 9 andTable 2, showed that both methods are optimal for analy-sis, separation and identification of dyes present in thisstudy.
Table 3 shows the obtained results in the study of thecollection of drawings and maps in the Royal ChancelleryArchives in Granada (Spain).
Table 2. Electrophoretic migration time and chromatographic1
retention time for the studied colors
Map No. Colorsample
Identified dye Migrationtime (min)
Retentiontime (min)
13 Yellow Crocetin 11.2 33.8Gambogid acid 14.6 42.2
19 Red Carminic acid 9.6 13.742 Yellow Gambogic acid 14.3 42.9
Table 3 Identification of the dyes in the maps.
Map No. Color sample Identified dye
2 Brown GambogeRed Carmine
11 Green Saffron 1 gambogeBrown Saffron 1 gamboge
13 Yellow GambogeGreen GambogeBrown Gamboge
37 Red Carmine41 Red Carmine 1 gamboge
Yellow Gamboge69 Green Indigo74 Green Gamboge83 Blue Indigo87 Blue Indigo
Brown Indigo94 Yellow Gamboge
Red CarmineGreen Gamboge
121 Red Carmine136 Green Indigo
© 2007 WILEY-VCH Verlag GmbH & Co. KGaA, Weinheim www.electrophoresis-journal.com

Electrophoresis 2007, 28, 1243–1251 CE and CEC 1249
Figure 6. Electropherograms obtained for solu-tions of natural dyes extracted from naturalsources.
© 2007 WILEY-VCH Verlag GmbH & Co. KGaA, Weinheim www.electrophoresis-journal.com
1250 A. López-Montes et al. Electrophoresis 2007, 28, 1243–1251
Figure 7. Electropherogram of amixture of the different naturaldyes studied obtained under theoptimized conditions. Peak 1:alizarin; peak 2: purpurin; peak3: indigotin; peak 4: carminicacid; peak 5: crocetin; peak 6:gambogic acid.
Figure 8. Electropherograms of map 19, sample red (A) and map42, sample yellow (B).
Figure 9. Electropherograms and chromatograms of map 13,sample yellow. (A) CE, (B) HPLC.
4 Concluding remarks
CE with diode-array UV-Vis spectrophotometric detectionhas been proved to be an optimal method of analysis forseparation and identification of dyes present in this study.The results presented in this work demonstrate that CE is avery fast and easy alternative to identification of colorants byHPLC-DAD. Even the sample needed for the analysis by CEis minor. The methodology proposed does not affect nega-tively to the artefact. The main advantages of the method arethat only small amounts of sample are required, sampletreatment is simple and analysis times are short.
The identification of natural dyes of the Real Chancilleríade Granada (Spain) has been successful. Identification of dyemixtures is possible and effective with only one sample,therefore sampling is considerably reduced.
The characterization of these materials has a double use.On one side, it allows us to put them in their historical con-text, and on the other it can be used to gain a deep knowledgethat could be useful for a possible restoration or conservationprocess. This analytical methodology is likewise apt for thestudy of a wide variety of other dyes and artefacts.
This work was partly supported by the Spanish Ministry ofScience and Technology (project no. MAT2002-01903). Theauthors are grateful to David Torres, Director of Archivo de laReal Chancillería de Granada, for kindly providing the realsamples, and the authors also thank F. Lara-Vargas, Ph.D. stu-dent from University of Granada, for his help.
5 References
[1] Guineau, B., Villela-Petit, I., Vezin, J., Roy, A., Smith, P. (Eds.),Painting Techniques: History, Materials and Studio Practice,Contributions to the Dublin Congress (1998). The Interna-tional Institute for Conservation of Historic and ArtisticWorks, Dublin1998, p. 31.
[2] Wallert, A., Restauro 1986, 3, 52.
[3] Burandt, J., American Institute for Conservation Book andPaper Group Annual 1994, 13.
[4] Clark, R. J. H., Gibbs, P. J., Anal. Chem. 1998, 70, 99A–104A.
© 2007 WILEY-VCH Verlag GmbH & Co. KGaA, Weinheim www.electrophoresis-journal.com

Electrophoresis 2007, 28, 1243–1251 CE and CEC 1251
[5] Quandt, A., Wallert, A., Roy, A., Smith, P. (Eds.), PaintingTechniques: History, Materials and Studio Practice, Con-tributions to the Dublin Congress (1998). The InternationalInstitute for Conservation of Historic and Artistic Works,Dublin 1998, p. 16.
[6] Vest, M., Wouters, J., ICOM Committee Conserv. 1999, 2,714–720.
[7] Orska-Gawrys, J., Surowiec, I., Kehl, J., Rejniak, H. et al., J.Chromatogr. A 2003, 989, 239–248.
[8] Szostek, B., Orska-Gawrys, J., Surowiec, I., Trojanowicz, M.,J. Chromatogr. A 2003, 1012, 179–192.
[9] Blanc, R., Espejo, T., López-Montes, A., Torres, D. et al., J.Chromatogr. A 2006, 1122, 105–113.
[10] Trojanowicz, M., Orska-Gawrys, J., Surowiec, I., Szostek, B.et al., Stud. Conserv. 2004, 49, 115–130.
[11] Puchalska, M., Orlinska, M., Ackcha, M. A., Polec-Pawlak, K.,Jarosz, M., J. Mass Spectrom. 2003, 38, 1252–1258.
[12] Sonoda, N., Stud. Conserv. 1999, 44, 195–208.
[13] Casas-Catalán, M. J., Doménech-Carbó, M. T., Anal. Bioanal.Chem. 2005, 382, 259–268.
[14] Doménech-Carbó, A., Doménech-Carbó, M. T., Saurí-Peris,M. C., Talanta 2005, 66, 769–782.
[15] Grygar, T., Kuckova, S., Hradil, D., Hradilova, D., J. SolidState Electrochem. 2003, 7, 706–713.
[16] Favaro, G., Miliani, C., Romani, A., Vagnini, M., J. Chem.Soc., Perkin Trans. 2002, 2, 192–197.
[17] Lozano, P., Castellar, M. R., Simancas, M. J., Iborra, J. L., J.Chromatogr. A 1999, 830, 477–483.
[18] Puchalska, M., Orlinska, M., Ackacha, M. A., Potec-Pawlak,K., Jarosz, M., J. Mass Spectrom 2004, 39, 1441–1449.
[19] Gómez, M. L. Cuadernos de arte, cátedra (Eds.), La restau-ración. Examen científico aplicado a la conservación deobras de arte Madrid 2000.
© 2007 WILEY-VCH Verlag GmbH & Co. KGaA, Weinheim www.electrophoresis-journal.com


![DA190759 Original Architectural Drawings - [A6402145].pdf](https://static.fdokumen.com/doc/165x107/6327476b5c2c3bbfa8041923/da190759-original-architectural-drawings-a6402145pdf.jpg)