SIMULTANEOUS DETERMINATION OF IRON AND COPPER BY THIRD-DERIVATIVE SOLIDPHASE SPECTROPHOTOMETRY
14
SIMULTANEOUS DETERMINATION OF IRON AND COPPER BY THIRD-DERIVATIVE SOLID-PHASE SPECTROPHOTOMETRY M. Ine´s Toral, * Nelson Lara, Javier Go´mez, and Pablo Richter Department of Chemistry, Faculty of Science, University of Chile, P.O. Box 653, Santiago, Chile ABSTRACT A simultaneous microdetermination of iron and copper at sub-mg/L level by solid phase derivative spectrophotometry has been developed. The compounds TPTZ (2,4,6-tripyridyl- 1,3,5-triazine) and Neocuproine (2,9-dimethyl-1,10-phenan- throline hydrochloride), were used as chromogenic reagents to form a blue iron complex and an orange copper complex, respectively (pH ¼ 5.0), which are fixed and concentrated on a cation-exchange resin sephadex sp C-25. The influence of experimental variables on the retention of the complexes on the resin are discussed. The signals in derivative units were measured directly on the solid, packed in a 1 mm spectro- photometric cell. The characteristic amplitude of the signals at 622.0 and 477.0 nm in third-derivative spectra are useful 153 *Corresponding author. Fax: þ56-2-2713888; E-mail: [email protected]
-
Upload
universidadfedericosantamaria -
Category
Documents
-
view
3 -
download
0
Transcript of SIMULTANEOUS DETERMINATION OF IRON AND COPPER BY THIRD-DERIVATIVE SOLIDPHASE SPECTROPHOTOMETRY

SIMULTANEOUS DETERMINATION
OF IRON AND COPPER BY
THIRD-DERIVATIVE SOLID-PHASE
SPECTROPHOTOMETRY
M. Ines Toral,* Nelson Lara,
Javier Gomez, and Pablo Richter
Department of Chemistry, Faculty of Science,University of Chile, P.O. Box 653, Santiago, Chile
ABSTRACT
A simultaneous microdetermination of iron and copper atsub-mg/L level by solid phase derivative spectrophotometryhas been developed. The compounds TPTZ (2,4,6-tripyridyl-1,3,5-triazine) and Neocuproine (2,9-dimethyl-1,10-phenan-throline hydrochloride), were used as chromogenic reagentsto form a blue iron complex and an orange copper complex,respectively (pH¼ 5.0), which are fixed and concentrated ona cation-exchange resin sephadex sp C-25. The influence ofexperimental variables on the retention of the complexes onthe resin are discussed. The signals in derivative units weremeasured directly on the solid, packed in a 1 mm spectro-photometric cell. The characteristic amplitude of the signalsat 622.0 and 477.0 nm in third-derivative spectra are useful
153
*Corresponding author. Fax: þ56-2-2713888; E-mail: [email protected]
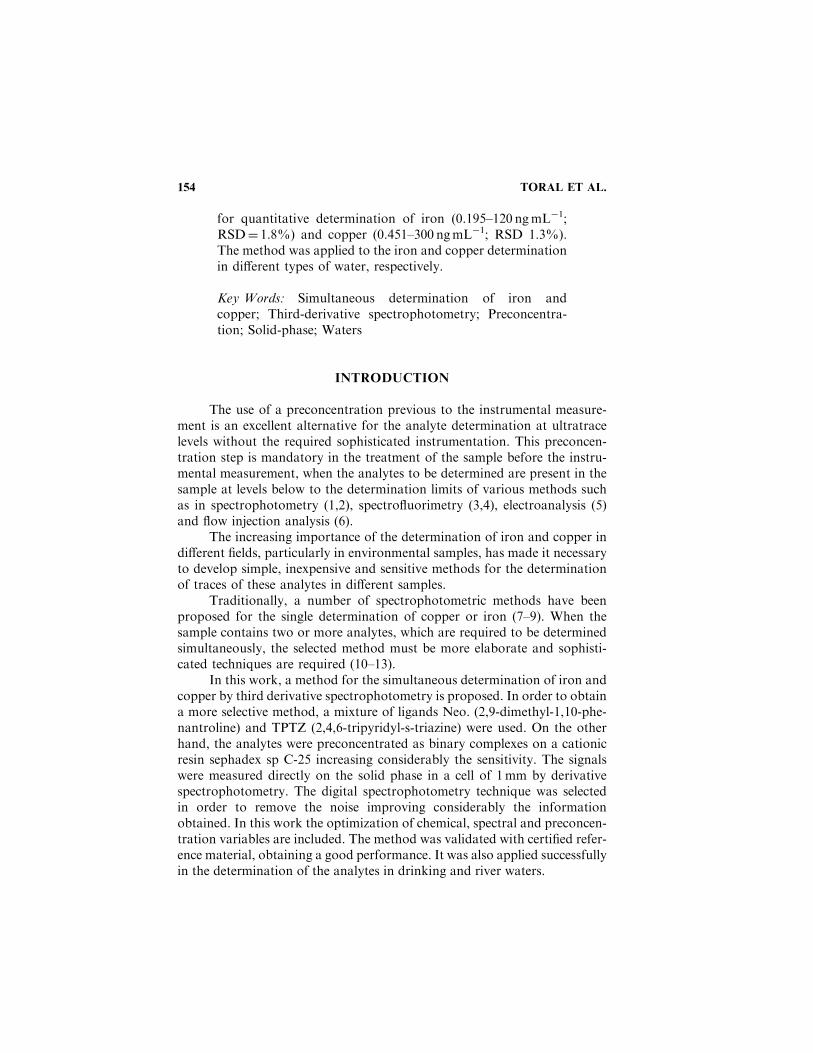
for quantitative determination of iron (0.195–120 ng mL�1;RSD¼ 1.8%) and copper (0.451–300 ng mL�1; RSD 1.3%).The method was applied to the iron and copper determinationin different types of water, respectively.
Key Words: Simultaneous determination of iron andcopper; Third-derivative spectrophotometry; Preconcentra-tion; Solid-phase; Waters
INTRODUCTION
The use of a preconcentration previous to the instrumental measure-ment is an excellent alternative for the analyte determination at ultratracelevels without the required sophisticated instrumentation. This preconcen-tration step is mandatory in the treatment of the sample before the instru-mental measurement, when the analytes to be determined are present in thesample at levels below to the determination limits of various methods suchas in spectrophotometry (1,2), spectrofluorimetry (3,4), electroanalysis (5)and flow injection analysis (6).
The increasing importance of the determination of iron and copper indifferent fields, particularly in environmental samples, has made it necessaryto develop simple, inexpensive and sensitive methods for the determinationof traces of these analytes in different samples.
Traditionally, a number of spectrophotometric methods have beenproposed for the single determination of copper or iron (7–9). When thesample contains two or more analytes, which are required to be determinedsimultaneously, the selected method must be more elaborate and sophisti-cated techniques are required (10–13).
In this work, a method for the simultaneous determination of iron andcopper by third derivative spectrophotometry is proposed. In order to obtaina more selective method, a mixture of ligands Neo. (2,9-dimethyl-1,10-phe-nantroline) and TPTZ (2,4,6-tripyridyl-s-triazine) were used. On the otherhand, the analytes were preconcentrated as binary complexes on a cationicresin sephadex sp C-25 increasing considerably the sensitivity. The signalswere measured directly on the solid phase in a cell of 1 mm by derivativespectrophotometry. The digital spectrophotometry technique was selectedin order to remove the noise improving considerably the informationobtained. In this work the optimization of chemical, spectral and preconcen-tration variables are included. The method was validated with certified refer-ence material, obtaining a good performance. It was also applied successfullyin the determination of the analytes in drinking and river waters.
154 TORAL ET AL.

EXPERIMENTAL
Apparatus
A Shimadzu UV-PC 1603 spectrophotometer with 1 mm cells was usedfor measurements of the absorbance and derivative absorption spectra. AnOrion Research Digital Ion-Analyzer 701 with glass and saturated calomelelectrodes was used for pH determinations. A magnetic stirrer HI 190 M,Hanna instruments for the preconcentration step was used.
Reagents
All reagents were of analytical grade and the solutions were preparedwith high-purity water from a NANOpure Barnstead ultrapure water systemdevice.
Standard Iron (II) solution (titrisol Merck, 1000 mg mL�1).Standard copper (II) solution (titrisol Merck, 1000 mg mL�1).Standards of the cationic and anionic solutions for interferent evalua-
tion (titrisol Merck, 1000mg mL�1).Solutions of 10 mg mL�1 of the analytes were prepared by diluting the
standard solutions. Other ranges of concentration were prepared by appro-priate dilution. All these solutions were stored in polyethylene containers.
2,4,6-tripyridyl-1,3,5-triazine, (TPTZ). An approximately 5.0�10�3 M solution was prepared by dissolving 0.15615 g of TPTZ (AldrichChemical Co.) in a few drops of concentrated hydrochloric acid and dilutingto 500 mL with water.
2,9-dimethyl-1,10-phenanthroline hydrochloride, (Neo.). A 0.15 Msolution was prepared by dissolving 18.3525 g of Neo. (Aldrich) in 500 mLof water.
Hydroxylamine hydrochloride (NH2OH�HCl) solution. This solutionwas prepared by dissolving 10.0 g of the salt in 100 mL of water.
Sodium acetate–acetic acid buffer (pH¼ 5.0). This solution wasprepared by dissolving 20.5 g of sodium acetate (Merck) in 100 mL of waterand then 8.05 mL of concentrated acetic acid (Merck) was added and dilutedto 1000 mL.
Resins, sephadex sp C-25 (sulfopropyl sephadex) cation exchanger,sigma, sephadex sp C-50 (sulfopropyl sephadex) cation exchanger,Sigma, Dowex 50WX2–100 (strongly acidic) cation exchanger. Sigma,chelating (iminodiacetic acid), mesh 50–100. Sigma, ionenaustauscher I,mesh 30–70, Sigma, ionenaustauscher V, mesh 30–70, Sigma, permutitQHPF, mesh 30–70. Sigma, permutit H-70, mesh 16–50. Sigma, permutit
155
zeo-dur, mesh 16–50, Sigma, permutit decalso, mesh 10–40, Sigma wereused.
In the validation of the method a river sediment certified, high-puritystandards were used. This sample had the following content in mg mL�1
�
0.5% in HNO3 5%: Fe, 1200.0; Al, 250.0; K, 150.0; Cu, 10.0; Ni, 0.50; V, 0.25;Ca, 300.0; Na, 50.0; Co, 0.10; Tl, 0.01; As, 0.60; Se, 0.50; Cr, 300.0; Pb, 7.0;Th, 0.02; Sr, 0.02; Ba, 0.50; Mg, 70.0; Cd, 0.10; Mn, 80.0; U, 0.01; Zn, 15.0.
Procedure
Place in a 600 mL beaker an aliquot of sample solution containing lessthan 2 mg of iron and 4 mg of copper, add 10 mL of acetic-acetate buffer(pH¼ 5.0), 2 mL of 10% NH2OH�HCl solution, 5 mL of 5.0� 10�3 MTPTZ solution, 5 mL of 0.15 M Neo. solution, and adjust the total volumeto 200 mL. Stir the mixture for 2 min. Add 60.0 mg of sephadex sp C-25. Stir12 min. Discard the solution and add de-ionized water to wash the resin.Discard the washed water and repeat twice again. Then pack the resin intoa cell of 1 mm. Record the zero-order spectra over the range from 400to 800 nm against a resin reagent blank prepared under the same experimentalconditions. Record also the third derivative spectra over the same wavelengthrange and use a smoothing factor of 40 and a scaling factor of 105.
RESULTS AND DISCUSSION
TPTZ reacts with iron in presence of hydroxylamine hydrochloridesolution (pH¼ 5.0) to give a blue cationic chelate. Similarly, copper underthe same conditions reacts with Neo. to give an orange cationic complex. Itis important to indicate that the Fe(TPTZ)2
þþ and Cu(Neo.)2þ are more
stable than Fe(II)-Neo. and Cu(I)-TPTZ (Figure 1).Considering that both complexes have a positive charge, these can be
retained on a cation-exchange resin. It was observed that the retention ispractically irreversible. Thus, the aromatic structure must be important forthe retention of the complexes by interaction with the organic structure ofthe polymer. In order to obtain the best solid phase for the analytes, westudied the retention of Fe(II)-TPTZ and Cu(I)-Neo., at pH¼ 5.0 on each ofthe following solid supports: chelating; dowex 50WX2; sephadex sp C-25;sephadex sp C-50; permutit decalso; permutit QHPF; permutit ZEO-DURand permutit H-70. Considering the sensitivity of the signal the cation-exchange sephadex sp C-25 was found to be the best for the retention ofboth the complexes.
156 TORAL ET AL.
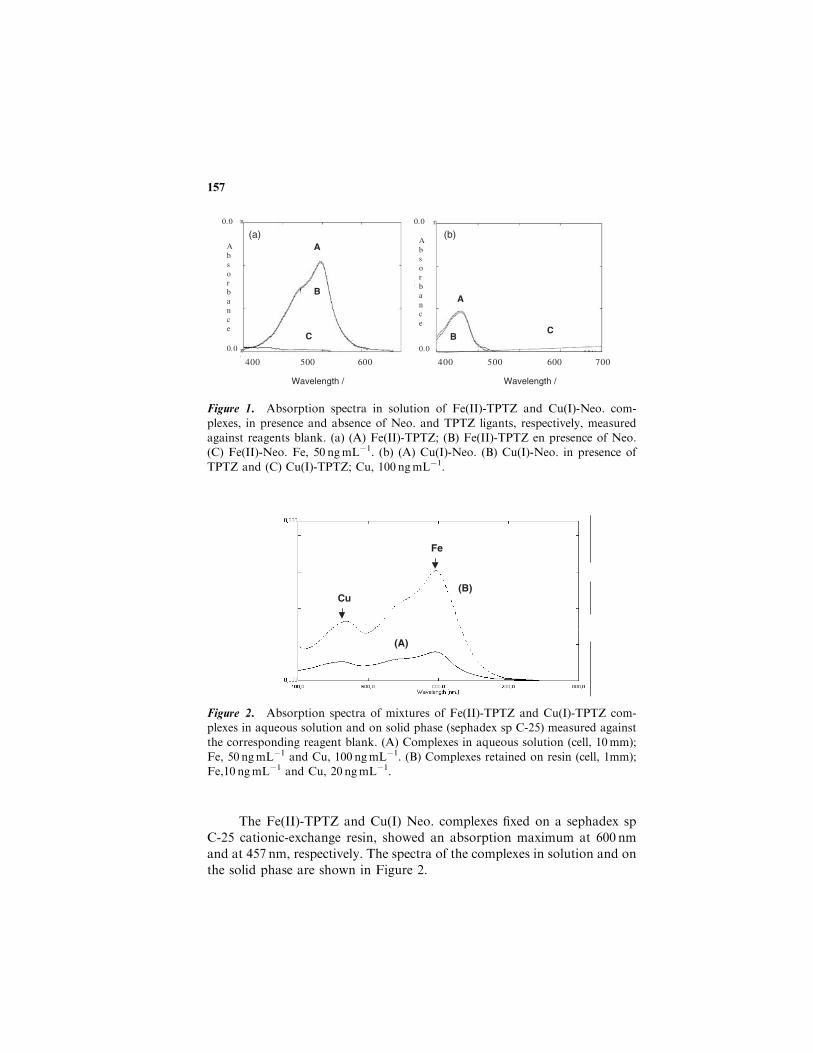
The Fe(II)-TPTZ and Cu(I) Neo. complexes fixed on a sephadex sp
C-25 cationic-exchange resin, showed an absorption maximum at 600 nm
and at 457 nm, respectively. The spectra of the complexes in solution and on
the solid phase are shown in Figure 2.
157
400 500 600
Absorbance
0.0
0.0
B
A
C
400 500 600 700
Absorbance
B
A
0.0
0.0
C
Wavelength / Wavelength /
(a) (b)
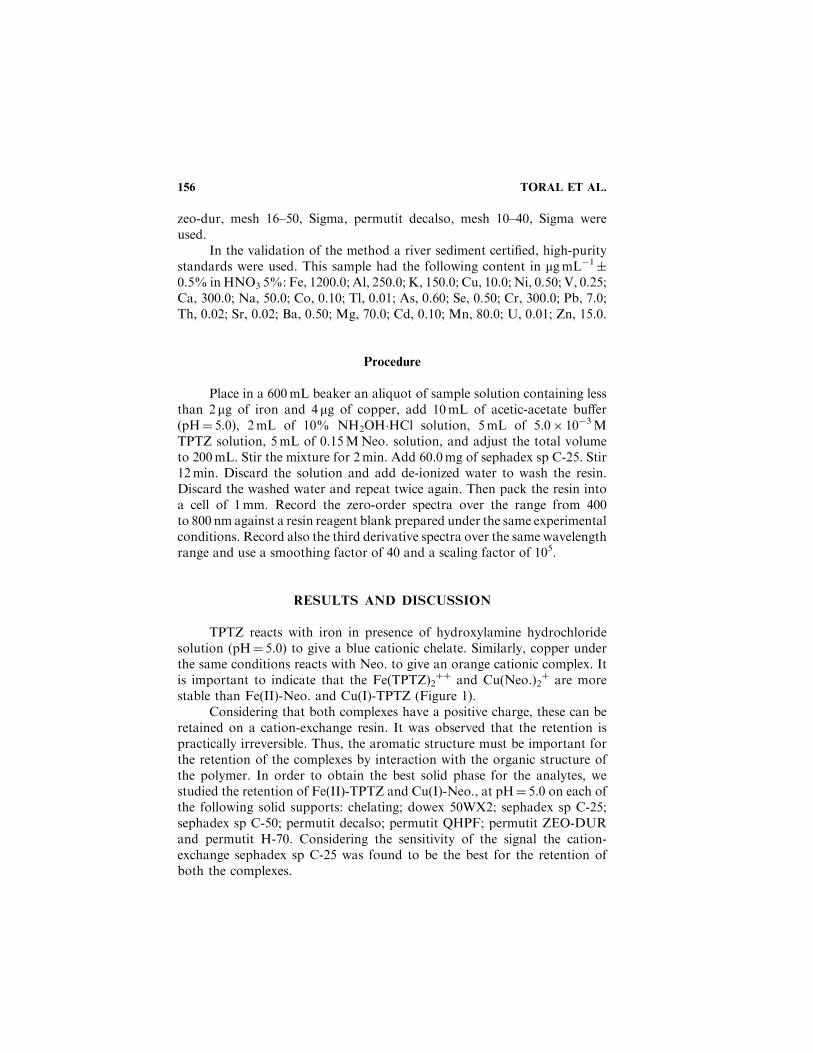
Figure 1. Absorption spectra in solution of Fe(II)-TPTZ and Cu(I)-Neo. com-
plexes, in presence and absence of Neo. and TPTZ ligants, respectively, measuredagainst reagents blank. (a) (A) Fe(II)-TPTZ; (B) Fe(II)-TPTZ en presence of Neo.(C) Fe(II)-Neo. Fe, 50 ng mL�1. (b) (A) Cu(I)-Neo. (B) Cu(I)-Neo. in presence of
TPTZ and (C) Cu(I)-TPTZ; Cu, 100 ng mL�1.
(B)
(A)
Fe
Cu
Figure 2. Absorption spectra of mixtures of Fe(II)-TPTZ and Cu(I)-TPTZ com-plexes in aqueous solution and on solid phase (sephadex sp C-25) measured againstthe corresponding reagent blank. (A) Complexes in aqueous solution (cell, 10 mm);
Fe, 50 ng mL�1 and Cu, 100 ng mL�1. (B) Complexes retained on resin (cell, 1mm);Fe,10 ng mL�1 and Cu, 20 ng mL�1.

As can be seen, in both cases a strong increase in sensitivity in the solidphase compared with of the solution were found.
Taking into account that the spectral bands are overlapped andthat the purpose of this work is to develop a simple, precise and accuratemethod for simultaneous determination of both analytes the derivativespectrophotometry technique was adopted, because permits, resolutionand determination of binary mixture of constituents (14,15).
On the other hand, the spectral signals were evaluated directly in thesolid phase, where the dispersion phenomena of the radiant energy becomemore evident, which can be minimized by the use of a small path of light. Inthis same context, the digital derivative spectrophotometry was also used inorder to control the influence of the dispersion phenomena which increasesthe noise of the baseline. The digital derivative spectrophotometry used, wasproposed by the Savitzky-Galay (16), which uses the least squares procedurefor to smooth and to differentiate the spectra numerical data. Under thiscondition the higher signal/noise ratio were found.
Selection of Spectral Variables
Derivative Order
Derivative spectra of different orders were obtained from stored zero-order spectra using digital differentiation with the program, of the softwareShimadzu kit version 3.7 (P/N 206-60570-04), as can be seen in Figure 3.
As can be seen in Figure 3a–d, the second, third and fourth derivativesare more resolved, but these also showed more noise than the first deriva-tive. By using the first derivative, the copper determination is not feasiblebecause the iron spectrum does not present a zero crossing point to carryout this determination. When the second derivative is used, it is possible bysimultaneous determination, but taking account the shape of these spectra,it is possible to wait better analytical results when the third derivative isused, because the copper and iron spectra present much better defined zonesfor determination of each analyte. A wavelength of 622.0 and 477.0 nm foriron and copper determination was used, respectively.
Selection of the Smoothing Factor
Using the third derivative, the smoothing factor was varied and thefollowing values were used: 5, 10, 20 and 40. These values are defined by
158 TORAL ET AL.

default, which are in relation with the range of wavelength in which thespectra were scanned.
The �� value of differentiation is constant and correspond to 400 nm,when the smoothing factor is increased the heights of the derivative signaldecrease but the noise decrease faster, increasing in this way the signal/noiseratio. A value of 40, was selected.
Selection of the Scale Factor
This factor must be studied in order to observe if the system present adistortion effect. Further, the selection of this parameter permits to improvethe reading of the analytical signal. Considering this fact, a factor scale of105 was selected.
159
BA
(a)
DU
AB
(b)
DU
AB (c)
DU
AB
(d)
DU
0.5
-0.5
Wavelength / nm Wavelength / nm
Wavelength / nm Wavelength / nm
Figure 3. Derivative spectra of Fe(II)-TPTZ and Cu(I)-Neo. complexes retained
on sephadex sp C-25 measured against resin of reagent blank. (A) Fe(II)-TPTZ,(B) Cu(I)-Neo.; (a) First derivative spectra; (b) Second derivative spectra (c) Thirdderivative spectra and (d) Fourth derivative spectra. DU: Derivative unit. Fe,
10 ng mL�1 and Cu, 20 ng mL�1.

Optimization of Preconcentration Variables
Variables were optimized by the univariate method, for each analyte
separately. This study was carried out at room temperature, because this
process was independent of temperature in the range of 15–40�C.
The effect of the mass of the resin on the analytical signal was optimised,
in which the general procedure was followed, but the mass of the resin was
varied (Figure 4).
As can be seen in the Figure 4, the signal decrease exponentially with
the increment of the mass of the resin. For the selection of this variable was
also considered mandatory to have enough mass of resin to pack a cell
of 1 mm. In this context, a mass of 60� 0.01 mg of sephadex sp C-25 was
selected. This variable must be strongly controlled because the signal is very
dependent of the resin mass.
The effect of the stirring time on the retention for both complexes
was also studied in the range from 1 to 20 min. When a final sample
volume between 100 and 400 mL was used, the stirring time for maximum
retention for the copper and iron complexes were 8 and 10 min, respectively
(Figure 5).
On the other hand, the effect of the total volume of sample on the
retention for both complexes was also studied, keeping the amount of ana-
lyte constant, in the range from 100 to 2000 mL. When a final volume
160 TORAL ET AL.
50 1000 150 200 2500.1
0.2
0.3
0.4
0.5
0.6
DU
A
B
Mass of resin / mg
Figure 4. Effect of the mass of resin on derivative units (DU) evaluated by thirdderivative for Fe(II)-TPTZ and Cu(I)-Neo. complexes retained on resin measured
against resin of reagent blank. (A) Fe(II)-TPTZ (B) Cu(I)-Neo.; Fe, 10 ng mL�1 andCu, 20 ng mL.

between 100 and 400 mL was used for the quantitative retention of bothcomplexes, a stirring time of 12 min was found optimum. In the range from500 to 2000 mL, it was necessary to use a stirring time of 24 min for toobtain a quantitative retention.
Optimization of Chemical Variables
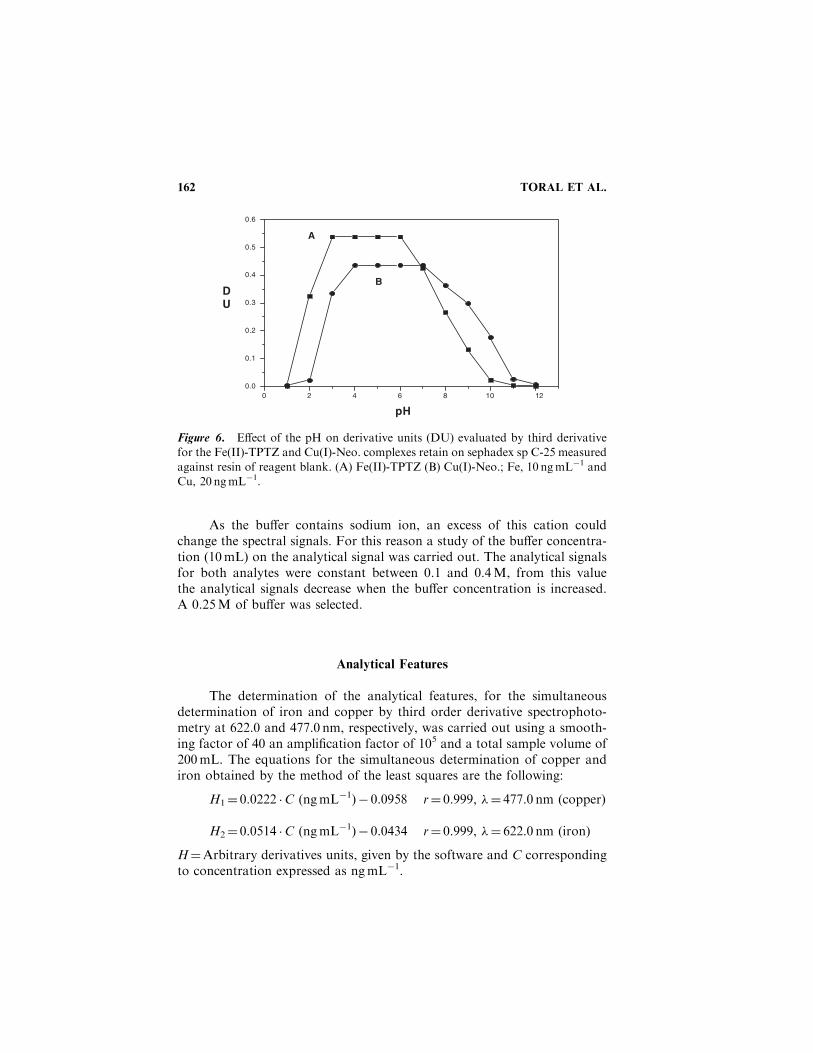
The effect of pH was studied in a range between 1.0 to 12.0. In thisstudy a buffer HAc/NaAc was used, but sodium hydroxide and hydrochloricacid was added for adjustment. The result are shown in Figure 6.
For iron complex at pH values below 3.0 or above 7.0, the derivativeunits decreases significantly, and for the copper complex the maximumderivative unit was found between 4.0 and 7.0 and the signal also decreasesin higher and lower pH values. In this context a pH value of 5.0 wasselected.
A study of TPTZ and Neocuproine concentration shows that the ana-lytical signal and the baseline increase when the TPTZ and Neocuproineconcentration are increased. Using 200 mL as total sample volume, thesignals were maximal and constant from 5 mL of 1.0� 10�3 M TPTZ andfrom 5 mL of 0.10 M Neo., for iron and copper, respectively. In order to havean excess of reagent, 5 mL of 5.0� 10�3 M TPTZ and 5 mL of 0.15 MNeocuproine were used.
161
0 2 4 6 8 10 12 14 16 18 200.0
0.1
0.2
0.3
0.4
0.5
0.6
DU
Time of stirring / min
A
B
Figure 5. Effect of the stirring time on derivative units (DU) evaluated by thirdderivative for Fe(II)-TPTZ and Cu(I)-Neo. complexes retained on sephadex sp C-25measured against resin of reagent blank. (A) Fe(II)-TPTZ (B) Cu(I)-Neo.; Fe,
10 ng mL�1 and Cu, 20 ng mL�1.
As the buffer contains sodium ion, an excess of this cation couldchange the spectral signals. For this reason a study of the buffer concentra-tion (10 mL) on the analytical signal was carried out. The analytical signalsfor both analytes were constant between 0.1 and 0.4 M, from this valuethe analytical signals decrease when the buffer concentration is increased.A 0.25 M of buffer was selected.
Analytical Features
The determination of the analytical features, for the simultaneousdetermination of iron and copper by third order derivative spectrophoto-metry at 622.0 and 477.0 nm, respectively, was carried out using a smooth-ing factor of 40 an amplification factor of 105 and a total sample volume of200 mL. The equations for the simultaneous determination of copper andiron obtained by the method of the least squares are the following:
H1¼ 0.0222 �C (ng mL�1)� 0.0958 r¼ 0.999, �¼ 477.0 nm (copper)
H2¼ 0.0514 �C (ng mL�1)� 0.0434 r¼ 0.999, �¼ 622.0 nm (iron)
H¼Arbitrary derivatives units, given by the software and C correspondingto concentration expressed as ng mL�1.
162 TORAL ET AL.
pH
0 2 4 6 8 10 120.0
0.1
0.2
0.3
0.4
0.5
0.6
DU
A
B
Figure 6. Effect of the pH on derivative units (DU) evaluated by third derivativefor the Fe(II)-TPTZ and Cu(I)-Neo. complexes retain on sephadex sp C-25 measured
against resin of reagent blank. (A) Fe(II)-TPTZ (B) Cu(I)-Neo.; Fe, 10 ng mL�1 andCu, 20 ng mL�1.
For a total volume of 200 mL the ranges in which this simultaneousdetermination could be made were found to be 0.195–120 ng mL�1 for ironand 0.451–300 ng mL�1 for copper.
The detection limits (calculated by using the 3s criterion) were foundto be 0.044 ng mL�1 for iron and 0.140 ng mL�1 for copper. The repeatabil-ity of the method expressed as relative standard deviations for ten stan-dard samples containing 74 ng mL�1 of copper and 24 ng mL�1 were 1.3and 1.8%, respectively. The detection and quantification limits can beimproved if the total volume of the sample is increased, this fact is themain advantage of the solid-phase spectrophotometry.
Interference Studies
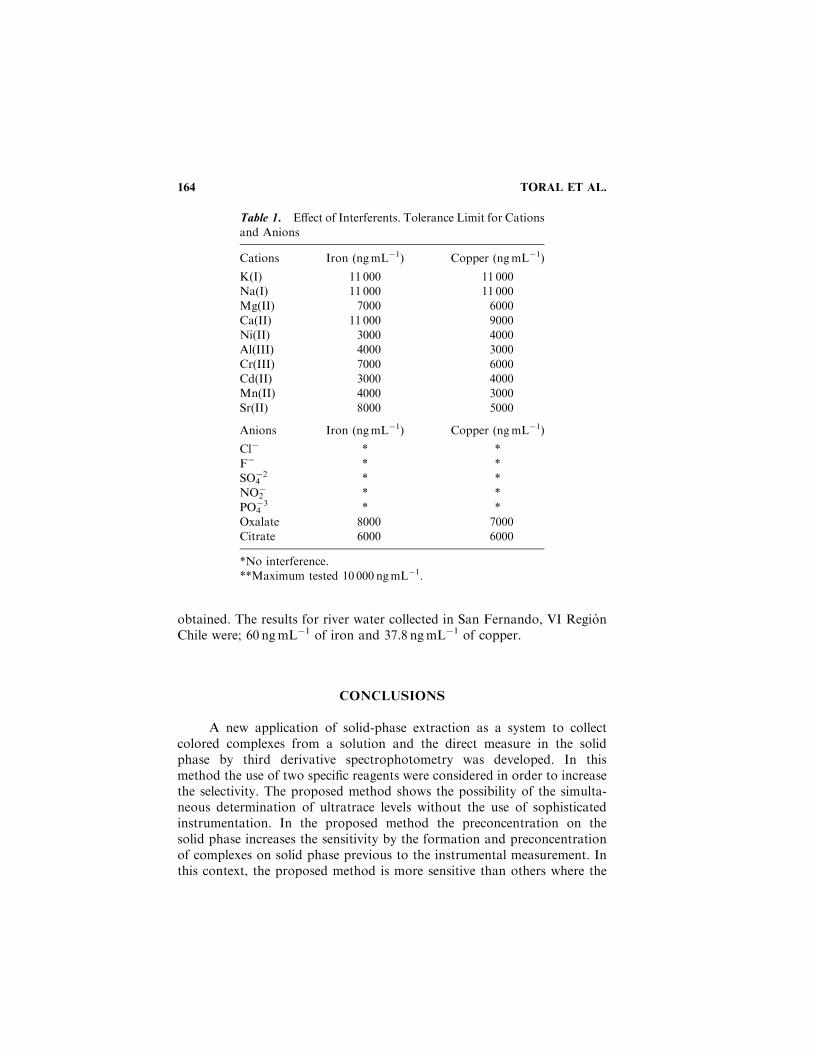
A systematic study of the effect of common foreign ions on the simul-taneous determination of 10 ng mL�1 iron and 20 ng mL�1 copper was stu-died to define the tolerance limit (amount of species that produced an errornot exceeding� 5% in the determination of these analytes). The tolerancevalues obtained are shown in Table 1. The interference of alkaline and earthalkaline cations can be explained because these species also interact with theactive charged sites of the resin. But, it is very important to indicate thatthe spectral bands of the complexes are not altered. In this context, whenthe matrix has a high saline content, the standard addition method ismandatory.
Application of the Method
The validation of this method was carried out by using a sample ofcertified river sediment. To 1 mL of the certified sample, 1.8 mL of copperof 1000 mg L�1 was added in order to enrich the copper content and then thissolution was diluted to 100 mL. An aliquot of 0.4 mL of this solution wasdiluted with de-ionized water to 200 mL (iron concentration¼ 24 ng mL�1,copper¼ 72 ng mL�1).
In this case the standard addition method was used in order toavoid matrix effects. The recovery percentages for iron and copper wereof 98.67 and 101.79%, respectively. In all cases the relative standard devia-tion was <3.0%.
The method was applied in natural water and drinking water and in allinstances the standard addition method was used in order to avoid matrixeffects. In drinking water, obtained from our laboratory in April, 2000,a concentration of 17.5 ng mL�1 of iron and 7.8 ng mL�1 of copper were
163
obtained. The results for river water collected in San Fernando, VI RegionChile were; 60 ng mL�1 of iron and 37.8 ng mL�1 of copper.
CONCLUSIONS
A new application of solid-phase extraction as a system to collectcolored complexes from a solution and the direct measure in the solidphase by third derivative spectrophotometry was developed. In thismethod the use of two specific reagents were considered in order to increasethe selectivity. The proposed method shows the possibility of the simulta-neous determination of ultratrace levels without the use of sophisticatedinstrumentation. In the proposed method the preconcentration on thesolid phase increases the sensitivity by the formation and preconcentrationof complexes on solid phase previous to the instrumental measurement. Inthis context, the proposed method is more sensitive than others where the
164 TORAL ET AL.
Table 1. Effect of Interferents. Tolerance Limit for Cationsand Anions
Cations Iron (ng mL�1) Copper (ng mL�1)
K(I) 11 000 11 000Na(I) 11 000 11 000Mg(II) 7000 6000
Ca(II) 11 000 9000Ni(II) 3000 4000Al(III) 4000 3000
Cr(III) 7000 6000Cd(II) 3000 4000Mn(II) 4000 3000
Sr(II) 8000 5000
Anions Iron (ng mL�1) Copper (ng mL�1)
Cl� * *
F� * *SO4
�2 * *NO2
� * *
PO4�3 * *
Oxalate 8000 7000Citrate 6000 6000
*No interference.**Maximum tested 10 000 ng mL�1.

simultaneous determination of both analytes is carried out directly inaqueous solution or by liquid–liquid extraction. The method is fast andsimple because the equilibrium involves the formation and retention ofthe complexes are rapid and kinetic phenomena are not present. Theproposed method was successfully applied in different types of water andit is possible to apply the method to other matrices.
ACKNOWLEDGEMENTS
The authors are grateful to the National Fund for Development ofScience and Technology (FONDECYT), project N� 1990033 and DID ofthe University of Chile I001-98/2.
REFERENCES
1. Molina-Dıaz, A.; Pascual-Reguera, M.I.; Linan-Verganzones, L.;Fernandez de Cordova, M.L.; Capitan-Vallvey, L.F. First-derivativesolid-phase spectrophotometric determination of Molybdenum at theng mL�1 level. Talanta 1994, 43, 185–191.
2. Toral, M.I.; Richter, P.; Rodrıguez, C. Simultaneous Determination ofcopper and iron by second derivative spectrophotometry using mixturesof ligans. Talanta 1997, 45, 147–153.
3. Capitan, F.; Sanchez-Palencia, G.; Navalon, A.; Capitan-Vallvey, L.F.;Vilchez, J.L. Simultaneous determination of molybdenum and tungstenby first-derivative synchonous solid-phase spectrofluorimetry. Anal.Chim. Acta 1992, 259, 345–353.
4. Vilchez, J.L.; Avidad, R.; Rohand, J.; Navalon, A.; Capitan-Vallvey,L.F. Determination of morestan residues in waters by solid-phase spec-trofluorimetry. Anal. Chim. Acta 1993, 282, 445–449.
5. Ogorevc, B.; Cai, Z.; Grabec, I. Determination of traces of copper byanodic-stripping voltammetry after its preconcentration via an ion-exchange route at carbon paste electrodes modified with vermiculite.Anal. Chim. Acta 1995, 305, 176–182.
6. Richter, P.; Toral, M.I.; Tapia, A.E.; Fuenzalida, E. Flow injectionphotometric determination of zinc and copper with zincon based onthe variation of the stability of the complexs with pH. Analyst 1997,122, 1045–1048.
7. Capitan-Garcia, F.; Checa, R.; Avidad, R.; Capitan-Vallvey, L.F.Determination of iron at ng/mL level by solid phase spectrophotometry
165

after preconcentration on cation exchange filters. Talanta 1995, 42,711–715.
8. Toral, M.I.; Bermejo-Barrera, A. Spectrophotometric and derivativespectrophotometric of the iron(II)-TPTZ-picrate ion association com-plex. Talanta 1989, 11, 1069–1074.
9. Toral, M.I.; Richter, P.; Munoz, B. Derivative spectrophotometricmethod for copper determination. Environ. Monit. Assess. 1995, 38,1–10.
10. Campbell, M.J.; Dabis, H.T. Accurate and precise determination oflead isotope ratios in clinical and environmental samples usinginductively coupled plasma-source mass spectrometry. J. Anal. At.Spectrom. 1989, 4, 235–236.
11. Ali, A.E.; Bacso, J. Investigation of different types of filters foratmospheric trace elements analysis by three analytical techniques.J. Radioanal. Nucl. Ch. 1996, 209, 147–155.
12. Kolesov, G.M.; Sapozhinikow, D.Y. Neutron-activation determina-tion of noble metals in samples of terrestrial and cosmic origin usingmicrofire assay concentration. Analyst 1995, 120, 1461–1464.
13. Masamba, W.R.; Smith, B.W.; Krupa, R.J.; Winefordner, J.D.Atomic and ionic fluorescence in an inductively coupled plasmausing hollow-cathode lamps pulsed at high currents as excitationsources. Appl. Spectrosc. 1988, 42, 872–878.
14. Toral, M.I.; Richter, P.; Tapia, A.E.; Hernandez, J. Simultaneousdetermination of iron and ruthenium as ternary complexes by extrac-tive second derivative spectrophotometry. Talanta 1999, 50, 183–191.
15. Toral, M.I.; Richter, P.; Lara, N.; Escudero, M.T.; Soto, C.Simultaneous determination of platinum and palladium by secondderivative spectrophotometry using 3-(20-Triazolylazo)-2,6-diamino-pyridine as chromophore ligand. Anal. Lett. 2000, 33, 93–109.
16. Savitzky, A.; Golay, M.J. Smooting and differentiation of data bysimplified least squares procedures. Anal. Chem. 1964, 36, 1627–1639.
166 TORAL ET AL.