
1801 Fundamentals of Spectrophotometry
47
Aug ‘17 1 Fundamentals of Spectroscopy 1801 Fundamentals of Spectrophotometry Electromagnetic Radiation 1864 1885 1890 1892 1900 1902 1905 1913 1925 1926 1927 Theory of electromagnetic radiation Equation for wavelengths of lines in visible spectra Validation of photons concept and explanation of photoelectric effect Theory of quantum energy and photons Particle/wave duality of electrons proposed Dual nature of electrons demonstrated Formula for hydrogen spectrum determined Proof of electromagnetic radiation Theory of electron “shells” Bohr developed model of hydrogen atom Establishment of Heisenberg’s uncertainty principle. Wave equations. Unification of quantum theory and wave mechanics. Problem Set Chp17:
-
Upload
khangminh22 -
Category
Documents
-
view
0 -
download
0
Transcript of 1801 Fundamentals of Spectrophotometry

Aug ‘171 Fundamentals of Spectroscopy
1801 Fundamentals of Spectrophotometry
Electromagnetic Radiation
1864 1885 1890 1892 1900 1902 1905 1913 1925 1926 1927
Theory of electromagnetic
radiation
Equation for wavelengths of lines
in visible spectra
Validation of photons concept
and explanation of photoelectric
effect
Theory of quantum energy
and photons
Theory of quantum energy
and photonsParticle/wave duality of electrons proposed
Dual nature of electrons
demonstrated
Formula for hydrogen spectrum
determined
Proof of electromagnetic
radiation
Theory of electron “shells”
Bohr developed model of hydrogen
atom
Establishment of Heisenberg’s
uncertainty principle. Wave equations.
Unification of quantum theory and wave
mechanics.Problem Set Chp17:

Aug ‘172 Fundamentals of Spectroscopy
Nature of Light(Electromagnetic Radiation)
What is light?What are its component?
What is the difference between red light and blue light?How do scientist use radiation to probe matter.

Aug ‘173 Fundamentals of Spectroscopy
Electro- Magnetic- components of lightLight is a form of energy that can
be describe as a wavel - wavelength, length of a wave
from crest to crest or trough to trough (nm)
n (nu)- the number of waves (cycles) which passes a given point (Hz or s-1 )
freq.(n) µ 1/ l larger n, smaller ln = c / l ® nl = c
c - speed of light, 3.0•108 m /sin vacuum

Aug ‘174 Fundamentals of Spectroscopy
The Electro- and Magnetic- of light
Electromagnetic RadiationLight has an electrical componentLight has a magnetic component. All electromagnetic radiation has
fundamental properties and behaves in predictable ways according to the basics of wave theory. Electromagnetic radiation consists of an electrical field(E) which varies in magnitude in a direction perpendicular to the direction in which the radiation is traveling, and a magnetic field (M) oriented at right angles to the electrical field. Both these fields travel at the speed of light (c).

Aug ‘175 Fundamentals of Spectroscopy
Light - Electromagnetic Spectrum
Visible light is actually superposition of different colors.Colors of light is due to EMR’s different wavelength or frequency

Aug ‘176 Fundamentals of Spectroscopy
Electromagnetic Spectrum
EMR SpectrumVisible light is one component of a gambit of radiation.
Electromagnetic spectrum Visible light (enlarged portion) is but a small part of the entire spectrum. The radiation’s energy increases from the radio wave end of the spectrum (low frequency, n and long wavelength, l) to the g-ray and (high frequency and short wavelength).
The solar spectrum

Aug ‘177 Fundamentals of Spectroscopy
Frequency -Wavelength RelationshipE= hn = hc/l, c = 3•108 m/s , 1•107 nm=1 cm, h = .63•10-34 J/s
Calculate the frequency of red light given l = 700nm: n = c/lRed light - l = 700 nm ~ 700•10-9 mn = 3•108 m/s / 700•10-9 m = 4.28 • 1014 s-1
n = 4.28 •1014 Hz
Calculate the wavelength of 92.5 MHz (91.X FM): l = c/nl = c / n = 3•108 m / s • 1 / 92.5 •106 Hzl = 3.24 m
Calculate the wavenumber n for UV light 300 nmn = 1/l = 1/300nm • (1•107nm/1cm) = 33333 cm-1 (1•107/ __nm) g cm-1

Aug ‘178 Fundamentals of Spectroscopy
Higgs-Boson Particle
The "God particle" is the nickname of a subatomic particle called the Higgs boson. The Higgs boson, or “God particle,” is believed to be the particle which gives mass to matter. The “God particle” nickname grew out of the long, drawn-out struggles of physicists to find this elusive piece of the cosmic puzzle.
The Higgs boson is often referred to as the "God particle" by individuals outside the scientific community, after the title of Leon Lederman's book on particle physics, The God Particle: If the Universe is the Answer, What Is the Question? Lederman said he gave it a nickname because the particle is "so central to the state of physics today, so crucial to our understanding of the structure of matter, yet so elusive,” and added that he chose "the God particle" because "the publisher wouldn't let us call it the Goddamn Particle, though that might be a more appropriate title, given its villainous nature and the expense it is causing.”
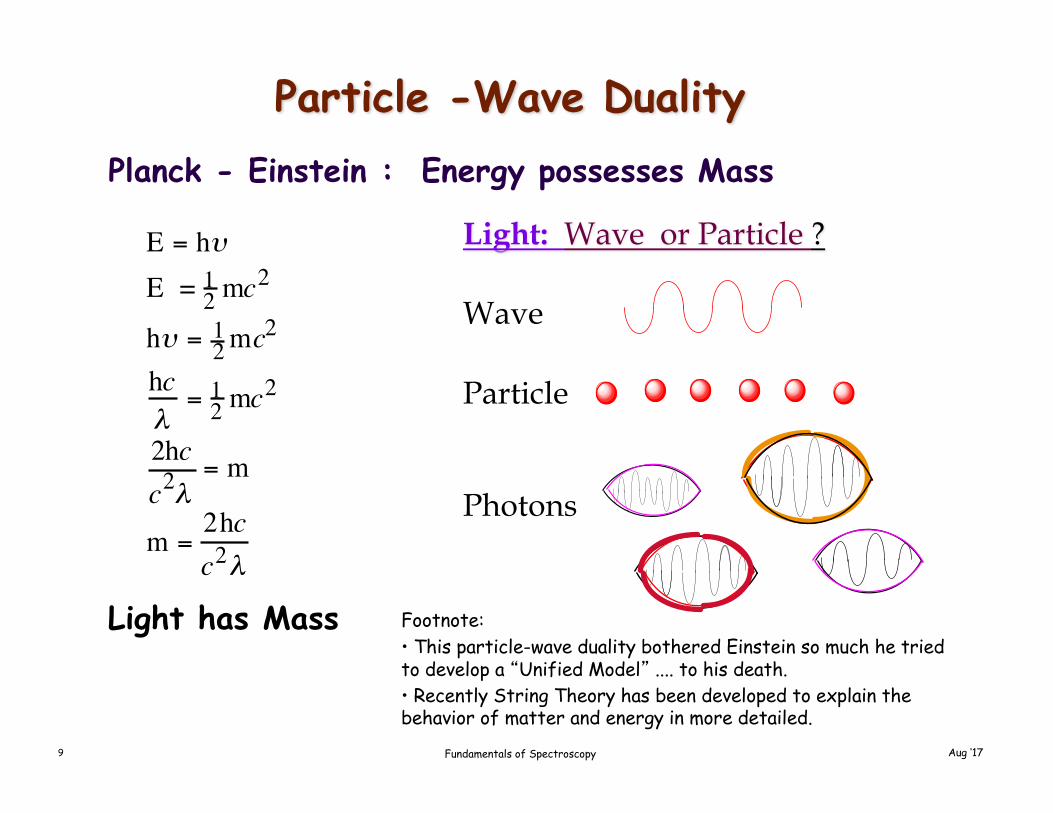
Aug ‘179 Fundamentals of Spectroscopy
Particle -Wave DualityPlanck - Einstein : Energy possesses Mass
E = hυ E = 1
2 mc2
hυ = 12 mc2
hcλ= 1
2 mc2
2hcc2λ
= m
m =2hcc2λ
Light has Mass Footnote:• This particle-wave duality bothered Einstein so much he tried to develop a “Unified Model” .... to his death.• Recently String Theory has been developed to explain the behavior of matter and energy in more detailed.
Light: Wave or Particle ?
Wave
Particle
Photons

Aug ‘1710 Fundamentals of Spectroscopy
Wave Property of ElectronsLouis DeBroglie (1923), Sorbonne, Paris. pH.D. Thesis
Particle-Wave Duality
If energy (radiation) behaves like a stream of particles, then could matter (under appropriate conditions) show wave-like properties
Indeed, light possesses momentum which can be measured by pressure of light exerted on object.
WhereU-velocityp-momentum
u = n l
€
p = mu p = Ec
mu = Ec
mν = hνc
mu = hλ
ν = much
λ = hmu
ν ∝m λ ∝m-1

Aug ‘1711 Fundamentals of Spectroscopy
Matter Possesses WaveElectron diffracted by NaCl crystal.
Diffraction is a property of light that is easily interpreted by using wave model.
Experiment confirms DeBroglie’s equation
DeBroglie’s Explanation
• Electron behave as standing or stationary wave
• The circumference of Bohr orbit must be a whole number which is a whole number multiple of the electron’s wavelength.

Aug ‘1712 Fundamentals of Spectroscopy
Wave Vs. ParticlePhoton Electrons(Planck’s) (DeBroglie)
Energy:
Wavelength
Velocity
E = hν E = 12mu
2
λ = hcE
λ = hmu
c = 3 • 108 ms u = 2Em[ ]
12
E = hn = h c / l = h c n , 1 ev = 1.60 •10-19 J

Aug ‘1713 Fundamentals of Spectroscopy
Color and Perception
The relationship between Colors and Metal Complexes
400 500 600 800

Aug ‘1714 Fundamentals of Spectroscopy
Colors & How We Perceive it
Artist color wheelshowing the colors whichare complementary to oneanother and the wavelengthrange of each color.

Aug ‘1715 Fundamentals of Spectroscopy
The color of Visible light

Aug ‘1716 Fundamentals of Spectroscopy
Black & White
If a sample absorbs all wavelengthof visible light, none reaches oureyes from that sample. Consequently, it appears black.
When a sample absorbs light, what we see is the sum of the remaining colors that strikes our eyes.
If the sample absorbs novisible light, it is white or colorless.

Aug ‘1717 Fundamentals of Spectroscopy
Absorption and Reflection
If the sample absorbsall but orange, thesample appears orange.
Further, we also perceive orange color when visible light of all colors except blue strikes our eyes. In a complementary fashion, if the sample absorbed only orange, it would appear blue; blue and orange are said to be complementary colors.
Aug ‘1718 Fundamentals of Spectroscopy
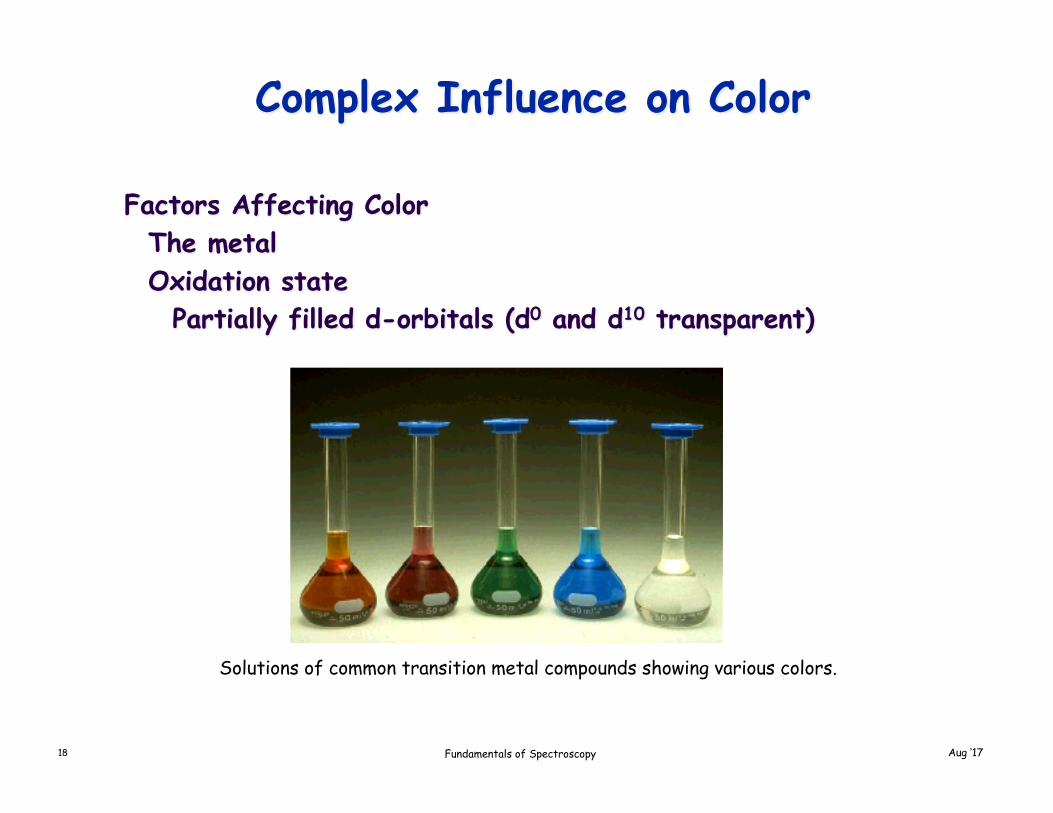
Complex Influence on Color
Factors Affecting ColorThe metalOxidation state
Partially filled d-orbitals (d0 and d10 transparent)
Solutions of common transition metal compounds showing various colors.

Aug ‘1719 Fundamentals of Spectroscopy
How we perceive colors
A solution of FeSCN2+ is not red because the complex add red radiation to the solvent.
The Visible Spectrum
Wavelength Region Color of Light Complementary ColorAbsorbed, nm Absorbed Transmitted
(what we see)400-435 Violet Yellow-green435-480 Blue Yellow-orange480-490 Blue-green Orange490-500 Green Red500-560 Green-yellow Violet560-580 Yellow-green Purple580-595 Yellow-orange Blue595-650 Orange Blue-green650-750 Red Green

Aug ‘1720 Fundamentals of Spectroscopy
The color of Visible lightLight is a form of energy carried by electric and magnetic fields traveling at 186,000 miles per second. Light has both particle and wave characteristics. The wavelength determines both its color and its energy; the shorter the wavelength, the higher the energy. Light or electromagnetic radiation, ranges from gamma rays (10-15 nm) through the visible region (500 nm) to the radio wave region (100 m). In the visible region, white light contains a spectrum of wavelengths from 400 nm (violet) to 780 nm (red); these can be seen in a rainbow or when light passes through a prism. The color of substances depends on the color of light absorbed by the molecules or atoms that compose the substance. This, in turn, depends on the energy separations between electron orbits. When a molecule or atom absorbs light, electrons are excited from lower energy orbits to higher energy orbits. If the energy of the light is high enough, light can break chemical bonds and destroy or change molecules through photo-decomposition; usually, however, the energy is simply given off again as heat or light through relaxation. The specific wavelengths at which molecules or atoms absorb or emit light serve as fingerprints for specific substances, making spectroscopy—the interaction of light and matter—a useful tool in identifying unknown substances. Magnetic resonance imaging and laser devices are two important applications of light and its interaction with matter. Light is a fundamental part of our lives as it is responsible for what we see. Sunlight is what keeps the earth alive and is our ultimate energy source. Human eyes can see a narrow band of light called visible light, but humans use many other wave-lengths for various purposes: X-rays and gamma rays are used in medicine, infrared light is used in night vision technology, microwaves are used in cooking, and radio waves are used in communication. The human eye evolved to see not only different intensities of light (black and white vision) but different colors as well. The colors that we see depend on the interaction of light with the molecules or atoms within the thing that we see.

Aug ‘1721 Fundamentals of Spectroscopy
The incandescent Bulb
An incandescent bulb will emit radiation at all wavelength much like a black body radiator.

Aug ‘1722 Fundamentals of Spectroscopy
Interaction of Radiation with MatterThe region of the electromagnetic spectrum. Interaction of an analyte with electromagnetic radiation can result in the types of changes shown. Note the changes in electron distributions occur in the UV/Vis region. The wavenumbers, wavelength, frequency and energy are characteristics that describes electromagnetic radiation.

Aug ‘1723 Fundamentals of Spectroscopy
Spectroscopic MeasurementsThe interaction of radiation with matter provides information about the sample.The sample begins at its ground state, absorbs the radiation and is stimulated to its excited state. The radiation that is absorb (ground state to excited state) or emitted (excited state returns to its ground state) contains the information. In the example below, the analyte is stimulated by nonradiative process such as heat, electrical energy or chemical reactions.
Absorption of energy (thermal, electrical or chemical Energy)
Chemiluminescence -excitation from a chemical reaction.
Emission - heat or electrical energy

Aug ‘1724 Fundamentals of Spectroscopy
Type of Spectroscopy
Absorption - radiation is absorb
photoluminescence - emitted photons after absorptionfluorescence is the instantaneous emissionphosphorescence is the delayed emission
Aug ‘1725 Fundamentals of Spectroscopy
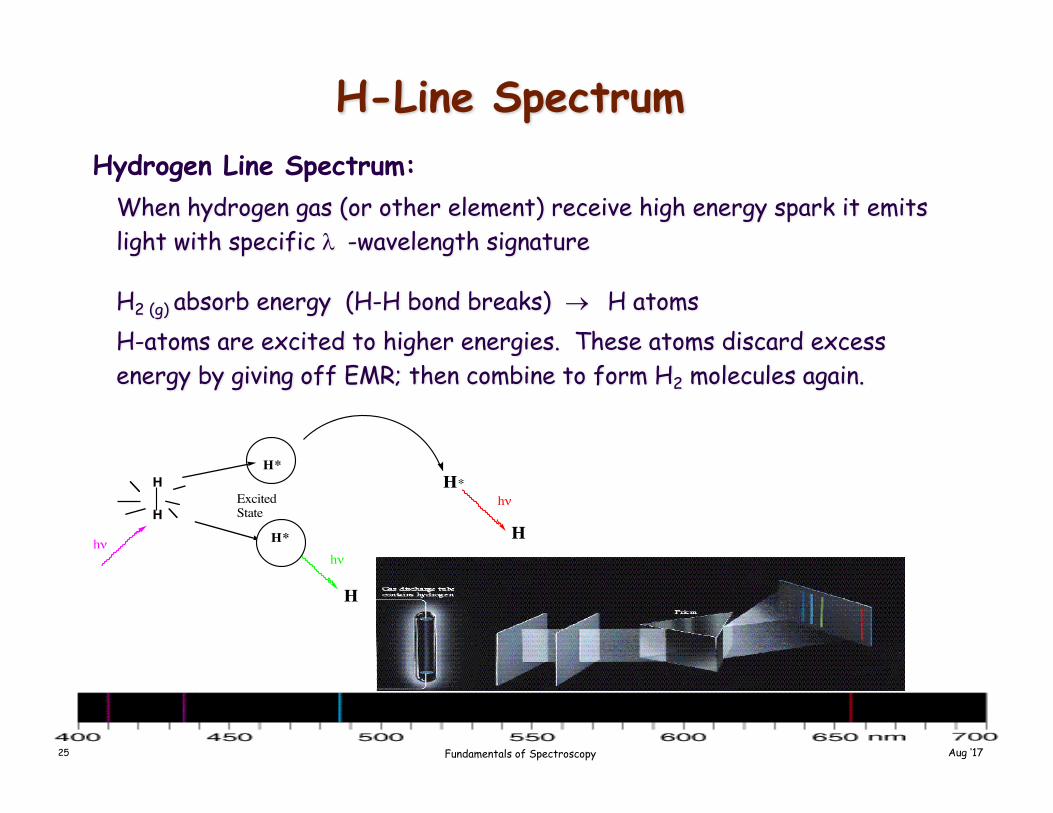
H-Line SpectrumHydrogen Line Spectrum:
When hydrogen gas (or other element) receive high energy spark it emits light with specific l -wavelength signature
H2 (g) absorb energy (H-H bond breaks) ® H atoms H-atoms are excited to higher energies. These atoms discard excess energy by giving off EMR; then combine to form H2 molecules again.
H
H
hν
H*
H*
ExcitedState
H*hν
Hhν
H

Aug ‘1726 Fundamentals of Spectroscopy
Bohr Model Illustrated• Electron orbits in circular orbit around proton in permitted allowed orbits. (This is so that electrons won’t spiral down toward nucleus).• Electrons can change to another allowed orbit
e- jumps to an energy level (absorbs energy) e- relaxes down (emit energy)
e
relaxation pathwayexcited state
In the process of absorbing energy (or photons) the electron of H is promoted to a higher orbital.
e
ground state
e e
ground state
In the relaxation process, since energy is conserve, energy is release in the form of light (photons, hv).
hv
hv

Aug ‘1727 Fundamentals of Spectroscopy
Bohr Model of the H-atom
What is the origin of the Atomic Line spectrum ?
Model of the Hydrogen atom / Atomic line Spectrum
100 nm 400 nm 600 nm 1000 nm 1400 nm
Lyman: n f = 1 Balmer: n f=2 Pashen: n f = 3
1
2
34567 ∞8
P
Lyman: n f = 1
Balmer: n f=2
Pashen: n f = 3
Lyman: n f = 1
Balmer: n f=2
Pashen: n f = 3
Electromagnetic Spectrum
1
2
34
6 7 ∞85
...
Balmer:λ = 410 nm (6-2) 434 nm (5-2) 486 nm (4-2) 656 nm (3-2)
Lyman:λ = 95.0 nm (5-1) 97.3 nm (4-1) 102.6 nm (3-1) 121.6 nm (2-1)
Paschen:λ = 1005 nm (7-3) 1094 nm (6-3) 1282 nm (5-3) 1875 nm (4-3)

Aug ‘1728 Fundamentals of Spectroscopy
Pathways to RelaxationDifferent illustrating of e- relaxing back to ground state.
1
2
3
4
567∞8
Model of the Hydrogen atom / Atomic line Spectrum
100 nm 400 nm 600 nm 1000 nm 1400 nm
Lyman: n f = 1 Balmer: n f=2 Pashen: n f = 3
1
2
34567 ∞8
P
Lyman: n f = 1
Balmer: n f=2
Pashen: n f = 3
Lyman: n f = 1
Balmer: n f=2
Pashen: n f = 3
Electromagnetic Spectrum
1
2
34
6 7 ∞85
...
Balmer:λ = 410 nm (6-2) 434 nm (5-2) 486 nm (4-2) 656 nm (3-2)
Lyman:λ = 95.0 nm (5-1) 97.3 nm (4-1) 102.6 nm (3-1) 121.6 nm (2-1)
Paschen:λ = 1005 nm (7-3) 1094 nm (6-3) 1282 nm (5-3) 1875 nm (4-3)
2. Energy Level Diagram
1. Atomic shell diagram
n=¥
3. Step Analogy 4. Well

Aug ‘1729 Fundamentals of Spectroscopy
Atomic Line Spectrum (2)The emission Lines for various atom (EMR line spectrum) results from the relaxation process of the electron from a higher excited state orbital to a lower ground state. The Rydberg equation is able to calculate the line spectrum due to this process for the H-atom. Unfortunately this equation only works for the Hydrogen and Hydrogen-like (species with only one electron) because Bohr model of the atom breaks down when there are more than two electrons. Quantum Mechanics was developed to determine the energy of the electron due to electron-electron repulsion which was the shortcoming of the Bohr model. This theory lead to the Schrodinger equation which provide a mathematical model of the atom and its electronic behavior: HY = EY.
Line emission spectra of hydrogen, mercury and neon. Excited gaseous elements produce characteristic spectra that can be used to identify the element as well as determine how much element is present in a sample.

Aug ‘1730 Fundamentals of Spectroscopy
Radiation AbsorptionAbsorption Process is best described by Beer-Lambert Law
Attenuation (decrease of photon to sample) of a bean of radiation by an absorbing solution. The incoming radiation has a higher radiant power than the radiant transmitted by the solution. The path length of the absorbing solution is b and the concentration is c.
A = -log T
= log (Po/P)
= e b c
c = molarity (M)e = molar absorptivity
L mol-1 cm-1
Optimal A: 0.4 - 0.9

Aug ‘1731 Fundamentals of Spectroscopy
Reflection and Scattering LossRadiation and scattering losses with a solution contained in a typical glass cell. Losses by reflection can occur at all the boundaries that separate the different material.
To correct against such error, the power of the radiation transmitted through the sample is compared to the radiation that passes through an identical cell that contains only the solvent or reagent blank.
Light Attenuation:
Absorbing lossScattering lossReflection loss
When glass cell contains water, 8.5 % of the yellow light is lost due to reflection. Other cause of scattering is due to dust or particle size of analyte.

Aug ‘1732 Fundamentals of Spectroscopy
Terms in AbsorptionRecommended terms approved by the American Chemical Society

Aug ‘1733 Fundamentals of Spectroscopy
Beer’s LawThere are several ways in which the law can be expressed,
A= a b c
P1 / Po = 10-A = 10 -abc where, A = log10 (I0/I1) a = 4pe / l
* A - absorbance* Po Power intensity of incident light* P1 Power intensity of light passing through the material* b is the distance that the light travels through the material (the path length)* c is the concentration of absorbing species in the material* a is the absorption coefficient or the molar absorptivity of the absorber* l is the wavelength of the light* e is the extinction coefficient
The law states that there is a logarithmic dependence between the transmission of light through a substance and the concentration of the substance, and also between the transmission and the length of material that the light travels through. Given b and a the concentration of a substance can be deduced from the amount of light transmitted by it.
If the material is a liquid, it is usually express as the absorber concentration via mole fraction i.e. a dimensionless fraction. The units of the absorption coefficient are thus reciprocal length (e.g. cm−1). If the concentration is expressed in moles per unit volume, a, is a molar absorptivity (usually given the symbol ε) in units of mol−1 cm−2 or sometimes L·mol−1·cm−1.
In the case of a gas, the concentration may be expressed as a number density (e.g. cm−3), in which case a, is an absorption cross-section and has units of area (e.g. cm2).
The value of the absorption coefficient a, varies between different absorbing materials and wavelength for a particular material. This value is determine by experiment.
b
P1P0
b

Aug ‘1734 Fundamentals of Spectroscopy
Using Beer’s LawBeer’s Law can be used to calculate molar absorptivities of species given the concentration, absorbance and the path length
Typical absorption spectra of potassium permanganate at five different concentration. The concentrations are given as ppm of Mn. A plot of absorbance at the peak wavelength at 525 nm vs. concentration shows Beer’s Law behavior.

Aug ‘1735 Fundamentals of Spectroscopy
Limits to Beer’s LawSpectrometer most accurate at intermediate levels of absorbance A~ .4 - .9
Beer’s Law many not always be obeyed. Deviation from Beer’s Law may be real deviation, instrumental deviation or chemical deviation.
Real Deviation - Beer’s Law applies only to absorption behavior under dilute solutions < 0.01M. This is the Limiting Law. At concentrations higher than 0.01M, the average distance diminish between ions causing alteration of the electrostatic interactions and the departure of Beer’s Law.
Chemical Deviation - Under some conditions, absorbing species undergoes association, dissociation, or reaction with solvent to give products that have different absorption features from the expected product.
Instrumental Deviation - Deviation from Beer’s Law result ifi) polychromatic radiation rather than monochromatic radiation is used ii) the stray light contaminates the sample (close sample chamber)iii) mismatch cells are used. iv) error in alignment of cellv) dust producing scattering of light.vi) no smudge or finger print on cuvettes.

Aug ‘1736 Fundamentals of Spectroscopy
Absorption SpectraAbsorption spectroscopy refers to a range of techniques employing the interaction of electromagnetic radiation with matter. In absorption spectroscopy, the intensity of a light’s beam is measured before and after interaction with a sample is compared. Light that is attenuated from the sample toward a detector on the opposite side of the sample is said to be detected in transmission and treated according to the theory of transmission spectroscopy. Light that is attenuated from the sample toward a detector on the same side (or right angles) of the sample is said to be detected in emission and it is this light that is the subject of emission spectroscopy. The remitted radiation may be composed of two kinds of radiation referred to as specular reflection (when the angle of reflection is equal to the angle of incidence) and diffuse
reflection (at all other angles).

Aug ‘1737 Fundamentals of Spectroscopy
Modes of SpectroscopyDifferent set up for spectroscopy

Aug ‘1738 Fundamentals of Spectroscopy
Absorption SpectroscopyMolecules undergo three type of transitions that covers ultraviolet-visible, infrared, and microwave radiation. Infrared promotes vibration of the molecule and microwave stimulates rotation of the molecule. Ultraviolet-visible radiation results in the promotion of an electron to a higher energy level. X-rays and high energy UV ruptures chemical bonds.
The length of the transition in the diagram relates to the energy of the transition. The total energy, E associated with a molecule is given by:
E = Eelectronic + Evibrational + Erotational
Energy-level diagram showing some of the energy changes that occur during absorption of infrared (IR), visible (VIS), and ultraviolet (UV) radiation by a molecular species.

Aug ‘1739 Fundamentals of Spectroscopy
Transitions and ExcitationsAn excited molecule can possess any one of a set of discrete amounts (quanta) of energy described by the laws of quantum mechanics. These amounts are called the "energy levels" of the molecule. In UV/VIS spectrophotometry, the major energy levels are determined primarily by the possible spatial distributions of the electrons and are called electronic energy levels, and to a lesser extent by vibrational energy levels, which arise from the various modes of vibration of the molecule (e.g. the stretching and bending of various covalent bonds).
For most molecules, absorption wavelengths corresponding to transitions between the ground state and any vibrational level of the first excited state, fall in the range of ultraviolet and visible light. Low-energy transitions are also possible between vibrational levels within a single electronic level. These transitions produce radiation in the infrared range.
The figure on the right illustrates the relationship between specific energy transitions in the energy level diagram (upper graph) and the absorbance spectrum (lower graph).

Aug ‘1740 Fundamentals of Spectroscopy
Absorption for Biological tissuesThe figure below shows the primary absorption spectra of biological tissues. Also shown are the absorption coefficients at some typical laser wavelengths.
There are several major contributors to the absorption spectrum:-In the ultraviolet, the absorption increases with shorter wavelength due to protein, DNA and other molecules.
- In the infrared, the absorption increases with longer wavelengths due to tissue water content. Scaling the pure water absorption by 75% mimics a typical tissue with 75% water content.
- In the red to near-IR (NIR), absorption is minimal. This region is called the diagnostic and therapeutic window.- Whole blood is a strong absorber in the red-NIR regime, but because the volume fraction of blood is a few
percent in tissues, the average absorption coefficient that affects light transport is moderate. However, when photons strike a blood vessel they encounter the full strong absorption of whole blood. Hence, local absorption properties govern light-tissue interactions, and average absorption properties govern light transport.

Aug ‘1741 Fundamentals of Spectroscopy
Atomic AbsorptionIn atomic absorption, the excitation of photons promotes the electrons from a lower energy level to a higher energy level that matches exactly the differences in energies between the highest occupied orbital and some higher unoccupied orbital. (Na)
Energy-level diagram for sodium, showing the transition resulting from absorption at 590, 330 and 285nm.

Aug ‘1742 Fundamentals of Spectroscopy
UV absorption spectraThe molecular absorption consists of absorption bands that are closely spaced. Under real conditions however, the line absorption bands become broad lines. In solution, the molecules are surrounded by solvent and the bands loses more resolution and becomes a blur hump.
Typical UV spectra. The compound, 1,2,4,5-tetrazine. The figure shows an absorption spectra in the gas phase(a), in a nonpolar solvent (b), and a polar solvent (c). The spectra in (b), shows that the electronic transition but resolution of the vibrational and rotational transition is lost. The spectra in (c) shows the blending of the electronic peaks because of strong intermolecular forces.

Aug ‘1743 Fundamentals of Spectroscopy
Infrared AbsorptionInfrared radiation are not sufficient to cause electronic transitions, but can cause different vibrational modes in a molecule.
Type of molecular vibrations. The arrows shows the direction of the movement and the plus and minus indicate the motion in or out of the plane.
IR covers the range of the electromagnetic spectrum between 0.78 and 1000 mm. The wavelength is measured in "wavenumbers", which have the units cm-1.
wavenumber = 1 / l (l in centimeters)It is useful to divide the infra red region into three sections; near-, mid-, and far infra red;
Region Wavelength range (µm) Wavenumber range (cm-1)
Near 0.78 - 2.5 12800 - 4000
Middle 2.5 - 50 4000 - 200
Far 50 -1000 200 - 10The most useful I.R. region lies between 4000 - 670cm-1
Type of molecular vibrations. The arrows shows the direction of the movement and the plus and minus indicate the motion in or out of the plane.

Aug ‘1744 Fundamentals of Spectroscopy
Fluorescence and PhosphorescenceThe emission process after absorption of radiation can take one of two photoluminescence pathways towards relaxation. Fluorescence is a rapid transition (10-5 or less) while Phosphorescence may take minutes or hours after the irradiation. A third non-photoluminescence pathway is the non-radiative relaxation.
Energy-level diagram showing some of the energy changes that occur during absorption, nonradiative relaxation and fluorescence by a molecular species

Aug ‘1745 Fundamentals of Spectroscopy
… and PhosphorescenceThe emission process after absorption of radiation can take one of two photoluminescence pathways towards relaxation. Fluorescence is a rapid transition (10-5 or less) while Phosphorescence may take minutes or hours after the irradiation. A third non-photoluminescence pathway is the nonradiative relaxation.
After an electron absorbs a photon of high energy, it may undergo vibrational relaxations and intersystem crossing to another spin state. Again the system relaxes vibrationally in the new spin state and eventually emits light by phosphorescence.

Aug ‘1746 Fundamentals of Spectroscopy
Emission of Electromagnetic RadiationEmission of a brine sample obtained in an oxyhydrogen flame. Lines of sodium, potassium, strontium, calcium and magnesium are identified. The transition for the spectrum is shown. Chemical species can emit light by (1) bombardment with electrons; (2) heating in a plasma, a flame or electric arc; (3) irradiation with a beam of light.
Real
Aug ‘1747 Fundamentals of Spectroscopy
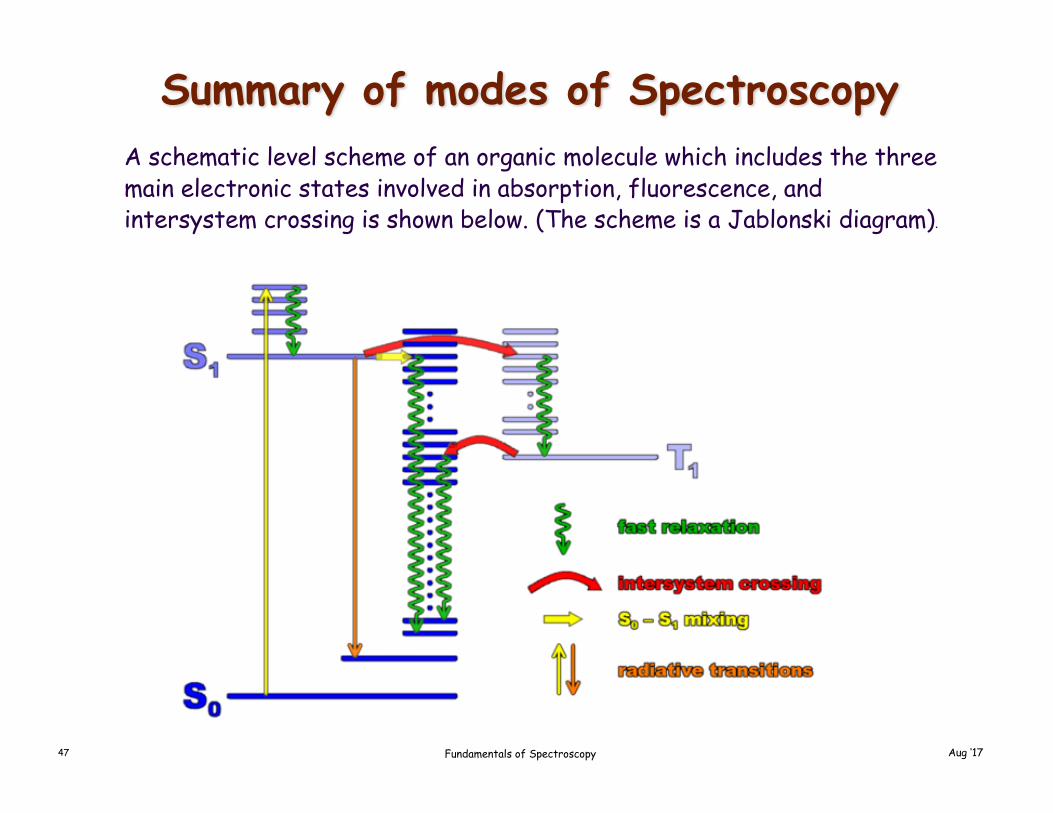
Summary of modes of Spectroscopy A schematic level scheme of an organic molecule which includes the three main electronic states involved in absorption, fluorescence, and intersystem crossing is shown below. (The scheme is a Jablonski diagram).