Simulation of NO and O2 transport facilitated by polymerized hemoglobin solutions in an arteriole...
35
Simulation of NO and O 2 Transport Facilitated by Polymerized Hemoglobin Solutions in an Arteriole that Takes into Account Wall Shear Stress-induced NO Production Yipin Zhou 1 , Pedro Cabrales 2 , and Andre F. Palmer 1,* 1 William G. Lowrie Department of Chemical and Biomolecular Engineering, The Ohio State University, Columbus, OH 43210, USA 2 Department of Bioengineering, University of California, San Diego, La Jolla, CA 92093, USA Abstract A mathematical model was developed to study nitric oxide (NO) and oxygen (O 2 ) transport in an arteriole and surrounding tissues exposed to a mixture of red blood cells (RBCs) and hemoglobin (Hb)-based O 2 carriers (HBOCs). A unique feature of this model is the inclusion of blood vessel wall shear stress-induced production of endothelial-derived NO, which is very sensitive to the viscosity of the RBC and HBOC mixture traversing the blood vessel lumen. Therefore in this study, a series of polymerized bovine Hb (PolyHb) solutions with high viscosity, varying O 2 affinity, NO dioxygenation rate constants and O 2 dissociation rate constants that were previously synthesized and characterized by our group were evaluated via mathematical modeling, in order to investigate the effect of these biophysical properties on the transport of NO and O 2 in an arteriole and its surrounding tissues subjected to anemia with the commercial HBOC Oxyglobin ® and cell- free bovine Hb (bHb) serving as appropriate controls. The computer simulation results indicated that transfusion of high viscosity PolyHb solutions promoted blood vessel wall shear stress dependent generation of the vasodilator NO, especially in the blood vessel wall and should transport enough NO inside the smooth muscle layer to activate vasodilation compared to the commercial HBOC Oxyglobin ® and cell-free bHb. However, NO scavenging in the arteriole lumen was unavoidable due to the intrinsic high NO dioxygenation rate constant of the HBOCs being studied. This study also observed that all PolyHbs could potentially improve tissue oxygenation under hypoxic conditions, while low O 2 affinity PolyHbs were more effective in oxygenating tissues under normoxic conditions compared with high O 2 affinity PolyHbs. In addition, all ultrahigh molecular weight PolyHbs displayed higher O 2 transfer rates than the commercial HBOC Oxyglobin ® and cell-free bHb. Therefore, these results suggest that ultrahigh molecular weight PolyHb solutions could be used as safe and efficacious O 2 carriers for use in transfusion medicine. It also suggests that future generations of PolyHb solutions should possess lower NO dioxygenation reaction rate constants in order to reduce NO scavenging, while maintaining high solution viscosity to take advantage of wall shear stress-induced NO production. Taken together, we suggest that this mathematical model can be used to predict the vasoactivity of HBOCs and help guide the design and optimization of the next generation of HBOCs for use in transfusion medicine. © 2011 Elsevier B.V. All rights reserved. * To whom correspondence should be addressed. Tel: (614) 292-6033 and [email protected]. Publisher's Disclaimer: This is a PDF file of an unedited manuscript that has been accepted for publication. As a service to our customers we are providing this early version of the manuscript. The manuscript will undergo copyediting, typesetting, and review of the resulting proof before it is published in its final citable form. Please note that during the production process errors may be discovered which could affect the content, and all legal disclaimers that apply to the journal pertain. NIH Public Access Author Manuscript Biophys Chem. Author manuscript; available in PMC 2013 March 1. Published in final edited form as: Biophys Chem. 2012 March ; 162: 45–60. doi:10.1016/j.bpc.2011.12.006. NIH-PA Author Manuscript NIH-PA Author Manuscript NIH-PA Author Manuscript
Transcript of Simulation of NO and O2 transport facilitated by polymerized hemoglobin solutions in an arteriole...

Simulation of NO and O2 Transport Facilitated by PolymerizedHemoglobin Solutions in an Arteriole that Takes into AccountWall Shear Stress-induced NO Production
Yipin Zhou1, Pedro Cabrales2, and Andre F. Palmer1,*
1William G. Lowrie Department of Chemical and Biomolecular Engineering, The Ohio StateUniversity, Columbus, OH 43210, USA2Department of Bioengineering, University of California, San Diego, La Jolla, CA 92093, USA
AbstractA mathematical model was developed to study nitric oxide (NO) and oxygen (O2) transport in anarteriole and surrounding tissues exposed to a mixture of red blood cells (RBCs) and hemoglobin(Hb)-based O2 carriers (HBOCs). A unique feature of this model is the inclusion of blood vesselwall shear stress-induced production of endothelial-derived NO, which is very sensitive to theviscosity of the RBC and HBOC mixture traversing the blood vessel lumen. Therefore in thisstudy, a series of polymerized bovine Hb (PolyHb) solutions with high viscosity, varying O2affinity, NO dioxygenation rate constants and O2 dissociation rate constants that were previouslysynthesized and characterized by our group were evaluated via mathematical modeling, in order toinvestigate the effect of these biophysical properties on the transport of NO and O2 in an arterioleand its surrounding tissues subjected to anemia with the commercial HBOC Oxyglobin® and cell-free bovine Hb (bHb) serving as appropriate controls. The computer simulation results indicatedthat transfusion of high viscosity PolyHb solutions promoted blood vessel wall shear stressdependent generation of the vasodilator NO, especially in the blood vessel wall and shouldtransport enough NO inside the smooth muscle layer to activate vasodilation compared to thecommercial HBOC Oxyglobin® and cell-free bHb. However, NO scavenging in the arteriolelumen was unavoidable due to the intrinsic high NO dioxygenation rate constant of the HBOCsbeing studied. This study also observed that all PolyHbs could potentially improve tissueoxygenation under hypoxic conditions, while low O2 affinity PolyHbs were more effective inoxygenating tissues under normoxic conditions compared with high O2 affinity PolyHbs. Inaddition, all ultrahigh molecular weight PolyHbs displayed higher O2 transfer rates than thecommercial HBOC Oxyglobin® and cell-free bHb. Therefore, these results suggest that ultrahighmolecular weight PolyHb solutions could be used as safe and efficacious O2 carriers for use intransfusion medicine. It also suggests that future generations of PolyHb solutions should possesslower NO dioxygenation reaction rate constants in order to reduce NO scavenging, whilemaintaining high solution viscosity to take advantage of wall shear stress-induced NO production.Taken together, we suggest that this mathematical model can be used to predict the vasoactivity ofHBOCs and help guide the design and optimization of the next generation of HBOCs for use intransfusion medicine.
© 2011 Elsevier B.V. All rights reserved.*To whom correspondence should be addressed. Tel: (614) 292-6033 and [email protected]'s Disclaimer: This is a PDF file of an unedited manuscript that has been accepted for publication. As a service to ourcustomers we are providing this early version of the manuscript. The manuscript will undergo copyediting, typesetting, and review ofthe resulting proof before it is published in its final citable form. Please note that during the production process errors may bediscovered which could affect the content, and all legal disclaimers that apply to the journal pertain.
NIH Public AccessAuthor ManuscriptBiophys Chem. Author manuscript; available in PMC 2013 March 1.
Published in final edited form as:Biophys Chem. 2012 March ; 162: 45–60. doi:10.1016/j.bpc.2011.12.006.
NIH
-PA Author Manuscript
NIH
-PA Author Manuscript
NIH
-PA Author Manuscript
IntroductionHemoglobin (Hb)-based oxygen (O2) carriers (HBOCs) have been under development as auniversal readily-available O2 carrying solution to be used in transfusion medicine forpatients suffering from moderate to serve anemia [1–5]. Despite significant commercialdevelopment, only the polymerized bovine Hb (bHb) product Hemopure® (HBOC-201,OPK Biotech, Cambridge, MA) is approved for clinical use in South Africa [6]. Recent latestage clinical results showed that HBOCs elicit vasoconstriction in the microcirculation andlead to the development of systemic hypertension [7–10]. One possible reason for theoccurrence of Hb-induced vasoconstriction stems from the rapid scavenging of thevasodilatory molecule nitric oxide (NO) by cell-free Hb in the circulation [11, 12].
NO is an important messenger molecule in vivo, which plays important roles in manyphysiological processes such as regulation of cellular respiration [13, 14] and vascular tone[15], induction of angiogenesis [16, 17], enhancement of wound healing [18, 19], andfacilitation of nervous system signaling [20]. NO is mainly generated by the layer ofendothelial cells that comprise the blood vessel wall via both enzymatic and non-enzymaticpathways [21–23]. When NO diffuses into the smooth muscle cell layer of the blood vesselwall, NO can activate soluble guanylate cyclase (sGC) [21] which converts guanosinetriphosphate (GTP) into 3’,5’-cyclic guanosine monophosphate (cGMP) [24] and inducesthe relaxation (i.e. dilation) of the blood vessel. When it diffuses into blood, NO can reactrapidly with heme-containing macromolecules such as acellular cell-free Hb and HBOCs[25] forming nitrate and methemoglobin (metHb). Thus, cell-free Hb and HBOCs areusually considered as NO sinks [26]. To further complicate matters, αβ dimers, tetramericHb and small polymerized Hb molecules can extravasate out of the blood vessel lumenthrough pores in the blood vessel wall, where these molecules can scavenge NO therebyeliciting vasoconstriction and systemic hypertension [26], which is one of the main side-effects hampering the clinical use of currently commercially available HBOCs [7–10, 18].
The bioavailability of NO derived from the endothelial cell layer can be influenced byvarious extracellular factors such as the shear stress acting on the blood vessel wall andvarious oxidative stresses [12, 27]. Both experimental studies on in vitro cell cultures andanimal models, as well as, mathematical simulations have observed and predicted thatincreasing the wall shear stress on the endothelium can increase the production rate of NO[28–33]. In the physiological range of observed blood vessel wall shear stresses rangingfrom 6–25 dyne/cm2, the rate of release of NO was found to be linearly dependent on theshear stress acting on the blood vessel wall [34, 35]. To further emphasize the importance ofshear stress-induced NO production, Cabrales et al. reported that transfusion of highviscosity >500 kDa fraction of ultrahigh molecular weight (MW) glutaraldehydepolymerized bHb (PolyHb) solutions synthesized by our group [36, 37] elicited little to novasoconstriction in a hamster top-load model [38] and in an exchange transfusion model[39], while the commercial low MW polymerized HBOC Oxyglobin® (average MW ~ 200kDa) elicited severe hypertension [40], although these various PolyHbs possessed NOdioxygenation rate constants that were similar to that of cell-free Hb. Compared toOxyglobin® (1.8 cP at a total Hb concentration of 13 g/dL) [39], the viscosities of PolyHbssynthesized by our group are much higher than that of Oxyglobin® (3.6 – 14 cP at a total Hbconcentration of 10 g/dL). Thus, it is reasonable to hypothesize that high viscosity PolyHbsolutions should be able to enhance shear stress-induced production of NO, which shouldoffset the rapid NO scavenging ability of acellular HBOCs.
Therefore, investigating simultaneous NO and O2 transport in the presence of PolyHbsolutions, especially accounting for blood vessel wall shear stress-induced production of NOdue to transfused HBOCs, can be beneficial in understanding and evaluating the potential
Zhou et al. Page 2
Biophys Chem. Author manuscript; available in PMC 2013 March 1.
NIH
-PA Author Manuscript
NIH
-PA Author Manuscript
NIH
-PA Author Manuscript

efficacy and safety of PolyHb solutions upon transfusion and optimize their future design inorder to mitigate the harmful vasoconstrictive and hypertensive effects. In a previous studyby our group, a NO/O2 transport model was developed in order to investigate NO/O2transport in an arteriole and its surrounding tissues facilitated by various types of HBOCs[41]. However, shear stress-induced generation of endothelial-derived NO was not takeninto account, which in turn may underestimate NO production upon transfusion of HBOCsolutions. In addition, to our knowledge, a mathematical model of simultaneous NO/O2transport in vivo facilitated by ultrahigh MW PolyHbs has never been conducted to date. Wehypothesize that PolyHb formulations with high solution viscosity and that correspondinglyyield high blood vessel wall shear stresses should help to facilitate an increase in tissueoxygenation upon transfusion, while maintaining adequate NO levels in the smooth musclelayer to induce vasodilation.
More specifically in this study, we propose to develop an improved NO and O2 transportmodel in a hamster arteriole exposed to a mixture of hemodiluted RBCs (to simulate theanemic state) and PolyHbs in order to investigate the effect of blood vessel wall shear stress-induced NO production caused by transfusion of highly viscous PolyHb solutions on NOtransport and O2 transport in an arteriole and its surrounding tissues upon transfusion ofvarious PolyHb solutions having different biophysical properties such as MW, diffusivity,O2 affinity, O2 dissociation kinetics and NO dioxygenation rate constant. The commerciallyavailable polymerized HBOC product Oxyglobin® and acellular bHb will be simulated forcomparison.
Materials and MethodsComputational Methods
A mathematical model based on modification of the Krogh tissue cylinder (KTC) model [41,42] was used to simulate mass transport of NO and O2 in a single arteriole to thesurrounding tissues upon transfusion of PolyHb solutions (Figure 1). The geometry of thearteriole and the surrounding tissue region were subdivided into 7 regions: 1) the RBC-richcore (0≤r≤r1); 2) the RBC-poor plasma layer (r1<r≤r2); 3) a stagnant protein glycocalyxlayer (G) (r2<r≤r3); 4) the endothelial cell layer (E) (r3<r≤r4); 5) the cell-free interstitialspace (IS) (r4<r≤r5); 6) the smooth muscle cell layer (SMC) (r5<r≤r6) and 7) the tissue space(TS) (r6<r≤r7) (Figure 1.B). The arteriole was assigned a length (Lc) of 500 µm and adiameter of 60 µm (Figure 1.A). In this model, RBCs and PolyHb molecules flow throughthe arteriolar region (0≤r≤r2) and enter the arteriole at Z = 0 and exit it at Z = Lc. O2 isassumed to be transported by the convective flow of dissolved O2, oxygenated RBCs andPolyHbs as well as other HBOCs in the blood. Due to the presence of the O2 gradientoriginating from the blood to the tissue space, O2 diffuses through the blood vessel wall intothe endothelial cell layer, smooth muscle layer and tissue space where it is consumed, whileNO is generated only by the endothelial cell layer and diffuses into both the bloodcompartment and surrounding smooth muscle cell layer and tissue. The extravasation ofPolyHb molecules through the blood vessel wall, vasoconstriction and change of blood flowrate following transfusion of the HBOCs were not considered in this model. Thismathematical model was numerically simulated using the Chemical Engineering module ofCOMSOL Multiphysics software (Comsol, Burlington, MA).
Hb-O2 Release/Binding KineticsThe kinetics of gaseous ligand binding and release between dissolved O2 and Hb insideRBCs/HBOCs is reversible and can be derived from a simplified reaction between one O2molecule and one heme group (equation 1) of the Hb tetramer. Thus, all calculations in thischapter will be based on the amount of heme groups present in RBCs and HBOCs (equation
Zhou et al. Page 3
Biophys Chem. Author manuscript; available in PMC 2013 March 1.
NIH
-PA Author Manuscript
NIH
-PA Author Manuscript
NIH
-PA Author Manuscript

2). The total amount of Hb is represented by the sum of oxygenated Hb (HbO2, oxyHb) anddeoxygenated Hb (Hb, deoxyHb) (equation 3), and the fractional saturation of Hb with O2 isdefined as S (equation 4). The rate of formation of O2 from HbO2 (RO2) is described byequation 5, where koff,O2 and kon,O2 are the O2 dissociation and association rate constants ofHb, respectively. At equilibrium, when RO2 is equal to zero, kon,O2 is given by equation 6,where Ye is the fractional saturation of Hb with O2 at equilibrium. Ye was calculated using a4-step Adair model [43] (equation 7), which is more accurate than the one-step Hill model[44] in order to increase the physiological relevance of the simulation [45], where a1-a4represent the Adair constants for either RBCs or HBOCs (listed in Table 3). Afterreorganizing the equations, the expression for RO2 can be rewritten in the form of equation8. Therefore, the corresponding rates of formation of O2 from releasing of O2 from HbO2contained inside RBCs and HBOCs are given as equations 9 and 10, respectively.
The rate of formation of HbO2 is given by the following equation RHbO2 = − RO2. The rateof formation of HbO2 in RBCs and HBOCs are described by equations 11 and 12,respectively.
(1)
(2)
(3)
(4)
(5)
(6)
(7)
(8)
(9)
Zhou et al. Page 4
Biophys Chem. Author manuscript; available in PMC 2013 March 1.
NIH
-PA Author Manuscript
NIH
-PA Author Manuscript
NIH
-PA Author Manuscript

(10)
(11)
(12)
Mass Balance on O2/NO with Hb Encapsulated within RBCs and HBOCsArteriole Lumen (0≤r≤r2)
In the arteriole lumen, blood can be roughly considered as a solution of RBCs. The RBCconcentration can be described as a function of the hematocrit (hct), which is the percentageof the total blood volume occupied by packed RBCs [46]. However, due to the Fåhraeuseffect, RBCs tend to migrate towards the central axis of the blood vessel, which generates aRBC-rich core with higher Hb concentration and a RBC-poor plasma region withcorrespondingly lower Hb concentration [47, 48]. In the RBC-rich core, the local hct ishigher than the discharge hct (HD) and is assumed to be a constant value (HC), while in theRBC-poor plasma region, the hct decreases from the core region toward the blood vesselwall and can be described by different concentration profiles ranging from step, linear andparabolic profiles [32, 49]. Chen et al. [49] investigated the effect of these three hct profileson NO/O2 transport by mathematical modeling and observed that the simulation resultsobtained by using a linear profile to describe the hct in the RBC-poor region was in goodagreement with experimental data. Thus, in this chapter, a linear hct profile and bloodvelocity (vz) profile (Figure 2) will be used to define the local blood velocity and hct at agiven radius (r) (equations 13 and 14 where Uavg is the average blood velocity). HC will becalculated by performing a mass balance on RBCs in the arteriole lumen (equation 15).Thus, the local concentration of Hb that is derived from RBCs is given by equation 16,while the luminal HBOC concentration will be determined by equation 17.
(13)
(14)
(15)
(16)
(17)
Zhou et al. Page 5
Biophys Chem. Author manuscript; available in PMC 2013 March 1.
NIH
-PA Author Manuscript
NIH
-PA Author Manuscript
NIH
-PA Author Manuscript
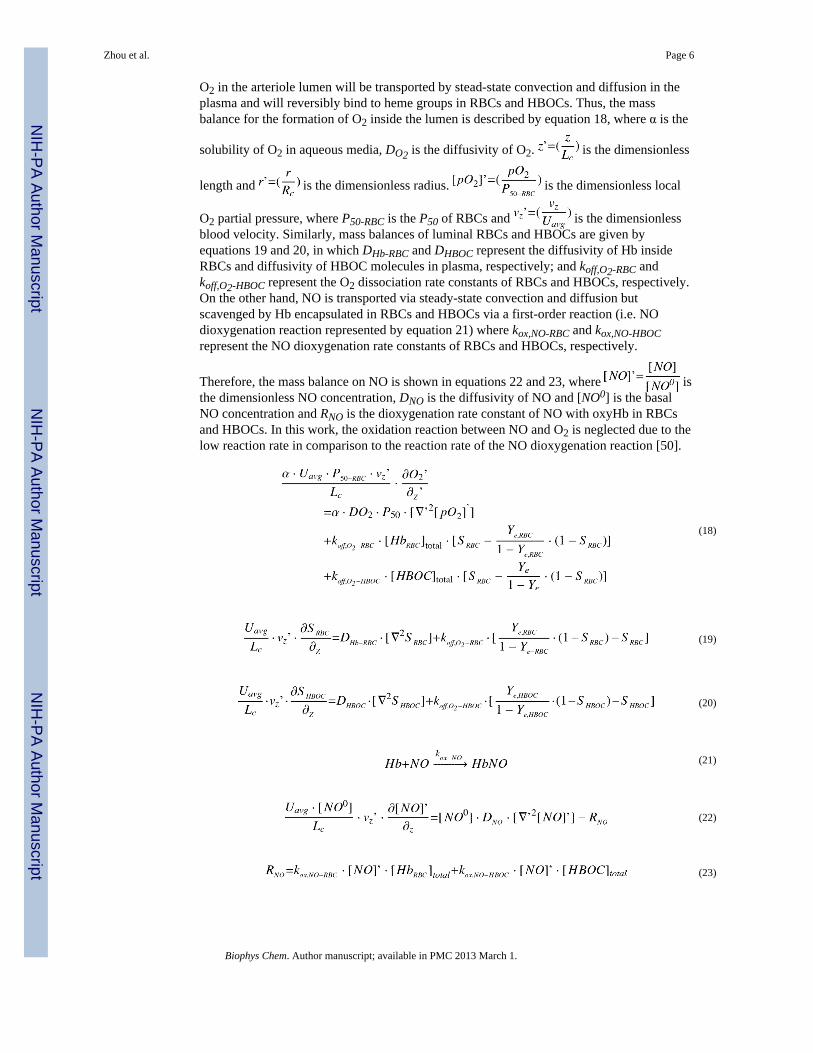
O2 in the arteriole lumen will be transported by stead-state convection and diffusion in theplasma and will reversibly bind to heme groups in RBCs and HBOCs. Thus, the massbalance for the formation of O2 inside the lumen is described by equation 18, where α is the
solubility of O2 in aqueous media, DO2 is the diffusivity of O2. is the dimensionless
length and is the dimensionless radius. is the dimensionless local
O2 partial pressure, where P50-RBC is the P50 of RBCs and is the dimensionlessblood velocity. Similarly, mass balances of luminal RBCs and HBOCs are given byequations 19 and 20, in which DHb-RBC and DHBOC represent the diffusivity of Hb insideRBCs and diffusivity of HBOC molecules in plasma, respectively; and koff,O2-RBC andkoff,O2-HBOC represent the O2 dissociation rate constants of RBCs and HBOCs, respectively.On the other hand, NO is transported via steady-state convection and diffusion butscavenged by Hb encapsulated in RBCs and HBOCs via a first-order reaction (i.e. NOdioxygenation reaction represented by equation 21) where kox,NO-RBC and kox,NO-HBOCrepresent the NO dioxygenation rate constants of RBCs and HBOCs, respectively.
Therefore, the mass balance on NO is shown in equations 22 and 23, where isthe dimensionless NO concentration, DNO is the diffusivity of NO and [NO0] is the basalNO concentration and RNO is the dioxygenation rate constant of NO with oxyHb in RBCsand HBOCs. In this work, the oxidation reaction between NO and O2 is neglected due to thelow reaction rate in comparison to the reaction rate of the NO dioxygenation reaction [50].
(18)
(19)
(20)
(21)
(22)
(23)
Zhou et al. Page 6
Biophys Chem. Author manuscript; available in PMC 2013 March 1.
NIH
-PA Author Manuscript
NIH
-PA Author Manuscript
NIH
-PA Author Manuscript

Glycocalyx Layer (r2<r≤r3)The glycocalyx layer consists of a macromolecular mesh lining the surface of the luminalside of the endothelial cell layer [51], which is structurally composed of a complex networkof polysaccharides and associated proteins such as albumin [52]. The thickness of theglycocalyx layer is estimated to be 0.5 µm [53]. As mentioned earlier, extravasation of Hb/HBOC through the blood vessel wall will be neglected in this model. Thus, O2 and NOsimply diffuse through this region without reaction. The steady-state transport of O2 and NOis described by equations 24 and 25.
(24)
(25)
Endothelial Cell Layer (r3<r≤r4)In the endothelial cell layer, the NO production rate was represented by RNO’ while the O2consumption rate was assumed to be twice the NO production rate [54, 55] (equation 26),while NO is generated proportional to the shear stress on the blood vessel wall in the rangeof 6–25 dyne/cm2 [35] (equations 27 and 28), where Q is the volumetric flow rate (ml/s) andη is the apparent solution viscosity. The blood vessel wall shear stress under normalphysiological conditions consisting of blood velocity of 0.5 cm/s and apparent bloodviscosity of 3.0 cp in an arteriole with a diameter of 50 µm was about 24 dyne/cm2 [56] andis represented by Shear_con, while the shear stress upon transfusion of HBOCs isrepresented by Shear_Exp.
(26)
(27)
(28)
The basal release rate of NO is assumed to be 5.3*10−12 mol*cm−2s−1 at a normal bloodvessel wall shear stress of 24 dyne/cm2 under the action of a physiologically normal bloodvelocity of 0.5 cm/s and apparent blood viscosity of 3.0 cp in an arteriole with a diameter of50 µm [56]. The endothelial layer in this chapter is assumed to have a thickness of 1 µm andlength of 500 µm. Thus, the baseline NO release rate (RNO, control’) is estimated to be 106nM/s.
Interstitial Layer (r4<r≤r5)Similar to the glycocalyx layer, there is no Hb or RBCs present in the interstitial layer. O2and NO simply diffuse through this region and their steady-state transport is described byequations 29 and 30.
(29)
Zhou et al. Page 7
Biophys Chem. Author manuscript; available in PMC 2013 March 1.
NIH
-PA Author Manuscript
NIH
-PA Author Manuscript
NIH
-PA Author Manuscript

(30)
Smooth Muscle Cell Layer (r5<r≤r6)O2 and NO diffuse into the smooth muscle cell layer and are consumed by the smoothmuscle cells. The consumption of O2 by smooth muscle cells is controlled by Michaelis-Menten (M-M) kinetics and inhibited in the presence of NO (equation 31), where Qmax,sm isthe maximum O2 consumption rate constant and Ksm is the M-M kinetic constant withoutNO present. The steady-state consumption of NO by the smooth muscle cells follows first-order kinetics (equation 32) with kNO-sm as the first order NO reaction rate constant.
(31)
(32)
Tissue Space (r6<r≤r7)In the tissue space, O2 and NO are transported by diffusion and are consumed by the tissuecells. Similarly, the consumption of O2 in the tissue space follows M-M kinetics and isinhibited by the presence of NO (equation 33), where Qmax,ts is the maximum O2consumption rate constant in the tissue space and Kts is the M-M kinetic constant in thetissue space in the absence of NO. The consumption of NO in the tissue space follows first-order kinetics (equation 34), where kNO-ts is the first order NO reaction rate constant.
(33)
(34)
Biophysical Properties of PolyHbs used in this Model—Two distinct types ofPolyHb solutions, i.e. low O2 affinity PolyHb (L-PolyHb) and high O2 affinity PolyHb (H-PolyHb), which were synthesized with varying molar ratios of glutaraldehyde (cross-linker)to bHb (G:Hb) ranging from 20:1 to 50:1 [36, 37], were evaluated in this model. Thebiophysical properties of PolyHbs and RBCs used in this work are listed in Tables 1 and 2.The diffusivities of PolyHbs and other HBOCs were calculated using equation 35, while thediffusivity of Hb encapsulated within RBCs was estimated using equation 36 [57]. Wecompared our results to simulations performed with the commercially available PolyHbOxyglobin® and cell-free bHb.
(35)
(36)
Zhou et al. Page 8
Biophys Chem. Author manuscript; available in PMC 2013 March 1.
NIH
-PA Author Manuscript
NIH
-PA Author Manuscript
NIH
-PA Author Manuscript

Model Parameters—The constants and parameters used in this model are listed in Table3. The arteriole diameter, average blood velocity and discharge hct (HD) for thesesimulations were taken from experimental data reported in reference [39] and personalcommunications from Dr. Cabrales (Bioengineering Department) at the University ofCalifornia, San Diego (UCSD): the HD was set to 11% to mimic animal studies conductedusing 50:1 L-PolyHb and 40:1 H-PolyHb solutions, while the HD was set to 18% to mimicanimal studies conducted using 20:1 and 30:1 L- and H-PolyHb solutions. The radius of theRBC-rich region (r1) changes proportionally with the HD [58, 59], and the r1 value used inthis work was extrapolated from values of r1 measured at hcts of 20%, 30% and 40% thatwere obtained from the literature [59]. For the calculation of NO transport, an inlet pO2 of60 mm Hg was chosen to mimic the inlet pO2s reported in the literature [39]. For thesimulation of O2 transport facilitated by HBOCs, inlet pO2 values were varied from 10–150mm Hg to simulate both hypoxic and normal physiological conditions. The diffusivities ofO2 (DO2) and NO (DNO) in the solid phase (i.e. endothelial cell layer, smooth muscle celllayer and tissue space) were reported to be half of the values reported in free solution [60,61]. Thus in this work, DO2 and DNO in these regions were assumed to be half of the valuesreported in blood phase. The overall concentration of HBOCs used in these simulations wasestimated from animal studies described in the literature [39].
The viscosity of blood after transfusion with PolyHbs and other HBOCs were taken fromreference [39] and personally communicated experimental results from Dr. Cabrales. Theblood vessel wall shear stress upon transfusion of 20:1 and 30:1 PolyHbs were calculatedusing equation 28 and listed in Table 4, while the blood vessel wall shear stresses upontransfusion of 40:1 H and 50:1 L PolyHb solutions were taken from the experimental resultscontained in reference [39]. The viscosity of blood at hcts of 11% and 18% were estimatedfrom the literature [62]. The effect of transfusion of Oxyglobin® and bHb on the resultantviscosity of blood was neglected in this study, since Oxyglobin® and bHb possessviscosities of 1.8 [39] and 1.6 [37] cp, respectively, even at concentrations higher than 10 g/dL.
ResultsEffect of PolyHb on NO Profiles
Vasoconstriction elicited by the transfusion of commercial HBOCs due to the undesiredrapid scavenging of NO by HBOCs has long been considered one of the major side-effectshampering the clinical use of HBOCs in transfusion medicine [8–10, 63–65]. However, ithas been demonstrated experimentally that transfusion of ultrahigh MW PolyHb solutionswith high viscosity into animals exhibited less vasoactivity upon transfusion compared tothe commercial PolyHb Oxyglobin® [38, 39]. This is partly because administration of highviscosity solutions increases blood vessel wall shear stress, which induces the endotheliumto produce the vasodilator NO [28, 66–70] so as to offset the intrinsic NO scavenging effectof HBOCs. Thus in this work, we are also going to study the NO generating effect obtainedvia transfusion of high viscosity PolyHb solutions by computer simulation. In order tocompare our results with 35% exchange transfusion experiments that were reported in theliterature [39], the overall PolyHb concentration in our calculations was set to 3.5 g/dL andthe inlet pO2 was set to 60 mm Hg.
The effect of increasing blood vessel wall shear stress due to transfusion of high viscosityPolyHb solutions on the steady-state radial NO concentration profiles at hcts of 11% and18% are shown in Figure 3 and compared to radial NO concentration profiles withoutconsidering the influence of blood vessel wall shear stress-induced NO production.Hemodiluted blood at a hct of 11% [39] and 18% in the absence of HBOCs were used ascontrols. The radial NO concentration profiles displayed in Figure 3 represent the NO
Zhou et al. Page 9
Biophys Chem. Author manuscript; available in PMC 2013 March 1.
NIH
-PA Author Manuscript
NIH
-PA Author Manuscript
NIH
-PA Author Manuscript
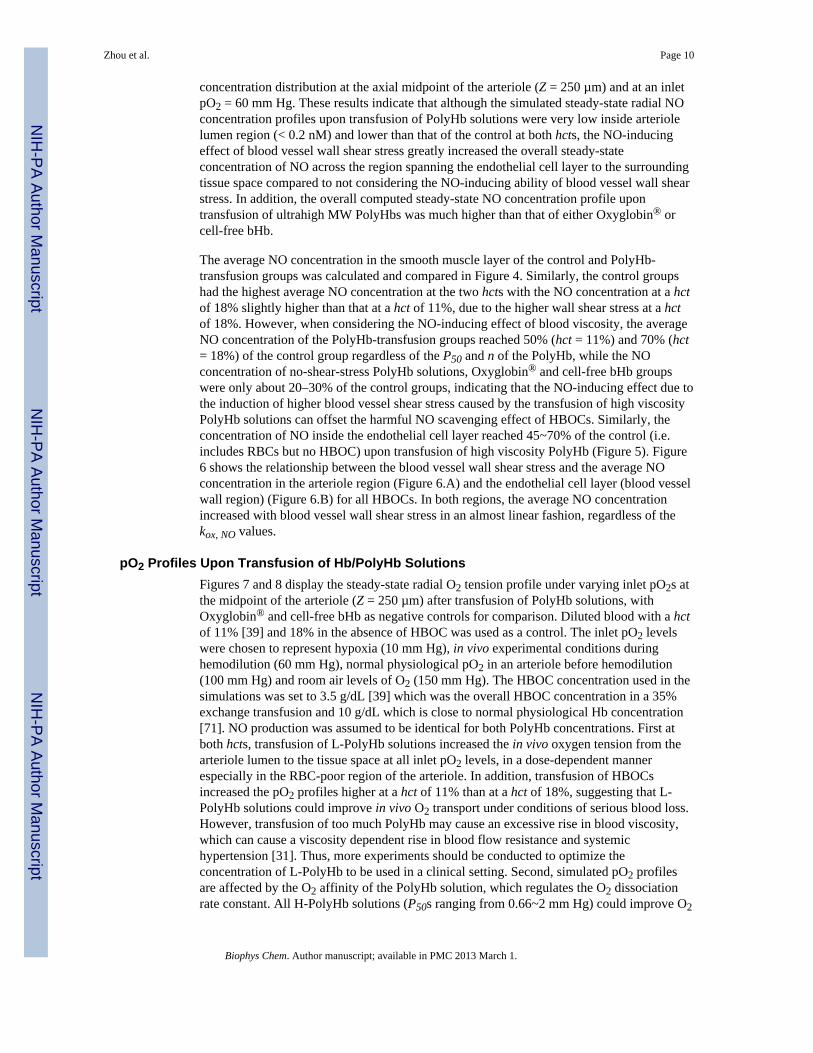
concentration distribution at the axial midpoint of the arteriole (Z = 250 µm) and at an inletpO2 = 60 mm Hg. These results indicate that although the simulated steady-state radial NOconcentration profiles upon transfusion of PolyHb solutions were very low inside arteriolelumen region (< 0.2 nM) and lower than that of the control at both hcts, the NO-inducingeffect of blood vessel wall shear stress greatly increased the overall steady-stateconcentration of NO across the region spanning the endothelial cell layer to the surroundingtissue space compared to not considering the NO-inducing ability of blood vessel wall shearstress. In addition, the overall computed steady-state NO concentration profile upontransfusion of ultrahigh MW PolyHbs was much higher than that of either Oxyglobin® orcell-free bHb.
The average NO concentration in the smooth muscle layer of the control and PolyHb-transfusion groups was calculated and compared in Figure 4. Similarly, the control groupshad the highest average NO concentration at the two hcts with the NO concentration at a hctof 18% slightly higher than that at a hct of 11%, due to the higher wall shear stress at a hctof 18%. However, when considering the NO-inducing effect of blood viscosity, the averageNO concentration of the PolyHb-transfusion groups reached 50% (hct = 11%) and 70% (hct= 18%) of the control group regardless of the P50 and n of the PolyHb, while the NOconcentration of no-shear-stress PolyHb solutions, Oxyglobin® and cell-free bHb groupswere only about 20–30% of the control groups, indicating that the NO-inducing effect due tothe induction of higher blood vessel shear stress caused by the transfusion of high viscosityPolyHb solutions can offset the harmful NO scavenging effect of HBOCs. Similarly, theconcentration of NO inside the endothelial cell layer reached 45~70% of the control (i.e.includes RBCs but no HBOC) upon transfusion of high viscosity PolyHb (Figure 5). Figure6 shows the relationship between the blood vessel wall shear stress and the average NOconcentration in the arteriole region (Figure 6.A) and the endothelial cell layer (blood vesselwall region) (Figure 6.B) for all HBOCs. In both regions, the average NO concentrationincreased with blood vessel wall shear stress in an almost linear fashion, regardless of thekox, NO values.
pO2 Profiles Upon Transfusion of Hb/PolyHb SolutionsFigures 7 and 8 display the steady-state radial O2 tension profile under varying inlet pO2s atthe midpoint of the arteriole (Z = 250 µm) after transfusion of PolyHb solutions, withOxyglobin® and cell-free bHb as negative controls for comparison. Diluted blood with a hctof 11% [39] and 18% in the absence of HBOC was used as a control. The inlet pO2 levelswere chosen to represent hypoxia (10 mm Hg), in vivo experimental conditions duringhemodilution (60 mm Hg), normal physiological pO2 in an arteriole before hemodilution(100 mm Hg) and room air levels of O2 (150 mm Hg). The HBOC concentration used in thesimulations was set to 3.5 g/dL [39] which was the overall HBOC concentration in a 35%exchange transfusion and 10 g/dL which is close to normal physiological Hb concentration[71]. NO production was assumed to be identical for both PolyHb concentrations. First atboth hcts, transfusion of L-PolyHb solutions increased the in vivo oxygen tension from thearteriole lumen to the tissue space at all inlet pO2 levels, in a dose-dependent mannerespecially in the RBC-poor region of the arteriole. In addition, transfusion of HBOCsincreased the pO2 profiles higher at a hct of 11% than at a hct of 18%, suggesting that L-PolyHb solutions could improve in vivo O2 transport under conditions of serious blood loss.However, transfusion of too much PolyHb may cause an excessive rise in blood viscosity,which can cause a viscosity dependent rise in blood flow resistance and systemichypertension [31]. Thus, more experiments should be conducted to optimize theconcentration of L-PolyHb to be used in a clinical setting. Second, simulated pO2 profilesare affected by the O2 affinity of the PolyHb solution, which regulates the O2 dissociationrate constant. All H-PolyHb solutions (P50s ranging from 0.66~2 mm Hg) could improve O2
Zhou et al. Page 10
Biophys Chem. Author manuscript; available in PMC 2013 March 1.
NIH
-PA Author Manuscript
NIH
-PA Author Manuscript
NIH
-PA Author Manuscript

transport to the tissue space to the same level as L-PolyHb solutions (P50s ranging from37~41 mm Hg), Oxyglobin® (P50 of 38 mm Hg) and cell-free bHb (P50 of 27 mm Hg) underhypoxic conditions (inlet pO2 = 10 mm Hg) regardless of PolyHb molecular size and hct.However, H-PolyHbs exhibited less of an ability to improve O2 transport than either L-PolyHb and Oxyglobin® at experimental hemodilution (60 mm Hg), normal physiological orsupraphysiological (100 and 150 mm Hg) inlet pO2 levels (Figure 7 B/C/D/F/G/H andFigure 8 B/C/D/F/G/H). In fact, increasing the O2 affinity of H-PolyHb solutions reduced itsability to improve O2 transport to the tissues upon transfusion. These results are inagreement with previous predictions in the literature [36, 37], which showed that H-PolyHbsolutions with extremely high O2 affinity and low O2 dissociation rate constant canpotentially oxygenate hypoxic tissues, which is similar to that of MP4 [72, 73], but is noteffective at oxygenating tissues under normoxic conditions. In contrast, all L-PolyHbsolutions possessed an enhanced ability to improve O2 transport in the tissue spacecompared to H-PolyHb solutions and cell-free bHb and could increase the O2 tension to asimilar level as Oxyglobin® at all PolyHb concentrations and inlet pO2s. These computersimulation results confirm the prediction that L-PolyHbs have the same O2 transport abilityas Oxyglobin®. In addition, cell-free bHb exhibited much less of an ability to improve O2transport than either L-PolyHb and Oxyglobin® at high inlet pO2s (100–150 mm Hg, Figure7.D/G/H, Figure 8.D/G/H) and was able to improve O2 transport no better than 40:1 and30:1 H-PolyHbs, which had the highest O2 affinities among the HBOCs studied, at an inletpO2 of 150 mmHg and at a hct of 18% especially at high HBOC concentrations (Figure 7.Hand Figure 8.H). This phenomenon can be ascribed to two reasons. First, bHb possessed alower O2 dissociation rate constant (36.1 s−1) compared to the PolyHbs (53–58 s−1) andOxyglobin® (60 s−1). Second, because of the higher cooperativity (2.7) and O2 associationrate constant of bHb [37] compared to L-PolyHbs, bHb has a better chance of binding O2instead of releasing O2 at high inlet pO2s compared to L-PolyHbs.
O2 Transfer Rate of PolyHbsThe O2 transfer rates at steady-state after administration of HBOC solutions at varying inletpO2s from 10–150 mmHg were calculated as the difference in the O2 flux between theentrance and exit of the arteriole lumen and shown in Figure 9 in comparison with those ofOxyglobin® and cell-free bHb. The O2 transfer rates of RBCs in diluted blood at hcts of11% and 18% were used as controls. At both hcts, the O2 transfer rates of all simulationgroups increased with increasing inlet pO2 and reached a plateau when the inlet pO2 washigher than 130 mm Hg. At a hct of 11% and at all inlet pO2s (Figure 9 A), L- and H-PolyHbs exhibited higher calculated O2 transfer rates than that of the control and any otherHBOC. Interestingly, although H-PolyHb didn’t enhance oxygenation of the tissue aseffectively as L-PolyHb, 40:1 H-PolyHb had a slightly higher O2 transfer rate than 50:1 L-PolyHb at inlet pO2s lower than 60 mm Hg, while L-PolyHb transferred O2 faster at inletpO2s higher than 70 mm Hg. In contrast, Oxyglobin® and bHb had lower O2 transfer ratesthan the control at inlet pO2s lower than 70 mm Hg. When the inlet pO2 was higher than 70mm Hg, the O2 transfer rates of Oxyglobin® and bHb rose to a similar level to that of H-PolyHb, which is consistent with the lower oxygenation ability of H-PolyHb. Similarly, at ahct of 18% (Figure 9.B), two H-PolyHbs had similar O2 transfer rates, which were higherthan that of the control and any of the other HBOCs at low to medium inlet pO2s (10–70mm Hg). The O2 transfer rates of both L-PolyHbs rose to a higher level than the controlwhen the inlet pO2 was higher than 60 mm Hg and to a similar level to H-PolyHb at an inletpO2 higher than 70 mm Hg. Again, the O2 transfer rates of Oxyglobin® and bHb were thelowest when the inlet pO2 was lower than 80 mm Hg and rose to a higher level compared tothe control at an inlet pO2 higher than 80 mm Hg. Interestingly, when the inlet pO2 waslower than 70–80 mm Hg, the O2 transfer rates were inversely related to the HBOCconcentration at both hcts, while at an inlet pO2 between 80–120 mm Hg, O2 transfer rates
Zhou et al. Page 11
Biophys Chem. Author manuscript; available in PMC 2013 March 1.
NIH
-PA Author Manuscript
NIH
-PA Author Manuscript
NIH
-PA Author Manuscript

increased with HBOC concentration at a hct of 11% but mainly remained unaffected byHBOC concentration at a hct of 18%.
DiscussionThis work is aimed at predicting the effect of PolyHb’s biophysical properties, for exampleO2 affinity and viscosity, on the transport of NO and O2 in an arteriole to primarily evaluatethe efficacy and safety of PolyHbs in clinical applications via a mathematical model basedon modification of the KTC model. An ideal HBOC should be able to improve tissueoxygenation, as well as, maintain adequate NO levels inside the smooth muscle layer tomaintain vasodilation. In order to simulate the structure of an arteriole and blood flow, thephysiological parameters of an arteriole such as hct, average blood velocity, diameter ofarteriole lumen and blood viscosity after transfusion were all taken from in vivo experimentson PolyHb solutions [39]. The effect of endothelial-derived NO production induced by thehigh wall shear stress generated by the flow of high viscosity PolyHb solutions on NOtransport was also investigated in this study.
In vivo, radial concentration profile of NO across the arteriole lumen to surrounding tissuesshould be determined by the balance of the NO scavenging rate of heme-containingmacromolecules and the NO production rate of the endothelial cell layer. High viscosityPolyHb solutions tend to elevate blood and plasma viscosity in the systemic circulation,which was previously considered to be harmful, since blood viscosity was reported to berelated to the physiopathology of hypertension and heart disease [30, 74–77]. However,recent experiments and a mathematical model have demonstrated that slight elevation inblood viscosity, e.g. due to a slight increase in the hct by less than 19%, could lower themean arterial pressure due to blood vessel wall shear stress-mediated production of thevasodilator NO [31, 32, 69]. The PolyHb solutions studied in this work increased theapparent blood viscosity after transfusion but didn’t overly surpass the normal physiologicalblood viscosity (Table 4). Thus, transfusion of high viscosity PolyHb solutions is expectedto increase the production of NO without excessively increasing blood flow resistance. Onthe other hand, all PolyHb solutions possess high NO dioxygenation rate constantscompared to RBCs. Therefore, the NO concentration profile in the arteriole will be affectedby the combined effects of the aforementioned two factors.
Table 5 lists the blood vessel wall shear stress reported in the literature with the calculatedresults using equation 28. It is evident that the calculated results are in good agreement withthe experimental results. Thus, equation 28 was accurate in estimating the blood vessel wallshear stress for this simulation.
In our simulations, the two controls without HBOC had the highest radial NO concentrationprofiles across the arteriole into the tissue space at each respective hct (Figures 3~5).Interestingly, the radial [NO] profiles and average NO concentrations of the two controlgroups in the arteriole lumen, endothelial cell layer and smooth muscle layer (Figures 3~5)increased with increasing hct, although there were more RBCs present in the lumen of bloodvessels at a hct of 18% to consume NO, indicating that when the NO consumption rate islow, enhancement in the NO production rate can offset the increased NO consumption bythe increased hct. For PolyHbs, although their computationally calculated radial NO profileswere lower than those of the controls no matter whether the blood vessel wall shear stresswas taken into account or not, the radial NO concentration profile upon transfusion ofPolyHb solutions was observed to be much higher than that of Oxyglobin® and cell-freebHb. Transfusion of PolyHb solutions increased the NO release rate from the blood vesselwall 2–2.5 times compared to that of the control, since the NO production rate is linearlydependent on the blood vessel wall shear stress [34] within the physiological wall shear
Zhou et al. Page 12
Biophys Chem. Author manuscript; available in PMC 2013 March 1.
NIH
-PA Author Manuscript
NIH
-PA Author Manuscript
NIH
-PA Author Manuscript

stress range of 6–25 dyne/cm2 [35]. However, the NO dioxygenation rate constant (kox,NO)of PolyHbs and other HBOCs are two orders of magnitude higher than that of RBCs due tothe presence of RBC membrane, which acts as a significant intracellular barrier against NOdiffusion [78]. This explains why the radial NO concentration profiles of the controls werehigher than that of the PolyHb solutions and other HBOCs with high NO dioxygenation rateconstants. However, this result demonstrated that the enhanced NO production rate due totransfusion of high viscosity PolyHbs offset the NO scavenging effect of the PolyHbs to alarge extent. The calculated NO concentration upon transfusion of PolyHb solutions in theendothelial cell layer and smooth muscle layer was proportional to the blood vessel wallshear stress and could reach over 70% of the control values when the NO-inducing effect ofhigh wall shear stress due to the high viscosity of PolyHb solutions was considered, whilethat of Oxyglobin® reached about 30% of the control (≤ 27 nM). Condorelli et al. reportedthat the median activation concentration of sGC in the smooth muscle layer by NO isapproximately 23 nM [79]. Upon transfusion of PolyHb solutions, the simulated NOconcentration inside the blood vessel wall ranged from 40 – 60 nM. Thus, transfusion ofPolyHb solutions is expected leave enough NO in the blood vessel wall for vasodilationcompared to Oxyglobin®. This is consistent with published results of animal tests with highMW and high viscosity PolyHb solutions, in which a little to mild rise in mean arterialpressure was observed after transfusion of the >500 kDa fraction of ultrahigh MW PolyHbsolutions [38, 39], while transfusion of Oxyglobin® and PolyHb fractions smaller than 500kDa with lower viscosity (1.0~1.4 cp) elicited a significant rise in mean arterial pressure [9,38, 39]. Additionally, although it was expected that the extremely low diffusivities ofPolyHbs in solution due to their ultrahigh MW could retard scavenging of NO by PolyHb inthe arteriole lumen, simulation results showed that the NO concentration in the arteriolelumen upon transfusion of PolyHb was lower than 0.2 nM due to the high NO dioxygenationrate constant, which masked the effects of retarded diffusion of PolyHbs. In summary,according to our simulation results, the [NO] profile is primarily a function of the balancebetween the blood vessel wall shear stress-mediated NO production rate and the rate of NOscavenging. Another key result is that quenching of NO inside the arteriole lumen isunavoidable. However, it is possible to maintain adequate NO levels in the smooth musclecell layer by increasing blood vessel wall shear stress. The blood vessel wall shear stressincreases proportionally with the viscosity of blood, which depends on the concentration ofPolyHb in the blood. However, an excessive increase in the viscosity of blood, e.g. higherthan 50%, may offset the vasodilatory effect of shear stress-induced NO production via theviscosity dependent rise of blood flow resistance, which may cause hypertension [31]. Thus,more research must be conducted to lower the intrinsic reactivity of PolyHb with NO, whilemaintaining the post-transfusion blood viscosity to 3–4 cp in order to induce blood vesselwall shear stress-dependent NO production. Additionally, the PolyHb concentration shouldalso be optimized in order to not only maintain shear stress-induced NO production, but alsoto avoid viscosity-induced hypertension.
The radial pO2 profiles are reported to be affected by the hct profile, blood velocity profile,radial distribution of HBOC and P50 [49]. Simulation results of the radial pO2 distribution(Figures 7 and 8) showed that transfusion of HBOC increased the pO2 profiles mostefficiently in the RBC-poor region of the arteriole at all inlet pO2s and hcts. This is becauseHBOC molecules contribute a significant fraction of the total Hb concentration present inthe RBC-poor region (equation 17) due to the behavior of the paucity of RBC in this region.Thereby, more O2 was released in this region than in the RBC-rich core. However, althoughthe concentration of HBOC in the RBC-poor region increased with increasing r according toequation 17, the pO2 dropped rapidly from the RBC-rich core to the glycocalyx layer insteadof increasing with HBOC concentration due to the rapid diffusion of O2 into the neighboringendothelial cell layer where O2 was rapidly consumed by these cells.
Zhou et al. Page 13
Biophys Chem. Author manuscript; available in PMC 2013 March 1.
NIH
-PA Author Manuscript
NIH
-PA Author Manuscript
NIH
-PA Author Manuscript

Comparing the simulation results using different HBOCs at varying concentrations and inletpO2s with in vivo measurements, all HBOCs only slightly improved oxygenation of thesurrounding tissues, while either 50:1 L-PolyHb or 40:1 H-PolyHb could increase theaverage pO2 in the arteriole by 30–60 mm Hg [39]. This discrepancy between simulationand experiments may be because in the model the HBOCs are assumed to be equilibratedwith the inlet pO2, while in the in vivo studies the PolyHb solutions, which were equilibratedwith room air (pO2 ≈ 144 mm Hg), may contain large amounts of O2 upon transfusion.Thus, the HBOC in the computer simulations can be much less O2 saturated than those inthe in vivo experiments, especially the L-PolyHbs, and the inlet concentration of O2 carriedby blood in the simulation can be much lower than that of the in vivo experiments, so thatthe amount of O2 which can be offloaded to tissues may be underestimated in thesimulations.
The O2 affinity which is quantified by the P50 is another important factor that determines theefficacy of PolyHb solutions. Under hypoxic conditions (e.g. 10 mm Hg, Figure 7.A/E andFigure 8.A/E), H-PolyHb could obviously improve oxygenation of the surrounding tissuesas efficiently as other HBOCs, while under normoxic conditions H-PolyHb hardly increasesthe pO2 profile. The efficiency of tissue oxygenation displayed by high O2 affinity PolyHbsolutions in hypoxic regions is in agreement with results of previous simulations with lowP50 HBOCs in a hepatic hollow fiber bioreactor [37]. Therefore, it is possible to use amixture of L- and H-PolyHb for formulating the transfusion solution, in which H-PolyHbwould oxygenate the extremely hypoxic tissues while L-PolyHb would oxygenate normoxictissues. However, there is debate on the efficacy of low P50 HBOCs to oxygenate tissuesunder normoxic conditions. Sakai et al. [80] and Cabrales et al. [81] reported that transfusionof vesicle encapsulated Hb with high O2 affinities oxygenated tissues better than vesicleswith low O2 affinities at an inlet pO2 of 60 mm Hg. Tsai et al. [82] reported that MP4 (P50 ≈5 mm Hg) could release more O2 in the capillaries than Oxyglobin®. On the other hand,recently, Cabrales et al. [39] observed in animal tests that high O2 affinity H-PolyHb wasmuch less effective in oxygenating tissues surrounding arterioles than L-PolyHb. Oursimulation results support the in vivo results obtained on transfusion of ultra-high MWPolyHbs. The discrepancy between our simulation results and in vivo results of transfusionof MP4 and Hb vesicles possessing high O2 affinity may be caused by the different intrinsicbiophysical properties of these HBOCs.
In contrast, all L-PolyHbs could obviously increase the in vivo pO2 profiles to a similar levelto that of Oxyglobin® at all inlet pO2s (Figures 7 and 8), irrespective of the cross-linkdensity. The tissue oxygenation abilities of 20:1 and 30:1 PolyHbs were almost identical,which is consistent with their similar O2 affinities and O2 dissociation rate constants.However, the pO2 profiles of cell-free bHb were slightly higher than those of L-PolyHbs atinlet pO2s of 0 and 60 mm Hg at both hcts (Figures 7 A/B/E/F and 8), while the pO2profiles of Oxyglobin® were also higher than that of L-PolyHb at inlet pO2s ranging from 10to 100 mm Hg at a hct of 11% (Figure 7.A/B/C/G/E/F, Figure 8.A/B/C/G/E/F). Thisphenomenon is similar to O2 transport simulation results obtained in hepatic hollow fiberbioreactors [37]. These results indicated that at low to medium in vivo pO2s, the diffusion ofHBOC molecules can have more of an influence on blood vessel and tissue oxygenationthan the HBOC O2 affinity and O2 dissociation rate constant. Thus, confirming that thelimited diffusion of PolyHb due to its ultrahigh MW may slightly retard offloading of O2 totissues. Therefore, these simulation results suggest that although high MW PolyHbs can helpto eliminate the harmful extravasation of HBOC through the blood vessel wall and prolongthe in vivo circulation time, the MW should engineered to obtain optimum tissueoxygenation and the longest circulation time at all blood vessel inlet pO2 levels.
Zhou et al. Page 14
Biophys Chem. Author manuscript; available in PMC 2013 March 1.
NIH
-PA Author Manuscript
NIH
-PA Author Manuscript
NIH
-PA Author Manuscript

Compared with the controls, Oxyglobin® and cell-free bHb, both L- and H-PolyHbsdisplayed higher O2 transfer rates (Figure 9). Patton and Palmer [57] predicted in a model ofO2 transport in a capillary that the release of O2 from RBCs and HBOCs is affected by theHBOC/RBC O2 affinity, cooperativity and HBOCs can compete with RBCs for O2 andbehave as sink for O2 depending on the relative O2 saturation of the RBCs and HBOCs. Oursimulation results showed that the O2 consumption rate, which was affected by the NOproduction rate, played a more important role in regulating the rate of O2 delivery. Forexample, bHb has a higher O2 saturation than L-PolyHb and Oxyglobin® at any pO2, butlower O2 transfer rate than those HBOCs under low to medium inlet pO2s. In oursimulations, Oxyglobin® and bHb had a lower O2 transfer rate than the control and PolyHbsat inlet pO2s ranging from 20 – 60 mm Hg. In this low inlet pO2 range, HBOCs werepartially O2 saturated. Patton and Palmer [57] suggested that when the tissue including theendothelial cell layer, smooth muscle cell layer and surrounding tissue had low O2consumption, unconsumed O2 could diffuse back into the arteriole lumen and bind to anyheme-containing molecules with available O2 binding sites. In our simulations, the NOproduction rate determines the O2 consumption rate in the endothelium (equation 26). Thus,Oxyglobin® and bHb possessed lower O2 consumption rates compared to PolyHbs andbehaved more like an O2 sink. Cell-free bHb exhibited this O2 sink effect more thanOxyglobin® in this inlet pO2 range, since its higher cooperativity (2.7) and O2 associationrate constant which increases with increasing pO2 made bHb more readily able to bind O2.The O2 “sink” effect of these HBOCs can be more pronounced at higher HBOCconcentrations when more HBOC is available to bind O2. When the inlet pO2 was higherthan 70 mm Hg, the O2 “sink” effect of the HBOCs started to be gradually counteracted bythe increasing amount of transported O2 and the high O2 dissociation rate constants of theseHBOCs. Therefore, the HBOC’s O2 transfer rates increased significantly and surpassed thatof the control, when the inlet pO2 was higher than 70 mm Hg. On the other hand, O2diffusion from the plasma layer to the blood vessel wall could be improved 2–2.5 fold aftertransfusion of L- and H-PolyHbs compared to transfusion of other HBOCs due to the highNO production rate in the endothelial cell layer, which also increased the release of O2 fromPolyHbs regardless of their O2 affinity and saturation. Therefore, PolyHbs displayed higherO2 transfer rates compared to the control and the commercial HBOC Oxyglobin® or bHb.
ConclusionsNO and O2 transport in an arteriole in the presence of RBCs and HBOCs under anemicconditions was studied in this work with a mathematical model. According to the simulationresults, administration of high viscosity ultrahigh MW PolyHb solutions should yield lessvasoconstriction by promoting blood vessel wall shear stress-dependent generation of thevasodilator NO, especially in the blood vessel walls compared to the commercial PolyHbOxyglobin®. However, quenching of NO by PolyHb molecules in the arteriole lumen isinevitable due to the high NO dioxygenation rate constant of the PolyHb molecules. Underhypoxic conditions, all PolyHbs could improve tissue oxygenation under anemic conditionsas effectively as the commercial HBOC Oxyglobin®, while L-PolyHb solutions were moreeffective in delivering O2 than H-PolyHb solutions under normoxic conditions. In addition,all ultrahigh MW PolyHb displayed higher O2 transfer rates than the commercial HBOCOxyglobin®. Taken together, the simulation results indicate that a safe and efficaciousHBOC should possess high viscosity and a low NO dioxygenation rate constant in order toreduce the side-effects associated with previous generations of acellular HBOCs.
Highlights
➢ Developed mathematical model of nitric oxide and oxygen transport in anarteriole
Zhou et al. Page 15
Biophys Chem. Author manuscript; available in PMC 2013 March 1.
NIH
-PA Author Manuscript
NIH
-PA Author Manuscript
NIH
-PA Author Manuscript

➢ Arteriole contained a mixture of red blood cells and HBOCs
➢ Model accounted for wall shear stress-induced production of nitric oxide
AcknowledgmentsThis work was supported by National Institutes of Health grants R01HL078840 and R01DK070862 to AFP.
References1. Chen JY, Scerbo M, Kramer G. A review of blood substitutes: examining the history, clinical trial
results, and ethics of hemoglobin-based oxygen carriers. Clinics (Sao Paulo, Brazil). 2009; 64(8):803–813.
2. Greenburg AG. The ideal blood substitute. Critical care clinics. 2009; 25(2):415–424. Table ofContents. [PubMed: 19341917]
3. Winslow RM. Current status of oxygen carriers ('blood substitutes'): 2006. Vox sanguinis. 2006;91(2):102–110. [PubMed: 16907870]
4. Winslow RM. Red cell substitutes. Seminars in hematology. 2007; 44(1):51–59. [PubMed:17198847]
5. Lewis JH. Deantigenated Beef Blood Plasma as a Possible Substitute for Human Blood Plasma.Science (New York, NY. 1943; 98(2547):371–372.
6. Jahr JS, Moallempour M, Lim JC. HBOC-201, hemoglobin glutamer-250 (bovine), Hemopure (R)(Biopure Corporation). Expert Opin Biol Th. 2008; 8(9):1425–1433.
7. Freilich D, Pearce LB, Pitman A, Greenburg G, Berzins M, Bebris L, Ahlers S, McCarron R.HBOC-201 vasoactivity in a phase III clinical trial in orthopedic surgery subjects--extrapolation ofpotential risk for acute trauma trials. The Journal of trauma. 2009; 66(2):365–376. [PubMed:19204509]
8. Natanson C, Kern SJ, Lurie P, Banks SM, Wolfe SM. Cell-free hemoglobin-based blood substitutesand risk of myocardial infarction and death: a meta-analysis. Jama. 2008; 299(19):2304–2312.[PubMed: 18443023]
9. Rice J, Philbin N, Handrigan M, Hall C, McGwin G, Ahlers S, Pearce LB, Arnaud F, McCarron R,Freilich D. Vasoactivity of bovine polymerized hemoglobin (HBOC-201) in swine with traumatichemorrhagic shock with and without brain injury. The Journal of trauma. 2006; 61(5):1085–1099.[PubMed: 17099513]
10. Yu B, Volpato GP, Chang K, Bloch KD, Zapol WM. Prevention of the pulmonary vasoconstrictoreffects of HBOC-201 in awake lambs by continuously breathing nitric oxide. Anesthesiology.2009; 110(1):113–122. [PubMed: 19104178]
11. Gibson QH, Roughton FJW. The kinetics and equilibria of the reactions of nitric oxide with sheephaemoglobin. J Physiol. 1957; 136(3)
12. Kavdia M, Tsoukias NM, Popel AS. Model of nitric oxide diffusion in an arteriole: impact ofhemoglobin-based blood substitutes. Am J Physiol Heart Circ Physiol. 2002; 282(6):H2245–H2253. [PubMed: 12003834]
13. Brown GC, Borutaite V. Nitric oxide and mitochondrial respiration in the heart. Cardiovascularresearch. 2007; 75(2):283–290. [PubMed: 17466959]
14. Lipton SA. Physiology. Nitric oxide and respiration. Nature. 2001; 413(6852):118–119. 121.[PubMed: 11557961]
15. Moncada S, Higgs EA. Nitric oxide and the vascular endothelium. Handbook of experimentalpharmacology. 2006; 176(Pt 1):213–254. [PubMed: 16999221]
16. Ziche M. Role of NO in angiogenesis. J Vasc Res. 2004; 41(1):95–95.17. Ziche M, Morbidelli L. Molecular regulation of tumour angiogenesis by nitric oxide. European
cytokine network. 2009; 20(4):164–170. [PubMed: 20167555]
Zhou et al. Page 16
Biophys Chem. Author manuscript; available in PMC 2013 March 1.
NIH
-PA Author Manuscript
NIH
-PA Author Manuscript
NIH
-PA Author Manuscript

18. Weller RB. Nitric oxide-containing nanoparticles as an antimicrobial agent and enhancer of woundhealing. The Journal of investigative dermatology. 2009; 129(10):2335–2337. [PubMed:19749782]
19. Zhu H, Wei X, Bian K, Murad F. Effects of nitric oxide on skin burn wound healing. J Burn CareRes. 2008; 29(5):804–814. [PubMed: 18695618]
20. Vincent SR. Nitric oxide neurons and neurotransmission. Prog Neurobiol. 2010; 90(2):246–255.[PubMed: 19853011]
21. Chen K, Pittman RN, Popel AS. Nitric oxide in the vasculature: where does it come from andwhere does it go? A quantitative perspective. Antioxidants & redox signaling. 2008; 10(7):1185–1198. [PubMed: 18331202]
22. Furchgott RF, Carvalho MH, Khan MT, Matsunaga K. Evidence for endothelium-dependentvasodilation of resistance vessels by acetylcholine. Blood vessels. 1987; 24(3):145–149. [PubMed:3036283]
23. Ignarro LJ, Buga GM, Wood KS, Byrns RE, Chaudhuri G. Endothelium-derived relaxing factorproduced and released from artery and vein is nitric oxide. Proceedings of the National Academyof Sciences of the United States of America. 1987; 84(24):9265–9269. [PubMed: 2827174]
24. Denninger JW, Marletta MA. Guanylate cyclase and the .NO/cGMP signaling pathway.Biochimica et biophysica acta. 1999; 1411(2–3):334–350. [PubMed: 10320667]
25. Olson JS, Foley EW, Rogge C, Tsai AL, Doyle MP, Lemon DD. No scavenging and thehypertensive effect of hemoglobin-based blood substitutes. Free Radical Biology and Medicine.2004; 36(6):685–697. [PubMed: 14990349]
26. Olson JS, Foley EW, Rogge C, Tsai AL, Doyle MP, Lemon DD. No scavenging and thehypertensive effect of hemoglobin-based blood substitutes. Free radical biology & medicine. 2004;36(6):685–697. [PubMed: 14990349]
27. Dudzinski DM, Igarashi J, Greif D, Michel T. The regulation and pharmacology of endothelialnitric oxide synthase. Annual review of pharmacology and toxicology. 2006; 46:235–276.
28. Buga GM, Gold ME, Fukuto JM, Ignarro LJ. Shear stress-induced release of nitric oxide fromendothelial cells grown on beads. Hypertension. 1991; 17(2):187–193. [PubMed: 1991651]
29. Garvin JL, Cabral PD, Hong NJ. Shear stress increases nitric oxide production in thick ascendinglimbs. Am J Physiol-Renal. 2010; 299(5):F1185–F1192.
30. Martini J, Carpentier B, Negrete AC, Cabrales P, Tsai AG, Intaglietta M. Beneficial effects due toincreasing blood and plasma viscosity. Clin Hemorheol Micro. 2006; 35(1–2):51–57.
31. Martini J, Carpentier B, Negrete AC, Frangos JA, Intaglietta M. Paradoxical hypotensionfollowing increased hematocrit and blood viscosity. American Journal of Physiology-Heart andCirculatory Physiology. 2005; 289(5):H2136–H2143. [PubMed: 16006543]
32. Sriram K, Vazquez BY, Yalcin O, Johnson PC, Intaglietta M, Tartakovsky DM. The effect ofsmall changes in hematocrit on nitric oxide transport in arterioles. Antioxid Redox Sign. 2010;14(2):175–185.
33. Ulker P, Yaras N, Yalcin O, Celik-Ozenci C, Johnson PC, Meiselman HJ, Baskurt OK. Shearstress activation of nitric oxide synthase and increased nitric oxide levels in human red blood cells.Nitric Oxide. 2011; 24(4):184–191. [PubMed: 21419856]
34. Kanai AJ, Strauss HC, Truskey GA, Crews AL, Grunfeld S, Malinski T. Shear stress induces ATP-independent transient nitric oxide release from vascular endothelial cells, measured directly with aporphyrinic microsensor. Circulation research. 1995; 77(2):284–293. [PubMed: 7614715]
35. Kuchan MJ, Frangos JA. Role of Calcium and Calmodulin in Flow-Induced Nitric-OxideProduction in Endothelial-Cells. American Journal of Physiology. 1994; 266(3):C628–C636.[PubMed: 8166225]
36. Buehler PW, Zhou Y, Cabrales P, Jia Y, Sun G, Harris DR, Tsai AG, Intaglietta M, Palmer AF.Synthesis, biophysical properties and pharmacokinetics of ultrahigh molecular weight tense andrelaxed state polymerized bovine hemoglobins. Biomaterials. 2010; 31(13):3723–3735. [PubMed:20149433]
37. Zhou YP, Jia YP, Buehler PW, Chen G, Cabrales P, Palmer AF. Synthesis, Biophysical Properties,and Oxygenation Potential of Variable Molecular Weight Glutaraldehyde-Polymerized BovineHemoglobins with Low and High Oxygen Affinity. Biotechnol Progr. 2011; 27(4):1172–1184.
Zhou et al. Page 17
Biophys Chem. Author manuscript; available in PMC 2013 March 1.
NIH
-PA Author Manuscript
NIH
-PA Author Manuscript
NIH
-PA Author Manuscript

38. Cabrales P, Sun GY, Zhou YP, Harris DR, Tsai AG, Intaglietta M, Palmer AF. Effects of themolecular mass of tense-state polymerized bovine hemoglobin on blood pressure andvasoconstriction. J Appl Physiol. 2009; 107(5):1548–1558. [PubMed: 19745190]
39. Cabrales P, Zhou Y, Harris DR, Palmer AF. Tissue oxygenation after exchange transfusion withultrahigh-molecular-weight tense- and relaxed-state polymerized bovine hemoglobins. Am JPhysiol Heart Circ Physiol. 2010; 298(3):H1062–H1071. [PubMed: 20061539]
40. Driessen B, Jahr JS, Lurie F, Gunther RA. Inadequacy of low-volume resuscitation withhemoglobin-based oxygen carrier hemoglobin glutamer-200 (bovine) in canine hypovolemia.Journal of veterinary pharmacology and therapeutics. 2001; 24(1):61–71. [PubMed: 11348488]
41. Gundersen SI, Chen G, Palmer AF. Mathematical model of NO and O2 transport in an arteriolefacilitated by hemoglobin based O2 carriers. Biophysical chemistry. 2009; 143(1–2):1–17.[PubMed: 19318228]
42. Popel AS. Theory of oxygen transport to tissue. Critical reviews in biomedical engineering. 1989;17(3):257–321. [PubMed: 2673661]
43. Adair GS. The hemoglobin system. VI. The oxygen dissociation curve of hemoglobin. J BiolChem. 1925; 63(2):529–545.
44. Hill AV. The Combinations of Haemoglobin with Oxygen and with Carbon Monoxide. I. TheBiochemical journal. 1913; 7(5):471–480. [PubMed: 16742267]
45. Sullivan JP, Gordon JE, Palmer AF. Simulation of oxygen carrier mediated oxygen transport toC3A hepatoma cells housed within a hollow fiber bioreactor. Biotechnology and bioengineering.2006; 93(2):306–317. [PubMed: 16161160]
46. Vander, A.; Sherman, J.; Luciano, D. Vander's human physiology: the mechanisms of bodyfunction. Eighth ed.. Boston: McGraw-Hill; 2001. Circulation; p. 373-462.
47. Sharan M, Popel AS. A two-phase model for flow of blood in narrow tubes with increasedeffective viscosity near the wall. Biorheology. 2001; 38(5–6):415–428. [PubMed: 12016324]
48. Tsai AG, Johnson PC, Intaglietta M. Oxygen gradients in the microcirculation. Physiologicalreviews. 2003; 83(3):933–963. [PubMed: 12843412]
49. Chen X, Jaron D, Barbee KA, Buerk DG. The influence of radial RBC distribution, blood velocityprofiles, and glycocalyx on coupled NO/O2 transport. J Appl Physiol. 2006; 100(2):482–492.[PubMed: 16210436]
50. Buerk DG. Can we model nitric oxide biotransport? A survey of mathematical models for a simplediatomic molecule with surprisingly complex biological activities. Annual review of biomedicalengineering. 2001; 3:109–143.
51. Weinbaum S, Tarbell JM, Damiano ER. The structure and function of the endothelial glycocalyxlayer. Annual review of biomedical engineering. 2007; 9:121–167.
52. Levine HA, McGee MP, Serna S. Diffusion and reaction in the cell glycocalyx and theextracellular matrix. Journal of mathematical biology. 2010; 60(1):1–26. [PubMed: 19274464]
53. van den Berg BM, Vink H, Spaan JA. The endothelial glycocalyx protects against myocardialedema. Circulation research. 2003; 92(6):592–594. [PubMed: 12637366]
54. Chen X, Buerk DG, Barbee KA, Jaron D. A model of NO/O2 transport in capillary-perfused tissuecontaining an arteriole and venule pair. Annals of biomedical engineering. 2007; 35(4):517–529.[PubMed: 17235703]
55. Chen K, Popel AS. Theoretical analysis of biochemical pathways of nitric oxide release fromvascular endothelial cells. Free radical biology & medicine. 2006; 41(4):668–680. [PubMed:16864000]
56. Liao JC, Vaughn MW, Kuo L. Estimation of nitric oxide production and reaction rates in tissue byuse of a mathematical model. Am J Physiol-Heart C. 1998; 274(6):H2163–H2176.
57. Patton JN, Palmer AF. Numerical simulation of oxygen delivery to muscle tissue in the presence ofhemoglobin-based oxygen carriers. Biotechnology progress. 2006; 22(4):1025–1049. [PubMed:16889379]
58. Cole RH, Vandegriff KD, Szeri AJ, Savas O, Baker DA, Winslow RM. A quantitative frameworkfor the design of acellular hemoglobins as blood substitutes: implications of dynamic flowconditions. Biophysical chemistry. 2007; 128(1):63–74. [PubMed: 17418478]
Zhou et al. Page 18
Biophys Chem. Author manuscript; available in PMC 2013 March 1.
NIH
-PA Author Manuscript
NIH
-PA Author Manuscript
NIH
-PA Author Manuscript

59. Tateishi N, Suzuki Y, Cicha I, Maeda N. O2 release from erythrocytes flowing in a narrow O2-permeable tube: effects of erythrocyte aggregation. American Journal of Physiology-Heart andCirculatory Physiology. 2001; 281(1):H448–H456. [PubMed: 11406514]
60. Fischkoff S, Vanderkooi JM. Oxygen diffusion in biological and artificial membranes determinedby the fluorochrome pyrene. The Journal of general physiology. 1975; 65(5):663–676. [PubMed:1176942]
61. Mahler M, Louy C, Homsher E, Peskoff A. Reappraisal of diffusion, solubility, and consumptionof oxygen in frog skeletal muscle, with applications to muscle energy balance. The Journal ofgeneral physiology. 1985; 86(1):105–134. [PubMed: 4031823]
62. Snyder GK. Influence of temperature and hematocrit on blood viscosity. The American journal ofphysiology. 1971; 220(6):1667–1672. [PubMed: 5087815]
63. Buehler PW, Alayash AI. Toxicities of hemoglobin solutions: in search of in-vitro and in-vivomodel systems. Transfusion. 2004; 44(10):1516–1530. [PubMed: 15383027]
64. Buehler PW, D'Agnillo F. Toxicological consequences of extracellular hemoglobin: biochemicaland physiological perspectives. Antioxidants & redox signaling. 2010; 12(2):275–291. [PubMed:19659434]
65. Simoni J, Simoni G, Moeller JF. Intrinsic toxicity of hemoglobin: how to counteract it. Artificialorgans. 2009; 33(2):100–109. [PubMed: 19178453]
66. Box FM, van der Geest RJ, Rutten MC, Reiber JH. The influence of flow, vessel diameter, andnon-newtonian blood viscosity on the wall shear stress in a carotid bifurcation model for unsteadyflow. Invest Radiol. 2005; 40(5):277–294. [PubMed: 15829825]
67. Kolluru GK, Sinha S, Majumder S, Muley A, Siamwala JH, Gupta R, Chatterjee S. Shear stresspromotes nitric oxide production in endothelial cells by sub-cellular delocalization of eNOS: Abasis for shear stress mediated angiogenesis. Nitric Oxide. 2010; 22(4):304–315. [PubMed:20188204]
68. Sprague B, Chesler NC, Magness RR. Shear stress regulation of nitric oxide production in uterineand placental artery endothelial cells: experimental studies and hemodynamic models of shearstresses on endothelial cells. Int J Dev Biol. 2010; 54(2–3):331–339. [PubMed: 19876820]
69. Tsai AG, Acero C, Nance PR, Cabrales P, Frangos JA, Buerk DG, Intaglietta M. Elevated plasmaviscosity in extreme hemodilution increases perivascular nitric oxide concentration andmicrovascular perfusion. Am J Physiol Heart Circ Physiol. 2005; 288(4):H1730–H1739.[PubMed: 15576432]
70. Tsai AG, Intaglietta M. High viscosity plasma expanders: Volume restitution fluids for loweringthe transfusion trigger. Biorheology. 2001; 38(2–3):229–237. [PubMed: 11381177]
71. Macdougall IC. Individualizing target haemoglobin concentrations - tailoring treatment for renalanaemia. Nephrology Dialysis Transplantation. 2001; 16:9–14.
72. Vandegriff KD, Malavalli A, Wooldridge J, Lohman J, Winslow RM. MP4, a new nonvasoactivePEG-Hb conjugate. Transfusion. 2003; 43(4):509–516. [PubMed: 12662285]
73. Winslow RM. MP4, a new nonvasoactive polyethylene glycol-hemoglobin conjugate. Artificialorgans. 2004; 28(9):800–806. [PubMed: 15320943]
74. Rosenson RS, Shott S, Tangney CC. Elevated blood viscosity contributes to coronary heart diseaserisk in hypertriglyceridemia subjects. Atherosclerosis. 1997; 134(1–2):94–94.
75. Devereux RB, Case DB, Alderman MH, Pickering TG, Chien S, Laragh JH. Possible role ofincreased blood viscosity in the hemodynamics of systemic hypertension. Am J Cardiol. 2000;85(10):1265. [PubMed: 10802017]
76. Macrury SM, Small M, Maccuish AC, Lowe GD. Association of Hypertension with Blood-Viscosity in Diabetes. Diabetic Med. 1988; 5(9):830–834. [PubMed: 2976642]
77. Letcher RL, Chien S, Pickering TG, Sealey JE, Laragh JH. Direct relationship between bloodpressure and blood viscosity in normal and hypertensive subjects. Role of fibrinogen andconcentration. The American journal of medicine. 1981; 70(6):1195–1202. [PubMed: 7234890]
78. Huang KT, Han TH, Hyduke DR, Vaughn MW, Van Herle H, Hein TW, Zhang C, Kuo L, LiaoJC. Modulation of nitric oxide bioavailability by erythrocytes. Proceedings of the NationalAcademy of Sciences of the United States of America. 2001; 98(20):11771–11776. [PubMed:11573011]
Zhou et al. Page 19
Biophys Chem. Author manuscript; available in PMC 2013 March 1.
NIH
-PA Author Manuscript
NIH
-PA Author Manuscript
NIH
-PA Author Manuscript

79. Condorelli P, George SC. In vivo control of soluble guanylate cyclase activation by nitric oxide: akinetic analysis. Biophysical journal. 2001; 80(5):2110–2119. [PubMed: 11325714]
80. Sakai H, Cabrales P, Tsai AG, Tsuchida E, Intaglietta M. Oxygen release from low and normalP50 Hb vesicles in transiently occluded arterioles of the hamster window model. Am J PhysiolHeart Circ Physiol. 2005; 288(6):H2897–H2903. [PubMed: 15681705]
81. Cabrales P, Sakai H, Tsai AG, Takeoka S, Tsuchida E, Intaglietta M. Oxygen transport by low andnormal oxygen affinity hemoglobin vesicles in extreme hemodilution. Am J Physiol Heart CircPhysiol. 2005; 288(4):H1885–H1892. [PubMed: 15563528]
82. Tsai AG, Vandegriff KD, Intaglietta M, Winslow RM. Targeted O2 delivery by low-P50hemoglobin: a new basis for O2 therapeutics. Am J Physiol Heart Circ Physiol. 2003;285(4):H1411–H1419. [PubMed: 12805024]
83. Sakai H, Tsai AG, Rohlfs RJ, Hara H, Takeoka S, Tsuchida E, Intaglietta M. Microvascularresponses to hemodilution with Hb vesicles as red blood cell substitutes: influence of O2 affinity.The American journal of physiology. 1999; 276(2 Pt 2):H553–H562. [PubMed: 9950857]
84. Kavdia M, Popel AS. Wall shear stress differentially affects NO level in arterioles for volumeexpanders and Hb-based O2 carriers. Microvascular research. 2003; 66(1):49–58. [PubMed:12826074]
85. Buehler PW, Zhou Y, Cabrales P, Jia Y, Sun G, Harris DR, Tsai AG, Intaglietta M, Palmer AF.Synthesis, biophysical properties and pharmacokinetics of ultrahigh molecular weight tense andrelaxed state polymerized bovine hemoglobins. Biomaterials. 2010; 31(13):3723–3735. [PubMed:20149433]
86. Buehler PW, Boykins RA, Jia YP, Norris S, Freedberg DI, Alayash AI. Structural and functionalcharacterization of glutaraldehyde-polymerized bovine hemoglobin and its isolated fractions.Analytical Chemistry. 2005; 77(11):3466–3478. [PubMed: 15924377]
87. Elmer J, Buehler PW, Jia YP, Wood F, Harris DR, Alayash AI, Palmer AF. FunctionalComparison of Hemoglobin Purified by Different Methods and Their Biophysical Implications.Biotechnology and bioengineering. 2010; 106(1):76–85. [PubMed: 20073089]
88. Intaglietta M, Sriram K, Vazquez BYS, Yalcin O, Johnson PC, Tartakovsky DM. The Effect ofSmall Changes in Hematocrit on Nitric Oxide Transport in Arterioles. Antioxidants & redoxsignaling. 2011; 14(2):175–185. [PubMed: 20560785]
Zhou et al. Page 20
Biophys Chem. Author manuscript; available in PMC 2013 March 1.
NIH
-PA Author Manuscript
NIH
-PA Author Manuscript
NIH
-PA Author Manuscript

Figure 1.Model Geometry of an Arteriole. A: Side-view of the 500 µm long arteriole and surroundingtissue used in the simulation. B: Schematic cross-section of the modified KTC modelgeometry delineating each subregion: 1) RBC-rich core (0≤r≤r1); 2) RBC-poor plasma layer(r1<r≤r2); 3) stagnant protein glycocalyx layer (G) (r2<r≤r3); 4) endothelial cell layer (E)(r3<r≤r4); 5) cell-free interstitial space (IS) (r4<r≤r5); 6) smooth muscle cell layer (SMC)(r5<r≤r6) and 7) tissue space (TS) (r6<r≤r7). r: radius; Z, axial coordinate.
Zhou et al. Page 21
Biophys Chem. Author manuscript; available in PMC 2013 March 1.
NIH
-PA Author Manuscript
NIH
-PA Author Manuscript
NIH
-PA Author Manuscript

Figure 2.Blood velocity profile in arteriole lumen [32, 49].
Zhou et al. Page 22
Biophys Chem. Author manuscript; available in PMC 2013 March 1.
NIH
-PA Author Manuscript
NIH
-PA Author Manuscript
NIH
-PA Author Manuscript

Figure 3.The effect of increasing blood vessel wall shear stress upon transfusion of PolyHb solutionson the steady-state radial NO concentration profiles at an pO2 inlet = 60 mm Hg: A): NOprofile at hct = 11%; B): NO profile at hct = 18%. The vertical dashed lines represent theRBC-rich region, RBC-poor region, glycocalyx, endothelial cell layer, interstitial layer,smooth muscle cell layer and tissue space, respectively from left to right.
Zhou et al. Page 23
Biophys Chem. Author manuscript; available in PMC 2013 March 1.
NIH
-PA Author Manuscript
NIH
-PA Author Manuscript
NIH
-PA Author Manuscript

Figure 4.The average NO concentration in the smooth muscle cell layer. A): Hct = 11%, L 50:1’ andH 40:1’ represent the groups that did not consider shear stress-induced production of NO bythe endothelium; B): Hct = 18%, L 20:1’, L 30:1’ and H 20:1’, H 30:1’ represent the groupsthat did not consider shear stress-induced production of NO by the endothelium.
Zhou et al. Page 24
Biophys Chem. Author manuscript; available in PMC 2013 March 1.
NIH
-PA Author Manuscript
NIH
-PA Author Manuscript
NIH
-PA Author Manuscript

Figure 5.The percentage average NO concentration inside the endothelial cell layer. A): Hct = 11%, L50:1’ and H 40:1’ represent the groups that did not consider shear stress-induced productionof NO by the endothelium; B): Hct = 18%, L 20:1’, L 30:1’, H 20:1’ and H 30:1’ representthe groups that did not consider shear stress-induced production of NO by the endothelium.
Zhou et al. Page 25
Biophys Chem. Author manuscript; available in PMC 2013 March 1.
NIH
-PA Author Manuscript
NIH
-PA Author Manuscript
NIH
-PA Author Manuscript

Figure 6.The relationship between blood vessel wall shear stress and average NO concentration in thearteriole lumen (A) and the endothelial cell layer (B) for all PolyHb solutions.
Zhou et al. Page 26
Biophys Chem. Author manuscript; available in PMC 2013 March 1.
NIH
-PA Author Manuscript
NIH
-PA Author Manuscript
NIH
-PA Author Manuscript

Figure 7.Steady-state radial pO2 profiles upon transfusion of PolyHb at hct = 11% and varying inletpO2. A–D): PolyHb = 3.5 g/dL, inlet pO2 = 10, 60, 100, 150 mm Hg; E–H): PolyHb = 10 g/dL, inlet pO2 = 10, 60, 100, 150 mm Hg. The vertical dashed lines represent the RBC-richregion, RBC-poor region, glycocalyx, endothelial cell layer, interstitial layer, smooth musclecell layer and tissue space, respectively from left to right.
Zhou et al. Page 27
Biophys Chem. Author manuscript; available in PMC 2013 March 1.
NIH
-PA Author Manuscript
NIH
-PA Author Manuscript
NIH
-PA Author Manuscript

Figure 8.Steady-state radial pO2 profiles upon transfusion of PolyHb at hct = 18% and varying inletpO2. A–D): PolyHb = 3.5 g/dL, inlet pO2 = 10, 60, 100, 150 mm Hg; E–H): PolyHb = 10 g/dL, inlet pO2 = 10, 60, 100, 150 mm Hg. The vertical dashed lines represent the RBC-richregion, RBC-poor region, glycocalyx, endothelial cell layer, interstitial layer, smooth musclecell layer and tissue space, respectively from left to right.
Zhou et al. Page 28
Biophys Chem. Author manuscript; available in PMC 2013 March 1.
NIH
-PA Author Manuscript
NIH
-PA Author Manuscript
NIH
-PA Author Manuscript

Figure 9.O2 transfer rate across the arteriole at different hcts and inlet pO2s. A): O2 transfer rate at ahct of 11% at [HBOC] = 3.5 g/dL and 10 g/dL, respectively. B): O2 transfer rate at a hct of18% at [HBOC] = 3.5 g/dL and 10 g/dL, respectively.
Zhou et al. Page 29
Biophys Chem. Author manuscript; available in PMC 2013 March 1.
NIH
-PA Author Manuscript
NIH
-PA Author Manuscript
NIH
-PA Author Manuscript
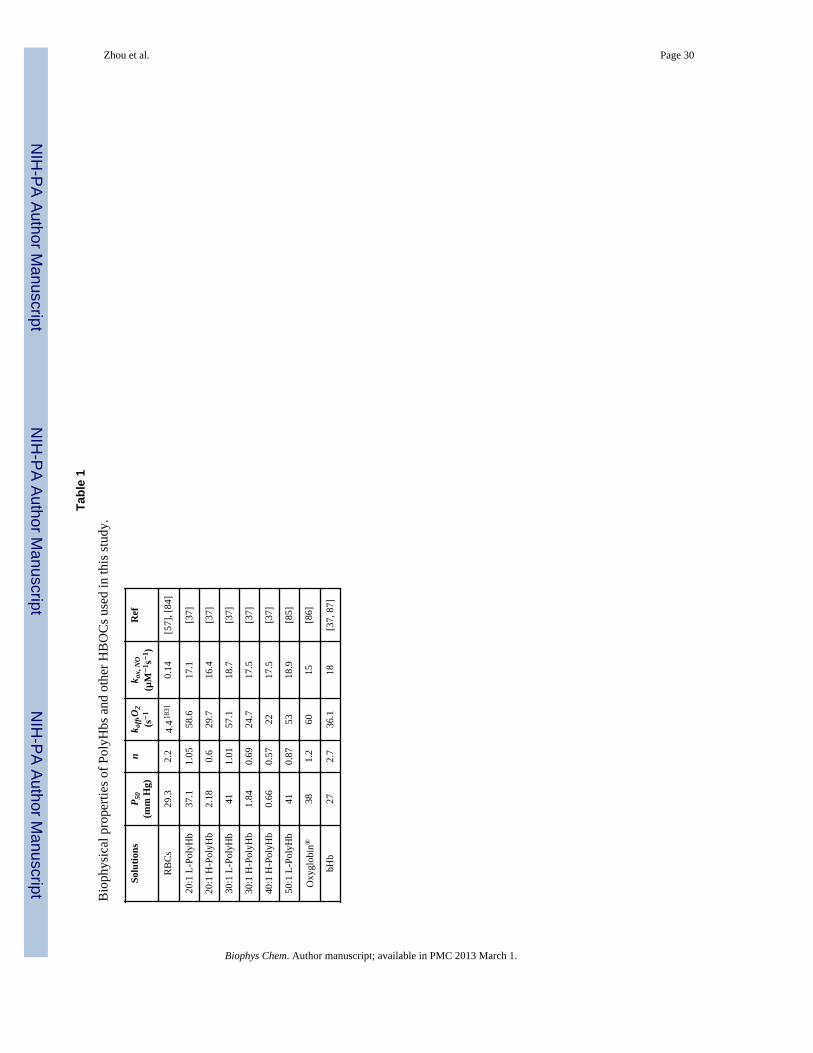
NIH
-PA Author Manuscript
NIH
-PA Author Manuscript
NIH
-PA Author Manuscript
Zhou et al. Page 30
Tabl
e 1
Bio
phys
ical
pro
perti
es o
f Pol
yHbs
and
oth
er H
BO
Cs u
sed
in th
is st
udy.
Solu
tions
P 50
(mm
Hg)
nk o
ff,O
2(s−
1k o
x, N
O(µ
M−
1 s−
1 )R
ef
RB
Cs
29.3
2.2
4.4
[83]
0.14
[57]
, [84
]
20:1
L-P
olyH
b37
.11.
0558
.617
.1[3
7]
20:1
H-P
olyH
b2.
180.
629
.716
.4[3
7]
30:1
L-P
olyH
b41
1.01
57.1
18.7
[37]
30:1
H-P
olyH
b1.
840.
6924
.717
.5[3
7]
40:1
H-P
olyH
b0.
660.
5722
17.5
[37]
50:1
L-P
olyH
b41
0.87
5318
.9[8
5]
Oxy
glob
in®
381.
260
15[8
6]
bHb
272.
736
.118
[37,
87]
Biophys Chem. Author manuscript; available in PMC 2013 March 1.

NIH
-PA Author Manuscript
NIH
-PA Author Manuscript
NIH
-PA Author Manuscript
Zhou et al. Page 31
Tabl
e 2
Diff
usiv
ity a
nd A
dair
cons
tant
s of P
olyH
bs a
nd o
ther
HB
OC
s use
d in
this
stud
y.
Solu
tions
Diff
usiv
ity(c
m2 /s
)
Ada
ir P
aram
eter
sR
efa 1
a 2a 3
a 4
RB
Cs
f(H
b)2.
59*1
0−3
1.77
*10−
31.
86*1
0−11
1.39
*10−
6[4
1]
20:1
L-P
olyH
b2.
01*1
0−7a
1.03
*10−
14.
21 *
10−
37.
52*1
0−5
5.27
*10−
7b
20:1
H-P
olyH
b1.
74*1
0−7a
14.1
397.
7835
2.75
34.
17*1
0−2
30:1
L-P
olyH
b1.
54*1
0−7a
9.73
*10−
23.
43*1
0−3
5.41
*10−
53.
1*10
−7
30: 1
H-P
olyH
b7.
57*1
0−8a
8.25
117.
5548
6.43
835.
98*1
0−1
40:1
H-P
olyH
b3.
91*1
0−8a
9.01
5824
.717
27.6
131.
1931
50:1
L-P
olyH
b4.
84*1
0−8a
1.47
*10−
15.
20*1
0−3
8.48
*10−
53.
40*1
0−7
Oxy
glob
in®
3.69
*10−
7a3.
39*1
0−2
2.49
*10−
32.
79*1
0−5
6.55
*10−
7[8
6]
bHb
6.21
*10−
7a6.
98*1
0−3
2.15
*10−
35.
00*1
0−6
1.88
*10−
6[8
6]
a HB
OC
diff
usiv
ity w
as c
alcu
late
d us
ing
equa
tion
35.
b Ada
ir pa
ram
eter
s wer
e cu
rve
fitte
d fr
om O
2-H
BO
C e
quili
briu
m c
urve
s giv
en in
refe
renc
es [3
7, 8
5] u
sing
the
Ada
ir eq
uatio
n
Biophys Chem. Author manuscript; available in PMC 2013 March 1.

NIH
-PA Author Manuscript
NIH
-PA Author Manuscript
NIH
-PA Author Manuscript
Zhou et al. Page 32
Table 3
Constants and parameters used in the simulations.
Symbol SimulationParameter
Value Units Ref
Lc Length of arteriole 500 µm [41]
Rc Radius of arteriole 30 µm [39]
Uavg Average blood velocity 0.42 cm/s [39]
[Hb]RBC Concentration of Hb insideRBC
34 g/dL [41]
[Hb]RBC-overall Overall molar concentrationof Hbin RBC: [heme]
21250 µM [29]
[HbRBC]total/[HBOC]total Local molar concentration ofHb in RBC or HBOC
Calculated fromequation 16 and
17
µM
HD Discharge hct 11% [39] and18%†
[39]
HC Hct of RBC-rich core 0.13 for HD 11%0.20 for HD 18%
Calculated from equation4–17
[NO]0 Basal NO concentration 0.01 µM [41]
αO2 (blood) Solubility of O2 in blood vessel 1.34 µmol/(L*mm Hg) [49]
αO2 (glycocalyx) Solubility of O2 in glycocalyx 1.34 µmol/(L*mm Hg) [49]
αO2 (endothelial) Solubility of O2 in endothelial cell layer 1.34 µmol/(L*mm Hg) [49]
αO2 (interstitial) Solubility of O2 in interstitial layer 1.10 µmol/(L*mm Hg) [57]
αO2 (smooth) Solubility of O2 in smooth muscle celllayer
1.34 µmol/(L*mm Hg) [49]
αO2 (tissue) Solubility of O2 in tissue 1.52 µmol/(L*mm Hg) [49]
r1 Radius of RBC-rich core 17.7(HD 11 %)19.8 (HD 18%)
µm Extrapolated from ref [59]
r2 Outer radius of RBC-poorregion
29.5 µm [49]
r3 Outer radius of glycocalyx 30 µm [49]
r4 Outer radius of endothelial cell layer 31 µm [49]
r5 Outer radius of interstitiallayer
31.5 µm [49]
r6 Outer radius of smoothmuscle cell layer
37.5 µm [49]
r7 Outer radius of tissue 135 µm [49]
DO2 Diffusivity of O2 0.000028 or0.000014
cm2/s [49], [88]
DNO Diffusivity of NO 0.000033 or0.0000165
cm2/s [49], [88]
[HBOC]overall Overall concentration ofPolyHb in vivo
3.5 or 10 g/dL [39]
Qmax,sm Maximum O2 consumptionrate constant in smooth
muscle cell layer
1 µM/s [49]
Biophys Chem. Author manuscript; available in PMC 2013 March 1.

NIH
-PA Author Manuscript
NIH
-PA Author Manuscript
NIH
-PA Author Manuscript
Zhou et al. Page 33
Symbol SimulationParameter
Value Units Ref
Ksm M-M constant of O2consumption in smooth
muscle cell layer
1 mm Hg [49]
kNO-sm First order NO reaction rateconstant in smooth muscle
cell layer
0.05 1/(µM*s) [12, 84]
Qmax,ts Maximum O2 consumptionrate constant in tissue
20 µM/s [49]
Kts M-M constant of O2consumption in tissue
1 mm Hg [49]
kNO-ts First order NO reaction rateconstant in tissue
0.05 1/(µM*s) [12, 84]
†personal communication from Dr. Pedro Cabrales, Department of Bioengineering, University of California, San Diego, CA.
Biophys Chem. Author manuscript; available in PMC 2013 March 1.

NIH
-PA Author Manuscript
NIH
-PA Author Manuscript
NIH
-PA Author Manuscript
Zhou et al. Page 34
Table 4
Blood viscosity and blood vessel wall shear stress after transfusion of PolyHb solutions.
Solution BloodViscosity (cP)
Wall ShearStress
(dyne/cm2)
11% hct 1.5 8.4
18% hct 1.9 10.9
20:1 L-PolyHb 4.1† 23.3
20:1 H-PolyHb 3.8† 21.6
30:1 L-PolyHb 4.6† 26.2
30:1 H-PolyHb 4.4† 25.1
40:1 H-PolyHb 2.5[39] 15.2[39]
50:1 L-PolyHb 2.9[39] 16.8[39]
Oxyglobin® 1.5 (11% hct)1.9 (18% hct)
8.4 (11% hct)10.9 (18% hct)
bHb 1.5 (11% hct)1.9 (18% hct)
8.4 (11% hct)10.9 (18% hct)
†experimental results were obtained from Dr. Pedro Cabrales, Department of Bioengineering, University of California, San Diego.
Biophys Chem. Author manuscript; available in PMC 2013 March 1.

NIH
-PA Author Manuscript
NIH
-PA Author Manuscript
NIH
-PA Author Manuscript
Zhou et al. Page 35
Table 5
Comparison of estimated blood vessel wall shear stress against experimentally measured blood vessel wallshear stress.
Blood Sample Calculated Wall ShearStress (dyne/cm2)
Measured WallShear Stress(dyne/cm2)
Baseline (hct 48%)[39] 26.2 27.5[39]
Normal (hct 45%)[56] 23.9 24[56]
50:1 L-PolyHb 16.5 16.8[39]
40:1 H-PolyHb 14.2 15.2[39]
Biophys Chem. Author manuscript; available in PMC 2013 March 1.