Simulation-Based Defect Engineering in “α-Spodumene” - MDPI
12
chemengineering Article Simulation-Based Defect Engineering in “α-Spodumene” Sivanujan Suthaharan 1 , Poobalasuntharam Iyngaran 1 and Navaratnarajah Kuganathan 2, * Citation: Suthaharan, S.; Iyngaran, P.; Kuganathan, N. Simulation-Based Defect Engineering in “α-Spodumene”. ChemEngineering 2021, 5, 57. https://doi.org/10.3390/ chemengineering5030057 Academic Editor: Changhyun Roh Received: 19 July 2021 Accepted: 28 August 2021 Published: 31 August 2021 Publisher’s Note: MDPI stays neutral with regard to jurisdictional claims in published maps and institutional affil- iations. Copyright: © 2021 by the authors. Licensee MDPI, Basel, Switzerland. This article is an open access article distributed under the terms and conditions of the Creative Commons Attribution (CC BY) license (https:// creativecommons.org/licenses/by/ 4.0/). 1 Department of Chemistry, University of Jaffna, Sir. Pon Ramanathan Road, Thirunelvely, Jaffna 40000, Sri Lanka; [email protected] (S.S.); [email protected] (P.I.) 2 Department of Materials, Imperial College London, London SW7 2AZ, UK * Correspondence: [email protected] Abstract: Naturally occurring lithium-rich α-spodumene (α-LiAlSi 2 O 6 ) is a technologically important mineral that has attracted considerable attention in ceramics, polymer industries, and rechargeable lithium ion batteries (LIBs). The defect chemistry and dopant properties of this material are studied using a well-established atomistic simulation technique based on classical pair-potentials. The most favorable intrinsic defect process is the Al-Si anti-site defect cluster (1.08 eV/defect). The second most favorable defect process is the Li-Al anti-site defect cluster (1.17 eV/defect). The Li-Frenkel is higher in energy by 0.33 eV than the Al-Si anti-site defect cluster. This process would ensure the formation of Li vacancies required for the Li diffusion via the vacancy-assisted mechanism. The Li-ion diffusion in this material is slow, with an activation energy of 2.62 eV. The most promising isovalent dopants on the Li, Al, and Si sites are found to be Na, Ga, and Ge, respectively. The formation of both Li interstitials and oxygen vacancies can be facilitated by doping of Ga on the Si site. The incorporation of lithium is studied using density functional theory simulations and the electronic structures of resultant complexes are discussed. Keywords: spodumene; DFT; atomistic simulation; defects; diffusion 1. Introduction Escalating demand for mineral candidates, especially in industries of lithium ion batteries (LIBs), has fueled the transformational shift in mobile-electronics. In particular, lithium-rich minerals have drawn the attention of investigators to analyze their poten- tial candidacy [1]. Lithium-rich minerals are significant in modern industries of LIBs, alloys, and pharmacy [2–4]. Spodumene is a lithium aluminosilicate system, which is categorized as a granitic-pegmatite in geo-mineralogy [5–7]. The theoretical Li content in the spodumene is reported to be 3.73% [8], where it offers a theoretical Li 2 O content of 8 wt % [9]. Mineralogists describe that the spodumene has some associations with quartz and albite [10] and as a three-phase system [11,12]. α, β, and γ are the three major phases of spodumene, where α-spodumene (LiAlSi 2 O 6 ) is the mined natural material [1]. In addition, α-spodumene has great potential to serve as a main lithium resource for lithium industries in comparison with the other two phases [13]. Previous computational investigations have shown the significance of atomistic scale computation to reveal the defect energetic features of the minerals for energy applica- tions [14–17]. Spodumene has been experimentally studied in previous cases for its phase transformation mechanisms [18] and to clarify the density of defects in natural α-spodumene [19]. Systematic computational studies have not been carried out previously and this investigation presents the first atomistic modelling defect energetic study of α- spodumene. Understanding the fundamental defect processes in α-LiAlSi 2 O 6 can be useful to optimize its performance in a wide industrial portrait. We have attempted to elucidate the energetics of the optimized theoretical model of α-spodumene and its intrinsic defect processes employing atomistic simulations based on classical pair-potentials. Density func- tional theory (DFT) simulations were performed to examine the stability of Li-incorporated α-spodumene and the electronic structures of the resultant complexes. ChemEngineering 2021, 5, 57. https://doi.org/10.3390/chemengineering5030057 https://www.mdpi.com/journal/chemengineering
-
Upload
khangminh22 -
Category
Documents
-
view
5 -
download
0
Transcript of Simulation-Based Defect Engineering in “α-Spodumene” - MDPI

chemengineering
Article
Simulation-Based Defect Engineering in “α-Spodumene”
Sivanujan Suthaharan 1 , Poobalasuntharam Iyngaran 1 and Navaratnarajah Kuganathan 2,*
�����������������
Citation: Suthaharan, S.; Iyngaran, P.;
Kuganathan, N. Simulation-Based
Defect Engineering in
“α-Spodumene”. ChemEngineering
2021, 5, 57. https://doi.org/10.3390/
chemengineering5030057
Academic Editor: Changhyun Roh
Received: 19 July 2021
Accepted: 28 August 2021
Published: 31 August 2021
Publisher’s Note: MDPI stays neutral
with regard to jurisdictional claims in
published maps and institutional affil-
iations.
Copyright: © 2021 by the authors.
Licensee MDPI, Basel, Switzerland.
This article is an open access article
distributed under the terms and
conditions of the Creative Commons
Attribution (CC BY) license (https://
creativecommons.org/licenses/by/
4.0/).
1 Department of Chemistry, University of Jaffna, Sir. Pon Ramanathan Road, Thirunelvely, Jaffna 40000,Sri Lanka; [email protected] (S.S.); [email protected] (P.I.)
2 Department of Materials, Imperial College London, London SW7 2AZ, UK* Correspondence: [email protected]
Abstract: Naturally occurring lithium-rich α-spodumene (α-LiAlSi2O6) is a technologically importantmineral that has attracted considerable attention in ceramics, polymer industries, and rechargeablelithium ion batteries (LIBs). The defect chemistry and dopant properties of this material are studiedusing a well-established atomistic simulation technique based on classical pair-potentials. The mostfavorable intrinsic defect process is the Al-Si anti-site defect cluster (1.08 eV/defect). The second mostfavorable defect process is the Li-Al anti-site defect cluster (1.17 eV/defect). The Li-Frenkel is higherin energy by 0.33 eV than the Al-Si anti-site defect cluster. This process would ensure the formationof Li vacancies required for the Li diffusion via the vacancy-assisted mechanism. The Li-ion diffusionin this material is slow, with an activation energy of 2.62 eV. The most promising isovalent dopantson the Li, Al, and Si sites are found to be Na, Ga, and Ge, respectively. The formation of both Liinterstitials and oxygen vacancies can be facilitated by doping of Ga on the Si site. The incorporationof lithium is studied using density functional theory simulations and the electronic structures ofresultant complexes are discussed.
Keywords: spodumene; DFT; atomistic simulation; defects; diffusion
1. Introduction
Escalating demand for mineral candidates, especially in industries of lithium ionbatteries (LIBs), has fueled the transformational shift in mobile-electronics. In particular,lithium-rich minerals have drawn the attention of investigators to analyze their poten-tial candidacy [1]. Lithium-rich minerals are significant in modern industries of LIBs,alloys, and pharmacy [2–4]. Spodumene is a lithium aluminosilicate system, which iscategorized as a granitic-pegmatite in geo-mineralogy [5–7]. The theoretical Li content inthe spodumene is reported to be 3.73% [8], where it offers a theoretical Li2O content of8 wt % [9]. Mineralogists describe that the spodumene has some associations with quartzand albite [10] and as a three-phase system [11,12]. α, β, and γ are the three major phases ofspodumene, where α-spodumene (LiAlSi2O6) is the mined natural material [1]. In addition,α-spodumene has great potential to serve as a main lithium resource for lithium industriesin comparison with the other two phases [13].
Previous computational investigations have shown the significance of atomistic scalecomputation to reveal the defect energetic features of the minerals for energy applica-tions [14–17]. Spodumene has been experimentally studied in previous cases for itsphase transformation mechanisms [18] and to clarify the density of defects in naturalα-spodumene [19]. Systematic computational studies have not been carried out previouslyand this investigation presents the first atomistic modelling defect energetic study of α-spodumene. Understanding the fundamental defect processes in α-LiAlSi2O6 can be usefulto optimize its performance in a wide industrial portrait. We have attempted to elucidatethe energetics of the optimized theoretical model of α-spodumene and its intrinsic defectprocesses employing atomistic simulations based on classical pair-potentials. Density func-tional theory (DFT) simulations were performed to examine the stability of Li-incorporatedα-spodumene and the electronic structures of the resultant complexes.
ChemEngineering 2021, 5, 57. https://doi.org/10.3390/chemengineering5030057 https://www.mdpi.com/journal/chemengineering

ChemEngineering 2021, 5, 57 2 of 12
2. Computational Methods
Defect calculations were performed using a classical pair-wise potential simulationcode GULP (general utility lattice program) in which lattice energy optimization proceduresare concretized [20]. A summary of the aspects of these techniques will be presentedas comprehensive reviews are given elsewhere [21]. Perfect and defective lattices aresimulated on the basis of potential system attributed to the energy as attested by the atomicposition coordinates within the crystal lattice. Inter-ionic interactions are described in termsof long-range Coulombic interactions and short-range Buckingham potential parameters(refer to Table 1) [22–25]. Ionic polarization is treated using the core–shell model wherethe instances with large spring values are approached with core alone treatment as theshell has no charge. The Mott-Littleton approach [26] was utilized to calculate defectformation energies in the lattice environment, in which the lattice is portioned as region Iand region II. It is foreseen that the calculated defect process energies will be overvaluedowing to the spherical treatment of ions at dilution limits. Although such an overestimationprevails in the present methodology, trends in relative energies will be congruous [27]. Thecontemporary atomistic scale simulations correspond to isobaric (i.e., constant pressurecondition) parameters for the processes [28,29].
Table 1. Buckingham potential parameters used in the atomistic simulations of α-LiAlSi2O6.
Two-Body [Φij (rij) = Aij exp (−rij/ρij) − Cij/rij6]
Interaction A/eV ρ/Å C/eV·Å6 Y/e K/eV·Å−2
Li+–O2− 632.1018 0.29060 0.00 1.00 99,999
Al3+–O2− 1109.92381 0.31540 0.00 3.00 99,999
Si4+-O2− 1283.91 0.32052 10.66 4.00 99,999
O2−–O2− 12,420.5 0.22150 29.07 −2.96 65.0
DFT simulation as implemented in the Vienna ab initio simulation program (VASP)code [30] was used to model the incorporation of Li. In this code, projected augmentedwave (PAW) potentials [31] and plane wave basis sets are used. A plane wave basis setwith a cut-off of 500 eV was used in all calculations. For bulk α-LiAlSi2O6, we used4 × 4 × 8 Monkhorst-Pack [32] k-points. A 2 × 2 × 2 super cell containing 320 atoms wasused to model Li incorporation. For this supercell, 2 × 2 × 4 Monkhorst-Pack k-pointswere used. The generalized gradient approximation (GGA) as parameterized by Perdew,Burke, and Ernzerhof (PBE) [33] was used to model exchange correlation. Full geometryoptimizations were performed to relax both atomic positions and cell parameters using theconjugate gradient algorithm [34]. We used zero damping DFT+D3 as parameterized byGrimme et al. [35] to model short-range dispersive interactions.
3. Results3.1. Computational Modelling of α-LiAlSi2O6
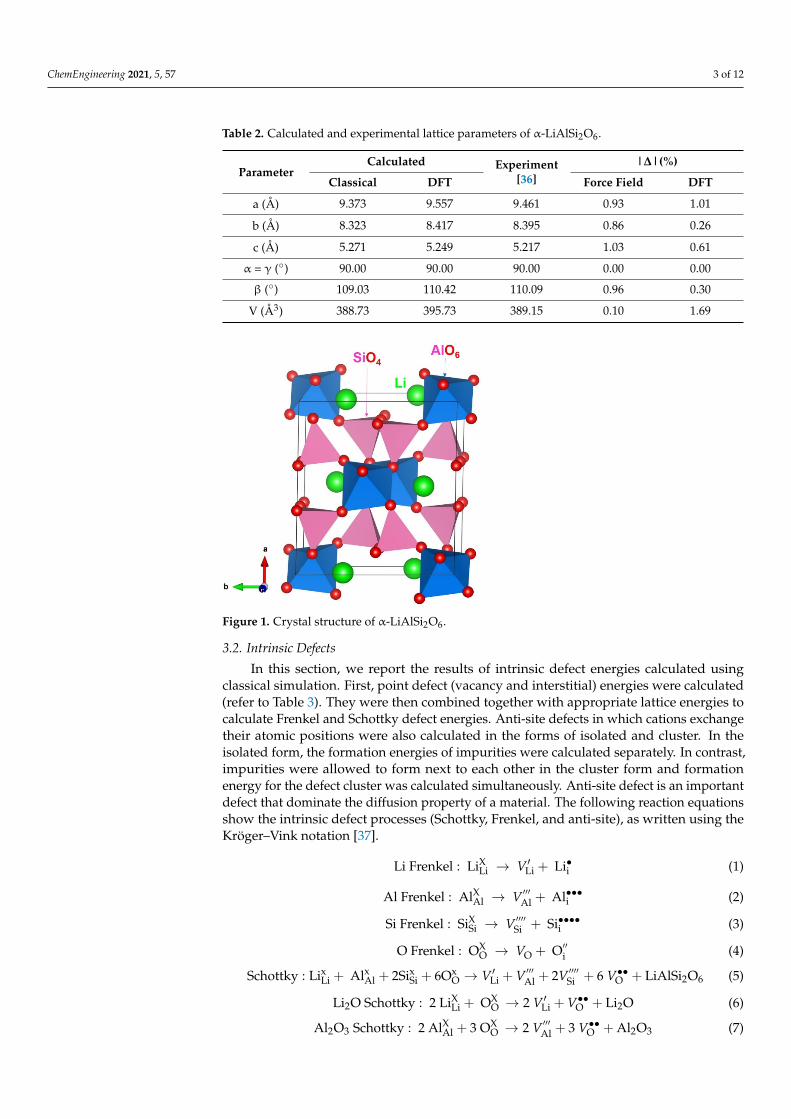
The aluminosilicate α-spodumene crystallizes in the space group C 2/c with a mon-oclinic structure, where Al3+ and Si4+ exhibit octahedral and tetrahedral coordination,respectively [36]. The experimental crystal structure of α-LiAlSi2O6 (lattice parameters:a = 9.461 Å, b = 8.395 Å, c = 5.217 Å, α = γ = 90.00◦, and β = 110.09◦) [36] was reproducedby both classical and DFT simulations, where the calculated structural parameters are ingood agreement with the experimental values (refer to Table 2). Figure 1 illustrates thestructure and chemical environment of α-spodumene. This parameterized model of theα-LiAlSi2O6 thus provides a valid fundamental base for subsequent defect modelling andcalculation.
ChemEngineering 2021, 5, 57 3 of 12
Table 2. Calculated and experimental lattice parameters of α-LiAlSi2O6.
ParameterCalculated Experiment
[36]|∆|(%)
Classical DFT Force Field DFT
a (Å) 9.373 9.557 9.461 0.93 1.01
b (Å) 8.323 8.417 8.395 0.86 0.26
c (Å) 5.271 5.249 5.217 1.03 0.61
α = γ (◦) 90.00 90.00 90.00 0.00 0.00
β (◦) 109.03 110.42 110.09 0.96 0.30
V (Å3) 388.73 395.73 389.15 0.10 1.69
ChemEngineering 2021, 5, x FOR PEER REVIEW 3 of 12
Figure 1. Crystal structure of α-LiAlSi2O6.
Table 2. Calculated and experimental lattice parameters of α-LiAlSi2O6.
Parameter Calculated
Experiment [36] |∆|(%)
Classical DFT Force Field DFT a (Å) 9.373 9.557 9.461 0.93 1.01 b (Å) 8.323 8.417 8.395 0.86 0.26 c (Å) 5.271 5.249 5.217 1.03 0.61 α = γ (°) 90.00 90.00 90.00 0.00 0.00 β (°) 109.03 110.42 110.09 0.96 0.30
V (Å3) 388.73 395.73 389.15 0.10 1.69
3.2. Intrinsic Defects In this section, we report the results of intrinsic defect energies calculated using clas-
sical simulation. First, point defect (vacancy and interstitial) energies were calculated (re-fer to Table 3). They were then combined together with appropriate lattice energies to calculate Frenkel and Schottky defect energies. Anti-site defects in which cations exchange their atomic positions were also calculated in the forms of isolated and cluster. In the iso-lated form, the formation energies of impurities were calculated separately. In contrast, impurities were allowed to form next to each other in the cluster form and formation en-ergy for the defect cluster was calculated simultaneously. Anti-site defect is an important defect that dominate the diffusion property of a material. The following reaction equations show the intrinsic defect processes (Schottky, Frenkel, and anti-site), as written using the Kröger–Vink notation [37]. Li Frenkel: Li → 𝑉 + Li• (1)Al Frenkel: Al → 𝑉 + Al••• (2)Si Frenkel: Si → 𝑉 + Si•••• (3)O Frenkel: O → 𝑉•• + O (4)Schottky: Li + Al + 2Si + 6O 𝑉 + 𝑉 + 2𝑉 + 6 𝑉•• + LiAlSi2O6 (5)Li O Schottky: 2 Li + O → 2 𝑉 + 𝑉•• + Li O (6)Al 𝑂 Schottky: 2 Al + 3 O → 2 𝑉 + 3 𝑉•• + Al O (7)
Figure 1. Crystal structure of α-LiAlSi2O6.
3.2. Intrinsic Defects
In this section, we report the results of intrinsic defect energies calculated usingclassical simulation. First, point defect (vacancy and interstitial) energies were calculated(refer to Table 3). They were then combined together with appropriate lattice energies tocalculate Frenkel and Schottky defect energies. Anti-site defects in which cations exchangetheir atomic positions were also calculated in the forms of isolated and cluster. In theisolated form, the formation energies of impurities were calculated separately. In contrast,impurities were allowed to form next to each other in the cluster form and formationenergy for the defect cluster was calculated simultaneously. Anti-site defect is an importantdefect that dominate the diffusion property of a material. The following reaction equationsshow the intrinsic defect processes (Schottky, Frenkel, and anti-site), as written using theKröger–Vink notation [37].
Li Frenkel : LiXLi → V′Li + Li•i (1)
Al Frenkel : AlXAl → V ′′′Al + Al•••i (2)
Si Frenkel : SiXSi → V ′′′′Si + Si••••i (3)
O Frenkel : OXO → VO + O′′i (4)
Schottky : LixLi + AlxAl + 2SixSi + 6OxO → V′Li + V ′′′Al + 2V ′′′′Si + 6 V••O + LiAlSi2O6 (5)
Li2O Schottky : 2 LiXLi + OXO → 2 V′Li + V••O + Li2O (6)
Al2O3 Schottky : 2 AlXAl + 3 OXO → 2 V ′′′Al + 3 V••O + Al2O3 (7)

ChemEngineering 2021, 5, 57 4 of 12
ZrO2 Schottky : ZrXZr + 2 OX
O → V ′′′′Zr + 2 V••O + ZrO2 (8)
Li/Al antisite (isolated) : LiXLi + AlXAl → Li′′Al + Al••Li (9)
Li/Al antisite (cluster) : LiXLi + AlXAl →{
Li′′Al + Al••Li}
(10)
Li/Si antisite (isolated) : LiXLi + SiXSi → Li′′′Si + Si•••Li (11)
Li/Zr antisite (cluster) : LiXLi + SiXSi →{
Li′′′Si + Si•••Li}
(12)
Al/Si antisite (isolated) : AlXAl + SiXSi → Al′Si + Si•Al (13)
Al/Si antisite (cluster) : AlXAl + SiXSi →{
Al′Si + Si•Al}
(14)
Table 3. Calculated point defect energies.
SitePoint Defect Energy (eV)
Vacancy Interstitial
Li 7.77 −4.95
Al 53.63 −42.69
Si 96.44 −79.27
O 23.53 −15.14
Formation energies of all vacancies are endothermic. Formation energy increaseswith the increase in the charge of ion formed (Li > O > Al > Si). Conversely, all interstitialformation energies are exoergic and formation energy increases with the decrease in thecharge of intertitial ion.
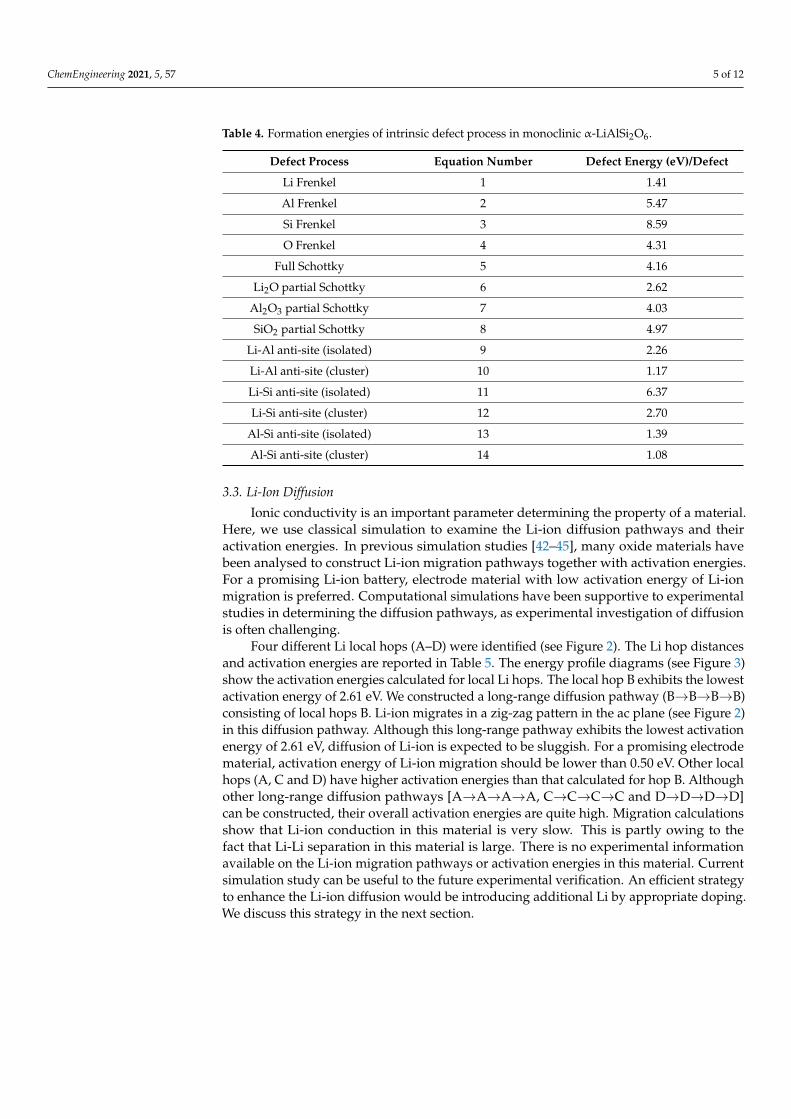
In Table 4, we report the calculated defect energies. The most favourable defectenergy process is the Al-Si anti-site defect cluster Equation (14). This indicates that a smallpercentage of Al-Si cation mixing would be present in this material. The cluster form isenergetically more favourable (by 0.31 eV) than its isolated form. This is owing to theisolated impurity defects preferring to form a cluster with exothermic binding energy of−0.31 eV. The second most favourable defect process is the Li-Al anti-site defect cluster.The defect energy is higher only by 0.09 eV than the Al-Si anti-site cluster. Anti-sitedefects have been found in many oxide materials experimentally and theoretically [38–41].The Li-Frenkel is higher in energy by 0.33 eV than the Al-Si anti-site defect cluster. ThisFrenkel would ensure the formation of Li vacancies needed for the vacancy mediatedLi-ion diffusion. Other Frenkel defect processes are highly endoergic, meaning that theLi2O partial Schottky is the lowest energy process compared with the other Schottky defectprocesses. This process will lead to the loss of Li2O in this material. However, this processwould require energy in the form of heat.
ChemEngineering 2021, 5, 57 5 of 12
Table 4. Formation energies of intrinsic defect process in monoclinic α-LiAlSi2O6.
Defect Process Equation Number Defect Energy (eV)/Defect
Li Frenkel 1 1.41
Al Frenkel 2 5.47
Si Frenkel 3 8.59
O Frenkel 4 4.31
Full Schottky 5 4.16
Li2O partial Schottky 6 2.62
Al2O3 partial Schottky 7 4.03
SiO2 partial Schottky 8 4.97
Li-Al anti-site (isolated) 9 2.26
Li-Al anti-site (cluster) 10 1.17
Li-Si anti-site (isolated) 11 6.37
Li-Si anti-site (cluster) 12 2.70
Al-Si anti-site (isolated) 13 1.39
Al-Si anti-site (cluster) 14 1.08
3.3. Li-Ion Diffusion
Ionic conductivity is an important parameter determining the property of a material.Here, we use classical simulation to examine the Li-ion diffusion pathways and theiractivation energies. In previous simulation studies [42–45], many oxide materials havebeen analysed to construct Li-ion migration pathways together with activation energies.For a promising Li-ion battery, electrode material with low activation energy of Li-ionmigration is preferred. Computational simulations have been supportive to experimentalstudies in determining the diffusion pathways, as experimental investigation of diffusionis often challenging.
Four different Li local hops (A–D) were identified (see Figure 2). The Li hop distancesand activation energies are reported in Table 5. The energy profile diagrams (see Figure 3)show the activation energies calculated for local Li hops. The local hop B exhibits the lowestactivation energy of 2.61 eV. We constructed a long-range diffusion pathway (B→B→B→B)consisting of local hops B. Li-ion migrates in a zig-zag pattern in the ac plane (see Figure 2)in this diffusion pathway. Although this long-range pathway exhibits the lowest activationenergy of 2.61 eV, diffusion of Li-ion is expected to be sluggish. For a promising electrodematerial, activation energy of Li-ion migration should be lower than 0.50 eV. Other localhops (A, C and D) have higher activation energies than that calculated for hop B. Althoughother long-range diffusion pathways [A→A→A→A, C→C→C→C and D→D→D→D]can be constructed, their overall activation energies are quite high. Migration calculationsshow that Li-ion conduction in this material is very slow. This is partly owing to thefact that Li-Li separation in this material is large. There is no experimental informationavailable on the Li-ion migration pathways or activation energies in this material. Currentsimulation study can be useful to the future experimental verification. An efficient strategyto enhance the Li-ion diffusion would be introducing additional Li by appropriate doping.We discuss this strategy in the next section.

ChemEngineering 2021, 5, 57 6 of 12
ChemEngineering 2021, 5, x FOR PEER REVIEW 5 of 12
Li-Si anti-site (cluster) 12 2.70 Al-Si anti-site (isolated) 13 1.39 Al-Si anti-site (cluster) 14 1.08
3.3. Li-ion Diffusion Ionic conductivity is an important parameter determining the property of a material.
Here, we use classical simulation to examine the Li-ion diffusion pathways and their acti-vation energies. In previous simulation studies [42–45], many oxide materials have been analysed to construct Li-ion migration pathways together with activation energies. For a promising Li-ion battery, electrode material with low activation energy of Li-ion migra-tion is preferred. Computational simulations have been supportive to experimental stud-ies in determining the diffusion pathways, as experimental investigation of diffusion is often challenging.
Four different Li local hops (A–D) were identified (see Figure 2). The Li hop distances and activation energies are reported in Table 5. The energy profile diagrams (see Figure 3) show the activation energies calculated for local Li hops. The local hop B exhibits the lowest activation energy of 2.61 eV. We constructed a long-range diffusion pathway (B→B→B→B) consisting of local hops B. Li-ion migrates in a zig-zag pattern in the ac plane (see Figure 2) in this diffusion pathway. Although this long-range pathway exhibits the lowest activation energy of 2.61 eV, diffusion of Li-ion is expected to be sluggish. For a promising electrode material, activation energy of Li-ion migration should be lower than 0.50 eV. Other local hops (A, C and D) have higher activation energies than that calculated for hop B. Although other long-range diffusion pathways [A→A→A→A, C→C→C→C and D→D→D→D] can be constructed, their overall activation energies are quite high. Migration calculations show that Li-ion conduction in this material is very slow. This is partly owing to the fact that Li-Li separation in this material is large. There is no experi-mental information available on the Li-ion migration pathways or activation energies in this material. Current simulation study can be useful to the future experimental verifica-tion. An efficient strategy to enhance the Li-ion diffusion would be introducing additional Li by appropriate doping. We discuss this strategy in the next section.
Figure 2. Calculated Li-ion diffusion pathways. Yellow, purple, green, and pink color atoms corre-spond to different Li hops. Figure 2. Calculated Li-ion diffusion pathways. Yellow, purple, green, and pink color atomscorrespond to different Li hops.
Table 5. Activation energies calculated for local Li hops together with activation energies.
Migration Path Li-Li Separation (Å) Activation Energy (eV)
A 4.42 3.20
B 4.61 2.61
C 5.44 6.58
D 6.11 5.21
ChemEngineering 2021, 5, x FOR PEER REVIEW 6 of 12
Table 5. Activation energies calculated for local Li hops together with activation energies.
Migration Path Li-Li Separation (Å) Activation Energy (eV) A 4.42 3.20 B 4.61 2.61 C 5.44 6.58 D 6.11 5.21
Figure 3. Energy profile diagrams showing activation energies calculated for local Li hops as shown in Figure 2.
3.4. Solution of Dopants Cation doping is an important strategy to modify the properties of materials. Here,
we consider isovalent and alovalent dopants at different cation sites. Charge compensat-ing defects are not necessary in the case of isovalent doping. However, point defects (va-cancies and interstitials) are used to compensate charges produced upon aliovalent dop-ing. A range of cations were doped and their solution energies were calculated using clas-sical simulation. We provide Buckingham potentials used for dopants in the Supplemen-tary Information (see Table S1).
3.4.1. Isovalent Doping First, monovalent dopants (M = Na, K, and Rb) were considered on the Li site and
the following reaction equation was used to calculate the solution energy. M O + Li → 2 M + Li O (15)
Solution energies are reported in Figure 4a. An exothermic solution energy of –0.24 eV is calculated for Na+, meaning that this dopant can be worth examining experimentally. The ionic radius of Li+ is 0.76 Å [46]. Favourability of Na+ on the Li site is partly owing to the fact that the ionic radius (1.02 Å) [46] of Na+ is closer to that of Li+. Solution energy increases with increasing ionic radius. Doping of K and Rb is not favourable as solution energies are positive for both dopants. The largest solution of energy (5.23 eV) is calcu-lated for Rb and this dopant is highly unlikely to be considered for doping at room tem-perature.
Next, trivalent dopants (M = Ga, Sc, In, Y, Gd, and La) were doped on the Al site. We describe the reaction process using the following equation: M O + 2 Al → 2 M + Al O (16)
Figure 3. Energy profile diagrams showing activation energies calculated for local Li hops as shownin Figure 2.
3.4. Solution of Dopants
Cation doping is an important strategy to modify the properties of materials. Here,we consider isovalent and alovalent dopants at different cation sites. Charge compensatingdefects are not necessary in the case of isovalent doping. However, point defects (vacanciesand interstitials) are used to compensate charges produced upon aliovalent doping. Arange of cations were doped and their solution energies were calculated using classical

ChemEngineering 2021, 5, 57 7 of 12
simulation. We provide Buckingham potentials used for dopants in the SupplementaryInformation (see Table S1).
3.4.1. Isovalent Doping
First, monovalent dopants (M = Na, K, and Rb) were considered on the Li site and thefollowing reaction equation was used to calculate the solution energy.
M2O + LiXLi → 2 MXLi + Li2O (15)
Solution energies are reported in Figure 4a. An exothermic solution energy of−0.24 eVis calculated for Na+, meaning that this dopant can be worth examining experimentally.The ionic radius of Li+ is 0.76 Å [46]. Favourability of Na+ on the Li site is partly owing tothe fact that the ionic radius (1.02 Å) [46] of Na+ is closer to that of Li+. Solution energyincreases with increasing ionic radius. Doping of K and Rb is not favourable as solutionenergies are positive for both dopants. The largest solution of energy (5.23 eV) is calculatedfor Rb and this dopant is highly unlikely to be considered for doping at room temperature.
ChemEngineering 2021, 5, x FOR PEER REVIEW 7 of 12
The lowest solution energy is calculated for Ga with an exothermic solution energy of –0.14 eV (refer to Figure 4b). The preference of Ga is partly due to the fact that the ionic radius of Al3+ (0.54 Å) matches reasonably with the ionic radius of Ga3+ (0.62 Å) [46]. Other dopants have endoergic solution energies. Solution energy increases gradually with ionic radius. The La is the most unlikely dopant as it has the highest solution energy of 1.91 eV.
Figure 4. Solution energies calculated for (a) monovalant, (b) trivalent, and (c) tetravalent dopants on the Li, Al, and Si, respectively.
Finally, the solution of tetravalent dopants (M = Ge, Ti, Sn, Zr, and Ce) was examined. Here, tetravalent dopants were substituted on the Si site. The following reaction equation was used to describe the doping process: MO + Si → M + SiO (17)
All dopants exhibit endothermic solution energies (refer to Figure 4c). A promising dopant for this process is Ge, with a solution energy of 0.39 eV owing to the ionic radius of Si4+ (0.26 Å) being closer to that of Ge4+ (0.39 Å) [46]. There is an increase in solution energy for Ti (2.53 eV). Then, the solution energy decreases to 1.63 eV. Both Sn and Zr have lower solution energies than that of Ti. The highest positive solution energy is cal-culated for Ce.
3.4.2. Aliovalent Doping Trivalent dopants (M = Ga, Sc, In, Y, Gd, and La) were substitutionally doped on the
site. This process required charge compensating defects. Two possible such defects (Li interstitial or oxygen vacancy) were considered (refer to Equations (18) and (19)). Addi-tional Li+ ions in this materials would increase its capacity. The formation of oxygen va-cancies would enhance the vacancy mediated oxygen ion diffusion. Furthermore, this doping process can lead to the loss of Li2O as Li interstitials and oxygen interstitials as facilitated by the formation oxygen vacancies can aggregate. M O + 2 Si + Li O → 2 M + 2 Li• + 2 SiO (18)M O + 2 Si + Li O → 2 M + V•• + 2 SiO (19)
Figure 5a reports the solution energies for the trivalent doping in which Li intersti-tials are the charge compensating defects (refer to Equation (18)). Ga is the most prominent
Figure 4. Solution energies calculated for (a) monovalant, (b) trivalent, and (c) tetravalent dopants on the Li, Al, and Si,respectively.
Next, trivalent dopants (M = Ga, Sc, In, Y, Gd, and La) were doped on the Al site. Wedescribe the reaction process using the following equation:
M2O3 + 2 AlXAl → 2 MXAl +Al2O3 (16)
The lowest solution energy is calculated for Ga with an exothermic solution energyof −0.14 eV (refer to Figure 4b). The preference of Ga is partly due to the fact that theionic radius of Al3+ (0.54 Å) matches reasonably with the ionic radius of Ga3+ (0.62 Å) [46].Other dopants have endoergic solution energies. Solution energy increases gradually withionic radius. The La is the most unlikely dopant as it has the highest solution energy of1.91 eV.
Finally, the solution of tetravalent dopants (M = Ge, Ti, Sn, Zr, and Ce) was examined.Here, tetravalent dopants were substituted on the Si site. The following reaction equationwas used to describe the doping process:
MO2 + SiXSi → MXSi + SiO2 (17)

ChemEngineering 2021, 5, 57 8 of 12
All dopants exhibit endothermic solution energies (refer to Figure 4c). A promisingdopant for this process is Ge, with a solution energy of 0.39 eV owing to the ionic radiusof Si4+ (0.26 Å) being closer to that of Ge4+ (0.39 Å) [46]. There is an increase in solutionenergy for Ti (2.53 eV). Then, the solution energy decreases to 1.63 eV. Both Sn and Zr havelower solution energies than that of Ti. The highest positive solution energy is calculatedfor Ce.
3.4.2. Aliovalent Doping
Trivalent dopants (M = Ga, Sc, In, Y, Gd, and La) were substitutionally doped onthe site. This process required charge compensating defects. Two possible such defects(Li interstitial or oxygen vacancy) were considered (refer to Equations (18) and (19)).Additional Li+ ions in this materials would increase its capacity. The formation of oxygenvacancies would enhance the vacancy mediated oxygen ion diffusion. Furthermore, thisdoping process can lead to the loss of Li2O as Li interstitials and oxygen interstitials asfacilitated by the formation oxygen vacancies can aggregate.
M2O3 + 2 SiXSi + Li2O → 2 M′Si + 2 Li•i + 2 SiO2 (18)
M2O3 + 2 SiXSi + Li2O → 2 M′Si + V••o + 2 SiO2 (19)
Figure 5a reports the solution energies for the trivalent doping in which Li interstitialsare the charge compensating defects (refer to Equation (18)). Ga is the most prominentdopant for this process, although its solution energy is 2.31 eV. The solution energy grad-ually increases with the increasing ionic radius. The dopant La has the highest solutionenergy of 5.29 eV. A similar trend is observed for the formation of oxygen vacancies, butwith slightly high energies (refer to Figure 5b). Overall, Ga is the promising dopant on theSi site for both processes.
ChemEngineering 2021, 5, x FOR PEER REVIEW 8 of 12
dopant for this process, although its solution energy is 2.31 eV. The solution energy grad-ually increases with the increasing ionic radius. The dopant La has the highest solution energy of 5.29 eV. A similar trend is observed for the formation of oxygen vacancies, but with slightly high energies (refer to Figure 5b). Overall, Ga is the promising dopant on the Si site for both processes.
Figure 5. Solution energies calculated for trivalent doping on the Si site for generating (a) Li interstitials and (b) oxygen vacancies.
3.5. Incorporation of Li into LiAlSi2O6 Li incorporation was examined using DFT simulations. Here, we report the geome-
tries, electronic structures, and volume change upon incorporation. The calculated total DOS plot of bulk LiAlSi2O6 is shown in Figure 6. The calculation shows that LiAlSi2O6 is an insulator with a band gap of 5.50 eV, which is in agreement with the band gap value of 5.575 eV calculated using DFT simulation by He et al. [47]. The total magnetic moment of the bulk LiAlSi2O6 is zero, as evidenced by the total DOS plot, in which spin up states are the mirror image of spin down states about the x-axis.
Figure 6. Total DOS plot of LiAlSi2O6. Vertical blue dot line corresponds to the Fermi energy level.
Incorporation of up to four Li atoms was considered. Figure 7 shows the relaxed structures. Incorporation of first two Li atoms is endoergic with respect to both the gas phase and bulk Li (see Table 6). Incorporation energy calculated using gas phase bulk Li metal is more positive than that calculated using the gas phase Li atom. This is because of the extra energy required to dissociate bulk Li to form Li atoms. Incorporation becomes exothermic for three and four Li atoms with respect to gas phase Li atom. This can be partly owing to the volume expansion introduced by the previous incorporation. Bader
Figure 5. Solution energies calculated for trivalent doping on the Si site for generating (a) Li interstitials and (b) oxygenvacancies.
3.5. Incorporation of Li into LiAlSi2O6
Li incorporation was examined using DFT simulations. Here, we report the geometries,electronic structures, and volume change upon incorporation. The calculated total DOSplot of bulk LiAlSi2O6 is shown in Figure 6. The calculation shows that LiAlSi2O6 is aninsulator with a band gap of 5.50 eV, which is in agreement with the band gap value of5.575 eV calculated using DFT simulation by He et al. [47]. The total magnetic moment ofthe bulk LiAlSi2O6 is zero, as evidenced by the total DOS plot, in which spin up states arethe mirror image of spin down states about the x-axis.

ChemEngineering 2021, 5, 57 9 of 12
ChemEngineering 2021, 5, x FOR PEER REVIEW 8 of 12
dopant for this process, although its solution energy is 2.31 eV. The solution energy grad-ually increases with the increasing ionic radius. The dopant La has the highest solution energy of 5.29 eV. A similar trend is observed for the formation of oxygen vacancies, but with slightly high energies (refer to Figure 5b). Overall, Ga is the promising dopant on the Si site for both processes.
Figure 5. Solution energies calculated for trivalent doping on the Si site for generating (a) Li interstitials and (b) oxygen vacancies.
3.5. Incorporation of Li into LiAlSi2O6 Li incorporation was examined using DFT simulations. Here, we report the geome-
tries, electronic structures, and volume change upon incorporation. The calculated total DOS plot of bulk LiAlSi2O6 is shown in Figure 6. The calculation shows that LiAlSi2O6 is an insulator with a band gap of 5.50 eV, which is in agreement with the band gap value of 5.575 eV calculated using DFT simulation by He et al. [47]. The total magnetic moment of the bulk LiAlSi2O6 is zero, as evidenced by the total DOS plot, in which spin up states are the mirror image of spin down states about the x-axis.
Figure 6. Total DOS plot of LiAlSi2O6. Vertical blue dot line corresponds to the Fermi energy level.
Incorporation of up to four Li atoms was considered. Figure 7 shows the relaxed structures. Incorporation of first two Li atoms is endoergic with respect to both the gas phase and bulk Li (see Table 6). Incorporation energy calculated using gas phase bulk Li metal is more positive than that calculated using the gas phase Li atom. This is because of the extra energy required to dissociate bulk Li to form Li atoms. Incorporation becomes exothermic for three and four Li atoms with respect to gas phase Li atom. This can be partly owing to the volume expansion introduced by the previous incorporation. Bader
Figure 6. Total DOS plot of LiAlSi2O6. Vertical blue dot line corresponds to the Fermi energy level.
Incorporation of up to four Li atoms was considered. Figure 7 shows the relaxedstructures. Incorporation of first two Li atoms is endoergic with respect to both the gasphase and bulk Li (see Table 6). Incorporation energy calculated using gas phase bulk Limetal is more positive than that calculated using the gas phase Li atom. This is because ofthe extra energy required to dissociate bulk Li to form Li atoms. Incorporation becomesexothermic for three and four Li atoms with respect to gas phase Li atom. This can bepartly owing to the volume expansion introduced by the previous incorporation. Badercharge analysis [48] confirms that all Li atoms exhibit a +1 charge. Positively charged Liatoms strongly interact with negatively charged oxygen atoms in the lattice.
ChemEngineering 2021, 5, x FOR PEER REVIEW 9 of 12
charge analysis [48] confirms that all Li atoms exhibit a +1 charge. Positively charged Li atoms strongly interact with negatively charged oxygen atoms in the lattice.
Figure 7. Relaxed structures of (a) a single Li, (b) 2Li, (c) 3Li, and (d) 4Li incorporated into LiAlSi2O6.
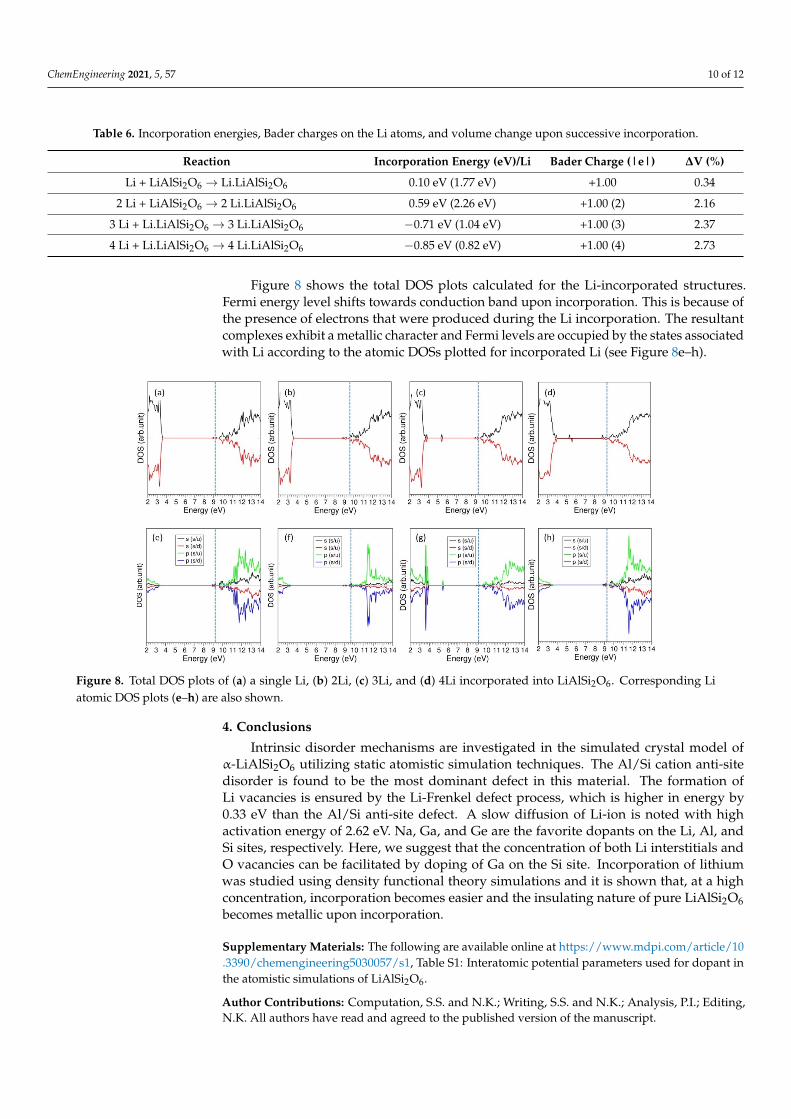
Table 6. Incorporation energies, Bader charges on the Li atoms, and volume change upon successive incorporation.
Reaction Incorporation Energy (eV)/Li Bader Charge (|e|) ∆V (%) Li + LiAlSi2O6 → Li.LiAlSi2O6 0.10 eV (1.77 eV) +1.00 0.34
2 Li + LiAlSi2O6 → 2 Li.LiAlSi2O6 0.59 eV (2.26 eV) +1.00 (2) 2.16 3 Li + Li.LiAlSi2O6 → 3 Li.LiAlSi2O6 –0.71 eV (1.04 eV) +1.00 (3) 2.37 4 Li + Li.LiAlSi2O6 → 4 Li.LiAlSi2O6 –0.85 eV (0.82 eV) +1.00 (4) 2.73
Figure 8 shows the total DOS plots calculated for the Li-incorporated structures. Fermi energy level shifts towards conduction band upon incorporation. This is because of the presence of electrons that were produced during the Li incorporation. The resultant complexes exhibit a metallic character and Fermi levels are occupied by the states associ-ated with Li according to the atomic DOSs plotted for incorporated Li (see Figure 8e–h).
Figure 7. Relaxed structures of (a) a single Li, (b) 2Li, (c) 3Li, and (d) 4Li incorporated into LiAlSi2O6.
ChemEngineering 2021, 5, 57 10 of 12
Table 6. Incorporation energies, Bader charges on the Li atoms, and volume change upon successive incorporation.
Reaction Incorporation Energy (eV)/Li Bader Charge (|e|) ∆V (%)
Li + LiAlSi2O6 → Li.LiAlSi2O6 0.10 eV (1.77 eV) +1.00 0.34
2 Li + LiAlSi2O6 → 2 Li.LiAlSi2O6 0.59 eV (2.26 eV) +1.00 (2) 2.16
3 Li + Li.LiAlSi2O6 → 3 Li.LiAlSi2O6 −0.71 eV (1.04 eV) +1.00 (3) 2.37
4 Li + Li.LiAlSi2O6 → 4 Li.LiAlSi2O6 −0.85 eV (0.82 eV) +1.00 (4) 2.73
Figure 8 shows the total DOS plots calculated for the Li-incorporated structures.Fermi energy level shifts towards conduction band upon incorporation. This is because ofthe presence of electrons that were produced during the Li incorporation. The resultantcomplexes exhibit a metallic character and Fermi levels are occupied by the states associatedwith Li according to the atomic DOSs plotted for incorporated Li (see Figure 8e–h).
ChemEngineering 2021, 5, x FOR PEER REVIEW 10 of 12
Figure 8. Total DOS plots of (a) a single Li, (b) 2Li, (c) 3Li, and (d) 4Li incorporated into LiAlSi2O6. Corresponding Li atomic DOS plots (e–h) are also shown.
4. Conclusions Intrinsic disorder mechanisms are investigated in the simulated crystal model of α-
LiAlSi2O6 utilizing static atomistic simulation techniques. The Al/Si cation anti-site disor-der is found to be the most dominant defect in this material. The formation of Li vacancies is ensured by the Li-Frenkel defect process, which is higher in energy by 0.33 eV than the Al/Si anti-site defect. A slow diffusion of Li-ion is noted with high activation energy of 2.62 eV. Na, Ga, and Ge are the favorite dopants on the Li, Al, and Si sites, respectively. Here, we suggest that the concentration of both Li interstitials and O vacancies can be facilitated by doping of Ga on the Si site. Incorporation of lithium was studied using den-sity functional theory simulations and it is shown that, at a high concentration, incorpo-ration becomes easier and the insulating nature of pure LiAlSi2O6 becomes metallic upon incorporation.
Supplementary Materials: The following are available online at www.mdpi.com/xxx/s1, Table S1: Interatomic potential parameters used for dopant in the atomistic simulations of LiAlSi2O6.
Author Contributions: Computation, S.S. and N.K.; Writing, S.S. and N.K.; Analysis, P.I.; Editing, N.K. All authors have read and agreed to the published version of the manuscript.
Funding: This research received no external funding.
Institutional Review Board Statement: Not applicable.
Informed Consent Statement: Not applicable.
Data Availability Statement: Not applicable.
Acknowledgments: We acknowledge Imperial College London for providing high performance computing facilities.
Conflicts of Interest: The authors declare no conflict of interest.
References 1. Dessemond, C.; Lajoie-Leroux, F.; Soucy, G.; Laroche, N.; Magnan, J.-F. Spodumene: The Lithium Market, Resources and Pro-
cesses. Minerals 2019, 9, 334. 2. Benson, T.R.; Coble, M.A.; Rytuba, J.J.; Mahood, G.A. Lithium enrichment in intracontinental rhyolite magmas leads to Li de-
posits in caldera basins. Nat. Commun. 2017, 8, 270. 3. Liu, Q.; Zhou, S.; Tang, C.; Zhai, Q.; Zhang, X.; Wang, R. Li-B Alloy as an Anode Material for Stable and Long Life Lithium
Metal Batteries. Energies 2018, 11, 2512.
Figure 8. Total DOS plots of (a) a single Li, (b) 2Li, (c) 3Li, and (d) 4Li incorporated into LiAlSi2O6. Corresponding Liatomic DOS plots (e–h) are also shown.
4. Conclusions
Intrinsic disorder mechanisms are investigated in the simulated crystal model ofα-LiAlSi2O6 utilizing static atomistic simulation techniques. The Al/Si cation anti-sitedisorder is found to be the most dominant defect in this material. The formation ofLi vacancies is ensured by the Li-Frenkel defect process, which is higher in energy by0.33 eV than the Al/Si anti-site defect. A slow diffusion of Li-ion is noted with highactivation energy of 2.62 eV. Na, Ga, and Ge are the favorite dopants on the Li, Al, andSi sites, respectively. Here, we suggest that the concentration of both Li interstitials andO vacancies can be facilitated by doping of Ga on the Si site. Incorporation of lithiumwas studied using density functional theory simulations and it is shown that, at a highconcentration, incorporation becomes easier and the insulating nature of pure LiAlSi2O6becomes metallic upon incorporation.
Supplementary Materials: The following are available online at https://www.mdpi.com/article/10.3390/chemengineering5030057/s1, Table S1: Interatomic potential parameters used for dopant inthe atomistic simulations of LiAlSi2O6.
Author Contributions: Computation, S.S. and N.K.; Writing, S.S. and N.K.; Analysis, P.I.; Editing,N.K. All authors have read and agreed to the published version of the manuscript.

ChemEngineering 2021, 5, 57 11 of 12
Funding: This research received no external funding.
Institutional Review Board Statement: Not applicable.
Informed Consent Statement: Not applicable.
Data Availability Statement: Not applicable.
Acknowledgments: We acknowledge Imperial College London for providing high performancecomputing facilities.
Conflicts of Interest: The authors declare no conflict of interest.
References1. Dessemond, C.; Lajoie-Leroux, F.; Soucy, G.; Laroche, N.; Magnan, J.-F. Spodumene: The Lithium Market, Resources and Processes.
Minerals 2019, 9, 334. [CrossRef]2. Benson, T.R.; Coble, M.A.; Rytuba, J.J.; Mahood, G.A. Lithium enrichment in intracontinental rhyolite magmas leads to Li deposits
in caldera basins. Nat. Commun. 2017, 8, 270. [CrossRef] [PubMed]3. Liu, Q.; Zhou, S.; Tang, C.; Zhai, Q.; Zhang, X.; Wang, R. Li-B Alloy as an Anode Material for Stable and Long Life Lithium Metal
Batteries. Energies 2018, 11, 2512. [CrossRef]4. Oruch, R.; Elderbi, M.A.; Khattab, H.A.; Pryme, I.F.; Lund, A. Lithium: A review of pharmacology, clinical uses, and toxicity. Eur.
J. Pharmacol. 2014, 740, 464–473. [CrossRef]5. Beskin, S.M.; Marin, Y.B. Classification of G3ranitic Pegmatites and Pegmatite-Bearing Granitic Systems. Geol. Ore Depos. 2018, 60,
578–586. [CrossRef]6. Sundelius, H.W. The Peg Claims spodumene pegmatites, Maine. Econ. Geol. 1963, 58, 84–106. [CrossRef]7. Barros, R.; Menuge, J.F. The Origin of Spodumene Pegmatites Associated with the Leinster Granite in Southeast Ireland. Can.
Miner. 2016, 54, 847–862. [CrossRef]8. Grosjean, C.; Miranda, P.H.; Perrin, M.; Poggi, P. Assessment of world lithium resources and consequences of their geographic
distribution on the expected development of the electric vehicle industry. Renew. Sustain. Energy Rev. 2012, 16, 1735–1744.[CrossRef]
9. Kesler, S.E.; Gruber, P.W.; Medina, P.A.; Keoleian, G.A.; Everson, M.P.; Wallington, T.J. Global lithium resources: Relativeimportance of pegmatite, brine and other deposits. Ore Geol. Rev. 2012, 48, 55–69. [CrossRef]
10. Jie, Z.; Weiqing, W.; Jing, L.; Yang, H.; Qiming, F.; Hong, Z. Fe(III) as an activator for the flotation of spodumene, albite, andquartz minerals. Miner. Eng. 2014, 61, 16–22. [CrossRef]
11. Dessemond, C.; Soucy, G.; Harvey, J.-P.; Ouzilleau, P. Phase Transitions in the α–γ–β Spodumene Thermodynamic System andImpact of γ-Spodumene on the Efficiency of Lithium Extraction by Acid Leaching. Minerals 2020, 10, 519. [CrossRef]
12. Peltosaari, O.; Tanskanen, P.; Heikkinen, E.-P.; Fabritius, T. α→γ→β-phase transformation of spodumene with hybrid microwaveand conventional furnaces. Miner. Eng. 2015, 82, 54–60. [CrossRef]
13. Song, Y.; Zhao, T.; He, L.; Zhao, Z.; Liu, X. A promising approach for directly extracting lithium from α-spodumene by alkalinedigestion and precipitation as phosphate. Hydrometallurgy 2019, 189, 105141. [CrossRef]
14. Kuganathan, N.; Srikaran, R.; Fossati, C.M.P.; Chroneos, A. Theoretical Modeling of Defects, Dopants, and Diffusion in theMineral Ilmenite. Minerals 2019, 9, 610. [CrossRef]
15. Suthaharan, S.; Iyngaran, P.; Kuganathan, N.; Chroneos, A. Defects, diffusion and dopants in the ceramic mineral “Lime-Feldspar”. J. Asian Ceram. Soc. 2021, 9, 570–577. [CrossRef]
16. Yuan, K.; Lee, S.S.; Cha, W.; Ulvestad, A.; Kim, H.; Abdilla, B.; Sturchio, N.C.; Fenter, P. Oxidation induced strain and defects inmagnetite crystals. Nat. Commun. 2019, 10, 703. [CrossRef] [PubMed]
17. Lowitzer, S.; Wilson, D.J.; Winkler, B.; Milman, V.; Gale, J.D. Defect properties of albite. Phys. Chem. Miner. 2008, 35, 129–135.[CrossRef]
18. Abdullah, A.A.; Oskierski, H.C.; Altarawneh, M.; Senanayake, G.; Lumpkin, G.; Dlugogorski, B.Z. Phase transformationmechanism of spodumene during its calcination. Miner. Eng. 2019, 140, 105883. [CrossRef]
19. Salis, M. Lattice defects in natural α-spodumene. Il Nuovo Cim. D 1995, 17, 649–651. [CrossRef]20. Gale, J.D. GULP: A computer program for the symmetry-adapted simulation of solids. J. Chem. Soc. Faraday Trans. 1997, 93,
629–637. [CrossRef]21. Gale, J.D.; Rohl, A.L. The General Utility Lattice Program (GULP). Mol. Simul. 2003, 29, 291–341. [CrossRef]22. Fisher, C.A.J.; Hart Prieto, V.M.; Islam, M.S. Lithium Battery Materials LiMPO4 (M = Mn, Fe, Co, and Ni): Insights into Defect
Association, Transport Mechanisms, and Doping Behavior. Chem. Mater. 2008, 20, 5907–5915. [CrossRef]23. Sauer, J.; Schroder, K.P.; Termath, V. Comparing the Acidities of Microporous Aluminosilicate and Silico-Aluminophosphate
Catalysts: A Combined Quantum Mechanics-Interatomic Potential Function Study. Czech. Chem. Commun. 1998, 63, 1394.[CrossRef]
24. Jones, A.; Slater, P.R.; Islam, M.S. Local Defect Structures and Ion Transport Mechanisms in the Oxygen-Excess ApatiteLa9.67(SiO4)6O2.5. Chem. Mater. 2008, 20, 5055–5060. [CrossRef]

ChemEngineering 2021, 5, 57 12 of 12
25. Olson, C.L.; Nelson, J.; Islam, M.S. Defect Chemistry, Surface Structures, and Lithium Insertion in Anatase TiO2. J. Phys. Chem. B2006, 110, 9995–10001. [CrossRef] [PubMed]
26. Mott, N.F.; Littleton, M.J. Conduction in polar crystals. I. Electrolytic conduction in solid salts. Trans. Faraday Soc. 1938, 34,485–499. [CrossRef]
27. Grimes, R.W.; Busker, G.; McCoy, M.A.; Chroneos, A.; Kilner, J.A.; Chen, S.-P. The Effect of Ion Size on Solution Mechanism andDefect Cluster Geometry. Ber. Der Bunsenges. Für Phys. Chem. 1997, 101, 1204–1210. [CrossRef]
28. Varotsos, P. Point defect parameters in β-PbF2 revisited. Solid State Ion. 2008, 179, 438–441. [CrossRef]29. Varotsos, P. Comparison of models that interconnect point defect parameters in solids with bulk properties. J. Appl. Phys. 2007,
101, 123503. [CrossRef]30. Kresse, G.; Joubert, D. From ultrasoft pseudopotentials to the projector augmented-wave method. Phys. Rev. B 1999, 59, 1758–1775.
[CrossRef]31. Blöchl, P.E. Projector augmented-wave method. Phys. Rev. B 1994, 50, 17953–17979. [CrossRef]32. Monkhorst, H.J.; Pack, J.D. Special points for Brillouin-zone integrations. Phys. Rev. B 1976, 13, 5188–5192. [CrossRef]33. Perdew, J.P.; Burke, K.; Ernzerhof, M. Generalized Gradient Approximation Made Simple. Phys. Rev. Lett. 1996, 77, 3865–3868.
[CrossRef]34. Press, W.H.; Teukolsky, S.A.; Vetterling, W.T.; Flannery, B.P. Numerical Recipes in C, 2nd ed.; The Art of Scientific Computing;
Cambridge University Press: Cambridge, UK, 1992.35. Grimme, S.; Antony, J.; Ehrlich, S.; Krieg, H. A consistent and accurate ab initio parametrization of density functional dispersion
correction (DFT-D) for the 94 elements H-Pu. J. Chem. Phys. 2010, 132, 154104. [CrossRef]36. Sasaki, S.; Fujino, K.; Takeuchi, Y.; Sadanaga, R. On the estimation of atomic charges by the X-ray method for some oxides and
silicates. Acta Crystallogr. Sect. A 1980, 36, 904–915. [CrossRef]37. Kröger, F.A.; Vink, H.J. Relations between the Concentrations of Imperfections in Crystalline Solids. In Solid State Physics; Seitz, F.,
Turnbull, D., Eds.; Academic Press: Cambridge, MA, USA, 1956; Volume 3, pp. 307–435.38. Armstrong, A.R.; Kuganathan, N.; Islam, M.S.; Bruce, P.G. Structure and Lithium Transport Pathways in Li2FeSiO4 Cathodes for
Lithium Batteries. J. Am. Chem. Soc. 2011, 133, 13031–13035. [CrossRef]39. Liu, H.; Choe, M.-J.; Enrique, R.A.; Orvañanos, B.; Zhou, L.; Liu, T.; Thornton, K.; Grey, C.P. Effects of Antisite Defects on Li
Diffusion in LiFePO4 Revealed by Li Isotope Exchange. J. Phys. Chem. C 2017, 121, 12025–12036. [CrossRef]40. Politaev, V.V.; Petrenko, A.A.; Nalbandyan, V.B.; Medvedev, B.S.; Shvetsova, E.S. Crystal structure, phase relations and electro-
chemical properties of monoclinic Li2MnSiO4. J. Solid State Chem. 2007, 180, 1045–1050. [CrossRef]41. Kuganathan, N.; Kordatos, A.; Kelaidis, N.; Chroneos, A. Defects, Lithium Mobility and Tetravalent Dopants in the Li3NbO4
Cathode Material. Sci. Rep. 2019, 9, 2192. [CrossRef]42. Islam, M.S.; Driscoll, D.J.; Fisher, C.A.J.; Slater, P.R. Atomic-Scale Investigation of Defects, Dopants, and Lithium Transport in the
LiFePO4 Olivine-Type Battery Material. Chem. Mater. 2005, 17, 5085–5092. [CrossRef]43. Kuganathan, N.; Ganeshalingam, S.; Chroneos, A. Defects, Dopants and Lithium Mobility in Li9V3(P2O7)3(PO4)2. Sci. Rep. 2018,
8, 8140. [CrossRef]44. Kuganathan, N.; Kordatos, A.; Anurakavan, S.; Iyngaran, P.; Chroneos, A. Li3SbO4 lithium-ion battery material: Defects, lithium
ion diffusion and tetravalent dopants. Mater. Chem. Phys. 2019, 225, 34–41. [CrossRef]45. Tealdi, C.; Saiful Islam, M.; Malavasi, L.; Flor, G. Defect and dopant properties of MgTa2O6. J. Solid State Chem. 2004, 177,
4359–4367. [CrossRef]46. Shannon, R. Revised effective ionic radii and systematic studies of interatomic distances in halides and chalcogenides. Acta
Crystallogr. Sect. A 1976, 32, 751–767. [CrossRef]47. He, G.-C.; Xiang, H.-M.; Jiang, W.; Kang, Q.; Chen, J.-H. First-principles theory on electronic structure and floatability of
spodumene. Rare Met. 2014, 33, 742–748. [CrossRef]48. Henkelman, G.; Arnaldsson, A.; Jónsson, H. A fast and robust algorithm for Bader decomposition of charge density. Comput.
Mater. Sci. 2006, 36, 354–360. [CrossRef]