First assessment of the plant phenology index (PPI) for ... - arXiv
Simulating the Impact of Climate Change on Rice Phenology and GrainYield in Irrigated Drylands of Central Asia
K. P. DEVKOTA,*,1 A. M. MANSCHADI,# M. DEVKOTA,* J. P. A. LAMERS,* E. RUZIBAEV,@
O. EGAMBERDIEV,@ E. AMIRI,& AND P. L. G. VLEK*
* Center for Development Research (ZEF), University of Bonn, Bonn, Germany#Department of Crop Sciences, University of Natural Resources and Life Sciences Vienna, Tulln, Austria
@ ‘‘Khorezm Project,’’ Center for Development Research (ZEF), University of Bonn/UNESCO, Urgench, Uzbekistan& Islamic Azad University of Lahijan, Lahijan, Iran
(Manuscript received 13 July 2012, in final form 7 April 2013)
ABSTRACT
Rice is the second major food crop in central Asia. Climate change may greatly affect the rice
production in the region. This study quantifies the effects of projected increases in temperature and
atmospheric CO2 concentration on the phenological development and grain yield of rice using the
‘‘ORYZA2000’’ simulation model. The model was parameterized and validated on the basis of datasets
from three field experiments with three widely cultivated rice varieties under various seeding dates in the
2008–09 growing seasons in the Khorezm region of Uzbekistan. The selected rice varieties represent
short-duration (SD), medium-duration (MD), and long-duration (LD) maturity types. The model was
linked with historical climate data (1970–99) and temperatures and CO2 concentrations projected by the
Intergovernmental Panel on Climate Change for the B1 and A1F1 scenarios for the period 2040–69 to
explore rice growth and yield formation at eight emergence dates from early May to mid-July. Simulation
results with historical daily weather data reveal a close relationship between seeding date and rice grain
yield. Optimal emergence dates were 25 June for SD, 5 June for MD, and 26 May for LD varieties. Under
both climate change scenarios, the seeding dates could be delayed by 10 days. Increased temperature and
CO2 concentration resulted in higher rice grain yields. However, seeding rice before and after the optimal
seeding dates reduced crop yield and yield stability significantly because of spikelet sterility induced by
both high and low temperatures. As the grain yield of SD varieties could be adversely affected by climate
change, rice breeding programs for central Asia should focus on developing appropriate heat-tolerant
MD and LD varieties.
1. Introduction
Climate change has become an important global issue.
Predictions for central Asia show that by the end of the
twenty-first century temperatures are likely to increase
by 38–48C, and the atmospheric CO2 concentration will
increase from the current 380 ppm to 485–1000 ppm.
Under such scenarios, crop yields are likely to decrease
by as much as 30% in the region even when the direct
positive physiological effects of increased CO2 are ac-
counted for (Parry et al. 2007).
Rice growth, development, and yield formation are
very sensitive to temperature. Currently, most of the rice
production occurs in regions where temperatures are al-
ready above the optimum for crop growth (daytime
maximum 288C and nighttimeminimum 228C) (Krishnan
et al. 2011). It is estimated that each 18C increase in the
daytime maximum–nighttime minimum temperatures
within the 288–218 to 348–278C range can decrease rice
yields by about 7%–8% (Baker et al. 1992).
In central Asia, rice is the second major food crop
and is grown on an area of 0.18 million ha (FAOSTAT
2010) in irrigated lowlands in the Amu Darya and Syr
Darya river basins. A number of studies have already
been conducted to examine the effect of increased
temperature and CO2 concentration on East and South
Asian rice cultivars (Wassmann et al. 2009; Krishnan
1Current affiliation: South Asia Regional Office, International
Maize and Wheat Improvement Center (CIMMYT), Kathmandu,
Nepal.
Corresponding author address: K. P. Devkota, International
Maize and Wheat Improvement Center (CIMMYT), P.O. Box
5168, Singh Durbar Plaza, Marga, Kathmandu, Nepal.
E-mail: [email protected]
SEPTEMBER 2013 DEVKOTA ET AL . 2033
DOI: 10.1175/JAMC-D-12-0182.1
� 2013 American Meteorological Society
et al. 2011), while far less attention has been devoted to
rice cultivars grown in central Asia. Rice is a C3 plant
and generally responds favorably to CO2 enrichment.
However, several studies have shown that high air
temperatures can reduce grain yield even under CO2
enrichment. Each 18C increase in the minimum tem-
perature during the growing season could decrease
yields by 10%, whereas the effect of an increase in the
maximum temperature on crop yield is insignificant
(Peng et al. 2004); rice yield could decrease by (2%–6%)
8C21 with an average mean daily temperature of 268C(Baker and Allen 1993; Matthews et al. 1995; Sheehy
et al. 2006). However, Krishnan et al. (2007) reported
that every 18C increase in temperature decreases rice
yield by 7.2% at the current CO2 concentration (380ppm),
but increases in CO2 enrichment up to 700ppm will lead
to an average yield increase of about 31% in India.
Similarly, Baker (2004) reported a 46%–71% increase in
rice yield at an ambient temperature of 288C with CO2
enrichment in U.S. cultivars. Furthermore, modeling
studies from Bangladesh (Karim et al. 1994), Japan
(Horie et al. 2000), China (Bachelet et al. 1995), and India
(Mall and Aggarwal 2002) reported country-specific var-
iations in future rice production due to climate change;
the greatest decline in crop yields will likely occur be-
tween the latitudes 108 and 358N (Penning de Vries 1993;
Krishnan et al. 2011). CO2 enrichment is likely to increase
the photosynthetic rate, and thus biomass production,
which in turn may positively affect assimilated allocation
to reproductive organs (Wassmann et al. 2009). However,
the yield decline under increased temperature conditions
is the result of spikelet sterility due to the negative effect
on pollination processes (Krishnan et al. 2011).
The climate in central Asia is continental and arid
(Kottek et al. 2006), with short, hot summers and long,
cold, dry winters. Under such climatic conditions, rice
cultivation is only possible for around 140 days during
the period May–October (Christmann et al. 2009). The
seeding time of rice, therefore, is very crucial, as the
flowering period with early seeding may coincide with
peak maximum temperatures, while late seeding may
result in low-temperature stress during grain filling
(Devkota 2011). Given the sensitivity of rice to tem-
perature, optimizing the seeding date and using adapted
varieties will be of central importance for enhancing
yields under climate change scenarios (Matthews et al.
1997; Blanche and Linscombe 2009). Simulation studies
on various seeding dates with different growth-duration
rice varieties can contribute to identifying the optimal
seeding date and appropriate rice variety for specific
geographical regions under both current and predicted
climate change scenarios (Krishnan et al. 2011). This can
indirectly overcome the predicted adverse effects of
climate change on rice production in a particular region
and may contribute to the development of suitable
adaptation strategies through agronomic and plant
breeding practices (Matthews et al. 1995).
The rice simulation model ORYZA2000, version 2.13,
is capable of simulating phenology, growth, spikelet ste-
rility, and grain yield of indica and japonica rice eco-
types in response to temperature, CO2, solar radiation,
and cultivar-specific genetic characteristics (Matthews
et al. 1997; Jing et al. 2007;Krishnan et al. 2007; Shen et al.
2011; Zhang and Tao 2013). It can simulate the response
of rice phenology to climate change and variability in
different climatic zones equally well or better than other
rice phenology models such as the Crop Estimation
through Resource and Environment Synthesis (CERES)
rice model, regional climate model (RCM), Beta model,
and Simulation Model for Rice–Weather Relationships
(SIMRIW) (Zhang and Tao 2013). The objective of
this study was to explore the potential effect of climate
change on rice phenology and grain yield in central Asia
by (i) parameterizing and validating the rice growth
model ORYZA2000 for local rice varieties and (ii) as-
sessing the impact of climate change as projected by the
Intergovernmental Panel on Climate Change (IPCC)
Special Report on Emissions Scenarios (SRES) under
lowest future emission trajectory (SRES B1) and highest
future emission trajectory (SRES A1F1) (Parry et al.
2007) at different emergence dates.
2. Materials and methods
a. Study area
The field experiments were conducted in the 2008 and
2009 rice-growing seasons in the Urgench–Khorezm
region (4183201200N, 6084004400E) located in northwest-
ern Uzbekistan on the left bank of the Amu Darya
River. The climate of the area is arid with a long-term
average annual rainfall of less than 100mm. The soil at
the experimental site is an irrigated alluvial meadow
(Russian classification), that is, arenosol, gleyic, calcaric,
sodic [Food and Agriculture Organization (FAO) clas-
sification], sandy loam to loamy sand with high soil
salinity [2.7 dSm21, electrical conductivity of a satu-
rated soil extract (ECe) 1:1 in 0–15-cm soil depth],
shallow (0.5–2m) and saline (2–4dSm21) groundwater
table, and low soil organicmatter (0.4%–0.8%) (Table 1).
b. Field experiments
1) EXPERIMENTAL DESIGN AND TREATMENTS
Three field experiments (one in 2008 and two in 2009)
were conducted to evaluate phenology and growth of
a set of widely cultivated Uzbek rice varieties seeded
2034 JOURNAL OF APPL IED METEOROLOGY AND CL IMATOLOGY VOLUME 52
at different dates. Rice varieties of short duration (SD;
Shoternboy-1, 85 days), medium duration (MD;Allanga-3,
105 days), and long duration (LD; Mustakillik, 125 days)
were evaluated. The first experiment (experiment I)
conducted in 2008 included evaluation of these varieties
in a randomized complete block design with eight repli-
cations in a 600-m2 plot at the Cotton Research Institute,
Urgench, Uzbekistan. Rice was seeded on 16 June in this
experiment, and the final yield and yield attributes were
recorded in a 7.5-m2 area in each plot. At a similar site,
a second experiment (experiment II) was conducted in
2009 to evaluate the three rice varieties seeded on 28May
and 19 June in an unreplicated 30-m2 plot. For each va-
riety, final yield and biomass were measured on three
subplots of 6m2. In the same year (2009), another un-
replicated experiment (experiment III) was conducted at
Urgench State University, Urgench, Uzbekistan (5 km
from the Cotton Research Institute), to evaluate the ef-
fect of six seeding dates starting on 5 May–15 July at 15–
20-day intervals. The plot size in this experiment was
20m2, and final yield and biomass were measured in a
6-m2 plot for all seeding dates.
2) CROP ESTABLISHMENT AND MANAGEMENT
Field preparation, sowing, seed rate, and irrigation
water management were managed according to the
recommended practices in the region. In all experi-
ments, the field was dry ploughed 3–4 times, leveled, and
irrigation water was applied. Pregerminated rice seeds
were then uniformly directly broadcast into the standing
water using the recommended seed rate of 80 kg ha21.
From seeding to 10 days of emergence, 1–2 cm of
standing water was maintained in the fields. After 10
days of emergence, similar to the farmers’ practice in the
region, 5–15 cm irrigation water was applied after the
disappearance of the standing water. In all experiments,
a fertilizer dose of 250 kg ha21 nitrogen (N), 120 kg ha21
phosphorus (P2O5), and 80 kg ha21 potash (K2O) was
applied. Phosphorus and K2O fertilizers and 50% of the
N were applied as a basal application during field
preparation. The remaining N was top-dressed in two
equal splits, that is, at panicle initiation and flowering.
The experimental fields were kept weed-free during the
entire crop-growing period through the combined use of
the postemergence herbicide Gulliver (Azimsulfuron
50 WG) at 25 g ha21 and hand weeding (performed on
two occasions). There was no visible nutrient or water
stress, and the crop was kept free of insect, pest, and
disease infestation; thus, the experiment was considered
as a potential production system (Bouman et al. 2001).
3) MEASUREMENTS
The phenological development of the rice was re-
corded in all experiments through visual observation
using the standard evaluation system for rice (IRRI
2002). For each seeding date of experiments II and III,
plant samples were collected from a 50 cm3 50 cm area
at 15–20-day intervals for determination of biomass pro-
duction and leaf area. The leaf area of green leaves was
measured with a leaf area meter (Li-Cor, Inc., LI-3100;
cm2) and converted to leaf area index (LAI; m2m22).
Stem, green leaves, dead leaves, and panicles were sep-
arated and oven-dried separately for 72h at 658C until
constant weight.
c. ORYZA2000 model
1) MODEL DESCRIPTION
ORYZA2000 simulates rice growth, development, and
water balance under potential production, water-limited,
and N-limited conditions (Bouman et al. 2001). The
model calculates the daily rate of biomass production
as a function of solar radiation, LAI, temperature, leaf N
content, and atmospheric CO2 concentration. The phe-
nological development is simulated based on daily ambi-
ent temperature and photoperiod. The key development
stages (DVSs) for rice are emergence, panicle initiation,
flowering, and physiological maturity. Consequently, the
life cycle of rice is divided into four phenological phases:
(i) juvenile phase from emergence (DVS 5 0) to start of
photoperiod-sensitive phase (DVS5 0.4), (ii) photoperiod-
sensitive phase from DVS 5 0.4 until panicle initiation
(DVS5 0.65), (iii) panicle formation phase from panicle
initiation to 50% flowering (DVS 5 1.0), and (iv) grain-
filling phase from flowering to physiological maturity
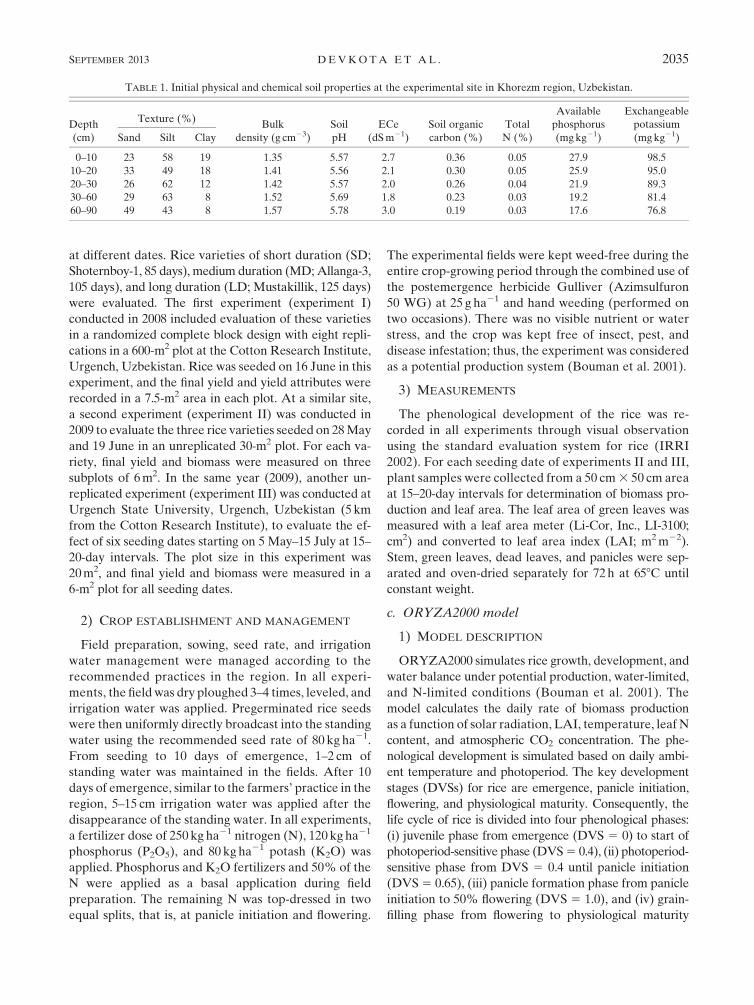
TABLE 1. Initial physical and chemical soil properties at the experimental site in Khorezm region, Uzbekistan.
Depth
(cm)
Texture (%)Bulk
density (g cm23)
Soil
pH
ECe
(dSm21)
Soil organic
carbon (%)
Total
N (%)
Available
phosphorus
(mgkg21)
Exchangeable
potassium
(mgkg21)Sand Silt Clay
0–10 23 58 19 1.35 5.57 2.7 0.36 0.05 27.9 98.5
10–20 33 49 18 1.41 5.56 2.1 0.30 0.05 25.9 95.0
20–30 26 62 12 1.42 5.57 2.0 0.26 0.04 21.9 89.3
30–60 29 63 8 1.52 5.69 1.8 0.23 0.03 19.2 81.4
60–90 49 43 8 1.57 5.78 3.0 0.19 0.03 17.6 76.8
SEPTEMBER 2013 DEVKOTA ET AL . 2035
(DVS 5 2.0). The duration of each of these four phases
is calculated based on a cultivar-specific development
rate constant, daily increment in heat units expressed in
degree-days, and photoperiod (Table 2).
The ORYZA2000 model also accounts for the effect
of CO2 enrichment by introducing a corrected coefficient
to the initial light-use efficiency of a single leaf [«;
kgCO2ha21 h21 (Jm22 s21)21]. The calculation of this
value uses the formula by Jansen (1990):
«5 «340
�12 exp(20:003 053CCO22 0:222)
12 exp(20:003 053 3402 0:222)
�, (1)
where « is the value of CO2 effect, «340 represents the
reference effect value of CO2 with the concentration of
340 ppm (defined as 1), and CCO2 is the CO2 concen-
tration in the actual simulation environment.
Effect of temperature on grain formation and spikeletfertility.Rice grain yield is determined by carbohydrate pro-
duction (source size) during grain filling and the stor-
age capacity of grains (sink size). Sink size is a function
of the number and maximum growth rate of spikelets.
The number of spikelets at flowering is calculated
from the total biomass accumulated from panicle
initiation until first flowering (Kropff et al. 1994). In
ORYZA2000, the rate of grain growth from panicle
initiation to 50% flowering is tracked, and the number
of spikelets formed (Si; number of spikelets per hectare
per day) is calculated as the product of biomass accu-
mulation from panicle initiation to 50% flowering
(G; kg dry matter ha21 day21) and spikelet formation
factor (Y; number per kilogram). The spikelet forma-
tion factor Y is the slope of the relationship between
the effect of solar radiation, temperature, nitrogen,
competition, and water on spikelet formation. Spikelets
turn into grains during crop growth. However, some
spikelets can become sterile because of either too high or
too low temperatures and do not fill (Horie et al. 1992).
Sterility caused by cold temperatures is based on the
cooling degree-day (SQt) and is calculated as follows:
SQt 5�(222Td) , (2)
where Td is the average temperature (corrected for
temperature increase caused by drought). The summa-
tion of SQt is done for the period of highest sensitivity of
the rice panicle to low temperatures (0.75#DVS# 1.2).
The relation between the percentage sterility caused by
cold (Sc, SF1) and the sum of the cooling degree-day is
Sc 5 12 (4:61 0:0543 SQ1:56t )/100. (3)
Rice spikelets are also sensitive to high temperature,
particularly at anthesis. Damage to the pollen occurs
when the temperature at flowering is above approximately
358C (Satake and Yoshida 1978). In ORYZA2000, the
fraction of fertile spikelets caused by high temperatures
(Sh, SF2) is calculated as (Horie 1993):
Sh 5 1/f11 exp[0:853(Tm,a2 36:6)]g , (4)
where Tm,a is average daily maximum temperature over
the growing period (0.96 # DVS # 1.22) with elevated
and ambient CO2 concentrations.
2) MODEL PARAMETERIZATION
The model was parameterized for SD (Shoternboy-1,
85 days), MD (Allanga-3, 105 days), and LD (Mustakillik,
125 days) varieties starting with the standard crop pa-
rameters for cultivar IR72 and following the procedures
set out by Bouman et al. (2001). The data from two
seeding dates (from experiment II) were used for model
parameterization.
3) MODEL EVALUATION
Following model parameterization, the data for
phenology, biomass partitioning, and yield from ex-
periments I and III (seven seeding dates) were used
for evaluating model performance. Following the
procedures set out by Bouman and van Laar (2006), a
combination of graphical presentation and various
statistical measures was used to evaluate the perfor-
mance of ORYZA2000. The graphs of the simulated
and measured grain yield, biomass, green leaf dry
weight, dead leaf dry weight, and phenological stages
were compared. For the same variables, we computed
the slope a, intercept b, and coefficient of deter-
mination R2 of the linear regression between mea-
sured X and simulated Y values. The model was
also evaluated using the Student’s t test of means as-
suming unequal variance P(t*). The variation in
measured data is represented by mean standard de-
viation. The absolute root-mean-square errors (RMSEa)
and normalized root-mean-square errors (RMSEn) were
calculated as
RMSEa 5
�1
n�(Yi 2Xi)
2
�0:5(5)
and
RMSEn5 1003
h(1/n)�(Yi 2Xi)
2i0:5
�Xi/n, (6)
2036 JOURNAL OF APPL IED METEOROLOGY AND CL IMATOLOGY VOLUME 52
where Yi and Xi are simulated and measured values,
respectively;Xi is themean of all measured values; and n
is the number of measurements.
It is assumed that the model reproduces experimental
data best when a is close to 0, b is close to 1,R2 is close to
1, P(t*) is larger than 0.05, RMSEa is similar to the
standard errors of measured values, and RMSEn is
similar to the coefficient of variation ofmeasured values.
4) CLIMATE CHANGE SCENARIO ANALYSIS
Historical data on rainfall, minimum and maximum
temperature, solar radiation, relative humidity, and va-
por pressure (as required by ORYZA2000) were col-
lected for a 29-yr period (1970–99) from the Urgench
airport (3 km from the experimental site). The projected
changes in surface air temperature under the SRES B1
and A1F1 scenarios for central Asia (Table 3) for 2040–
69 were collected from the IPCC Fourth Assessment
Report (Parry et al. 2007). The projected increase in
temperature was added to the daily minimum and
maximum temperatures, and two climate change sce-
narios were generated. The ambient CO2 concentration
of 340 ppm in historical data, 540 ppm in the B1 scenario,
and 960 ppm in the A1F1 scenario as projected by Parry
et al. (2007) were used in ORYZA2000 for scenario
analysis.
In the climate change simulations, ORYZA2000 was
used to simulate the impact of climate change on pheno-
logical development (days to flowering and physiological
maturity), grain yield, spikelet sterility factor due to low
temperature (Sc, SF1), and spikelet fertility factor due to
high temperature (Sh, SF2) in SD, MD, and LD rice va-
rieties at eight emergence dates from early May to mid-
July (6 May, 16 May, 26 May, 5 June, 15 June, 25 June,
5 July, and 15 July) over 29 years under current historical
weather data and for 2040–69 under the SRES B1 and
A1F1 scenarios. As the model is not capable of predicting
emergence dates, the simulation treatments were planned
with emergence dates instead of seeding dates.
3. Results
a. Parameterization and validation of ORYZA2000
The details seeding date, days to emergence, panicle
initiation, flowering, and physiological maturity were
recorded (Table 4). The goodness-of-fit parameters
(Tables 5, 6) show that the observed and simulated
phenological stages of all rice varieties at seeding
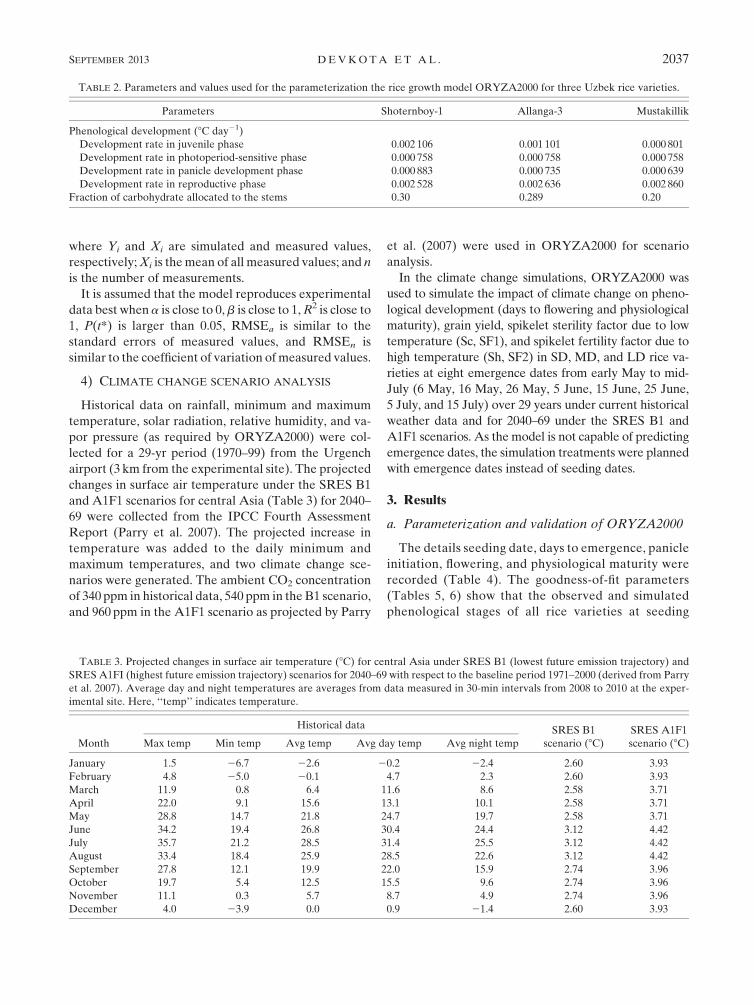
TABLE 2. Parameters and values used for the parameterization the rice growth model ORYZA2000 for three Uzbek rice varieties.
Parameters Shoternboy-1 Allanga-3 Mustakillik
Phenological development (8C day21)
Development rate in juvenile phase 0.002 106 0.001 101 0.000 801
Development rate in photoperiod-sensitive phase 0.000 758 0.000 758 0.000 758
Development rate in panicle development phase 0.000 883 0.000 735 0.000 639
Development rate in reproductive phase 0.002 528 0.002 636 0.002 860
Fraction of carbohydrate allocated to the stems 0.30 0.289 0.20
TABLE 3. Projected changes in surface air temperature (8C) for central Asia under SRES B1 (lowest future emission trajectory) and
SRES A1FI (highest future emission trajectory) scenarios for 2040–69 with respect to the baseline period 1971–2000 (derived from Parry
et al. 2007). Average day and night temperatures are averages from data measured in 30-min intervals from 2008 to 2010 at the exper-
imental site. Here, ‘‘temp’’ indicates temperature.
Month
Historical data SRES B1
scenario (8C)SRES A1F1
scenario (8C)Max temp Min temp Avg temp Avg day temp Avg night temp
January 1.5 26.7 22.6 20.2 22.4 2.60 3.93
February 4.8 25.0 20.1 4.7 2.3 2.60 3.93
March 11.9 0.8 6.4 11.6 8.6 2.58 3.71
April 22.0 9.1 15.6 13.1 10.1 2.58 3.71
May 28.8 14.7 21.8 24.7 19.7 2.58 3.71
June 34.2 19.4 26.8 30.4 24.4 3.12 4.42
July 35.7 21.2 28.5 31.4 25.5 3.12 4.42
August 33.4 18.4 25.9 28.5 22.6 3.12 4.42
September 27.8 12.1 19.9 22.0 15.9 2.74 3.96
October 19.7 5.4 12.5 15.5 9.6 2.74 3.96
November 11.1 0.3 5.7 8.7 4.9 2.74 3.96
December 4.0 23.9 0.0 0.9 21.4 2.60 3.93
SEPTEMBER 2013 DEVKOTA ET AL . 2037
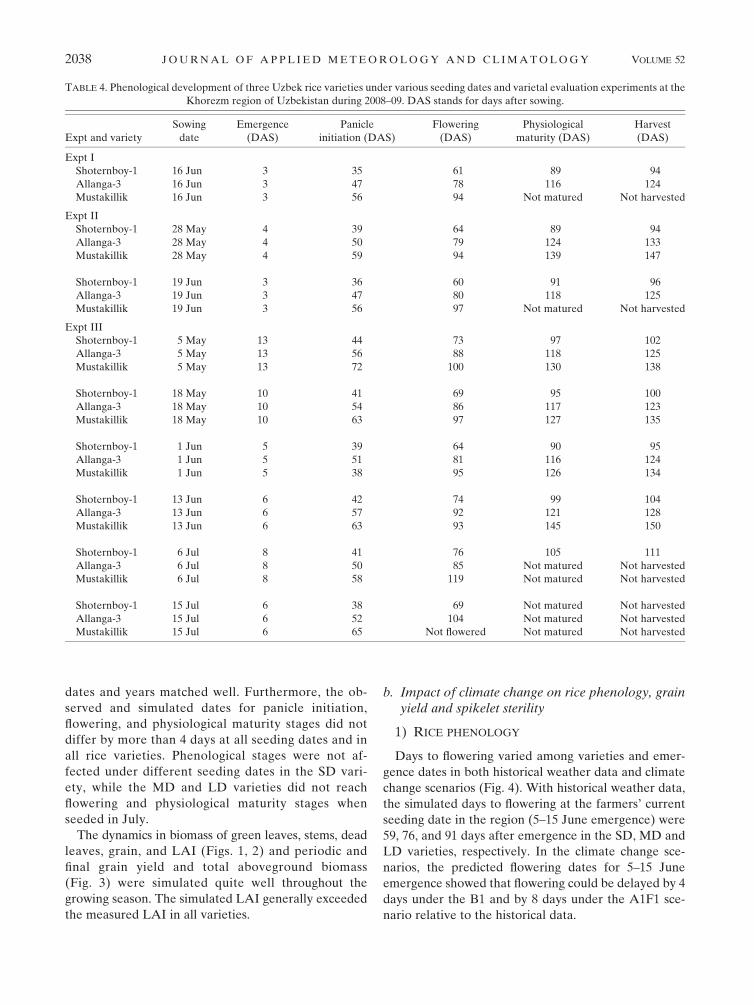
dates and years matched well. Furthermore, the ob-
served and simulated dates for panicle initiation,
flowering, and physiological maturity stages did not
differ by more than 4 days at all seeding dates and in
all rice varieties. Phenological stages were not af-
fected under different seeding dates in the SD vari-
ety, while the MD and LD varieties did not reach
flowering and physiological maturity stages when
seeded in July.
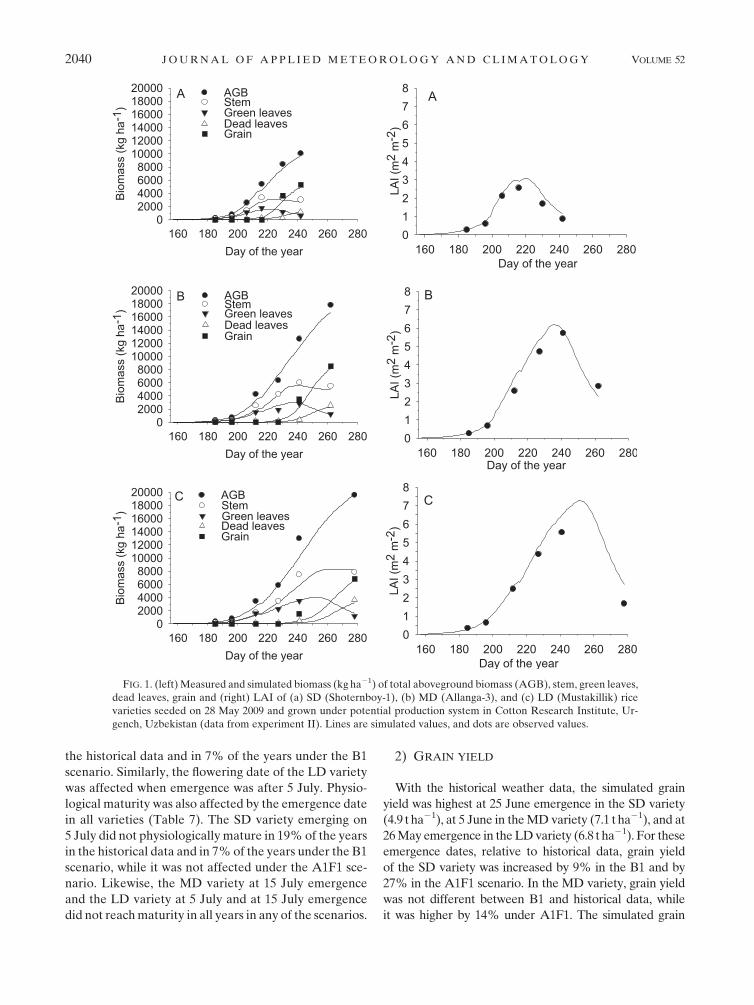
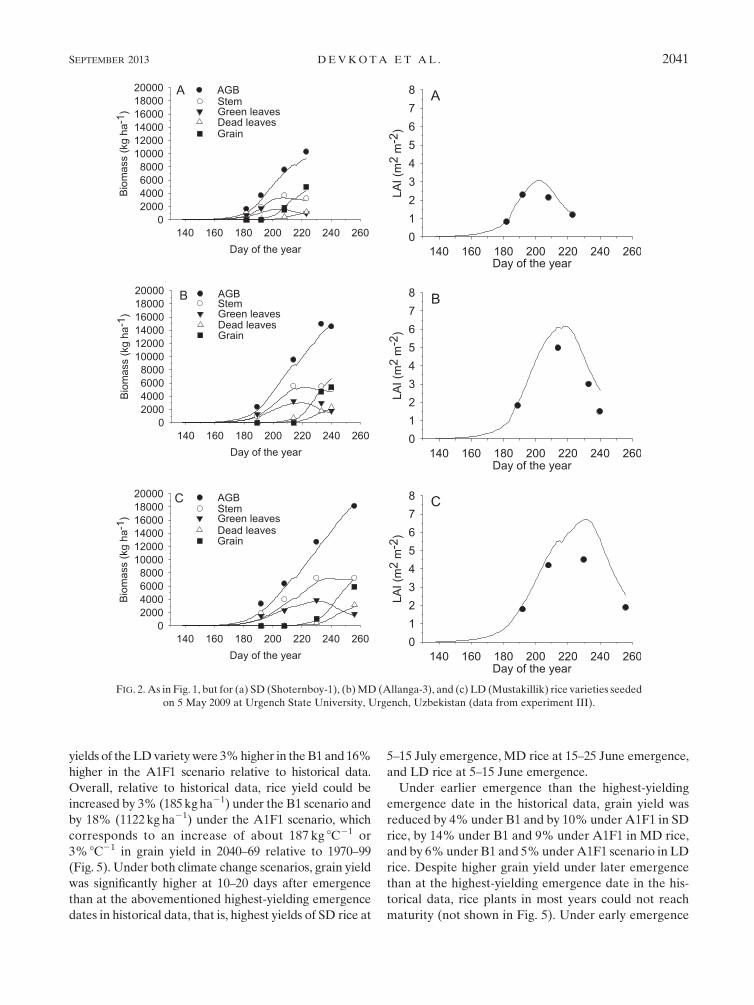
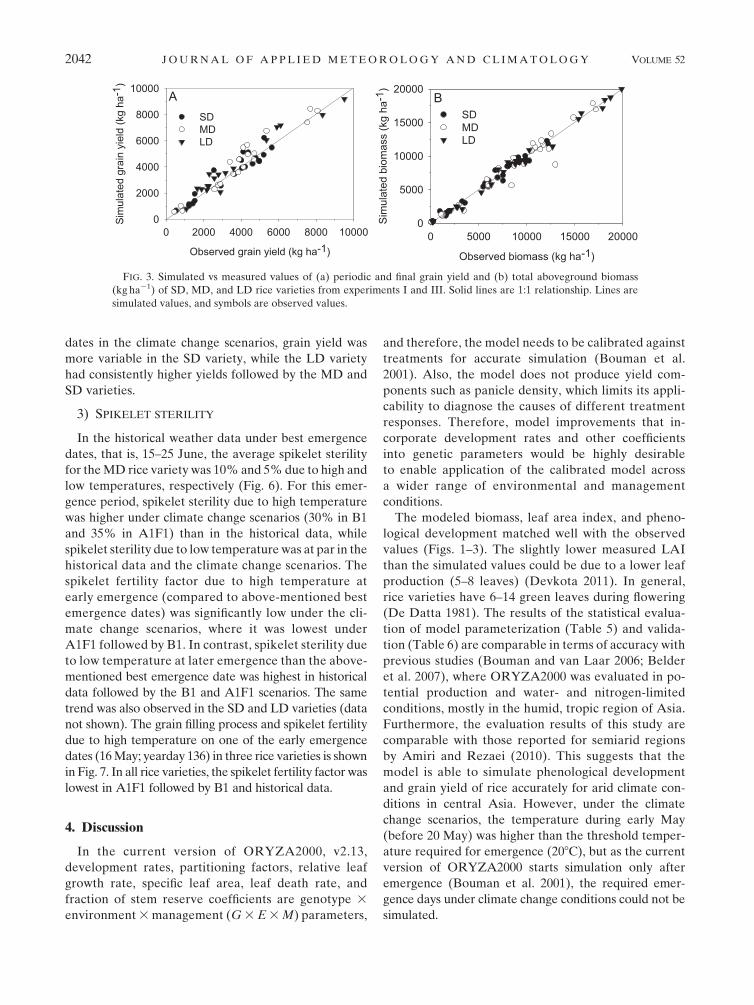
The dynamics in biomass of green leaves, stems, dead
leaves, grain, and LAI (Figs. 1, 2) and periodic and
final grain yield and total aboveground biomass
(Fig. 3) were simulated quite well throughout the
growing season. The simulated LAI generally exceeded
the measured LAI in all varieties.
b. Impact of climate change on rice phenology, grainyield and spikelet sterility
1) RICE PHENOLOGY
Days to flowering varied among varieties and emer-
gence dates in both historical weather data and climate
change scenarios (Fig. 4). With historical weather data,
the simulated days to flowering at the farmers’ current
seeding date in the region (5–15 June emergence) were
59, 76, and 91 days after emergence in the SD, MD and
LD varieties, respectively. In the climate change sce-
narios, the predicted flowering dates for 5–15 June
emergence showed that flowering could be delayed by 4
days under the B1 and by 8 days under the A1F1 sce-
nario relative to the historical data.
TABLE 4. Phenological development of three Uzbek rice varieties under various seeding dates and varietal evaluation experiments at the
Khorezm region of Uzbekistan during 2008–09. DAS stands for days after sowing.
Expt and variety
Sowing
date
Emergence
(DAS)
Panicle
initiation (DAS)
Flowering
(DAS)
Physiological
maturity (DAS)
Harvest
(DAS)
Expt I
Shoternboy-1 16 Jun 3 35 61 89 94
Allanga-3 16 Jun 3 47 78 116 124
Mustakillik 16 Jun 3 56 94 Not matured Not harvested
Expt II
Shoternboy-1 28 May 4 39 64 89 94
Allanga-3 28 May 4 50 79 124 133
Mustakillik 28 May 4 59 94 139 147
Shoternboy-1 19 Jun 3 36 60 91 96
Allanga-3 19 Jun 3 47 80 118 125
Mustakillik 19 Jun 3 56 97 Not matured Not harvested
Expt III
Shoternboy-1 5 May 13 44 73 97 102
Allanga-3 5 May 13 56 88 118 125
Mustakillik 5 May 13 72 100 130 138
Shoternboy-1 18 May 10 41 69 95 100
Allanga-3 18 May 10 54 86 117 123
Mustakillik 18 May 10 63 97 127 135
Shoternboy-1 1 Jun 5 39 64 90 95
Allanga-3 1 Jun 5 51 81 116 124
Mustakillik 1 Jun 5 38 95 126 134
Shoternboy-1 13 Jun 6 42 74 99 104
Allanga-3 13 Jun 6 57 92 121 128
Mustakillik 13 Jun 6 63 93 145 150
Shoternboy-1 6 Jul 8 41 76 105 111
Allanga-3 6 Jul 8 50 85 Not matured Not harvested
Mustakillik 6 Jul 8 58 119 Not matured Not harvested
Shoternboy-1 15 Jul 6 38 69 Not matured Not harvested
Allanga-3 15 Jul 6 52 104 Not matured Not harvested
Mustakillik 15 Jul 6 65 Not flowered Not matured Not harvested
2038 JOURNAL OF APPL IED METEOROLOGY AND CL IMATOLOGY VOLUME 52
In the SD variety, flowering was delayed under cli-
mate change scenarios relative to the historical data for
all eight emergence dates. However, in the MD and LD
varieties, flowering could be delayed by 1.5 days per 18Cincrease in temperature with early emergence dates,
while under late (July) emergence conditions, flowering
was later in historical data than in the climate change
scenarios (Fig. 4).
Under both current and climate change scenarios at
all emergence dates, the SD variety reached the flow-
ering stage (Table 7). However, the MD variety
emerging on 15 July did not flower in 37% of the years in
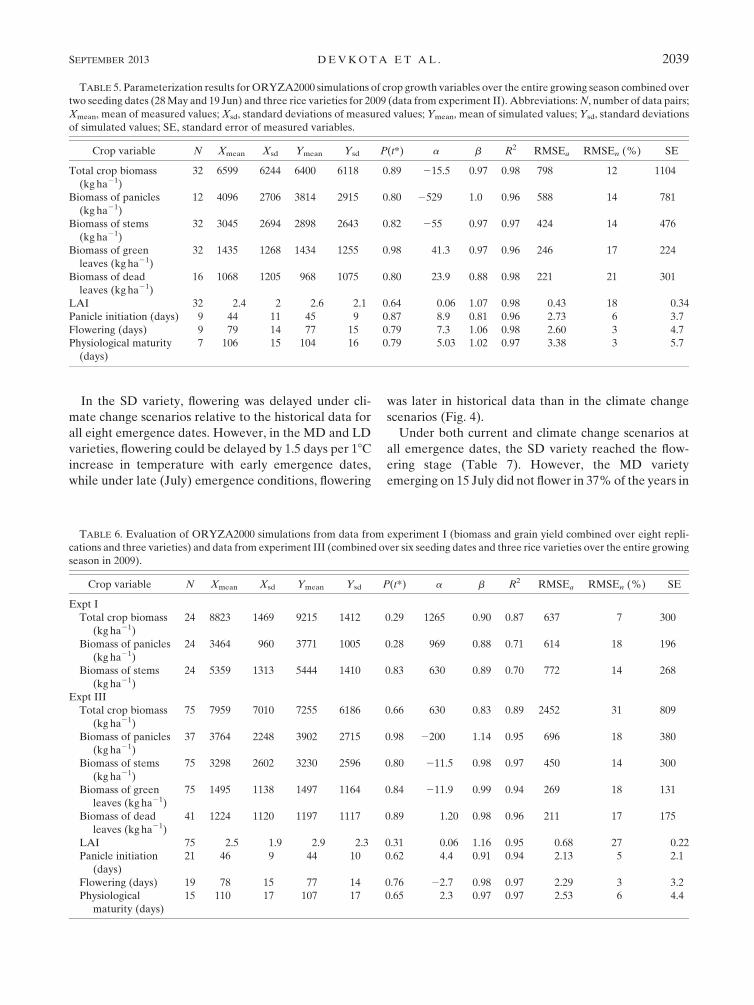
TABLE 5. Parameterization results forORYZA2000 simulations of crop growth variables over the entire growing season combined over
two seeding dates (28May and 19 Jun) and three rice varieties for 2009 (data from experiment II). Abbreviations:N, number of data pairs;
Xmean, mean of measured values;Xsd, standard deviations of measured values; Ymean, mean of simulated values; Ysd, standard deviations
of simulated values; SE, standard error of measured variables.
Crop variable N Xmean Xsd Ymean Ysd P(t*) a b R2 RMSEa RMSEn (%) SE
Total crop biomass
(kg ha21)
32 6599 6244 6400 6118 0.89 215.5 0.97 0.98 798 12 1104
Biomass of panicles
(kg ha21)
12 4096 2706 3814 2915 0.80 2529 1.0 0.96 588 14 781
Biomass of stems
(kg ha21)
32 3045 2694 2898 2643 0.82 255 0.97 0.97 424 14 476
Biomass of green
leaves (kgha21)
32 1435 1268 1434 1255 0.98 41.3 0.97 0.96 246 17 224
Biomass of dead
leaves (kgha21)
16 1068 1205 968 1075 0.80 23.9 0.88 0.98 221 21 301
LAI 32 2.4 2 2.6 2.1 0.64 0.06 1.07 0.98 0.43 18 0.34
Panicle initiation (days) 9 44 11 45 9 0.87 8.9 0.81 0.96 2.73 6 3.7
Flowering (days) 9 79 14 77 15 0.79 7.3 1.06 0.98 2.60 3 4.7
Physiological maturity
(days)
7 106 15 104 16 0.79 5.03 1.02 0.97 3.38 3 5.7
TABLE 6. Evaluation of ORYZA2000 simulations from data from experiment I (biomass and grain yield combined over eight repli-
cations and three varieties) and data from experiment III (combined over six seeding dates and three rice varieties over the entire growing
season in 2009).
Crop variable N Xmean Xsd Ymean Ysd P(t*) a b R2 RMSEa RMSEn (%) SE
Expt I
Total crop biomass
(kg ha21)
24 8823 1469 9215 1412 0.29 1265 0.90 0.87 637 7 300
Biomass of panicles
(kg ha21)
24 3464 960 3771 1005 0.28 969 0.88 0.71 614 18 196
Biomass of stems
(kg ha21)
24 5359 1313 5444 1410 0.83 630 0.89 0.70 772 14 268
Expt III
Total crop biomass
(kg ha21)
75 7959 7010 7255 6186 0.66 630 0.83 0.89 2452 31 809
Biomass of panicles
(kg ha21)
37 3764 2248 3902 2715 0.98 2200 1.14 0.95 696 18 380
Biomass of stems
(kg ha21)
75 3298 2602 3230 2596 0.80 211.5 0.98 0.97 450 14 300
Biomass of green
leaves (kgha21)
75 1495 1138 1497 1164 0.84 211.9 0.99 0.94 269 18 131
Biomass of dead
leaves (kgha21)
41 1224 1120 1197 1117 0.89 1.20 0.98 0.96 211 17 175
LAI 75 2.5 1.9 2.9 2.3 0.31 0.06 1.16 0.95 0.68 27 0.22
Panicle initiation
(days)
21 46 9 44 10 0.62 4.4 0.91 0.94 2.13 5 2.1
Flowering (days) 19 78 15 77 14 0.76 22.7 0.98 0.97 2.29 3 3.2
Physiological
maturity (days)
15 110 17 107 17 0.65 2.3 0.97 0.97 2.53 6 4.4
SEPTEMBER 2013 DEVKOTA ET AL . 2039
the historical data and in 7% of the years under the B1
scenario. Similarly, the flowering date of the LD variety
was affected when emergence was after 5 July. Physio-
logical maturity was also affected by the emergence date
in all varieties (Table 7). The SD variety emerging on
5 July did not physiologically mature in 19% of the years
in the historical data and in 7%of the years under the B1
scenario, while it was not affected under the A1F1 sce-
nario. Likewise, the MD variety at 15 July emergence
and the LD variety at 5 July and at 15 July emergence
did not reachmaturity in all years in any of the scenarios.
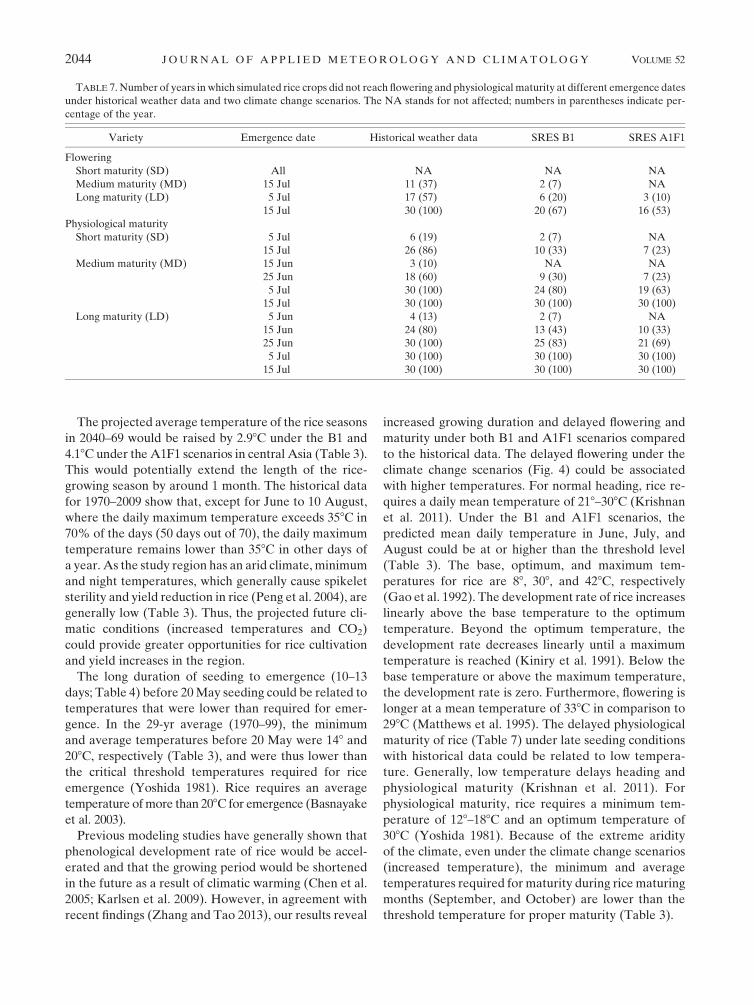
2) GRAIN YIELD
With the historical weather data, the simulated grain
yield was highest at 25 June emergence in the SD variety
(4.9 t ha21), at 5 June in theMDvariety (7.1 t ha21), and at
26May emergence in theLDvariety (6.8 t ha21). For these
emergence dates, relative to historical data, grain yield
of the SD variety was increased by 9% in the B1 and by
27% in the A1F1 scenario. In the MD variety, grain yield
was not different between B1 and historical data, while
it was higher by 14% under A1F1. The simulated grain
FIG. 1. (left) Measured and simulated biomass (kg ha21) of total aboveground biomass (AGB), stem, green leaves,
dead leaves, grain and (right) LAI of (a) SD (Shoternboy-1), (b) MD (Allanga-3), and (c) LD (Mustakillik) rice
varieties seeded on 28 May 2009 and grown under potential production system in Cotton Research Institute, Ur-
gench, Uzbekistan (data from experiment II). Lines are simulated values, and dots are observed values.
2040 JOURNAL OF APPL IED METEOROLOGY AND CL IMATOLOGY VOLUME 52
yields of theLDvarietywere 3%higher in theB1 and 16%
higher in the A1F1 scenario relative to historical data.
Overall, relative to historical data, rice yield could be
increased by 3% (185kgha21) under the B1 scenario and
by 18% (1122kgha21) under the A1F1 scenario, which
corresponds to an increase of about 187 kg 8C21 or
3% 8C21 in grain yield in 2040–69 relative to 1970–99
(Fig. 5). Under both climate change scenarios, grain yield
was significantly higher at 10–20 days after emergence
than at the abovementioned highest-yielding emergence
dates in historical data, that is, highest yields of SD rice at
5–15 July emergence, MD rice at 15–25 June emergence,
and LD rice at 5–15 June emergence.
Under earlier emergence than the highest-yielding
emergence date in the historical data, grain yield was
reduced by 4% under B1 and by 10% under A1F1 in SD
rice, by 14% under B1 and 9% under A1F1 in MD rice,
and by 6%under B1 and 5%underA1F1 scenario in LD
rice. Despite higher grain yield under later emergence
than at the highest-yielding emergence date in the his-
torical data, rice plants in most years could not reach
maturity (not shown in Fig. 5). Under early emergence
FIG. 2. As in Fig. 1, but for (a) SD (Shoternboy-1), (b)MD (Allanga-3), and (c) LD (Mustakillik) rice varieties seeded
on 5 May 2009 at Urgench State University, Urgench, Uzbekistan (data from experiment III).
SEPTEMBER 2013 DEVKOTA ET AL . 2041
dates in the climate change scenarios, grain yield was
more variable in the SD variety, while the LD variety
had consistently higher yields followed by the MD and
SD varieties.
3) SPIKELET STERILITY
In the historical weather data under best emergence
dates, that is, 15–25 June, the average spikelet sterility
for theMD rice variety was 10%and 5%due to high and
low temperatures, respectively (Fig. 6). For this emer-
gence period, spikelet sterility due to high temperature
was higher under climate change scenarios (30% in B1
and 35% in A1F1) than in the historical data, while
spikelet sterility due to low temperature was at par in the
historical data and the climate change scenarios. The
spikelet fertility factor due to high temperature at
early emergence (compared to above-mentioned best
emergence dates) was significantly low under the cli-
mate change scenarios, where it was lowest under
A1F1 followed by B1. In contrast, spikelet sterility due
to low temperature at later emergence than the above-
mentioned best emergence date was highest in historical
data followed by the B1 and A1F1 scenarios. The same
trend was also observed in the SD and LD varieties (data
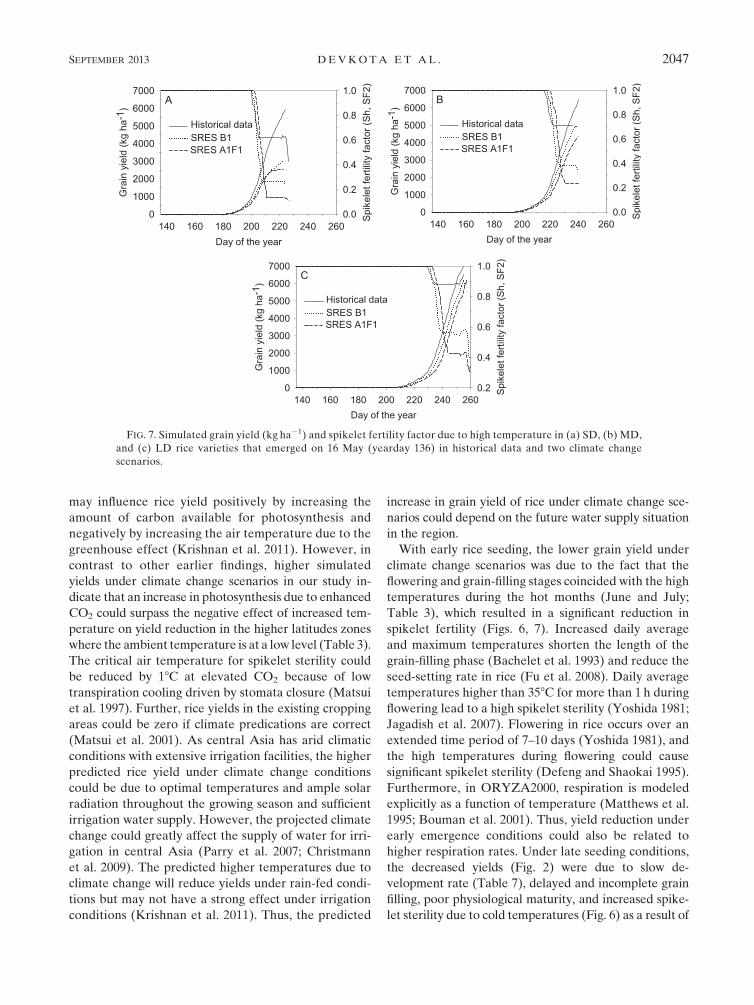
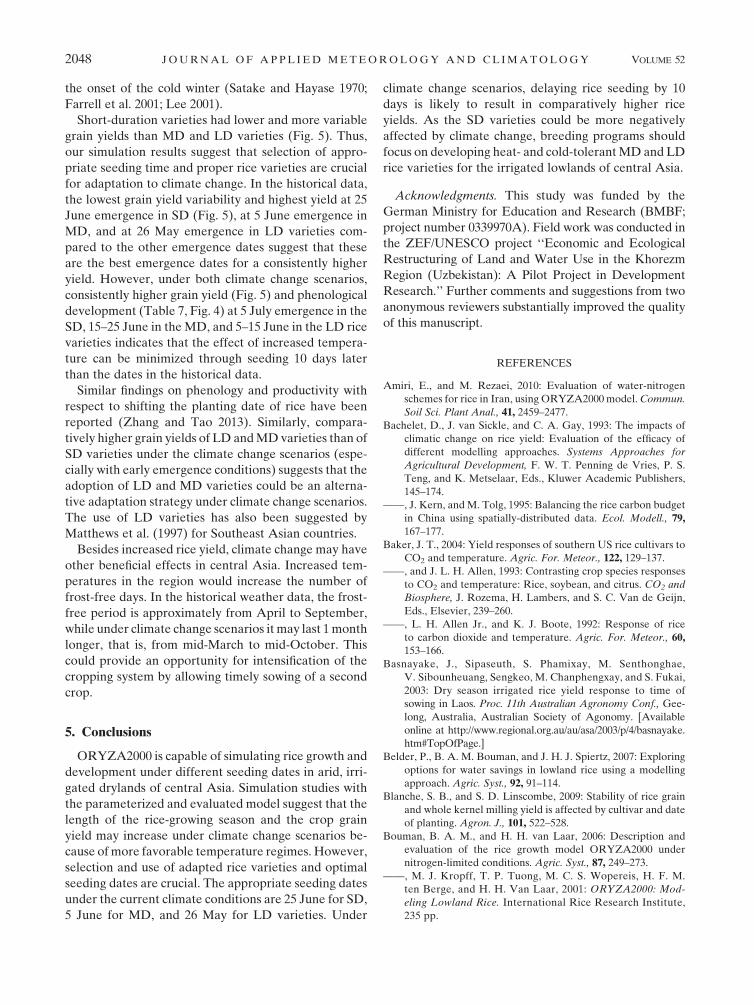
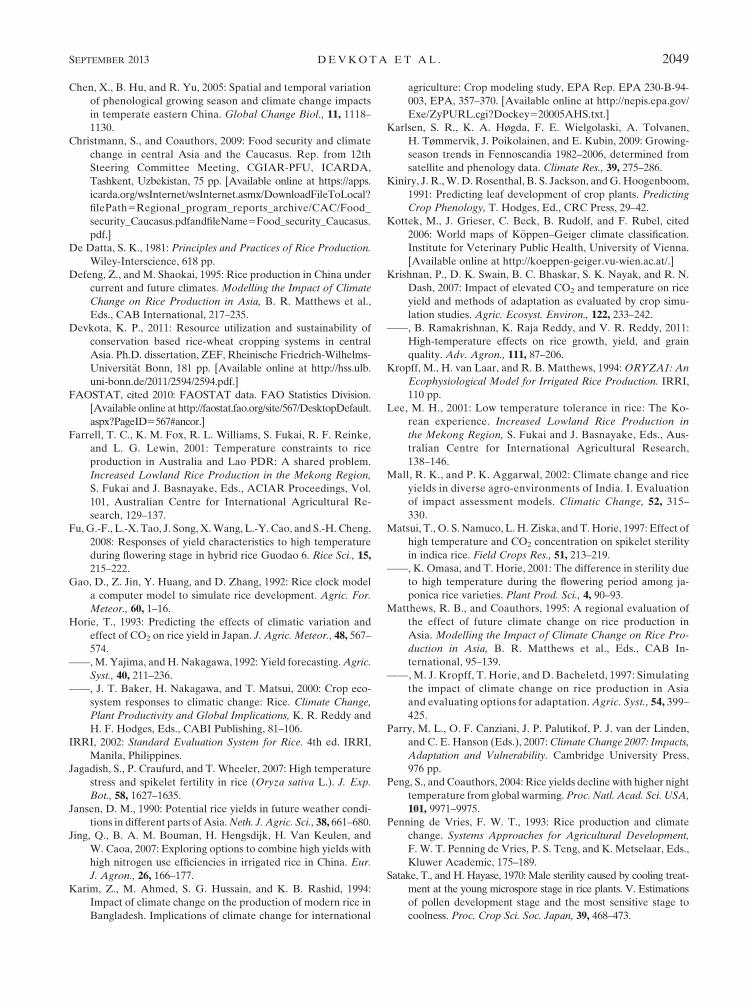
not shown). The grain filling process and spikelet fertility
due to high temperature on one of the early emergence
dates (16May; yearday 136) in three rice varieties is shown
in Fig. 7. In all rice varieties, the spikelet fertility factor was
lowest in A1F1 followed by B1 and historical data.
4. Discussion
In the current version of ORYZA2000, v2.13,
development rates, partitioning factors, relative leaf
growth rate, specific leaf area, leaf death rate, and
fraction of stem reserve coefficients are genotype 3environment3management (G3E3M) parameters,
and therefore, the model needs to be calibrated against
treatments for accurate simulation (Bouman et al.
2001). Also, the model does not produce yield com-
ponents such as panicle density, which limits its appli-
cability to diagnose the causes of different treatment
responses. Therefore, model improvements that in-
corporate development rates and other coefficients
into genetic parameters would be highly desirable
to enable application of the calibrated model across
a wider range of environmental and management
conditions.
The modeled biomass, leaf area index, and pheno-
logical development matched well with the observed
values (Figs. 1–3). The slightly lower measured LAI
than the simulated values could be due to a lower leaf
production (5–8 leaves) (Devkota 2011). In general,
rice varieties have 6–14 green leaves during flowering
(De Datta 1981). The results of the statistical evalua-
tion of model parameterization (Table 5) and valida-
tion (Table 6) are comparable in terms of accuracy with
previous studies (Bouman and van Laar 2006; Belder
et al. 2007), where ORYZA2000 was evaluated in po-
tential production and water- and nitrogen-limited
conditions, mostly in the humid, tropic region of Asia.
Furthermore, the evaluation results of this study are
comparable with those reported for semiarid regions
by Amiri and Rezaei (2010). This suggests that the
model is able to simulate phenological development
and grain yield of rice accurately for arid climate con-
ditions in central Asia. However, under the climate
change scenarios, the temperature during early May
(before 20 May) was higher than the threshold temper-
ature required for emergence (208C), but as the current
version of ORYZA2000 starts simulation only after
emergence (Bouman et al. 2001), the required emer-
gence days under climate change conditions could not be
simulated.
FIG. 3. Simulated vs measured values of (a) periodic and final grain yield and (b) total aboveground biomass
(kg ha21) of SD, MD, and LD rice varieties from experiments I and III. Solid lines are 1:1 relationship. Lines are
simulated values, and symbols are observed values.
2042 JOURNAL OF APPL IED METEOROLOGY AND CL IMATOLOGY VOLUME 52
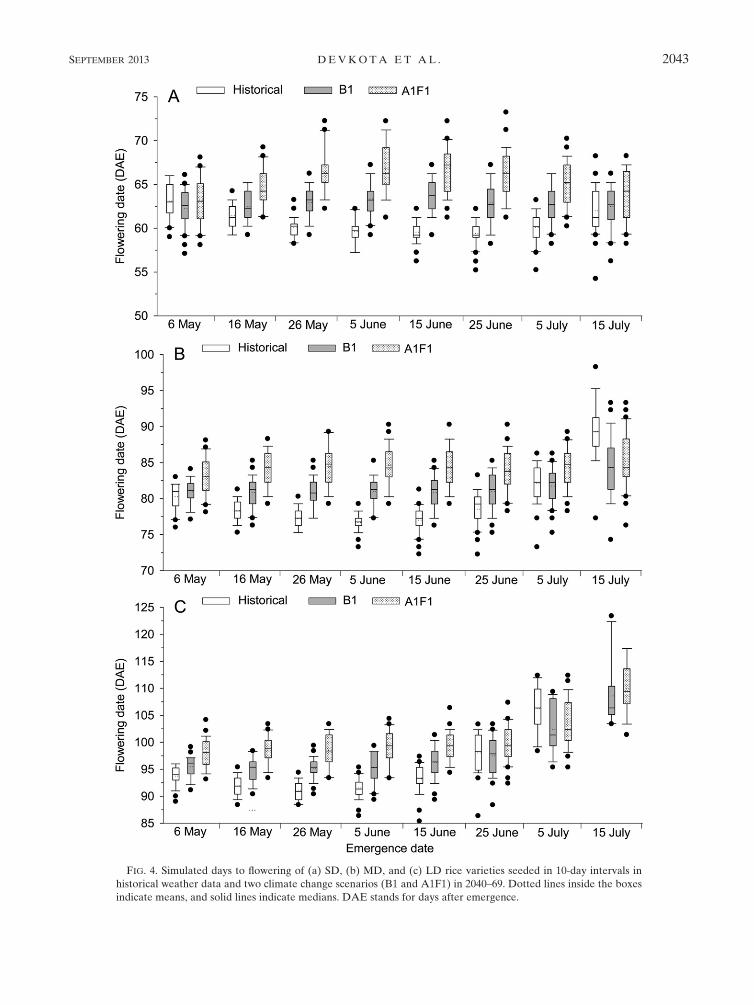
FIG. 4. Simulated days to flowering of (a) SD, (b) MD, and (c) LD rice varieties seeded in 10-day intervals in
historical weather data and two climate change scenarios (B1 and A1F1) in 2040–69. Dotted lines inside the boxes
indicate means, and solid lines indicate medians. DAE stands for days after emergence.
SEPTEMBER 2013 DEVKOTA ET AL . 2043
The projected average temperature of the rice seasons
in 2040–69 would be raised by 2.98C under the B1 and
4.18C under the A1F1 scenarios in central Asia (Table 3).
This would potentially extend the length of the rice-
growing season by around 1 month. The historical data
for 1970–2009 show that, except for June to 10 August,
where the daily maximum temperature exceeds 358C in
70% of the days (50 days out of 70), the daily maximum
temperature remains lower than 358C in other days of
a year. As the study region has an arid climate, minimum
and night temperatures, which generally cause spikelet
sterility and yield reduction in rice (Peng et al. 2004), are
generally low (Table 3). Thus, the projected future cli-
matic conditions (increased temperatures and CO2)
could provide greater opportunities for rice cultivation
and yield increases in the region.
The long duration of seeding to emergence (10–13
days; Table 4) before 20May seeding could be related to
temperatures that were lower than required for emer-
gence. In the 29-yr average (1970–99), the minimum
and average temperatures before 20 May were 148 and208C, respectively (Table 3), and were thus lower than
the critical threshold temperatures required for rice
emergence (Yoshida 1981). Rice requires an average
temperature ofmore than 208C for emergence (Basnayake
et al. 2003).
Previous modeling studies have generally shown that
phenological development rate of rice would be accel-
erated and that the growing period would be shortened
in the future as a result of climatic warming (Chen et al.
2005; Karlsen et al. 2009). However, in agreement with
recent findings (Zhang and Tao 2013), our results reveal
increased growing duration and delayed flowering and
maturity under both B1 and A1F1 scenarios compared
to the historical data. The delayed flowering under the
climate change scenarios (Fig. 4) could be associated
with higher temperatures. For normal heading, rice re-
quires a daily mean temperature of 218–308C (Krishnan
et al. 2011). Under the B1 and A1F1 scenarios, the
predicted mean daily temperature in June, July, and
August could be at or higher than the threshold level
(Table 3). The base, optimum, and maximum tem-
peratures for rice are 88, 308, and 428C, respectively(Gao et al. 1992). The development rate of rice increases
linearly above the base temperature to the optimum
temperature. Beyond the optimum temperature, the
development rate decreases linearly until a maximum
temperature is reached (Kiniry et al. 1991). Below the
base temperature or above the maximum temperature,
the development rate is zero. Furthermore, flowering is
longer at a mean temperature of 338C in comparison to
298C (Matthews et al. 1995). The delayed physiological
maturity of rice (Table 7) under late seeding conditions
with historical data could be related to low tempera-
ture. Generally, low temperature delays heading and
physiological maturity (Krishnan et al. 2011). For
physiological maturity, rice requires a minimum tem-
perature of 128–188C and an optimum temperature of
308C (Yoshida 1981). Because of the extreme aridity
of the climate, even under the climate change scenarios
(increased temperature), the minimum and average
temperatures required for maturity during rice maturing
months (September, and October) are lower than the
threshold temperature for proper maturity (Table 3).
TABLE 7. Number of years in which simulated rice crops did not reach flowering and physiological maturity at different emergence dates
under historical weather data and two climate change scenarios. The NA stands for not affected; numbers in parentheses indicate per-
centage of the year.
Variety Emergence date Historical weather data SRES B1 SRES A1F1
Flowering
Short maturity (SD) All NA NA NA
Medium maturity (MD) 15 Jul 11 (37) 2 (7) NA
Long maturity (LD) 5 Jul 17 (57) 6 (20) 3 (10)
15 Jul 30 (100) 20 (67) 16 (53)
Physiological maturity
Short maturity (SD) 5 Jul 6 (19) 2 (7) NA
15 Jul 26 (86) 10 (33) 7 (23)
Medium maturity (MD) 15 Jun 3 (10) NA NA
25 Jun 18 (60) 9 (30) 7 (23)
5 Jul 30 (100) 24 (80) 19 (63)
15 Jul 30 (100) 30 (100) 30 (100)
Long maturity (LD) 5 Jun 4 (13) 2 (7) NA
15 Jun 24 (80) 13 (43) 10 (33)
25 Jun 30 (100) 25 (83) 21 (69)
5 Jul 30 (100) 30 (100) 30 (100)
15 Jul 30 (100) 30 (100) 30 (100)
2044 JOURNAL OF APPL IED METEOROLOGY AND CL IMATOLOGY VOLUME 52
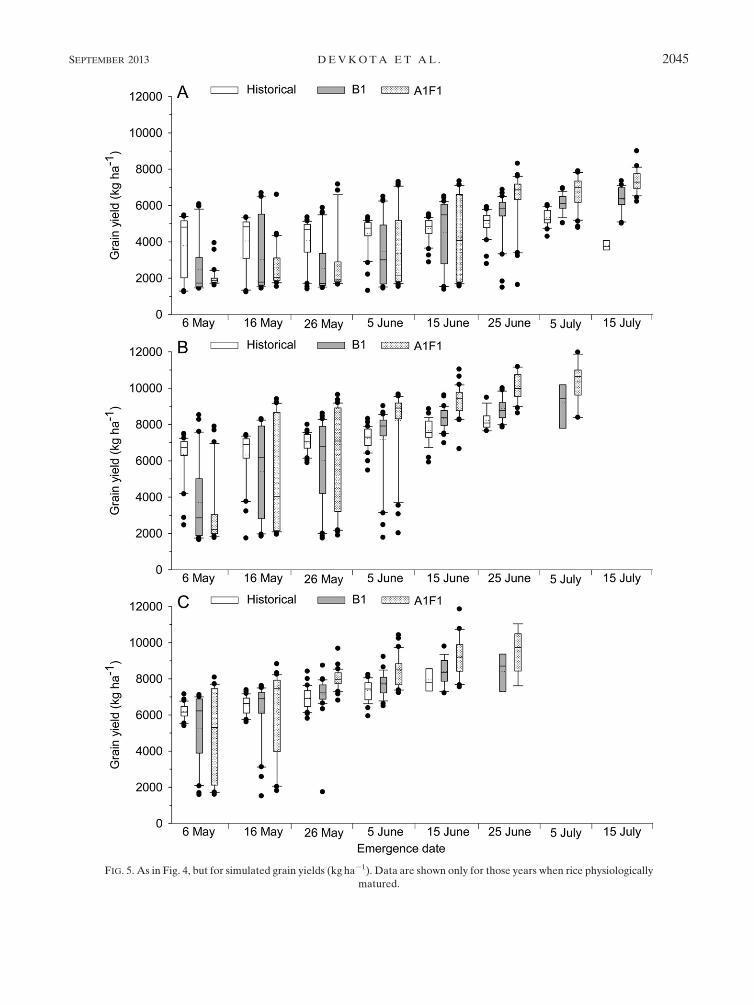
FIG. 5. As in Fig. 4, but for simulated grain yields (kg ha21). Data are shown only for those years when rice physiologically
matured.
SEPTEMBER 2013 DEVKOTA ET AL . 2045
With the best seeding dates with historical data, unlike
many earlier findings (Baker and Allen 1993; Matthews
et al. 1995; Peng et al. 2004; Sheehy et al. 2006), our
findings show no yield reduction in rice under climate
change scenarios in central Asia (0%–9% and 14%–27%
yield increase under B1 and A1F1 scenarios, respec-
tively). However, this is in agreement with observations
in India (Krishnan et al. 2007) and in the United States
(Baker 2004). To date, rice cultivation is mostly concen-
trated in tropical and subtropical regions. In such envi-
ronments, temperatures are already above the optimum
for rice growth (288–228C), and high temperature is al-
ready one of the major environmental stresses limiting
rice productivity (Krishnan et al. 2011). Increasing CO2
FIG. 6. Simulated spikelet fertility factor due to (a) high temperature and (b) low temperature in historical data and under two climate
change scenarios for different emergence dates.
2046 JOURNAL OF APPL IED METEOROLOGY AND CL IMATOLOGY VOLUME 52
may influence rice yield positively by increasing the
amount of carbon available for photosynthesis and
negatively by increasing the air temperature due to the
greenhouse effect (Krishnan et al. 2011). However, in
contrast to other earlier findings, higher simulated
yields under climate change scenarios in our study in-
dicate that an increase in photosynthesis due to enhanced
CO2 could surpass the negative effect of increased tem-
perature on yield reduction in the higher latitudes zones
where the ambient temperature is at a low level (Table 3).
The critical air temperature for spikelet sterility could
be reduced by 18C at elevated CO2 because of low
transpiration cooling driven by stomata closure (Matsui
et al. 1997). Further, rice yields in the existing cropping
areas could be zero if climate predications are correct
(Matsui et al. 2001). As central Asia has arid climatic
conditions with extensive irrigation facilities, the higher
predicted rice yield under climate change conditions
could be due to optimal temperatures and ample solar
radiation throughout the growing season and sufficient
irrigation water supply. However, the projected climate
change could greatly affect the supply of water for irri-
gation in central Asia (Parry et al. 2007; Christmann
et al. 2009). The predicted higher temperatures due to
climate change will reduce yields under rain-fed condi-
tions but may not have a strong effect under irrigation
conditions (Krishnan et al. 2011). Thus, the predicted
increase in grain yield of rice under climate change sce-
narios could depend on the future water supply situation
in the region.
With early rice seeding, the lower grain yield under
climate change scenarios was due to the fact that the
flowering and grain-filling stages coincided with the high
temperatures during the hot months (June and July;
Table 3), which resulted in a significant reduction in
spikelet fertility (Figs. 6, 7). Increased daily average
and maximum temperatures shorten the length of the
grain-filling phase (Bachelet et al. 1993) and reduce the
seed-setting rate in rice (Fu et al. 2008). Daily average
temperatures higher than 358C for more than 1 h during
flowering lead to a high spikelet sterility (Yoshida 1981;
Jagadish et al. 2007). Flowering in rice occurs over an
extended time period of 7–10 days (Yoshida 1981), and
the high temperatures during flowering could cause
significant spikelet sterility (Defeng and Shaokai 1995).
Furthermore, in ORYZA2000, respiration is modeled
explicitly as a function of temperature (Matthews et al.
1995; Bouman et al. 2001). Thus, yield reduction under
early emergence conditions could also be related to
higher respiration rates. Under late seeding conditions,
the decreased yields (Fig. 2) were due to slow de-
velopment rate (Table 7), delayed and incomplete grain
filling, poor physiological maturity, and increased spike-
let sterility due to cold temperatures (Fig. 6) as a result of
FIG. 7. Simulated grain yield (kg ha21) and spikelet fertility factor due to high temperature in (a) SD, (b) MD,
and (c) LD rice varieties that emerged on 16 May (yearday 136) in historical data and two climate change
scenarios.
SEPTEMBER 2013 DEVKOTA ET AL . 2047
the onset of the cold winter (Satake and Hayase 1970;
Farrell et al. 2001; Lee 2001).
Short-duration varieties had lower and more variable
grain yields than MD and LD varieties (Fig. 5). Thus,
our simulation results suggest that selection of appro-
priate seeding time and proper rice varieties are crucial
for adaptation to climate change. In the historical data,
the lowest grain yield variability and highest yield at 25
June emergence in SD (Fig. 5), at 5 June emergence in
MD, and at 26 May emergence in LD varieties com-
pared to the other emergence dates suggest that these
are the best emergence dates for a consistently higher
yield. However, under both climate change scenarios,
consistently higher grain yield (Fig. 5) and phenological
development (Table 7, Fig. 4) at 5 July emergence in the
SD, 15–25 June in theMD, and 5–15 June in the LD rice
varieties indicates that the effect of increased tempera-
ture can be minimized through seeding 10 days later
than the dates in the historical data.
Similar findings on phenology and productivity with
respect to shifting the planting date of rice have been
reported (Zhang and Tao 2013). Similarly, compara-
tively higher grain yields of LD andMDvarieties than of
SD varieties under the climate change scenarios (espe-
cially with early emergence conditions) suggests that the
adoption of LD and MD varieties could be an alterna-
tive adaptation strategy under climate change scenarios.
The use of LD varieties has also been suggested by
Matthews et al. (1997) for Southeast Asian countries.
Besides increased rice yield, climate change may have
other beneficial effects in central Asia. Increased tem-
peratures in the region would increase the number of
frost-free days. In the historical weather data, the frost-
free period is approximately from April to September,
while under climate change scenarios it may last 1month
longer, that is, from mid-March to mid-October. This
could provide an opportunity for intensification of the
cropping system by allowing timely sowing of a second
crop.
5. Conclusions
ORYZA2000 is capable of simulating rice growth and
development under different seeding dates in arid, irri-
gated drylands of central Asia. Simulation studies with
the parameterized and evaluated model suggest that the
length of the rice-growing season and the crop grain
yield may increase under climate change scenarios be-
cause ofmore favorable temperature regimes. However,
selection and use of adapted rice varieties and optimal
seeding dates are crucial. The appropriate seeding dates
under the current climate conditions are 25 June for SD,
5 June for MD, and 26 May for LD varieties. Under
climate change scenarios, delaying rice seeding by 10
days is likely to result in comparatively higher rice
yields. As the SD varieties could be more negatively
affected by climate change, breeding programs should
focus on developing heat- and cold-tolerantMD and LD
rice varieties for the irrigated lowlands of central Asia.
Acknowledgments. This study was funded by the
German Ministry for Education and Research (BMBF;
project number 0339970A). Field work was conducted in
the ZEF/UNESCO project ‘‘Economic and Ecological
Restructuring of Land and Water Use in the Khorezm
Region (Uzbekistan): A Pilot Project in Development
Research.’’ Further comments and suggestions from two
anonymous reviewers substantially improved the quality
of this manuscript.
REFERENCES
Amiri, E., and M. Rezaei, 2010: Evaluation of water-nitrogen
schemes for rice in Iran, using ORYZA2000model.Commun.
Soil Sci. Plant Anal., 41, 2459–2477.
Bachelet, D., J. van Sickle, and C. A. Gay, 1993: The impacts of
climatic change on rice yield: Evaluation of the efficacy of
different modelling approaches. Systems Approaches for
Agricultural Development, F. W. T. Penning de Vries, P. S.
Teng, and K. Metselaar, Eds., Kluwer Academic Publishers,
145–174.
——, J. Kern, and M. Tolg, 1995: Balancing the rice carbon budget
in China using spatially-distributed data. Ecol. Modell., 79,
167–177.
Baker, J. T., 2004: Yield responses of southern US rice cultivars to
CO2 and temperature. Agric. For. Meteor., 122, 129–137.
——, and J. L. H. Allen, 1993: Contrasting crop species responses
to CO2 and temperature: Rice, soybean, and citrus. CO2 and
Biosphere, J. Rozema, H. Lambers, and S. C. Van de Geijn,
Eds., Elsevier, 239–260.
——, L. H. Allen Jr., and K. J. Boote, 1992: Response of rice
to carbon dioxide and temperature. Agric. For. Meteor., 60,153–166.
Basnayake, J., Sipaseuth, S. Phamixay, M. Senthonghae,
V. Sibounheuang, Sengkeo, M. Chanphengxay, and S. Fukai,
2003: Dry season irrigated rice yield response to time of
sowing in Laos. Proc. 11th Australian Agronomy Conf., Gee-
long, Australia, Australian Society of Agonomy. [Available
online at http://www.regional.org.au/au/asa/2003/p/4/basnayake.
htm#TopOfPage.]
Belder, P., B. A. M. Bouman, and J. H. J. Spiertz, 2007: Exploring
options for water savings in lowland rice using a modelling
approach. Agric. Syst., 92, 91–114.Blanche, S. B., and S. D. Linscombe, 2009: Stability of rice grain
and whole kernel milling yield is affected by cultivar and date
of planting. Agron. J., 101, 522–528.
Bouman, B. A. M., and H. H. van Laar, 2006: Description and
evaluation of the rice growth model ORYZA2000 under
nitrogen-limited conditions. Agric. Syst., 87, 249–273.
——, M. J. Kropff, T. P. Tuong, M. C. S. Wopereis, H. F. M.
ten Berge, and H. H. Van Laar, 2001: ORYZA2000: Mod-
eling Lowland Rice. International Rice Research Institute,
235 pp.
2048 JOURNAL OF APPL IED METEOROLOGY AND CL IMATOLOGY VOLUME 52
Chen, X., B. Hu, and R. Yu, 2005: Spatial and temporal variation
of phenological growing season and climate change impacts
in temperate eastern China. Global Change Biol., 11, 1118–
1130.
Christmann, S., and Coauthors, 2009: Food security and climate
change in central Asia and the Caucasus. Rep. from 12th
Steering Committee Meeting, CGIAR-PFU, ICARDA,
Tashkent, Uzbekistan, 75 pp. [Available online at https://apps.
icarda.org/wsInternet/wsInternet.asmx/DownloadFileToLocal?
filePath5Regional_program_reports_archive/CAC/Food_
security_Caucasus.pdfandfileName5Food_security_Caucasus.
pdf.]
De Datta, S. K., 1981: Principles and Practices of Rice Production.
Wiley-Interscience, 618 pp.
Defeng, Z., and M. Shaokai, 1995: Rice production in China under
current and future climates. Modelling the Impact of Climate
Change on Rice Production in Asia, B. R. Matthews et al.,
Eds., CAB International, 217–235.
Devkota, K. P., 2011: Resource utilization and sustainability of
conservation based rice-wheat cropping systems in central
Asia. Ph.D. dissertation, ZEF, Rheinische Friedrich-Wilhelms-
Universit€at Bonn, 181 pp. [Available online at http://hss.ulb.
uni-bonn.de/2011/2594/2594.pdf.]
FAOSTAT, cited 2010: FAOSTAT data. FAO Statistics Division.
[Available online at http://faostat.fao.org/site/567/DesktopDefault.
aspx?PageID5567#ancor.]
Farrell, T. C., K. M. Fox, R. L. Williams, S. Fukai, R. F. Reinke,
and L. G. Lewin, 2001: Temperature constraints to rice
production in Australia and Lao PDR: A shared problem.
Increased Lowland Rice Production in the Mekong Region,
S. Fukai and J. Basnayake, Eds., ACIAR Proceedings, Vol.
101, Australian Centre for International Agricultural Re-
search, 129–137.
Fu, G.-F., L.-X. Tao, J. Song, X.Wang, L.-Y. Cao, and S.-H. Cheng,
2008: Responses of yield characteristics to high temperature
during flowering stage in hybrid rice Guodao 6. Rice Sci., 15,
215–222.
Gao, D., Z. Jin, Y. Huang, and D. Zhang, 1992: Rice clock model
a computer model to simulate rice development. Agric. For.
Meteor., 60, 1–16.
Horie, T., 1993: Predicting the effects of climatic variation and
effect of CO2 on rice yield in Japan. J. Agric. Meteor., 48, 567–
574.
——,M. Yajima, andH. Nakagawa, 1992: Yield forecasting.Agric.
Syst., 40, 211–236.——, J. T. Baker, H. Nakagawa, and T. Matsui, 2000: Crop eco-
system responses to climatic change: Rice. Climate Change,
Plant Productivity and Global Implications, K. R. Reddy and
H. F. Hodges, Eds., CABI Publishing, 81–106.
IRRI, 2002: Standard Evaluation System for Rice. 4th ed. IRRI,
Manila, Philippines.
Jagadish, S., P. Craufurd, and T. Wheeler, 2007: High temperature
stress and spikelet fertility in rice (Oryza sativa L.). J. Exp.
Bot., 58, 1627–1635.
Jansen, D. M., 1990: Potential rice yields in future weather condi-
tions in different parts of Asia.Neth. J. Agric. Sci., 38, 661–680.
Jing, Q., B. A. M. Bouman, H. Hengsdijk, H. Van Keulen, and
W. Caoa, 2007: Exploring options to combine high yields with
high nitrogen use efficiencies in irrigated rice in China. Eur.
J. Agron., 26, 166–177.
Karim, Z., M. Ahmed, S. G. Hussain, and K. B. Rashid, 1994:
Impact of climate change on the production of modern rice in
Bangladesh. Implications of climate change for international
agriculture: Crop modeling study, EPA Rep. EPA 230-B-94-
003, EPA, 357–370. [Available online at http://nepis.epa.gov/
Exe/ZyPURL.cgi?Dockey520005AHS.txt.]
Karlsen, S. R., K. A. Høgda, F. E. Wielgolaski, A. Tolvanen,
H. Tømmervik, J. Poikolainen, and E. Kubin, 2009: Growing-
season trends in Fennoscandia 1982–2006, determined from
satellite and phenology data. Climate Res., 39, 275–286.
Kiniry, J. R.,W. D. Rosenthal, B. S. Jackson, andG. Hoogenboom,
1991: Predicting leaf development of crop plants. Predicting
Crop Phenology, T. Hodges, Ed., CRC Press, 29–42.
Kottek, M., J. Grieser, C. Beck, B. Rudolf, and F. Rubel, cited
2006: World maps of K€oppen–Geiger climate classification.
Institute for Veterinary Public Health, University of Vienna.
[Available online at http://koeppen-geiger.vu-wien.ac.at/.]
Krishnan, P., D. K. Swain, B. C. Bhaskar, S. K. Nayak, and R. N.
Dash, 2007: Impact of elevated CO2 and temperature on rice
yield and methods of adaptation as evaluated by crop simu-
lation studies. Agric. Ecosyst. Environ., 122, 233–242.
——, B. Ramakrishnan, K. Raja Reddy, and V. R. Reddy, 2011:
High-temperature effects on rice growth, yield, and grain
quality. Adv. Agron., 111, 87–206.
Kropff, M., H. van Laar, and R. B. Matthews, 1994:ORYZA1: An
Ecophysiological Model for Irrigated Rice Production. IRRI,
110 pp.
Lee, M. H., 2001: Low temperature tolerance in rice: The Ko-
rean experience. Increased Lowland Rice Production in
the Mekong Region, S. Fukai and J. Basnayake, Eds., Aus-
tralian Centre for International Agricultural Research,
138–146.
Mall, R. K., and P. K. Aggarwal, 2002: Climate change and rice
yields in diverse agro-environments of India. I. Evaluation
of impact assessment models. Climatic Change, 52, 315–
330.
Matsui, T., O. S. Namuco, L. H. Ziska, and T. Horie, 1997: Effect of
high temperature and CO2 concentration on spikelet sterility
in indica rice. Field Crops Res., 51, 213–219.
——, K. Omasa, and T. Horie, 2001: The difference in sterility due
to high temperature during the flowering period among ja-
ponica rice varieties. Plant Prod. Sci., 4, 90–93.
Matthews, R. B., and Coauthors, 1995: A regional evaluation of
the effect of future climate change on rice production in
Asia. Modelling the Impact of Climate Change on Rice Pro-
duction in Asia, B. R. Matthews et al., Eds., CAB In-
ternational, 95–139.
——,M. J. Kropff, T. Horie, and D. Bacheletd, 1997: Simulating
the impact of climate change on rice production in Asia
and evaluating options for adaptation.Agric. Syst., 54, 399–
425.
Parry, M. L., O. F. Canziani, J. P. Palutikof, P. J. van der Linden,
and C. E. Hanson (Eds.), 2007:Climate Change 2007: Impacts,
Adaptation and Vulnerability. Cambridge University Press,
976 pp.
Peng, S., and Coauthors, 2004: Rice yields decline with higher night
temperature from global warming.Proc. Natl. Acad. Sci. USA,
101, 9971–9975.Penning de Vries, F. W. T., 1993: Rice production and climate
change. Systems Approaches for Agricultural Development,
F. W. T. Penning de Vries, P. S. Teng, and K. Metselaar, Eds.,
Kluwer Academic, 175–189.
Satake, T., and H. Hayase, 1970: Male sterility caused by cooling treat-
ment at the young microspore stage in rice plants. V. Estimations
of pollen development stage and the most sensitive stage to
coolness. Proc. Crop Sci. Soc. Japan, 39, 468–473.
SEPTEMBER 2013 DEVKOTA ET AL . 2049

——, and S. Yoshida, 1978: High temperature-induced sterility in
indica rice at flowering. Japanese J. Crop Sci., 47, 6–17.
Sheehy, J. E., P. L. Mitchell, and A. B. Ferrer, 2006: Decline in rice
grain yields with temperature: Models and correlations can
give different estimates. Field Crops Res., 98, 151–156.
Shen, S. H., S. B. Yang, Y. X. Zhao, Y. L. Xu, X. Y. Zhao, Z. Y.
Wang, J. Liu, andW.W. Zhang, 2011: Simulating the rice yield
change in the middle and lower reaches of the Yangtze River
under SRES B2 scenario. Acta Ecol. Sin., 31, 40–48.
Wassmann, R., and Coauthors, 2009: Climate change affecting rice
production: The physiological and agronomic basis for possi-
ble adaptation strategies. Adv. Agron., 101, 59–122.
Yoshida, S., 1981: Fundamentals of Rice Crop Science. Inter-
national Rice Research Institute, 269 pp.
Zhang, S., and F. Tao, 2013: Modeling the response of rice
phenology to climate change and variability in different cli-
matic zones: Comparisons of five models. Eur. J. Agron., 45,165–176.
2050 JOURNAL OF APPL IED METEOROLOGY AND CL IMATOLOGY VOLUME 52
Copyright © 2022 FDOKUMEN