
Simulating the evolution of soil solutions in irrigated rice soils in the Sahel
96
Elsevier Editorial System(tm) for Geoderma Manuscript Draft Manuscript Number: GEODER4246R1 Title: Simulating the evolution of soil solutions in irrigated rice soils in the Sahel. Article Type: Research Paper Section/Category: Soil Chemistry and Biogeochemistry Keywords: alkalinization; sodication; Phreeqc; plant uptake; water management; West Africa Corresponding Author: Dr Claude Hammecker, Ph.D. Corresponding Author's Institution: Institut de Recherche pour le Développement - LDD First Author: Claude Hammecker, PhD Order of Authors: Claude Hammecker, PhD; Piet van Asten, PhD; Serge Marlet, PhD; Jean-Luc Maeght, Master Sc; Roland Poss, PhD Abstract: In sahelian countries, agriculture often relies on irrigation especially for rice cropping which has been introduced these last decades. As most of the water resources used for irrigation (mainly rivers and lakes) have an alkaline composition, rice cropping is often held as responsible for soil alkalinization. In order to evaluate the probability for this process to occur, we studied 3 different sites in West Africa where numerical simulation of the geochemical interactions between soil, irrigation water and groundwater were performed with PHREEQC. It was possible to simulate the evaporation of the ponding water, the mixing between groundwater and irrigation water, the lateral drainage (flushing) and the leaching, and finally the management of the crop residues. By performing prospective simulations over 60 cropping cycles it has been shown that soil alkalinization and sodication are not inevitable in these area especially if the cropping is properly managed. Moreover, when straw is removed and the plot flushed before the new cropping season, alkaline soils can even be improved with rice cropping. ird-00396823, version 1 - 19 Jun 2009 Author manuscript, published in "Geoderma 150, 1-2 (2009) 129-140" DOI : 10.1016/j.geoderma.2008.12.024
Transcript of Simulating the evolution of soil solutions in irrigated rice soils in the Sahel
Elsevier Editorial System(tm) for Geoderma
Manuscript Draft
Manuscript Number: GEODER4246R1
Title: Simulating the evolution of soil solutions in irrigated rice soils in the Sahel.
Article Type: Research Paper
Section/Category: Soil Chemistry and Biogeochemistry
Keywords: alkalinization; sodication; Phreeqc; plant uptake; water management; West Africa
Corresponding Author: Dr Claude Hammecker, Ph.D.
Corresponding Author's Institution: Institut de Recherche pour le Développement - LDD
First Author: Claude Hammecker, PhD
Order of Authors: Claude Hammecker, PhD; Piet van Asten, PhD; Serge Marlet, PhD; Jean-Luc
Maeght, Master Sc; Roland Poss, PhD
Abstract: In sahelian countries, agriculture often relies on irrigation especially for rice cropping
which has been introduced these last decades. As most of the water resources used for irrigation
(mainly rivers and lakes) have an alkaline composition, rice cropping is often held as responsible
for soil alkalinization. In order to evaluate the probability for this process to occur, we studied 3
different sites in West Africa where numerical simulation of the geochemical interactions between
soil, irrigation water and groundwater were performed with PHREEQC. It was possible to simulate
the evaporation of the ponding water, the mixing between groundwater and irrigation water, the
lateral drainage (flushing) and the leaching, and finally the management of the crop residues. By
performing prospective simulations over 60 cropping cycles it has been shown that soil
alkalinization and sodication are not inevitable in these area especially if the cropping is properly
managed. Moreover, when straw is removed and the plot flushed before the new cropping season,
alkaline soils can even be improved with rice cropping.
ird-0
0396
823,
ver
sion
1 -
19 J
un 2
009
Author manuscript, published in "Geoderma 150, 1-2 (2009) 129-140" DOI : 10.1016/j.geoderma.2008.12.024

ird-0
0396
823,
ver
sion
1 -
19 J
un 2
009

1 2 3 4 5 6 7 8 9 10 11 12 13 14 15 16 17 18 19 20 21 22 23 24 25 26 27 28 29 30 31 32 33 34 35 36 37 38 39 40 41 42 43 44 45 46 47 48 49 50 51 52 53 54 55 56 57 58 59 60 61 62 63 64 65
1
Simulating the evolution of soil solutions in irrigated rice soils in the Sahel.
Claude Hammeckera, Piet van Astenb e, Serge Marletc, Jean-Luc Maeghta and Roland Possd.
a Institut de Recherche pour le Développement UR 176, Land Development Department,
Office of Science for Land Development, Pahonyothin Road, Chatuchak, Bangkok 10900, Thailand
b WARDA, The Africa Rice Center, BP 96, St.Louis, Senegal.
C CIRAD, UMR G-EAU, Avenue Agropolis, 34398 Montpellier Cedex 5, France
d Institut de Recherche pour le Développement UR 176, SupAgro, 2 place Viala, 34060 Montpellier
cedex 1, France
e present address : IITA- ESARC P.O.Box 7878 Kampala, Uganda
ManuscriptClick here to download Manuscript: pubchim3-3c3.doc Click here to view linked References
ird-0
0396
823,
ver
sion
1 -
19 J
un 2
009

1 2 3 4 5 6 7 8 9 10 11 12 13 14 15 16 17 18 19 20 21 22 23 24 25 26 27 28 29 30 31 32 33 34 35 36 37 38 39 40 41 42 43 44 45 46 47 48 49 50 51 52 53 54 55 56 57 58 59 60 61 62 63 64 65
2
Abstract
In sahelian countries, agriculture often relies on irrigation especially for rice cropping which has
been introduced these last decades. As most of the water resources used for irrigation (mainly rivers
and lakes) have an alkaline composition, rice cropping is often held as responsible for soil
alkalinization. In order to evaluate the probability for this process to occur, we studied 3 different
sites in West Africa where numerical simulation of the geochemical interactions between soil,
irrigation water and groundwater were performed with PHREEQC. It was possible to simulate the
evaporation of the ponding water, the mixing between groundwater and irrigation water, the lateral
drainage (flushing) and the leaching, and finally the management of the crop residues. By
performing prospective simulations over 60 cropping cycles it has been shown that soil
alkalinization and sodication are not inevitable in these area especially if the cropping is properly
managed. Moreover, when straw is removed and the plot flushed before the new cropping season,
alkaline soils can even be improved with rice cropping.
Keywords : alkalinization, sodication, PHREEQC, plant uptake, water management, West Africa
ird-0
0396
823,
ver
sion
1 -
19 J
un 2
009
1 2 3 4 5 6 7 8 9 10 11 12 13 14 15 16 17 18 19 20 21 22 23 24 25 26 27 28 29 30 31 32 33 34 35 36 37 38 39 40 41 42 43 44 45 46 47 48 49 50 51 52 53 54 55 56 57 58 59 60 61 62 63 64 65
3
Introduction
In the Sahel, irrigated rice (Oryza Sativa L.) cropping has been introduced on a wide scale during
the last 20 years. The construction of large (> 100 ha) and costly irrigation schemes were intended
to increase food security and provide income for Sahelian farmers, whose crops and livestock were
devastated during the droughts in the 1970-1980’s. Irrigated rice cropping in the hot and dry
Sahelian climate seems like a paradox. However, the major Sahelian rivers and some large artificial
reservoirs provide more than sufficient water to support current irrigation activities throughout the
year. Although most Sahelian irrigation waters contain relatively little salt, they usually show
alkaline compositions, where alkalinity (Alk.) is the dominant aqueous species. It is defined as the
algebraic sum of the strong base cation and strong acid anion equivalents (Stumm and Morgan,
1970), and can be expressed as : Alk. = (HCO3-)+ (CO3
2-) +(OH-) - (H+) , where ( ) denote the total
concentration in molc l-1 . Moreover most of the Sahelian irrigation waters, show also a positive
calcite residual alkalinity (RAcalcite) which corresponds to the alkalinity of the solution after
precipitation of calcite : RAcalcite = Alk. – (Ca2+), (Valles et al., 1991; Bertrand et al., 1993). RAcalcite
has also been shown to be a conservative tracer of the soil solution ( Ribolzi et al., 1996; Barbiero et
al., 2001; Barbiero et al., 2004). Even the residual sodium carbonate, defined as RSC = Alk. –
(Ca2+) - (Mg2+) ; which corresponds to the alkalinity of the solution after calcite and Mg-carbonate
or Mg-silicate precipitation, is positive for these solutions and is an indicator of potential
alkalinization and sodication (Eaton, 1950; Hardie and Eugster, 1970; Van Beek and Van Breemen,
1973; Al Droubi et al.,1980). Continuous concentration of such waters in the soil root zone may
lead to the formation of alkaline and sodic soils, showing both high pH values and high
exchangeable sodium percentage : ESP = XNa+ / CEC , where XNa+ is the exchangeable Na+ and
CEC the total cation exchange capacity. Such soils are less productive because of the pH-induced
loss or low availability of several plant nutrients (e.g. Fe, P, Zn) and poor physical properties of the
ird-0
0396
823,
ver
sion
1 -
19 J
un 2
009
1 2 3 4 5 6 7 8 9 10 11 12 13 14 15 16 17 18 19 20 21 22 23 24 25 26 27 28 29 30 31 32 33 34 35 36 37 38 39 40 41 42 43 44 45 46 47 48 49 50 51 52 53 54 55 56 57 58 59 60 61 62 63 64 65
4
sodic horizon (Abrol et al., 1988).
Whether or not large quantities of alkaline salts will accumulate in the soil root zone depends
largely on the water balance of the root zone. Evapotranspiration in the Sahelian climate can be
very large and regularly exceeds rates of 10 mm day-1 in the dry season (November – May) when
maximum temperatures reach 40 to 45 °C (Van Asten et al., 2003, Hammecker et al., 2003). In most
irrigation schemes, percolation rates are very low (< 4 mm day-1) (Condom, 2000 ; Hammecker et
al., 2003 ; Van Asten, unpublished), due to the low hydraulic conductivity of the clayey soils and air
entrapment (Hammecker et al., 2003). In the course of the cropping season, percolation rates can
further decrease if groundwater levels reach the soil surface. The combination of large
evapotranspiration and small percolation can lead to the excessive build up of alkaline salts in the
long run.
Recent studies have shown that the current soil alkalinity and sodicity problems in Sahelian
irrigation schemes are primarily caused by salts that originate from the parent material (Barbiero
and Van Vliet-Lanoe, 1998, Van Asten et al., 2004), or that accumulated as a result of long-time
irrigation of non-flooded crops in combination with shallow saline groundwater levels. Hence, these
salts were already in the soils before irrigated rice cropping was introduced and there is little
indication that the recent introduction of irrigated rice cropping contributed to a significant increase
in the salt content of these soils (van Asten, 2003). Moreover, most rice soils have the capacity to
buffer an increase in soil solution alkalinity through desorption of exchangeable Ca2+ and the
subsequent precipitation of calcite. However, although this buffer capacity is large, it is not infinite.
Consequently, it still remains uncertain whether current irrigation practices will not lead to soil
alkalinization and sodication in the long run (i.e. some decades) in areas where salts added through
irrigation can not sufficiently be leached or evacuated from the soil root zone. Given the high
investment costs of irrigated agriculture and the high costs of reversing alkalinization and
sodication processes, it is important to know whether current or alternative crop and water
ird-0
0396
823,
ver
sion
1 -
19 J
un 2
009

1 2 3 4 5 6 7 8 9 10 11 12 13 14 15 16 17 18 19 20 21 22 23 24 25 26 27 28 29 30 31 32 33 34 35 36 37 38 39 40 41 42 43 44 45 46 47 48 49 50 51 52 53 54 55 56 57 58 59 60 61 62 63 64 65
5
management will lead to the degradation of one of the Sahel’s most productive crop system.
In this study, we focus on three Sahelian irrigation situations, inside irrigation schemes, that differ
distinctly in terms of parent material, soil water balance and irrigation water quality. All sites have
earlier been subject of studies on soil and water quality (Hammecker and Maeght, 1999; Boivin et
al., 2002; Van Asten, 2003). Therefore, mean values for basic crop, water and soils parameters are
already available. Taking into account some of the most important chemical and hydrological
features, we tried to simulate how soils and soil solutions would evolve over time, under current
and alternative land management practices at the three sites. The most critical parameter; i.e. the
ratio between leached and irrigated solution volume, is the leaching fraction (LF) whether with
vertical drainage or lateral drainage (flushing). In order to account for spatial variability within the
irrigation schemes, we calculated soil solution evolution for different leaching fractions. This
approach allows for the identification of the minimum leaching fraction that is required, in order to
prevent soil degradation in the long run. Proton excretion (or alkalinity uptake) by the rice plant can
also contribute significantly to the alkalinity balance of the soil root zone (Van Asten et al., 2004)
and was also taken into account.
The objectives of this study are: (i) to give an overview of basic soil and water parameters for a
range of Sahelian irrigation schemes, (ii) to simulate soil evolution under current and alternative
crop and water management practices, and (iii) to identify the minimum leaching fraction that is
required to prevent soil degradation in the long term.
2. Material and methods
2.1.Study sites
ird-0
0396
823,
ver
sion
1 -
19 J
un 2
009
1 2 3 4 5 6 7 8 9 10 11 12 13 14 15 16 17 18 19 20 21 22 23 24 25 26 27 28 29 30 31 32 33 34 35 36 37 38 39 40 41 42 43 44 45 46 47 48 49 50 51 52 53 54 55 56 57 58 59 60 61 62 63 64 65
6
This study is based on data collected in three different irrigation areas in West Africa located in the
valley of River Senegal, the Gorgol noir and in the valley of river Niger, where irrigated rice
cropping is the main agricultural activity.
These sites are representative of most of the conditions where rice-cropping cultivation is observed
in the Sahel, and are representative of different geological, geomorphological and pedological
siuations with different soil textures. They are representative of (i) silty clay loam soils, developed
on crystalline bedrock (Foum Gleita), (ii) alluvial levees with loamy sand soils (Niono) and (iii)
alluvial basin with clayey vertisol (Donaye).
2.1.1.Foum Gleïta
The 'Mauritanides' geological region where Foum Gleita is located, is representative of the Pan-
African orogenic belt which has been folded and lifted in the Appalachian era (Carité, 1989) and is
consisting of metamorphic rocks, mainly greenschists, calcshists, micaschists and quartz, and
secondary intrusions of dolerite, on which pedogenesis developed alkaline soils.
The Foum Gleita irrigation scheme is located in central southern Mauritania (N16°08’; W12°46’).
The scheme was constructed between 1985 and 1989, with a surface area of 1950 ha. Irrigation
water originates from a large artificial lake that formed behind a dam in the Gorgol Noir river.
Irrigation and drainage are gravimetric but the drainage canals are often not functional due to poor
maintenance. Most soils in Foum Gleita have formed from the schist parent rock that can be found
at shallow depths (< 2.5m) (Van Asten et al., 2003). Soil texture is mostly silty clay loam, with
around 30% clay. Although no specific clay mineralogical studies have been done in the Foum
Gleita schemes, other studies in the Gorgol basin have shown that a large proportion of the clays are
illites and kaolinites (Maignien, 1961; Audry, 1961). The soils have a moderate to strong structure,
varying from subangular blocky to prismatic in the more vertic soils. Biological activity in these
soils is generally high. The porosity of the soils is generally medium to high, but is distinctly lower
ird-0
0396
823,
ver
sion
1 -
19 J
un 2
009

1 2 3 4 5 6 7 8 9 10 11 12 13 14 15 16 17 18 19 20 21 22 23 24 25 26 27 28 29 30 31 32 33 34 35 36 37 38 39 40 41 42 43 44 45 46 47 48 49 50 51 52 53 54 55 56 57 58 59 60 61 62 63 64 65
7
near soil surface. Although some soils have high ESP values, up to 65%, no evidence of soil
structure degradation due to sodication has been observed in Foum Gleita. (Van Asten et al., 2003).
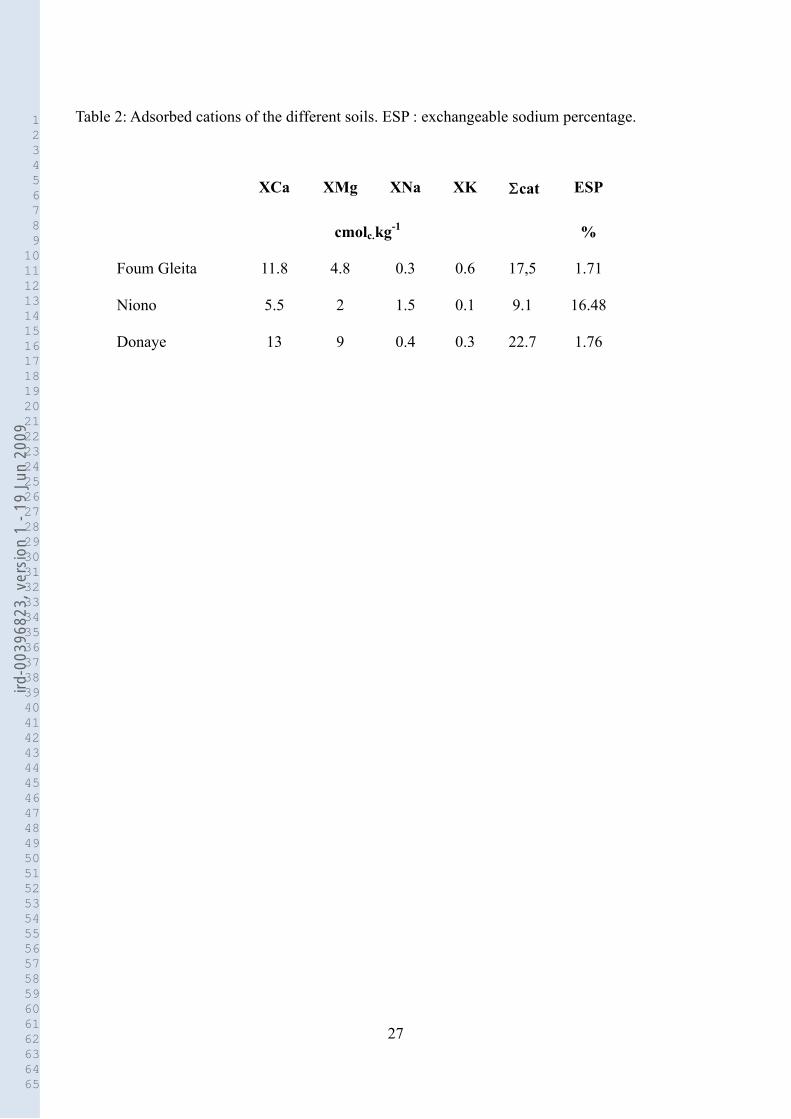
In this region the cation exchange capacity (CEC) of soils ranges from 8 to 18 cmolc.kg-1, and the
electrical conductivity of the 1:5 paste (EC1:5) varies from 0.12 to 1.32 dS.cm-1. Percolation rates
are generally below 4 mm day-1, and decrease during the rainy season as groundwater approaches
the surface. On a few soils, high percolation rates were measured (> 10 mm day-1) and farmers
complained about difficulties in maintaining a submersion needed for rice. After the cropping
season, groundwater quickly drops to below 1.2 m, indicating that deep percolation into the
vertically oriented bedrock occurs, suggesting that horizontal groundwater flow along the slopes is
minimal (van Asten et al., 2003). The absence of a shallow groundwater level during fallow periods
suggests that capillary rise from the ground water can generally be neglected as a source of
(alkaline) salts. The irrigation water is 2 to 4 times more saline than at the other study sites (EC =
0.17 dS.m-1), but the sodium adsorption ratio, defined as : SAR = Na+ /(Ca2+ +Mg2+)1/2 where the
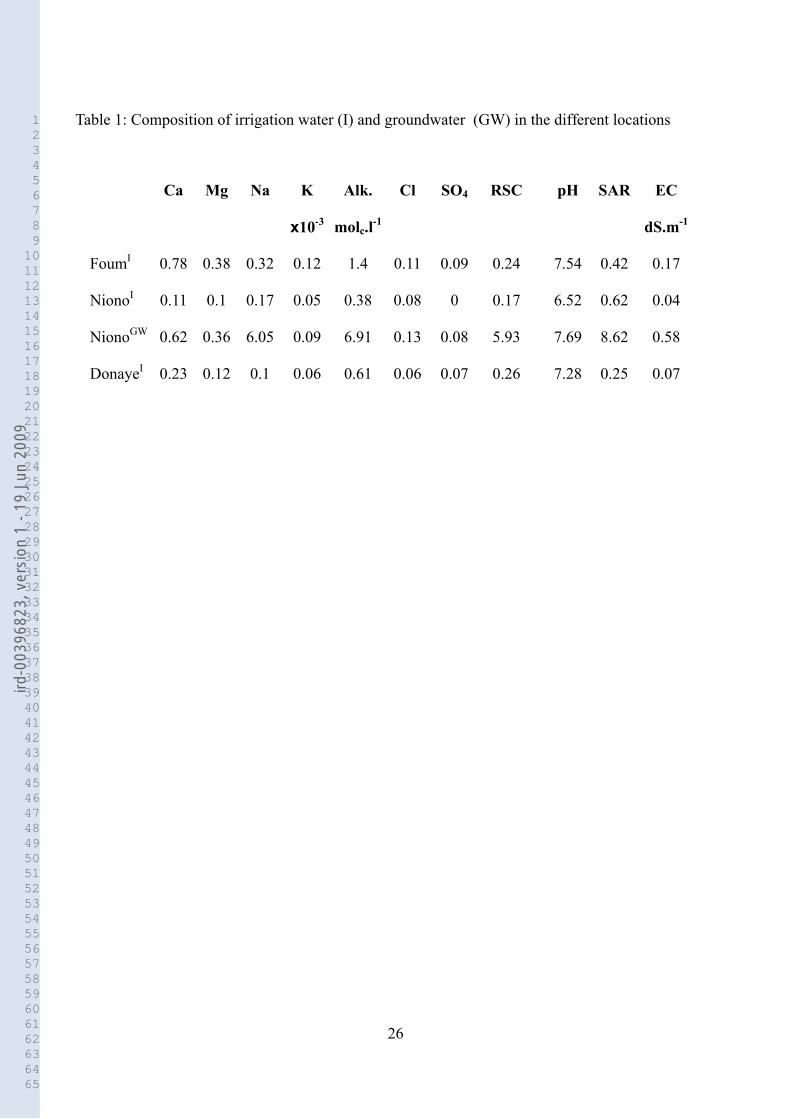
concentration are in mmol.l-1 , is still considered as very low (0.42). The residual sodium carbonate
(RSC) is low and consequently suitable for irrigation according to the Riverside’s diagram (see
table 1). However, as at the other sites, RSC is positive and may therefore lead to alkalinization and
sodication.
2.1.2. Niono
The site of Niono, is typical of the inner Delta of river Niger, developed on three different
geological units: (i) Infracambrian substratum (-500 to -480 M years) composed of fractured
schists and sandstones, (ii) Continental Terminal of Post Eocene to Pre-Quaternary age (-2.5 to -2 M
years) formed by alternate sedimentary deposits of clays, sandy clays and sand , (iii) recent
quaternary alluvial sediments deposited by the river Niger. In the studied area, the main
morphological units are sandy levees, loamy inter levee depressions and clayey settling basins.
ird-0
0396
823,
ver
sion
1 -
19 J
un 2
009

1 2 3 4 5 6 7 8 9 10 11 12 13 14 15 16 17 18 19 20 21 22 23 24 25 26 27 28 29 30 31 32 33 34 35 36 37 38 39 40 41 42 43 44 45 46 47 48 49 50 51 52 53 54 55 56 57 58 59 60 61 62 63 64 65
8
The study is based on data obtained in the huge irrigation scheme of the Office du Niger in Mali
near Ségou (14°32 N 05°59 W). The climate is semi-arid (sudano-sahelian) with an average rainfall
of 460 mm/year, distributed from June to October. The annual evaporation reaches 2.5m which
generates soil solution concentration and consequently alkalization processes related to the alkaline
composition of irrigation water (Condom, 2000) . The distribution of the soils in this area is
inherited from ancient delta deposits constituted of clayey depressions delimited by sandy levees.
These soils evolved under hydrologic conditions imposed by the water management during last half
century, especially related to the uprise of the groundwater level.
The soils in this study are located on a little levee. The upper soil layers are composed of 11% clay
and 78% sand, and classified as loamy sand. The identified clay minerals are mainly kaolinite,
smectite and traces of illite. The structure of the soil is polyhedral. The soil displays an important
biological porosity in the upper part of the profile (0-70cm) due to roots and to meso-fauna activity.
The CEC for this soil is 9 cmolc/kg but with large proportion of exchangeable sodium (ESP) of
about 16% (table 2) ; the EC1:1 for the soils in the area range from 0.18 to 1.09 dS.m-1 . For the last
30 years the fields have been mainly cropped in rice with market gardening as a marginal activity
(Condom, 2000).
In this large irrigation scheme plots are equipped with lateral drainage canals receiving mainly
water from superficial flushing. After several decades of intensive irrigation, the water table level
has risen approximatively by 50 m and is now close to the surface. Condom (2000) found that
during the cropping season the average infiltration was about 80 mm (i.e. 9% of the leaching
fraction), whereas during the inter cropping periods an equivalent amount of water from the water
table supplied capillary rise towards the surface. Lateral losses towards drains and leaks represent
26 % of the total water inputs (Condom, 2000).
The Niger River that supplies the irrigation water by gravity has very low concentration (EC) and
SAR values (Table 1), whereas the groundwater is 10 times more concentrated with a very high
ird-0
0396
823,
ver
sion
1 -
19 J
un 2
009
1 2 3 4 5 6 7 8 9 10 11 12 13 14 15 16 17 18 19 20 21 22 23 24 25 26 27 28 29 30 31 32 33 34 35 36 37 38 39 40 41 42 43 44 45 46 47 48 49 50 51 52 53 54 55 56 57 58 59 60 61 62 63 64 65
9
SAR value. According to the Riverside classification (Riverside salinity lab. staff, 1954) the quality
of irrigation water does not constitute any harm to soil conservation but the composition of the
groundwater typically represents a sodic hazard. Nevertheless, as illustrated by the positive RAcalcite
and RSC value (Table 1), these solutions can both become very alkaline and sodic when they
concentrate, as the Ca2+ and Mg2+ might precipitate in minerals with low solubility like calcite and
Mg-carbonates or Mg-silicates (e.g. sepiolite), whereas alkalinity and Na, keep concentrating in the
solution (Vallès, 1991; Bethke, 2007).
2.1.3. Donaye
The third site, Donaye is representative of the irrigated soils of the river Senegal, representing a
total surface area of irrigation schemes of 240,000 ha (Barbiero et al., 2001). These soils developed
on marine sediments deposited during the Nouakchottian transgression (4300 BP) which extended
380 km inland, near Bogué.
The irrigation scheme is located in northern Senegal (N16°40’; W15°), in the middle valley of the
Senegal River, near Podor. It is a 20-year-old irrigation scheme managed by the farmers, without
drainage network. The soil which has for long time been described as formed by recent alluvial
deposits is a vertisol (vertic Xerofluvent). However in a recent work Barbiero et al. (2005) have
suggested that the soil distribution in lower and middle valley of river Senegal might result from the
pedological transformation of a unique unripe mud, deposited during the last quaternary marine
transgressions. The soils of the Senegal valley can be considered as a chronosequence, where the
most recent soils can be observed downriver in the delta, and the most developed ones upriver, in
the middle valley. The pedological process driven by the acidic conditions associated to the
oxidation of inherited pyrite, led to the dissolution of the parental mud. The protonation and acid
hydrolysis of the aluminosilicates in this material resulted in the formation of a sandy horizon,
representing the quartz skeleton. In the upper part of the soil, the interaction of the river water
ird-0
0396
823,
ver
sion
1 -
19 J
un 2
009
1 2 3 4 5 6 7 8 9 10 11 12 13 14 15 16 17 18 19 20 21 22 23 24 25 26 27 28 29 30 31 32 33 34 35 36 37 38 39 40 41 42 43 44 45 46 47 48 49 50 51 52 53 54 55 56 57 58 59 60 61 62 63 64 65
10
(through floods and irrigation ) with the acidic, Al and Si rich soil solution contributed to the
precipitation of clay minerals, forming vertisols. In the Delta of the river Senegal this process is still
active (Barbiero et al. 2005) and the vertisol is still thin whereas in Donaye it represents a two-
meter-deep soil showing a vertic structure (slickensides), and constituted by 65 to 70% clay
minerals, mainly beidellite and kaolinite (Favre et al., 2002), which shows a high cation exchange
capacity of 22.7 cmol.kg-1(table 2). The soil overlays a 5 to 6 m thick sandy layer corresponding to
the afore mentioned quartz skeleton.
Rice cropping is performed by surge irrigation, and flooding is maintained during the complete
plant growth cycle (about 100 days). The presence of a shallow water table at 2m depth contributes
to air entrapment and stops vertical infiltration (Hammecker et al. 2003). Consequently, vertical
leaching is negligible, and soil solution in the upper part of the profile (above 40 cm) does not
connect with the water table during the irrigation period. However, bad maintenance of bunds
aimed to hold the irrigation in the paddy plots, generates important leaks contributing to non
negligible loss of water, especially during the first irrigation. Irrigation water is pumped in a loop of
river Senegal called Doué. This water with a very low concentration (EC = 0.07 dS.m-1) and a low
SAR value (Table 1), is suitable for irrigation according to Riverside's diagram. Nevertheless, like
in the former situations, the RAcalcite and RSC of the irrigation water are positive, and the
concentration of this solution may lead to sodication.
2.2. Numerical simulation.
2.2.1. The model and its main parameters.
The evolution of the soil solution and its interactions with the solid phase (precipitation-dissolution
and exchange processes) were evaluated with the computer model PHREEQC v2. (Parkhurst and
Appelo, 1999). This model, based on aqueous thermodynamics, computes equilibrium chemistry of
aqueous solutions interacting with minerals, gases, solid solutions, exchangers, and sorption
ird-0
0396
823,
ver
sion
1 -
19 J
un 2
009

1 2 3 4 5 6 7 8 9 10 11 12 13 14 15 16 17 18 19 20 21 22 23 24 25 26 27 28 29 30 31 32 33 34 35 36 37 38 39 40 41 42 43 44 45 46 47 48 49 50 51 52 53 54 55 56 57 58 59 60 61 62 63 64 65
11
surfaces, providing a full speciation of an aqueous system. The different databases provided with
the model give a very wide possibility for computing the activities of most of the aqueous species
present in natural solutions, especially for the CO3-HCO3 solutions. This model is especially useful
as, in addition to the calculation of the chemical equilibria, it allows for the simulation of mixing
different solutions, for concentrating solution due to evaporation, and for adding or taking out
aqueous species from the soil solution. Using these options, it is possible to simulate solution
changes due to flooded irrigation combined with concentration of the soil solution and evaporation.
In surge flooding conditions, successive water inputs are usually performed to maintain a constant
ponding level.
Considering the duration of the rice cycle, the average evapotranspiration and the soil porosity,
Hammecker et al. 2003 found that about 17 irrigations were necessary during one growing cycle.
Considering that in the PHREEQC model all the calculations are performed for a given volume of
solution, the Cation Exchange Capacity (CEC) and exchangeable cations were expressed per
volume of liquid phase, depending on the soil porosity. The mass balance for water and solutes was
calculated in the root zone, i.e. the first 20 centimeters of the soil profile (Slaton et al., 1990;
Sharma et al., 1994; Boivin et al.2002). The irrigation water management during the cropping
season, was simulated for one liter of soil solution in the root zone and the corresponding water
volume for the superficial ponding water. As depicted in figure 2, during the first irrigation of the
season 3 liters are introduced into the system : 1 liter for the soil solutions, and two liters for
superficial ponding. During the cropping season, the superficial water level can almost disappear
completely, but farmers usually irrigate before the complete drying-up of the plot.
Different hydrological conditions, typical of field situations, were considered to simulate the
geochemical evolution taking into account different leaching fractions, presence or absence of
capillary rise from an aquifer with different composition, and the influence of plant uptake of
nutriments. The actual leaching fraction (LF) being considered is the fraction of applied irrigation
ird-0
0396
823,
ver
sion
1 -
19 J
un 2
009
1 2 3 4 5 6 7 8 9 10 11 12 13 14 15 16 17 18 19 20 21 22 23 24 25 26 27 28 29 30 31 32 33 34 35 36 37 38 39 40 41 42 43 44 45 46 47 48 49 50 51 52 53 54 55 56 57 58 59 60 61 62 63 64 65
12
water that drains below the root zone :
a
d
D
DLF
[1]
Where Dd [L] is the amount of water drained below the root zone and Da [L] the amount of
irrigation water applied.
2.2.2. Chemical equilibria
Ionic activities in the soil solution were computed according to Debye-Hückel expression, based on
the ionic strength of the solution. The soil solution was equilibrated with exchange sites on clay
minerals and organic matter following Gaines and Thomas (1953) convention and mass
conservation. Equilibrium with gas and minerals were considered for those initially present in soil,
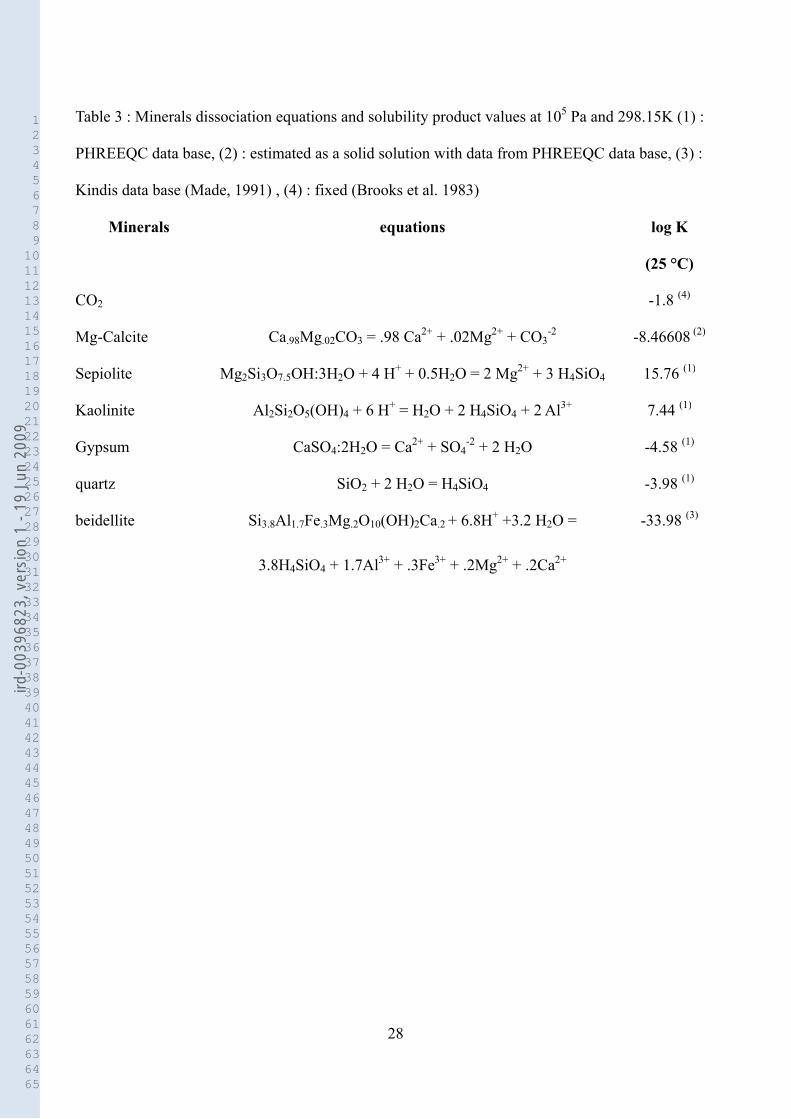
and those likely to crystallize or to affect the evolution of soil solution. The minerals usually found
in arid soils like Mg-calcite, gypsum, quartz, kaolinite and sepiolite, were allowed to precipitate and
dissolve, consequently to modify the composition of the solution. As quartz is initially present in the
soil, this mineral has been chosen rather than amorphous silica, though the two options were tested
and no differences in the major results of these simulations were found. When Al in solution
analysis was not available it was computed considering equilibrium with kaolinite at the pH of the
soil solution. The main solid and gaseous phases used in these simulations are reported in table 3,
with their dissociation equation, and solubility products (K). Partial CO2 pressure was considered to
be equal to atmospheric value (log pCO2 = -3.5 atm) whereas in the soil solution it was considered
to be higher and constant, with log pCO2 = -1.8 atm, like in most of the tropical soils (Brook et al.
1983). The crystallization of the different minerals was considered to take place when the solution
reached equilibrium, regardless of any eventual super-saturation or kinetics phenomenon. However
as the simulation is performed over a very long term, with different water contents, these processes
will scarcely affect the final result.
ird-0
0396
823,
ver
sion
1 -
19 J
un 2
009

1 2 3 4 5 6 7 8 9 10 11 12 13 14 15 16 17 18 19 20 21 22 23 24 25 26 27 28 29 30 31 32 33 34 35 36 37 38 39 40 41 42 43 44 45 46 47 48 49 50 51 52 53 54 55 56 57 58 59 60 61 62 63 64 65
13
2.2.3 The hydrological parameters
The adopted procedure for calculation was first, to equilibrate the irrigation solution with the soil
solution, the mineral phases, and the partial CO2 pressure in soil (10-1.8 atm). The resulting solution
was then concentrated to 5% of its original volume, as the farmers don't let the plot dry out
completely. This value has been estimated from experimental observations (Hammecker, non
published), though it has been verified that the choice of this value has little influence on the final
result. During this procedure equilibria with the solid phase were computed considering the soils
being initially formed by quartz, kaolinite, beidelite and by their respective exchangeable cations
(table 2).
Finally, depending on the leaching fraction (LF), the remaining water content after evaporation
(Q0) was added to a new amount of irrigation water (Q1), in order to start a new simulation with the
same amount of water (one liter), following this relation :
Q0= (1-LF) 0.05
Q1=1-Q0
[2a]
[2b]
This procedure was performed 17 times for one cropping cycle, and 60 cropping cycles were
simulated. In order to take into account the capillary rise in these geochemical processes, we
estimated the quantity of solution possibly risen from the water table towards the root zone with
water flows derived from hydraulic gradients measured during the dry period (Condom, 2000). As
capillary rise occurs only during the inter-cropping period, we treated both periods together, by
mixing the two solutions (irrigation and water table) in their respective proportions (90% and 10%)
in the root zone.
In addition to vertical drainage, superficial lateral drainage (flushing) is performed intentionally or
accidentally by the farmers in some situations. During this type of water management all salts and
concentrated soils solutions present in the superficial layers of soil are dissolved and partially
evacuated with the first water input at the beginning of the cropping period. As the soil profile dried
ird-0
0396
823,
ver
sion
1 -
19 J
un 2
009

1 2 3 4 5 6 7 8 9 10 11 12 13 14 15 16 17 18 19 20 21 22 23 24 25 26 27 28 29 30 31 32 33 34 35 36 37 38 39 40 41 42 43 44 45 46 47 48 49 50 51 52 53 54 55 56 57 58 59 60 61 62 63 64 65
14
out during the inter-cropping season most of the soluble salts have accumulated in surface.
Superficial lateral drainage experiment performed in Donaye showed that just with natural leakage
from the bunds, an average of 15% of the total salinity (0-1m) could be removed (Hammecker et al.
1999). In Niono the flushing (lateral drainage) is performed intentionally, at the beginning of each
new cropping season whereas in Donaye it occurs accidentally as, the margins of the plots leak after
the inter cropping period when the soil shrinks and the margins crack. Consequently, we simulated
an input of irrigation before each cropping period. This water was equilibrated with the soil
solution, the minerals and the exchangeable cations, and was then partially evacuated from the
system (Fig. 3). This numerical treatment, simulates the exportation of elements during a flush
(lateral drainage), where flushing rates were defined as the proportion of water exported from the
system, after the first water input had equilibrated with soil. Equilibrium during this procedure is
conditioned by different physico-chemical processes like : (i) the competition between convective
downward flow during infiltration and upward molecular diffusion towards the superficial water
layer, (ii) the kinetics of minerals dissolution , (iii) the lateral losses in the plot. These processes
were not considered individually but integrated into a bulk value of flushing rate. Different
theoretical flushing rates were tested (5%, 10%, 30% and 50%) as no precise measurements for
actual superficial lateral drainage were available in the three conditions. However they are in
concordance with the flushing rate measured by Hammecker et al.1999 and with those determined
in the experiment performed by Haefele et al. (1999) in the same area, who that showed superficial
lateral drainage after submersed ploughing (puddling) at the beginning of the cropping season,
could increase this salt exportation four folds.
2.2.4. Plant uptake
The geochemical budget was considered with and without the incidence of the plant uptake, in order
to quantify the contribution of the plant uptake to soil degradation or conservation processes. The
ird-0
0396
823,
ver
sion
1 -
19 J
un 2
009
1 2 3 4 5 6 7 8 9 10 11 12 13 14 15 16 17 18 19 20 21 22 23 24 25 26 27 28 29 30 31 32 33 34 35 36 37 38 39 40 41 42 43 44 45 46 47 48 49 50 51 52 53 54 55 56 57 58 59 60 61 62 63 64 65
15
main threat being alkalization due to carbonate concentration (pH increase), the focus has been set
on the ability for rice to export alkalinity, and the main related cations (Ca and Mg) possibly
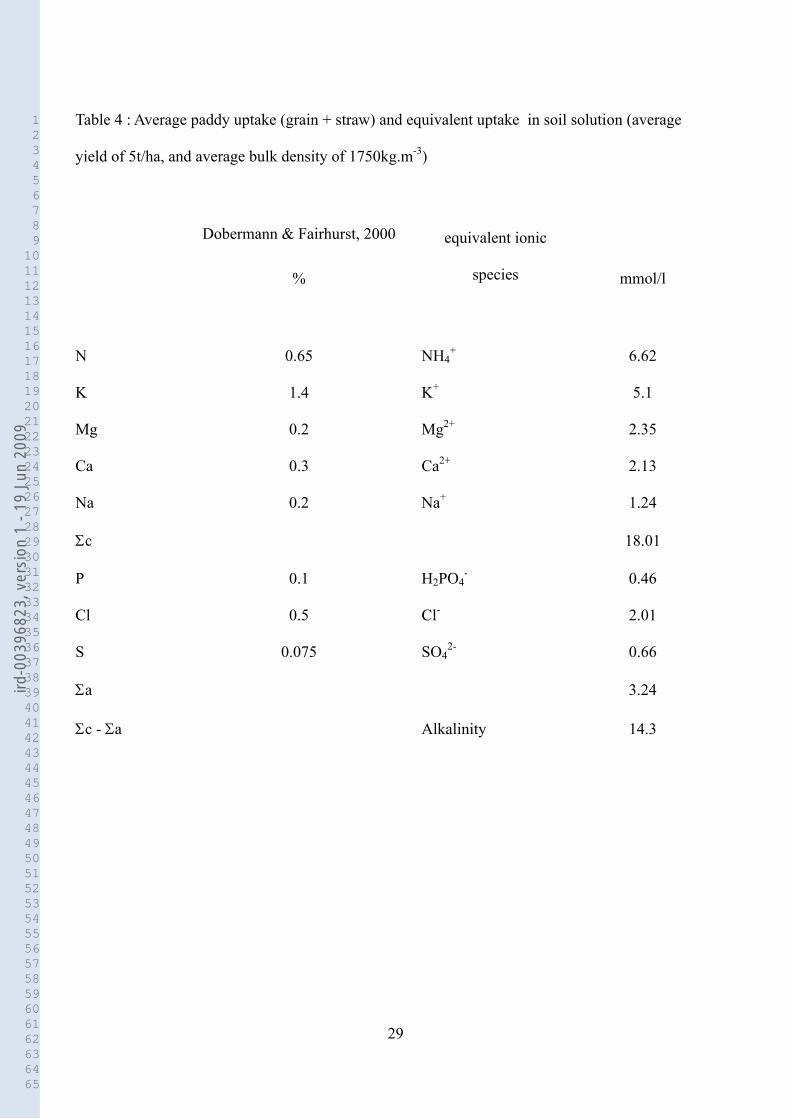
affecting the carbonate balance and ESP. Data of Dobermann and Fairhurst (2000) on the average
final composition of rice were used (Table 4). We considered an average yield of 5t/ha, which
corresponds to 10t/ha of dry biomass(DB), a soil depth (z) of 0.2 m, an average bulk density (b) of
1750 kg.m-3 and a mineral density (s) of 2650 kg.m-3.
The average ratio between the dry biomass (DB) and the volume of the soil solution (Vsoil) has been
calculated to be 14.7 kg.m-3 as follows :
ssoil z
DB
V
DB
4
3
10
10
where s is the porosity. As the soil profile is saturated porosity is defined as:
s
bs
1
Plants export alkalinity because they absorb more cations than anions. In order to maintain
electrical neutrality both inside and outside of the roots they have to produce organic anions and
excrete protons (Pinton et al.,2001 ; Rengel, 2003). The average plant alkalinity was calculated as
the difference between the cations and anions absorbed by the plant (Table 4). It was considered that
all plant alkalinity was removed from the field, as farmers export the entire plant for threshing.
Moreover, when a crop is considered in the geochemical system , it is also necessary to take into
account the N cycle. In paddy fields the plant absorb N as NH4+ originating from the deamination of
the organic matter and the hydrolysis of the urea used as N fertilizer:
R(NH2)2 + H+ +H2O = NH4+ + ROH Helyar and Porter, 1989
CO(NH2)2 + 2H+ +H2O = 2NH4+ + CO2 Bolan and Hedley, 2003
In both cases for each mole of NH4+ produced one mole of protons is removed from soil solution.
ird-0
0396
823,
ver
sion
1 -
19 J
un 2
009
1 2 3 4 5 6 7 8 9 10 11 12 13 14 15 16 17 18 19 20 21 22 23 24 25 26 27 28 29 30 31 32 33 34 35 36 37 38 39 40 41 42 43 44 45 46 47 48 49 50 51 52 53 54 55 56 57 58 59 60 61 62 63 64 65
16
Part of the ammonium produced is also adsorbed on the exchangeable complex or lost as ammonia.
Therefore we only took into account the ammonium ions absorbed by the plant, by using the total N
content of the plant (Table 4), irrespectively of the actual urea management in these sites. The net
acidification due to plant uptake and the N cycle was calculated as:
proton produced = plant alkalinity– N uptake.
In order to simulate the exportation of alkalinity, hence the acidification of the soil solution due to
proton excretion, potassium bicarbonate (KHCO3), magnesium and calcium carbonate (MgCO3 ,
CaCO3) and potassium chloride (KCl) were numerically removed from the irrigation solution in
proportions, calculated to meet the corresponding alkalinity uptake (Table 4). The total uptake for
the different ions was divided by 17 (i.e. the number of irrigation events during a cropping cycle)
and distributed evenly over the entire cropping season.
3.Results and discussion.
3.1.Evolution of the irrigation solutions with increasing concentration.
Results displayed in Figure 4 show the evolution of the solution composition versus the
concentration rate defined as : concentration rate = (Vi – V) / Vi , where Vi is the initial volume of
solution and V the volume of solution reached after concentration.
These results showed an important increase in pH with concentration, up to values around 9, and
clearly superior to 8.3 the pK of calcite. Irrigation water of Foum Gleïta, rapidly reached saturation
with calcite for its large initial Ca concentration. Consequently Ca concentration in solution
decreased constantly whereas Alkalinity, Na and Mg concentrations increased, despite a slight
depletion in Mg when sepiolite crystallization started. At the same time pH increased drastically
despite sepiolite precipitation involving a release of protons into the solution (Table 3). Finally even
for very high concentration rates, Mg increased noticeably in the solution because of its high initial
ird-0
0396
823,
ver
sion
1 -
19 J
un 2
009
1 2 3 4 5 6 7 8 9 10 11 12 13 14 15 16 17 18 19 20 21 22 23 24 25 26 27 28 29 30 31 32 33 34 35 36 37 38 39 40 41 42 43 44 45 46 47 48 49 50 51 52 53 54 55 56 57 58 59 60 61 62 63 64 65
17
content, as sepiolite crystallization is controlled by Si, which is less abundant.
During this simulation, the irrigation water of Niono rapidly reached saturation with quartz and
while it is the only mineral precipitating, alkalinity and concentrations in all the cations increased
regularly with concentration rate. The solution reached saturation with calcite for a high
concentration rate (0.75) then Ca concentration decreased. For higher concentration rates, Mg
concentration dropped when sepiolite crystallized whereas Na kept concentrating. A similar
behavior was observed in Donaye, when water of river Senegal concentrated. In the three cases the
pH of irrigation water increased and Na became the dominant cation in solution, enhancing the risk
of sodication. Considering the SAR and the Electrical Conductivity of the irrigation water of the
different situations, they can be considered as suitable for irrigation according to the Riverside
diagram (1954). However this static view does not reflect the evolution of the solutions that may
occur when concentrating. Numerical simulation of the concentration of these solutions (Figure 5),
show that their SAR increased drastically with concentration, whereas the total salinity (EC) didn't
increase as much, mainly because of the precipitation of calcite. Barbiero et al. (2004) showed
some results for experimental concentration of irrigation water from River Niger, in the Republic of
Niger, which have similar initial composition as the irrigation water of Niono, where the SAR of
the solutions also increased but with much higher EC values until reaching the C4S4 domain,
instead of C2S4 as in the numerical simulation (Fig. 5). This discrepancy should mainly be
explained by the fact that in the simulation the kinetics of precipitations have not been taken into
account, and especially the retardation induced by the presence of Mg in the same proportions as Ca
(House et al. 1988). However, in both cases the simulation shows that resulting solutions are
extremely hazardous for soil conservation as they tend to promote sodication.
3.2. Evolution of the soil solutions over 60 simulated cropping cycles.
The previous simulations described the evolution of the irrigation solution without taking into
ird-0
0396
823,
ver
sion
1 -
19 J
un 2
009
1 2 3 4 5 6 7 8 9 10 11 12 13 14 15 16 17 18 19 20 21 22 23 24 25 26 27 28 29 30 31 32 33 34 35 36 37 38 39 40 41 42 43 44 45 46 47 48 49 50 51 52 53 54 55 56 57 58 59 60 61 62 63 64 65
18
account the interactions with soils, especially with the exchange complex and the minerals.
Moreover, in order to get an overall idea of the geochemical processes involved in field conditions,
the vertical drainage and capillary rise was taken into account, following the simulation procedures
described previously for the three situations.
The first set of simulation was aimed at quantifying the influence of the presence of a soil with a
reactive adsorption complex and minerals, as well as the influence of the vertical leaching towards
the water table. As the concentration of the soil varies constantly between two irrigations, the
results displayed in the following figures corresponds to the composition of the soil solution and the
exchange complex, immediately after the irrigation i.e. when the plots are full of water, in order to
represent the actual solution infiltrating into the soil.
In the case of Foum Gleita (Fig. 6) where irrigation water tends to become very alkaline with
concentration, an equivalent trend was observed in presence of soil and vertical drainage. However
this trend appeared in lesser proportions, as pH reached only a value of 7.8 after 60 cropping cycles.
The major ions in solution were Na+ and alkalinity. Both increased regularly with the number of
cropping cycles whereas Ca2+ decreased as calcite precipitated. The complex reacted to compensate
this trend, providing Ca2+ to the soil solution. Consequently, the proportion of exchangeable Ca
decreased and exchangeable Mg became dominant. At the same time, exchangeable Na increased
and consequently ESP rose to 15% after 10 cropping cycles and finally reached 30% after 60
cropping cycles. The evolution of the pH and alkalinity is still positive, but at a noticeably lower
rate than for the concentration of the irrigation water alone. In fact, the large CEC of the soil
buffered the effects of irrigation solution composition, especially as it imposed the geochemical
composition of the soil solution, and supplied sufficient Ca2+ ions necessary to precipitate calcite
and so prevented the accumulation of excessive alkalinity. According to the Residual Alkalinity
(RA), which is still positive, the general trend of the system is to evolve continuously, but slowly,
towards alkaline conditions.
ird-0
0396
823,
ver
sion
1 -
19 J
un 2
009
1 2 3 4 5 6 7 8 9 10 11 12 13 14 15 16 17 18 19 20 21 22 23 24 25 26 27 28 29 30 31 32 33 34 35 36 37 38 39 40 41 42 43 44 45 46 47 48 49 50 51 52 53 54 55 56 57 58 59 60 61 62 63 64 65
19
In the case of Niono (Fig. 7), the simulation showed a continuous increase in pH during the first 35
cropping cycles followed by a stabilization at around pH=8.1. Alkalinity and
Na+ in soil solution and in the soil displayed a similar evolution, namely increasing until reaching
saturation towards sepiolite. RAcalcite followed the same increasing trend as alkalinity, witnessing an
alkaline evolution. Exchangeable sodium increased drastically during the first cropping cycles and
reached a maximum of 53% of the exchangeable complex after 50 cropping cycles, until sepiolite
started to crystallize. Although extreme values for ESP have not actually been observed in this
region, they are indicative of the type of degradation the soils might undergo in these conditions :
high pH and ESP values are typical of alkalization and sodication processes. Although the irrigation
solution is potentially less alkaline than in Foum Gleita, its use for irrigation is more hazardous,
because the adsorption complex is very vulnerable to soil solution composition due to low CEC ;
the exchange between the adsorbed Ca2+ and Na+ in solution will therefore lead to a rapid increase
in ESP.
Finally, in the case of Donaye (Fig. 8), the pH of the soil solution did not change much with the
number of cropping cycles and mainly remained near neutrality. Sodium and magnesium were the
major cations in the soil solution, and both concentrations increased with the number of cropping
cycles. Alkalinity was the main anion, but both chloride and sulphate increased drastically with
time, as there was no leaching towards the water table in this site. The soil solution temporarily
reached equilibrium with gypsum during the dry season when all the irrigation water was
evaporated, and especially during the inter cropping periods, according field observations (Boivin et
al., 2002; Barbiero et al., 2005).
In the first instance RAcalcite dropped slightly but increased again progressively when calcite and
later gypsum started to precipitate. As the soil is very clayey with high CEC, the composition of the
soil solution was determined by the buffering property of the soil. Exchangeable calcium was
ird-0
0396
823,
ver
sion
1 -
19 J
un 2
009
1 2 3 4 5 6 7 8 9 10 11 12 13 14 15 16 17 18 19 20 21 22 23 24 25 26 27 28 29 30 31 32 33 34 35 36 37 38 39 40 41 42 43 44 45 46 47 48 49 50 51 52 53 54 55 56 57 58 59 60 61 62 63 64 65
20
progressively desorbed and precipitated, exchangeable magnesium increased and became the first
exchangeable cation. At the same time ESP increased linearly up to 9% after 60 cycles. These
extreme values for adsorbed magnesium were not observed yet, but still represent the values
potentially reached for these conditions. Sixty cropping cycles were not sufficient to lead to alkaline
conditions. However these confined conditions promote a very slow alkalization and sodication
process.
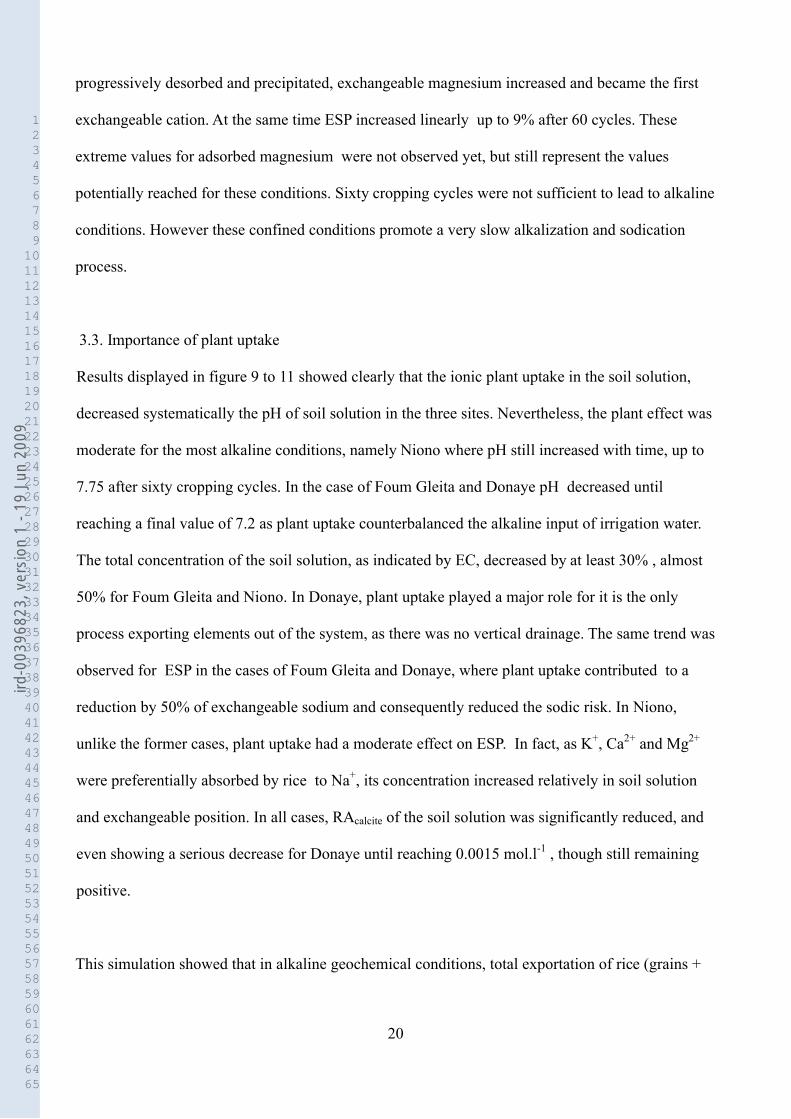
3.3. Importance of plant uptake
Results displayed in figure 9 to 11 showed clearly that the ionic plant uptake in the soil solution,
decreased systematically the pH of soil solution in the three sites. Nevertheless, the plant effect was
moderate for the most alkaline conditions, namely Niono where pH still increased with time, up to
7.75 after sixty cropping cycles. In the case of Foum Gleita and Donaye pH decreased until
reaching a final value of 7.2 as plant uptake counterbalanced the alkaline input of irrigation water.
The total concentration of the soil solution, as indicated by EC, decreased by at least 30% , almost
50% for Foum Gleita and Niono. In Donaye, plant uptake played a major role for it is the only
process exporting elements out of the system, as there was no vertical drainage. The same trend was
observed for ESP in the cases of Foum Gleita and Donaye, where plant uptake contributed to a
reduction by 50% of exchangeable sodium and consequently reduced the sodic risk. In Niono,
unlike the former cases, plant uptake had a moderate effect on ESP. In fact, as K+, Ca2+ and Mg2+
were preferentially absorbed by rice to Na+, its concentration increased relatively in soil solution
and exchangeable position. In all cases, RAcalcite of the soil solution was significantly reduced, and
even showing a serious decrease for Donaye until reaching 0.0015 mol.l-1 , though still remaining
positive.
This simulation showed that in alkaline geochemical conditions, total exportation of rice (grains +
ird-0
0396
823,
ver
sion
1 -
19 J
un 2
009
1 2 3 4 5 6 7 8 9 10 11 12 13 14 15 16 17 18 19 20 21 22 23 24 25 26 27 28 29 30 31 32 33 34 35 36 37 38 39 40 41 42 43 44 45 46 47 48 49 50 51 52 53 54 55 56 57 58 59 60 61 62 63 64 65
21
straw) improved generally the composition of the soil solution and tended to reduce the risks of
salinisation, alkalization and generally sodication except in the case of Niono where the low CEC
was very sensitive to a relative Na increase in the soil solution. This situation is illustrated by
Barbiero et al. 2001 who carried out an experiment in Niger (Lossa) where the cultivation of a local
fodder grass (Echinochloa stagnina) and its exportation out of the field contributed to noticeable de-
alkalization of a highly alkaline soil.
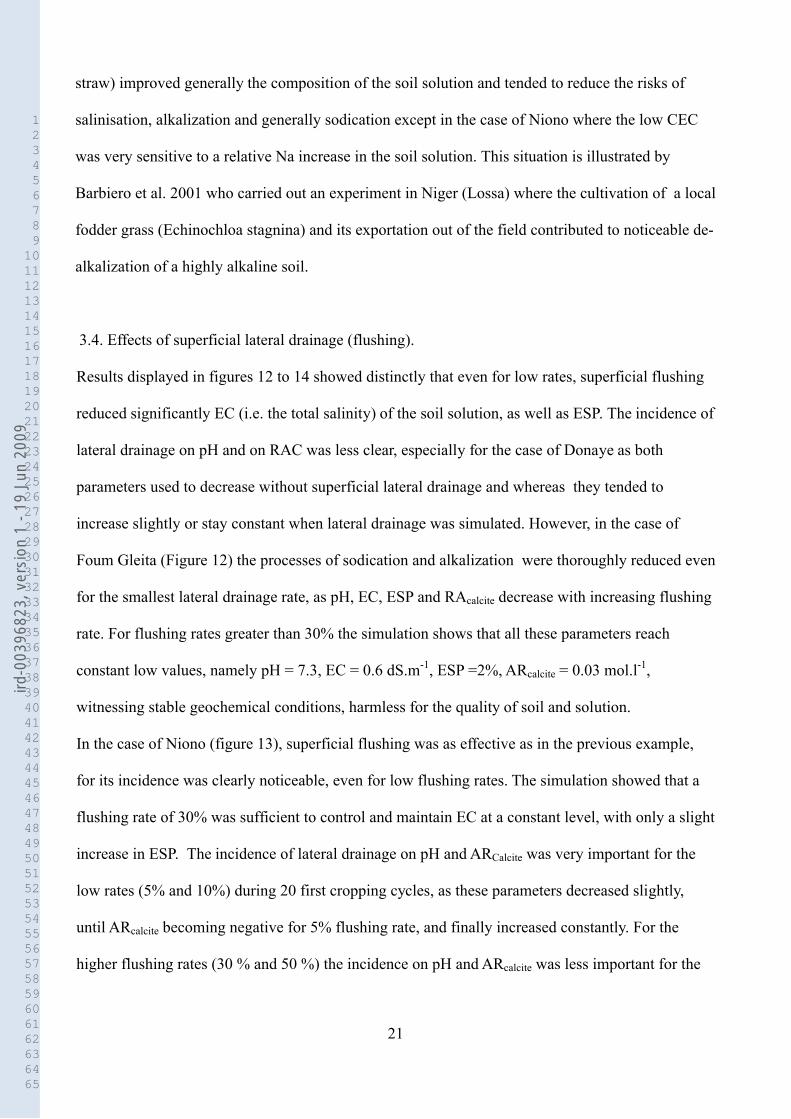
3.4. Effects of superficial lateral drainage (flushing).
Results displayed in figures 12 to 14 showed distinctly that even for low rates, superficial flushing
reduced significantly EC (i.e. the total salinity) of the soil solution, as well as ESP. The incidence of
lateral drainage on pH and on RAC was less clear, especially for the case of Donaye as both
parameters used to decrease without superficial lateral drainage and whereas they tended to
increase slightly or stay constant when lateral drainage was simulated. However, in the case of
Foum Gleita (Figure 12) the processes of sodication and alkalization were thoroughly reduced even
for the smallest lateral drainage rate, as pH, EC, ESP and RAcalcite decrease with increasing flushing
rate. For flushing rates greater than 30% the simulation shows that all these parameters reach
constant low values, namely pH = 7.3, EC = 0.6 dS.m-1, ESP =2%, ARcalcite = 0.03 mol.l-1,
witnessing stable geochemical conditions, harmless for the quality of soil and solution.
In the case of Niono (figure 13), superficial flushing was as effective as in the previous example,
for its incidence was clearly noticeable, even for low flushing rates. The simulation showed that a
flushing rate of 30% was sufficient to control and maintain EC at a constant level, with only a slight
increase in ESP. The incidence of lateral drainage on pH and ARCalcite was very important for the
low rates (5% and 10%) during 20 first cropping cycles, as these parameters decreased slightly,
until ARcalcite becoming negative for 5% flushing rate, and finally increased constantly. For the
higher flushing rates (30 % and 50 %) the incidence on pH and ARcalcite was less important for the
ird-0
0396
823,
ver
sion
1 -
19 J
un 2
009

1 2 3 4 5 6 7 8 9 10 11 12 13 14 15 16 17 18 19 20 21 22 23 24 25 26 27 28 29 30 31 32 33 34 35 36 37 38 39 40 41 42 43 44 45 46 47 48 49 50 51 52 53 54 55 56 57 58 59 60 61 62 63 64 65
22
first simulated cropping cycles, but remained constant over the entire period. This special behavior
is probably related to the difference in pCO2 between the soil solution (10-1.8 atm) and the
supplementary irrigation water (10-3.5 atm) added to compensate lateral drainage, and their relative
proportions when mixed, promoting whether calcite precipitation or dilution of the soil solution. In
any cases the superficial flushing reduced significantly the risk of alkalisation and sodication,
though ESP values still reached relatively high values (17%).
An equivalent behavior was noticed in the simulation for the case of Donaye (figure 14), although
no vertical drainage was considered; EC and ESP showed a significant decrease even for low
flushing rates and reached a low constant value all along the cropping cycles when higher
superficial lateral drainage rates were achieved (EC = 0.7 dS.m-1 ; ESP =1.5 % for 30% flushing
rate and EC = 0.6 dS.m-1 ; ESP = 0.8 % for a flushing rate of 50 %). Consequently the soil solution
and soil quality increased. On the other hand, pH and ARcalcite showed a significant decrease when
no lateral drainage was simulated whereas they showed a similar behavior for the different flushing
rates as described for the case of Niono. However these variations of pH and ARcalcite can be
considered as negligible considering alkalization because for the worst condition (flushing rate of
10 %), pH reached 7.33 and ARcalcite reached 0.004 molc.l-1 after 60 cropping cycles .
Moreover these results also show that ARcalcite , which is considered as a conservative tracer
(Ribolzi et al. 1996;Barbiero et al. 2001; Barbiero et al. 2004), varies along the simulation, and
probably also in field conditions, as solutions with different pCO2 are mixed.
In Donaye, mineralogical and chemical experimental studies of the soil have been performed to
assess the modifications of the soil quality after 15 years of intensive irrigation. When compared
inside an irrigated plot and outside the irrigation scheme, the evolution of the soil exchangeable
complex, especially the ESP, has been found not significantly different (Charolais and Weber,
1994). Equally, when the pH of the soil, the EC and the content of accumulated carbonates in the
topsoil have been measured on a 1/50 aqueous extract, (Schiess, 1995; Boivin et al. 1998) only a
ird-0
0396
823,
ver
sion
1 -
19 J
un 2
009
1 2 3 4 5 6 7 8 9 10 11 12 13 14 15 16 17 18 19 20 21 22 23 24 25 26 27 28 29 30 31 32 33 34 35 36 37 38 39 40 41 42 43 44 45 46 47 48 49 50 51 52 53 54 55 56 57 58 59 60 61 62 63 64 65
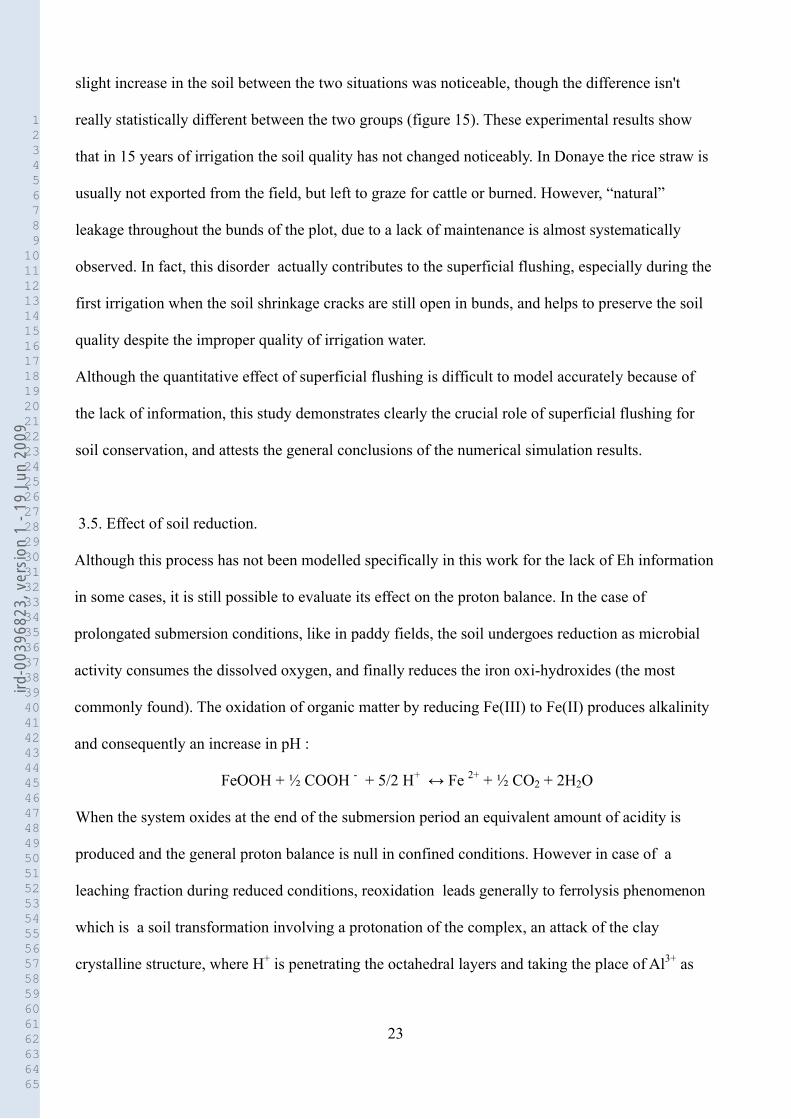
23
slight increase in the soil between the two situations was noticeable, though the difference isn't
really statistically different between the two groups (figure 15). These experimental results show
that in 15 years of irrigation the soil quality has not changed noticeably. In Donaye the rice straw is
usually not exported from the field, but left to graze for cattle or burned. However, “natural”
leakage throughout the bunds of the plot, due to a lack of maintenance is almost systematically
observed. In fact, this disorder actually contributes to the superficial flushing, especially during the
first irrigation when the soil shrinkage cracks are still open in bunds, and helps to preserve the soil
quality despite the improper quality of irrigation water.
Although the quantitative effect of superficial flushing is difficult to model accurately because of
the lack of information, this study demonstrates clearly the crucial role of superficial flushing for
soil conservation, and attests the general conclusions of the numerical simulation results.
3.5. Effect of soil reduction.
Although this process has not been modelled specifically in this work for the lack of Eh information
in some cases, it is still possible to evaluate its effect on the proton balance. In the case of
prolongated submersion conditions, like in paddy fields, the soil undergoes reduction as microbial
activity consumes the dissolved oxygen, and finally reduces the iron oxi-hydroxides (the most
commonly found). The oxidation of organic matter by reducing Fe(III) to Fe(II) produces alkalinity
and consequently an increase in pH :
FeOOH + ½ COOH - + 5/2 H+ ↔ Fe 2+ + ½ CO2 + 2H2O
When the system oxides at the end of the submersion period an equivalent amount of acidity is
produced and the general proton balance is null in confined conditions. However in case of a
leaching fraction during reduced conditions, reoxidation leads generally to ferrolysis phenomenon
which is a soil transformation involving a protonation of the complex, an attack of the clay
crystalline structure, where H+ is penetrating the octahedral layers and taking the place of Al3+ as
ird-0
0396
823,
ver
sion
1 -
19 J
un 2
009
1 2 3 4 5 6 7 8 9 10 11 12 13 14 15 16 17 18 19 20 21 22 23 24 25 26 27 28 29 30 31 32 33 34 35 36 37 38 39 40 41 42 43 44 45 46 47 48 49 50 51 52 53 54 55 56 57 58 59 60 61 62 63 64 65
24
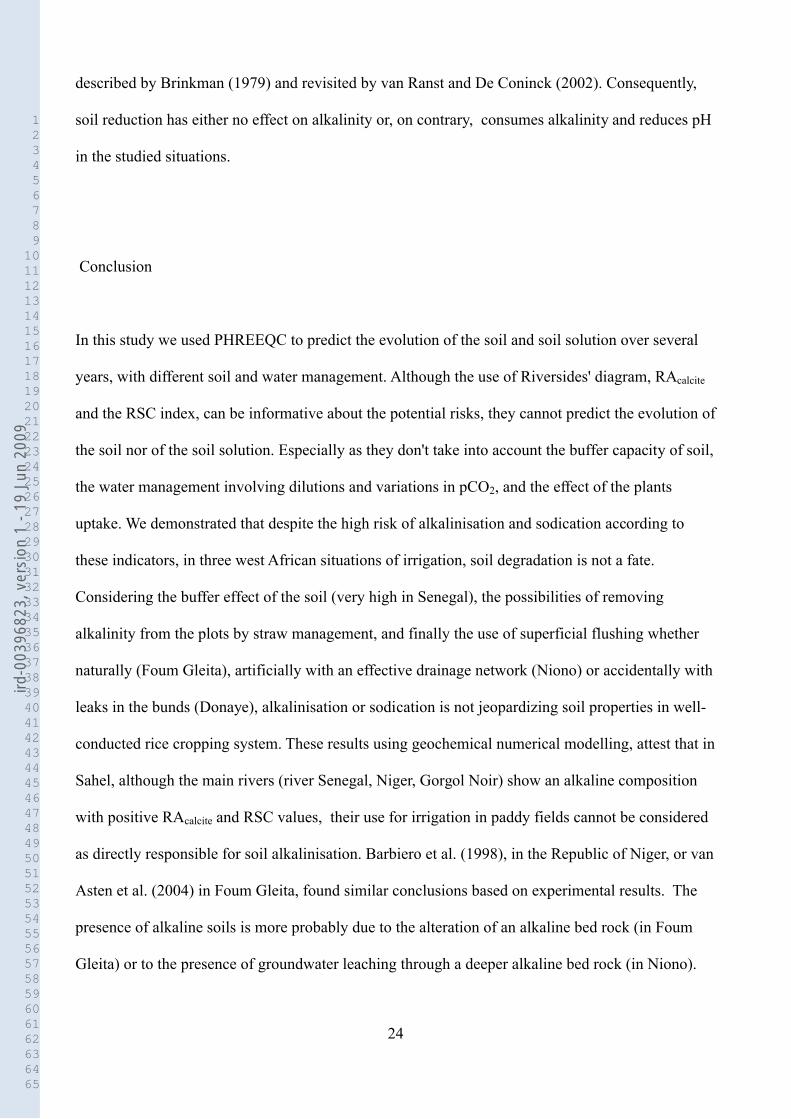
described by Brinkman (1979) and revisited by van Ranst and De Coninck (2002). Consequently,
soil reduction has either no effect on alkalinity or, on contrary, consumes alkalinity and reduces pH
in the studied situations.
Conclusion
In this study we used PHREEQC to predict the evolution of the soil and soil solution over several
years, with different soil and water management. Although the use of Riversides' diagram, RAcalcite
and the RSC index, can be informative about the potential risks, they cannot predict the evolution of
the soil nor of the soil solution. Especially as they don't take into account the buffer capacity of soil,
the water management involving dilutions and variations in pCO2, and the effect of the plants
uptake. We demonstrated that despite the high risk of alkalinisation and sodication according to
these indicators, in three west African situations of irrigation, soil degradation is not a fate.
Considering the buffer effect of the soil (very high in Senegal), the possibilities of removing
alkalinity from the plots by straw management, and finally the use of superficial flushing whether
naturally (Foum Gleita), artificially with an effective drainage network (Niono) or accidentally with
leaks in the bunds (Donaye), alkalinisation or sodication is not jeopardizing soil properties in well-
conducted rice cropping system. These results using geochemical numerical modelling, attest that in
Sahel, although the main rivers (river Senegal, Niger, Gorgol Noir) show an alkaline composition
with positive RAcalcite and RSC values, their use for irrigation in paddy fields cannot be considered
as directly responsible for soil alkalinisation. Barbiero et al. (1998), in the Republic of Niger, or van
Asten et al. (2004) in Foum Gleita, found similar conclusions based on experimental results. The
presence of alkaline soils is more probably due to the alteration of an alkaline bed rock (in Foum
Gleita) or to the presence of groundwater leaching through a deeper alkaline bed rock (in Niono).
ird-0
0396
823,
ver
sion
1 -
19 J
un 2
009

1 2 3 4 5 6 7 8 9 10 11 12 13 14 15 16 17 18 19 20 21 22 23 24 25 26 27 28 29 30 31 32 33 34 35 36 37 38 39 40 41 42 43 44 45 46 47 48 49 50 51 52 53 54 55 56 57 58 59 60 61 62 63 64 65
25
Unlike the usual assumptions,where rice cropping is held responsible for soil salinization or
alkalinisation, this study show that in these cases, rice cropping can improve the soil quality when
irrigation and residue management are performed properly. Namely a superficial lateral drainage
performed once, at the beginning of the cropping season, although being sometimes seen as a waste
of water by the local farmers, improves noticeably the sustainability of the system despite adverse
composition of the irrigation water. More over, in the situation of alkalinisation risk, the exportation
of the straw out of the plots contributes significantly to the control of the average alkalinity of soil,
especially in the cases of Niono and Donaye.
ird-0
0396
823,
ver
sion
1 -
19 J
un 2
009
1 2 3 4 5 6 7 8 9 10 11 12 13 14 15 16 17 18 19 20 21 22 23 24 25 26 27 28 29 30 31 32 33 34 35 36 37 38 39 40 41 42 43 44 45 46 47 48 49 50 51 52 53 54 55 56 57 58 59 60 61 62 63 64 65
26
Table 1: Composition of irrigation water (I) and groundwater (GW) in the different locations
Ca Mg Na K Alk. Cl SO4 RSC pH SAR EC
x10-3 molc.l-1 dS.m-1
FoumI 0.78 0.38 0.32 0.12 1.4 0.11 0.09 0.24 7.54 0.42 0.17
NionoI 0.11 0.1 0.17 0.05 0.38 0.08 0 0.17 6.52 0.62 0.04
NionoGW 0.62 0.36 6.05 0.09 6.91 0.13 0.08 5.93 7.69 8.62 0.58
DonayeI 0.23 0.12 0.1 0.06 0.61 0.06 0.07 0.26 7.28 0.25 0.07
ird-0
0396
823,
ver
sion
1 -
19 J
un 2
009
1 2 3 4 5 6 7 8 9 10 11 12 13 14 15 16 17 18 19 20 21 22 23 24 25 26 27 28 29 30 31 32 33 34 35 36 37 38 39 40 41 42 43 44 45 46 47 48 49 50 51 52 53 54 55 56 57 58 59 60 61 62 63 64 65
27
Table 2: Adsorbed cations of the different soils. ESP : exchangeable sodium percentage.
XCa XMg
cmolc.
XNa
kg-1
XK cat ESP
%
Foum Gleita 11.8 4.8 0.3 0.6 17,5 1.71
Niono 5.5 2 1.5 0.1 9.1 16.48
Donaye 13 9 0.4 0.3 22.7 1.76
ird-0
0396
823,
ver
sion
1 -
19 J
un 2
009
1 2 3 4 5 6 7 8 9 10 11 12 13 14 15 16 17 18 19 20 21 22 23 24 25 26 27 28 29 30 31 32 33 34 35 36 37 38 39 40 41 42 43 44 45 46 47 48 49 50 51 52 53 54 55 56 57 58 59 60 61 62 63 64 65
28
Table 3 : Minerals dissociation equations and solubility product values at 105 Pa and 298.15K (1) :
PHREEQC data base, (2) : estimated as a solid solution with data from PHREEQC data base, (3) :
Kindis data base (Made, 1991) , (4) : fixed (Brooks et al. 1983)
Minerals equations log K
(25 °C)
CO2 -1.8 (4)
Mg-Calcite Ca.98Mg.02CO3 = .98 Ca2+ + .02Mg2+ + CO3-2 -8.46608 (2)
Sepiolite Mg2Si3O7.5OH:3H2O + 4 H+ + 0.5H2O = 2 Mg2+ + 3 H4SiO4 15.76 (1)
Kaolinite Al2Si2O5(OH)4 + 6 H+ = H2O + 2 H4SiO4 + 2 Al3+ 7.44 (1)
Gypsum CaSO4:2H2O = Ca2+ + SO4-2 + 2 H2O -4.58 (1)
quartz SiO2 + 2 H2O = H4SiO4 -3.98 (1)
beidellite Si3.8Al1.7Fe.3Mg.2O10(OH)2Ca.2 + 6.8H+ +3.2 H2O =
3.8H4SiO4 + 1.7Al3+ + .3Fe3+ + .2Mg2+ + .2Ca2+
-33.98 (3)
ird-0
0396
823,
ver
sion
1 -
19 J
un 2
009
1 2 3 4 5 6 7 8 9 10 11 12 13 14 15 16 17 18 19 20 21 22 23 24 25 26 27 28 29 30 31 32 33 34 35 36 37 38 39 40 41 42 43 44 45 46 47 48 49 50 51 52 53 54 55 56 57 58 59 60 61 62 63 64 65
29
Table 4 : Average paddy uptake (grain + straw) and equivalent uptake in soil solution (average
yield of 5t/ha, and average bulk density of 1750kg.m-3)
Dobermann & Fairhurst, 2000
%
equivalent ionic
species mmol/l
N 0.65 NH4+ 6.62
K 1.4 K+ 5.1
Mg 0.2 Mg2+ 2.35
Ca 0.3 Ca2+ 2.13
Na 0.2 Na+ 1.24
c 18.01
P 0.1 H2PO4- 0.46
Cl 0.5 Cl- 2.01
S 0.075 SO42- 0.66
a 3.24
c - a Alkalinity 14.3
ird-0
0396
823,
ver
sion
1 -
19 J
un 2
009
1 2 3 4 5 6 7 8 9 10 11 12 13 14 15 16 17 18 19 20 21 22 23 24 25 26 27 28 29 30 31 32 33 34 35 36 37 38 39 40 41 42 43 44 45 46 47 48 49 50 51 52 53 54 55 56 57 58 59 60 61 62 63 64 65
30
References
Al Droubi, A., Fritz, B., Gac, J-Y. and Tardy, Y., 1980. Generalized residual alkalinity concept;
application to prediction of the chemical evolution of natural waters by evaporation. Am. J.
Sci., 280: 560-572
Arbol, I.P., Yadav, J.S.P. and Massoud, F.I., 1988. Salt-affected soils and their management. Food
and Agricultural Organization of the United Nations, Soils Bulletin 39, Rome 131 pp.
Audry, P., 1961. Etude pédologique du cercle de Guidimaka (République Islamique de Mauritanie).
Etude du milieu naturel et étude pédologique. - Rapp. Off. Rech. sci. tech. O-mer, Dakar, 173
p. multigr.,
Barbiero, L. and Van-Vliet-Lanoe, B., 1998. The alkali soils of the middle Niger Valley; origins,
formation and present evolution. Geoderma, 84: 323-343.
Barbiero, L.; Valles, V.; Regeard, A., Cheverry, C., 2001 Residual alkalinity as tracer to estimate the
changes induced by forage cultivation in a non-saline irrigated sodic soil Agricultural Water
Management. 50 : 229-241
Barbiero L., Ould Mohamedou A., Laperrousaz C., Furian S., Cunnac S., 2004. Polyphasic origin of
salinity in the Senegal delta and middle valley. Catena 58, 101-124.
Barbiero L., Ould Mohamedou A., Roger L., Furian S., Aventurier A., Rémy J.C., Marlet S., 2005.
The origin of vertisols and their relationship to Acid Sulfate Soils in the Senegal Valley.
Catena 59, 93-116.
Bertrand, R., Keita, B., Ndiaye, K.M., 1993. La dégradation des sols des périmètres irrigués des
grandes vallées sud-sahariennes: Cas de l'Office du Niger au Mali). Cahiers Agricultures 2,
318 329.
Bethke, C.M. 2007. Geochemical and Biogeochemical Reaction Modeling. Cambridge University
Press. 564 pp.
ird-0
0396
823,
ver
sion
1 -
19 J
un 2
009

1 2 3 4 5 6 7 8 9 10 11 12 13 14 15 16 17 18 19 20 21 22 23 24 25 26 27 28 29 30 31 32 33 34 35 36 37 38 39 40 41 42 43 44 45 46 47 48 49 50 51 52 53 54 55 56 57 58 59 60 61 62 63 64 65
31
Boivin, P., Favre, F. and Maeght, J-L., 1998. Les sols de la moyenne vallée du fleuve Sénégal :
caractéristiques et évolution sous irrigation. Étude et Gestion des Sols, 5: 235- 246
Boivin, P., Favre, F., Hammecker, C., Maeght, J-L., Delarivière, J., Poussin, J-C. and Wopereis,
M.C.S., 2002. Processes driving soil solution chemistry in a flooded rice-cropped vertisol:
analysis of long-time monitoring data. Geoderma, 110: 87-107
Bolan N.S. and Hedley M.J., 2003. Role of carbon, nitrogen, and sulfur cycles in soil acidification.
In: Z. Rengel (Editor), Handbook of soil acidity. Marcel Dekker, New York, pp. 29-56.
Brinkman, R. 1979. Ferrolysis, a soil-forming process in hydromorphic conditions. Doctoral thesis.
Agricultural Research Reports 887, Centre for Agricultural Publishing and Documentation,
Wageningen.
Brooks, G.A., Folkoff, M.E., Box, E.O. 1983. A global model of soil carbon dioxide. Earth Surface
Processes and Land/onus 8:79-88.
Carité, D. 1989. Géologie en Mauritanie. Edisud. 284 pp.
Charolais, M., Weber, V., 1994. Evolution des sols irrigués dans la moyenne vallée du fleuve
Sénégal. M.Sc. Thesis, EPFL, Lausane, Switzerland.
Condom, N., 2000. Analyse et modélisation des processus hydro-géochimiques de la salinisation
des sols. Application aux sols rizicoles de l'Office du Niger (Mali). PhD Thesis. Ecole
Nationale Supérieure d'Agronomie de Montpellier. 183 pp.
Dobermann, A. and Fairhurst, T.H., 2000. Rice: nutritional disorders and nutrient management.
International Rice Research Institute & Potash and Phosphate Institute, Singapore, 191 pp.
Eaton, F.M., 1950. Significance of carbonates in irrigation waters. Soil Science, 69:123-133
Favre, F., Tessier, D., Abdelmoula M., Génin, J. M. ,Gates, W. P. , Boivin, P. , 2002. Iron reduction
and changes in cation exchange capacity in intermittently waterlogged soil. European Journal
of Soil Science, 53: 175-183
ird-0
0396
823,
ver
sion
1 -
19 J
un 2
009
1 2 3 4 5 6 7 8 9 10 11 12 13 14 15 16 17 18 19 20 21 22 23 24 25 26 27 28 29 30 31 32 33 34 35 36 37 38 39 40 41 42 43 44 45 46 47 48 49 50 51 52 53 54 55 56 57 58 59 60 61 62 63 64 65
32
Gaines, G.L., and Thomas, H.C., 1953. Adsorption studies on clay minerals. II. A formulation of the
thermodynamics of exchange adsorption. Journal of Chemical Physics, 21 :714-718.
Haefele, S.; Wopereis, M. C. S.; Boivin, P. and N'Diaye, A. M. 1999. Effect of puddling on soil
desalinization and rice seedling survival in the Senegal River Delta. Soil and Tillage Research,
51, 35-46
Hammecker, C. and Maeght, J-L., 1999. Synthèse sur l’évolution des sols sous culture (Sénégal).
Lutte contre la dégradation des sols dans la vallée du fleuve Sénégal. Document PSI, technical
report.
Hammecker, C., Maeght, J-L. And Wade M. 1999. Essai de drainage sur le périmètre de Donaye 8.
Lutte contre la dégradation des sols dans la vallée du fleuve Sénégal. Document PSI, technical
report.
Hammecker, C., Antonino, A.C.D., Maeght, J-L. and Boivin, P. 2003. Experimental study and
numerical modelling of the water transfers in an irrigated plot in Northern Senegal: evidences
of air entrapment. European Journal of Soil Science. 54: 491-503
Hardie, L. A. and Eugster, H. 1970. The evolution of closed basin brines. Mineral. Soc. Amer. Spec.
Pap., 3, 273-290.
Helyar, K.R. and Porter, W.M., 1989. Soil acidification, its measurement and the processes
involved. In: A.D. Robson (Editor), Soil acidity and plant growth. Academic press, Sydney,
pp. 61-101.
House, W.A, Howson, M. R., Pethybridge, A. D., 1988. Crystallisation kinetics of calcite in the
presence of magnesium ions. J. Chem. Soc., Faraday Trans. 1, 84 : 2723 - 2734,
Madé, B., 1991. Modélisation thermodynamique et cinétique des réaction géochimiques dans les
interactions eau-roche. PhD thesis, Université Louis Pasteur, Strasbourg.
Maignien R., 1961. Contribution à l'étude des sols à pâturage du cercle du Gorgol. Rapp. Off.
Rech. sci. tech. O-mer, Dakar, 125 p. multigr.
ird-0
0396
823,
ver
sion
1 -
19 J
un 2
009

1 2 3 4 5 6 7 8 9 10 11 12 13 14 15 16 17 18 19 20 21 22 23 24 25 26 27 28 29 30 31 32 33 34 35 36 37 38 39 40 41 42 43 44 45 46 47 48 49 50 51 52 53 54 55 56 57 58 59 60 61 62 63 64 65
33
Parkhurst, D.L., Appelo C.A.J., 1999. User’s guide to PHREEQC (version2)-a computer program
for speciation, batch-reaction, one-dimensional transport, and inverse geochemical
calculations. Water-Resources investigations report 99-4256 USGS, Denver, Colorado
Pinton, R., Varanini, Z., Nannipieri, P. 2001. The Rhizosphere: Biochemistry and Organic
Substances at the Soil-plant Interface. CRC Press. 424 pp.
Valles, V., Pachepsky, Y.A., Ponizovsky,A.A. 1991. Invariant criteria for irrigation water quality
assessment in arid and semi arid regions. In: Genesis and Control of Fertility of Salt Affected
Soils. ISSS Sub-Commission on Salt Affected Soils Science, USSR, V.V. Dokuchaev Soil
Institute, Moscow, pp. 330-333.
van Asten, P.J.A. 2003. Soil Quality and Rice Productivity Problems in Sahelian Irrigation
Schemes, PhD thesis, Wageningen University, the Netherlands, 143 pp.
van Asten, P.J.A., Barbiéro L., Wopereis M.C.S. and van der Zee, S.E.A.T.M. 2003. Actual and
potential salt-related soil degradation in an irrigated rice scheme in the Sahelian zone of
Mauritania. Agricultural Water Management. 60:13-32
van Asten, P. J. A., van 't Zelfde, J. A., van der Zee, S. E. A. T. M. and Hammecker, C. 2004. The
effect of irrigated rice cropping on the alkalinity of two alkaline rice soils in the Sahel,
Geoderma, 119: 233-247
van Beek, C.G.E. and Van Breemen, N. 1973. The alkalinity of alcali soils. J. Soil Sci. 24:129-136
van Ranst, E. and de Coninck, F. 2002. Evaluation of ferrolysis in soil formation. European Journal
of Soil Science. 53:513-519
Rengel, Z. 2003. Handbook of soil acidity , CRC Press, 496 pp
Ribolzi, O., Valles, V., Bariac, T., 1996. Comparison of hydrograph deconvolutions using residual
alkalinity, chloride and oxygen 18 as hydrochemical tracers. Water Res. Resour. 32 (4), 1051-
ird-0
0396
823,
ver
sion
1 -
19 J
un 2
009
1 2 3 4 5 6 7 8 9 10 11 12 13 14 15 16 17 18 19 20 21 22 23 24 25 26 27 28 29 30 31 32 33 34 35 36 37 38 39 40 41 42 43 44 45 46 47 48 49 50 51 52 53 54 55 56 57 58 59 60 61 62 63 64 65
34
1059.
Riverside Salinity Laboratory Staff, 1954. Diagnosis and Improvement of Saline and Alkali Soils.
Agriculture Handbook n°60, United States Department of Agriculture
Schiess, S. 1995. Alcalinisation des sols irrigués dans la moyenne vallée du fleuve Sénégal :
diagnostique (sic) par évaluation du stock de carbonates. M.Sc. Thesis, EPFL, Lausane,
Switzerland.
Sharma, P., Pantuwan, G., Ingram, K., DeDatta, S. 1994. Rainfed lowland rice roots: soil and
hydrological effects. In: GJD, K. (Ed.), Rice Roots Nutrient and Water Use. IRRI, Manila, pp.
55 66.
Slaton, N.A., Beyrouty, C.A., Wells, B.R., Norman, R.J., Gbur, E.E. 1990. Root growth and
distribution of two short-season rice genotypes. Plant and Soils. 121: 269-278
Stumm, W., Morgan, J.J., 1970. Aquatic Chemistry : An Introduction Emphasing Chemical
Equilibria in Natural Waters. Wiley, New York.
ird-0
0396
823,
ver
sion
1 -
19 J
un 2
009
1 2 3 4 5 6 7 8 9 10 11 12 13 14 15 16 17 18 19 20 21 22 23 24 25 26 27 28 29 30 31 32 33 34 35 36 37 38 39 40 41 42 43 44 45 46 47 48 49 50 51 52 53 54 55 56 57 58 59 60 61 62 63 64 65
35
Figure 1 : Location of the studied sites
Figure 2 : Schematic representation water use dynamics in simulation : a. after irrigation, 2 liters of
superficial ponding water + 1 liter soil solution in the root zone, b. : after evaporation and just
before the next irrigation, 1 liter of soil solution in the root zone.
Figure 3: Schematic representation of the procedure adopted to simulate the effects of the leaching
fraction (L.F.) and of the superficial flushing (S.F.). a. -1: the soil is saturated, 2 : at the end of the
concentration period, part of the remaining solution is evacuated from the system (LF). b. -1 : at the
end of an inter-cropping period precipitated minerals and concentrated solutions are close to the soil
surface, 2: addition of a superficial layer of irrigation water, dissolving the minerals and
equilibrating with soil solution and and exchangeable cations, 3: part of the superficial layer is
evacuated.
Figure 4 : Evolution of irrigation water composition during concentration for pCO2 = 101.5 Pa and
possibility for common minerals (calcite, quartz, sepiolite, kaolinite, gypsum) to precipitate.
Figure 5 : Evolution of irrigation water composition during concentration in the Riverside diagram.
Figure 6 : Evolution of soil solution and adsorption complex for Foum Gleita. RAC : RAcalcite , the
straight horizontal solid line states for the precipitation of calcite.
Figure 7 : Evolution of soil solution and adsorption complex for Niono. RAC : RAcalcite , the
straight horizontal solid line states for the precipitation of calcite and the dotted line for the
precipitation of sepiolite.
ird-0
0396
823,
ver
sion
1 -
19 J
un 2
009
1 2 3 4 5 6 7 8 9 10 11 12 13 14 15 16 17 18 19 20 21 22 23 24 25 26 27 28 29 30 31 32 33 34 35 36 37 38 39 40 41 42 43 44 45 46 47 48 49 50 51 52 53 54 55 56 57 58 59 60 61 62 63 64 65
36
Figure 8 : Evolution of soil solution and adsorption complex for Donaye, RAC : RAcalcite , the
straight horizontal solid line states for the precipitation of calcite and the dotted line for the
precipitation of gypsum.
Figure 9 : Evolution of pH, EC of soil solution, ESP and RAcalcite of the soil solution for Foum
Gleïta considering presence (solid line) and absence (dotted line) of plant uptake.
Figure 10 : Evolution of pH, EC of soil solution, ESP and RAcalcite of the soil solution for Niono
considering presence (solid line) and absence (dotted line) of plant uptake.
Figure 11 : Evolution of pH, EC of soil solution, ESP and RAcalcite of the soil solution for Donaye
considering presence (solid line) and absence (dotted line) of plant uptake.
Figure 12 : Evolution of pH, EC of soil solution, ESP and RAcalcite of the soil solution for Foum
Gleïta, considering different superficial flushing rates, vertical drainage and plant uptake.
Figure 13 : Evolution of pH, EC of soil solution, ESP and RAcalcite of the soil solution for Niono,
considering different superficial flushing rates, vertical drainage and plant uptake.
Figure 14 : Evolution of pH, EC of soil solution, ESP and RAcalcite of the soil solution for Donaye,
considering different superficial flushing rates and plant uptake.
Figure 15 : Comparison of soil quality between irrigated rice cropped plots and uncultivated soil in
Donaye. The diagrams were obtained with superficial (0-10cm) soil samples, n=130 in irrigated
plots and n=95 in uncultivated soils.
ird-0
0396
823,
ver
sion
1 -
19 J
un 2
009
Revision notes for the manuscript GEODER 4246 :
Simulating the evolution of soil solutions in irrigated rice soils in the Sahel.By
Claude Hammeckera, Piet van Astenb e, Serge Marletc, Jean-Luc Maeghta and Roland Possd.
The comments and corrections suggested by the reviewers have been taken into account in the new
version of the manuscript. Considering the numerous items listed by the reviewers, they will not be
commented individually.
Reviewer 1 :
The different sites studied in this paper have been put into a regional context demonstrating
their relevance according to specific geological, geomorphological, pedological, and textural
conditions. Moreover their specific water management and hydrological conditions have been
highlighted.
The evolution of the Residual Alkalinity Calcite has been introduced into the new version of the
manuscript, according to the reviewers recommendations. However this simulation study
showed that ARcalcite is dependent on the mixing of solutions where pCO2 is different, and
therefore partially fails to its conservative tracer property.
The typos and missing references have been corrected.
As during the simulated process, the volume of solution varies between two consecutive
irrigations, the results presented for the soil solution compositions and the exchangeable cations
are those computed for the situation where the water level in the plot is at the maximum, that is
just before evaporation starts. Therefore the results presented in the manuscript are not exactly
thoses for which the most soluble minerals like sepiolite or gypsum precipitate, though they do
precipitate just before the next irrigation.
* Revision NotesClick here to download Revision Notes: revision notes.doc
ird-0
0396
823,
ver
sion
1 -
19 J
un 2
009
The authors chose to keep the results and the discussion in the same section, in order to avoid
repeating the same statements. However as recommended by the reviewer, the results have been
discussed more thoroughly and documented.
Extreme ESP values or Mg concentrations in soil solution and on the exchangeable complex,
computed by the model in absence of plant or drainage have not been observed in field
conditions, attesting that these processes have an important influence on the evolution of the
soil and soil solution. When taken into account in the simulations they contribute in mitigating
the influence of adverse irrigation water quality, displaying results closer to reality.
The functioning of the model PHREEQC has been described more clearly in the revised
version.
The units for pCO2 have been homogenized and the choice of pCO2 in tropical soils has been
documented.
The reference to soil reduction and specially to ferrolysis had been precised according to the
reviewers recommendations.
In the conclusion we drew recommendations for a long lasting management of irrigation
schemes according to the specificity of each site.
ird-0
0396
823,
ver
sion
1 -
19 J
un 2
009

Reviewer 2 :
As suggested, it has been stated more precisely that the results presented in the manuscript are
simulations and not experimental results. However each it was possible the simulated results
were validated by field data or references.
The different precisions about the the definitions of alkalinity, ESP, SAR, EC, Ece, SARe
required by the reviewer have been introduced in the revised version, when available.
Supersaturation of the soil solution has not been taken into account in these study as it is usually
governed by kinetic processes. Considering that the simulations are aimed to describe long term
evolutions, we felt that the it would not have improved the simulation and the final results.
The use of abbreviations has been improved and homogenized in the new version of the
manuscript.
Few data were available about the irrigation efficiencies in the different sites. Therefore this
subject has not been discussed in the paper, though we understand it's importance.
ird-0
0396
823,
ver
sion
1 -
19 J
un 2
009
1 2 3 4 5 6 7 8 9 10 11 12 13 14 15 16 17 18 19 20 21 22 23 24 25 26 27 28 29 30 31 32 33 34 35 36 37 38 39 40 41 42 43 44 45 46 47 48 49 50 51 52 53 54 55 56 57 58 59 60 61 62 63 64 65
Simulating the evolution of soil solutions in irrigated rice soils in the Sahel.
Claude Hammeckera, Piet van Astenb e, Serge Marletc, JeanLuc Maeghta and Roland Possd.
a Institut de Recherche pour le Développement UR 176, Land Development Department,
Office of Science for Land Development, Pahonyothin Road, Chatuchak, Bangkok 10900,
Thailand.
Fax : +66 2561 2186
Email : [email protected]
b WARDA, The Africa Rice Center, BP 96, St.Louis, Senegal.
C CIRAD, UMR GEAU, Avenue Agropolis, 34398 Montpellier Cedex 5, France
d Institut de Recherche pour le Développement UR 176, SupAgro, 2 place Viala, 34060
Montpellier cedex 1, France
e present address : IITA ESARC P.O.Box 7878 Kampala, Uganda
1
* Marked ManuscriptClick here to view linked References
ird-0
0396
823,
ver
sion
1 -
19 J
un 2
009

1 2 3 4 5 6 7 8 9 10 11 12 13 14 15 16 17 18 19 20 21 22 23 24 25 26 27 28 29 30 31 32 33 34 35 36 37 38 39 40 41 42 43 44 45 46 47 48 49 50 51 52 53 54 55 56 57 58 59 60 61 62 63 64 65
Abstract
In sahelian countries, agriculture often relies on irrigation especially for rice cropping which
has been introduced these last decades. As most of the water resources used for irrigation
(mainly rivers and lakes) have an alkaline composition, rice cropping is often held as
responsible for soil alkalinization. In order to evaluate the probability for this process to
occur, we studied 3 different sites in West Africa where numerical simulation of the
geochemical interactions between soil, irrigation water and groundwater were performed
with PHREEQC. It was possible to simulate the evaporation of the ponding water, the mixing
between groundwater and irrigation water, the lateral drainage (flushing) and the leaching,
and finally the management of the crop residues. By performing prospective simulations over
60 cropping cycles it has been shown that soil alkalinization and sodication are not inevitable
in these area especially if the cropping is properly managed. Moreover, when straw is
removed and the plot flushed before the new cropping season, alkaline soils can even be
improved with rice cropping.
Keywords : alkalinization, sodication, PHREEQC, plant uptake, water management, West
Africa
2
ird-0
0396
823,
ver
sion
1 -
19 J
un 2
009
1 2 3 4 5 6 7 8 9 10 11 12 13 14 15 16 17 18 19 20 21 22 23 24 25 26 27 28 29 30 31 32 33 34 35 36 37 38 39 40 41 42 43 44 45 46 47 48 49 50 51 52 53 54 55 56 57 58 59 60 61 62 63 64 65
Introduction
In the Sahel, irrigated rice (Oryza Sativa L.) cropping has been introduced on a wide scale
during the last 20 years. The construction of large (> 100 ha) and costly irrigation schemes
were intended to increase food security and provide income for Sahelian farmers, whose
crops and livestock were devastated during the droughts in the 19701980’s. Irrigated rice
cropping in the hot and dry Sahelian climate seems like a paradox. However, the major
Sahelian rivers and some large artificial reservoirs provide more than sufficient water to
support current irrigation activities throughout the year. Although most Sahelian irrigation
waters contain relatively little salt, they usually show alkaline compositions, where alkalinity
(Alk.) is the dominant aqueous species. It is defined as the algebraic sum of the strong base
cation and strong acid anion equivalents (Stumm and Morgan, 1970), and can be expressed
as : Alk. = (HCO3)+ (CO3
2) +(OH) (H+) , where ( ) denote the total concentration in
molc l1 . Moreover most of the Sahelian irrigation waters, show also a positive calcite residual
alkalinity (RAcalcite) which corresponds to the alkalinity of the solution after precipitation of
calcite : RAcalcite = Alk. – (Ca2+), (Valles et al., 1991; Bertrand et al., 1993). RAcalcite has also
been shown to be a conservative tracer of the soil solution ( Ribolzi et al., 1996; Barbiero et
al., 2001; Barbiero et al., 2004). Even the residual sodium carbonate, defined as RSC = Alk.
– (Ca2+) (Mg2+) ; which corresponds to the alkalinity of the solution after calcite and Mg
carbonate or Mgsilicate precipitation, is positive for these solutions and is an indicator of
potential alkalinization and sodication (Eaton, 1950; Hardie and Eugster, 1970; Van Beek and
Van Breemen, 1973; Al Droubi et al.,1980). Continuous concentration of such waters in the
soil root zone may lead to the formation of alkaline and sodic soils, showing both high pH
values and high exchangeable sodium percentage : ESP = XNa+ / CEC , where XNa+ is the
3
ird-0
0396
823,
ver
sion
1 -
19 J
un 2
009
1 2 3 4 5 6 7 8 9 10 11 12 13 14 15 16 17 18 19 20 21 22 23 24 25 26 27 28 29 30 31 32 33 34 35 36 37 38 39 40 41 42 43 44 45 46 47 48 49 50 51 52 53 54 55 56 57 58 59 60 61 62 63 64 65
exchangeable Na+ and CEC the total cation exchange capacity. Such soils are less productive
because of the pHinduced loss or low availability of several plant nutrients (e.g. Fe, P, Zn)
and poor physical properties of the sodic horizon (Abrol et al., 1988).
Whether or not large quantities of alkaline salts will accumulate in the soil root zone depends
largely on the water balance of the root zone. Evapotranspiration in the Sahelian climate can
be very large and regularly exceeds rates of 10 mm day1 in the dry season (November – May)
when maximum temperatures reach 40 to 45 °C (Van Asten et al., 2003, Hammecker et al.,
2003). In most irrigation schemes, percolation rates are very low (< 4 mm day1) (Condom,
2000 ; Hammecker et al., 2003 ; Van Asten, unpublished), due to the low hydraulic
conductivity of the clayey soils and air entrapment (Hammecker et al., 2003). In the course of
the cropping season, percolation rates can further decrease if groundwater levels reach the
soil surface. The combination of large evapotranspiration and small percolation can lead to
the excessive build up of alkaline salts in the long run.
Recent studies have shown that the current soil alkalinity and sodicity problems in Sahelian
irrigation schemes are primarily caused by salts that originate from the parent material
(Barbiero and Van VlietLanoe, 1998, Van Asten et al., 2004), or that accumulated as a result
of longtime irrigation of nonflooded crops in combination with shallow saline groundwater
levels. Hence, these salts were already in the soils before irrigated rice cropping was
introduced and there is little indication that the recent introduction of irrigated rice cropping
contributed to a significant increase in the salt content of these soils (van Asten, 2003).
Moreover, most rice soils have the capacity to buffer an increase in soil solution alkalinity
through desorption of exchangeable Ca2+ and the subsequent precipitation of calcite.
However, although this buffer capacity is large, it is not infinite. Consequently, it still remains
uncertain whether current irrigation practices will not lead to soil alkalinization and
4
ird-0
0396
823,
ver
sion
1 -
19 J
un 2
009

1 2 3 4 5 6 7 8 9 10 11 12 13 14 15 16 17 18 19 20 21 22 23 24 25 26 27 28 29 30 31 32 33 34 35 36 37 38 39 40 41 42 43 44 45 46 47 48 49 50 51 52 53 54 55 56 57 58 59 60 61 62 63 64 65
sodication in the long run (i.e. some decades) in areas where salts added through irrigation
can not sufficiently be leached or evacuated from the soil root zone. Given the high
investment costs of irrigated agriculture and the high costs of reversing alkalinization and
sodication processes, it is important to know whether current or alternative crop and water
management will lead to the degradation of one of the Sahel’s most productive crop system.
In this study, we focus on three Sahelian irrigation situations, inside irrigation schemes, that
differ distinctly in terms of parent material, soil water balance and irrigation water quality.
All sites have earlier been subject of studies on soil and water quality (Hammecker and
Maeght, 1999; Boivin et al., 2002; Van Asten, 2003). Therefore, mean values for basic crop,
water and soils parameters are already available. Taking into account some of the most
important chemical and hydrological features, we tried to simulate how soils and soil
solutions would evolve over time, under current and alternative land management practices
at the three sites. The most critical parameter; i.e. the ratio between leached and irrigated
solution volume, is the leaching fraction (LF) whether with vertical drainage or lateral
drainage (flushing). In order to account for spatial variability within the irrigation schemes,
we calculated soil solution evolution for different leaching fractions. This approach allows for
the identification of the minimum leaching fraction that is required, in order to prevent soil
degradation in the long run. Proton excretion (or alkalinity uptake) by the rice plant can also
contribute significantly to the alkalinity balance of the soil root zone (Van Asten et al., 2004)
and was also taken into account.
The objectives of this study are: (i) to give an overview of basic soil and water parameters for
a range of Sahelian irrigation schemes, (ii) to simulate soil evolution under current and
5
ird-0
0396
823,
ver
sion
1 -
19 J
un 2
009

1 2 3 4 5 6 7 8 9 10 11 12 13 14 15 16 17 18 19 20 21 22 23 24 25 26 27 28 29 30 31 32 33 34 35 36 37 38 39 40 41 42 43 44 45 46 47 48 49 50 51 52 53 54 55 56 57 58 59 60 61 62 63 64 65
alternative crop and water management practices, and (iii) to identify the minimum leaching
fraction that is required to prevent soil degradation in the long term.
2. Material and methods
2.1.Study sites
This study is based on data collected in three different irrigation areas in West Africa located
in the valley of River Senegal, the Gorgol noir and in the valley of river Niger, where
irrigated rice cropping is the main agricultural activity.
These sites are representative of most of the conditions where ricecropping cultivation is
observed in the Sahel, and are representative of different geological, geomorphological and
pedological siuations with different soil textures. They are representative of (i) silty clay
loam soils, developed on crystalline bedrock (Foum Gleita), (ii) alluvial levees with loamy
sand soils (Niono) and (iii) alluvial basin with clayey vertisol (Donaye).
2.1.1.Foum Gleïta
The 'Mauritanides' geological region where Foum Gleita is located, is representative of the
PanAfrican orogenic belt which has been folded and lifted in the Appalachian era (Carité,
1989) and is consisting of metamorphic rocks, mainly greenschists, calcshists, micaschists and
quartz, and secondary intrusions of dolerite, on which pedogenesis developed alkaline soils.
The Foum Gleita irrigation scheme is located in central southern Mauritania (N16°08’;
W12°46’). The scheme was constructed between 1985 and 1989, with a surface area of 1950
ha. Irrigation water originates from a large artificial lake that formed behind a dam in the
Gorgol Noir river. Irrigation and drainage are gravimetric but the drainage canals are often
6
ird-0
0396
823,
ver
sion
1 -
19 J
un 2
009
1 2 3 4 5 6 7 8 9 10 11 12 13 14 15 16 17 18 19 20 21 22 23 24 25 26 27 28 29 30 31 32 33 34 35 36 37 38 39 40 41 42 43 44 45 46 47 48 49 50 51 52 53 54 55 56 57 58 59 60 61 62 63 64 65
not functional due to poor maintenance. Most soils in Foum Gleita have formed from the
schist parent rock that can be found at shallow depths (< 2.5m) (Van Asten et al., 2003). Soil
texture is mostly silty clay loam, with around 30% clay. Although no specific clay
mineralogical studies have been done in the Foum Gleita schemes, other studies in the Gorgol
basin have shown that a large proportion of the clays are illites and kaolinites (Maignien,
1961; Audry, 1961). The soils have a moderate to strong structure, varying from subangular
blocky to prismatic in the more vertic soils. Biological activity in these soils is generally high.
The porosity of the soils is generally medium to high, but is distinctly lower near soil surface.
Although some soils have high ESP values, up to 65%, no evidence of soil structure
degradation due to sodication has been observed in Foum Gleita. (Van Asten et al., 2003). In
this region the cation exchange capacity (CEC) of soils ranges from 8 to 18 cmolc.kg1, and
the electrical conductivity of the 1:5 paste (EC1:5) varies from 0.12 to 1.32 dS.cm1.
Percolation rates are generally below 4 mm day1, and decrease during the rainy season as
groundwater approaches the surface. On a few soils, high percolation rates were measured
(> 10 mm day1) and farmers complained about difficulties in maintaining a submersion
needed for rice. After the cropping season, groundwater quickly drops to below 1.2 m,
indicating that deep percolation into the vertically oriented bedrock occurs, suggesting that
horizontal groundwater flow along the slopes is minimal (van Asten et al., 2003). The
absence of a shallow groundwater level during fallow periods suggests that capillary rise from
the ground water can generally be neglected as a source of (alkaline) salts. The irrigation
water is 2 to 4 times more saline than at the other study sites (EC = 0.17 dS.m1), but the
sodium adsorption ratio, defined as : SAR = Na+ /(Ca2+ +Mg2+)1/2 where the concentration
are in mmol.l1 , is still considered as very low (0.42). The residual sodium carbonate (RSC) is
low and consequently suitable for irrigation according to the Riverside’s diagram (see table
7
ird-0
0396
823,
ver
sion
1 -
19 J
un 2
009

1 2 3 4 5 6 7 8 9 10 11 12 13 14 15 16 17 18 19 20 21 22 23 24 25 26 27 28 29 30 31 32 33 34 35 36 37 38 39 40 41 42 43 44 45 46 47 48 49 50 51 52 53 54 55 56 57 58 59 60 61 62 63 64 65
1). However, as at the other sites, RSC is positive and may therefore lead to alkalinization
and sodication.
2.1.2. Niono
The site of Niono, is typical of the inner Delta of river Niger, developed on three different
geological units: (i) Infracambrian substratum (500 to 480 M years) composed of fractured
schists and sandstones, (ii) Continental Terminal of Post Eocene to PreQuaternary age (2.5
to 2 M years) formed by alternate sedimentary deposits of clays, sandy clays and sand , (iii)
recent quaternary alluvial sediments deposited by the river Niger. In the studied area, the
main morphological units are sandy levees, loamy inter levee depressions and clayey
settling basins.
The study is based on data obtained in the huge irrigation scheme of the Office du Niger in
Mali near Ségou (14°32 N 05°59 W). The climate is semiarid (sudanosahelian) with an
average rainfall of 460 mm/year, distributed from June to October. The annual evaporation
reaches 2.5m which generates soil solution concentration and consequently alkalization
processes related to the alkaline composition of irrigation water (Condom, 2000) . The
distribution of the soils in this area is inherited from ancient delta deposits constituted of
clayey depressions delimited by sandy levees. These soils evolved under hydrologic conditions
imposed by the water management during last half century, especially related to the uprise of
the groundwater level.
The soils in this study are located on a little levee. The upper soil layers are composed of 11%
clay and 78% sand, and classified as loamy sand. The identified clay minerals are mainly
kaolinite, smectite and traces of illite. The structure of the soil is polyhedral. The soil displays
an important biological porosity in the upper part of the profile (070cm) due to roots and to
8
ird-0
0396
823,
ver
sion
1 -
19 J
un 2
009
1 2 3 4 5 6 7 8 9 10 11 12 13 14 15 16 17 18 19 20 21 22 23 24 25 26 27 28 29 30 31 32 33 34 35 36 37 38 39 40 41 42 43 44 45 46 47 48 49 50 51 52 53 54 55 56 57 58 59 60 61 62 63 64 65
mesofauna activity. The CEC for this soil is 9 cmolc/kg but with large proportion of
exchangeable sodium (ESP) of about 16% (table 2) ; the EC1:1 for the soils in the area range
from 0.18 to 1.09 dS.m1 . For the last 30 years the fields have been mainly cropped in rice
with market gardening as a marginal activity (Condom, 2000).
In this large irrigation scheme plots are equipped with lateral drainage canals receiving
mainly water from superficial flushing. After several decades of intensive irrigation, the water
table level has risen approximatively by 50 m and is now close to the surface. Condom
(2000) found that during the cropping season the average infiltration was about 80 mm (i.e.
9% of the leaching fraction), whereas during the inter cropping periods an equivalent
amount of water from the water table supplied capillary rise towards the surface. Lateral
losses towards drains and leaks represent 26 % of the total water inputs (Condom, 2000).
The Niger River that supplies the irrigation water by gravity has very low concentration (EC)
and SAR values (Table 1), whereas the groundwater is 10 times more concentrated with a
very high SAR value. According to the Riverside classification (Riverside salinity lab. staff,
1954) the quality of irrigation water does not constitute any harm to soil conservation but the
composition of the groundwater typically represents a sodic hazard. Nevertheless, as
illustrated by the positive RAcalcite and RSC value (Table 1), these solutions can both become
very alkaline and sodic when they concentrate, as the Ca2+ and Mg2+ might precipitate in
minerals with low solubility like calcite and Mgcarbonates or Mgsilicates (e.g. sepiolite),
whereas alkalinity and Na, keep concentrating in the solution (Vallès, 1991; Bethke, 2007).
2.1.3. Donaye
The third site, Donaye is representative of the irrigated soils of the river Senegal, representing
9
ird-0
0396
823,
ver
sion
1 -
19 J
un 2
009

1 2 3 4 5 6 7 8 9 10 11 12 13 14 15 16 17 18 19 20 21 22 23 24 25 26 27 28 29 30 31 32 33 34 35 36 37 38 39 40 41 42 43 44 45 46 47 48 49 50 51 52 53 54 55 56 57 58 59 60 61 62 63 64 65
a total surface area of irrigation schemes of 240,000 ha (Barbiero et al., 2001). These soils
developed on marine sediments deposited during the Nouakchottian transgression (4300 BP)
which extended 380 km inland, near Bogué.
The irrigation scheme is located in northern Senegal (N16°40’; W15°), in the middle valley of
the Senegal River, near Podor. It is a 20yearold irrigation scheme managed by the farmers,
without drainage network. The soil which has for long time been described as formed by
recent alluvial deposits is a vertisol (vertic Xerofluvent). However in a recent work Barbiero
et al. (2005) have suggested that the soil distribution in lower and middle valley of river
Senegal might result from the pedological transformation of a unique unripe mud, deposited
during the last quaternary marine transgressions. The soils of the Senegal valley can be
considered as a chronosequence, where the most recent soils can be observed downriver in
the delta, and the most developed ones upriver, in the middle valley. The pedological process
driven by the acidic conditions associated to the oxidation of inherited pyrite, led to the
dissolution of the parental mud. The protonation and acid hydrolysis of the aluminosilicates
in this material resulted in the formation of a sandy horizon, representing the quartz
skeleton. In the upper part of the soil, the interaction of the river water (through floods and
irrigation ) with the acidic, Al and Si rich soil solution contributed to the precipitation of clay
minerals, forming vertisols. In the Delta of the river Senegal this process is still active
(Barbiero et al. 2005) and the vertisol is still thin whereas in Donaye it represents a two
meterdeep soil showing a vertic structure (slickensides), and constituted by 65 to 70% clay
minerals, mainly beidellite and kaolinite (Favre et al., 2002), which shows a high cation
exchange capacity of 22.7 cmol.kg1(table 2). The soil overlays a 5 to 6 m thick sandy layer
corresponding to the afore mentioned quartz skeleton.
Rice cropping is performed by surge irrigation, and flooding is maintained during the
10
ird-0
0396
823,
ver
sion
1 -
19 J
un 2
009
1 2 3 4 5 6 7 8 9 10 11 12 13 14 15 16 17 18 19 20 21 22 23 24 25 26 27 28 29 30 31 32 33 34 35 36 37 38 39 40 41 42 43 44 45 46 47 48 49 50 51 52 53 54 55 56 57 58 59 60 61 62 63 64 65
complete plant growth cycle (about 100 days). The presence of a shallow water table at 2m
depth contributes to air entrapment and stops vertical infiltration (Hammecker et al. 2003).
Consequently, vertical leaching is negligible, and soil solution in the upper part of the profile
(above 40 cm) does not connect with the water table during the irrigation period. However,
bad maintenance of bunds aimed to hold the irrigation in the paddy plots, generates
important leaks contributing to non negligible loss of water, especially during the first
irrigation. Irrigation water is pumped in a loop of river Senegal called Doué. This water with
a very low concentration (EC = 0.07 dS.m1) and a low SAR value (Table 1), is suitable for
irrigation according to Riverside's diagram. Nevertheless, like in the former situations, the
RAcalcite and RSC of the irrigation water are positive, and the concentration of this solution
may lead to sodication.
2.2. Numerical simulation.
2.2.1. The model and its main parameters.
The evolution of the soil solution and its interactions with the solid phase (precipitation
dissolution and exchange processes) were evaluated with the computer model PHREEQC v2.
(Parkhurst and Appelo, 1999). This model, based on aqueous thermodynamics, computes
equilibrium chemistry of aqueous solutions interacting with minerals, gases, solid solutions,
exchangers, and sorption surfaces, providing a full speciation of an aqueous system. The
different databases provided with the model give a very wide possibility for computing the
activities of most of the aqueous species present in natural solutions, especially for the CO3
HCO3 solutions. This model is especially useful as, in addition to the calculation of the
chemical equilibria, it allows for the simulation of mixing different solutions, for
concentrating solution due to evaporation, and for adding or taking out aqueous species from
11
ird-0
0396
823,
ver
sion
1 -
19 J
un 2
009

1 2 3 4 5 6 7 8 9 10 11 12 13 14 15 16 17 18 19 20 21 22 23 24 25 26 27 28 29 30 31 32 33 34 35 36 37 38 39 40 41 42 43 44 45 46 47 48 49 50 51 52 53 54 55 56 57 58 59 60 61 62 63 64 65
the soil solution. Using these options, it is possible to simulate solution changes due to
flooded irrigation combined with concentration of the soil solution and evaporation. In surge
flooding conditions, successive water inputs are usually performed to maintain a constant
ponding level.
Considering the duration of the rice cycle, the average evapotranspiration and the soil
porosity, Hammecker et al. 2003 found that about 17 irrigations were necessary during one
growing cycle. Considering that in the PHREEQC model all the calculations are performed
for a given volume of solution, the Cation Exchange Capacity (CEC) and exchangeable
cations were expressed per volume of liquid phase, depending on the soil porosity. The mass
balance for water and solutes was calculated in the root zone, i.e. the first 20 centimeters of
the soil profile (Slaton et al., 1990; Sharma et al., 1994; Boivin et al.2002). The irrigation
water management during the cropping season, was simulated for one liter of soil solution in
the root zone and the corresponding water volume for the superficial ponding water. As
depicted in figure 2, during the first irrigation of the season 3 liters are introduced into the
system : 1 liter for the soil solutions, and two liters for superficial ponding. During the
cropping season, the superficial water level can almost disappear completely, but farmers
usually irrigate before the complete dryingup of the plot.
Different hydrological conditions, typical of field situations, were considered to simulate the
geochemical evolution taking into account different leaching fractions, presence or absence of
capillary rise from an aquifer with different composition, and the influence of plant uptake of
nutriments. The actual leaching fraction (LF) being considered is the fraction of applied
irrigation water that drains below the root zone :
LF=Dd
Da
[1]
Where Dd [L] is the amount of water drained below the root zone and Da [L] the amount of
12
ird-0
0396
823,
ver
sion
1 -
19 J
un 2
009

1 2 3 4 5 6 7 8 9 10 11 12 13 14 15 16 17 18 19 20 21 22 23 24 25 26 27 28 29 30 31 32 33 34 35 36 37 38 39 40 41 42 43 44 45 46 47 48 49 50 51 52 53 54 55 56 57 58 59 60 61 62 63 64 65
irrigation water applied.
2.2.2. Chemical equilibria
Ionic activities in the soil solution were computed according to DebyeHückel expression,
based on the ionic strength of the solution. The soil solution was equilibrated with exchange
sites on clay minerals and organic matter following Gaines and Thomas (1953) convention
and mass conservation. Equilibrium with gas and minerals were considered for those initially
present in soil, and those likely to crystallize or to affect the evolution of soil solution. The
minerals usually found in arid soils like Mgcalcite, gypsum, quartz, kaolinite and sepiolite,
were allowed to precipitate and dissolve, consequently to modify the composition of the
solution. As quartz is initially present in the soil, this mineral has been chosen rather than
amorphous silica, though the two options were tested and no differences in the major results
of these simulations were found. When Al in solution analysis was not available it was
computed considering equilibrium with kaolinite at the pH of the soil solution. The main
solid and gaseous phases used in these simulations are reported in table 3, with their
dissociation equation, and solubility products (K). Partial CO2 pressure was considered to be
equal to atmospheric value (log pCO2 = 3.5 atm) whereas in the soil solution it was
considered to be higher and constant, with log pCO2 = 1.8 atm, like in most of the tropical
soils (Brook et al. 1983). The crystallization of the different minerals was considered to take
place when the solution reached equilibrium, regardless of any eventual supersaturation or
kinetics phenomenon. However as the simulation is performed over a very long term, with
different water contents, these processes will scarcely affect the final result.
2.2.3 The hydrological parameters
13
ird-0
0396
823,
ver
sion
1 -
19 J
un 2
009
1 2 3 4 5 6 7 8 9 10 11 12 13 14 15 16 17 18 19 20 21 22 23 24 25 26 27 28 29 30 31 32 33 34 35 36 37 38 39 40 41 42 43 44 45 46 47 48 49 50 51 52 53 54 55 56 57 58 59 60 61 62 63 64 65
The adopted procedure for calculation was first, to equilibrate the irrigation solution with the
soil solution, the mineral phases, and the partial CO2 pressure in soil (101.8 atm). The
resulting solution was then concentrated to 5% of its original volume, as the farmers don't let
the plot dry out completely. This value has been estimated from experimental observations
(Hammecker, non published), though it has been verified that the choice of this value has
little influence on the final result. During this procedure equilibria with the solid phase were
computed considering the soils being initially formed by quartz, kaolinite, beidelite and by
their respective exchangeable cations (table 2).
Finally, depending on the leaching fraction (LF), the remaining water content after
evaporation (Q0) was added to a new amount of irrigation water (Q1), in order to start a new
simulation with the same amount of water (one liter), following this relation :
Q0= (1LF) 0.05
Q1=1Q0
[2a]
[2b]This procedure was performed 17 times for one cropping cycle, and 60 cropping cycles were
simulated. In order to take into account the capillary rise in these geochemical processes, we
estimated the quantity of solution possibly risen from the water table towards the root zone
with water flows derived from hydraulic gradients measured during the dry period (Condom,
2000). As capillary rise occurs only during the intercropping period, we treated both periods
together, by mixing the two solutions (irrigation and water table) in their respective
proportions (90% and 10%) in the root zone.
In addition to vertical drainage, superficial lateral drainage (flushing) is performed
intentionally or accidentally by the farmers in some situations. During this type of water
management all salts and concentrated soils solutions present in the superficial layers of soil
are dissolved and partially evacuated with the first water input at the beginning of the
14
ird-0
0396
823,
ver
sion
1 -
19 J
un 2
009
1 2 3 4 5 6 7 8 9 10 11 12 13 14 15 16 17 18 19 20 21 22 23 24 25 26 27 28 29 30 31 32 33 34 35 36 37 38 39 40 41 42 43 44 45 46 47 48 49 50 51 52 53 54 55 56 57 58 59 60 61 62 63 64 65
cropping period. As the soil profile dried out during the intercropping season most of the
soluble salts have accumulated in surface. Superficial lateral drainage experiment performed
in Donaye showed that just with natural leakage from the bunds, an average of 15% of the
total salinity (01m) could be removed (Hammecker et al. 1999). In Niono the flushing
(lateral drainage) is performed intentionally, at the beginning of each new cropping season
whereas in Donaye it occurs accidentally as, the margins of the plots leak after the inter
cropping period when the soil shrinks and the margins crack. Consequently, we simulated an
input of irrigation before each cropping period. This water was equilibrated with the soil
solution, the minerals and the exchangeable cations, and was then partially evacuated from
the system (Fig. 3). This numerical treatment, simulates the exportation of elements during a
flush (lateral drainage), where flushing rates were defined as the proportion of water
exported from the system, after the first water input had equilibrated with soil. Equilibrium
during this procedure is conditioned by different physicochemical processes like : (i) the
competition between convective downward flow during infiltration and upward molecular
diffusion towards the superficial water layer, (ii) the kinetics of minerals dissolution , (iii) the
lateral losses in the plot. These processes were not considered individually but integrated into
a bulk value of flushing rate. Different theoretical flushing rates were tested (5%, 10%, 30%
and 50%) as no precise measurements for actual superficial lateral drainage were available in
the three conditions. However they are in concordance with the flushing rate measured by
Hammecker et al.1999 and with those determined in the experiment performed by Haefele et
al. (1999) in the same area, who that showed superficial lateral drainage after submersed
ploughing (puddling) at the beginning of the cropping season, could increase this salt
exportation four folds.
2.2.3
15
ird-0
0396
823,
ver
sion
1 -
19 J
un 2
009
1 2 3 4 5 6 7 8 9 10 11 12 13 14 15 16 17 18 19 20 21 22 23 24 25 26 27 28 29 30 31 32 33 34 35 36 37 38 39 40 41 42 43 44 45 46 47 48 49 50 51 52 53 54 55 56 57 58 59 60 61 62 63 64 65
2.2.4. Plant uptake
The geochemical budget was considered with and without the incidence of the plant uptake,
in order to quantify the contribution of the plant uptake to soil degradation or conservation
processes. The main threat being alkalization due to carbonate concentration (pH increase),
the focus has been set on the ability for rice to export alkalinity, and the main related cations
(Ca and Mg) possibly affecting the carbonate balance and ESP. Data of Dobermann and
Fairhurst (2000) on the average final composition of rice were used (Table 4). We considered
an average yield of 5t/ha, which corresponds to 10t/ha of dry biomass(DB), a soil depth (z)
of 0.2 m, an average bulk density (b) of 1750 kg.m3 and a mineral density (s) of 2650 kg.m
3.
The average ratio between the dry biomass (DB) and the volume of the soil solution (Vsoil)
has been calculated to be 14.7 kg.m3 as follows :
DBV soil
=DB⋅103
z⋅104⋅s
where s is the porosity. As the soil profile is saturated porosity is defined as:
s=1−b
s
Plants export alkalinity because they absorb more cations than anions. In order to maintain
electrical neutrality both inside and outside of the roots they have to produce organic anions
and excrete protons (Pinton et al.,2001 ; Rengel, 2003). The average plant alkalinity was
calculated as the difference between the cations and anions absorbed by the plant (Table 4).
It was considered that all plant alkalinity was removed from the field, as farmers export the
entire plant for threshing.
Moreover, when a crop is considered in the geochemical system , it is also necessary to take
16
ird-0
0396
823,
ver
sion
1 -
19 J
un 2
009
1 2 3 4 5 6 7 8 9 10 11 12 13 14 15 16 17 18 19 20 21 22 23 24 25 26 27 28 29 30 31 32 33 34 35 36 37 38 39 40 41 42 43 44 45 46 47 48 49 50 51 52 53 54 55 56 57 58 59 60 61 62 63 64 65
into account the N cycle. In paddy fields the plant absorb N as NH4+ originating from the
deamination of the organic matter and the hydrolysis of the urea used as N fertilizer:
R(NH2)2 + H+ +H2O = NH4+ + ROH Helyar and Porter, 1989
CO(NH2)2 + 2H+ +H2O = 2NH4+ + CO2 Bolan and Hedley, 2003
In both cases for each mole of NH4+ produced one mole of protons is removed from soil
solution. Part of the ammonium produced is also adsorbed on the exchangeable complex or
lost as ammonia. Therefore we only took into account the ammonium ions absorbed by the
plant, by using the total N content of the plant (Table 4), irrespectively of the actual urea
management in these sites. The net acidification due to plant uptake and the N cycle was
calculated as:
proton produced = plant alkalinity– N uptake.
In order to simulate the exportation of alkalinity, hence the acidification of the soil solution
due to proton excretion, potassium bicarbonate (KHCO3), magnesium and calcium carbonate
(MgCO3 , CaCO3) and potassium chloride (KCl) were numerically removed from the irrigation
solution in proportions, calculated to meet the corresponding alkalinity uptake (Table 4). The
total uptake for the different ions was divided by 17 (i.e. the number of irrigation events
during a cropping cycle) and distributed evenly over the entire cropping season.
3.Results and discussion.
3.1.Evolution of the irrigation solutions with increasing concentration.
Results displayed in Figure 4 show the evolution of the solution composition versus the
concentration rate defined as : concentration rate = (Vi – V) / Vi , where Vi is the initial
volume of solution and V the volume of solution reached after concentration.
17
ird-0
0396
823,
ver
sion
1 -
19 J
un 2
009

1 2 3 4 5 6 7 8 9 10 11 12 13 14 15 16 17 18 19 20 21 22 23 24 25 26 27 28 29 30 31 32 33 34 35 36 37 38 39 40 41 42 43 44 45 46 47 48 49 50 51 52 53 54 55 56 57 58 59 60 61 62 63 64 65
These results showed an important increase in pH with concentration, up to values around 9,
and clearly superior to 8.3 the pK of calcite. Irrigation water of Foum Gleïta, rapidly reached
saturation with calcite for its large initial Ca concentration. Consequently Ca concentration
in solution decreased constantly whereas Alkalinity, Na and Mg concentrations increased,
despite a slight depletion in Mg when sepiolite crystallization started. At the same time pH
increased drastically despite sepiolite precipitation involving a release of protons into the
solution (Table 3). Finally even for very high concentration rates, Mg increased noticeably in
the solution because of its high initial content, as sepiolite crystallization is controlled by Si,
which is less abundant.
During this simulation, the irrigation water of Niono rapidly reached saturation with quartz
and while it is the only mineral precipitating, alkalinity and concentrations in all the cations
increased regularly with concentration rate. The solution reached saturation with calcite for a
high concentration rate (0.75) then Ca concentration decreased. For higher concentration
rates, Mg concentration dropped when sepiolite crystallized whereas Na kept concentrating.
A similar behavior was observed in Donaye, when water of river Senegal concentrated. In the
three cases the pH of irrigation water increased and Na became the dominant cation in
solution, enhancing the risk of sodication. Considering the SAR and the Electrical
Conductivity of the irrigation water of the different situations, they can be considered as
suitable for irrigation according to the Riverside diagram (1954). However this static view
does not reflect the evolution of the solutions that may occur when concentrating. Numerical
simulation of the concentration of these solutions (Figure 5), show that their SAR increased
drastically with concentration, whereas the total salinity (EC) didn't increase as much, mainly
because of the precipitation of calcite. Barbiero et al. (2004) showed some results for
experimental concentration of irrigation water from River Niger, in the Republic of Niger,
18
ird-0
0396
823,
ver
sion
1 -
19 J
un 2
009

1 2 3 4 5 6 7 8 9 10 11 12 13 14 15 16 17 18 19 20 21 22 23 24 25 26 27 28 29 30 31 32 33 34 35 36 37 38 39 40 41 42 43 44 45 46 47 48 49 50 51 52 53 54 55 56 57 58 59 60 61 62 63 64 65
which have similar initial composition as the irrigation water of Niono, where the SAR of the
solutions also increased but with much higher EC values until reaching the C4S4 domain,
instead of C2S4 as in the numerical simulation (Fig. 5). This discrepancy should mainly be
explained by the fact that in the simulation the kinetics of precipitations have not been taken
into account, and especially the retardation induced by the presence of Mg in the same
proportions as Ca (House et al. 1988). However, in both cases the simulation shows that
resulting solutions are extremely hazardous for soil conservation as they tend to promote
sodication.
3.2. Evolution of the soil solutions over 60 simulated cropping cycles.
The previous simulations described the evolution of the irrigation solution without taking
into account the interactions with soils, especially with the exchange complex and the
minerals. Moreover, in order to get an overall idea of the geochemical processes involved in
field conditions, the vertical drainage and capillary rise was taken into account, following the
simulation procedures described previously for the three situations.
The first set of simulation was aimed at quantifying the influence of the presence of a soil
with a reactive adsorption complex and minerals, as well as the influence of the vertical
leaching towards the water table. As the concentration of the soil varies constantly between
two irrigations, the results displayed in the following figures corresponds to the composition
of the soil solution and the exchange complex, immediately after the irrigation i.e. when the
plots are full of water, in order to represent the actual solution infiltrating into the soil.
In the case of Foum Gleita (Fig. 6) where irrigation water tends to become very alkaline with
concentration, an equivalent trend was observed in presence of soil and vertical drainage.
However this trend appeared in lesser proportions, as pH reached only a value of 7.8 after 60
19
ird-0
0396
823,
ver
sion
1 -
19 J
un 2
009
1 2 3 4 5 6 7 8 9 10 11 12 13 14 15 16 17 18 19 20 21 22 23 24 25 26 27 28 29 30 31 32 33 34 35 36 37 38 39 40 41 42 43 44 45 46 47 48 49 50 51 52 53 54 55 56 57 58 59 60 61 62 63 64 65
cropping cycles. The major ions in solution were Na+ and alkalinity. Both increased regularly
with the number of cropping cycles whereas Ca2+ decreased as calcite precipitated. The
complex reacted to compensate this trend, providing Ca2+ to the soil solution. Consequently,
the proportion of exchangeable Ca decreased and exchangeable Mg became dominant. At the
same time, exchangeable Na increased and consequently ESP rose to 15% after 10 cropping
cycles and finally reached 30% after 60 cropping cycles. The evolution of the pH and
alkalinity is still positive, but at a noticeably lower rate than for the concentration of the
irrigation water alone. In fact, the large CEC of the soil buffered the effects of irrigation
solution composition, especially as it imposed the geochemical composition of the soil
solution, and supplied sufficient Ca2+ ions necessary to precipitate calcite and so prevented
the accumulation of excessive alkalinity. According to the Residual Alkalinity (RA), which is
still positive, the general trend of the system is to evolve continuously, but slowly, towards
alkaline conditions.
In the case of Niono (Fig. 7), the simulation showed a continuous increase in pH during the
first 35 cropping cycles followed by a stabilization at around pH=8.1. Alkalinity and
Na+ in soil solution and in the soil displayed a similar evolution, namely increasing until
reaching saturation towards sepiolite. RAcalcite followed the same increasing trend as alkalinity,
witnessing an alkaline evolution. Exchangeable sodium increased drastically during the first
cropping cycles and reached a maximum of 53% of the exchangeable complex after 50
cropping cycles, until sepiolite started to crystallize. Although extreme values for ESP have
not actually been observed in this region, they are indicative of the type of degradation the
soils might undergo in these conditions : high pH and ESP values are typical of alkalization
and sodication processes. Although the irrigation solution is potentially less alkaline than in
Foum Gleita, its use for irrigation is more hazardous, because the adsorption complex is very
20
ird-0
0396
823,
ver
sion
1 -
19 J
un 2
009

1 2 3 4 5 6 7 8 9 10 11 12 13 14 15 16 17 18 19 20 21 22 23 24 25 26 27 28 29 30 31 32 33 34 35 36 37 38 39 40 41 42 43 44 45 46 47 48 49 50 51 52 53 54 55 56 57 58 59 60 61 62 63 64 65
vulnerable to soil solution composition due to low CEC ; the exchange between the adsorbed
Ca2+ and Na+ in solution will therefore lead to a rapid increase in ESP.
Finally, in the case of Donaye (Fig. 8), the pH of the soil solution did not change much with
the number of cropping cycles and mainly remained near neutrality. Sodium and magnesium
were the major cations in the soil solution, and both concentrations increased with the
number of cropping cycles. Alkalinity was the main anion, but both chloride and sulphate
increased drastically with time, as there was no leaching towards the water table in this site.
The soil solution temporarily reached equilibrium with gypsum during the dry season when
all the irrigation water was evaporated, and especially during the inter cropping periods,
according field observations (Boivin et al., 2002; Barbiero et al., 2005).
In the first instance RAcalcite dropped slightly but increased again progressively when calcite
and later gypsum started to precipitate. As the soil is very clayey with high CEC, the
composition of the soil solution was determined by the buffering property of the soil.
Exchangeable calcium was progressively desorbed and precipitated, exchangeable
magnesium increased and became the first exchangeable cation. At the same time ESP
increased linearly up to 9% after 60 cycles. These extreme values for adsorbed magnesium
were not observed yet, but still represent the values potentially reached for these conditions.
Sixty cropping cycles were not sufficient to lead to alkaline conditions. However these
confined conditions promote a very slow alkalization and sodication process.
3.3. Importance of plant uptake
Results displayed in figure 9 to 11 showed clearly that the ionic plant uptake in the soil
solution, decreased systematically the pH of soil solution in the three sites. Nevertheless, the
21
ird-0
0396
823,
ver
sion
1 -
19 J
un 2
009

1 2 3 4 5 6 7 8 9 10 11 12 13 14 15 16 17 18 19 20 21 22 23 24 25 26 27 28 29 30 31 32 33 34 35 36 37 38 39 40 41 42 43 44 45 46 47 48 49 50 51 52 53 54 55 56 57 58 59 60 61 62 63 64 65
plant effect was moderate for the most alkaline conditions, namely Niono where pH still
increased with time, up to 7.75 after sixty cropping cycles. In the case of Foum Gleita and
Donaye pH decreased until reaching a final value of 7.2 as plant uptake counterbalanced the
alkaline input of irrigation water. The total concentration of the soil solution, as indicated by
EC, decreased by at least 30% , almost 50% for Foum Gleita and Niono. In Donaye, plant
uptake played a major role for it is the only process exporting elements out of the system, as
there was no vertical drainage. The same trend was observed for ESP in the cases of Foum
Gleita and Donaye, where plant uptake contributed to a reduction by 50% of exchangeable
sodium and consequently reduced the sodic risk. In Niono, unlike the former cases, plant
uptake had a moderate effect on ESP. In fact, as K+, Ca2+ and Mg2+ were preferentially
absorbed by rice to Na+, its concentration increased relatively in soil solution and
exchangeable position. In all cases, RAcalcite of the soil solution was significantly reduced, and
even showing a serious decrease for Donaye until reaching 0.0015 mol.l1 , though still
remaining positive.
This simulation showed that in alkaline geochemical conditions, total exportation of rice
(grains + straw) improved generally the composition of the soil solution and tended to
reduce the risks of salinisation, alkalization and generally sodication except in the case of
Niono where the low CEC was very sensitive to a relative Na increase in the soil solution. This
situation is illustrated by Barbiero et al. 2001 who carried out an experiment in Niger (Lossa)
where the cultivation of a local fodder grass (Echinochloa stagnina) and its exportation out
of the field contributed to noticeable dealkalization of a highly alkaline soil.
3.4. Effects of superficial lateral drainage (flushing).
22
ird-0
0396
823,
ver
sion
1 -
19 J
un 2
009
1 2 3 4 5 6 7 8 9 10 11 12 13 14 15 16 17 18 19 20 21 22 23 24 25 26 27 28 29 30 31 32 33 34 35 36 37 38 39 40 41 42 43 44 45 46 47 48 49 50 51 52 53 54 55 56 57 58 59 60 61 62 63 64 65
Results displayed in figures 12 to 14 showed distinctly that even for low rates, superficial
flushing reduced significantly EC (i.e. the total salinity) of the soil solution, as well as ESP.
The incidence of lateral drainage on pH and on RAC was less clear, especially for the case of
Donaye as both parameters used to decrease without superficial lateral drainage and whereas
they tended to increase slightly or stay constant when lateral drainage was simulated.
However, in the case of Foum Gleita (Figure 12) the processes of sodication and alkalization
were thoroughly reduced even for the smallest lateral drainage rate, as pH, EC, ESP and
RAcalcite decrease with increasing flushing rate. For flushing rates greater than 30% the
simulation shows that all these parameters reach constant low values, namely pH = 7.3, EC
= 0.6 dS.m1, ESP =2%, ARcalcite = 0.03 mol.l1, witnessing stable geochemical conditions,
harmless for the quality of soil and solution.
In the case of Niono (figure 13), superficial flushing was as effective as in the previous
example, for its incidence was clearly noticeable, even for low flushing rates. The simulation
showed that a flushing rate of 30% was sufficient to control and maintain EC at a constant
level, with only a slight increase in ESP. The incidence of lateral drainage on pH and ARCalcite
was very important for the low rates (5% and 10%) during 20 first cropping cycles, as these
parameters decreased slightly, until ARcalcite becoming negative for 5% flushing rate, and
finally increased constantly. For the higher flushing rates (30 % and 50 %) the incidence on
pH and ARcalcite was less important for the first simulated cropping cycles, but remained
constant over the entire period. This special behavior is probably related to the difference in
pCO2 between the soil solution (101.8 atm) and the supplementary irrigation water (103.5
atm) added to compensate lateral drainage, and their relative proportions when mixed,
promoting whether calcite precipitation or dilution of the soil solution. In any cases the
superficial flushing reduced significantly the risk of alkalisation and sodication, though ESP
23
ird-0
0396
823,
ver
sion
1 -
19 J
un 2
009
1 2 3 4 5 6 7 8 9 10 11 12 13 14 15 16 17 18 19 20 21 22 23 24 25 26 27 28 29 30 31 32 33 34 35 36 37 38 39 40 41 42 43 44 45 46 47 48 49 50 51 52 53 54 55 56 57 58 59 60 61 62 63 64 65
values still reached relatively high values (17%).
An equivalent behavior was noticed in the simulation for the case of Donaye (figure 14),
although no vertical drainage was considered; EC and ESP showed a significant decrease
even for low flushing rates and reached a low constant value all along the cropping cycles
when higher superficial lateral drainage rates were achieved (EC = 0.7 dS.m1 ; ESP =1.5 %
for 30% flushing rate and EC = 0.6 dS.m1 ; ESP = 0.8 % for a flushing rate of 50 %).
Consequently the soil solution and soil quality increased. On the other hand, pH and ARcalcite
showed a significant decrease when no lateral drainage was simulated whereas they showed
a similar behavior for the different flushing rates as described for the case of Niono.
However these variations of pH and ARcalcite can be considered as negligible considering
alkalization because for the worst condition (flushing rate of 10 %), pH reached 7.33 and
ARcalcite reached 0.004 molc.l1 after 60 cropping cycles .
Moreover these results also show that ARcalcite , which is considered as a conservative tracer
(Ribolzi et al. 1996;Barbiero et al. 2001; Barbiero et al. 2004), varies along the simulation,
and probably also in field conditions, as solutions with different pCO2 are mixed.
In Donaye, mineralogical and chemical experimental studies of the soil have been performed
to assess the modifications of the soil quality after 15 years of intensive irrigation. When
compared inside an irrigated plot and outside the irrigation scheme, the evolution of the soil
exchangeable complex, especially the ESP, has been found not significantly different
(Charolais and Weber, 1994). Equally, when the pH of the soil, the EC and the content of
accumulated carbonates in the topsoil have been measured on a 1/50 aqueous extract,
(Schiess, 1995; Boivin et al. 1998) only a slight increase in the soil between the two
situations was noticeable, though the difference isn't really statistically different between the
two groups (figure 15). These experimental results show that in 15 years of irrigation the soil
24
ird-0
0396
823,
ver
sion
1 -
19 J
un 2
009

1 2 3 4 5 6 7 8 9 10 11 12 13 14 15 16 17 18 19 20 21 22 23 24 25 26 27 28 29 30 31 32 33 34 35 36 37 38 39 40 41 42 43 44 45 46 47 48 49 50 51 52 53 54 55 56 57 58 59 60 61 62 63 64 65
quality has not changed noticeably. In Donaye the rice straw is usually not exported from the
field, but left to graze for cattle or burned. However, “natural” leakage throughout the bunds
of the plot, due to a lack of maintenance is almost systematically observed. In fact, this
disorder actually contributes to the superficial flushing, especially during the first irrigation
when the soil shrinkage cracks are still open in bunds, and helps to preserve the soil quality
despite the improper quality of irrigation water.
Although the quantitative effect of superficial flushing is difficult to model accurately because
of the lack of information, this study demonstrates clearly the crucial role of superficial
flushing for soil conservation, and attests the general conclusions of the numerical simulation
results.
3.5. Effect of soil reduction.
Although this process has not been modelled specifically in this work for the lack of Eh
information in some cases, it is still possible to evaluate its effect on the proton balance. In
the case of prolongated submersion conditions, like in paddy fields, the soil undergoes
reduction as microbial activity consumes the dissolved oxygen, and finally reduces the iron
oxihydroxides (the most commonly found). The oxidation of organic matter by reducing
Fe(III) to Fe(II) produces alkalinity and consequently an increase in pH :
FeOOH + ½ COOH + 5/2 H+ Fe ↔ 2+ + ½ CO2 + 2H2O
When the system oxides at the end of the submersion period an equivalent amount of acidity
is produced and the general proton balance is null in confined conditions. However in case of
a leaching fraction during reduced conditions, reoxidation leads generally to ferrolysis
phenomenon which is a soil transformation involving a protonation of the complex, an
attack of the clay crystalline structure, where H+ is penetrating the octahedral layers and
25
ird-0
0396
823,
ver
sion
1 -
19 J
un 2
009

1 2 3 4 5 6 7 8 9 10 11 12 13 14 15 16 17 18 19 20 21 22 23 24 25 26 27 28 29 30 31 32 33 34 35 36 37 38 39 40 41 42 43 44 45 46 47 48 49 50 51 52 53 54 55 56 57 58 59 60 61 62 63 64 65
taking the place of Al3+ as described by Brinkman (1979) and revisited by van Ranst and De
Coninck (2002). Consequently, soil reduction has either no effect on alkalinity or, on contrary,
consumes alkalinity and reduces pH in the studied situations.
Conclusion
In this study we used PHREEQC to predict the evolution of the soil and soil solution over
several years, with different soil and water management. Although the use of Riversides'
diagram, RAcalcite and the RSC index, can be informative about the potential risks, they cannot
predict the evolution of the soil nor of the soil solution. Especially as they don't take into
account the buffer capacity of soil, the water management involving dilutions and variations
in pCO2, and the effect of the plants uptake. We demonstrated that despite the high risk of
alkalinisation and sodication according to these indicators, in three west African situations of
irrigation, soil degradation is not a fate. Considering the buffer effect of the soil (very high in
Senegal), the possibilities of removing alkalinity from the plots by straw management, and
finally the use of superficial flushing whether naturally (Foum Gleita), artificially with an
effective drainage network (Niono) or accidentally with leaks in the bunds (Donaye),
alkalinisation or sodication is not jeopardizing soil properties in wellconducted rice cropping
system. These results using geochemical numerical modelling, attest that in Sahel, although
the main rivers (river Senegal, Niger, Gorgol Noir) show an alkaline composition with
positive RAcalcite and RSC values, their use for irrigation in paddy fields cannot be considered
as directly responsible for soil alkalinisation. Barbiero et al. (1998), in the Republic of Niger,
or van Asten et al. (2004) in Foum Gleita, found similar conclusions based on experimental
26
ird-0
0396
823,
ver
sion
1 -
19 J
un 2
009

1 2 3 4 5 6 7 8 9 10 11 12 13 14 15 16 17 18 19 20 21 22 23 24 25 26 27 28 29 30 31 32 33 34 35 36 37 38 39 40 41 42 43 44 45 46 47 48 49 50 51 52 53 54 55 56 57 58 59 60 61 62 63 64 65
results. The presence of alkaline soils is more probably due to the alteration of an alkaline
bed rock (in Foum Gleita) or to the presence of groundwater leaching through a deeper
alkaline bed rock (in Niono). Unlike the usual assumptions,where rice cropping is held
responsible for soil salinization or alkalinisation, this study show that in these cases, rice
cropping can improve the soil quality when irrigation and residue management are
performed properly. Namely a superficial lateral drainage performed once, at the beginning of
the cropping season, although being sometimes seen as a waste of water by the local farmers,
improves noticeably the sustainability of the system despite adverse composition of the
irrigation water. More over, in the situation of alkalinisation risk, the exportation of the straw
out of the plots contributes significantly to the control of the average alkalinity of soil,
especially in the cases of Niono and Donaye.
27
ird-0
0396
823,
ver
sion
1 -
19 J
un 2
009
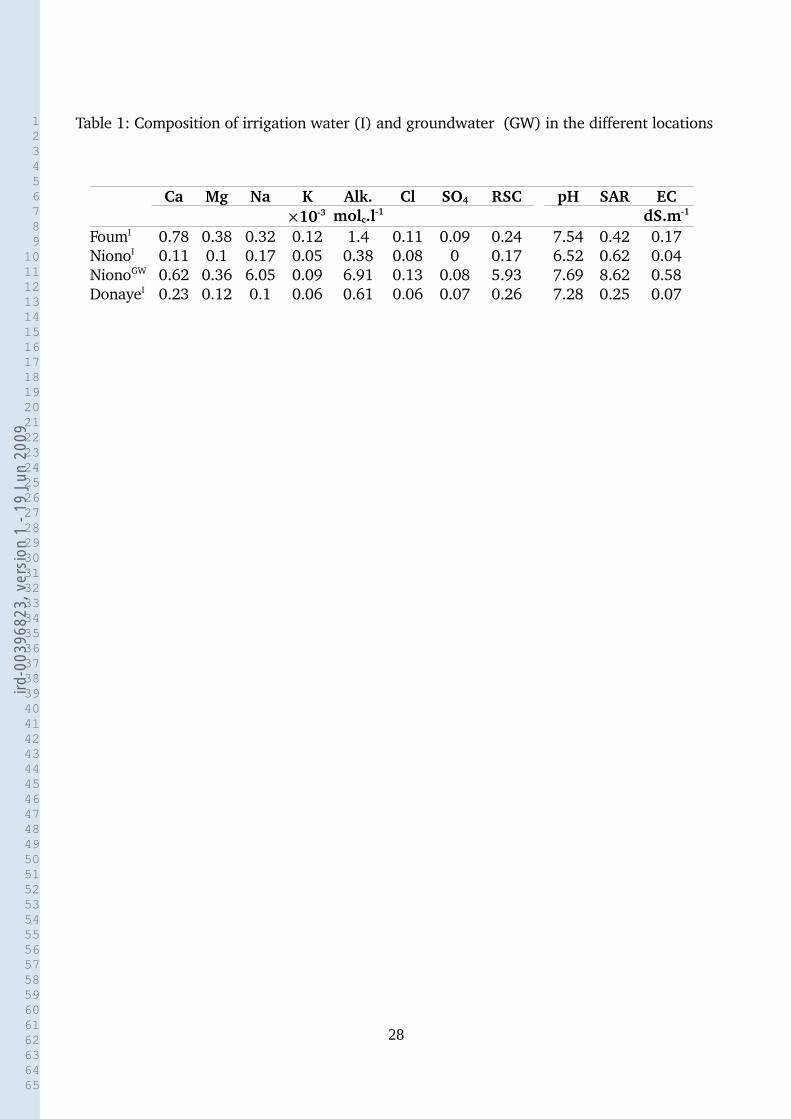
1 2 3 4 5 6 7 8 9 10 11 12 13 14 15 16 17 18 19 20 21 22 23 24 25 26 27 28 29 30 31 32 33 34 35 36 37 38 39 40 41 42 43 44 45 46 47 48 49 50 51 52 53 54 55 56 57 58 59 60 61 62 63 64 65
Table 1: Composition of irrigation water (I) and groundwater (GW) in the different locations
Ca Mg Na K Alk. Cl SO4 RSC pH SAR EC103 molc.l1 dS.m1
FoumI 0.78 0.38 0.32 0.12 1.4 0.11 0.09 0.24 7.54 0.42 0.17NionoI 0.11 0.1 0.17 0.05 0.38 0.08 0 0.17 6.52 0.62 0.04NionoGW 0.62 0.36 6.05 0.09 6.91 0.13 0.08 5.93 7.69 8.62 0.58DonayeI 0.23 0.12 0.1 0.06 0.61 0.06 0.07 0.26 7.28 0.25 0.07
28
ird-0
0396
823,
ver
sion
1 -
19 J
un 2
009
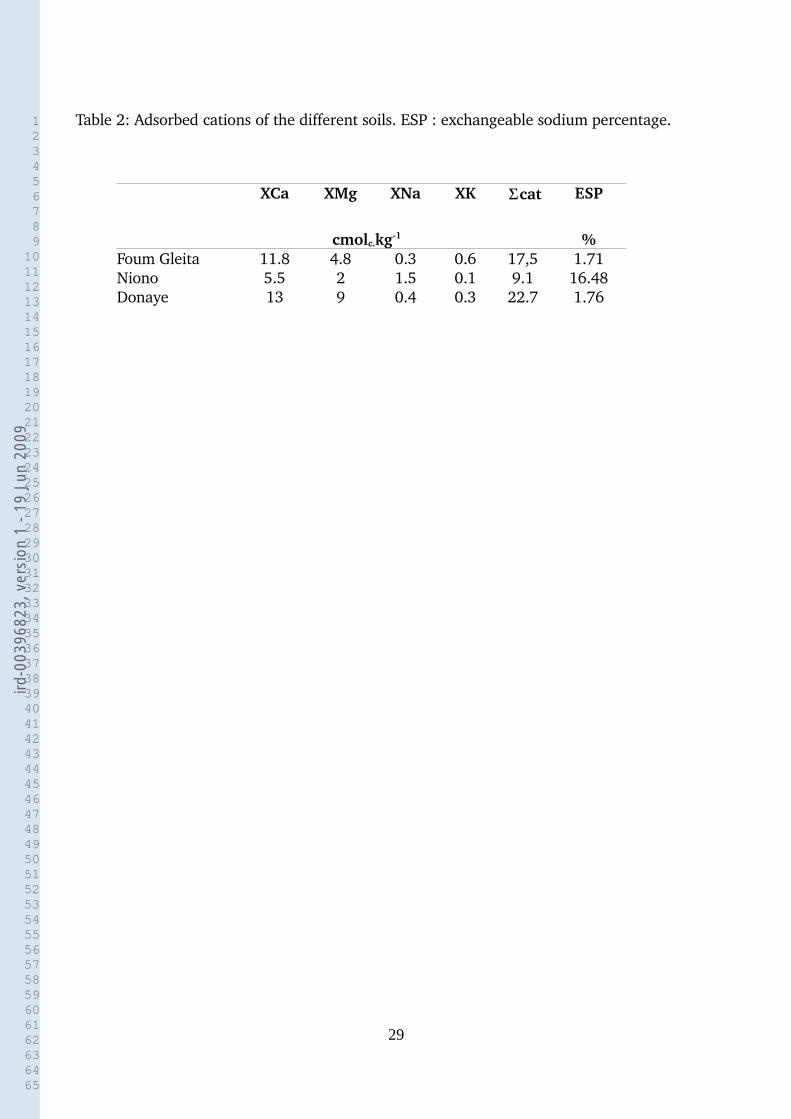
1 2 3 4 5 6 7 8 9 10 11 12 13 14 15 16 17 18 19 20 21 22 23 24 25 26 27 28 29 30 31 32 33 34 35 36 37 38 39 40 41 42 43 44 45 46 47 48 49 50 51 52 53 54 55 56 57 58 59 60 61 62 63 64 65
Table 2: Adsorbed cations of the different soils. ESP : exchangeable sodium percentage.
XCa XMg
cmolc.
XNa
kg1
XK cat ESP
%Foum Gleita 11.8 4.8 0.3 0.6 17,5 1.71Niono 5.5 2 1.5 0.1 9.1 16.48Donaye 13 9 0.4 0.3 22.7 1.76
29
ird-0
0396
823,
ver
sion
1 -
19 J
un 2
009
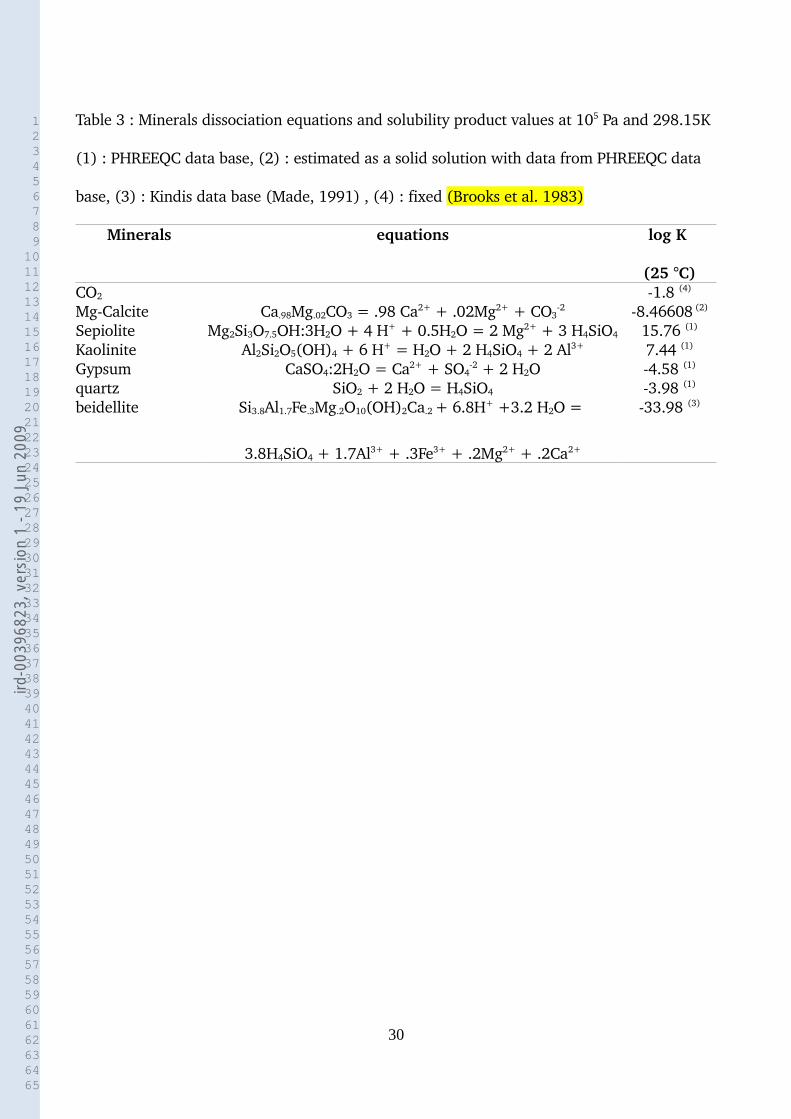
1 2 3 4 5 6 7 8 9 10 11 12 13 14 15 16 17 18 19 20 21 22 23 24 25 26 27 28 29 30 31 32 33 34 35 36 37 38 39 40 41 42 43 44 45 46 47 48 49 50 51 52 53 54 55 56 57 58 59 60 61 62 63 64 65
Table 3 : Minerals dissociation equations and solubility product values at 105 Pa and 298.15K
(1) : PHREEQC data base, (2) : estimated as a solid solution with data from PHREEQC data
base, (3) : Kindis data base (Made, 1991) , (4) : fixed (Brooks et al. 1983)
Minerals equations log K
(25 °C)CO2 1.8 (4)
MgCalcite Ca.98Mg.02CO3 = .98 Ca2+ + .02Mg2+ + CO32 8.46608 (2)
Sepiolite Mg2Si3O7.5OH:3H2O + 4 H+ + 0.5H2O = 2 Mg2+ + 3 H4SiO4 15.76 (1)
Kaolinite Al2Si2O5(OH)4 + 6 H+ = H2O + 2 H4SiO4 + 2 Al3+ 7.44 (1)
Gypsum CaSO4:2H2O = Ca2+ + SO42 + 2 H2O 4.58 (1)
quartz SiO2 + 2 H2O = H4SiO4 3.98 (1)
beidellite Si3.8Al1.7Fe.3Mg.2O10(OH)2Ca.2 + 6.8H+ +3.2 H2O =
3.8H4SiO4 + 1.7Al3+ + .3Fe3+ + .2Mg2+ + .2Ca2+
33.98 (3)
30
ird-0
0396
823,
ver
sion
1 -
19 J
un 2
009

1 2 3 4 5 6 7 8 9 10 11 12 13 14 15 16 17 18 19 20 21 22 23 24 25 26 27 28 29 30 31 32 33 34 35 36 37 38 39 40 41 42 43 44 45 46 47 48 49 50 51 52 53 54 55 56 57 58 59 60 61 62 63 64 65
Table 4 : Average paddy uptake (grain + straw) and equivalent uptake in soil solution
(average yield of 5t/ha, and average bulk density of 1750kg.m3)
Dobermann & Fairhurst, 2000
%
equivalent ionic
species mmol/l
N 0.65 NH4+ 6.62
K 1.4 K+ 5.1Mg 0.2 Mg2+ 2.35Ca 0.3 Ca2+ 2.13Na 0.2 Na+ 1.24c 18.01P 0.1 H2PO4
0.46Cl 0.5 Cl 2.01S 0.075 SO4
2 0.66a 3.24c - a Alkalinity 14.3
31
ird-0
0396
823,
ver
sion
1 -
19 J
un 2
009
1 2 3 4 5 6 7 8 9 10 11 12 13 14 15 16 17 18 19 20 21 22 23 24 25 26 27 28 29 30 31 32 33 34 35 36 37 38 39 40 41 42 43 44 45 46 47 48 49 50 51 52 53 54 55 56 57 58 59 60 61 62 63 64 65
References
Al Droubi, A., Fritz, B., Gac, JY. and Tardy, Y., 1980. Generalized residual alkalinity concept;
application to prediction of the chemical evolution of natural waters by evaporation.
Am. J. Sci., 280: 560572
Arbol, I.P., Yadav, J.S.P. and Massoud, F.I., 1988. Saltaffected soils and their management.
Food and Agricultural Organization of the United Nations, Soils Bulletin 39, Rome 131
pp.
Audry, P., 1961. Etude pédologique du cercle de Guidimaka (République Islamique de
Mauritanie). Etude du milieu naturel et étude pédologique. Rapp. Off. Rech. sci. tech.
Omer, Dakar, 173 p. multigr.,
Barbiero, L. and VanVlietLanoe, B., 1998. The alkali soils of the middle Niger Valley; origins,
formation and present evolution. Geoderma, 84: 323343.
Barbiero, L.; Valles, V.; Regeard, A., Cheverry, C., 2001 Residual alkalinity as tracer to
estimate the changes induced by forage cultivation in a nonsaline irrigated sodic soil
Agricultural Water Management. 50 : 229241
Barbiero L., Ould Mohamedou A., Laperrousaz C., Furian S., Cunnac S., 2004. Polyphasic
origin of salinity in the Senegal delta and middle valley. Catena 58, 101124.
Barbiero L., Ould Mohamedou A., Roger L., Furian S., Aventurier A., Rémy J.C., Marlet S.,
2005. The origin of vertisols and their relationship to Acid Sulfate Soils in the Senegal
Valley. Catena 59, 93116.
Bertrand, R., Keita, B., Ndiaye, K.M., 1993. La dégradation des sols des périmètres irrigués
des grandes vallées sudsahariennes: Cas de l'Office du Niger au Mali). Cahiers
Agricultures 2, 318 329.
32
ird-0
0396
823,
ver
sion
1 -
19 J
un 2
009
1 2 3 4 5 6 7 8 9 10 11 12 13 14 15 16 17 18 19 20 21 22 23 24 25 26 27 28 29 30 31 32 33 34 35 36 37 38 39 40 41 42 43 44 45 46 47 48 49 50 51 52 53 54 55 56 57 58 59 60 61 62 63 64 65
Bethke, C.M. 2007. Geochemical and Biogeochemical Reaction Modeling. Cambridge
University Press. 564 pp.
Boivin, P., Favre, F. and Maeght, JL., 1998. Les sols de la moyenne vallée du fleuve Sénégal :
caractéristiques et évolution sous irrigation. Étude et Gestion des Sols, 5: 235 246
Boivin, P., Favre, F., Hammecker, C., Maeght, JL., Delarivière, J., Poussin, JC. and Wopereis,
M.C.S., 2002. Processes driving soil solution chemistry in a flooded ricecropped
vertisol: analysis of longtime monitoring data. Geoderma, 110: 87107
Bolan N.S. and Hedley M.J., 2003. Role of carbon, nitrogen, and sulfur cycles in soil
acidification. In: Z. Rengel (Editor), Handbook of soil acidity. Marcel Dekker, New York,
pp. 2956.
Brinkman, R. 1979. Ferrolysis, a soilforming process in hydromorphic conditions. Doctoral
thesis. Agricultural Research Reports 887, Centre for Agricultural Publishing and
Documentation, Wageningen.
Brooks, G.A., Folkoff, M.E., Box, E.O. 1983. A global model of soil carbon dioxide. Earth
Surface Processes and Land/onus 8:7988.
Carité, D. 1989. Géologie en Mauritanie. Edisud. 284 pp.
Charolais, M., Weber, V., 1994. Evolution des sols irrigués dans la moyenne vallée du fleuve
Sénégal. M.Sc. Thesis, EPFL, Lausane, Switzerland.
Condom, N., 2000. Analyse et modélisation des processus hydrogéochimiques de la
salinisation des sols. Application aux sols rizicoles de l'Office du Niger (Mali). PhD
Thesis. Ecole Nationale Supérieure d'Agronomie de Montpellier. 183 pp.
Dobermann, A. and Fairhurst, T.H., 2000. Rice: nutritional disorders and nutrient
management. International Rice Research Institute & Potash and Phosphate Institute,
33
ird-0
0396
823,
ver
sion
1 -
19 J
un 2
009
1 2 3 4 5 6 7 8 9 10 11 12 13 14 15 16 17 18 19 20 21 22 23 24 25 26 27 28 29 30 31 32 33 34 35 36 37 38 39 40 41 42 43 44 45 46 47 48 49 50 51 52 53 54 55 56 57 58 59 60 61 62 63 64 65
Singapore, 191 pp.
Eaton, F.M., 1950. Significance of carbonates in irrigation waters. Soil Science, 69:123133
Favre, F., Tessier, D., Abdelmoula M., Génin, J. M. ,Gates, W. P. , Boivin, P. , 2002. Iron
reduction and changes in cation exchange capacity in intermittently waterlogged soil.
European Journal of Soil Science, 53: 175-183
Gaines, G.L., and Thomas, H.C., 1953. Adsorption studies on clay minerals. II. A formulation
of the thermodynamics of exchange adsorption. Journal of Chemical Physics, 21 :714
718.
Haefele, S.; Wopereis, M. C. S.; Boivin, P. and N'Diaye, A. M. 1999. Effect of puddling on soil
desalinization and rice seedling survival in the Senegal River Delta. Soil and Tillage
Research, 51, 3546
Hammecker, C. and Maeght, JL., 1999. Synthèse sur l’évolution des sols sous culture
(Sénégal). Lutte contre la dégradation des sols dans la vallée du fleuve Sénégal.
Document PSI, technical report.
Hammecker, C., Maeght, JL. And Wade M. 1999. Essai de drainage sur le périmètre de
Donaye 8. Lutte contre la dégradation des sols dans la vallée du fleuve Sénégal.
Document PSI, technical report.
Hammecker, C., Antonino, A.C.D., Maeght, JL. and Boivin, P. 2003. Experimental study and
numerical modelling of the water transfers in an irrigated plot in Northern Senegal:
evidences of air entrapment. European Journal of Soil Science. 54: 491503
Hardie, L. A. and Eugster, H. 1970. The evolution of closed basin brines. Mineral. Soc. Amer.
Spec. Pap., 3, 273290.
Helyar, K.R. and Porter, W.M., 1989. Soil acidification, its measurement and the processes
involved. In: A.D. Robson (Editor), Soil acidity and plant growth. Academic press,
34
ird-0
0396
823,
ver
sion
1 -
19 J
un 2
009
1 2 3 4 5 6 7 8 9 10 11 12 13 14 15 16 17 18 19 20 21 22 23 24 25 26 27 28 29 30 31 32 33 34 35 36 37 38 39 40 41 42 43 44 45 46 47 48 49 50 51 52 53 54 55 56 57 58 59 60 61 62 63 64 65
Sydney, pp. 61101.
House, W.A, Howson, M. R., Pethybridge, A. D., 1988. Crystallisation kinetics of calcite in the
presence of magnesium ions. J. Chem. Soc., Faraday Trans. 1, 84 : 2723 - 2734,
Madé, B., 1991. Modélisation thermodynamique et cinétique des réaction géochimiques dans
les interactions eauroche. PhD thesis, Université Louis Pasteur, Strasbourg.
Maignien R., 1961. Contribution à l'étude des sols à pâturage du cercle du Gorgol. Rapp. Off.
Rech. sci. tech. Omer, Dakar, 125 p. multigr.
Parkhurst, D.L., Appelo C.A.J., 1999. User’s guide to PHREEQC (version2)a computer
program for speciation, batchreaction, onedimensional transport, and inverse
geochemical calculations. WaterResources investigations report 994256 USGS, Denver,
Colorado
Pinton, R., Varanini, Z., Nannipieri, P. 2001. The Rhizosphere: Biochemistry and Organic
Substances at the Soilplant Interface. CRC Press. 424 pp.
Valles, V., Pachepsky, Y.A., Ponizovsky,A.A. 1991. Invariant criteria for irrigation water quality
assessment in arid and semi arid regions. In: Genesis and Control of Fertility of Salt
Affected Soils. ISSS SubCommission on Salt Affected Soils Science, USSR, V.V.
Dokuchaev Soil Institute, Moscow, pp. 330333.
van Asten, P.J.A. 2003. Soil Quality and Rice Productivity Problems in Sahelian Irrigation
Schemes, PhD thesis, Wageningen University, the Netherlands, 143 pp.
van Asten, P.J.A., Barbiéro L., Wopereis M.C.S. and van der Zee, S.E.A.T.M. 2003. Actual and
potential saltrelated soil degradation in an irrigated rice scheme in the Sahelian zone of
Mauritania. Agricultural Water Management. 60:1332
35
ird-0
0396
823,
ver
sion
1 -
19 J
un 2
009
1 2 3 4 5 6 7 8 9 10 11 12 13 14 15 16 17 18 19 20 21 22 23 24 25 26 27 28 29 30 31 32 33 34 35 36 37 38 39 40 41 42 43 44 45 46 47 48 49 50 51 52 53 54 55 56 57 58 59 60 61 62 63 64 65
van Asten, P. J. A., van 't Zelfde, J. A., van der Zee, S. E. A. T. M. and Hammecker, C. 2004.
The effect of irrigated rice cropping on the alkalinity of two alkaline rice soils in the
Sahel, Geoderma, 119: 233247
van Beek, C.G.E. and Van Breemen, N. 1973. The alkalinity of alcali soils. J. Soil Sci. 24:129
136
van Ranst, E. and de Coninck, F. 2002. Evaluation of ferrolysis in soil formation. European
Journal of Soil Science. 53:513519
Rengel, Z. 2003. Handbook of soil acidity , CRC Press, 496 pp
Ribolzi, O., Valles, V., Bariac, T., 1996. Comparison of hydrograph deconvolutions using
residual alkalinity, chloride and oxygen 18 as hydrochemical tracers. Water Res. Resour.
32 (4), 10511059.
Riverside Salinity Laboratory Staff, 1954. Diagnosis and Improvement of Saline and Alkali
Soils. Agriculture Handbook n°60, United States Department of Agriculture
Schiess, S. 1995. Alcalinisation des sols irrigués dans la moyenne vallée du fleuve Sénégal :
diagnostique (sic) par évaluation du stock de carbonates. M.Sc. Thesis, EPFL, Lausane,
Switzerland.
Sharma, P., Pantuwan, G., Ingram, K., DeDatta, S. 1994. Rainfed lowland rice roots: soil and
hydrological effects. In: GJD, K. (Ed.), Rice Roots Nutrient and Water Use. IRRI, Manila,
pp. 55 66.
Slaton, N.A., Beyrouty, C.A., Wells, B.R., Norman, R.J., Gbur, E.E. 1990. Root growth and
distribution of two shortseason rice genotypes. Plant and Soils. 121: 269278
Stumm, W., Morgan, J.J., 1970. Aquatic Chemistry : An Introduction Emphasing Chemical
36
ird-0
0396
823,
ver
sion
1 -
19 J
un 2
009

1 2 3 4 5 6 7 8 9 10 11 12 13 14 15 16 17 18 19 20 21 22 23 24 25 26 27 28 29 30 31 32 33 34 35 36 37 38 39 40 41 42 43 44 45 46 47 48 49 50 51 52 53 54 55 56 57 58 59 60 61 62 63 64 65
Equilibria in Natural Waters. Wiley, New York.
37
ird-0
0396
823,
ver
sion
1 -
19 J
un 2
009
1 2 3 4 5 6 7 8 9 10 11 12 13 14 15 16 17 18 19 20 21 22 23 24 25 26 27 28 29 30 31 32 33 34 35 36 37 38 39 40 41 42 43 44 45 46 47 48 49 50 51 52 53 54 55 56 57 58 59 60 61 62 63 64 65
Figure 1 : Location of the studied sites
Figure 2 : Schematic representation water use dynamics in simulation : a. after irrigation, 2
liters of superficial ponding water + 1 liter soil solution in the root zone, b. : after
evaporation and just before the next irrigation, 1 liter of soil solution in the root zone.
Figure 3: Schematic representation of the procedure adopted to simulate the effects of the
leaching fraction (L.F.) and of the superficial flushing (S.F.). a. 1: the soil is saturated, 2 : at
the end of the concentration period, part of the remaining solution is evacuated from the
system (LF). b. 1 : at the end of an intercropping period precipitated minerals and
concentrated solutions are close to the soil surface, 2: addition of a superficial layer of
irrigation water, dissolving the minerals and equilibrating with soil solution and and
exchangeable cations, 3: part of the superficial layer is evacuated.
Figure 4 : Evolution of irrigation water composition during concentration for pCO2 = 101.5 Pa
and possibility for common minerals (calcite, quartz, sepiolite, kaolinite, gypsum) to
precipitate.
Figure 5 : Evolution of irrigation water composition during concentration in the Riverside
diagram.
Figure 6 : Evolution of soil solution and adsorption complex for Foum Gleita. RAC : RAcalcite ,
the straight horizontal solid line states for the precipitation of calcite.
Figure 7 : Evolution of soil solution and adsorption complex for Niono. RAC : RAcalcite , the
38
ird-0
0396
823,
ver
sion
1 -
19 J
un 2
009
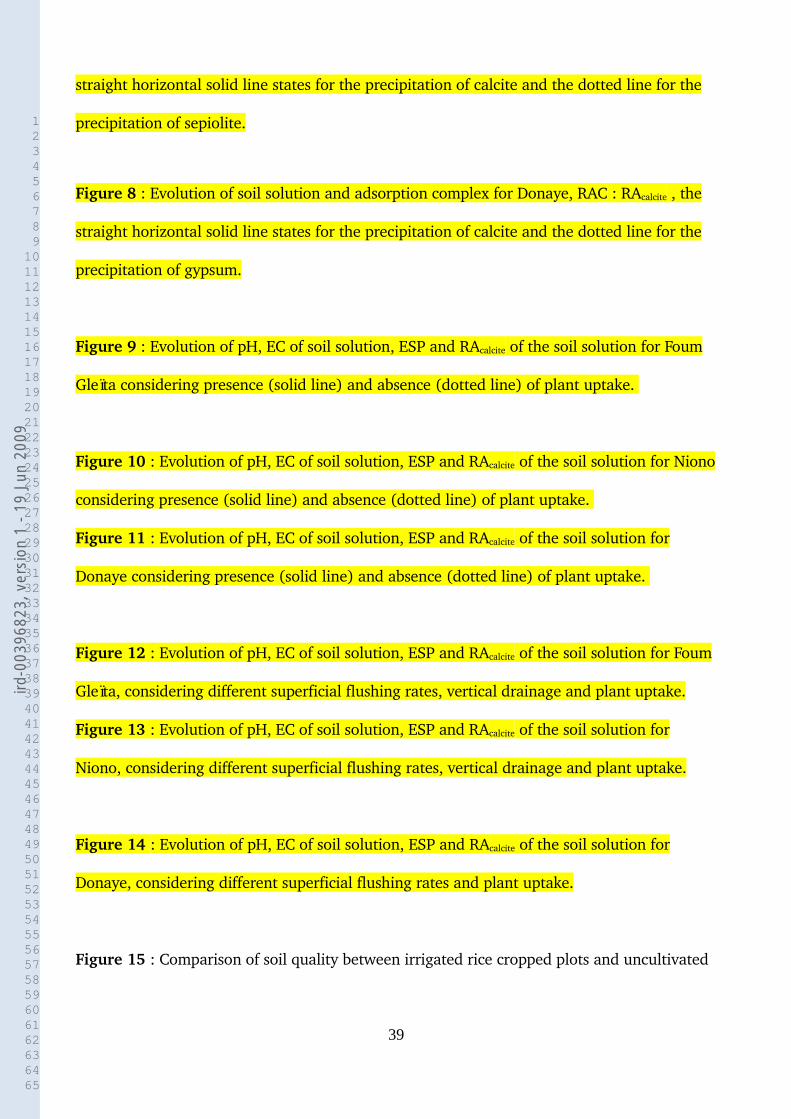
1 2 3 4 5 6 7 8 9 10 11 12 13 14 15 16 17 18 19 20 21 22 23 24 25 26 27 28 29 30 31 32 33 34 35 36 37 38 39 40 41 42 43 44 45 46 47 48 49 50 51 52 53 54 55 56 57 58 59 60 61 62 63 64 65
straight horizontal solid line states for the precipitation of calcite and the dotted line for the
precipitation of sepiolite.
Figure 8 : Evolution of soil solution and adsorption complex for Donaye, RAC : RAcalcite , the
straight horizontal solid line states for the precipitation of calcite and the dotted line for the
precipitation of gypsum.
Figure 9 : Evolution of pH, EC of soil solution, ESP and RAcalcite of the soil solution for Foum
Gleïta considering presence (solid line) and absence (dotted line) of plant uptake.
Figure 10 : Evolution of pH, EC of soil solution, ESP and RAcalcite of the soil solution for Niono
considering presence (solid line) and absence (dotted line) of plant uptake.
Figure 11 : Evolution of pH, EC of soil solution, ESP and RAcalcite of the soil solution for
Donaye considering presence (solid line) and absence (dotted line) of plant uptake.
Figure 12 : Evolution of pH, EC of soil solution, ESP and RAcalcite of the soil solution for Foum
Gleïta, considering different superficial flushing rates, vertical drainage and plant uptake.
Figure 13 : Evolution of pH, EC of soil solution, ESP and RAcalcite of the soil solution for
Niono, considering different superficial flushing rates, vertical drainage and plant uptake.
Figure 14 : Evolution of pH, EC of soil solution, ESP and RAcalcite of the soil solution for
Donaye, considering different superficial flushing rates and plant uptake.
Figure 15 : Comparison of soil quality between irrigated rice cropped plots and uncultivated
39
ird-0
0396
823,
ver
sion
1 -
19 J
un 2
009

1 2 3 4 5 6 7 8 9 10 11 12 13 14 15 16 17 18 19 20 21 22 23 24 25 26 27 28 29 30 31 32 33 34 35 36 37 38 39 40 41 42 43 44 45 46 47 48 49 50 51 52 53 54 55 56 57 58 59 60 61 62 63 64 65
soil in Donaye. The diagrams were obtained with superficial (010cm) soil samples, n=130
in irrigated plots and n=95 in uncultivated soils.
40
ird-0
0396
823,
ver
sion
1 -
19 J
un 2
009

Figure1Click here to download high resolution image
ird-0
0396
823,
ver
sion
1 -
19 J
un 2
009
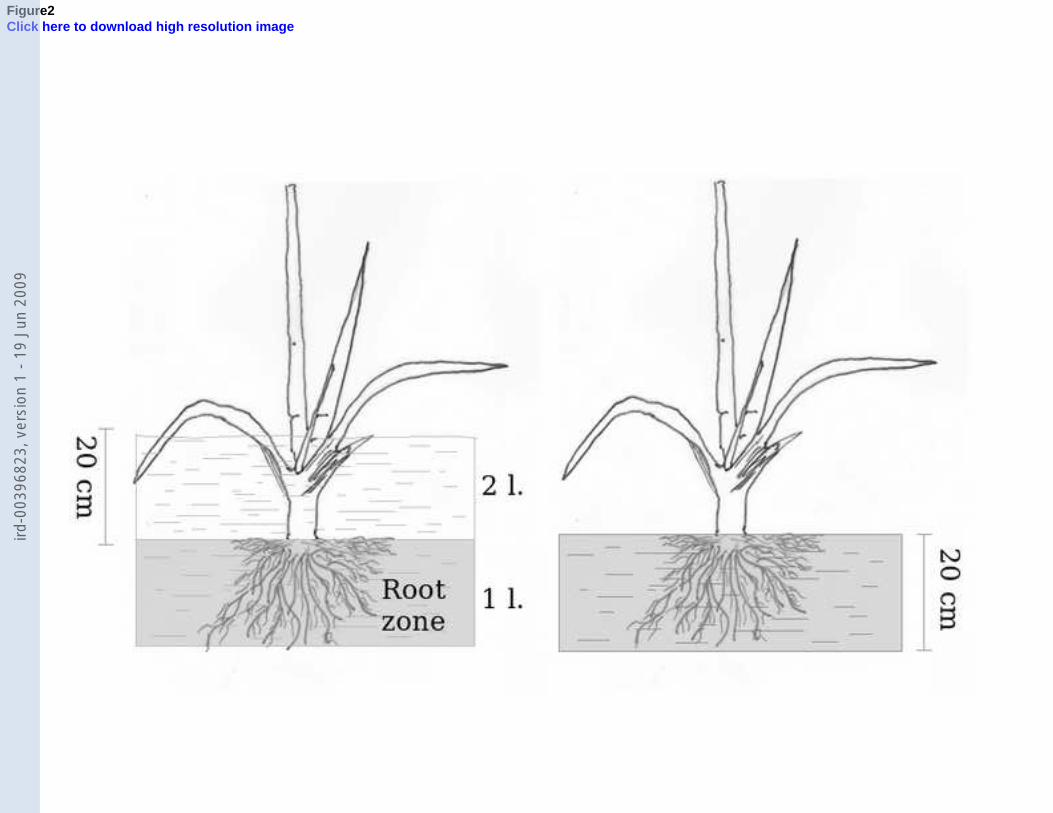
Figure2Click here to download high resolution image
ird-0
0396
823,
ver
sion
1 -
19 J
un 2
009
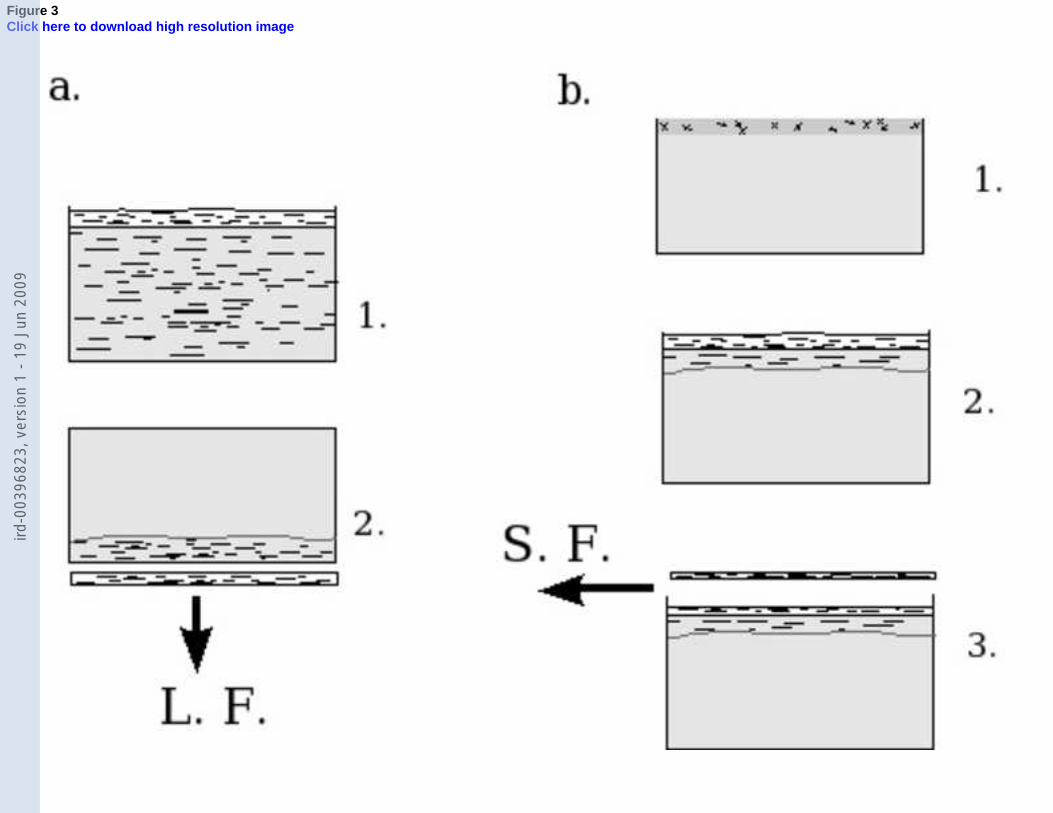
Figure 3Click here to download high resolution image
ird-0
0396
823,
ver
sion
1 -
19 J
un 2
009
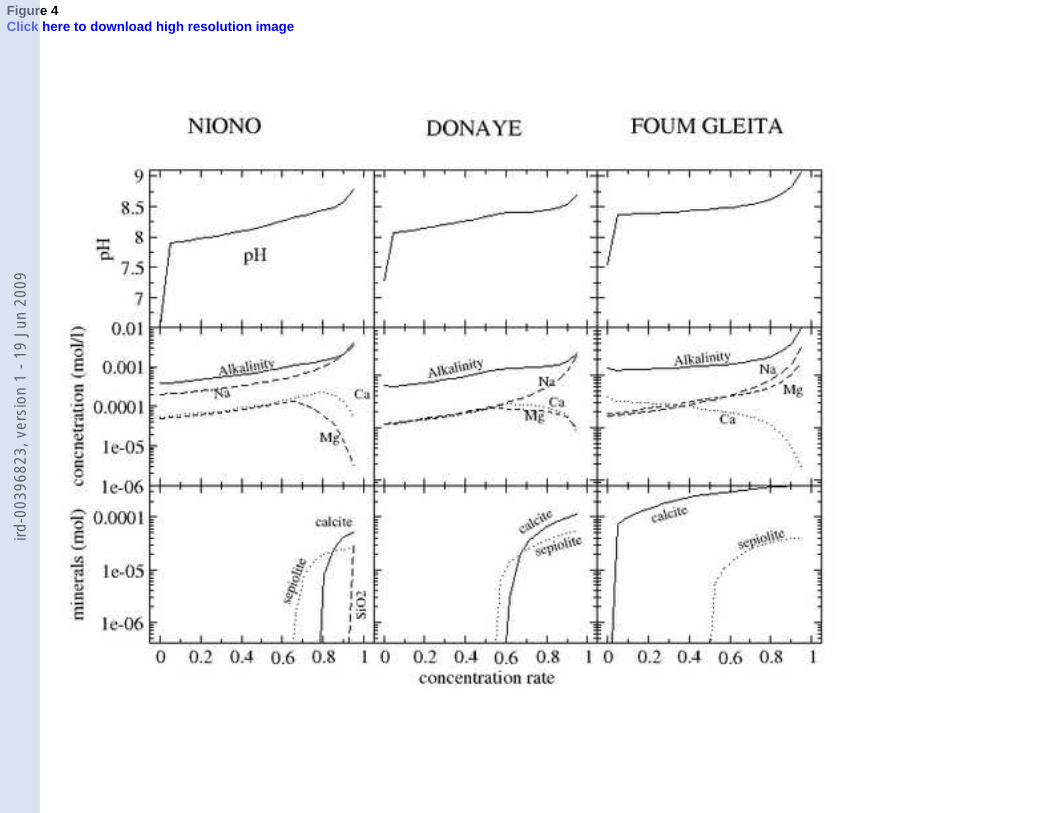
Figure 4Click here to download high resolution image
ird-0
0396
823,
ver
sion
1 -
19 J
un 2
009
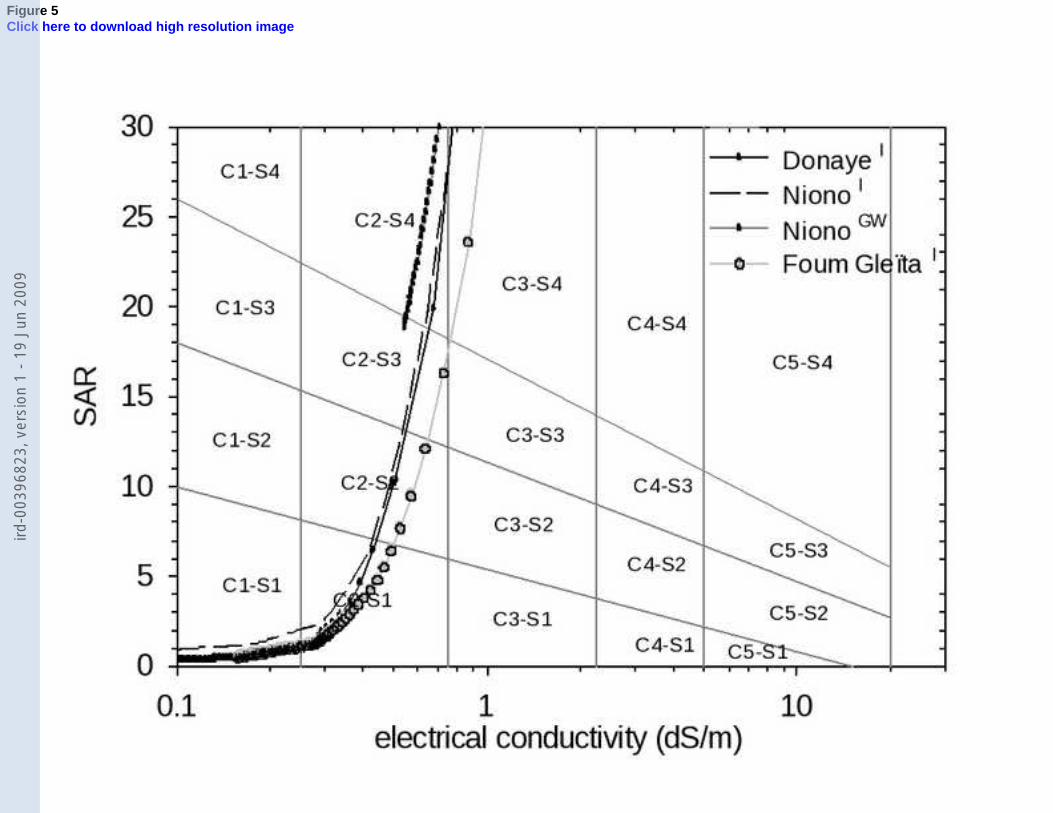
Figure 5Click here to download high resolution image
ird-0
0396
823,
ver
sion
1 -
19 J
un 2
009

Figure 6Click here to download high resolution image
ird-0
0396
823,
ver
sion
1 -
19 J
un 2
009

Figure 7Click here to download high resolution image
ird-0
0396
823,
ver
sion
1 -
19 J
un 2
009
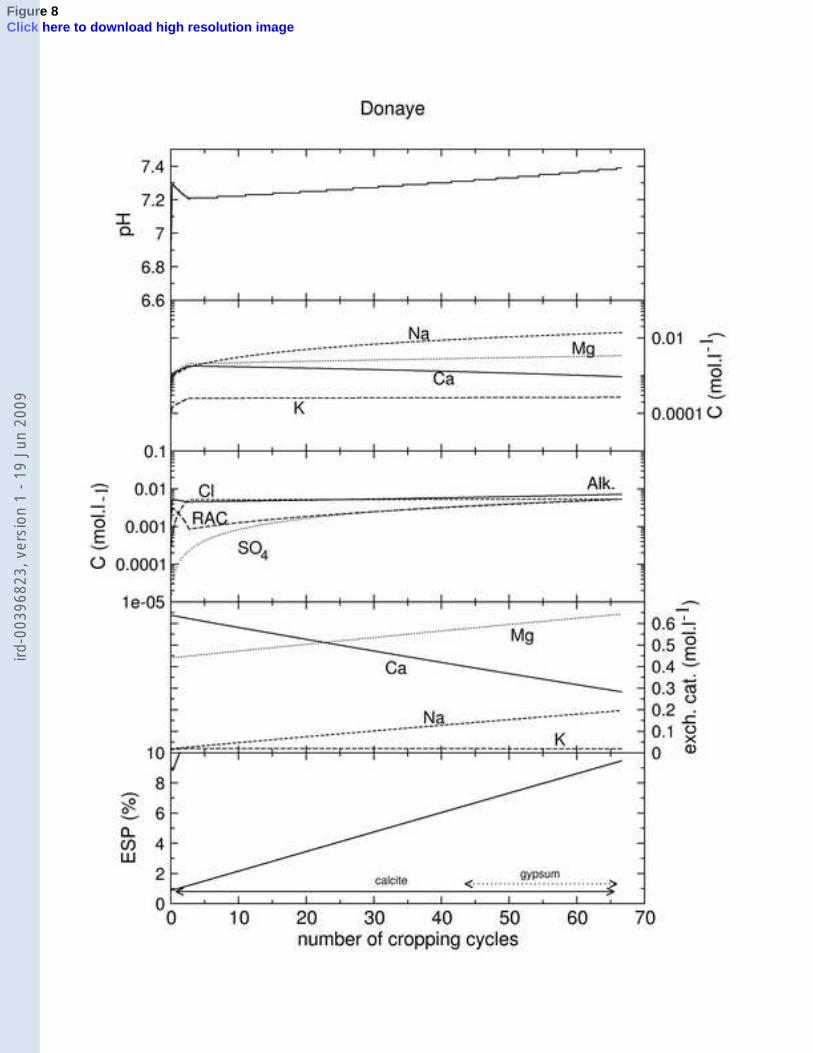
Figure 8Click here to download high resolution image
ird-0
0396
823,
ver
sion
1 -
19 J
un 2
009

Figure 9Click here to download high resolution image
ird-0
0396
823,
ver
sion
1 -
19 J
un 2
009
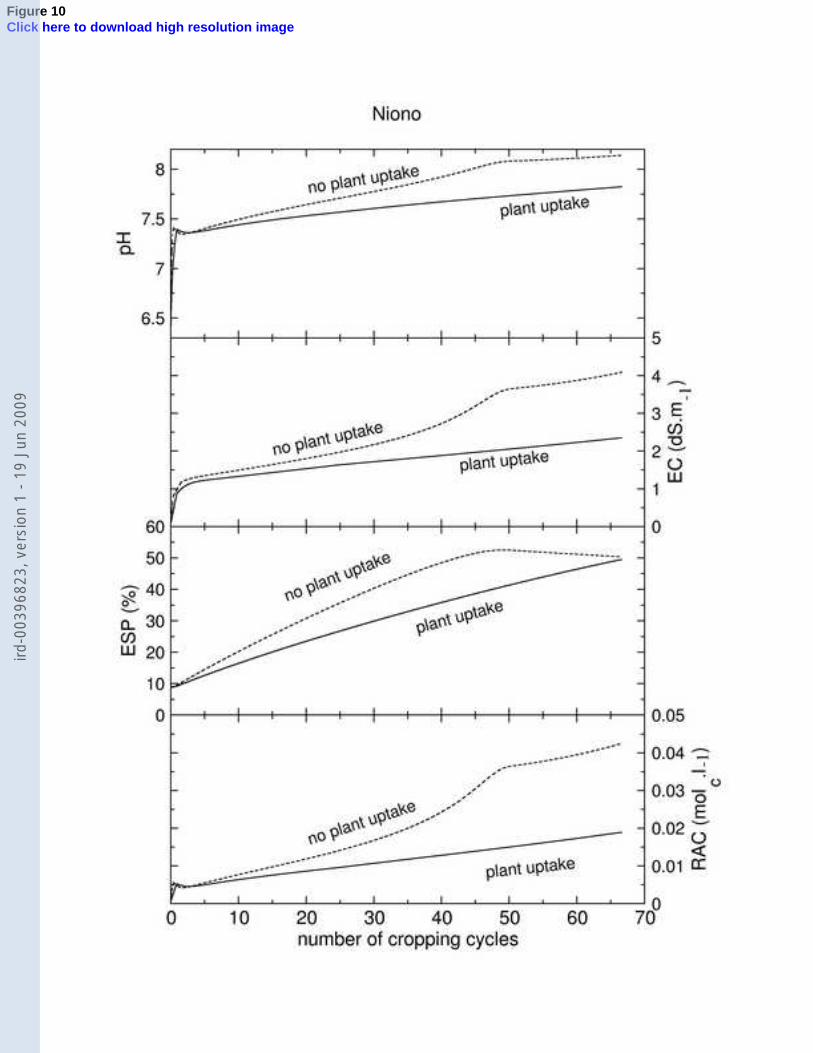
Figure 10Click here to download high resolution image
ird-0
0396
823,
ver
sion
1 -
19 J
un 2
009
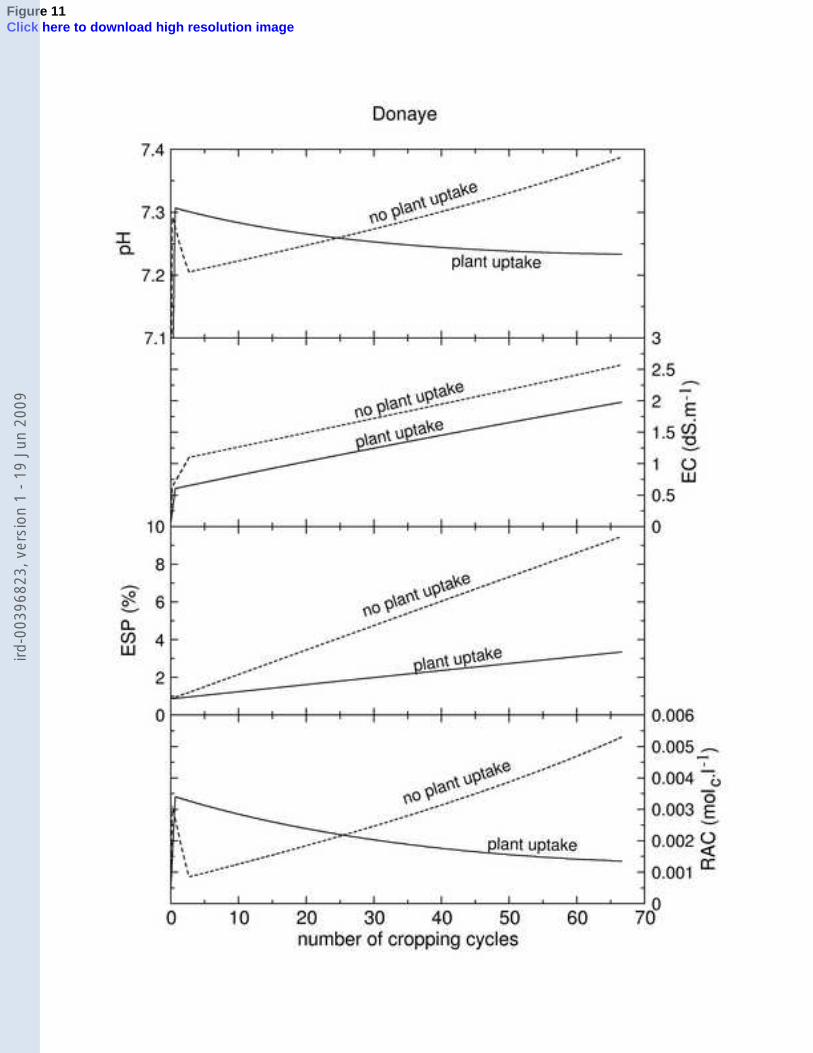
Figure 11Click here to download high resolution image
ird-0
0396
823,
ver
sion
1 -
19 J
un 2
009
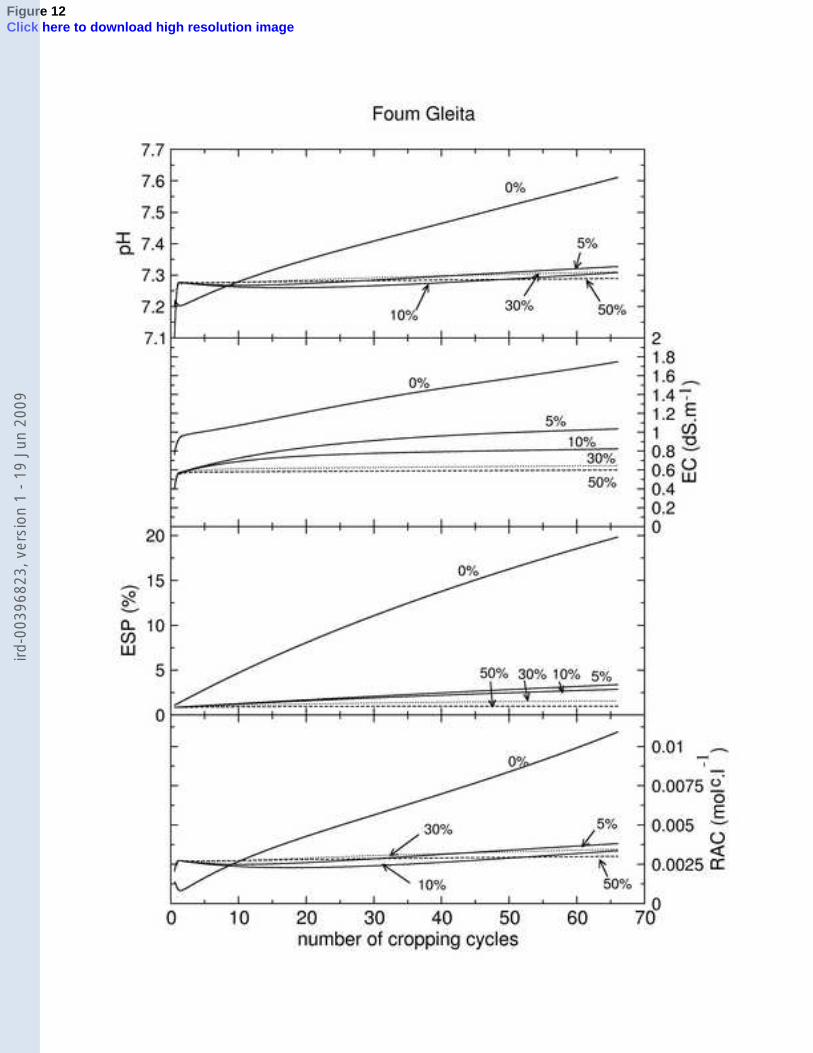
Figure 12Click here to download high resolution image
ird-0
0396
823,
ver
sion
1 -
19 J
un 2
009
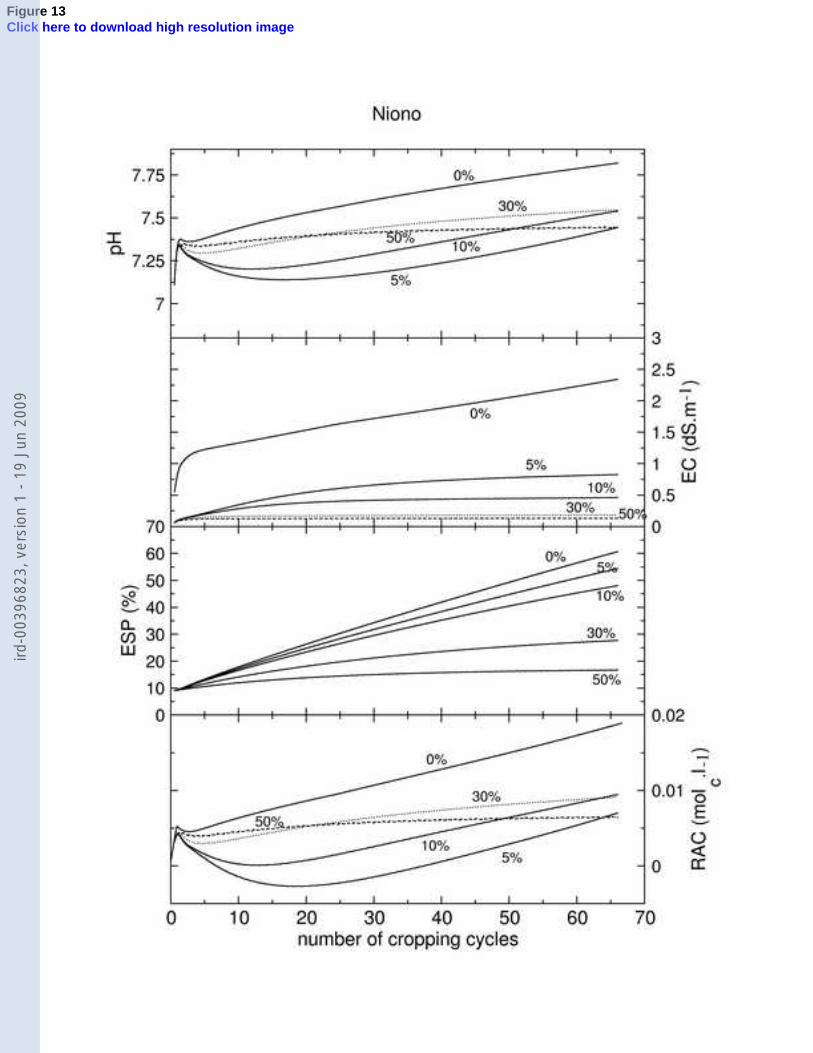
Figure 13Click here to download high resolution image
ird-0
0396
823,
ver
sion
1 -
19 J
un 2
009
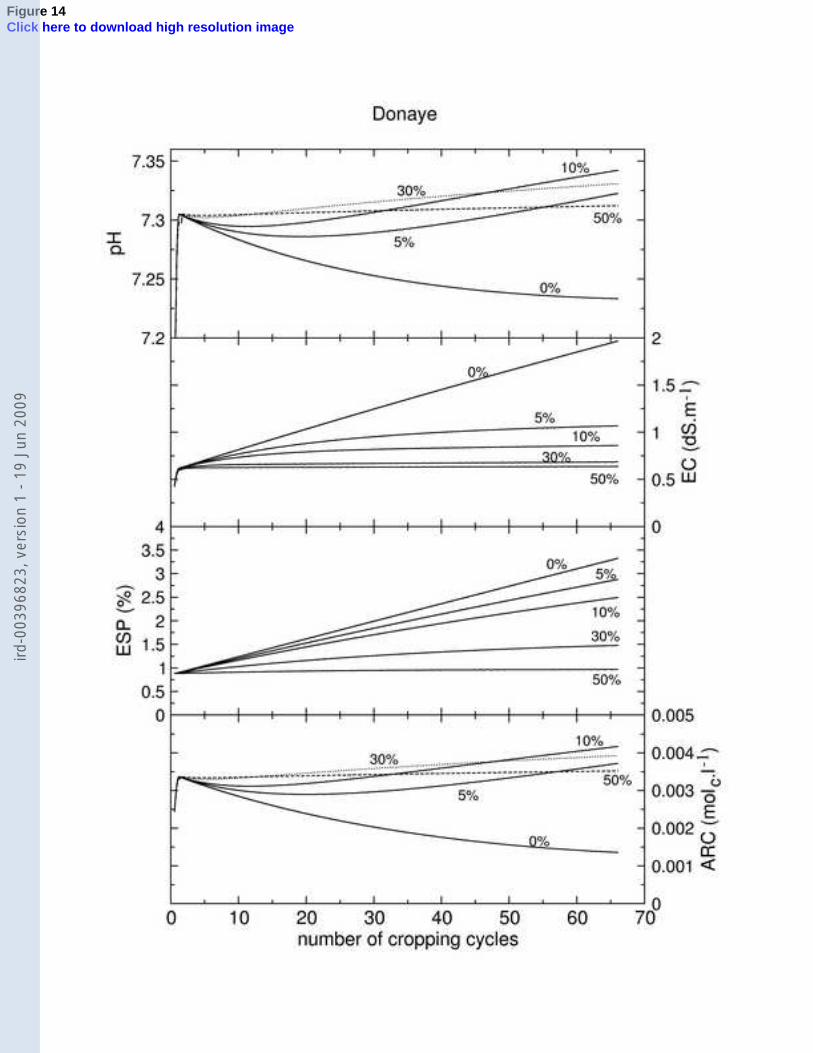
Figure 14Click here to download high resolution image
ird-0
0396
823,
ver
sion
1 -
19 J
un 2
009
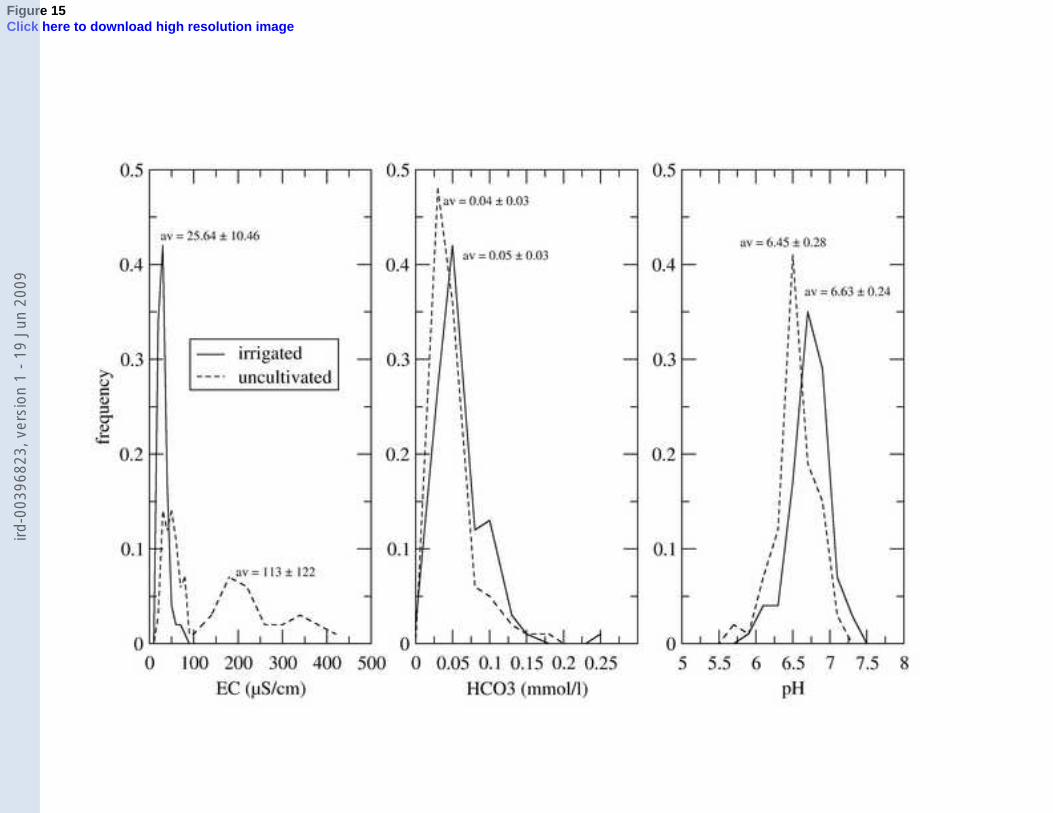
Figure 15Click here to download high resolution image
ird-0
0396
823,
ver
sion
1 -
19 J
un 2
009