Simulating calcium signaling in fine astrocytic processes
254
HAL Id: tel-02406699 https://tel.archives-ouvertes.fr/tel-02406699 Submitted on 12 Dec 2019 HAL is a multi-disciplinary open access archive for the deposit and dissemination of sci- entific research documents, whether they are pub- lished or not. The documents may come from teaching and research institutions in France or abroad, or from public or private research centers. L’archive ouverte pluridisciplinaire HAL, est destinée au dépôt et à la diffusion de documents scientifiques de niveau recherche, publiés ou non, émanant des établissements d’enseignement et de recherche français ou étrangers, des laboratoires publics ou privés. Simulating calcium signaling in fine astrocytic processes Audrey Denizot To cite this version: Audrey Denizot. Simulating calcium signaling in fine astrocytic processes. Quantitative Methods [q-bio.QM]. Université de Lyon, 2019. English. NNT: 2019LYSEI093. tel-02406699
-
Upload
khangminh22 -
Category
Documents
-
view
1 -
download
0
Transcript of Simulating calcium signaling in fine astrocytic processes

HAL Id: tel-02406699https://tel.archives-ouvertes.fr/tel-02406699
Submitted on 12 Dec 2019
HAL is a multi-disciplinary open accessarchive for the deposit and dissemination of sci-entific research documents, whether they are pub-lished or not. The documents may come fromteaching and research institutions in France orabroad, or from public or private research centers.
L’archive ouverte pluridisciplinaire HAL, estdestinée au dépôt et à la diffusion de documentsscientifiques de niveau recherche, publiés ou non,émanant des établissements d’enseignement et derecherche français ou étrangers, des laboratoirespublics ou privés.
Simulating calcium signaling in fine astrocytic processesAudrey Denizot
To cite this version:Audrey Denizot. Simulating calcium signaling in fine astrocytic processes. Quantitative Methods[q-bio.QM]. Université de Lyon, 2019. English. �NNT : 2019LYSEI093�. �tel-02406699�

N° d’ordre NNT : 2019LYSEI093
THESE de DOCTORAT DE L’UNIVERSITE DE LYONopérée au sein de
INSA Lyon
Ecole Doctorale 512Infomaths
Spécialité/ discipline de doctorat : Informatique
Soutenue publiquement le 08/11/2019, par :Audrey Denizot
Simulation de la signalisation calciquedans les prolongements fins
astrocytaires
Devant le jury composé de :
Dupont, Geneviève Directeur de recherche ULB RapporteureSavtchenko, Leonid Senior research scientist UCL Rapporteur
Henneberger, Christian Assistant Professor Uni. Bonn ExaminateurVenance, Laurent Directeur de recherche CNRS ExaminateurBeslon, Guillaume Professeur INSA Lyon ExaminateurPanatier, Aude Chargée de recherche INSERM Examinatrice
Berry, Hugues Directeur de recherche INRIA Directeur de thèseSoula, Hédi Professeur UPMC Co-directeur de
thèse, invité
Cette thèse est accessible à l'adresse : http://theses.insa-lyon.fr/publication/2019LYSEI093/these.pdf © [A. Denizot], [2019], INSA Lyon, tous droits réservés

Cette thèse est accessible à l'adresse : http://theses.insa-lyon.fr/publication/2019LYSEI093/these.pdf © [A. Denizot], [2019], INSA Lyon, tous droits réservés

Département FEDORA – INSA Lyon - Ecoles Doctorales – Quinquennal 2016-2020
SIGLE ECOLE DOCTORALE NOM ET COORDONNEES DU RESPONSABLE
CHIMIE CHIMIE DE LYON
http://www.edchimie-lyon.fr Sec. : Renée EL MELHEM Bât. Blaise PASCAL, 3e étage [email protected] INSA : R. GOURDON
M. Stéphane DANIELE Institut de recherches sur la catalyse et l’environnement de Lyon IRCELYON-UMR 5256 Équipe CDFA 2 Avenue Albert EINSTEIN 69 626 Villeurbanne CEDEX [email protected]
E.E.A. ÉLECTRONIQUE, ÉLECTROTECHNIQUE, AUTOMATIQUE
http://edeea.ec-lyon.fr Sec. : M.C. HAVGOUDOUKIAN [email protected]
M. Gérard SCORLETTI École Centrale de Lyon 36 Avenue Guy DE COLLONGUE 69 134 Écully Tél : 04.72.18.60.97 Fax 04.78.43.37.17 [email protected]
E2M2 ÉVOLUTION, ÉCOSYSTÈME,
MICROBIOLOGIE, MODÉLISATION
http://e2m2.universite-lyon.fr Sec. : Sylvie ROBERJOT Bât. Atrium, UCB Lyon 1 Tél : 04.72.44.83.62 INSA : H. CHARLES [email protected]
M. Philippe NORMAND UMR 5557 Lab. d’Ecologie Microbienne Université Claude Bernard Lyon 1 Bâtiment Mendel 43, boulevard du 11 Novembre 1918 69 622 Villeurbanne CEDEX [email protected]
EDISS INTERDISCIPLINAIRE
SCIENCES-SANTÉ
http://www.ediss-lyon.fr Sec. : Sylvie ROBERJOT Bât. Atrium, UCB Lyon 1 Tél : 04.72.44.83.62 INSA : M. LAGARDE [email protected]
Mme Emmanuelle CANET-SOULAS INSERM U1060, CarMeN lab, Univ. Lyon 1 Bâtiment IMBL 11 Avenue Jean CAPELLE INSA de Lyon 69 621 Villeurbanne Tél : 04.72.68.49.09 Fax : 04.72.68.49.16 [email protected]
INFOMATHS INFORMATIQUE ET
MATHÉMATIQUES
http://edinfomaths.universite-lyon.fr Sec. : Renée EL MELHEM Bât. Blaise PASCAL, 3e étage Tél : 04.72.43.80.46 [email protected]
M. Luca ZAMBONI Bât. Braconnier 43 Boulevard du 11 novembre 1918 69 622 Villeurbanne CEDEX Tél : 04.26.23.45.52 [email protected]
Matériaux
MATÉRIAUX DE LYON
http://ed34.universite-lyon.fr Sec. : Stéphanie CAUVIN Tél : 04.72.43.71.70 Bât. Direction [email protected]
M. Jean-Yves BUFFIÈRE INSA de Lyon MATEIS - Bât. Saint-Exupéry 7 Avenue Jean CAPELLE 69 621 Villeurbanne CEDEX Tél : 04.72.43.71.70 Fax : 04.72.43.85.28 [email protected]
MEGA MÉCANIQUE, ÉNERGÉTIQUE,
GÉNIE CIVIL, ACOUSTIQUE
http://edmega.universite-lyon.fr Sec. : Stéphanie CAUVIN Tél : 04.72.43.71.70 Bât. Direction [email protected]
M. Jocelyn BONJOUR INSA de Lyon Laboratoire CETHIL Bâtiment Sadi-Carnot 9, rue de la Physique 69 621 Villeurbanne CEDEX [email protected]
ScSo ScSo*
http://ed483.univ-lyon2.fr Sec. : Véronique GUICHARD INSA : J.Y. TOUSSAINT Tél : 04.78.69.72.76 [email protected]
M. Christian MONTES Université Lyon 2 86 Rue Pasteur 69 365 Lyon CEDEX 07 [email protected]
*ScSo : Histoire, Géographie, Aménagement, Urbanisme, Archéologie, Science politique, Sociologie, Anthropologie Cette thèse est accessible à l'adresse : http://theses.insa-lyon.fr/publication/2019LYSEI093/these.pdf © [A. Denizot], [2019], INSA Lyon, tous droits réservés

Cette thèse est accessible à l'adresse : http://theses.insa-lyon.fr/publication/2019LYSEI093/these.pdf © [A. Denizot], [2019], INSA Lyon, tous droits réservés

5
Remerciements
Je tiens tout d’abord à remercier celui qui, par son ouverture d’esprit, m’a ouvertles portes de la modélisation, à moi, expérimentaliste de formation. Hugues, mercipour ta confiance, ton soutien et ta patience. Merci aussi à toi Hédi pour avoir sutrouver les mots justes quand tout n’était pas au beau fixe dans mon parcours. Iwould also like to thank all of the other members of my PhD committee for acceptingto examine my thesis: Dr Geneviève Dupont, Dr Leonid Savtchenko, Pr ChristianHenneberger, Dr Laurent Venance, Pr Guillaume Beslon and Dr Aude Panatier.Merci à Aude et Geneviève, membres de mon comité de suivi de thèse. Elles ontsu me conseiller avec bienveillance et rigueur et ont contribué à l’amélioration dutravail présenté dans cette thèse.
Merci à l’ENS Lyon pour le financement de cette thèse. Merci à mon labora-toire, le LIRIS pour le financement de mon voyage au Japon afin de collaborer avecl’équipe d’Erik de Schutter ainsi que des mois de travail qui séparaient la fin demon contrat de thèse de la date de ma soutenance. Merci enfin à INRIA, qui afinancé mes déplacements, sans lesquels ma thèse aurait très certainement perdu encouleurs.
I am highly grateful to my collaborators. I would like to thank OIST universityand more particularly Erik De Schutter and his team for their welcoming duringmy 4 months-long stay in their lab. Special thanks to Weiliang and Iain, for theirpatience to teach me STEPS, their help to debug and improve my code as well ascollaborative work for designing new simulations. I thank Corrado Calì for his avail-ability for visioconferences and for the exciting collaborative work started together.Thank you Misa and Valentin for our joint fruitful work. Hopefully the first of a longseries. Special thanks to you Misa, for your rigorous work, patience, positivenessand support.
Merci également à toute l’équipe pédagogique Biosciences de l’INSA pour leuraide. Je tiens à remercier tout particulièrement Charlotte, Marion et Céline pourleurs précieux conseils. Merci mille fois Baptiste pour ta disponibilité, ton aide etpour tes réparations multiples au cours des TPs ! Merci également à l’équipe péda-gogique de la préparation à l’agrégation de l’ENS de Lyon et plus particulièrementà Déborah, pour la confiance et la liberté qui m’ont été accordées pour l’élaboration
Cette thèse est accessible à l'adresse : http://theses.insa-lyon.fr/publication/2019LYSEI093/these.pdf © [A. Denizot], [2019], INSA Lyon, tous droits réservés

6 Remerciements
de mes corrections de leçons et cours.Merci à l’antenne INRIA de la Doua pour les sourires et blagues (plus ou moins
grasses de bon matin), la bienveillance, les déjeuners, le café, les sorties montagneet musique, les discussions politiques, existentielles, les bonnes recettes partagées.Nico et tes jeux de mots, Victor et nos discussions qui m’ont fait grandir (même siça ne se voit pas trop en grimpe !), Aurel et nos cafés existentiels, Simon, Lois etCharles et nos débats animés, Kiki et tes sourires, Alex et ta bienveillance, Alvaroet ta générosité sans bornes, et tous les autres, merci pour votre gentillesse. GraciasCarlos pour ton enthousiasme for astrocytes and constant emulation.
Un grand merci aux Bordelais, qui ont su m’accueillir chaleureusement lors demon stage de Master 2. Merci Aude pour tout ce que tu m’as appris, tant sci-entifiquement qu’humainement. Merci à Dylan, Mark, Silvia et Valentin pour lesbons moments passés en paillasse et au bureau. Merci à mes amis de toujours m’yaccueillir les bras ouverts: Silvia, Scarlett, Nadia, Gio, Nico, Lisa et tous les autres! Merci, thank you, grazie Nadia et Gio de m’avoir permis de découvrir votre belleSicile et Palermo, un voyage riche en couleurs et en saveurs. Thank you Orsi foryour kind supportive messages and for all those sportive moments shared together,you have made Bordeaux feel like home for me too.
To my friends met in Okinawa: I think there are no words to thank you enough forall that you have done for me. Thank you for welcoming me, helping me and showingme around. Thank you my climbing, diving, workout, yoga, cooking, photographybuddies. Neil, my stay would have been so different without you around, thank youfor your kindness, I feel very lucky to be your friend. Thank you Leonidas for thescientific discussions and emulation on astrocytes. Thank you Anna, Natasha, Ales,Georgiy, Will, Nico, Xavi and Jo for broadening my horizons. I am very happy tohave met you. I miss you and will hopefully see you all very soon! Thanks also tothose crazy people met in OCNC: Vasha, Dorian, Aurelio and Caleb. I hope we’llmeet again!
Merci à tous mes amis pour leur soutien inconditionnel. Merci à Tristan et Fan-tine pour votre présence quand tout va bien comme dans les moments difficiles,pour nos expéditions et aventures en tous genres, pour vos bons petits plats et votregentillesse ! Merci aux autres copains grimpeurs pour toutes nos aventures et enattendant les suivantes : Yuri, Math, Alban, Ben. Thomas, Ralbol, Guillaume, JeanLoup, Théo : quelle coloc ! Merci pour ces moments de partage truffés d’étourderieset de blagues plus ou moins réussies (on sait à qui je fais référence ;)). Léa et nos dis-cussions pour refaire le monde (et nos vies). Thomas et ton sarcasme acéré. Pacôme,merci d’être toujours présent. Que d’aventures partagées, qui ont largement con-tribué à mon épanouissement ! Albane et nos discussions décousues et chaotiques (unpeu comme ces remerciements), rythmées au fil des voyages. Pierre et nos échangesécolos bobos gauchiasses et nos beaux voyages. Merci Ziyad de m’avoir ouvert tes
Cette thèse est accessible à l'adresse : http://theses.insa-lyon.fr/publication/2019LYSEI093/these.pdf © [A. Denizot], [2019], INSA Lyon, tous droits réservés

Remerciements 7
portes à la Réunion, merci pour ces moments d’échanges et de découvertes. Grégoireet nos discussions montagnardes, musicales et politiques. Merci de m’avoir permisde découvrir la Chine et ton quotidien là-bas. Aurélie et tes anecdotes croustillantes.Juliette et nos discussions toujours enrichissantes. Thib et Judith, votre gentillesseet votre bonne humeur. Merci aux zicos pour avoir rythmé mes années à Lyon:Félix, Jason, Pacôme, Lucas, le club jazz et la fanfare de l’ENS et tous ceux quej’ai oubliés. Alice et ta détermination détonnante, tes tractions impressionnantes etautres Top Top. Mon Jéjé et notre amitié inconditionnelle et bienveillante, tu memanques beaucoup. Ma Pata, ta folie et ta curiosité sans limites. Anh Thy et nosmoments de folies et de partage. Paug et nos échanges musico-existentiels. Rémi etnos discussions thésardes et autres aventures démesuriennes.
Qu’aurait été cette thèse sans une petite touche DéMesurée... J’ai failli louperle coche, heureusement, Jean Loup a eu l’oeil ! Que de moments d’échanges, defous rires, de sourires, d’apprentissage et de remises en question. En espérant quel’aventure n’en soit qu’à ses balbutiements. Jean Loup, Anissa, Nico, Rémi, Anaïs,Nadège, Marylou, Lucile, Sonia, Camille et tous les autres: merci pour votre ent-housiasme DéMesuré.
Une rencontre inopinée dans une salle d’escalade fort occupée. Alexis, je ne saiscomment te remercier pour ta bienveillance, ta gentillesse et ton soutien intarissable.Que de beaux moments partagés et de projets (à) réalisés(er). Vivement la suite,qui sait où nos petites têtes pleines d’idées vont nous mener !
Last but not least, merci à ma famille, toujours présente et acceptant avec pa-tience mes excentricités et autres lubies. Merci Quentin pour les blagues mais aussipour ton soutien quand mes jambes refusaient d’avancer. Merci maman et papa pourvotre accueil chaleureux et bienveillant et pour m’avoir toujours laissé la liberté depoursuivre mes rêves et mes passions. Un amour non sans appréhension mais sansbornes. J’ai de la chance de vous avoir. Merci, merci, merci.
Cette thèse est accessible à l'adresse : http://theses.insa-lyon.fr/publication/2019LYSEI093/these.pdf © [A. Denizot], [2019], INSA Lyon, tous droits réservés

Cette thèse est accessible à l'adresse : http://theses.insa-lyon.fr/publication/2019LYSEI093/these.pdf © [A. Denizot], [2019], INSA Lyon, tous droits réservés

9
Résumé
Les astrocytes sont les cellules gliales les plus abondantes du système nerveuxcentral et sont essentiels à son fonctionnement, intervenant notamment dans la for-mation des synapses et de la barrière hémato-encéphalique, dans le maintien del’homéostasie métabolique et ionique ainsi que dans la régulation des concentrationsextracellulaires en neurotransmetteurs. Récemment, les astrocytes ont égalementété identifiés comme des partenaires essentiels des neurones dans le cadre du traite-ment de l’information dans le système nerveux central. Les astrocytes peuvent en-trer en contact avec les neurones au niveau des synapses (≈ 60-90% des synapses del’hippocampe sont contactées par des astrocytes [1, 2]) et moduler la communicationneuronale via la libération de gliotransmetteurs et l’absorption de neurotransmet-teurs [3]. Les interactions au niveau de ces synapses dites tripartites sont nécessairesau développement et impliquées dans le fonctionnement normal du système nerveuxcentral.
L’excitabilité des astrocytes résulte de fluctuations de la concentration cytosoliqueen calcium : les signaux calciques. Ces signaux sont altérés dans de nombreusespathologies dont les maladies neuro-développementales, neurodégénératives et neu-ropsychiatriques. Le recours dans un nombre croissant d’études à la microscopie àsuper-résolution [4] et aux indicateurs calciques encodés génétiquement (GECI) [5]a permis de révéler une complexité jusqu’alors insoupçonnée des signaux calciquesastrocytaires. Ces derniers présentent une grande diversité spatio-temporelle, avecnotamment des différences majeures entre les signaux observés dans le corps cellu-laire (le soma) et dans les prolongements fins périphériques [6]. Par rapport auxsignaux somatiques, les signaux des prolongements sont caractérisés par une ciné-tique plus rapide, ont des amplitudes de pics d’un ordre de grandeur inférieur etsont fortement confinés spatialement. La majorité des signaux calciques mesurés invivo et in vitro survient dans ces prolongements, qui représentent la majorité (≈75%) du volume des astrocytes [7]
.
Historiquement, les signaux calciques ont été modélisés avec des modèles déter-
Cette thèse est accessible à l'adresse : http://theses.insa-lyon.fr/publication/2019LYSEI093/these.pdf © [A. Denizot], [2019], INSA Lyon, tous droits réservés

10 Résumé
ministes parfaitement mélangés, qui supposent que le système comprend un grandnombre de molécules qui sont uniformément distribuées. Ces méthodes ne prennentpas en compte la stochasticité inhérente aux interactions moléculaires ainsi que leseffets de diffusion, qui sont prépondérants dans les petits volumes. De fait, cesméthodes permettent d’étudier les signaux calciques à l’échelle de la cellule ou duréseau de cellules mais sont peu adaptées à l’étude des signaux dans de petits vol-umes comme ceux des prolongements fins astrocytaires. Les travaux présentés danscette thèse étudient l’effet des propriétés spatiales (comme la géométrie cellulaire,les distributions spatiales des molécules et la diffusion) sur les signaux calciques dansles prolongements fins astrocytaires, en collaboration avec des expérimentateurs.
Le Chapitre IV présente notre modèle de signaux calciques en 2 dimensionsspatiales. Comme les canaux calciques IP3R sont supposés être responsables dela majorité des signaux dans les astrocytes, nous proposons un modèle de signauxcalciques IP3R-dépendants. Pour prendre en compte la stochasticité inhérente auxpetits volumes sub-cellulaires et au faible nombre de molécules supposé dans lesprolongements fins, le modèle est à la fois spatialement explicite et individu-centré.La cinétique des canaux IP3R est modélisée par une version simplifiée du modèlede De Young et Keizer [8] (voir la section III.1 pour plus de détails). Cette implé-mentation en 2D, bien que moins réaliste qu’un équivalent en 3D, est plus rapideet mieux adaptée à une analyse extensive de la diversité de comportements que lemodèle peut exhiber. Les principales conclusions de cette étude sont les suivantes :
• Les signaux calciques spontanés du modèle émergent d’une interaction entrel’excitabilité et la stochasticité du système.
• Le modèle reproduit les principales formes de signaux calciques reportées dansla littérature.
• La fréquence des signaux calciques dépend de l’organisation spatiale des canauxcalciques. Les simulations du modèle montrent notamment que deux prolonge-ments astrocytaires exprimant exactement les mêmes canaux calciques peuventêtre caractérisés par différents types de signaux en fonction de l’organisationspatiale des canaux.
Comme le paramétrage en 2 dimensions spatiales ne permet pas d’établir unerelation exacte entre le nombre de molécules dans les simulations et les concentra-tions mesurées expérimentalement, nous avons décidé de développer notre modèleen 3 dimensions spatiales. Le modèle est stochastique, utilisant des méthodes dites"voxel-based" (voir la section III.4 pour plus de détails). Ce travail a été effectué
Cette thèse est accessible à l'adresse : http://theses.insa-lyon.fr/publication/2019LYSEI093/these.pdf © [A. Denizot], [2019], INSA Lyon, tous droits réservés

Résumé 11
en collaboration avec l’équipe d’Erik De Schutter, OIST (Japon), qui a développéle logiciel STEPS, avec lequel le modèle a été implémenté. Ce modèle permet deplus d’étudier l’impact de la localisation des canaux IP3R, qui sont présents à lasurface (2D) du reticulum endoplasmique (ER), sur les signaux calciques dans levolume cytosolique (en 3D). Dans ce modèle, les concentrations moléculaires et lesvolumes peuvent être ajustés avec précision pour décrire au mieux les données ex-périmentales. Les données expérimentales en question ont été obtenues par noscollaborateurs : l’équipe d’U. V. Nägerl de l’Institut interdisciplinaire des neuro-sciences de l’Université de Bordeaux (France) pour les mesures de signaux calciquesen microscopie à super-résolution et en confocal et C. Cali, KAUST University(Arabie Saoudite) pour la reconstitution en 3D de la géométrie d’un astrocyte del’hippocampe àpartir d’images de microscopie électronique. Les résultats de cetteétude sont présentés dans le Chapitre V. Brièvement, les principales conclusions decette étude sont que :
• Notre modèle en 3D, avec un volume et des concentrations calciques réalistes,reproduit les données expérimentales de signaux calciques spontanés, obtenuesdans des microdomaines calciques dans les prolongements fins.
• Les simulations du modèle prédisent que des variations locales de la concentra-tion et de la cinétique des indicateurs fluorescents, utilisés dans les expériencesd’imagerie calcique, pourraient contribuer à la diversité des signaux observéeau sein d’un même astrocyte.
• Des interactions entre l’organisation spatiale des canaux calciques et la géométriecellulaire permettent de moduler la fréquence et l’amplitude des signaux spon-tanés.
Les résultats de nos collaborateurs [9] ainsi que de nombreuses études révèlent laprésence de signaux induits par l’activité des neurones avoisinant l’astrocyte. Dansle but de mieux comprendre cette communication entre neurones et astrocytes, nousavons simulé l’induction de signaux calciques astrocytaires en réponse à une stimula-tion neuronale. Les simulations ainsi que les données expérimentales associées sontprésentées dans le Chapitre VI et permettent de mieux comprendre les paramètresqui peuvent influencer le déclenchement ainsi que la propagation des signaux au seindes prolongements fins. Les principales conclusions de cette étude sont :
• La géométrie des prolongements astrocytaires, qui sont le site des interactionsentre neurones et astrocytes, influence la probabilité ainsi que la vitesse depropagation des signaux. Notamment, les structures observées par nos col-laborateurs, constituant une alternance de renflements cellulaires et de rami-fications plus fines, semblent isoler les renflements de la diffusion de molécules
Cette thèse est accessible à l'adresse : http://theses.insa-lyon.fr/publication/2019LYSEI093/these.pdf © [A. Denizot], [2019], INSA Lyon, tous droits réservés

12 Résumé
tout en favorisant la propagation des signaux calciques.
• La présence de ramifications se refermant en anneaux semble diminuer la prob-abilité ainsi que la vitesse de propagation des signaux calciques, pouvant poten-tiellement favoriser une communication locale entre l’astrocyte et les synapsesen contact avec ladite structure en anneaux.
• Des simulations de notre modèle révèlent que la distance entre une synapseneuronale et le plus proche ER astrocytaire influe sur la variabilité en am-plitude et en fréquence des signaux calciques, pour une intensité de stimulusneuronal donnée.
En résumé, les simulations présentées dans cette thèse indiquent que (1) la diffu-sion moléculaire, fortement modulée par la concentration et la cinétique des buffersendogènes et exogènes, (2) l’organisation spatiale des molécules au sein de la cel-lule, notamment la co-clusterisation des canaux calciques, (3) la géométrie de l’ERet sa localisation dans la cellule et (4) la géométrie cellulaire influencent fortementles signaux calciques et pourraient contribuer à la diversité des signaux calciquesastrocytaires.
Mots-clés: Système nerveux central, astrocytes, signalisation, calcium, neuro-sciences computationnelles, modélisation stochastique, réaction-diffusion.
Cette thèse est accessible à l'adresse : http://theses.insa-lyon.fr/publication/2019LYSEI093/these.pdf © [A. Denizot], [2019], INSA Lyon, tous droits réservés

13
Abstract and keywords
Abstract
Astrocytes are predominant glial cells in the central nervous system, which areessential for the formation of synapses, participate to the blood-brain barrier andmaintain the metabolic, ionic and neurotransmitter homeostasis. Recently, astro-cytes have emerged as key elements of information processing in the central nervoussystem. Astrocytes can contact neurons at synapses and modulate neuronal com-munication via the release of gliotransmitters and the uptake of neurotransmitters.The use of super-resolution microscopy [4] and highly sensitive genetically encodedCa2+ indicators (GECIs) [5] have revealed a striking spatiotemporal diversity ofCa2+ signals in astrocytes. Most astrocytic signals occur in processes, which arethe sites of neuron-astrocyte communication, and strongly differ from somatic sig-nals. Those processes are too fine to be resolved by conventional light microscopyso that super-resolution microscopy and computational modeling remain the onlymethodologies to study those compartments. The work presented in this thesis aimsat investigating the effect of spatial properties (as e.g cellular geometry, moleculardistributions and diffusion) on Ca2+ signals in those processes, which are deemedessential in such small volumes.
Historically, Ca2+ signals were modeled with deterministic well-mixed approaches,which enabled the study of Ca2+ signals in astrocytic networks or whole-cell events.Those methods however ignore the stochasticity inherent to molecular interactionsas well as diffusion effects, which both play important roles in small volumes.
In this thesis, we present the spatially-extended stochastic model that we havedeveloped in order to investigate Ca2+ signals in fine astrocytic processes. Thiswork was performed in collaboration with experimentalists that performed electron(C. Cali, KAUST University, Saudi Arabia) as well as super-resolution microscopy(Nägerl team, Institut interdisciplinaire des neurosciences de l’Université de Bor-deaux, France). The model was validated against experimental data. Simulations of
Cette thèse est accessible à l'adresse : http://theses.insa-lyon.fr/publication/2019LYSEI093/these.pdf © [A. Denizot], [2019], INSA Lyon, tous droits réservés

14 Abstract and keywords
the model suggest that (1) molecular diffusion, strongly influenced by the concen-tration and kinetics of endogenous and exogenous buffers, (2) intracellular spatialorganization of molecules, notably Ca2+ channels co-clustering, (3) ER geometryand localization within the cell, (4) cellular geometry strongly influence Ca2+ dy-namics and can be responsible for the striking diversity of astrocytic Ca2+ signals.This work contributes to a better understanding of astrocyte Ca2+ signals, a prereq-uisite for understanding neuron-astrocyte communication and its influence on brainfunction.
Keywords : Central nervous system, astrocytes, signaling, calcium, computa-tional neuroscience, stochastic modeling, reaction-diffusion.
Cette thèse est accessible à l'adresse : http://theses.insa-lyon.fr/publication/2019LYSEI093/these.pdf © [A. Denizot], [2019], INSA Lyon, tous droits réservés

15
List of scientific productions
Publications
K. Ceyzériat, L. Ben Haim, A. Denizot, D. Pommier, M. Matos, O. Guillemaud,M.-A. Palomares, L. Abjean, F. Petit, P. Gipchtein, M.-C. Gaillard, M. Guiller-mier, S. Bernier, M. Gaudin, G. Aurégan, C. Joséphine, N. Déchamps, J. Veran, V.Langlais, K. Cambon, A. P. Bemelmans, J. Baijer, G. Bonvento, M. Dhenain, J.-F.Deleuze, S. H. R. Oliet, E. Brouillet, P. Hantraye, M.-A. Carrillo-de Sauvage, R.Olaso, A. Panatier, and C. Escartin, “Modulation of astrocyte reactivity improvesfunctional deficits in mouse models of Alzheimer’s disease,” Acta NeuropathologicaCommunications, vol. 6, p. 104, Oct. 2018.
Denizot, A., Arizono, M., Nägerl, U.V., Soula, H., and Berry, H. (2019). Simu-lation of calcium signaling in fine astrocytic processes: Effect of spatial propertieson spontaneous activity. PLOS Comput. Biol. 15, e1006795.
Denizot, A., Berry, H., Venugopal, S. Computational Modeling of IntracellularCa2+ Signals in Astrocytes. in Encyclopedia of Computational Neuroscience, 2019.Submitted.
Denizot, A., Arizono, M., Chen, W., Hepburn, I., Soula, H., Nagerl, U. V.,De Schutter, E., Berry, H. Investigating the effect of the nanoscale architecture ofastrocytic processes on the propagation of calcium signals, accepted to the 28thAnnual Computational Neuroscience Meeting, CNS 2019, Barcelona, Spain. InPress.
Cette thèse est accessible à l'adresse : http://theses.insa-lyon.fr/publication/2019LYSEI093/these.pdf © [A. Denizot], [2019], INSA Lyon, tous droits réservés

16 List of scientific productions
Communications
A. Denizot, M. Arizono, W. Chen, I. Hepburn, H. Soula, V. U. Nägerl, E. DeSchutter, H. Berry. Investigating the effect of the nanoscale architecture of astro-cytic processes on the propagation of calcium signals, Annual Computational Neu-roscience Meeting, July 2019, Barcelona, Spain. (poster)
A. Denizot, H. Soula, and H. Berry, Simulation of calcium signaling in fine astro-cytic processes, OIST Computational Neuroscience Course, Okinawa, Japan, July2018. (poster)
A. Denizot, H. Soula, and H. Berry, Simulation of calcium signaling in fine as-trocytic processes, LyonSysBio, Lyon, France, November 2017. (poster)
A. Denizot, H. Soula, and H. Berry, Simulation of calcium signaling in fine as-trocytic processes : effect of spatial properties on spontaneous activity, LyonSysBio,Lyon, France, November 2017. (oral presentation)
A. Denizot, H. Soula, and H. Berry, Simulation of calcium signaling in fine astro-cytic processes, OIST Computational Neuroscience Course, Okinawa, Japan, July2017. (poster)
A. Denizot, Towards simulation of calcium signaling in fine astrocytic processes,International Astrocyte School, Bertinoro, Italy, March 2017. (oral presentation)
A. Denizot, H. Soula, and H. Berry, Simulation of calcium signaling in fine as-trocytic processes, CompSysbio, Aussois, France, March 2017. (poster)
Cette thèse est accessible à l'adresse : http://theses.insa-lyon.fr/publication/2019LYSEI093/these.pdf © [A. Denizot], [2019], INSA Lyon, tous droits réservés

17
Contents
A Modeling astrocyte excitability and Ca2+ signaling 27
I Astrocyte characteristics and functions within the CNS 29I.1 What are astrocytes? . . . . . . . . . . . . . . . . . . . . . . . . . 29
I.1.1 Historical considerations . . . . . . . . . . . . . . . . . . . 29I.1.2 Astrocyte characteristics . . . . . . . . . . . . . . . . . . 30
I.2 Physiological functions of astrocytes . . . . . . . . . . . . . . . . 36I.2.1 Brain development . . . . . . . . . . . . . . . . . . . . . . 36I.2.2 Homeostasis . . . . . . . . . . . . . . . . . . . . . . . . . 36I.2.3 Metabolic support . . . . . . . . . . . . . . . . . . . . . . 38I.2.4 Blood Brain Barrier . . . . . . . . . . . . . . . . . . . . . 38I.2.5 Brain injury . . . . . . . . . . . . . . . . . . . . . . . . . 38I.2.6 Information processing . . . . . . . . . . . . . . . . . . . . 39I.2.7 Focus on the tripartite synapse . . . . . . . . . . . . . . . 41
II Astrocyte excitability: Ca2+ signals 45II.1 General considerations on Ca2+ signals . . . . . . . . . . . . . . . 45
II.1.1 Ca2+, ubiquitous intracellular messenger . . . . . . . . . . 45II.1.2 Experimental methods to investigate Ca2+ signaling . . . 46
II.2 Astrocytic Ca2+ signals . . . . . . . . . . . . . . . . . . . . . . . 53II.2.1 Functional roles of Ca2+ signals in astrocytes . . . . . . . 53II.2.2 Characteristics of astrocytic Ca2+ signals . . . . . . . . . 57II.2.3 Mechanisms of Ca2+ signals in astrocytes . . . . . . . . . 60
III Modeling astrocytic Ca2+ signals 67III.1 Deterministic well-mixed models . . . . . . . . . . . . . . . . . . 67
III.1.1 Methods and computational approaches . . . . . . . . . . 68III.1.2 Deterministic well-mixed models of Ca2+ signals . . . . . 69III.1.3 Deterministic well-mixed models of astrocytic Ca2+ signals 73
III.2 Stochastic well-mixed models . . . . . . . . . . . . . . . . . . . . 74III.2.1 Methods and computational approaches . . . . . . . . . . 74III.2.2 Stochastic well-mixed models of Ca2+ signals . . . . . . . 78III.2.3 Stochastic well-mixed models of astrocytic Ca2+ signals . 79
Cette thèse est accessible à l'adresse : http://theses.insa-lyon.fr/publication/2019LYSEI093/these.pdf © [A. Denizot], [2019], INSA Lyon, tous droits réservés

18 CONTENTS
III.3 Deterministic spatial models . . . . . . . . . . . . . . . . . . . . . 81III.3.1 Methods and computational approaches . . . . . . . . . . 82III.3.2 Deterministic spatial models of Ca2+ signals . . . . . . . . 83III.3.3 Deterministic spatial models of astrocytic Ca2+ signals . . 84
III.4 Stochastic spatial models . . . . . . . . . . . . . . . . . . . . . . 91III.4.1 Methods and computational approaches . . . . . . . . . . 92III.4.2 Stochastic spatial models of Ca2+ signals . . . . . . . . . 95III.4.3 Stochastic spatial models of astrocytic Ca2+ signals . . . . 97
III.5 Hybrid models . . . . . . . . . . . . . . . . . . . . . . . . . . . . 98III.5.1 Methods and computational approaches . . . . . . . . . . 99III.5.2 Hybrid models of Ca2+ signals . . . . . . . . . . . . . . . 100
III.6 Conclusion . . . . . . . . . . . . . . . . . . . . . . . . . . . . . . 102
B Investigating Ca2+ dynamics in fine astrocytic pro-cesses 105
IV Towards a 2D spatial individual-based model of Ca2+ signalingin small volumes 107IV.1 Kinetic scheme and modeling approach . . . . . . . . . . . . . . . 108
IV.1.1 Kinetic scheme . . . . . . . . . . . . . . . . . . . . . . . . 108IV.1.2 Modeling approach . . . . . . . . . . . . . . . . . . . . . . 110
IV.2 Results: effect of spatial properties on spontaneous Ca2+ activityin the 2D model . . . . . . . . . . . . . . . . . . . . . . . . . . . 115IV.2.1 Spontaneous oscillations of the 2D model . . . . . . . . . 115IV.2.2 Transitions between Ca2+ activity regimes . . . . . . . . . 117IV.2.3 Impact of Ca2+ diffusion coefficient on Ca2+ signals . . . . 118IV.2.4 IP3R clustering controls Ca2+ signals when co-localized . 122
IV.3 Discussion . . . . . . . . . . . . . . . . . . . . . . . . . . . . . . . 123
V Modeling spontaneous Ca2+ signals in realistic 3D geometries 129V.1 Simulating Ca2+ signals in a simplified 3D PAP geometry . . . . 129
V.1.1 Experimental measurements of Ca2+ signals . . . . . . . . 130V.1.2 Modeling approach . . . . . . . . . . . . . . . . . . . . . . 130V.1.3 Results . . . . . . . . . . . . . . . . . . . . . . . . . . . . 134V.1.4 Discussion . . . . . . . . . . . . . . . . . . . . . . . . . . 140
V.2 Simulating Ca2+ signals in a 3D geometry extracted from EM . . 141V.2.1 Modeling approach . . . . . . . . . . . . . . . . . . . . . . 141V.2.2 Results . . . . . . . . . . . . . . . . . . . . . . . . . . . . 143V.2.3 Discussion . . . . . . . . . . . . . . . . . . . . . . . . . . 148
V.3 Discussion . . . . . . . . . . . . . . . . . . . . . . . . . . . . . . . 150
Cette thèse est accessible à l'adresse : http://theses.insa-lyon.fr/publication/2019LYSEI093/these.pdf © [A. Denizot], [2019], INSA Lyon, tous droits réservés

Table des matières 19
VI Modeling the onset and propagation of neuronal activity-inducedCa2+ signals in processes 155
VI.1 Simulating the propagation of Ca2+ signals in processes displayingnode/shaft geometries . . . . . . . . . . . . . . . . . . . . . . . . 156
VI.1.1 Experimental background . . . . . . . . . . . . . . . . . . 156
VI.1.2 Modeling approach and geometry . . . . . . . . . . . . . . 157
VI.1.3 Simulations reproduce bleaching experiments . . . . . . . 158
VI.1.4 Investigating signal propagation in node/shaft geometries 161
VI.1.5 Investigating the influence of node branching on the prop-agation of Ca2+ signals . . . . . . . . . . . . . . . . . . . 166
VI.1.6 Discussion . . . . . . . . . . . . . . . . . . . . . . . . . . 172
VI.2 Simulating the effect of ER-PSD distance on neuronal activity-induced Ca2+ signals in astrocytic processes . . . . . . . . . . . . 174
VI.2.1 Experimental background . . . . . . . . . . . . . . . . . . 174
VI.2.2 Modeling approach and geometry . . . . . . . . . . . . . . 174
VI.2.3 Results: Effect of ER-PSD distance on the onset and char-acteristics of astrocytic Ca2+ signals . . . . . . . . . . . . 175
VI.2.4 Discussion . . . . . . . . . . . . . . . . . . . . . . . . . . 177
VI.3 Conclusion . . . . . . . . . . . . . . . . . . . . . . . . . . . . . . 179
VIIConclusion and perspectives 181
A Supplemental methods and model validation 245
A.1 Parameter values . . . . . . . . . . . . . . . . . . . . . . . . . . . 245
A.2 Validation of modeling strategies . . . . . . . . . . . . . . . . . . 245
A.2.1 Study of the effect of endogenous buffers on the effectiveDCa . . . . . . . . . . . . . . . . . . . . . . . . . . . . . . 245
A.2.2 Validation of the 3D model implemented in STEPS . . . . 251
Cette thèse est accessible à l'adresse : http://theses.insa-lyon.fr/publication/2019LYSEI093/these.pdf © [A. Denizot], [2019], INSA Lyon, tous droits réservés

20
List of Figures
I.1 Typical morphology of astrocytes . . . . . . . . . . . . . . . . . . . 31I.1 Typical morphology of astrocytes (continued) . . . . . . . . . . . . 32I.2 Astrocytic networks . . . . . . . . . . . . . . . . . . . . . . . . . . 33I.3 Morphological diversity of astrocytes . . . . . . . . . . . . . . . . . 35I.4 Roles of astrocytes in brain development and function . . . . . . . . 37I.5 Impaired functions of astrocytes in the diseased brain . . . . . . . . 40I.5 Impaired functions of astrocytes in the diseased brain (continued) . 41I.6 Dynamic remodeling of PAPs . . . . . . . . . . . . . . . . . . . . . 42I.7 Neuron-astrocyte interactions at the tripartite synapse . . . . . . . 43
II.1 Principles of Ca2+ signaling . . . . . . . . . . . . . . . . . . . . . . 46II.2 Role of Ca2+ in cardiomyocytes contraction . . . . . . . . . . . . . 47II.3 Genetically encoded Ca2+ indicators (GECIs) . . . . . . . . . . . . 50II.4 Super-resolution and electron microscopy for better resolving Ca2+
signaling at the nanoscale in astrocytes . . . . . . . . . . . . . . . . 51II.5 Functional roles of astrocytic Ca2+ signals . . . . . . . . . . . . . . 54II.6 Spatiotemporal diversity of Ca2+ signals in WT and IP3R2−/−
astrocytes . . . . . . . . . . . . . . . . . . . . . . . . . . . . . . . . 59II.7 Spatial diversity of Ca2+ signals in astrocytes . . . . . . . . . . . . 60II.8 Schematic representation of the main molecules involved in Ca2+
signaling expressed in astrocytes . . . . . . . . . . . . . . . . . . . . 62II.9 IP3-dependent Ca2+-induced Ca2+ release mechanism . . . . . . . . 64II.10 Structure and kinetics of the IP3R channel . . . . . . . . . . . . . . 66
III.1 Phase plane diagrams of excitable and oscillatory systems . . . . . 69III.2 Historical, deterministic well-mixed, models of IP3R channels . . . . 71III.2 Historical, deterministic well-mixed, models of IP3R channels (con-
tinued) . . . . . . . . . . . . . . . . . . . . . . . . . . . . . . . . . . 72III.3 Typical kinetic scheme of astrocytic Ca2+ oscillations and the as-
sociated Ca2+ dynamics . . . . . . . . . . . . . . . . . . . . . . . . 75III.4 Example of a modal gating model of IP3R: the Park & Drive model 80III.5 Examples of geometries for modeling intracellular Ca2+ signals in
astrocytes . . . . . . . . . . . . . . . . . . . . . . . . . . . . . . . . 86
Cette thèse est accessible à l'adresse : http://theses.insa-lyon.fr/publication/2019LYSEI093/these.pdf © [A. Denizot], [2019], INSA Lyon, tous droits réservés

LIST OF FIGURES 21
III.6 Example of a spatial oscillator model of intracellular astrocyticCa2+ signals . . . . . . . . . . . . . . . . . . . . . . . . . . . . . . . 89
III.7 Towards simulating signal propagation within intracellular astro-cytic networks with ASTRO . . . . . . . . . . . . . . . . . . . . . . 90
III.8 Spatially-explicit stochastic approaches . . . . . . . . . . . . . . . . 93III.9 Overview of the methods for simulating molecular interactions . . . 103
IV.1 Reaction scheme and IP3R model . . . . . . . . . . . . . . . . . . . 109IV.2 2D model exploration . . . . . . . . . . . . . . . . . . . . . . . . . . 116IV.3 The particle-based model produces different Ca2+ activity regimes
depending on parameter values . . . . . . . . . . . . . . . . . . . . 119IV.4 Ca2+ diffusion modulates the temporal characteristics of the signals
upon co-localization . . . . . . . . . . . . . . . . . . . . . . . . . . 121IV.5 IP3R clustering modulates Ca2+ signals when co-localized . . . . . . 124
V.1 Reaction scheme of the 3D ”GC+Buf” model . . . . . . . . . . . . . 132V.2 3D model simulations in fine astrocyte processes successfully repro-
duce Ca2+ microdomains signals . . . . . . . . . . . . . . . . . . . . 135V.3 The kinetics and concentration of GECIs strongly influence Ca2+
dynamics . . . . . . . . . . . . . . . . . . . . . . . . . . . . . . . . 137V.4 IP3R clustering and ER-PM distance influence Ca2+ dynamics in 3D139V.4 IP3R clustering and ER-PM distance influence Ca2+ dynamics in
3D (continued) . . . . . . . . . . . . . . . . . . . . . . . . . . . . . 140V.5 Realistic astrocytic mesh extracted from EM . . . . . . . . . . . . . 142V.6 Simulations in a realistic 3D PAP geometry reproduce experimental
astrocytic Ca2+ traces . . . . . . . . . . . . . . . . . . . . . . . . . 144V.7 Effect of IP3R clustering on spontaneous Ca2+ dynamics in a real-
istic PAP geometry . . . . . . . . . . . . . . . . . . . . . . . . . . . 146V.8 Clustering at ER-PM contact sites does not impact spontaneous
Ca2+ signals . . . . . . . . . . . . . . . . . . . . . . . . . . . . . . . 147V.9 Neuronal stimulation is encoded in amplitude and frequency of
Ca2+ signals in PAPs . . . . . . . . . . . . . . . . . . . . . . . . . . 150V.10 Mesh extracted from electron microscopy revealing PSDs at the
vicinity of PAPs . . . . . . . . . . . . . . . . . . . . . . . . . . . . . 151
VI.1 Spontaneous Ca2+ waves propagate along astrocytic processes inthe gliapil . . . . . . . . . . . . . . . . . . . . . . . . . . . . . . . . 156
VI.2 Super-resolution microscopy reveals node/shaft structures in thegliapil . . . . . . . . . . . . . . . . . . . . . . . . . . . . . . . . . . 157
VI.3 Geometries designed for investigating node/shaft structures of thegliapil . . . . . . . . . . . . . . . . . . . . . . . . . . . . . . . . . . 158
Cette thèse est accessible à l'adresse : http://theses.insa-lyon.fr/publication/2019LYSEI093/these.pdf © [A. Denizot], [2019], INSA Lyon, tous droits réservés

22
VI.4 Simulations confirm that node/shaft width ratio is a good predictorof the diffusional isolation of nodes . . . . . . . . . . . . . . . . . . 160
VI.5 Nodes of the gliapil often interact with dendritic spines . . . . . . . 163VI.6 Study of the effect of node/shaft width ratio on node to node signal
propagation . . . . . . . . . . . . . . . . . . . . . . . . . . . . . . . 165VI.7 Study of the effect of node/shaft width ratio on signal propagation
upon successive neuronal stimuli . . . . . . . . . . . . . . . . . . . 167VI.8 Experimental analysis of node branching and designed geometries . 168VI.9 Effect of node branching and of ring-like structures on signal prop-
agation . . . . . . . . . . . . . . . . . . . . . . . . . . . . . . . . . 171VI.10 Electron microscopy reveals the presence of ER in PAPS and its
vicinity to synapses . . . . . . . . . . . . . . . . . . . . . . . . . . . 175VI.11 Modeling approach for investigating the effect of ER-PSD distance
on Ca2+ signaling . . . . . . . . . . . . . . . . . . . . . . . . . . . . 176VI.12 ER-PSD distance influences Ca2+ peak duration and amplitude . . 178
A.1 Mean field study of the effect of Ca2+ buffering . . . . . . . . . . . 249A.2 Effect of adding buffers to the 2D particle-based model . . . . . . . 250A.3 Validation of the 3D model . . . . . . . . . . . . . . . . . . . . . . 252
List of Tables
II.1 Kinetics of the major Ca2+ indicators . . . . . . . . . . . . . . . . . . . 52
III.1Propensity functions for different reaction types . . . . . . . . . . . . . 76III.2Spatially-extended stochastic simulators . . . . . . . . . . . . . . . . . 96
IV.1Parameter values and initial conditions of the 2D model . . . . . . . . 112
A.1 Parameter values and initial conditions of the 3D model . . . . . . . . 246A.2 Parameter values and initial conditions associated to endogenous buffers
in the 3D ”GC+Buf” model . . . . . . . . . . . . . . . . . . . . . . . . 247A.3 Parameter values and initial conditions of the ODE model of Ca2+
buffering . . . . . . . . . . . . . . . . . . . . . . . . . . . . . . . . . . . 248A.4 Parameter values and initial conditions of the 2D model of Ca2+ buffering251
Cette thèse est accessible à l'adresse : http://theses.insa-lyon.fr/publication/2019LYSEI093/these.pdf © [A. Denizot], [2019], INSA Lyon, tous droits réservés

23
Abbreviations
AAV: Adeno-associated virusAD: Alzheimer’s diseaseANP: Atrial natriuretic peptideATP: Adenosine-triphosphateBD: Brownian dynamicsBDNF: Brain-derived neurotrophic factorcAMP: Cyclic adenosine monophosphateCB1: Cannabinoid receptor type 1CICR: Calcium-induced calcium releaseCME: Chemical master equationCNS: Central nervous systemDREADD: Designer receptors exclusively activated by designer drugsDYK: De Young-KeizerEM: Electron microscopyER: Endoplasmic reticulumFDF: Fire-diffuse-fireFIB: Focused ion beamFRET: Fluorescence resonance energy transferFWHM: Full width at half maximumGABA: Gamma-Aminobutyric acidGECI: Genetically encoded calcium indicatorGFAP: Glial fibrillary acidic proteinGPCR: G protein-coupled receptorsGFRD: Green’s function reaction dynamicsIP3R: Inositol 3-Phosphate receptorLTP: Long term potentiationmGluR: metabotropic glutamate receptorNMDA: N-Methyl-D-aspartic acidNCX: Na+-Ca2+ exchangerNPC: Neural precursor cellODE: Ordinary differential equation
Cette thèse est accessible à l'adresse : http://theses.insa-lyon.fr/publication/2019LYSEI093/these.pdf © [A. Denizot], [2019], INSA Lyon, tous droits réservés

24 Abbreviations
OPC: Oligodendrocyte precursor cellPALM: Photo-activated localizationPAP: Peripheral astrocytic processPD: Parkinson’s diseasePDE: Partial differential equationPDF: Probability density functionPDMP: Piecewise deterministic markov processesPIP2: Phosphatidylinositol 4,5-bisphosphatePKA: Protein kinase APLC: Phospholipase CPM: Plasma membraneRDME: Reaction-diffusion master equationROS: Reactive Oxygen SpeciesRyR: Ryanodine receptorSEM: Scanning electron microscopySERCA: Smooth endoplasmic calcium ATPaseSMFM: Single-molecule fluorescence microscopySOCE: Store-operated Ca2+ entrySSA: Stochastic Simulation AlgorithmSTED: Stimulated emission depletionSTORM: Stochastic optical reconstructionTIRF: Total internal reflection fluorescenceTRPV: Transient receptor potential cation channel subfamily VTTX: TetrodotoxinWT: Wild type
Cette thèse est accessible à l'adresse : http://theses.insa-lyon.fr/publication/2019LYSEI093/these.pdf © [A. Denizot], [2019], INSA Lyon, tous droits réservés

Abbreviations 25
“If our small minds, for some convenience, divide this glass of wine, this universe,into parts — physics, biology, geology, astronomy, psychology, and so on —
remember that nature does not know it! So let us put it all back together, notforgetting ultimately what it is for.”
Richard Feynman
Cette thèse est accessible à l'adresse : http://theses.insa-lyon.fr/publication/2019LYSEI093/these.pdf © [A. Denizot], [2019], INSA Lyon, tous droits réservés

Cette thèse est accessible à l'adresse : http://theses.insa-lyon.fr/publication/2019LYSEI093/these.pdf © [A. Denizot], [2019], INSA Lyon, tous droits réservés

27
Part A
Modeling astrocyte excitability andCa2+ signaling
Cette thèse est accessible à l'adresse : http://theses.insa-lyon.fr/publication/2019LYSEI093/these.pdf © [A. Denizot], [2019], INSA Lyon, tous droits réservés

Cette thèse est accessible à l'adresse : http://theses.insa-lyon.fr/publication/2019LYSEI093/these.pdf © [A. Denizot], [2019], INSA Lyon, tous droits réservés

29
Chapter I
Astrocyte characteristics andfunctions within the CNS
I.1 What are astrocytes?
I.1.1 Historical considerations
Astrocytes are a type of glial cells of the central nervous system (CNS). Thefirst report of glial cells was done by Virchow in 1846, describing a highly connectedsubstance, cementing the brain, that he named “neuroglia” [10]. Camillo Golgi hasfirst identified them as cells that differ from neurons [11, 12] and observed, usingsilver-chromate staining, a huge diversity of glial cells, which were organized innetworks. He also observed that many of their cellular ramifications were headingtowards blood vessels. Michael von Lenhossek has named those cells ’astrocytes’,literally "star-shaped" cells, referring to their ramifications from the soma [13]. Inthe beginning of the XXth century, Ramón y Cajal has developed a method to stainastrocytes: gold and mercury chloride-sublimate, which labels only glial fibrillaryacidic protein (GFAP), a marker that is mostly expressed in astrocytes [14]. He hassuggested their role in regulating blood flow [15]. Few researchers a century agoeven speculated that glia might play a central role for information processing in theCNS [16, 17].
Cette thèse est accessible à l'adresse : http://theses.insa-lyon.fr/publication/2019LYSEI093/these.pdf © [A. Denizot], [2019], INSA Lyon, tous droits réservés

30 I. Astrocyte characteristics and functions within the CNS
I.1.2 Astrocyte characteristics
Astrocyte morphology
Deiters has first reported the ramified shape of some neuroglia, later confirmedby Michael von Lenhossek [18]. Astrocyte morphology consists in a big soma(≈ 6 × 103µm3 [19]), containing the nucleus, and cellular ramifications/branchesreferred to as astrocyte processes.
The first studies of astrocytic morphology were performed with stainings such asGolgi staining and with dyes that were loaded in the cell. Later studies have ratherperformed immunostaining, which relies on the selective visualization of proteinsthat are specific to the cell type of interest. For example, astrocytes have been tradi-tionally characterized by their expression of GFAP and anti-GFAP immunostaininghas yield to the concept of astrocytes being star-shaped cells (see Fig I.1A). Moderntools beyond those techniques have been developed to visualize astrocyte morphol-ogy in physiological conditions. Transcriptomics studies [20, 21, 22] have identifiedastrocyte-specific promoters such as GFAP or S100β [23, 24, 25]. Those promoterscan be used to express genetically encoded Ca2+ indicators (GECIs) specifically inastrocytes [26]. Assuming that all regions of astrocytes can display Ca2+ signals,those tools allow for a better resolution of astrocyte morphology in vivo and in vitrocompared to e.g GFAP staining, which marks 15% of the total astrocytic volume[27]. GECIs, similarly to dyes (see Fig I.1), actually reveal a shape that is morespongiform than star-shaped , with a volume of ≈ 104 µm3 [28]. ≈ 80% of the totalsurface area belongs to processes [29]. Specialized and polarized ramifications thatare in contact with blood vessels are called endfeet [30]. Electron microscopy (EM)has been important for characterizing astrocytic morphology at the nanometer scale[31, 32, 33, 2, 1], revealing extra-thin sheets and processes near the neuropil andenwrapping synapses, often referred to as peripheral astrocyte processes (PAPs).Fig I.1 presents the typical morphology of astrocytes, revealed by different imagingtechniques.
Interestingly, an astrocyte in the adult rodent brain can cover from 20 000 to80 000 µm3 [27, 35, 36]. Each astrocyte only contacts neighboring ones at its pe-ripheral processes so that astrocytes occupy non-overlapping territories [27] (see alsoFig I.1C). A single astrocyte can also wrap several neuronal somata and can interactwith 300 to 600 neuronal dendrites [35]. Finally, it has been demonstrated that as-trocytes in the rat hippocampus can contact simultaneously up to 100 000 synapses[27]. Since the volume of human astrocytes is 15 to 20 fold larger than in rodents,a single astrocytic domain could cover up to 2 000 000 synapses [37].
Cette thèse est accessible à l'adresse : http://theses.insa-lyon.fr/publication/2019LYSEI093/these.pdf © [A. Denizot], [2019], INSA Lyon, tous droits réservés

I.1. What are astrocytes? 31
Figure I.1: Typical morphology of astrocytes. High resolution electron and light microscopyrevealing the ramified, spongiform structure of astrocytes. (A) Comparison of astrocyte imagesobtained by glial fibrillary acidic protein (GFAP) immunostaining (red) and 3d reconstructionsof dye-filled astrocytes (green). The images illustrate the higher morphological complexitythat can be visualized with dye-filled compared to GFAP-labeled astrocytes, which is morespongiform than star-shaped. (B) Confocal image of a dye-filled astrocyte, revealing its discretemorphological compartments: the soma, major branches and distal finer processes). (C ) Opticalslice through the interface region of neighboring astrocytes (yellow), illustrating the restrictedregion in which astrocytes interdigitate.
Cette thèse est accessible à l'adresse : http://theses.insa-lyon.fr/publication/2019LYSEI093/these.pdf © [A. Denizot], [2019], INSA Lyon, tous droits réservés

32 I. Astrocyte characteristics and functions within the CNS
Figure I.1: Typical morphology of astrocytes (continued). (D) Electron microscopicimage of an entire astrocyte that was stained with Golgi (left). Yellow zones represent threeperi-somatic sub-volumes and cyan regions, three peripheral ones (680 µm3 each). The rightpanel illustrates the dense networks of fine astrocytic processes. (E ) 3D reconstruction ofastrocytic processes (blue) from a single astrocyte of the rat hippocampus. Their appositionto neuronal dendrites are clearly visible (four dendrites are reconstructed in gold, yellow, redand purple). Presynaptic neuronal elements are not reconstructed here. ≈ 50% of the surfaceof mushroom spines was apposed to peripheral astrocyte processes (PAPs) (F ), while only theneck of thin dendrites was in contact with processes (G, arrows). Panel A was taken fromPekny et al [34], B from Shigetomi et al [26], C from Bushong et al [27] and D, E, F, G fromReichenbach et al [29].
Neuron/astrocytes ratio
The number of glial cells in the central nervous system has for long been acontroversial subject (see [38]). New stereological studies [39] have revealed a ratioof the total number of glia and neurons in macaque monkeys and human brains thatis roughly 1:1, although the glia/neurons ratio depends on brain region: from 11:1in the brain stem to 0.2:1 in the cerebellum [40]. Astrocytes most probably accountfor 20-40% of all glial cells [18], thus accounting for 10-20% of neural cells in thehuman CNS.
Expression identity of astrocytes
In order to better characterize astrocyte gene expression identity and the possiblevariability of the latter depending on brain region, genetic screens have been per-formed. Astrocytes have first been characterized by the expression of glial fibrillaryacidic protein (GFAP) [18]. GFAP is however not the best astrocytic marker as itis expressed late in development and fails at labelling protoplasmic astrocytes [41].Recent transcriptomic studies on populations of astrocytes have revealed that theuse of ALDH1L1 gene marker should be favoured instead [42, 43]. Other markersfor astrocytes have been identified by Zhang et al [21]. No universal marker forstaining all astrocytes in the CNS has been identified yet but the most commonlyused are GFAP, Vimentin, S100β, EAAT-1 (GLAST), EAAT-2 (GLT-1), Glutaminesynthetase, ALDH1L1, CX43, CX30, AQP4 and SOX9 (see [18] for more details).Importantly, cultured astrocytes do not express the same genes as in vivo astrocytes[42].
Cette thèse est accessible à l'adresse : http://theses.insa-lyon.fr/publication/2019LYSEI093/these.pdf © [A. Denizot], [2019], INSA Lyon, tous droits réservés

I.1. What are astrocytes? 33
A B
Figure I.2: Astrocytic networks (A) Astrocytes are connected to each other via connexin (Cx)channels. Specific domains characterize each astrocyte and astrocytes communicate via gapjunction channels only at the interface between their territories. Note that 2 processes from thesame astrocyte can contact each other and form ‘reflexive’ gap junctions. (B) Representation ofthe organization of the astroglial network in the hippocampus, in which the layer of pyramidalneurons (red) influences the number and morphologies of astrocytes. This figure was takenfrom Giaume et al [51].
Astrocyte networks
Astrocyte coupling has first been demonstrated by injecting Lucifer yellow or bio-cytin in a single astrocyte, resulting in the staining of nearly a hundred of adjacentastrocytes. This connection between the cytosol of several astrocytes is orchestratedby gap junctions on astrocytic membranes. Gap junctions are composed of hundredsof channels named connexons, which, when open, enable the intercellular transportof all ions and molecules that are smaller than 1000 Da. There, two adjacent mem-branes come close together, with an intercellular space of ≈ 2-3 nm [44]. Astrocytescoupling is highly variable as it can involve networks of hundreds of cells [45, 46] toonly 2-5 of them [47, 48] and as coupling is not ubiquitous so that neighboring cellsmay not be coupled even if closely apposed [49, 50]. The organization of astrocyticnetworks does not look random as they often follow anatomical structures such asbarrels of the somatosensory cortex [51]. Interestingly, ≈ 25% of gap junctions havebeen reported to connect processes from the same cell [52], potentially enabling thecoupling of different subcellular compartments [52].
Cette thèse est accessible à l'adresse : http://theses.insa-lyon.fr/publication/2019LYSEI093/these.pdf © [A. Denizot], [2019], INSA Lyon, tous droits réservés

34 I. Astrocyte characteristics and functions within the CNS
Astrocyte electrophysiological signature
Mature astrocytes are hyperpolarized with a resting potential of ≈ -80 mV, dueto high membrane permeability to K+ [53]. They are also characterized by a nearlylinear relationship of current to voltage [54]. Although astrocytes display a hugevariability in their morphology, their electrophysiological properties are remarkablysimilar. For more details on the ion channels responsible for ion currents and restingmembrane potential in astrocytes, see [18].
Astrocyte diversity
Although astrocytes share a similar ramified structure, they display a remark-able morphological heterogeneity, which was already reported by Ramón y Cajal[55]. The diversity of astrocytic morphology is presented in Fig I.3. Nine mainastrocyte subtypes have emerged from morphological studies, including protoplas-mic VS fibrous astrocytes, which are found in gray and white matter respectively,and the more specific Müller glia of the retina and Bergmann glia in the cerebel-lum [56]. Notably, cultured astrocytes display a very different morphology fromin situ or in vivo astrocytes (Fig I.3F,G). Depending on brain region, astrocytesdisplay various protein expression levels [57], transcriptionally distinct intracellularregions [43, 58, 59] as well as distinct Ca2+ signals and electrophysiological proper-ties [45, 60, 61]. Although the morphology of astrocytes is as heterogeneous as thatof neurons, the functional implications of this diversity is still poorly understoodand requires further investigation.
The proportion of synapses that are in contact with astrocytes processes alsodisplays both intra-regional and inter-regional diversity (see section I.2.7 for moredetails).
Better understanding the subregional and regional diversity of astrocytes is im-portant as it might underlie selective neuronal degeneration in brain diseases suchas Parkinson’s disease [62]. For more detailed reviews on regional morphological andfunctional diversity of astrocytes and potential approaches that could uncover thediversity of astrocytes, see [63, 64, 18, 65].
Cette thèse est accessible à l'adresse : http://theses.insa-lyon.fr/publication/2019LYSEI093/these.pdf © [A. Denizot], [2019], INSA Lyon, tous droits réservés

I.1. What are astrocytes? 35
Figure I.3: Morphological diversity of astrocytes. Astrocytes are polarized and highlyramified cells that can display various morphologies depending on brain region. (A) Astrocyteof the mouse neocortex. Note that one process on the left is contacting a blood vessel (whitearrow). (B) Bergmann glial cells from mouse cerebellum. Those astrocytes display a specificpolarization: cell bodies are localized at one end while the other end contacts the pia mater. (C )Müller glial cells of the mouse retina also display an elongated morphology. (D) Staining of ezrin,an actin-binding protein in PAPs, in the stratum radiatum of the rat hippocampus. This staininglabels the tips of astocytic processes and enables the visualization of astrocyte territories.Somata are labelled with white circles. Arrows represent pyramidal cells and interneurons.(E ) Brainbow Cre/LoxP transgenic mice also revealing astrocyte territories and spongiformstructures. (F–G ) Co-immunostaining for GFAP (red) and ezrin (green), respectively labellingmajor processes and more distal ones and illustrating the lack of precision of morphologicalstructure observed with GFAP staining. Also note the striking difference in morphology ofacutely isolated (F ) VS cultured (G ) astrocytes. Cultured astrocytes appear less ramified,displaying a less complex morphological architecture. Scale bars (µm): 20 (A), 100 (D), 20(E), 15 (F), 10 (G). Figure from Reichenbach et al [29].
Cette thèse est accessible à l'adresse : http://theses.insa-lyon.fr/publication/2019LYSEI093/these.pdf © [A. Denizot], [2019], INSA Lyon, tous droits réservés

36 I. Astrocyte characteristics and functions within the CNS
I.2 Physiological functions of astrocytes
Although they were first considered to be mainly responsible for brain tissuecohesion, the roles of astrocytes in the functioning of the central nervous system arenow better documented. The main roles of astrocytes in the CNS are presented inFig I.4 and in the next paragraphs.
I.2.1 Brain development
The critical role of astrocytes for synaptogenesis has first been observed in cul-ture. Indeed, astrocyte-neuron co-cultures displayed seven times more synapses thanclassical neuronal cultures [66]. Astrocytes induce synapse formation via the releaseof diverse molecules including thrombospondins and chordin-like 1 [67, 68]. As-trocytes modulate neighboring dendritic spines morphology [69], synapse-astrocytecontact is correlated to the maturation and to the lifetime of dendritic spines [70]and movements of astrocytic processes are observed during synapse formation [70].Interestingly, metabotropic glutamate receptors (mGluRs) are expressed in astro-cytes as early as the first postnatal week [71], enabling them to detect synapticactivity at early stages of brain development. For a review on the roles of astrocytesin synapse formation, maturation, pruning, as well as synapse elimination, whichare synthesized in the concept of the astroglial cradle [72, 73], see Dallerac et al [74].
Astrocytes are also involved in promoting the myelination of active neurons byoligodendrocytes [75]. For reviews on the roles of astrocytes in CNS development,see [76, 41].
I.2.2 Homeostasis
Astrocytes regulate ionic homeostasis of the extracellular space, including K+,Na+ and Ca2+, which is essential for the propagation of electrical signals within neu-rons [81]. Astrocytes are essential for uptaking and catabolizing neurotransmitters,including GABA, adenosine, monoamines and glutamate. Astrocytes also releaseprecursors of neurotransmitters to neurons. For example, around 80% of glutamateis taken up by astrocytes in the CNS [82], which prevents neuronal and synapticdamage caused by high glutamate concentration [83]. Astrocytes also regulate thepH and water homeostasis of the extracellular space, thus also regulating its volume.Finally, astrocytes regulate the homeostasis of reactive oxygen species (ROS) [18].
Cette thèse est accessible à l'adresse : http://theses.insa-lyon.fr/publication/2019LYSEI093/these.pdf © [A. Denizot], [2019], INSA Lyon, tous droits réservés

I.2. Physiological functions of astrocytes 37
Figure I.4: Roles of astrocytes in brain development and function. Astrocytes areessential for brain development (figure from Schiweck et al [77]), homeostasis, informationprocessing and metabolism (figure from Amaral et al [78]). They are key elements of the bloodbrain barrier (figure from Kandel et al [79]) and participate to the repair of the injured braintissue (figure from Lee-Liu et al [80]). For more detailed discussion and references on thephysiological roles of astrocytes, please refer to section I.2 and to Verkhratsky et al [18].
Cette thèse est accessible à l'adresse : http://theses.insa-lyon.fr/publication/2019LYSEI093/these.pdf © [A. Denizot], [2019], INSA Lyon, tous droits réservés

38 I. Astrocyte characteristics and functions within the CNS
Astrocytes are thus chemosensing cells that are responsible for systemic home-ostasis of ions and metabolites in the CNS.
I.2.3 Metabolic support
Astrocytes possess most of the brain glycogen reserves and can metabolize itthrough glycogenesis, before providing neurons with energy substrates such as glu-tamine [78, 84]. Glycogenesis is important for long term potentiation (LTP) and formemory consolidation [18]. Most importantly, astrocytes utilize glucose to performaerobic glycolysis, which produces lactate [84]. The astrocyte-neuron lactate shuttlehypothesis (ANLSH) has been formulated by Pellerin et al [85] and proposes thatneuronal activity relies on lactate that is released from astrocytes. Astrocytes canproduce, release as well as take up extracellular lactate [86] so that astrocytes cansupport metabolic needs of neurons by producing as well as uptaking lactate.
I.2.4 Blood Brain Barrier
Astrocytes contribute to the blood-brain barrier, which protects the brain fromhomeostatic changes and from most of the pathogens (although a few pathogens suchas e.g the human immunodeficiency virus, HIV, can cross this barrier) [87]. Endfeetare enriched in ion channels and Kir K+ transporters [87], which contribute tosystemic homeostasis in the brain by regulating its pH, Na+ and K+ concentrations.Astrocyte activity in response to neuronal activity can induce vasomodulation [88,89, 90], illustrating potential roles of astrocytes for mediating interactions betweenactive neurons and blood vessels.
I.2.5 Brain injury
The involvement of glial cells in the diseased brain has been speculated since thebeginning of the XIXth century by Alzheimer, Nissl and Fromman. However, theXXth century has been characterized by a neuro-centric investigation of the diseasedbrain [91].
As astrocytes play key roles in brain function, their functions are altered invarious brain diseases such as epilepsy [91], brain tumours [91], neurodegenerativediseases [92], Down syndrome [93], major depressive disorder [91] and schizophrenia
Cette thèse est accessible à l'adresse : http://theses.insa-lyon.fr/publication/2019LYSEI093/these.pdf © [A. Denizot], [2019], INSA Lyon, tous droits réservés

I.2. Physiological functions of astrocytes 39
[94]. The involvement of astrocytes in brain diseases is represented in Fig I.5A.When the brain is injured, astrocytes migrate to the injured site and get ac-
tivated. Astrocyte activation, also called astrogliosis, is characterized by an up-regulation of GFAP and by a modified pattern of gene expression. The beneficialand detrimental effects of reactive astrocytes are detailed in refs [95, 96, 34] and rep-resented in Fig I.5B. After their activation, astrocytes often form a glial scar thatisolates damaged from intact tissue [95] and assists recovery of the damaged tissue.The glial scar consists in astrocytes interacting with different cell types and onlyisolates severely damaged tissues such as tumours, necrosing tissue, neurodegener-ative regions, infected or inflamed regions, both in brain and spinal chord injuriesor following a stroke [97]. The glial scar is thus a hallmark of various brain diseasessuch as traumatic spinal cord and brain injuries, chronic (e.g multiple sclerosis (MS)and amyotrophic lateral sclerosis (ALS)) and acute neurodegenerative diseases (e.gAlzheimer’s disease (AD) and Parkinson’s disease (PD)) and stroke [98]. Recentstudies have demonstrated that the glial scar is essential for the regeneration ofstimulated axons within injured spinal cord [99]. However, the glial scar is also as-sociated with some detrimental effects such as inhibition of neuronal growth and ofsynaptic transmission at the injury site [100] and consists in an impermeable barrierfor regeneration, thus compromising neuronal repair [97].
My master’s internship consisted in investigating the effect of astrogliosis in thehippocampus on neuronal communication. We have demonstrated that astrocytereactivity impairs long term potentiation and is associated with learning and mem-ory defects [101].
Astrocytes, especially reactive astrocytes, thus emerge as new therapeutic tar-gets for the diseased brain. For reviews on astrogliosis, see [102, 103, 104, 34]. Formore details on the involvement of astrocytes in the diseased brain, see dedicatedreviews [94, 105, 91, 106].
I.2.6 Information processing
As they do not exhibit electrical excitability [108], astrocytes were first char-acterized as non-excitable cells of the CNS, although they express voltage-gatedchannels [109] and membrane receptors for neurotransmitters such as glutamate,γ-aminobutyric acid (GABA) or adenosine triphosphate (ATP) [18]. Astrocyte ex-citability instead results from variations of cytosolic Ca2+ concentration [110], whichcan activate signals that modulate neuronal communication [111, 112, 113, 114]. Thediversity and functional roles of astrocytic Ca2+ signals will be further developed inChapter II and the interactions of astrocytes with neurons for information processingin the brain in section I.2.7.
Cette thèse est accessible à l'adresse : http://theses.insa-lyon.fr/publication/2019LYSEI093/these.pdf © [A. Denizot], [2019], INSA Lyon, tous droits réservés

40 I. Astrocyte characteristics and functions within the CNS
Figure I.5: Impaired functions of astrocytes in the diseased brain. Panel (A) is aschematic representation of the impaired functions of astrocytes in the diseased brain. Formore details and references, see section I.2.5. For simplicity, only interactions with neuronsand blood vessels are represented, although other cell types interact with astrocytes such asmicroglia and oligodendrocytes. Astrocytes in the diseased brain are responsible for glutamateexcitoxicity, altered brain homeostasis, impaired synaptic communication and plasticity and cantrigger neuronal death. Note that only adult brain functions are represented in this cartoon butthat impaired astrocytic functions in the developing brain lead to neurodevelopmental
Cette thèse est accessible à l'adresse : http://theses.insa-lyon.fr/publication/2019LYSEI093/these.pdf © [A. Denizot], [2019], INSA Lyon, tous droits réservés

I.2. Physiological functions of astrocytes 41
Figure I.5: Impaired functions of astrocytes in the diseased brain (continued). disordersthat can be lethal [41]. Panel (B) is a figure taken from Soung et al [107] and represents thebeneficial and detrimental effects of reactive astrocytes, which are a hallmark of many braindiseases.
I.2.7 Focus on the tripartite synapse
Electron microscopy has revealed that astrocytic processes can tightly wrapsynapses [27]. At least half of the CNS synapses are indeed ensheathed by an as-trocytic process, also referred to as peripheral astrocytic processe (PAP) [18]. Theproportion of ensheathed synapses varies depending on brain region, from ≈ 90%in layer IV of the somatosensory cortex to 60-90% in the hippocampus and 29-56%in the neocortex [115], and also varies depending on the type of synapse [116, 117].The synaptic surface that is contacted by astrocytes varies from being the wholesynaptic cleft [117] to only a fraction of it [2] (see Fig I.6C). Electron microscopyreveals that PAPs are very thin, ≈ 200 nm in diameter on average, often < 100 nm[29]. 80% of the plasma membrane of an astrocyte belongs to its PAPs, resulting ina high surface/volume ratio of ≈ 25µm−1 [118].
When apposed to synapses, astrocytes can sense neurotransmitters and neu-romodulators released from pre-synaptic neurons: glutamate through metabotropicglutamate receptors (mGluRs) [119], γ-aminobutyric acid (GABA) through GABABreceptors [120], acetylcholine [114, 121] and dopamine [122]. They can also sensepurines released by neurons such as adenosine-triphosphate (ATP) and adenosine[123, 124]. Astrocytes have also been shown to respond to post-synaptic activ-ity [125], including endocannabinoids through cannabinoid CB1 receptors (CB1Rs)[126, 127, 128] and ectopic release of glutamate from glutamatergic fibers in the caseof Bergmann glia in the cerebellum [129]. Those stimuli trigger Ca2+ signals in astro-cyes that can activate the release of molecules, referred to as gliotransmitters, suchas glutamate, D-Serine, ATP, tumor necrosis factor-α (TNFα), brain-derived neu-rotrophic factor (BDNF) or atrial natriuretic peptide (ANP) [130], which can mod-ulate synaptic transmission [111, 112, 113, 114] and vasoconstriction/vasodilatation[88, 89, 90, 131]. Detailed neuron-astrocytes signaling pathways at the tripartitesynapse are presented in Fig I.7. For recent reviews on tripartite synapses and theassociated controversies, see [3, 132, 133, 134, 135, 136].
The morphology of PAPs is highly dynamic and synapse coverage by astro-cytic processes varies within minutes depending on physiological conditions [29] (seeFig I.6A,B). Long term potentiation (LTP) induction in hippocampal slices and sen-
Cette thèse est accessible à l'adresse : http://theses.insa-lyon.fr/publication/2019LYSEI093/these.pdf © [A. Denizot], [2019], INSA Lyon, tous droits réservés

42 I. Astrocyte characteristics and functions within the CNS
Figure I.6: Dynamic remodeling of PAPs. (A) Spontaneous transient extension and pro-trusion of an astrocytic process in the brainstem (arrowhead). (A1), (A2) and (A3) representa stack of 6 images recorded respectively at time 0, 5 and 10 min in the same acutely isolatedbrainstem slice. (B) 3D-reconstruction revealing the transient extension of the PAP pointedby the arrowhead in panel A. Scale bar: 5 µm. (C ) Diverse morphologies of neuron/astrocytecontact sites revealed by 3d reconstructions from two-photon image stacks. Contact sites canensheath dendritic necks (arrowhead in C1; zoom in C4, C5) or contact a small fraction of thedendrite (arrow in C1; zoom in C2, C3). Scale bar in C1: 5 µm. (D) Schematic representa-tion of the variations of synaptic coverage by astrocytes during synaptic plasticity. Increasedsynaptic activity at glutamatergic synapses (D1) is associated with the release of glutamatethat triggers a temporary increase in the motility of PAPs (D2). If this transient motility resultsin a decrease of synaptic coverage, glutamate spillover occurs, activating both structural (D3)and functional (D4) synaptic plasticity. mGluR: metabotropic glutamate receptor. Panels A-Cwere taken from Reichenbach et al [29] and panel D from Dallerac et al [74].
Cette thèse est accessible à l'adresse : http://theses.insa-lyon.fr/publication/2019LYSEI093/these.pdf © [A. Denizot], [2019], INSA Lyon, tous droits réservés

I.2. Physiological functions of astrocytes 43
Figure I.7: Neuron-astrocyte interactions at the tripartite synapse. Representation of thediverse signals that are exchanged between astrocytes and neurons at the tripartite synapses,both excitatory (+, orange) and inhibitory (-, blue). The left panel of the figure presents thedifferent neurotransmitters that can be released by active neurons and that trigger Ca2+ signalsin astrocytes. The right panel presents the gliotransmitters that can be released by astrocytesin response to neuronal activity-induced Ca2+ signals. The corresponding references for eachsignaling molecule is given in parenthesis. The abbreviations correspond to the regions studied:Amy: Amygdala; BrSt: brainstem; CA1: CA1 region of the hippocampus; Ctx: cortex; DG:dentate gyrus; hHip: human hippocampus; Str: Striatum. The * symbol indicates that in thegiven study, Ca2+ signals involved in gliotransmission were local rather than global. This figurewas taken from Guerra-Gomez et al [137].
Cette thèse est accessible à l'adresse : http://theses.insa-lyon.fr/publication/2019LYSEI093/these.pdf © [A. Denizot], [2019], INSA Lyon, tous droits réservés

44 I. Astrocyte characteristics and functions within the CNS
sory stimulation in vivo both result in changes of synapse coverage by PAPs [138].Under stimulation, astrocytic processes retract from the synapse, possibly favoringglutamate and ions clearance from the synaptic cleft [139]. The close associationboth structurally and functionally of astrocytes to pre- and post- synaptic elementspresented in this section is referred to as the tripartite synapse. For more detailson synaptic micro-environment associated with PAPs, see refs [139, 140, 115]. Fora review on the involvement of astrocytes in synaptic plasticity, see Theodesis et al[139].
Cette thèse est accessible à l'adresse : http://theses.insa-lyon.fr/publication/2019LYSEI093/these.pdf © [A. Denizot], [2019], INSA Lyon, tous droits réservés

45
Chapter II
Astrocyte excitability: Ca2+ signals
Astrocytes have recently emerged as essential partners of neurons for informationprocessing in the brain. Chemical or mechanical stimulation of cultured astrocyteshave revealed that astrocyte excitability results from variations of cytosolic Ca2+
concentration [141, 142, 143, 144, 145]. In this chapter, the roles, characteristicsand mechanisms of Ca2+ signals in astrocytes are presented.
II.1 General considerations on Ca2+ signals
II.1.1 Ca2+, ubiquitous intracellular messenger
Ca2+ is an ubiquitous intracellular messenger in eukaryotic cells, playing keyroles in signal transduction for cell growth, apoptosis, differentiation, secretion,metabolism, gene transcription, muscle contraction, fertilization, immunity, learn-ing and memory [146]. Because of their central roles for cellular physiology, Ca2+
signals are altered in a lot of diseases, including cancer [147, 148].Ca2+ signals correspond to variations of cytosolic Ca2+ concentration in response
to stimuli. The encoding of signals depends on the cell and on the stimulus. Forexample, the main mechanism of Ca2+ signals in astrocytes is believed to rely on theopening of type 2 IP3R. After agonists bind to Gq/11-GPCRs, IP3 synthesis is acti-vated and the resulting IP3 molecules, together with Ca2+, activate the opening ofIP3R channels, resulting in an influx of Ca2+ ions in the cytosol (see section II.2.3.2for more details). Ca2+ signals can differ by their amplitude, duration, frequencyand by their propagation range and speed. Those signals rely on the existence ofCa2+ stores and on the activity of Ca2+ channels and pumps that enable the gener-ation of Ca2+ signals as well as the restoration of basal concentrations, respectively.
Cette thèse est accessible à l'adresse : http://theses.insa-lyon.fr/publication/2019LYSEI093/these.pdf © [A. Denizot], [2019], INSA Lyon, tous droits réservés

46 II. Astrocyte excitability: Ca2+ signals
Extracellular space
[Ca2+] ~ 10-3 M
Internal store
[Ca2+] ~ 10-7 M
[Ca2+]
gradient
Ca2+ channels
[Ca2+] ~ 10-3-10-4 M
Ca2+ pumps
ATP
ADP+Pi
ATP
ADP+Pi
Cytosol
Ca2+ sources
Signal12
3
24
4Ca2+ signal
Figure II.1: Principles of Ca2+ signaling. Ca2+ signals correspond to transient increasesin Ca2+ concentration in the cytosol (blue), [Ca2+]cyt. Resting [Ca2+]cyt is ≈ 100 nM while[Ca2+] in Ca2+ sources (orange) (i.e the extracellular space and internal stores: ER, mitochon-dria, lysosomes) is ≈ 0.1-1 mM. The [Ca2+] gradient between the cytosol and Ca2+ sourcesis maintained at steady state, corresponding to equilibriated fluxes in and out of the cytosol.When a signal is sensed by the cell (1), Ca2+ influx to the cytosol is performed by Ca2+ chan-nels (2), which results in a Ca2+ signal (3). Basal [Ca2+] in the cytosol and in stores are thenrestored by the ATP-dependent activity of Ca2+ pumps (4).
The detailed mechanisms are described in Fig II.1. Ca2+ channels and pumps as wellas the proteins responsible for Ca2+ transport (i.e diffusive Ca2+ buffers) stronglyvary depending on cell type or even on subcellular localization, which contributesto the variability of Ca2+ signals [149].
Fig II.2 presents the molecular mechanisms responsible for the contraction ofheart cells, the cardiomyocytes, which are mediated by Ca2+ signals.
For detailed reviews on Ca2+ signals and the molecules involved, see [146, 150].For a detailed review on the roles of Ca2+ signaling throughout the evolutionarytree, see Plattner et al [151].
II.1.2 Experimental methods to investigate Ca2+ signaling
In this section, the main experimental methods that can be used for investigatingCa2+ signaling are presented, mostly focusing on techniques based on electron and
Cette thèse est accessible à l'adresse : http://theses.insa-lyon.fr/publication/2019LYSEI093/these.pdf © [A. Denizot], [2019], INSA Lyon, tous droits réservés

II.1. General considerations on Ca2+ signals 47
Figure II.2: Role of Ca2+ in cardiomyocytes contraction. Schematic representation of themolecular interactions that mediate Ca2+ signals in cardiomyocytes, which are necessary fornormal cardiac contractility, taken from Baskin et al [152]. After an action potential depolarizesthe plasma membrane of cardiomyocytes via a Na+ influx into the cytosol, voltage-gated L-typeCa2+ channels are activated, resulting in an increase of [Ca2+]cyt. This triggers the activationof Ca2+-gated Ryanodine Receptors (RyRs) on the sarcoplasmic reticulum, increasing further[Ca2+]cyt. Ca2+ ions then interact with troponin, which conformational change enables thebinding of myosin to actin, resulting in cellular contraction. Muscle relaxation is regulated byCa2+ pathways that restore the concentration of Ca2+ in both the cytosol and the SR, notablyvia the activity of energy-dependent membranous pumps and Na+/Ca2+ exchangers (NCX).Red and blue arrows refer to up- and down-regulated genes in Med12cKO hearts (see Baskinet al [152] for more details).
fluorescent microscopy.
II.1.2.1 Molecular approaches to trigger Ca2+ signals
The most common tools that are used to trigger Ca2+ signals in astrocytes are de-polarization, mechanical stimuli, photolysis of caged IP3 or Ca2+ and the activationof astrocytic G protein-coupled receptors (GPCRs) by the application of agonists.The Designer receptors exclusively activated by designer drugs (DREADDs) are afamily of engineered GPCRs created by Armbruster et al [153] that can selectivelymodulate signal transduction pathways in vitro and in vivo. Finally, optogenetics
Cette thèse est accessible à l'adresse : http://theses.insa-lyon.fr/publication/2019LYSEI093/these.pdf © [A. Denizot], [2019], INSA Lyon, tous droits réservés

48 II. Astrocyte excitability: Ca2+ signals
[154] allow the investigation of Ca2+ signals with a high control of both spatialand temporal characteristics of the stimulation. For example, photo-activable Ca2+
channels can be used for triggering astrocytic Ca2+ [155] in specific sub-populationsof astrocytes in a given physiological condition. For more details on molecular ap-proaches to investigate Ca2+ signals in astrocytes, see [156, 157].
II.1.2.2 Fluorescent microscopy for monitoring Ca2+ signals
Fluorescing techniques involve the use of fluorescent indicators, I, to track molecules/ionsof interest within the cell. Indicators fluoresce when bound to the molecule of in-terest and the variations of fluorescence with time are measured and normalizedover the basal level of fluorescence (∆F/F0). Importantly, imaging fluorescent Ca2+
indicators does not measure the exact [Ca2+] variations but rather the variationsof [Ca2+-I] so that the signals measured strongly depend on the concentration andkinetics of the indicator.
The available fluorescent indicators for studying Ca2+ signals, which kinetics arepresented in Table II.1, are:
• Ca2+ dyesThe first molecules that have been used to perform Ca2+ imaging were Ca2+
organic dyes such as Fluo4, BAPTA and EGTA. Those dyes are delivered bybulk loading or by dialysis of the cytosol with a patch pipette. They have beenessential for studying astrocytic Ca2+ signals in live tissues, including theirdiscovery, their relationship with neuronal activity [158, 159, 116, 111, 160]and their first recordings in vivo [47]. However, the loading of Ca2+ dyes inastrocytes in brain slices is often problematic and can result in cell death.Moreover, those dyes get diluted out of the cell with time so that they onlyreveal the soma and the major branches [161]. Importantly, a recent study hasalso demonstrated that BAPTA inhibits 30-80% of the activity of theNa+,K+-ATPase and suppresses spontaneous Ca2+ activity in astrocytes [162] so thatits use should be avoided for monitoring Ca2+ signals.
• GECIsIn order to improve the spatial resolution of Ca2+ imaging, Hires et al [163]have engineered some fluorescent proteins, which comprise a single polypeptidechain and a Ca2+-binding motif, called genetically-encoded Ca2+ indicators(GECIs). GECIs can be used in live tissues to monitor Ca2+ dynamics. Twomain types of GECIs have been used to study astrocytes: single-wavelengthsGECIs, as e.g GCaMPs, and FRET-based ratiometric GECIs (for more de-tails see Tian et al [164]). GCaMPs are molecular constructs derived from
Cette thèse est accessible à l'adresse : http://theses.insa-lyon.fr/publication/2019LYSEI093/these.pdf © [A. Denizot], [2019], INSA Lyon, tous droits réservés

II.1. General considerations on Ca2+ signals 49
the fluorescent protein GFP and the Ca2+ buffer calmodulin (Fig II.3A1,A2).GCaMPs have been optimized for brightness, dynamic range, photostabilityand Ca2+ affinity. They display high signal/noise ratio (Fig II.3A4). Theemergence of these tools have improved considerably our understanding ofCa2+ dynamics in astrocytes, notably by revealing the existence of local sig-nals in fine processes (see Fig II.6). GECIs are constantly being improved anddisplay various kinetics and resolutions, which are suited to different biologicalquestions (spatial VS temporal resolution notably). For example, GCaMP6fis more suited to the study of spatially restricted compartments such as mi-crodomains than GCaMP3 [165]. Some GECIs are targeted to plasmalemmal[166] or organellar [167, 168] membranes (-Lck membrane-tethering domain[169], see Fig II.3A3)) or to subcellular compartments such as mitochondriaand the ER (e.g CEPIAS) [170, 171, 172, 173, 174, 175], which enables a higherspatial resolution of Ca2+ signals.GECIs can be targeted to be expressed specifically in astrocytes (Fig II.3B).This targeting further increases signal/noise ratio compared to classical Ca2+
dyes, enabling stable in vivo recordings and resolving the entire cellular ultra-stucture [161]. Note that long-term expression of GECIs may cause astrogliosisand/or decreased health of neurons [176]. For a detailed review on GECIs, seeShigetomi et al [177].
• Biosensors of molecules of the Ca2+ pathwayIn order to refine our understanding of Ca2+ signaling, another strategy con-sists in tracking molecules that belong to the Ca2+ signaling pathway such asGCPRs [178], IP3 [179, 180, 181], PKA [182] or cAMP [183].
• NanobodiesA recent study has developed plasmids that encode nanobodies against fluo-rescent proteins fused to functional modules [184]. Those nanobodies can beused as fluorescent sensors for visualizing Ca2+, H+ and ATP/ADP dynam-ics or can be targeted to the lumen of sub-compartments of interest. Thistoolkit could be useful for investigating Ca2+ fluxes e.g between the ER andmitochondria or at ER-plasma membrane contact sites.
Examples of the use of super-resolution microscopy techniques and electron mi-croscopy for studying astrocytic sub-compartments are presented in Fig II.4. Forfurther reading on the importance of super-resolution microscopy for studying Ca2+
dynamics in astrocytes, see dedicated reviews [158, 140, 4].
Cette thèse est accessible à l'adresse : http://theses.insa-lyon.fr/publication/2019LYSEI093/these.pdf © [A. Denizot], [2019], INSA Lyon, tous droits réservés

50 II. Astrocyte excitability: Ca2+ signals
Figure II.3: Genetically encoded Ca2+ indicators (GECIs). (A) Molecular structure ofGCaMP-like GECIs. GECIs are constructs based on GFP and calmodulin, which encounter aconformational change when binding Ca2+, resulting in fluorescent emissions at 515nm (A1).Panel (A2) represents 2 orthogonal views of the crystal structure of the GECI GCaMP2DRSETin the Ca2+-bound state. The M13 helix is represented in blue, calmodulin in red and cpEGFPin green. Some constructs can diffuse within the cytosol while Lck- variants are anchored tothe plasma membrane (A3). Panel A4 represents the typical modification in emission spectrumof GCaMP-like GECIs when binding Ca2+. (B) Astrocyte-specific expression of GECIs can beinduced by electroporation (1), AAV injection (2) or Knock-in (3). Ca2+ signals can then beinvestigated either in acute brain slices or in vivo. Panels A1, A2, A3 & A4 were taken from[161, 164, 188] and B was adapted from Shigetomi et al [177]
Cette thèse est accessible à l'adresse : http://theses.insa-lyon.fr/publication/2019LYSEI093/these.pdf © [A. Denizot], [2019], INSA Lyon, tous droits réservés

II.1. General considerations on Ca2+ signals 51
Figure II.4: Super-resolution and electron microscopy for better resolving Ca2+ sig-naling at the nanoscale in astrocytes. (A) 3D reconstruction of an astrocyte (blue) fromelectron microscopy shown without (left) and with (right) neighboring dendritic spines (thinin grey, mushroom spines in yellow) containing PSDs (red). (B) STED images displaying as-trocytic processes (green) in CA1 stratum radiatum of hippocampal organotypic slices and theneighboring synaptic structures (red). Arrows point dendritic spines. Top and bottom panelscorrespond respectively to lower and higher (square in top panel) magnification. (C ) dSTORMimaging of GLT-1 from cultured glial cells from rat hippocampus shown at lower (C1) andhigher (C2, yellow squared region in C1) magnification. Panel C3 presents a comparison ofconfocal (top) with dSTORM (bottom) imaging of Bassoon (red), Homer1 (green) and GLT-1(magenta) in CA1 region from thick hippocampal slices. This figure was adapted from Helleret al [4, 140].
Cette thèse est accessible à l'adresse : http://theses.insa-lyon.fr/publication/2019LYSEI093/these.pdf © [A. Denizot], [2019], INSA Lyon, tous droits réservés

52 II. Astrocyte excitability: Ca2+ signals
Table II.1: Kinetics of the major Ca2+ indicators. Note that the 2 components ofkoff for GCaMP7s refer to the fast (61%) and slow (39%) components [185]. The values ofkon and koff for a given indicator vary slightly depending on the study, although the order ofmagnitude is the same (see e.g kinetics of GCaMP6s and GCaMP6f in refs [185, 186]).
Indicator kon(M−1.s−1) koff(s−1) ReferencesFluo4 6 · 108 210 [187]Mag-Fura-2 7.5 · 108 26760 [187]GCaMP3 7.45 · 106 2.57 [186]GCaMP6s 4.3 · 106 0.69 [185]GCaMP6f 9.44 · 106 4.01 [185]jGCaMP7f 1.34 · 107 5.86 [185]jGCaMP7s 2.15 · 107 2.86 & 0.26 [185]jGCaMP7c 3.56 · 106 2.79 [185]jGCaMP7b 1.6 · 107 4.48 [185]
Cette thèse est accessible à l'adresse : http://theses.insa-lyon.fr/publication/2019LYSEI093/these.pdf © [A. Denizot], [2019], INSA Lyon, tous droits réservés

II.2. Astrocytic Ca2+ signals 53
II.2 Astrocytic Ca2+ signals
This section presents the main functional roles and impairments of astrocyticCa2+ signals, their spatiotemporal diversity as well as the main molecular mecha-nisms from which they can emerge.
II.2.1 Functional roles of Ca2+ signals in astrocytes
After the discovery of Ca2+ signals in astrocytes in response to stimuli, a lotof studies have investigated their physiological roles, which are presented in nextparagraphs and summarized in Fig II.5.
II.2.1.1 In the developing CNS
Ca2+ signals in radial glia, precursors of astrocytes, control cell proliferation andneurogenesis [189, 190]. Yang et al [191] have demonstrated that if type 2 inositol1,4,5-triphosphate receptor (IP3R2), which is the Ca2+ channel responsible for themajority of astrocytic signals (see section II.2.2), is not expressed then redundantsynapses are observed in 2-weeks old mice. This suggests an essential role of as-trocytic Ca2+ signals for developmental synapse elimination [191]. Astrocytic Ca2+
signals are also critical for dendritic spine maturation [192, 193]. Altogether, thosedata suggest strong implications of Ca2+ signals in astrocytes and their precursorsfor the development of the central nervous system (CNS).
II.2.1.2 In the adult brain functioning
In this section, the main brain functions that have been associated with Ca2+
signals in astrocytes are presented.
At the cellular levelFor long, astrocytic Ca2+ signals have been considered too slow and to require sus-tained stimulation to impact synaptic communication [194, 195]. The use of super-resolution microscopy [4] and of highly sensitive genetically encoded Ca2+ indicators(GECIs) [5] (see section II.1) has yet revealed the existence of faster Ca2+ events inperipheral synaptic processes (PAPs) in vivo or in slices, with an onset and duration
Cette thèse est accessible à l'adresse : http://theses.insa-lyon.fr/publication/2019LYSEI093/these.pdf © [A. Denizot], [2019], INSA Lyon, tous droits réservés

54 II. Astrocyte excitability: Ca2+ signals
Figure II.5: Functional roles of astrocytic Ca2+ signals. Representation of the mainfunctional roles of Ca2+ signals in astrocytes that have been demonstrated so far. AstrocyticCa2+ signals emerge as essential components of brain function, from cellular functioning toneural networks coupling and behavior. For more details and references, see section II.2.1.
Cette thèse est accessible à l'adresse : http://theses.insa-lyon.fr/publication/2019LYSEI093/these.pdf © [A. Denizot], [2019], INSA Lyon, tous droits réservés

II.2. Astrocytic Ca2+ signals 55
of the same order of magnitude than those of neuronal signals [111, 160, 6, 196] (seeFig II.6). Those signals can trigger the release of gliotransmitters that modulatesynaptic physiology and plasticity (see section I.2.7). Astrocytic Ca2+ signals arealso essential for neurotransmitter uptake by astrocytes [197], modulatingK+ home-ostasis [198], controlling blood vessels diameter [199], the movements of astrocyticprocesses [200, 138, 201], glutamate spillover [202] or even modulate the propagationof action potentials [203]. Ca2+ signals in astrocytes are thus crucial for synapticphysiology and plasticity.
At the neural network levelOne astrocyte can contact thousands of synapses that can project locally and/or tolong distances. As Ca2+ signals can propagate within astrocytic networks throughgap junctions (see section I.1.2), astrocytic Ca2+ signals could be involved in brainfunction at a higher spatial scale: neural networks. Ca2+ signals are indeed associ-ated to and seem necessary for synchronized neuronal firing in slices [204, 205, 206,207, 208] and in vivo [209]. Ca2+ signaling from astrocytes in specific brain regionsthus support local neuronal synchronization states. Further investigation is neededto refine our understanding of those processes.
At the brain levelAstrocytic Ca2+ signals are essential for brain physiology, including cognition, emo-tion, motor and sensory processing. For a review, see Oliveira et al [210].
• CognitionA deficiency in the expression of IP3R2 in astrocytes impairs memory consol-idation during non-theta periods in the hippocampus [211]. This observationis however in contradiction with a previous study that found no impact ofIP3R2 impairment on spatial memory [212]. Another study has also reportedthe necessity of astrocytic exocytosis, which relies on Ca2+, for spatial learningand memory [213]. A recent in vivo study has demonstrated that activatingastrocytes during memory acquisition is enough to improve memory retrieval[214]. Interestingly, transplanting human astrocyte progenitor cells withinmouse brain resulted in an increased performance of the transplanted micein learning and memory tasks [215]. Astrocytic Ca2+ signals thus emerge askey features of memory and learning, although further investigation is neededto resolve the apparent controversies. For a detailed review on the roles ofastrocytes in cognition, see Santello et al [216].
• Sensory processingFast Ca2+ signals have been observed in astrocytes in response to sensorystimulation in vivo [217, 196]. The intracellular localization of those events
Cette thèse est accessible à l'adresse : http://theses.insa-lyon.fr/publication/2019LYSEI093/these.pdf © [A. Denizot], [2019], INSA Lyon, tous droits réservés

56 II. Astrocyte excitability: Ca2+ signals
as well as the molecular pathways involved vary depending on brain region[218, 219]. Two-photon imaging of Ca2+ signals in ferret visual cortex in vivohas demonstrated that astrocytic Ca2+ signals display distinct spatial receptivefields depending on the visual stimuli [220]. IP3R2-dependent astrocytic Ca2+
signals are necessary for somatosensory cortex plasticity in vivo [114] and forthe integration of visual stimuli [221]. Finally, astrocytic Ca2+ signals areresponsible for an enhancement of evoked cortical responses by transcranialdirect current stimulations [222]. Thus, astrocytic Ca2+ signals are associatedwith sensory processing.
• Emotion processingIP3R2-dependent Ca2+ signaling does not seem to be involved in anxiety-related behaviors according to several studies [223, 202, 212]. Results ondepressive-like behaviors are controversial depending on the genetic model[224, 212]. Astrocytic Ca2+ activity however reduces fear expression in fear-conditioning paradigm according to a recent study [225]. Overall, furtherinvestigation with more specific tools, notably that do not only trigger IP3R2-dependent Ca2+ signals, are needed to refine our understanding of the roles ofastrocytic signals in emotion processing.
• Motor processingExploratory behavior does not seem to depend on IP3-dependent astrocyticCa2+ signals [224, 202, 212], although the activation of astrocytic GPCRs sug-gests a role of Ca2+ signaling in motor coordination in an IP3R2-independentmanner [226]. Tran et al [227] have demonstrated that the amplitude of Ca2+
signals in cortical astrocytes endfeet during neurovascular coupling is potenti-ated by the movement of the mouse. Finally, striatal microcircuits are alteredin vivo in response to reduced Ca2+ signals in astrocytes, causing obsessive-compulsive-like behavior in mice (excessive self-grooming) [228]. Taken to-gether, those results demonstrate an important role of astrocytic Ca2+ signalsin motor circuits, although the detailed mechanisms require further investiga-tion.
To conclude, astrocytic Ca2+ signals are essential for brain physiology, althoughthe detailed mechanisms often remain controversial, probably because of the differ-ent techniques used. For example, studies with IP3R2−/− mice are compared withstudies using IP3 sponge, which inhibits all IP3-mediated Ca2+ signals, not to men-tion that most studies ignore IP3R2-independent Ca2+ signals in astrocytes. Morespecific tools are needed to better investigate the involvement of astrocytic Ca2+
activity in brain physiology.
Cette thèse est accessible à l'adresse : http://theses.insa-lyon.fr/publication/2019LYSEI093/these.pdf © [A. Denizot], [2019], INSA Lyon, tous droits réservés

II.2. Astrocytic Ca2+ signals 57
II.2.1.3 In the diseased brain
As a result of their roles in brain physiology, astrocytic Ca2+ signals are im-paired in numerous brain injuries and diseases. Astrocytic Ca2+ signals are im-paired in brain disorders such as neurodegenerative diseases including Alzheimer’sdisease (AD) [229, 230, 231, 232, 91, 233] and Parkinson’s disease [234], epilepsy[235, 91, 236], schizophrenia [237], hyperactivity, attention deficit, and related psy-chiatric disorders [238], brain tumours [91], major depressive disorders [91], autism[239], Down syndrome [91, 93] and psychiatric disorders [240]. Aberrant Ca2+ sig-nals have also been reported in reactive astrocytes, which are a hallmark of manybrain diseases [241]. For reviews on the involvement of astrocytic Ca2+ signaling inCNS pathology, see [242, 105, 232, 91].
Alexander’s disease (AxD) is directly associated with a deficiency in astrocytes.It is triggered by a mutation in the astrocytic intermediate filament GFAP. Itssymptoms are diverse, from delays in mental and physical development, myelina-tion deficits, focal lesions, macrocephaly and seizures. Interestingly, only specificbrain regions are vulnerable to the effect of this mutation although GFAP is widelyexpressed throughout the CNS in astrocytes [243]. A recent study has generatediPSCs from 2 AxD patients and demonstrated that astrocytes displayed abnormalorganellar morphology and distribution coupled with impaired Ca2+ wave propa-gation, while correcting the GFAP mutation restored functional phenotype [244].Further investigation is needed to understand the causal relationship between im-paired organelle localization, astrocytic Ca2+ signaling and AxD. This discoveryhowever highlights the importance of subcellular spatial distributions of organellesfor functional Ca2+ signaling.
II.2.2 Characteristics of astrocytic Ca2+ signals
The first Ca2+ signals in astrocytic networks (see section I.1.2) have been ob-served in cell culture and consisted in a wave propagating at a velocity of ≈ 20µm.s−1
[110, 245]. Few years later, Ca2+ waves have been observed in situ in the retina [246]and in the corpus callosum [247] and more recently observed in vivo in response tolocomotion and startle [6, 248, 249]. Ca2+ waves can propagate in astrocytic net-works over long distances (300 − 400µm). They propagate either by the cellularrelease of ATP and the activation of purinergic receptors [250, 251, 252] or directlythrough gap junctions [253]. A representative recording of an astrocytic Ca2+ wavemeasured with two-photon microscopy is presented in Fig II.6A.
Cette thèse est accessible à l'adresse : http://theses.insa-lyon.fr/publication/2019LYSEI093/these.pdf © [A. Denizot], [2019], INSA Lyon, tous droits réservés

58 II. Astrocyte excitability: Ca2+ signals
The use of super-resolution microscopy [4] and of genetically encoded Ca2+ indi-cators (GECIs) [5] has revealed a striking spatiotemporal diversity of Ca2+ signals inastrocytes, notably demonstrating striking differences between signals in the somaand in the peripheral astrocytic processes (PAPs) [6] (see Fig II.6B). Ca2+ signalsin PAPs are indeed highly localized, uncorrelated, characterized by faster kineticsand an order of magnitude smaller amplitude (∆F/F0) compared to somatic signals.Most Ca2+ signals detected both in vitro and in vivo occur in processes [7].
As depicted in the schematic in Fig II.7, the different spatial patterns of astro-cytic Ca2+ signals consist of:
• Spatially-restricted Ca2+ signals in microdomains (Fig II.7A) in thin processes.They are extremely diverse and can correspond to fast events that can be TTX-sensitive (neuronal activity-induced) [254, 111] or spontaneous [255, 197, 254,248, 160]. The longer lasting events (≈ 70s) are referred as Ca2+ twinkles[218].
• Endfeet-localized Ca2+ signals (Fig II.7B), that are mediated by IP3R2 andplasmalemmal Transient receptor potential cation channel subfamily V mem-ber 4 (TRPV4) [256, 257].
• Local Ca2+ waves that propagate in larger processes, which sporadically prop-agate bidirectionally to and from the soma (Fig II.7C) [254, 7]. Local Ca2+
waves could also emerge from Ca2+ propagation across the intracellular net-work of processes via gap junction coupling (Fig. II.7D) [52]. Although ≈ 25%of gap junctions have been reported to connect processes from the same cell[52], intracellular network propagation has not been characterized yet.
• Global Ca2+ signals (Fig II.7E), which are IP3R2-dependent and propagatewithin the whole astrocyte .
• Intercellular Ca2+ waves (Fig II.7F) that propagate throughout astrocytic net-works.
Taken together, the spatiotemporal diversity of astrocyte Ca2+ signals concerns theirspatial extent (from localized microdomains to intercellular Ca2+ waves), their time-scales (from ms to tens of seconds).
Cette thèse est accessible à l'adresse : http://theses.insa-lyon.fr/publication/2019LYSEI093/these.pdf © [A. Denizot], [2019], INSA Lyon, tous droits réservés

II.2. Astrocytic Ca2+ signals 59
Figure II.6: Spatiotemporal diversity of Ca2+ signals in WT and IP3R2−/− astrocytes.(A) Two-photon imaging reveals that Ca2+ activity propagates from one astrocyte to anothervia gap junctions. The blue and red arrowheads correspond respectively to cells from whichthe wave comes and cells to which the wave is propagating. Taken from Kuga et al [46]. (B)This panel, taken from Srinivasan et al [6], illustrates the diversity of Ca2+ signals (amplitude,frequency, duration) in WT astrocytes depending on sub-cellular localization (soma in green,waves in red and microdomains in yellow). The blue line illustrates the approximate territoryof the astrocyte.
Cette thèse est accessible à l'adresse : http://theses.insa-lyon.fr/publication/2019LYSEI093/these.pdf © [A. Denizot], [2019], INSA Lyon, tous droits réservés

60 II. Astrocyte excitability: Ca2+ signals
Figure II.7: Spatial diversity of Ca2+ signals in astrocytes. Ca2+ signals in astrocytesdisplay various spatiotemporal forms. Some signals can be localized at the vicinity of synapses(A), either spontaneous or induced by neuronal activity, in endfeet (B) or they can propagatevia regionalized (C), intracellular (D), global (E) or intercellular (F) Ca2+ waves. Note that thepropagation of intra- and inter-cellular Ca2+ waves occurs via gap junction coupling, althoughintracellular propagation through gap junctions has not been reported yet.
II.2.3 Mechanisms of Ca2+ signals in astrocytes
In the next paragraphs, the main molecules that are involved in Ca2+ signalingin astrocytes are described, with a particular emphasis on the IP3R pathway and onthe kinetics of IP3R channels.
Cette thèse est accessible à l'adresse : http://theses.insa-lyon.fr/publication/2019LYSEI093/these.pdf © [A. Denizot], [2019], INSA Lyon, tous droits réservés

II.2. Astrocytic Ca2+ signals 61
II.2.3.1 Ca2+ signaling molecules in astrocytes
Spatial and temporal dynamics of Ca2+ signals in astrocytes emerge from dif-ferent processes involving cytosolic uptake and release to either extracellular spaceor intracellular Ca2+ stores, as well as Ca2+ buffering and diffusion (see Fig II.1).Several channels, pumps and transporters of Ca2+ are expressed in astrocytes, thatare presented in Fig II.8. Their contribution to Ca2+ signals is not clear and mightdepend on intracellular localization (e.g soma, endfeet or processes) or on brain re-gion. For reviews on the different mechanisms of Ca2+ signals in astrocytes, see[177, 258, 259, 3]
II.2.3.2 The IP3R pathway
Ca2+ signals in astrocytes are considered to rely mainly on the IP3R Ca2+ channelpathway. Indeed, type-2 IP3R (IP3R2) Ca2+ channel is enriched in astrocytes [42]and knocking-out IP3R2 channels abolishes all Ca2+ signals in astrocytic soma andabout half of those in processes [6]. The molecular origin of the IP3R2-independentsignals in processes remains a matter of debate and could involve Ca2+ fluxes throughthe plasma membrane [6] and/or other IP3R channel subtypes [260] and/or otherintracellular stores [177] (see also Fig II.8). In the next paragraphs, the IP3R path-way is presented as well as the structure, kinetics and molecular interactions of IP3Rchannels. For reviews on the controversies associated with IP3R-dependent signalsin astrocytes, see [3, 135, 136].
Pathway descriptionThe binding of agonists to Gq/11-GPCRs activates IP3 synthesis via the cleavage
of the membranous phosphatidylinositol bisphosphate (PIP2) by phospholipase C.IP3 molecules then diffuse and the binding of both IP3 molecules and Ca2+ ions toIP3R channels on the membrane of the endoplasmic reticulum (ER) triggers a Ca2+
influx from the ER to the cytosol [261, 262]. [Ca2+] gradient between the ER andthe cytosol is maintained by energy-dependent sarcoplasmic/endoplasmic reticulumCa2+-ATPase (SERCA) pumps (see also Fig II.8).
Parker et al [263] have demonstrated that photolysis of caged IP3 in Xenopusoocytes triggered Ca2+ release from the ER while simultaneous injection of Ca2+
inhibited Ca2+ release, demonstrating a bell-curve relationship between the proba-bility of IP3R opening and [Ca2+]. The initiation and propagation of IP3R-dependentCa2+ signals then relies on Ca2+-induced-Ca2+ release (CICR) mechanism: an in-crease, even small, of the local [Ca2+] increases the probability of IP3R opening
Cette thèse est accessible à l'adresse : http://theses.insa-lyon.fr/publication/2019LYSEI093/these.pdf © [A. Denizot], [2019], INSA Lyon, tous droits réservés

62 II. Astrocyte excitability: Ca2+ signals
TRPM2
TRPML
P2X4
Ca2+
Ca2+
Ca2+
2mM
150nM
200nM
0.8mM
0.5mM
CBP
SOCE
Figure II.8: Schematic representation of the main molecules involved in Ca2+ signalingexpressed in astrocytes. This schematic presents the main channels, pumps and Ca2+ bindingproteins (CBP) responsible for the variations of Ca2+ concentration in the cytosol of astrocytes.Note that specific sub-cellular distributions, such as molecular co-localizations, can increase theefficiency of those mechanisms. A widely spread mechanism is the store-operated Ca2+ entry(SOCE) process. During Ca2+ flux from the ER to the cytosol, stromal interaction molecules(STIM) translocate to the plasma membrane at ER/plasma membrane contact sites, wherethey interact with ORAI channels, which induces Ca2+ influx from the extracellular spaceand then into the ER. GPCR: G-protein coupled receptor, IP3R: inositol 1,4,5-triphosphatereceptor, MCU: mitochondrial uniporter complex, NCLX: mitochondrial Na+, Ca2+ exchanger,NCX:Na+, Ca2+ exchanger, PLC: phosopholipase C, PMCA: plasma membrane Ca2+-ATPase,RyR: ryanodine receptor, SERCA: Sarcoplasmic/endoplasmic reticulum Ca2+ -ATPase, SPCA:secretory pathway Ca2+/Mn2+-ATPase, TPC: two-pore channel, TRP: transient potentialchannels, VGCC: voltage-gated Ca2+ channels. Concentrations in the main Ca2+ reservoirsand in the cytosol are indicated in bold red. This figure was modified from Maklad et al [148],according to Shigetomi et al [177].
Cette thèse est accessible à l'adresse : http://theses.insa-lyon.fr/publication/2019LYSEI093/these.pdf © [A. Denizot], [2019], INSA Lyon, tous droits réservés

II.2. Astrocytic Ca2+ signals 63
(Fig II.9A), which increases local [Ca2+].
Forms of Ca2+ signalsCa2+ signals can be of diverse forms, as illustrated by Fig II.9B, being often
divided in 3 different types: blips, puffs and waves. Blips correspond to signals oflow amplitude and duration and are associated with the activity of single IP3Rs.Blips are representative of the stochastic binding of Ca2+ and IP3 to IP3R channels.The [Ca2+] at the mouth of an open IP3R can reach ≈ 10 µM. Puffs correspondto signals of higher amplitude, which can emerge from the simultaneous opening ofseveral IP3R channels. Non-uniform spatial distributions of the channels into clus-ters, i.e arrangements of several channels close together can favor this process. Suchspatial arrangements of IP3R channels into clusters have been reported in SH-SY5Yand COS7 cells [264, 265]. Finally, Ca2+ waves and global events (spikes) rely on thepropagation of Ca2+ puffs from a cluster to neighboring clusters via Ca2+-inducedCa2+ release (CICR). The spatial organization of IP3R channels thus dictates thespatial spread of CICR and the resulting variability of Ca2+ signals: from blips andpuffs to waves and whole-cell signals.
IP3R ultrastructure and kineticsIP3R is a ubiquitous 25 nm-long Ca2+ channel consisting in tetramers of 3 dif-
ferent isoforms in Vertebrates: IP3R1, 2 or 3, with 60-80% homology in their aminoacid sequences [269]. IP3R can be composed of either homo- or hetero-tetramers[270]. IP3Rs are involved in cell signaling of various cell types and are impaired inmany diseases (see Seo et al [271] for a review). IP3R channels have been first char-acterized in mice in 1989 [272] and their detailed structure with a 4.7 Å resolutionhas been uncovered in 2015 [273]. The detailed ultrastructure of IP3Rs, includingIP3 binding sites, is presented in Fig II.10A. Note that Ca2+ binding sites as wellas the precise conformational changes associated to Ca2+ binding are still not clearso that current models are based on experimental measurements of IP3R kineticsrather than on structural data. For more details on the ultrastructure of IP3Rs, seeSerysheva et al [274].
Most studies on IP3R kinetics are based on IP3R1 isoform. A recent study hasdemonstrated that all of the 4 subunits must be bound to IP3 to trigger IP3R open-ing, independent of [Ca2+] or [ATP] [275]. Recent patch clamp measurements fromsingle IP3R channels (Fig II.10C) have refined our understanding of IP3R function-ing by revealing their modal gating kinetics [276]. In the study from Ionescu et al,IP3R channels can be in 3 distinct modes, characterized by different IP3R open-ing probabilities, from low to high. Channels stay in each mode for long periodsof time (tens of opening/closing sequences). [Ca2+] and [IP3] do not influence the
Cette thèse est accessible à l'adresse : http://theses.insa-lyon.fr/publication/2019LYSEI093/these.pdf © [A. Denizot], [2019], INSA Lyon, tous droits réservés

64 II. Astrocyte excitability: Ca2+ signals
A1
B
A2
Figure II.9: IP3-dependent Ca2+-induced Ca2+ release mechanism. (A) Probability ofIP3R opening P0 as a function of [Ca2+]. Plots display the variability of P0 depending on[IP3] and on the IP3R subtype: IP3R1 (A1) or IP3R2 (A2). Experimental data (symbols)were measured with on-nucleus patch clamp in DT40-3KO cells [266]. The smooth curvescorrespond to biphasic curves, commonly referred to as ’bell curves’. (B) Representation of thediversity of IP3-induced Ca2+ signals. The right column presents the equivalent Ca2+ signals,here corresponding to stochastic simulations. Bottom: signals of low amplitude and duration,called "blips", associated with the activity of single IP3R channels. Middle: IP3R-mediatedsignals of higher amplitude, referred to as "puffs", which emerge from the simultaneous openingof several IP3R channels. Top: at a higher spatial level, Ca2+ waves and global events (spikes)can be observed. They rely on the propagation of Ca2+ puffs from a cluster to neighboringclusters via Ca2+-induced Ca2+ release (CICR). For more details on blips, puffs and waves, seededicated paragraph in section II.2.3.2. Panel A was taken from Dupont et al [267] and B fromThurley et al [268].
Cette thèse est accessible à l'adresse : http://theses.insa-lyon.fr/publication/2019LYSEI093/these.pdf © [A. Denizot], [2019], INSA Lyon, tous droits réservés

II.2. Astrocytic Ca2+ signals 65
opening probability within each mode but rather the probability of the channel totransition between modes. Those observations have changed the paradigms of IP3Rmodels (see section III.2), so that the major mechanism for regulating IP3R activityin newly developed models occurs through modal switches of IP3R states.
IP3R channels can interact with various molecules that can modulate their ki-netics and activity. Those molecules include IP3 [275], Phosphatidylinositol 4,5-bisphosphate (PIP2) [277], phosphatases and kinases [278, 279], Adenosine triphos-phate (ATP) [266], cyclic adenosine monophosphate (cAMP) [278], calmodulin [280,278, 281], Homer [282] and BCl-2 [283] (see also Fig II.10B). See dedicated reviewsfor more details on the modulation of IP3R activity and kinetics [284, 269].
Cette thèse est accessible à l'adresse : http://theses.insa-lyon.fr/publication/2019LYSEI093/these.pdf © [A. Denizot], [2019], INSA Lyon, tous droits réservés

66 II. Astrocyte excitability: Ca2+ signals
Ca2+
A1
C
A2
A3 A4
B
1
2
3
Figure II.10: Structure and kinetics of the IP3R channel. Panel (A) represents thestructure of the IP3R. (A1) Key domains of one subunit of IP3R. When IP3 binds α andβ domains of the IP3-binding domain (IBC), a conformational change occurs, consisting ina movement of both α and suppressor domains (SD). (A2) View from the cytosol of theIP3R, revealing 4 subunits and their contact sites. Red region corresponds to the C-terminiof the 4 subunits, blue to the N-termini, yellow box represents the C- and N- termini of asingle subunit and yellow circles to IP3 binding sites. (A3) View across the ER membrane ofIP3R structure (2 subunits visible). (A4) Possible mechanism for inter-subunit interactions.When IP3 binds the IBC, it can induce a conformational change of the C-terminal domain(CTD) from the neighboring subunit, which lines the S6 region (red arrow), which causeshydrophobic constriction that maintains the Ca2+ pore closed. IP3 binding thus contributes toconformational changes in S6 region of the neighboring subunit, enabling the opening of thepore and Ca2+ flux from the ER to the cytosol. (B) Visualization of the various molecules thatcan interact with IP3R channels and the corresponding binding sites. Ca2+ pore is schematizedby a red dashed arrow. (C) Current traces from single IP3R recordings from Ionescu et al [276],illustrating modal gating of IP3R. In those recordings, [IP3]= 10 µM (saturating) and [Ca2+]= 100 nM (1), 1 µM (2) & 89 µM (3). Horizontal arrows on the left indicate the backgroundcurrents of closed channels. Arrowheads in B and C indicate transitions corresponding tomodified gating behavior of the IP3R. Panel A was taken from Taylor et al [285], B fromSerysheva et al [286] and C from Ionescu et al [276].
Cette thèse est accessible à l'adresse : http://theses.insa-lyon.fr/publication/2019LYSEI093/these.pdf © [A. Denizot], [2019], INSA Lyon, tous droits réservés

67
Chapter III
Modeling astrocytic Ca2+ signals
A computational model corresponds to a simplification that describes relevantparameters of a system of interest (its elements, their states and their interactions),allowing for better understanding, quantification and visualization of the system.Modeling is particularly useful to conduct experiments that are time-consuming oreven unfeasible experimentally and can be predictive and informative about the sys-tem’s behavior. For a model to be predictive, it first needs to be validated againstexperimental data. Molecular reaction kinetics can be simulated with 4 main differ-ent strategies, depending on whether they account for the stochasticity arising fromdiscrete molecules and whether they include spatial information.
In this chapter, after presenting the different methods available for simulatingthe kinetics of molecular reactions, the main generic (i.e not cell type-specific) andastrocytic Ca2+ signaling models will be presented. Only IP3-mediated Ca2+ signal-ing models will be described. For information about models of other Ca2+ signalingpathways, the reader can refer to [287, 288, 289].
III.1 Deterministic well-mixed models
At the beginning of the XXth century, Michaelis and Menten have described en-zymatic reactions with differential equations, which has been one of the first stepstowards using modeling as a complementary approach to experimental studies. Mod-eling chemical reactions with ordinary differential equations (ODEs) has been his-torically the first modeling approach for biological systems and has contributed to abetter understanding of molecular pathways, including Ca2+ signaling. Those mod-els are both deterministic, i.e the average behavior of populations of molecules ismonitored, and well-mixed, i.e space is considered homogeneous and molecules areassumed to be equally distributed within the system so that spatial effects such as
Cette thèse est accessible à l'adresse : http://theses.insa-lyon.fr/publication/2019LYSEI093/these.pdf © [A. Denizot], [2019], INSA Lyon, tous droits réservés

68 III. Modeling astrocytic Ca2+ signals
geometry and diffusion are ignored.In this section, the methods and computational approaches for deterministic well-
mixed models will be introduced before presenting examples of their implementationfor simulating Ca2+ dynamics.
III.1.1 Methods and computational approaches
Biological processes often display noise. Extrinsic noise corresponds to fluctu-ations in cellular environment, including temperature, pH, local concentrations aswell as cell-to-cell variability [290]. Intrinsic noise (=molecular noise) [291] is ex-pected to vary as 1√
Xwhere X is the number of molecules in the system [292] and
thus arises from low number of molecules but also from the intrinsic stochastic na-ture of biochemical reactions [292]. If X is high enough, noise can be averaged anddeterministic approximation is valid. If the number of molecules decreases, stochas-ticity must be taken into account, which is the focus of section III.2.
At any time point, the system is described by a vector containing the concen-tration of each reactant. The velocity of each reaction assumes mass action kinetics(see Eq III.1) or is based on an enzymatic kinetic law like Michaelis-Menten or Hillkinetics [293] and is specified using a rate equation. Mathematical description ofthose rates is done through the use of ordinary differential equations (ODEs), calledreaction-rate equations, that can be solved analytically or numerically with an ODEsolver [294] (see Eq III.4 for examples of rate equations describing IP3R-dependentCa2+ dynamics). ODEs coupled with initial concentrations of all molecular speciesare enough to predict their concentrations at any time point. Numerical methodsfor solving ODEs are presented in e.g Butcher et al [294].
A simple example to illustrate the principle of ODEs is to consider the bi-molecular reaction in which substrates S1 and S2 react to form S3 and S4:
S1+S2
kf
�kb
S3+S4, where kf is the forward binding rate constant and kb the backward
unbinding rate constant. Then the variation of the concentration of the species S3
with time can be described by the following deterministic formulation:
d[S3]
dt= kf [S1][S2]− kb[S3][S4] (III.1)
Systems of differential equations are often studied two variables at a time withphase plane diagrams, which can help predict the dynamics of the system understudy. The nullclines (curves where each derivative is zero) and the values of the
Cette thèse est accessible à l'adresse : http://theses.insa-lyon.fr/publication/2019LYSEI093/these.pdf © [A. Denizot], [2019], INSA Lyon, tous droits réservés
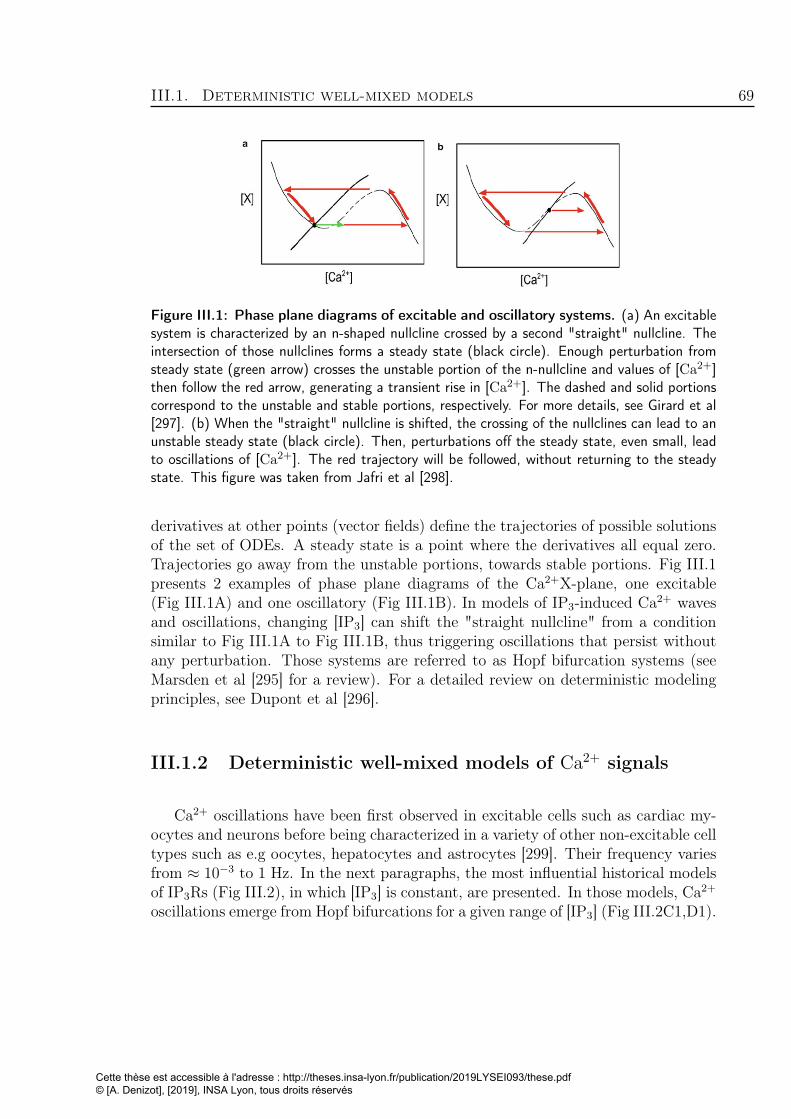
III.1. Deterministic well-mixed models 69
Figure III.1: Phase plane diagrams of excitable and oscillatory systems. (a) An excitablesystem is characterized by an n-shaped nullcline crossed by a second "straight" nullcline. Theintersection of those nullclines forms a steady state (black circle). Enough perturbation fromsteady state (green arrow) crosses the unstable portion of the n-nullcline and values of [Ca2+]then follow the red arrow, generating a transient rise in [Ca2+]. The dashed and solid portionscorrespond to the unstable and stable portions, respectively. For more details, see Girard et al[297]. (b) When the "straight" nullcline is shifted, the crossing of the nullclines can lead to anunstable steady state (black circle). Then, perturbations off the steady state, even small, leadto oscillations of [Ca2+]. The red trajectory will be followed, without returning to the steadystate. This figure was taken from Jafri et al [298].
derivatives at other points (vector fields) define the trajectories of possible solutionsof the set of ODEs. A steady state is a point where the derivatives all equal zero.Trajectories go away from the unstable portions, towards stable portions. Fig III.1presents 2 examples of phase plane diagrams of the Ca2+X-plane, one excitable(Fig III.1A) and one oscillatory (Fig III.1B). In models of IP3-induced Ca2+ wavesand oscillations, changing [IP3] can shift the "straight nullcline" from a conditionsimilar to Fig III.1A to Fig III.1B, thus triggering oscillations that persist withoutany perturbation. Those systems are referred to as Hopf bifurcation systems (seeMarsden et al [295] for a review). For a detailed review on deterministic modelingprinciples, see Dupont et al [296].
III.1.2 Deterministic well-mixed models of Ca2+ signals
Ca2+ oscillations have been first observed in excitable cells such as cardiac my-ocytes and neurons before being characterized in a variety of other non-excitable celltypes such as e.g oocytes, hepatocytes and astrocytes [299]. Their frequency variesfrom ≈ 10−3 to 1 Hz. In the next paragraphs, the most influential historical modelsof IP3Rs (Fig III.2), in which [IP3] is constant, are presented. In those models, Ca2+
oscillations emerge from Hopf bifurcations for a given range of [IP3] (Fig III.2C1,D1).
Cette thèse est accessible à l'adresse : http://theses.insa-lyon.fr/publication/2019LYSEI093/these.pdf © [A. Denizot], [2019], INSA Lyon, tous droits réservés

70 III. Modeling astrocytic Ca2+ signals
One of the first models of Ca2+ oscillations has been developed by Meyer &Stryer [305]. They hypothesized that oscillations resulted from Ca2+-dependent IP3
production by PLCδ and successfully reproduced Ca2+ oscillations, coupled withIP3 oscillations, which have been proven not to exist in several cell types.
The model from Goldbeter, Dupont & Berridge consisted in two Ca2+ cellularpools: one that was IP3-sensitive and one that was Ca2+-sensitive (Fig III.2A1).Ca2+ released from the IP3-sensitive pool activates CICR from the Ca2+-sensitivepool. As experimental work suggested that IP3-sensitive and Ca2+-sensitive poolsconsisted in a unique pool, the ER, Dupont et al [301] have developed a one-poolversion of this model, presented in Fig III.2A2,A3. This model has been furtherrefined in subsequent studies [306, 307]. Those models have been very influential inthe early 1990s but binding models, that take into account conformational states ofIP3R channels, have been preferred in future IP3R models. The 2 most influentialhistorical binding models of IP3R are the De Young & Keizer model [8] and theLi-Rinzel model [302].
The bell-shaped relationship of the open probability of IP3R (P0) with [Ca2+][263, 308] (Fig II.9) can be interpreted as a consequence of a slower inactivation ofIP3R by Ca2+ than its activation. This can be modeled simply by the existence ofactivating and inactivating Ca2+ binding sites, the latter displaying a smaller affin-ity for Ca2+. The first binding model of IP3R that took into account those differentkinetics of IP3R was the model by De Young & Keizer (DYK) [8]. The parametervalues of the model were fitted on IP3R open probability data [308] and IP3 bindingdata [309]. Because 4 different conductances were observed for a single IP3R andthat the most commonly open one was 3rd highest conductance [310], DYK assumedthat IP3R opened when 3 subunits were open.
In their model, each IP3R subunit contains 3 binding sites: two activating sites,for Ca2+ and IP3, and one inactivating site for Ca2+. ijk is the state of an IP3Rsubunit, where i, j & k correspond respectively to Ca2+-activating, IP3 and Ca2+-inactivating sites. Each site can be in two states: 1 = bound or 0 = unbound,so that each subunit has 23 possible states which are depicted, along with theirtransition rates, in Fig III.2B2. For example, 110 represents an IP3R subunit withCa2+-activating and IP3 sites bound and Ca2+-inhibiting site unbound. Open prob-ability PO of a single IP3R is thus PO = x3
110, where x110 corresponds to the fractionof IP3R subunits in state 110. The model was then simplified by considering thatIP3 binding is fast compared to the others, thus leaving 4 equations to describe thesystem: one for Ca2+ and 22-1 for IP3R subunits (as
∑ijk xijk = 1), with xijk the
fraction of subunits in state ijk). Ca2+ dynamics in the DYK model is characterizedby 2 Hopf bifurcations (Fig III.2C1). If [IP3] (fixed in the DYK model) is chosen
Cette thèse est accessible à l'adresse : http://theses.insa-lyon.fr/publication/2019LYSEI093/these.pdf © [A. Denizot], [2019], INSA Lyon, tous droits réservés

III.1. Deterministic well-mixed models 71
B1 B2
C1 D1
C2 D2
100
000
110
010
101
001
111
011
IP3- & Ca2+-sensitive pool
Receptor
Signal
+
Ca2+IP3
IP3-sensitive pool
Receptor
Signal
+
Ca2+
IP3
Ca2+-sensitive pool
A1 A2
A3
3-binding site IP3R
i kj
Ca activ. Ca inhib.IP3
100
000
110
010
001
111
011CaCa
IP3
IP3
Ca
IP3
CaCa
Ca
Ca
Ca
IP3
101
Figure III.2: Historical, deterministic well-mixed, models of IP3R channels. This figurepresents the historical models of Ca2+ dynamics from Golbeter-Dupont-Berridge [300, 301](A), De Young-Keizer [8] (B, C) and Li-Rinzel [302] (B, D). (A1) Schematic representation ofthe two-pools model from Goldbeter-Dupont-Berridge. (A2) Schematic representation of theone-pool model from Dupont et al [301]. (A3) Typical oscillations from the one-pool modelbased on CICR. (A3) Ca2+ oscillations from the one-pool model are presented for I=0.53 muM.(B1) Schematic representation of the kinetic scheme from the De Young-Keizer (DYK) andLi-Rinzel models.
Cette thèse est accessible à l'adresse : http://theses.insa-lyon.fr/publication/2019LYSEI093/these.pdf © [A. Denizot], [2019], INSA Lyon, tous droits réservés

72 III. Modeling astrocytic Ca2+ signals
Figure III.2: Historical, deterministic well-mixed, models of IP3R channels (continued).(B2) Schematic representation of the 8 possible states of an IP3R subunit in the DYK andLi-Rinzel models. The corresponding bifurcation diagram and examples of oscillations fromDYK model are presented respectively in panels C1 and C2. (D1) Bifurcation diagram of theLi-Rinzel model. Ca2+ oscillations arise from Hopf bifurcation at [IP3]=0.355 µM and stopat supercritical Hopf bifurcation at [IP3]=0.637 µM. Between those bifurcation points, theamplitude of the oscillations increases with [IP3] while their period remains almost constant(D2). Stable and unstable oscillations are represented with filled and open circles respectively,at their maximum and minimum values. Panel A3 was taken from Dupont et al [301], B1, D1& D2 from De Pitta et al [303], C1 from DYK [8] and C2 from Timofeeva et al [304].
between those 2 points, then cellular Ca2+ oscillates (Fig III.2C2).Several studies have developed alternative versions of the DYK model, that mod-
eled sequential binding of Ca2+ and IP3 [311], conformational transitions [312, 313]or implemented saturated effects at high [Ca2+] [314, 315]. See Shuai et al for areview [316]. The DYK model is still influential, even though it is not in accordancewith recent data such as the necessity of 4 IP3 to be bound for the channel to openor the modal switching of the receptors (see Fig III.4).
Li & Rinzel have proposed a simplified version of the DYK model by taking intoaccount that binding of activating IP3 and Ca2+ is much faster than inactivatingCa2+ [302]. They simplified those 2 dynamics in their model so that it consists in 2equations, describing the evolution of [Ca2+] (C) and of the probability h that IP3Ris unbound to inactivating Ca2+. The open probability of IP3R can be expressed asfollows:
PO = x3110 = (m∞h)3 (III.2)
where h = x000 + x010 + x100 + x110. m∞ and dhdt
can be expressed as follows:
m∞ =[I]
[I + d1]
C
C + d5
dh
dt=h∞ − hτh
(III.3)
where C, I correspond to [Ca2+] and [IP3], respectively, and di = biai
are derived fromDYK model.
Similarly to DYK model, [IP3] is not a variable but a parameter of the model.Ca2+ oscillations occur only for intermediate values of [IP3] (I) (≈ 0.3µM < I <0.65µM), associated with Hopf bifurcations (Fig III.2D1,D2). Increased [IP3] isassociated with increased amplitudes of Ca2+ oscillations. Despite its simplifications,
Cette thèse est accessible à l'adresse : http://theses.insa-lyon.fr/publication/2019LYSEI093/these.pdf © [A. Denizot], [2019], INSA Lyon, tous droits réservés

III.1. Deterministic well-mixed models 73
this model displays a similar behavior than that of the DYK model, notably the bell-shaped relationship between PO and [Ca2+], and has thus been widely used in thefield.
The Li-Rinzel model has been adapted to account for variations of the total[Ca2+] = [Ca2+]cyt + [Ca2+]ER [317, 318, 319].
For detailed reviews on deterministic well-mixed models of Ca2+ oscillations, see[320, 321].
III.1.3 Deterministic well-mixed models of astrocytic Ca2+
signals
Diverse models have used deterministic well-mixed approaches to model Ca2+
signals in astrocytes, being in their soma [322, 323, 324], whole-cell intracellularsignals[325], their encoding [303], inter-astrocyte signals [326, 327, 328], astrocyte-neuron signals [329, 330] or astrocyte-blood vessels signals [331].
Ca2+ oscillations in astrocytes can occur in response to extracellular signals re-leased from neighboring neurons that trigger intracellular IP3 signals. Therefore,models of astrocytic excitability have adapted the historical IP3R models in orderto take into account the variations of [IP3] associated with GPCR activation. Thetypical kinetic scheme of those models is presented in Fig III.3A and its mathemat-ical formulation is as follows (parameters are defined in Fig III.3):
d[Ca2+]cyt
dt= JIP3R + Jleak − JSERCA + Jin − Jout
d[Ca2+]ER
dt= α(JSERCA − Jleak − JIP3R)
d[IP3]
dt= JPLC − kD[IP3]
(III.4)
In most models, JIP3R corresponds to the Li-Rinzel model of IP3R [322, 327, 331,332, 333]. For example, the model from De Pitta et al [333] displays the same equa-tions for [Ca2+] (C) and IP3R closure (h) than the Li-Rinzel model but also containsa third variable corresponding to variations of [IP3]: I, which varies depending onregulatory pathways of IP3 production and degradation. This three-variable modelis thus referred to as the ChI model. Typical evolution of C, h and I with time duringa Ca2+ wave is presented in Fig III.3C. The ChI model has been extended into theG-ChI model, to account for GPCR-dependent IP3 production. Using bifurcationanalysis, they predicted that accounting for variations of [IP3] in their model couldtrigger persistent oscillations, in which [Ca2+] dynamics was encoded in frequency
Cette thèse est accessible à l'adresse : http://theses.insa-lyon.fr/publication/2019LYSEI093/these.pdf © [A. Denizot], [2019], INSA Lyon, tous droits réservés

74 III. Modeling astrocytic Ca2+ signals
or frequency & amplitude but not in amplitude alone.
Deterministic models of IP3R channels mainly differ in their mechanism of Ca2+
oscillations, which can be either IP3-independent [8, 302, 336, 312], coupled withpassive [306] and/or with active IP3 oscillations [305, 333, 337, 338]. Only represen-tative models of IP3R have been presented here. For more information, see dedicatedreviews [339, 316, 340, 341, 342].
III.2 Stochastic well-mixed models
As presented in section III.1, deterministic approaches fail to describe molecularinteractions at low concentrations [343, 344] so that the discovery of highly localizedCa2+ signals occurring in femtoliter volumes encouraged modelers to go from deter-ministic to stochastic descriptions of Ca2+ signals. Stochastic approaches have beenessential to grasp intracellular dynamics, such as the switching in bistable systemslike the gallactose signalling pathway [345].
In this section, the common methods to model well-mixed stochastic processeswill be introduced before presenting their implementation in models of Ca2+ dy-namics.
III.2.1 Methods and computational approaches
Stochastic formulation of biochemical interactions consists in considering each re-action as a probabilistic event. The state of a given system of N molecular species Si,with i ∈ [1, N ] is described by a time-dependent state vector x(t) = [x1(t), ..., xN(t)],which contains the copy number xi(t) of each molecular species Si at time t. αj(x)dtis the likelihood of reaction j to occur during the time step dt, called propensity. Thisprobability depends on the number of distinct reactants combinations for reactionj ∈ [1, R] and on the probability that a given combination of reactants interacts.Table III.1 illustrates examples of propensity functions for different types of reac-tions. vj corresponds to the jth column of the stoichiometry matrix v, and is thestate change vector for reaction Rj, which specifies changes of the system when Rj
occurs. Then the entire system of R reactions can be described with a differentialequation, the chemical master equation (CME) [346, 347], that describes the tem-poral evolution of the probability density P(x,t), which results from transitions from
Cette thèse est accessible à l'adresse : http://theses.insa-lyon.fr/publication/2019LYSEI093/these.pdf © [A. Denizot], [2019], INSA Lyon, tous droits réservés
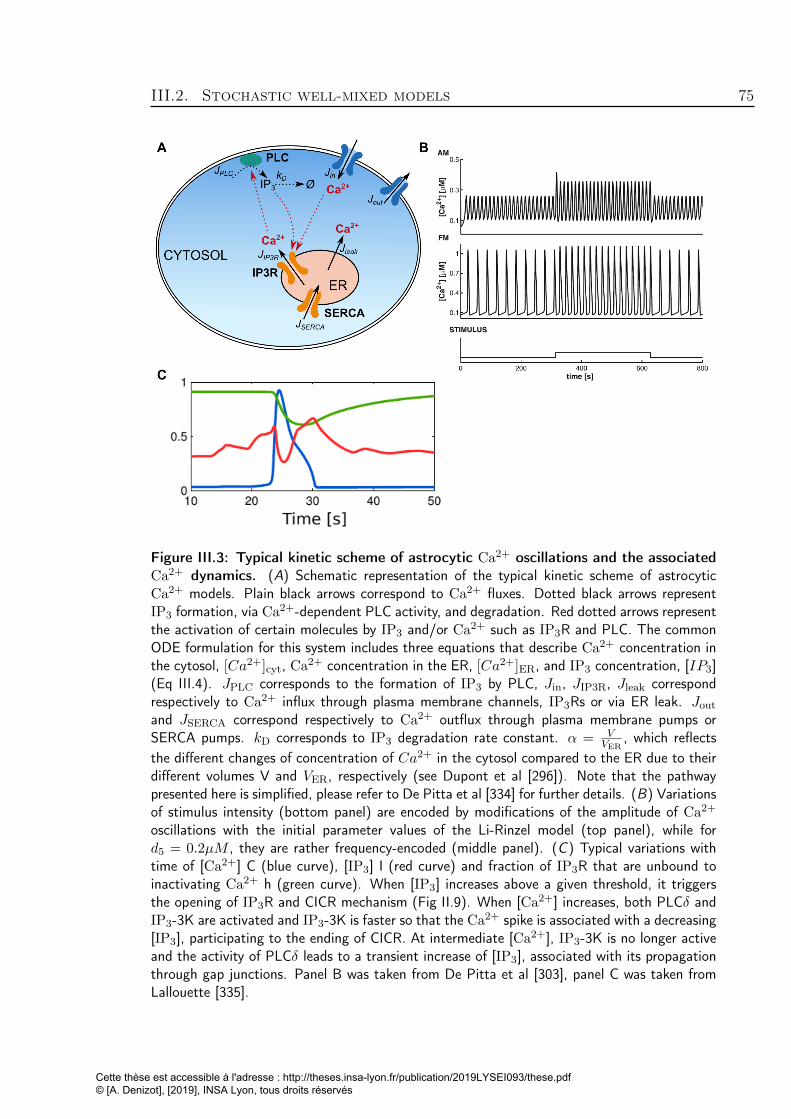
III.2. Stochastic well-mixed models 75
Figure III.3: Typical kinetic scheme of astrocytic Ca2+ oscillations and the associatedCa2+ dynamics. (A) Schematic representation of the typical kinetic scheme of astrocyticCa2+ models. Plain black arrows correspond to Ca2+ fluxes. Dotted black arrows representIP3 formation, via Ca2+-dependent PLC activity, and degradation. Red dotted arrows representthe activation of certain molecules by IP3 and/or Ca2+ such as IP3R and PLC. The commonODE formulation for this system includes three equations that describe Ca2+ concentration inthe cytosol, [Ca2+]cyt, Ca2+ concentration in the ER, [Ca2+]ER, and IP3 concentration, [IP3](Eq III.4). JPLC corresponds to the formation of IP3 by PLC, Jin, JIP3R, Jleak correspondrespectively to Ca2+ influx through plasma membrane channels, IP3Rs or via ER leak. Jout
and JSERCA correspond respectively to Ca2+ outflux through plasma membrane pumps orSERCA pumps. kD corresponds to IP3 degradation rate constant. α = V
VER, which reflects
the different changes of concentration of Ca2+ in the cytosol compared to the ER due to theirdifferent volumes V and VER, respectively (see Dupont et al [296]). Note that the pathwaypresented here is simplified, please refer to De Pitta et al [334] for further details. (B) Variationsof stimulus intensity (bottom panel) are encoded by modifications of the amplitude of Ca2+
oscillations with the initial parameter values of the Li-Rinzel model (top panel), while ford5 = 0.2µM , they are rather frequency-encoded (middle panel). (C ) Typical variations withtime of [Ca2+] C (blue curve), [IP3] I (red curve) and fraction of IP3R that are unbound toinactivating Ca2+ h (green curve). When [IP3] increases above a given threshold, it triggersthe opening of IP3R and CICR mechanism (Fig II.9). When [Ca2+] increases, both PLCδ andIP3-3K are activated and IP3-3K is faster so that the Ca2+ spike is associated with a decreasing[IP3], participating to the ending of CICR. At intermediate [Ca2+], IP3-3K is no longer activeand the activity of PLCδ leads to a transient increase of [IP3], associated with its propagationthrough gap junctions. Panel B was taken from De Pitta et al [303], panel C was taken fromLallouette [335].
Cette thèse est accessible à l'adresse : http://theses.insa-lyon.fr/publication/2019LYSEI093/these.pdf © [A. Denizot], [2019], INSA Lyon, tous droits réservés
76 III. Modeling astrocytic Ca2+ signals
state x-vj to x (via reaction Rj) minus the transitions out of state x:
∂P (x, t)
∂t=
R∑j=1
[αj(x− vj)P (x− vj, t)− αj(x)P (x, t)] (III.5)
Most of the time, the CME contains too many equations to be solved analyticallyand can be computationally expensive when increasing the number of molecules orwhen there are highly non-linear molecular pathways. In order to solve the CME,kinetic Monte Carlo algorithms have been developed [348, 349]. In those algorithms,random numbers are generated with pseudo-random number generators such as theMersenne Twister algorithm [350]. Because of the stochasticity of the system, eachsimulation, corresponding to an individual realization of the possible evolution ofstates of the system, is different. Thus, probability distributions of variables mustbe calculated by running simulations with different seeds. For more details, seeWilkinson et al [351].
Table III.1: Propensity functions for different reaction types. xi(t) corresponds tothe number of molecules of species Si at time t. cjdt is the probability that a particular reactantcombination of Rj will actually react during the time step dt. The constant cj thus dependson the molecular interaction of interest and can be determined experimentally. It is actuallyproportional to the value of reaction rate from mass action laws (presented in section III.1).This table was reproduced from Singh et al [352].
reaction Rj Propensity∅ → reaction products cjdtSi → reaction products cjxidtSi + Sk(i 6= k)→ reaction products cjxixkdt
Below are presented the most common stochastic well-mixed approaches, dividedinto continuous and discrete approaches.
III.2.1.1 Continuous stochastic approaches
Continuous stochastic approaches correspond to differential equations which con-tain an extra term that accounts for (Gaussian) noise [353, 354], referred to asstochastic ordinary differential equations (SDEs).
Cette thèse est accessible à l'adresse : http://theses.insa-lyon.fr/publication/2019LYSEI093/these.pdf © [A. Denizot], [2019], INSA Lyon, tous droits réservés
III.2. Stochastic well-mixed models 77
III.2.1.2 Discrete stochastic approaches
Discrete stochastic approaches consider the number of reactants as opposed tothe use of their concentrations in continuous methods. Several discrete algorithmshave been developed to solve the CME:
• Gillespie’s SSA algorithm and variantsOne of the most commonly used stochastic well-mixed approaches is Gillespie’sexact Stochastic Simulation Algorithm (SSA) [346, 355], in which time of nextreaction as well as the nature of the reaction are chosen randomly, basedon the probabilities of the reactions (propensity functions). This method isstatistically exact, i.e it samples the exact trajectories from the distributionpredicted by the CME. The probability density that next reaction is Rj andoccurs between (t+τ ,t+τ+dt) can be expressed as:
P (τ, j) = αje(−α0τ) (III.6)
where α0 =R∑
j=1
αj and αj is the propensity of reaction Rj (j ∈ [1, R]). For more
details on its implementation, see section IV.1 and e.g [355, 356, 351, 346, 357].Several variants of the SSA algorithm have been developed [358, 359, 360, 361].
• The τ-leap methodThe τ -leap method is an approximation of the SSA method that uses largertime steps τ whereas the SSA method proceeds one reaction at a time. The τ -leap method calculates the total number and nature of reactions that happenduring a time step τ , deduced from either Poisson [362] or binomial [363]distributions. This method is thus both faster and less accurate than the SSA.In particular, it can lead to negative numbers of reactants. If for example aPoisson distribution defines the number of realizations of reaction Ri duringτ , it can be expressed as follows:
xi(t+ τ) = xi(t) +R∑
j=1
vijξj(αj) (III.7)
where ξj is the expected number of times for the jth reaction to occur during[t, t + τ) and corresponds to a Poissonian random variable of parameter αj,vij describes the change in the copy number of species Si caused by reactionRj (j ∈ [1,R]), αj is the propensity of reaction Rj, xi(t) corresponds to thecopy number of species Si at time t.
For more details on stochastic modeling and methods, see [351, 292, 355, 364, 356,365].
Cette thèse est accessible à l'adresse : http://theses.insa-lyon.fr/publication/2019LYSEI093/these.pdf © [A. Denizot], [2019], INSA Lyon, tous droits réservés

78 III. Modeling astrocytic Ca2+ signals
III.2.2 Stochastic well-mixed models of Ca2+ signals
Recent studies have suggested that Ca2+ signals exhibit stochastic behavior, in-dependent from the level of IP3 stimulation and that it does not obey deterministicdynamics [366, 367, 368, 369, 370, 371]. The observable global Ca2+ signals such asmicrodomain signals, puffs, oscillations or waves are believed to be emergent prop-erties of this stochastic process. Several models have investigated those dynamicsand their modulation by stochastic channel activity. Next paragraphs will presentthe main representative stochastic well-mixed models of Ca2+ dynamics. For a re-view on possible physiological mechanisms responsible for the stochasticity of Ca2+
signals, see Dupont et al [372].
The first type of stochastic IP3R models that have been developed correspondedto Markov processes or Langevin approaches based on the historical IP3R modelspresented in section III.1 [373, 374, 375, 376]. The use of new techniques has enabledthe recording of single IP3R channels. Whereas the first models of IP3R channelswere based on mean behavior over time and over populations of IP3R channels,models based on those single channels recordings are based on the evolution ofthe conductance of single channels over time. Those models take into account theconformational changes that IP3Rs encounter after being bound to activating Ca2+
and IP3 and before being actually open [377, 378, 313, 316].The development of techniques for measuring time-dependent single channel cur-
rents [276, 379] has allowed for the development of a new class of stochastic IP3Rmodels: modal models [380, 381, 382]. Experimental data have indeed revealed theexistence of different modes of activity of IP3R channels, each characterized by aspecific open probability, and mode switching phenomena. The number of modesdepends on the study, mostly 2 [380, 381] or 3 [382]. Those models are implementedas hierarchical Markov models, in which each mode corresponds to a Markov modelof specific topology. Gating models still take into account state transitions withinIP3R channels but also consider that they can be in different conformations, thatcorrespond to different open probabilities called modes. The two main modal gat-ing models of IP3R from Ullah et al [382] and Siekmann et al [381] are presentedin Fig III.4. Because few mode switches occur in data collected, the first modalmodels of IP3R modeled separately the different modes [380], which described ac-curately the dynamics in each mode but failed to represent the dynamics of modeswitching. To go further, Siekmann et al [381] have developed a continuous-timeMarkov chain model that included different modes of IP3R activity and switchingbetween those modes. This study has resulted in 2 different modal models for typeI and type II IP3R channels and their regulation by IP3, ATP and Ca2+. They haveisolated 2 different modes referred to as 2-states park (inactive) and 4-states drive
Cette thèse est accessible à l'adresse : http://theses.insa-lyon.fr/publication/2019LYSEI093/these.pdf © [A. Denizot], [2019], INSA Lyon, tous droits réservés

III.2. Stochastic well-mixed models 79
(highly active) modes. State transitions within each mode are ligand-independentwhile mode switching rates are complex non-linear functions of [Ca2+] and [IP3],reflecting transitions that cannot be modeled by simple binding of IP3 or Ca2+ andmight involve multiple additional states, that are not formulated in those models.Time spent in park mode tpark and in drive mode tdrive can be expressed as follows:
tpark = (1 +q45
q54
)1
q42
tdrive = (1 +q21
q12
+q23
q32
+q26
q62
)1
q24
(III.8)
so that tpark can be approximated by 1q42
since the ratio q45q54
is low for IP3R1 and 2and where qij represents the transition rate from state i to state j.
Modal models of IP3R are still limited by current knowledge on the structure ofIP3R, as, for example, the precise Ca2+ binding sites and their physiological roles arestill poorly understood [274]. A challenge in the field is to be able to build a modelof IP3R dynamics that combines our knowledge of macroscopic Ca2+ dynamics andthe microscopic behavior of single IP3Rs that is now available.
Scaling up to models of global Ca2+ events, stochastic models have revealedthat puffs are strongly stochastic, noise-induced events [383, 384, 385] (see review[386]). Gillespie’s SSA triggered Ca2+ oscillations associated to stochasticity whilethe deterministic implementation of the same model yield to steady state [387,388, 366, 389, 390, 391]. Those observations highlight the different behaviors ofdeterministic versus stochastic simulators and that stochastic modeling might revealsubtle emergent behaviors of Ca2+ dynamics at subcellular locations.For a recent review on stochastic Ca2+ signaling models, see [392].
III.2.3 Stochastic well-mixed models of astrocytic Ca2+ sig-nals
Recently, some astrocyte models have started to incorporate noise, especially formodelling intracellular Ca2+ dynamics. Riera et al [332] have developed a stochas-tic model of Ca2+ dynamics with stochastic differential equations. By changing theamount of Ca2+ influx through passive leakage, they have demonstrated potentialmechanisms for the elevated resting [Ca2+] of astrocyte networks in Alzheimer’s dis-ease (AD) mouse models reported by Kuchibotla et al [230]. A recent stochasticmodel has also been developed to study astrocyte-neuron communication [393], byadding an activity-dependent noise term accounting for stochastic neurotransmitter
Cette thèse est accessible à l'adresse : http://theses.insa-lyon.fr/publication/2019LYSEI093/these.pdf © [A. Denizot], [2019], INSA Lyon, tous droits réservés

80 III. Modeling astrocytic Ca2+ signals
Figure III.4: Example of a modal gating model of IP3R: the Park & Drive model. (A)Measurements of single IP3R2 channel currents from Siekmann et al [381], with [Ca2+]=50nM,[IP3]=10 µM and [ATP]=50nM. The recorded IP3R presented here displays for few seconds anactivity characterized by a low open probability PO, referred to as ’Park’ mode, before switchingto a mode characterized by a higher PO, the ’Drive’ mode. Panel B presents the modal modeldeveloped by Siekmann et al [381] based on the experimental measurements from panel A.Each mode is described by a Markov model, which different states do not correspond to anyphysiological observation. Only the inter-mode rates (α & β) depend on [IP3] and [Ca2+].Subscripts indicate different states. Panel C presents the modal model of Ullah et al [382],that accounts for 3 different modes of IP3R activity: low (L), intermediate (I) and high (H) PO,represented in blue, green and red, respectively. The numbers in the subscripts ij correspond tothe number i of Ca2+ and j of IP3 bound to the IP3R in the state Cij (or Oij if the receptoris open). Superscripts L, I and H correspond to low, intermediate and high open probabilitiesrespectively. For both models, C refers to close and O to open state. Taken from Dupont &Sneyd [340].
Cette thèse est accessible à l'adresse : http://theses.insa-lyon.fr/publication/2019LYSEI093/these.pdf © [A. Denizot], [2019], INSA Lyon, tous droits réservés

III.3. Deterministic spatial models 81
release, stochastic channel opening and diffusive noise.
The models presented in this section have shed light to the stochastic behav-ior of IP3R channels. As state-based (Markovian) kinetic models are often hard toscale and computationally demanding, those IP3R models are often combined withdeterministic descriptions of other cellular processes in so-called multiscale/hybridmodels (see section III.5).
As astrocytic Ca2+ signals display a striking spatial diversity (see Fig II.7), im-plementing cellular geometry and Ca2+ diffusion in models appears crucial for re-producing and better understanding experimental observations.
III.3 Deterministic spatial models
Robert Brown reported in 1828 that pollen grains displayed constant randommovements when suspended in water, which is now referred to as Brownian motion.At the beginning of the XXth century, Einstein and then Jean Perrin have con-tributed to a better understanding of those random movements. In parallel to thiswork, Adolf Fick in 1855 formulated the macroscopic laws of diffusion. Turing hasdemonstrated that diffusion can spontaneously drive a system to instability, leadingto spatial patterns, even if the initial state of the system was uniform [394]. Thegeometry of the cell, as e.g a large turtuosity (i.e lots of obstacles that impose colli-sions of molecules onto membranes), can form structures from which the probabilityof molecules to diffuse outside is low, referred to as molecular traps.Molecular interactions rely on (1) the probability of encounter of molecules and(2) on the reaction rate of the two molecules once they are close enough to in-teract. If (2) is great compared to (1), then reactions are diffusion-limited and thesystem’s dynamics cannot be fully grasped by well-mixed models as described in sec-tions III.1 and III.2. In case of diffusion-limited reactions, the spatial character ofcellular processes and molecular transport must be taken into account in the model.If reactions are fast enough and if the number of molecular species is high, deter-ministic spatial approaches can be used to study the system. Those approaches arethe least computationally expensive to simulate spatial effects. For heterogeneousspace-dependent reaction rates or low-copy numbers of molecules, stochastic spatialapproaches should be favored, which are described in section III.4. For more detailson the theory of diffusion, see Nicholson et al [395].
Cette thèse est accessible à l'adresse : http://theses.insa-lyon.fr/publication/2019LYSEI093/these.pdf © [A. Denizot], [2019], INSA Lyon, tous droits réservés

82 III. Modeling astrocytic Ca2+ signals
III.3.1 Methods and computational approaches
Simulating space with a deterministic model relies on the use of compartmen-tal models. The geometry can be either derived from experiments or analyticallyconstructed in 1D, 2D or 3D. The geometry is then divided into sub-compartments.Each sub-compartment is considered well-mixed and can be described with the toolspresented in section III.1.
Incorporating Fick’s law of diffusion to the Reaction Rate Equation (RRE) (sec-tion III.1) leads to a PDE system, which describes the changes in concentration of aset of species over time and space [396]. Mathematically, a PDE reaction–diffusionsystem, also referred to as Reaction-diffusion equation (RDE), describes variationsof concentrations over time and space and is formulated as follows:
∂u
∂t= D∇2u+R(u) (III.9)
Or equivalently if the model is in 3 spatial dimensions (x, y & z):
∂u
∂t= D(
∂2u
∂x2+∂2u
∂y2+∂2u
∂z2) +R(u) (III.10)
where u is the concentration of the molecular species U of interest ∈ Rδ at time t ∈[0,T], δ is the dimension of the space being modeled, D is the diffusion coefficient ofU and R is a function representing the reactions involving U, which are describedby a set of differential equations. For example, if we come back to the bimolecular
reaction presented in section III.1 S1 + S2
kf
�kb
S3 + S4, including diffusion in the
model modifies Eq III.1 as follows:
∂[S3]
∂t= kf [S1][S2]− kb[S3][S4] +DS3∇2[S3] (III.11)
where DS3 is the coefficient of diffusion of species S3.
Theoretical diffusion coefficients of molecular species of interest can be calculatedfrom molecular weights or, more precisely, can be measured by fluorescence recoveryexperiments in the system of interest. Increasing the number of species and/or ofreactions increases computational cost. For techniques to solve numerically PDEs,see e.g Smith et al [397].
Several software tools are available for simulating spatial deterministic molecularinteractions:
Cette thèse est accessible à l'adresse : http://theses.insa-lyon.fr/publication/2019LYSEI093/these.pdf © [A. Denizot], [2019], INSA Lyon, tous droits réservés

III.3. Deterministic spatial models 83
• Virtual Cell (VCell) [398].
• ReDi-Cell [399], which is a GPGPU solver, so that spatial decomposition ofthe system occurs over all available GPUs.
• GENESIS [400].
• Chemesis [401].
• MOOSE [402].
• NEURON [403, 404] and the recently derived ASTRO [405]. NEURON en-ables simulations on 1D branching geometries either described by the modeleror imported from tracing programs. It is one of the most used modeling soft-ware in neuroscience, accounting for more than 1900 publications and morethan 600 models available on ModelDB, a platform for storing and retrievingneuroscience models [406].
For more details on tools and simulators available for spatially-extended determin-isitc models, see the review by Slepchenko et al [407].
III.3.2 Deterministic spatial models of Ca2+ signals
As presented in sections III.1 & III.2, the majority of Ca2+ models have beendeveloped using rate equations or Markov processes which lack spatiality. Whenthe biological question at stake necessitates to account for Ca2+ diffusion and thespatial distributions of Ca2+ signals, spatially-explicit models have been used in-stead. Deterministic spatial models of non-neuronal cell types, such as myocytes[408, 409, 410], have suggested that the positioning of intracellular Ca2+ channelsaffects the characteristics of Ca2+ waves. Spatial deterministic models have alsoprovided the first mechanistic insights on Ca2+ microdomains [411].
Because of their spatial spread, Ca2+ waves are the first type of Ca2+ signalsthat has been investigated with spatially-extended models. Ca2+ waves correspondto increases of [Ca2+] that start at a specific location in the cell and then propagate,potentially to the whole-cell. The wave is terminated by re-uptake/buffering mech-anisms such as SERCA pump activity and IP3 degradation (exponential decay). 2main mechanisms have been proposed to explain wave propagation:
• Passive wave propagation, which relies on Ca2+ diffusion within the cytosol.
Cette thèse est accessible à l'adresse : http://theses.insa-lyon.fr/publication/2019LYSEI093/these.pdf © [A. Denizot], [2019], INSA Lyon, tous droits réservés

84 III. Modeling astrocytic Ca2+ signals
• Active wave propagation, which relies on an excitable system. An increase of[Ca2+] above a certain threshold triggers additional Ca2+ release. Ca2+ thendiffuses across IP3R-enriched regions, in which the Ca2+ wave propagates viaCa2+-induced Ca2+ release (CICR) (see Fig II.9) [412, 413].
One of the most used deterministic model of Ca2+ waves is the Fire-diffuse-fire(FDF) model [414, 415], which is a threshold model. This model assumes thatthe wave is driven by passive diffusion of Ca2+ between distinct active release sites(IP3R clusters in the case of IP3R-dependent Ca2+ signals). Ca2+ is released (’fire’)at release sites when [Ca2+] is above a given threshold. Those models have been ex-tensively studied mathematically and are computationally inexpensive. FDF modelshave enabled to study the impact of SERCA pumps on wave propagation [416] andthe interactions between the ER and the cytosol [319, 417, 418].
Deterministic spatial models have demonstrated that waves in inhomogeneousmedium can display unexpected behaviors [419] and that waves can arise from theinterplay between ER distribution within the soma and IP3 generation in the neurite[420].
Only few representative spatially-extended models of Ca2+ waves have been pre-sented in this section. For more details on deterministic spatial models of Ca2+
waves, see ref [321, 298, 304].
Samanta et al [421] and McIvor et al [422] have developed deterministic spa-tial models to investigate Ca2+ dynamics within Ca2+ microdomains and observedthat IP3R clustering as well as the spatial distribution of Orai channels influencethe amplitude of Ca2+ peaks. More spatially-extended models are necessary toinvestigate microdomains dynamics although stochastic approaches (section III.4)should be preferred because of the small volumes and low copy numbers involved inmicrodomains.
III.3.3 Deterministic spatial models of astrocytic Ca2+ signals
As intra- and inter-cellular Ca2+ signals in astrocytes are highly spatialized, fromrecurrent sites of focal activity (microdomains) to propagating waves (see Fig II.7),spatially-extended models of intracellular Ca2+ signals in astrocytes have emergedrecently.
A key point for modeling astrocytes with spatially-extended models is to choosethe level of details to describe the extremely complex and ramified geometry ofastrocytes. Fig III.5 presents the different types of geometries that can be used inspatially-explicit models of astrocytes. Note that apart from 1D that is specific to
Cette thèse est accessible à l'adresse : http://theses.insa-lyon.fr/publication/2019LYSEI093/these.pdf © [A. Denizot], [2019], INSA Lyon, tous droits réservés

III.3. Deterministic spatial models 85
deterministic approaches, those geometries can be used in both deterministic andstochastic spatial models. The geometry can either be built from scratch by themodeler, mimicking key geometrical aspects of the system of interest (Fig III.5A2,B2, C2) or directly imported from experiments (Fig III.5A1, B1, C1). If a 3Dgeometry (Fig III.5A) is not required for investigating the question of interest, thegeometry can be projected in 2D ((Fig III.5B) or 1D (Fig III.5C). Discretizationshould lead to small enough compartments to represent the spatial entities of interestbut large enough so that deterministic approximation of the system can hold (i.ehigh enough copy number of particles in the compartments of interest).
III.3.3.1 Astrocyte models of intercellular Ca2+ signals
The first spatial models of astrocytes have mainly focused on intercellular Ca2+
waves propagation, in 2D [423, 328] or in 3D [337, 424]. Höfer et al [337] havemodified the Li-Rinzel model (Eq III.2 & III.3) to add IP3 dynamics to the modeland diffusion of Ca2+ and IP3 in 2 spatial dimensions. The model consists in 4ODEs for cytosolic [Ca2+]= C, [Ca2+] in the ER=S, [IP3]=I and the active fractionof IP3R=R:
dC
dt= vrel − vSERCA + vin − vout +DCa(
∂2C
∂x2+∂2C
∂y2)
dS
dt= β(vSERCA − vrel)
dI
dt= vPLCβ + vPLCδ − vdeg +DIP3(
∂2I
∂x2+∂2I
∂y2)
dR
dt= vrec − vinact
(III.12)
where vPLCβ, vPLCδ, vrel, vSERCA, vdeg, vin and vout correspond to the rates of re-spectively PLCβ, PLCδ, Ca2+ release from the ER, Ca2+ pumping into the ER bySERCA pumps, IP3 degradation, Ca2+ influx to and outflux from the cytosol. vinact
and vrec correspond to the rates of IP3R inactivation and recovery, respectively. Notethat equations for I and C include the variations of concentration due to IP3 andCa2+ diffusion, with diffusion coefficients DIP3 and DCa, respectively.
IP3 transport from cell to cell via gap junctions, was derived from Fick’s 1st Lawof diffusion:
Jnet(i→ j) = F (IP i3 − IP
j3 ) (III.13)
where i designates a given compartment(=astrocyte), j a neighboring one, Jnet thenet flux of IP3 from compartment i to j and IP k
3 the concentration of IP3 in com-partment k. F represents the coupling strength of the network and depends on the
Cette thèse est accessible à l'adresse : http://theses.insa-lyon.fr/publication/2019LYSEI093/these.pdf © [A. Denizot], [2019], INSA Lyon, tous droits réservés

86 III. Modeling astrocytic Ca2+ signals
Figure III.5: Examples of geometries for modeling intracellular Ca2+ signals in astro-cytes. Depending on the biological question, the astrocytic geometry chosen for simulationscan be in 3D (A), either realistic, extracted from 3d reconstructions of experimental data (A1),or simplified (A2). The geometry in panel A1 corresponds to a hippocampal astrocytic process≈ 1 µm long and with a diameter of ≈ 200 nm, extracted and reconstructed from electronmicroscopy, provided by C. Cali, KAUST University, Saudi Arabia [32]. Cytosolic volume isrepresented in dark and ER volume in light green. 2D projections of 3D reconstructions (B1)or of simplified geometries (B2) can also be performed for computational efficiency, although itdecreases the accuracy of the model. (C) Spatial compartments can even be simplified as 1Dsegments. They can be derived from experimental data and thus represent a 3D tree composedof 1D segments (C1) or simplified networks of 1D segments representing average network prop-erties (C2). Those 1D networks have been used both for modeling inter-cellular (network ofastrocytes) and intra-cellular (network of processes) astrocytic networks. Panel C1 was takenfrom Savtchenko et al [405]. It presents a complete astrocyte model (z-projection) generatedby NEURON software. Main branches are depicted in orange and thin processes in purple.
Cette thèse est accessible à l'adresse : http://theses.insa-lyon.fr/publication/2019LYSEI093/these.pdf © [A. Denizot], [2019], INSA Lyon, tous droits réservés

III.3. Deterministic spatial models 87
number of gap junctions in the system and on their permeability.This model has been used by Goldberg et al [425] in a 1D chain of astrocytes.
They have demonstrated that the coupling function of gap junctions must be non-linear and include a threshold of [IP3] for long-distance wave propagation and thatthis type of propagation is facilitated if internal Ca2+ oscillations are in a frequency-modulation mode.
Kang & Othmer [424] have included extracellular ATP signaling in their modelof IP3R-mediated inter-cellular Ca2+ waves. Geometry of the network was basedon in vitro and in vivo confocal immunofluorescence images. They found that Ca2+
waves in astrocytes are probably mediated by a combination of IP3 transport viagap junctions and by ATP signaling via the extracellular space.
Lallouette et al [426] have also used the model from Höfer et al [337] to investi-gate the impact of astrocytic network topology (i.e gap junction coupling) in 3D oninter-cellular Ca2+ waves propagation. Simulations of the model have demonstratedthat modifying the topology of the network is sufficient to reproduce diverse forms ofwaves reported experimentally. Sparse connectivity favored wave propagation whilelong–distance or dense connectivity impaired it.
Finally, Postnov et al [423] have implemented a model of neuron–astrocytesnetwork and have reproduced typical global and local Ca2+ patterns observed inexperiments.
III.3.3.2 Models of intracellular Ca2+ dynamics in astrocytes
The spatiotemporal complexity of intracellular Ca2+ signals in astrocytes pre-sented in section II.2 (Fig II.6B) has given rise to a novel type of models of Ca2+ sig-nals in astrocytes, focusing on intracellular Ca2+ dynamics rather than intercellularwaves propagation. Below are presented the most representative spatially-extendeddeterministic models that have been developed to study intracellular Ca2+ dynamicsin astrocytes.
In order to investigate distal Ca2+ signals in astrocytes, Brazhe et al [427](Fig III.6) have developed a model that spatially segregates distal regions fromdeeper regions of astrocytes. In this model, perimembrane regions (type I) are char-acterized by metabotropic glutamate receptors (mGluRs)-mediated signals and bythe absence of ER. Deeper regions (type II) such as the soma are characterizedby IP3R-dependent Ca2+ signaling and waves propagation via CICR. The coupling
Cette thèse est accessible à l'adresse : http://theses.insa-lyon.fr/publication/2019LYSEI093/these.pdf © [A. Denizot], [2019], INSA Lyon, tous droits réservés

88 III. Modeling astrocytic Ca2+ signals
between those spatially-segregated regions is mediated by the diffusion of Ca2+ inthe model, Jdiff . The geometry of the model was extracted from confocal imagingof a rodent hippocampal astrocyte and then mapped in 2D, labeled and discretized(Fig III.6a-d), with a resolution of 0.59 µm/pixel. The ODEs that describe the 2distinct Ca2+ oscillators and Ca2+ diffusion are presented in the bottom panel ofFig III.6. This model offers insights into the interactions between neuronal activity-driven Ca2+ signals and somatic global events.
Gordleeva et al [428] have investigated the correlations between local and andglobal astrocytic Ca2+ signals. Similarly to Brazhe et al. 2018 [427], they have useda compartmental approach, in which astrocytic geometry was reconstructed froma cultured astrocyte and was then divided into well-mixed cylinders, coupled withCa2+ and IP3 diffusion. Their results suggest that Ca2+ signals in astrocytes canbe triggered by synchronized neuronal signals, suggesting that astrocytes could actas detectors of spatial synchronization of neuronal activity.
A recently published paper by Savtchenko et al [405] has developed a model ofCa2+ signaling based on a realistic astrocyte morphology. This study is based onthe NEURON software, which enables deterministic simulations within segmented1D geometries (Fig III.5C1). They modeled Ca2+ dynamics based on Fluo4 mea-surements and investigated the effect of Ca2+ buffers and of IP3R clustering onthe propagation of Ca2+ signals within the astrocytic intracellular network of pro-cesses. Added to those important results, this study has developed a tool derivedfrom NEURON software, called ASTRO, that enables the simulation of macroscopicCa2+ dynamics and of oscillatory Ca2+ dynamics at the microscopic scale in smallcompartments representing PAPs.
As fine processes are the site of neuron-astrocyte communication, modeling stud-ies that investigate Ca2+ dynamics in peripheral astrocyte processes (PAPs) haveemerged. Some have been developed to study Na+ [429] or Ca2+ [430] dynamicsin PAPs. Montes de Oca Balderas et al have investigated Ca2+ signaling in PAPsin a spatially-extended model [430]. This study has investigated the impact of thedistance of the astrocytic ER from the tip of the astrocytic process that contactsa synapse. They modeled PAPs as 1 µm-long and 100 nm in diameter cylindersand neglected radial diffusion so that the model was in 1 spatial dimension. Theirresults suggest that IP3 diffusion on its own is sufficient to trigger Ca2+ signals inresponse to neuronal communication, even if the ER is 1 µm away from the PSD.Note however that no IP3 degradation term was included in the model so that cor-rect interpretation of simulation results might be tricky.
As PAPs contain low numbers of molecules, deterministic approaches might not
Cette thèse est accessible à l'adresse : http://theses.insa-lyon.fr/publication/2019LYSEI093/these.pdf © [A. Denizot], [2019], INSA Lyon, tous droits réservés

III.3. Deterministic spatial models 89
Figure III.6: Example of a spatial oscillator model of intracellular astrocytic Ca2+
signals. The top panel of this figure represents the model formulation of Brazhe et al [427].3D confocal fluorescent reconstruction (a) was projected in 2D (b). The cellular compart-ments were then labeled in this 2D geometry as perimembrane and deeper regions (c) beforediscretizing space in each compartment (d). The kinetic scheme modeled in each compart-ment is represented in panel (e): IP3R-independent in leaflets (=perimembrane region, blue)and IP3R-dependent in deeper regions (pink). Dotted curves indicate a functional dependencybetween molecular interactions. The Js represent Ca2+ fluxes through membranes and the 4variables are represented in black boxed. The ODEs corresponding to the dynamics in eachcompartment and their coupling through Ca2+ diffusion are presented in the bottom panel ofthis figure (blue for perimembrane regions and pink for deep regions, yellow for diffusive Ca2+
flux). This figure was adapted from Brazhe et al [427].
Cette thèse est accessible à l'adresse : http://theses.insa-lyon.fr/publication/2019LYSEI093/these.pdf © [A. Denizot], [2019], INSA Lyon, tous droits réservés

90 III. Modeling astrocytic Ca2+ signals
Figure III.7: Towards simulating signal propagation within intracellular astrocytic net-works with ASTRO. Single section (a) and full z-stack (b) of a dye-filled astrocyte of thehippocampal CA1 region and its 3D tree reconstruction using NeuroTrace (2D view of the 3Dimage) (c). Scale bar: 10 µm (d) 2D visualization of the astrocyte stem tree from panel c inNEURON format. Thin ‘buds’ represent initial regions of nanoscopic protrusions. Scale bar:10 µm. (e-f) Typical astrocyte stem tree (e), obtained by fitting branch diameters accord-ing to available experimental data (f). Data from experiments and the model are presentedrespectively in blue and red. The solid lines correspond to power law fit of data scatters.
Cette thèse est accessible à l'adresse : http://theses.insa-lyon.fr/publication/2019LYSEI093/these.pdf © [A. Denizot], [2019], INSA Lyon, tous droits réservés

III.4. Stochastic spatial models 91
be well-suited to study this system and further investigation using stochastic ap-proaches should be undertaken.
Deterministic spatially-extended models have led to significant advances in ourunderstanding of Ca2+ signaling in astrocytes, especially at the whole-cell level.Deterministic spatial methods display however some limitations. For example, thespatial extent of functional compartments is not always well defined and can changeover time, which is hard to estimate as some of those functional compartments aresmaller than the resolution of conventional light microscopy. Another limitationof this approach is that it ignores low copy number of molecules that are oftenthe hallmark of subcellular processes. Thus, compartmentalized models are well-suited for exploring cellular heterogeneity and the influence of geometry on molecularinteractions at the cellular level but stochastic approaches should be favored formodeling local signals involving low copy number of molecules as encountered inPAPs.
III.4 Stochastic spatial models
An increasing number of studies demonstrate important roles of spatial-stochasticeffects on cellular processes, from highly heterogeneous intracellular geometry [431],to non-uniform spatial molecular patterns [432] or molecular crowding effects [433].Spatial-stochastic approaches are essential for modeling systems that display lowcopy number of molecules as well as diffusive noise. Those models are computa-tionally expensive so that whole-cell simulations have been described as a ’grandchallenge of the 21st century’ [434]. Those approaches have successfully reproduceddynamics that were not grasped by the corresponding mean-field or non-spatialmodels for systems such as oscillations of Min proteins in E. Coli cell division [435],signal transduction in E. coli chemotaxis [436], MAPK pathway [437], morphogengradients [438] and interactions of DNA-transcription factors [439].
In this section, the main spatial stochastic modeling methods are introduced,before presenting the ones that have been specifically developed for studying Ca2+
dynamics. For a detailed review on spatial stochastic simulations of intracellularmolecular interactions, see [440, 441, 442, 443, 399, 444].
Cette thèse est accessible à l'adresse : http://theses.insa-lyon.fr/publication/2019LYSEI093/these.pdf © [A. Denizot], [2019], INSA Lyon, tous droits réservés

92 III. Modeling astrocytic Ca2+ signals
III.4.1 Methods and computational approaches
Similarly to deterministic spatial models, stochastic spatial approaches rely ongeometries that can be either derived from experiments or constructed analytic ge-ometries and can be implemented in 2D or 3D (Fig III.5). When space is discretized,the spatial compartments can be of different forms: from heterogeneous to homoge-neous grids in 2D models to voxels of cuboid [445] or tetrahedra [446, 447] shape in3D models. There are three main approaches for simulating reaction-diffusion sys-tems that are presented in Fig III.8 and in next paragraphs: particle-based, voxel-based and hybrid spatially-extended stochastic approaches. Other spatial stochasticmethods exist although out of the scope of this manuscript. Those methods include:
• Molecular dynamics [448], which attributes mass, momentum and energy toindividual atoms with an extremely small time step (10−15 s) and often verylarge number of particles (≈ 1010).
• Spatial chemical Langevin equation (SCLE) [449], which is a spatialized adap-tation of the chemical Langevin equation that incorporates diffusion and con-sists of a group of stochastic differential equations (SDEs) (see section III.2).
III.4.1.1 Microscopic spatial stochastic approaches
The most straightforward spatially-explicit stochastic approach consists of track-ing the diffusive path of each individual molecule/ion (=particle) within the spa-tial domain. Particles are characterized by their individual spheres of interac-tion/interaction radii (Fig III.8A1). Second-order reactions occur depending ontheir rates when the reactants are within their interaction radii. Those approaches,referred to as particle-tracking, particle-based or microscopic approaches, can beimplemented with various methods:
• Brownian dynamicsIn Brownian dynamics, single molecules are tracked while following Browniantrajectories:
r(t+ ∆t) = r(t) +√
2Di∆tξ (III.14)
where Di is the diffusion coefficient of molecule i and ξ is a vector of i.i.d.Gaussian-distributed random numbers with zero mean and unit variance. Re-actions occur when the molecules are within their interaction radii. The mostcommon methods to implement Brownian dynamics include:
Cette thèse est accessible à l'adresse : http://theses.insa-lyon.fr/publication/2019LYSEI093/these.pdf © [A. Denizot], [2019], INSA Lyon, tous droits réservés

III.4. Stochastic spatial models 93
Voxel-based
discretized space
A1 A2 A3
Particle-based
continuous spaceHybrid
Figure III.8: Spatially-explicit stochastic approaches. This figure represents the mainapproaches for spatially-explicit stochastic simulations. In particle-based models (A1), particles(red circles) are characterized by their real-valued coordinates in space and by their sphere ofinteraction (dashed black circles). Second-order reactions occur according to their specific ratewhen reactants are within their interaction radii. Note that space can be continuous (A1) ordiscretized (lattice-based method, not represented). In stochastic compartment-based = voxel-based models (A2), space is discretized into voxels that are assumed to be well-mixed. Particlescan react with reactants localized in the same voxel. The diffusion of particles is implemented asan additional reaction where single particles can hop from a voxel to a neighboring one. Voxelscan be of various shapes, mainly cubes or tetrahedra, the latter leading to higher computationalcost but finer description of the membranous contours of the various compartments. In hybridmodels (A3), part of the system is implemented with a particle-based approach while the rest ofthe system is implemented with a voxel-based approach, providing a good compromise betweenaccuracy and computational cost.
– Smoluchowski’s model, in which a molecule is characterized by its radiusof interaction and 2 reacting particles react immediately if they are withinthis radius.
– Doi/λ−ρ model [450], which is a generalization of Smoluchowski’s model[451]. , where a molecule reacts with probability λ per time unit whenthe distance between its center and another reacting molecule is less thanρ.
– The microscopic lattice method, which discretizes space into subvolumesso that each subvolume can contain at most one molecule. In this method,molecules hop from subvolume to a neighboring one and can react withmolecules that are in neighboring subvolumes. The size of the latticestrongly influences reaction rates [452] so that this method has not beenused much, except for studies on molecular crowding or on oligomerization[453].
Cette thèse est accessible à l'adresse : http://theses.insa-lyon.fr/publication/2019LYSEI093/these.pdf © [A. Denizot], [2019], INSA Lyon, tous droits réservés

94 III. Modeling astrocytic Ca2+ signals
• Green’s function reaction dynamics methodsGreen’s function reaction dynamics (GFRD) is an event-driven method inwhich reaction step is accurately calculated from propensity functions of indi-vidual reactions. Large jumps in time and space can be made if particles arefar away from each other, so that this approach is ideal for systems with hightime/distance between two reactions. This technique can be up to 5 orders ofmagnitude faster than Brownian dynamics if the number of molecules is low[454, 455].
III.4.1.2 Mesoscopic spatial stochastic approaches
Mesoscopic approaches are the least computationally expensive stochastic spatially-explicit methods as they track populations of molecules within subvolumes ratherthan individual molecules. Space is subdivided into non-overlapping voxels in amesh (Fig III.8A2). Diffusion is modeled as first-order events where a molecule Ml
in a voxel vi diffuses to a neighboring voxel vj and is treated as a set of reactions inthe CME, forming the reaction-diffusion master equation (RDME) [456, 457, 458].
Mli
dlijxli−−−→Mlj
where xli is the number of Ml in vi and dlij is the diffusion rate constant of Ml fromvi to vj, that depends on the coefficient of diffusion of Ml, Dl, and on voxel sizes.
Molecules in each voxel are assumed to be well-mixed and can react with otherreactants present in the same compartment or diffuse to a neighboring compartment.If space is divided into k voxels/compartments and there are N molecules, then theRDME is an equation for the probability density function (PDF) of kN dimensionsand time. This high dimensionality makes RDME hard to be solved directly so thatthe model is analyzed statistically with Monte Carlo approaches. See Van Kampen’s’Stochastic Processes in Physics and Chemistry’ [347] and Hellander et al [459] formore details on RDME.
Voxel size much be chosen carefully as it has to be smaller than the smallestgeometrical feature of interest and also smaller than the diffusion length of all thereactants in the timescale chosen [460]. Accuracy and computational cost decreasewith increasing sizes of compartments. The main limitations of this approach arethe potential errors in capturing the effects at boundaries [450, 461] and decreasedaccuracy if voxel size is below the well-mixed subvolume condition [444]. Note that ifmesh size is chosen carefully, compartment-based models have been shown to providea very good approximation of molecular trajectories at a much lower computationalcost than the corresponding molecular dynamics model [444, 462].
The most common mesoscopic spatial stochastic algorithms are:
Cette thèse est accessible à l'adresse : http://theses.insa-lyon.fr/publication/2019LYSEI093/these.pdf © [A. Denizot], [2019], INSA Lyon, tous droits réservés
III.4. Stochastic spatial models 95
• The next subvolume methodIn the next subvolume method, the exact Gillespie’s SSA (see section III.2)is computed in every voxel independently and diffusion is modeled betweenneighboring voxels.
• Spatial τ-leapThe spatial τ -leap algorithm is an approximation of the next subvolume methodthat uses larger time steps τ [463]. It computes the τ -leap method (see sec-tion III.2) independently in each voxel and diffusion is modeled between adja-cent voxels.
III.4.1.3 Hybrid spatial stochastic methods
In order to optimize both accuracy and computational cost, hybrid (=multiscale)methods describe regions of particular interest such as the vicinity of Ca2+ channelswith microscopic details while other regions are simulated with a compartment-based approach (Fig III.8A3). Those methods thus decrease the level of details formodeling regions in which accuracy is not necessary, thus optimizing computationalcost. Flegg et al [464] have developed such a hybrid spatially-explicit approach,called the two-regime method (TRM).
III.4.1.4 Available stochastic spatial simulators
Currently available software packages for spatially-explicit stochastic models arepresented in Table III.2. For more details on the features of the simulators presentedhere, see dedicated reviews [465, 445, 443, 455, 466, 467, 468, 469].
Note that software tools are also available for smaller spatial scales as e.g SpringSaLaD(vcell.org/ssalad), in which individual molecules are described as collections of spheresthat are bound together.
III.4.2 Stochastic spatial models of Ca2+ signals
High-resolution Ca2+ imaging studies have revealed that puffs occur at fixed cel-lular sites [480, 481, 265] and involve the simultaneous opening of several channelswithin a few hundred nm [482]. Those observations motivated the development ofstochastic spatially-explicit models of Ca2+ signals.
Cette thèse est accessible à l'adresse : http://theses.insa-lyon.fr/publication/2019LYSEI093/these.pdf © [A. Denizot], [2019], INSA Lyon, tous droits réservés

96 III. Modeling astrocytic Ca2+ signals
Table III.2: Spatially-extended stochastic simulators. In Method column (’Meth’),’Vox’ refers to voxel-based approaches, ’Part’ to particle-based approaches and ’Hyb’ to hybridapproaches. ’Det’ and ’WM’ columns contain ’x’ when it is also possible to perform deterministicor well-mixed implementations of the model with the simulator, respectively.
Simulator Url Meth Det WM RefSmartCell software.crg.es /smartcell Vox x [470, 456]MesoRD mesord.sourceforge.net Vox [471]Gridcell iml.ece.mcgill.ca /GridCell Vox [445]E-Cell e-cell.org Hyb [472, 473]VirtualCell(VCell)
vcell.org Vox x [398]
URDME urdme.org Vox [474]STEPS steps.sourceforge.net Vox x [475]Smoldyn smoldyn.org Part [453]ChemCell chemcell.sandia.gov Part [476]MCell MCell.cnl.salk.edu Part [477]eGFRD gfrd.org Part [437]Cell++ sourceforge.net/projects
/cellppHyb [478]
Spatiocyte spatiocyte.org Hyb [465]ReaDDy readdy.github.io Hyb [479]
One of the first spatial stochastic model of Ca2+ dynamics was based on a 2Dlattice and demonstrated the effect of various parameters such as Ca2+ diffusion,Ca2+ dynamics, the type and dose of agonist and morphological parameters such assize and geometry of the cell and its organelles on the temporal and spatial patternsof Ca2+ oscillations [483].
Because of their small volumes and low, highly variable numbers of Ca2+ ions(5-6 ions in a half-µm diameter dendritic spine [460]), dendrites have been one ofthe first systems studied with spatial stochastic approaches. Dendritic morphol-ogy, especially dendritic diameter, has been demonstrated to influence the spatio-temporal characteristics of Ca2+ signals, molecular diffusion and compartmental-ization [484, 485, 486, 487, 488]. Overall, spatial stochastic models have led tosignificant progress in understanding local Ca2+ dynamics in dendrites.
Spatial stochastic models have been used to model Ryanodine receptors (RyRs)-mediated Ca2+ signals in microdomains in myocytes [489] and revealed that theintrinsic noise of Ca2+ signals is associated with an increased probability of channel
Cette thèse est accessible à l'adresse : http://theses.insa-lyon.fr/publication/2019LYSEI093/these.pdf © [A. Denizot], [2019], INSA Lyon, tous droits réservés

III.4. Stochastic spatial models 97
opening. Spatially-explicit stochastic models have also been developed to investigateintracellular IP3R-mediated Ca2+ dynamics. For example, Mazel et al [431] have re-vealed that IP3R channels that are located close to mitochondria have a slightlylower probability to open than average, resulting in a lower depletion of the ER inthe vicinity of mitochondria. Wieder et al have demonstrated that local fluctuationsof the number of Ca2+ ions in microdomains due to diffusive noise increases the openprobability of a single IP3R compared to the standard deterministic model [490]. Inanother model, diffusive noise mixed Ca2+ within IP3R clusters and decreased self-inhibition of IP3R channels by Ca2+, thus increasing the open time of the channels,resulting in increased durations of Ca2+ signals [491].
Beyond the scope of Ca2+ signals, those models illustrate the roles of stochas-ticity, including diffusive noise, in intracellular signaling networks and suggest thatthey must be taken into account in order to accurately describe intracellular molec-ular interactions.
As explained in section III.3, waves are modeled as a result of the sequentialopening of Ca2+ release sites, coupled by diffusion. Experimental studies such asMarchant et al [368] have demonstrated that the frequency of Ca2+ waves is influ-enced by the characteristics of local signals such as puff frequency and amplitude,which are inherently stochastic (see section III.2). Therefore, spatially-explictitstochastic models have been developed to investigate both RyR-mediated [414] andIP3R-mediated [377] Ca2+ waves models. Other models have also implementedstochastic generalizations of the fire-diffuse-fire model (see section III.3) [492, 493]and demonstrated the emergence of coherence resonance of Ca2+ stores as well asenhanced transitions from isolated Ca2+ releases to steadily propagating Ca2+ waveswhen [IP3] increases. For reviews on stochastic waves, see [304] but also [392].
III.4.3 Stochastic spatial models of astrocytic Ca2+ signals
As described previously, models of Ca2+ signals in astrocytes have mostly beenperformed with spatially-explicit deterministic approaches, which are well-suited tothe description of global events but fail to accurately describe the heterogeneous dis-tribution of Ca2+ channels and pumps [494, 495, 496, 497, 282] and local variationsof the number of Ca2+ ions in thin astrocytic processes. For example, a cytosolicCa2+ concentration of 100 nM in the 0.357 µm3 hippocampal astrocytic volumepresented in Fig III.5A1 corresponds to 21 ions.
Recently, some astrocyte models have started to incorporate noise using hybrid
Cette thèse est accessible à l'adresse : http://theses.insa-lyon.fr/publication/2019LYSEI093/these.pdf © [A. Denizot], [2019], INSA Lyon, tous droits réservés

98 III. Modeling astrocytic Ca2+ signals
approaches in order to better simulate stochastic components of Ca2+ dynamicsat the subcellular level. For example, Cresswell-Clay et al [498] have developed awhole-cell model of a single astrocyte consisting in a soma with 5 main branches, allcontaining ER. Ca2+ signals were implemented as a stochastic influx. Their resultssuggest that both cellular geometry (e.g somatic volume) and the velocity of diffus-ing molecules influence the coupling and nature of the Ca2+ signals in response toneuronal stimulation. Interestingly, simulations also revealed complex spatiotempo-ral characteristics of Ca2+ depletion in the somatic ER in response to Ca2+ signalsin processes, due to intra-ER Ca2+ diffusion.
The model that is presented in this thesis is the first spatially-explicit fullystochastic model of Ca2+ signals in astrocytes (see Chapters IV, V, VI).
To conclude, diverse spatially-explicit stochastic approaches can be performed,that display different levels of accuracy. As a general rule, microscopic approachesshould only be performed when information about the exact trajectories of sin-gle molecules is required. In order to optimize the computational cost associatedwith spatial stochastic models, another strategy that is very prolific is to combinestochastic and deterministic approaches within the same model, each approach beingadapted to reactions/phenomena within the system of interest. Those approachesare called hybrid approaches and are the focus of next section.
III.5 Hybrid models
In most pathways, including Ca2+ signaling, some of the molecules involvedare in low copy numbers while there are many copies of some others (as e.g thenumber of IP3 molecules compared to the number of Ca2+ buffers in astrocyticprocesses). Hybrid models, that combine different modelling approaches, can beideal to model such systems by adding complexity and computational cost only toregions/molecular interactions that need a high level of details. Yet, the couplingof different modeling approaches remains tricky and can introduce errors. In thissection, the different techniques that can be used for hybrid simulations as well asexamples of hybrid models of Ca2+ signaling are briefly presented.
Cette thèse est accessible à l'adresse : http://theses.insa-lyon.fr/publication/2019LYSEI093/these.pdf © [A. Denizot], [2019], INSA Lyon, tous droits réservés

III.5. Hybrid models 99
III.5.1 Methods and computational approaches
Next paragraphs present the different combinations of approaches that are com-monly performed in hybrid models. Hybrid approaches can be divided into twomain categories: well-mixed VS spatially-extended methods. For recent reviews onhybrid methods, see [499, 467, 364].
III.5.1.1 Well-mixed hybrid methods
Well-mixed hybrid methods take into account a separation in timescales inwhich fast reactions or abundant molecules are described deterministically whileslow reactions or scarce molecules are described with a discrete stochastic process[500, 501]. Those deterministic-stochastic models are mathematically defined asPiecewise Deterministic Markov Processes (PDMPs) [502], which combine ODEs(see section III.1) with discrete stochastic processes such as CLE-approximation,Gillespie’s SSA or the τ -leap method (see section III.2) or any combination [503].Those models are simulated with Monte Carlo realizations. The coupling of the twomethods can be done with fixed time-steps, associated with time-discretization er-rors, or with adaptive methods, in which the synchronous treatment of deterministicand stochastic systems should be ensured.
Several studies have developed the theoretical background and algorithms forperforming such deterministic-stochastic well-mixed models [361, 504, 505, 506, 500,507]. Partitioning methods, adaptive or not, have also been developed in order tosort reactions into "fast" and "slow" categories [508, 361, 509]. For examples of im-plementation of well-mixed hybrid models, see [510, 511]. For rigorous error analysisand identification/partitioning of reactions, see Ganguly et al [508].
III.5.1.2 Spatially-extended hybrid methods
If the system of interest displays heterogeneous distributions of molecular speciesor if diffusion is heterogeneous or limiting, the modeler can combine different spatially-extended approaches depending on spatial localization. As described previously(section III.3 & III.4), 4 main methods are available for spatially-extended models:macroscopic (well-mixed), mesoscopic, microscopic and molecular dynamics.
Several studies have developed algorithms for spatially-extended hybrid models[512, 513, 456, 514]. For example, Ferm et al [513] propose an adaptive hybridmethod that divides the domain into diffusion-limited regions, described with thenext subvolume method (see section III.4), and well-mixed regions, described with
Cette thèse est accessible à l'adresse : http://theses.insa-lyon.fr/publication/2019LYSEI093/these.pdf © [A. Denizot], [2019], INSA Lyon, tous droits réservés

100 III. Modeling astrocytic Ca2+ signals
PDEs (see section III.3). For detailed and recent reviews on spatially-extended hy-brid methods and on the methods used for coupling the different simulators of themodel, see [467, 515, 516].
III.5.1.3 Simulators for hybrid approaches
Few simulators allow for multiscale modeling of molecular interactions:
• Multi-scale Object Oriented Simulation Environment (MOOSE,http://moose.ncbs.res.in/) [402, 517] can simulate individual molecules (viaan adaptation of the Monte Carlo simulator of Smoldyn [453]) as well as pop-ulations of molecules within pathways, entire cells or large networks of cellsvia a range of numerical engines (determinisitc, stochastic, reaction-diffusionwith branching or cubic meshes).
• Smoldyn has also recently been adapted to accommodate hybrid stochasticmodels [518] in which the subsystems with disparate levels of stochasticity aresegregated in space but can interact in an interface region [464, 519, 491].
• The GEneral NEural SImulation System simulator (GENESIS, http://genesis-sim.org/GENESIS/genesis.html) [400] has been developed to run hybrid sim-ulations in neural systems but is no longer being actively developed.
• The MUSIC API (http://software.incf.org/software/) is a framework that en-ables to build multiscale modeling between pre-existing simulators/models,with which promising multi-simulation environment tools have started to bedeveloped [520, 521].
III.5.2 Hybrid models of Ca2+ signals
III.5.2.1 Well-mixed hybrid models of Ca2+ signals
Well-mixed hybrid approaches have been widely used to model Ca2+ signaling.They model whole-cell dynamics (Ca2+ influx, removal, binding/unbinding to buffersand diffusion) with deterministic approaches but keep a high level of detail for de-scribing biophysical properties of channel gating and kinetics [384, 340]. Thosemodels have led to significant improvement in our understanding of intracellular
Cette thèse est accessible à l'adresse : http://theses.insa-lyon.fr/publication/2019LYSEI093/these.pdf © [A. Denizot], [2019], INSA Lyon, tous droits réservés

III.5. Hybrid models 101
Ca2+ signals, as e.g Ca2+ microdomains in cardiomyocytes [522, 523].Hybrid models of IP3R-dependent Ca2+ signaling have investigated the dura-
tion of Ca2+ signals depending on [IP3], in a single-cluster study [524] and thenextended in a 2D plane with several IP3R clusters [525]. The amplitude of Ca2+
peaks appeared random and only the largest ones could spread to next cluster, con-tributing to CICR and wave propagation. Another hybrid study on IP3R clustersalso predicted that CICR can be triggered by IP3R clustering where homogeneousdistribution of IP3Rs didn’t display signal propagation [526]. Wieder et al [490]have also proposed a hybrid model of Ca2+ microdomain in which IP3R dynamicswas modeled stochastically while diffusion and bulk reactions were modeled deter-ministically. They have demonstrated the influence of fluctuations in the numberof Ca2+ ions on the equilibrium behavior of single IP3Rs by increasing its openingprobability compared to the equivalent deterministic implementation.
Those studies demonstrate the influence of discrete Ca2+ noise on cellular pro-cesses at a higher spatial scale.
III.5.2.2 Spatially-extended hybrid Ca2+ models
Consequently to the discovery of the spatial diversity of Ca2+ signals, an increas-ing number of spatially-explicit hybrid approaches have been applied to Ca2+ signals.Those models simulate global Ca2+ dynamics with PDEs and microdomains sur-rounding IP3R channels with spatially-extended stochastic processes. Those modelshave proven very useful for modeling dendrites in neurons, in which dendritic spinesare typically modeled stochastically while bigger cellular subcompartments such asthe soma and dendrites are modeled deterministically [460].
Other studies rather focused on Ca2+ dynamics at IP3R clusters and have suc-cessfully reproduced puff dynamics measured experimentally [527], investigated theinfluence of IP3R clustering on puff dynamics [528], the effect of local signals onsignals at the cell level [529, 530], the emergence of Ca2+ blips [531], the decreaseof intra-cluster coupling of IP3Rs when inter-channel distance increased [532], pre-dicted that inter-peak-interval (IPI) as well as peak amplitude increase with IP3Rcluster size, even for small amounts of IP3R within the cluster [533] and suggestedoptimal cluster sizes for CICR [369].
Other hybrid studies of Ca2+ signals have provided plausible mechanisms for theformation of Ca2+ waves based on puffs dynamics [534]. Other studies have demon-strated the effect of stochastic IP3R gating on the propagation of Ca2+ waves in 2D[377] and the dependence of the lifetime of Ca2+ signals (puffs VS waves) on theinter-cluster distance [535].
Means et al [536] have used a spatially-explicit hybrid approach and modeled
Cette thèse est accessible à l'adresse : http://theses.insa-lyon.fr/publication/2019LYSEI093/these.pdf © [A. Denizot], [2019], INSA Lyon, tous droits réservés

102 III. Modeling astrocytic Ca2+ signals
reactions with PDEs except for the stochastic gating of IP3R channels. Simula-tions were performed in 3D with realistic ER geometry extracted from electron mi-croscopy. They have demonstrated that IP3R clustering might reduce the activityof IP3R channels, which could avoid ER depletion in case of repeated stimulations.
Hybrid computational approaches have promoted the emergence of studies ofCa2+ signals in 3D cellular geometries of increasing complexity. Those methods willbe essential for understanding the influence of local noisy molecular interactionsand diffusion on cellular Ca2+ patterns. No spatially-explicit hybrid model has beendeveloped for modeling Ca2+ signals in astrocytes yet but should prove most usefulfor better understanding the diversity of astrocytic Ca2+ signals.
III.6 Conclusion
Including more details in a model is associated with higher complexity and longertime to compute so that a compromise must be made between current knowledgeof the system and computational cost. The art of modeling thus consists in find-ing a minimal representation that can capture the system’s behavior. The citationfrom George Box, "All models are wrong but some are useful" [537], illustrates thatmodels are abstract simplifications of a process. Even though those simplificationsmake the model incomplete to reproduce the system as a whole, they provide newunderstanding about the system that could not be grasped from a model as complexas the system of interest.
Fig III.9 summarizes the main methods presented in this chapter by order of ac-curacy/computational cost and sums up the approximations that have to be madefor using each method. Models are designed to answer a particular research ques-tion and the lowest level of details that is enough to answer the biological questionshould be chosen. For a detailed list of tools for modeling Ca2+ signals, the readercan refer to the Toolbox of Dupont et al [267]. For reviews on Ca2+ signaling modelsdeveloped so far, see [372, 538, 539, 321, 340, 392]. For more details on models ofastrocytic excitability, see dedicated reviews [287, 540].
As astrocyte excitability plays key roles in information processing in the brain,better understanding its functioning is crucial in the neuroscience field. The complexspatiotemporal Ca2+ code of astrocytes yet remains to be decoded and computa-tional modeling of Ca2+ signals in astrocytes is an essential step towards unravellingastrocyte excitability and its involvement in brain function.
Cette thèse est accessible à l'adresse : http://theses.insa-lyon.fr/publication/2019LYSEI093/these.pdf © [A. Denizot], [2019], INSA Lyon, tous droits réservés

III.6. Conclusion 103
Figure III.9: Overview of the methods for simulating molecular interactions. Thedifferent methods presented in chapter III are presented from high accuracy/high computationalcost associated with molecular dynamics to less accurate but faster reaction ordinary differentialequations.
Cette thèse est accessible à l'adresse : http://theses.insa-lyon.fr/publication/2019LYSEI093/these.pdf © [A. Denizot], [2019], INSA Lyon, tous droits réservés

104 III. Modeling astrocytic Ca2+ signals
Cette thèse est accessible à l'adresse : http://theses.insa-lyon.fr/publication/2019LYSEI093/these.pdf © [A. Denizot], [2019], INSA Lyon, tous droits réservés

105
Part B
Investigating Ca2+ dynamics in fineastrocytic processes
Cette thèse est accessible à l'adresse : http://theses.insa-lyon.fr/publication/2019LYSEI093/these.pdf © [A. Denizot], [2019], INSA Lyon, tous droits réservés

Cette thèse est accessible à l'adresse : http://theses.insa-lyon.fr/publication/2019LYSEI093/these.pdf © [A. Denizot], [2019], INSA Lyon, tous droits réservés

107
Chapter IV
Towards a 2D spatialindividual-based model of Ca2+
signaling in small volumes
80% of the astrocyte Ca2+ activity in vivo take place in the gliapil, which ismostly formed by astrocytic ramifications that cannot be spatially resolved by con-ventional light microscopy [541], yet account for 75% of the astrocytic volume [7](see Chapter I). At this spatial scale, Ca2+ signals are characterized by non-uniformspatial distributions composed of hotspots where Ca2+ signals are more likely to oc-cur and repeat [480, 542] (see Chapter II). Those observations suggest the existenceof subcellular spatial organizations responsible for the spatial distribution of Ca2+
signal patterns. Understanding Ca2+ signaling in PAPs, where astrocytes poten-tially regulate neuronal information processing, is crucial. However, most models ofintracellular astrocytic Ca2+ have focused on the soma and main processes and didnot take into account the stochastic effects associated with the small volumes andthe low copy number of molecules involved in fine processes.
This chapter presents the 2D implementation of the model of spontaneous IP3R-mediated Ca2+ signaling that has been developed during this PhD. To account forthe stochasticity inherent to small sub-cellular volumes and low copy numbers ex-pected in fine processes, the model is both spatially explicit and particle-based. Thekinetics of IP3R channels is accounted for with a simplified version of the DYKMarkov model (see section III.1). This 2D implementation, even though less realis-tic than the 3D implementations presented in Chapters V and VI, allowed for anexploration of the range of dynamical behaviors that the model can display.
Cette thèse est accessible à l'adresse : http://theses.insa-lyon.fr/publication/2019LYSEI093/these.pdf © [A. Denizot], [2019], INSA Lyon, tous droits réservés

108IV. Towards a 2D spatial individual-based model of Ca2+ signaling in
small volumes
IV.1 Kinetic scheme and modeling approach
IV.1.1 Kinetic scheme
The model considers cytosolic Ca2+ and IP3 dynamics in the framework of Ca2+-induced Ca2+ release (CICR) signaling. The reaction scheme considered is shownin figure IV.1 A. In short, we consider Ca2+ fluxes between the cytosol and theextracellular space or the endoplasmic reticulum (ER), including via IP3R channels.We also take into account the effect of phospholipase C δ (PLCδ ), that, whenactivated by Ca2+, synthesizes IP3. To derive simple models for this scheme, wemade the following assumptions:
• We considered that the extracellular and ER Ca2+ concentrations are constantduring the simulation, as well as the electrical potentials across the plasmaand ER membranes. In this case, Ca2+ outflow from the cytosol to the ERor to the extracellular medium can be lumped into a single first-order rate α.Likewise, Ca2+ entry from the extracellular medium or any IP3R-independentCa2+ influx from the ER can be considered constants, too. We lumped theminto a single overall constant flux γ.
• PLCδ enzymes remain located in the cytosol (no translocation) and the amountof their substrate PIP2 is present everywhere in large excess. Under thiscondition, activated PLCδ produces IP3 with constant rate δ.
IP3R channels are gated both by Ca2+ and IP3, with a bell-shaped dependenceof the open probability to Ca2+ concentration [308] (see Fig II.9). To model theirdynamics, we used the classical 8-state Markov model proposed in [308, 8], withtwo Ca2+ binding sites and one IP3 binding site for each IP3R (see figure IV.1B).However we used the following simplifications:
• We considered that the binding or unbinding rate constant of a given bindingsite is independent from the occupancy state of the other sites (no intra-channelcooperativity). Under this assumption, the rate constant for Ca2+ bindingat the first Ca2+ binding site, a1, does not depend on whether the other twobinding sites are bound or not. Thus, the rate constant for {000}+Ca→ {100}has the same value as e.g. the reaction {011} + Ca → {111} (where thetriplet notation corresponds to the one defined in figure IV.1). Likewise, therate constants for Ca2+ or IP3 binding or unbinding to the three sites wereconsidered independent from the other occupancy states.
• The open state is assumed to be state {110} (first Ca site and IP3 bound,
Cette thèse est accessible à l'adresse : http://theses.insa-lyon.fr/publication/2019LYSEI093/these.pdf © [A. Denizot], [2019], INSA Lyon, tous droits réservés

IV.1. Kinetic scheme and modeling approach 109
Figure IV.1: Reaction scheme and IP3R model The biochemical processes includedin the model are illustrated in (A): Cytosolic Ca2+ can exit the cytosol to the extracellularspace or the endoplasmic reticulum (ER) at a (total) rate α, lumping together the effects ofER and plasma membrane pumps. Likewise, Ca2+ can enter the cytosol from the extracellularspace or from the ER via IP3R-independent flow, with (total) rate γ, emulating Ca2+ channelsfrom the plasma membrane. When an IP3R channel opens, Ca2+ enters the cytosol throughthe channel at rate µ. Phospholipase C δ (PLCδ), once activated by Ca2+ binding, producesIP3 at rate δ. Like Ca2+, IP3 can bind the IP3R channel and is removed with rate β. (B)Our model of the kinetics of the IP3R channel is an 8-state Markov model adapted from[8, 308]. Each IP3R channel monomer is associated with 3 binding sites, two Ca2+ bindingsites and one IP3 binding site. Occupancy states are designated by a triplet {i, j, k} wherei stands for the occupation of the first Ca binding site (i = 1 if bound, 0 else), j for thatof the IP3 binding site and k for the second Ca site. The first Ca2+ binding site has higheraffinity than the second. The open state is state {110}, where the first Ca and the IP3 sitesare bound but not the second Ca site. (C ) Spatial parameters for the particle-based model.The NIP3R IP3R molecules are positioned within uniformly distributed clusters, with η IP3Rin each cluster. Hence η = 1 corresponds to uniformly distributed IP3R (no clustering), whilethe degree of clustering increases with η (for constant total IP3R number). To account forpotential co-localization between IP3R-dependent and IP3R-independent Ca2+ sources, theinflux of IP3R-independent Ca2+ (at rate γ) occurs within distance Rγ of an IP3R. Thus,low values of Rγ emulate co-localization between IP3R-dependent and IP3R-independent Ca2+
influx sources.
Cette thèse est accessible à l'adresse : http://theses.insa-lyon.fr/publication/2019LYSEI093/these.pdf © [A. Denizot], [2019], INSA Lyon, tous droits réservés

110IV. Towards a 2D spatial individual-based model of Ca2+ signaling in
small volumes
second Ca site free), as in [308, 8]. These latter models further assume inter-channel cooperativity, where IP3R channels assemble as tetramers of which atleast three monomers must be in the open state for Ca2+ to be transferred.Here we neglected inter-channel cooperativity and considered that every singlechannel was open when in the open state i.e., as long as an IP3R channel isopen, it is assumed to inject Ca2+ in the cytosol at constant rate µ.
IV.1.2 Modeling approach
Monte Carlo simulations of the spatially-explicit stochastic particle-basedmodel
We first modeled the kinetic scheme described in figure IV.1 with a lattice-freespatially-explicit stochastic particle-based model (see section III.4), referred to as“Particle-based” model below, in two spatial dimensions, with reflective boundaryconditions. Each molecule of the system was explicitly modeled with its associatedposition in space. PLCδ and IP3R molecules were considered immobile whereasCa2+ and IP3 molecules were mobile by diffusion. At the beginning of each Monte-Carlo (MC) simulation of this model, the space coordinates for each Ca2+, IP3 andPLCδ molecules were chosen uniformly at random.
To determine the positions of the NIP3R IP3R molecules, we first chose the centersof Nc = NIP3R/η IP3R clusters uniformly at random in the reaction space, where ηis the number of IP3R channels per cluster (as illustrated in figure IV.1 C). For eachcluster, we positioned η IP3R molecules uniformly at random within a distance Rc
of the cluster center, with Rc = dIP3R
√η/0.91, where dIP3R is the interaction dis-
tance of the IP3R, i.e. the maximal distance between IP3R center and a Ca2+ or IP3
molecule below which binding can occur. According to this algorithm, η = 1 corre-sponds to randomly distributed independent IP3R molecules (no clustering) whereasIP3R molecules become increasingly clustered when η increases, with constant IP3Rdensity within the clusters and constant total IP3R number in the reaction space.
Each MC stimulation step (of duration ∆t) consists in iterating the followingsteps:
• Diffusion. The position of each mobile molecule (Ca2+ and IP3) is updatedindependently according to Brownian motion: r(t + ∆t) = r(t) +
√2Di∆tξ,
where Di, i = {Ca, IP3} is molecule i diffusion coefficient and ξ is a vector ofi.i.d. Gaussian-distributed random numbers with zero mean and unit variance.
Cette thèse est accessible à l'adresse : http://theses.insa-lyon.fr/publication/2019LYSEI093/these.pdf © [A. Denizot], [2019], INSA Lyon, tous droits réservés

IV.1. Kinetic scheme and modeling approach 111
In a subset of simulations, the new position of each mobile molecule was chosenat random in the reaction volume, i.e. r(t + ∆t) = ζ were ζ is a vector ofi.i.d. random numbers uniformly distributed in [0, L], with L the length ofthe spatial domain. We refer to this setting as “infinite” diffusion coefficients,D =∞.
• Binding. For each Ca2+ ion close enough to a PLCδ to react (i.e. when thedistance between both is less than the interaction radius of PLCδ ), a new IP3
molecule is created with probability δ∆t at the position of the PLCδmolecule.Likewise, each Ca2+ or IP3 molecule close enough to an IP3R molecule (i.e.within its interaction radius) can bind it depending on its occupancy state. Ifthe IP3 binding site is free, an IP3 molecule binds with probability a2∆t. If oneof the Ca sites is free, a Ca2+ ion binds the free site with probability a1∆t (firstCa site) or a3∆t (second Ca site). If both Ca sites are free, binding occursto the first site with probability a1∆t and to the second one with probability(1− a1∆t)a3∆t.
• Unbinding. Each IP3R molecule releases its bound Ca2+ or IP3 moleculesindependently, with probability b1∆t (first Ca site), b2∆t (IP3 site) and b3∆t(second Ca site). Ca2+ or IP3 molecules that bound the IP3R at the previous(binding) step of the current time step do not unbind.
• Removal. Free cytosolic Ca2+ and IP3 molecules are removed from the cytosolwith probability α∆t and β∆t, respectively. Ca2+ and IP3 molecules thatunbound from IP3R at the previous (unbinding) step of the current time stepare not removed.
• Ca2+ Influx. For each IP3R channel in the open state {110}, a new Ca2+
ion is created in the cytosol at the IP3R position with probability µ∆t. Anew Ca2+ ion can also be created in the cytosol with probability γ∆t, mim-icking Ca2+ influx from IP3R-independent sources in the ER membrane orthrough the plasma membrane. Note that the position of this new Ca2+ isnot uniform over space but depends on parameter Rγ and works as follows: anIP3R molecule is chosen (uniformly) at random and the new Ca2+ ion is posi-tioned uniformly at random within distance Rγ of the chosen IP3R. Thereforelow values of Rγ emulate co-localization between IP3R-dependent and IP3R-independent Ca2+ influx sources, whereas the location of IP3R-independentCa2+ influx is uniform over the reaction volume when Rγ becomes as large asthe volume side length.
Table IV.1 gives the parameter values used in our 2D simulations, including theinitial numbers of Ca2+, PLCδ , IP3 and IP3R molecules.
Cette thèse est accessible à l'adresse : http://theses.insa-lyon.fr/publication/2019LYSEI093/these.pdf © [A. Denizot], [2019], INSA Lyon, tous droits réservés

112IV. Towards a 2D spatial individual-based model of Ca2+ signaling in
small volumes
Table IV.1: Parameter values and initial conditions of the 2D model. a.u :arbitrary unit. In 2d, by definition, a MC time unit is 100 ∆t and one MC space unit is setby the interaction radius of IP3R, i.e. dIP3R = 1.0 MC space unit. δ, β, µ, γ, b1, b2 andb3 are first order constants, in (MC time unit)−1. Diffusion coefficients DCa and DIP3 areexpressed in (MC space unit)2.(MC time unit)−1 whereas α, a1, a2, a3 are expressed in (MCspace unit)2.(MC time unit)−1.
Parameter Description Value in 2d modelV Cell volume 200× 200 a.u.
IP3 dynamicsIP0 Initial IP3 number 15 molec.DIP3 IP3 diffusion 10 a.uNplc PLCδ number 1000 molec.δ PLCδmax rate 0.1 a.uβ IP3 decay 0.01 a.u
Ca2+ dynamicsCa0 Initial Ca2+ number 50 molec.DCa Ca2+ diffusion variedµ Ca2+ flux through open IP3R 50 a.uγ Cytosolic Ca2+ influx 50 a.uα Ca2+ decay rate 1.0 a.u
IP3RNIP3R IP3R number 1000 molec.dIP3R IP3R interact. distance 1 space unit
IP3R bindinga1 First Ca 1.0 a.ua2 IP3 1.0 a.ua3 Second Ca 0.1 a.u
IP3R dissociationb1 First Ca 0.1 a.ub2 IP3 0.1 a.ub3 Second Ca 0.1 a.u
Cette thèse est accessible à l'adresse : http://theses.insa-lyon.fr/publication/2019LYSEI093/these.pdf © [A. Denizot], [2019], INSA Lyon, tous droits réservés

IV.1. Kinetic scheme and modeling approach 113
Mean-field (MF) dynamics of the perfectly stirred model
With infinite diffusion, the dynamics of the system can be assumed to be perfectlystirred. With that mean-field (MF) assumption, the temporal dynamics of reactionscheme figure IV.1 can be modeled using ordinary differential equations based onthe mass-action law (see section III.1). IP3R dynamics in these conditions can bedescribed with seven ODEs that express the temporal dynamics of the concentrationof IP3R in state {ijk}, [ijk]:
d[000]/dt= − (a1[Ca] + a2[IP3] + a3[Ca]) [000] + b1[100] + b2[010] + b3[001]d[001]/dt= − (a1[Ca] + a2[IP3] + b3) [001] + b1[101] + b2[011] + a3[Ca][000]d[010]/dt= − (a1[Ca] + b2 + a3[Ca]) [010] + b1[110] + a2[IP3][000] + b3[011]d[011]/dt= − (a1[Ca] + b2 + b3) [011] + b1[111] + a2[IP3][001] + a3[Ca][010]d[100]/dt= − (b1 + a2[IP3] + a3[Ca]) [100] + a1[Ca][000] + b2[110] + b3[101]d[101]/dt= − (b1 + a2[IP3] + b3) [101] + a1[Ca][001] + b2[111] + a3[Ca][100]d[110]/dt= − (b1 + b2 + a3[Ca]) [110] + a1[Ca][010] + a2[IP3][100] + b3[111]
(IV.1)where [Ca] and [IP3] denote Ca2+ and IP3 concentration, respectively. The
concentration of the eighth occupancy state, {111} is obtained from conservation ofthe IP3R, i.e.[1111] = NIP3R/V − ([000] + [001] + [010] + [011] + [100] + [101] + [110]).IP3 dynamics in the mean-field model is given by :
d[IP3]/dt = −a2[IP3]1∑
i=0
1∑k=0
[i0k]+b2
1∑i=0
1∑k=0
[i1k]+δ[PLCδ][Ca]−β[IP3] (IV.2)
where [PLCδ] = Nplc/V . Finally, the mean-field dynamics of the free Ca2+ isobtained with:
d[Ca]/dt =−(a1
∑1j=0
∑1k=0[0jk] + a3
∑1i=0
∑1j=0[ij0]
)[Ca]
+b1
∑1j=0
∑1k=0[1jk] + b3
∑1i=0
∑1j=0[ij1]
−α[Ca] + γ + µ[110]
(IV.3)
For comparison with the output of the other models, the concentrations were trans-formed into numbers of molecules by multiplication by the reaction volume V .
Perfectly-stirred stochastic temporal dynamics (SSA)
For comparison, we also modeled the reaction scheme depicted in Figure IV.1using Gillespie’s exact SSA that accounts for stochasticity due to low copy numbers
Cette thèse est accessible à l'adresse : http://theses.insa-lyon.fr/publication/2019LYSEI093/these.pdf © [A. Denizot], [2019], INSA Lyon, tous droits réservés

114IV. Towards a 2D spatial individual-based model of Ca2+ signaling in
small volumes
and assumes perfect mixing of the reactants [346, 355] (see section III.2). In thismodel, the dynamic variables are the number of Ca2+ and IP3 molecules in the sys-tem, NCa and NIP3 and the number of IP3R channels in state {ijk}, Nijk. The ratesof all the reactions of the scheme of figure IV.1 are then calculated according tomass-action laws like in the MF model of eq. (IV.1,IV.2,IV.3). For instance, at reac-tion time t, the rate of reaction {001}+Ca→ {101} is given by a2/V N001(t)NCa(t).The next reaction time τ is sampled from an exponential distribution with mean1/RT , where RT is the sum of the reaction rates of all reactions. The next re-action to occur at time t + τ is chosen as an integer random variable with pointprobability given by the ratio of its rate to RT . For instance, for the reaction illus-trated above, the probability that this reaction is the one occurring at time t+ τ isa2/V N001(t)NCa(t)/RT . Finally, the variables are updated according to the chosenreaction. In the data presented below, we have modeled each receptor individu-ally, i.e. for each receptor l ∈ 0 . . . NIP3R, N l
ijk = 1 if receptor l is in state ijk, 0else. If the illustration reaction described above on receptor l is chosen, this meansN l
001(t + τ) = N l001(t) − 1, NCa(t + τ) = NCa(t) − 1 and N l
101(t + τ) = N l101(t) + 1.
The other variables keep their values.
Simulation code
The code of the ODE, Gillespie and Particle-based models is available on Mod-elDB at http://modeldb.yale.edu/247694.
Peak detection and analysis
In order to characterize Ca2+ dynamics, Ca2+ peaks were isolated and analyzed.They correspond to transient increases of the concentration of Ca2+. Automatedpeak detection from the model simulations was based on the statistics of baselineCa2+ trace. A histogram of Ca2+ trace was built with a bin size of 0.25 ions andthe mode of this histogram was used to define baseline Ca2+. A peak initiationcorresponded to the time step where Ca2+ trace overcame a peak threshold definedas baseline +nσCa where σCa is the standard deviation of the above histogram. Thevalue of n varied between 2 and 4 and was set by hand for each simulation, dependingon its signal/noise ratio. The peak was considered terminated when the Ca2+ tracedecreased again below peak threshold. This implies that in case of a second Ca2+
peak starting before the first one terminated, both events were considered as beingpart of the same peak. Peak duration was defined as the time between peak initiationand termination. Peak amplitude was defined as the maximum number of Ca2+ ions
Cette thèse est accessible à l'adresse : http://theses.insa-lyon.fr/publication/2019LYSEI093/these.pdf © [A. Denizot], [2019], INSA Lyon, tous droits réservés

IV.2. Results: effect of spatial properties on spontaneous Ca2+ activityin the 2D model 115
reached during the peak duration. The number of IP3R open per peak was definedas the maximum number of IP3R open simultaneously during peak duration. Puffswere defined as Ca2+ events resulting from the cooperation of more than one IP3R.In our spatially-explicit simulations, a Ca2+ signal was considered to be a puff ifmore than one IP3R were open during the peak and if the average distance traveledby Ca2+ within the duration of this peak was larger than the distance between thesimultaneously open IP3R molecules.
IV.2 Results: effect of spatial properties on spon-taneous Ca2+ activity in the 2D model
IV.2.1 Spontaneous oscillations of the 2D model
We first analyzed our particle-based model for the CICR signaling system ofFig IV.1. To that end, we compared Monte-Carlo simulations of the particle-basedmodel in two dimensions with the corresponding Mean-Field and Gillespie’s SSAmodels (see Methods section). Those three models represent three different levelsof approximation: the Mean-Field model assumes deterministic kinetics and perfectmixing; the SSA model keeps the perfect mixing hypothesis but assumes stochas-tic kinetics while the particle-based model assumes stochastic kinetics but accountsfor potential non-perfect mixing, i.e. diffusion effects. For comparison with SSA,we first considered perfect mixing of Ca2+ ions and IP3 molecules in the particle-based model by setting the diffusion coefficients DCa = DIP3 =∞ (see section IV.1).
Fig IV.2A shows one simulation sample for each model. A first result is that thestochastic models (SSA and particle-based) do exhibit spontaneous Ca2+ peaks withthe parameters of this figure. On top of a background level of roughly 50 Ca2+ ions,with fluctuations of roughly ± 20 ions, large and fast peaks arise spontaneously witha total amplitude between 20 and 120 ions above the baseline. In strong opposition,the (deterministic) mean-field model does not show these oscillations: one gets a sta-tionary trace, that systematically coincides with the baseline level of the stochastictraces (Fig IV.2B). Comparing the two stochastic models (SSA and particle-based)indicates that both display the same basal Ca2+ level (Fig IV.2B) and the same fre-quency, mean peak amplitude and duration (Fig IV.2C). Altogether, this suggeststhat stochasticity is necessary for spontaneous Ca2+ signals to occur in this model.
We next searched for the dynamical mechanism that gives rise to those sponta-
Cette thèse est accessible à l'adresse : http://theses.insa-lyon.fr/publication/2019LYSEI093/these.pdf © [A. Denizot], [2019], INSA Lyon, tous droits réservés
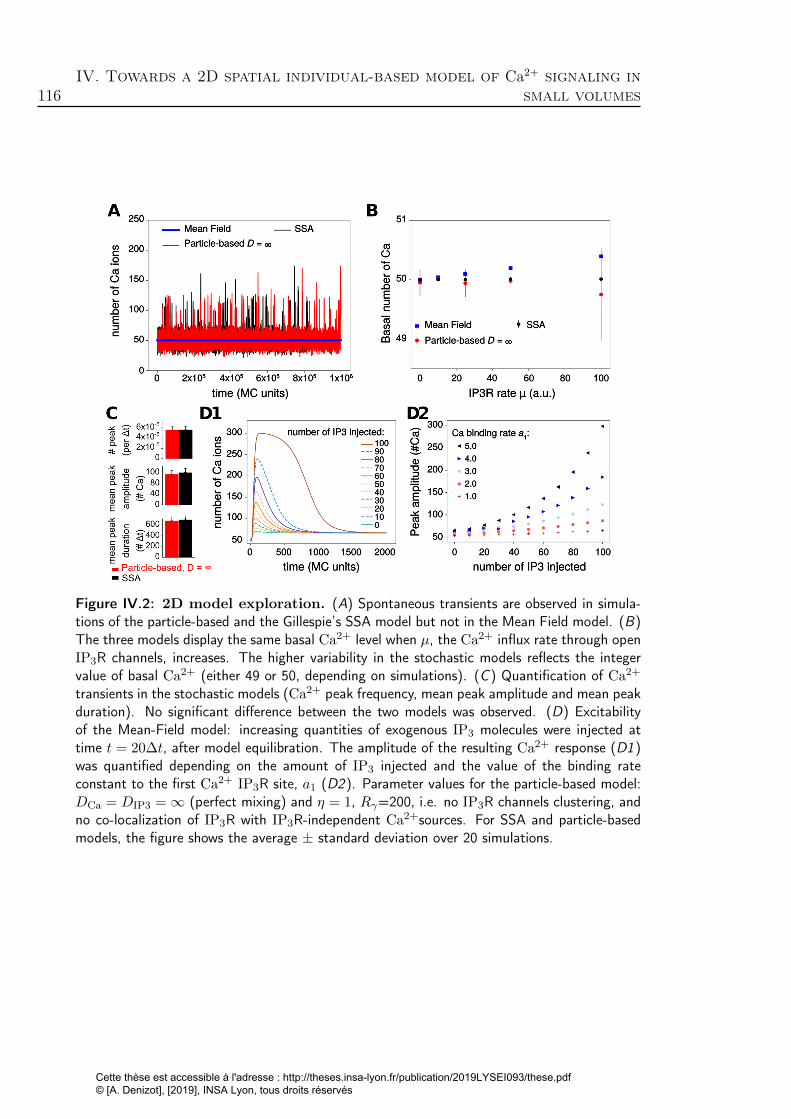
116IV. Towards a 2D spatial individual-based model of Ca2+ signaling in
small volumes
Figure IV.2: 2D model exploration. (A) Spontaneous transients are observed in simula-tions of the particle-based and the Gillespie’s SSA model but not in the Mean Field model. (B)The three models display the same basal Ca2+ level when µ, the Ca2+ influx rate through openIP3R channels, increases. The higher variability in the stochastic models reflects the integervalue of basal Ca2+ (either 49 or 50, depending on simulations). (C ) Quantification of Ca2+
transients in the stochastic models (Ca2+ peak frequency, mean peak amplitude and mean peakduration). No significant difference between the two models was observed. (D) Excitabilityof the Mean-Field model: increasing quantities of exogenous IP3 molecules were injected attime t = 20∆t, after model equilibration. The amplitude of the resulting Ca2+ response (D1)was quantified depending on the amount of IP3 injected and the value of the binding rateconstant to the first Ca2+ IP3R site, a1 (D2). Parameter values for the particle-based model:DCa = DIP3 =∞ (perfect mixing) and η = 1, Rγ=200, i.e. no IP3R channels clustering, andno co-localization of IP3R with IP3R-independent Ca2+sources. For SSA and particle-basedmodels, the figure shows the average ± standard deviation over 20 simulations.
Cette thèse est accessible à l'adresse : http://theses.insa-lyon.fr/publication/2019LYSEI093/these.pdf © [A. Denizot], [2019], INSA Lyon, tous droits réservés

IV.2. Results: effect of spatial properties on spontaneous Ca2+ activityin the 2D model 117
neous peaks. A thorough numerical parameter exploration of the mean-field modelfailed to demonstrate the existence of Hopf bifurcations or of any other bifurcationthat would generate limit-cycle oscillations in the model. This is a distinctive featureof our model, since spontaneous oscillations in the vast majority of IP3R-mediatedCa2+ signaling models arise from limit-cycle generating bifurcations [8, 300, 302].This is however not unexpected since the simplifications made to derive our modelsignificantly reduced its nonlinearity compared to these models, and the emergenceof limit-cycle bifurcations demands strong nonlinearity. For instance, limit-cycle os-cillations in the classical Li-Rinzel model [302] disappear when IP3R opening needsless than three open monomers . However, our model retains enough nonlinearityto exhibit excitability. To evidence this, we used the mean-field model, waited untilall concentrations reached their stationary state, and injected an increasing amountof exogenous IP3 molecules. In response to this IP3 injection, a Ca2+ transient wasobtained, before relaxation to the stationary state (Fig IV.2D). Fig IV.2D2 showshow the resulting transient amplitude depends on the amount of injected IP3. Forlow values of IP3R Ca2+ binding rate (first site), a1, the Ca2+ response is basicallylinear with the number of injected IP3: doubling the amount of IP3 injected onlydoubles the amplitude of the Ca2+ response. However, as a1 increases, peak am-plitude becomes a strongly nonlinear function of the number of IP3 injected. Witha1 = 5 a.u. for instance, doubling the number of injected IP3 from 50 to 100, re-sults in an almost threefold increase of the Ca2+ response. Therefore the mean-fieldmodel with large values of a1 is an excitable system that amplifies the fluctuationsof IP3 in its Ca2+ responses. We conclude that spontaneous Ca2+ transients occurin the system of Fig IV.1 through the interplay of the stochasticity of the SSA orparticle-based models and the underlying excitability of the system.
IV.2.2 Transitions between Ca2+ activity regimes
The experimental and modeling literature on intracellular Ca2+ signals distin-guishes two classes of localized Ca2+ peaks: puffs and blips [532] (see Fig II.9).Blips refer to brief and weak peaks that correspond to the opening of a single IP3Rchannel (or a single IP3R channel tetramer), whereas puffs are peaks of larger dura-tion and amplitude, resulting from the concerted opening of a group of nearby IP3Rchannels (or tetramers thereof), via the Ca2+-induced Ca2+-release principle. Wenext examined whether our model was able to reproduce these observations.
We carried out parameter exploration of the particle-based model in conditionsof perfect mixing for mobile molecules (Ca and IP3) and uniform spatial distribu-
Cette thèse est accessible à l'adresse : http://theses.insa-lyon.fr/publication/2019LYSEI093/these.pdf © [A. Denizot], [2019], INSA Lyon, tous droits réservés
118IV. Towards a 2D spatial individual-based model of Ca2+ signaling in
small volumes
tion of the immobile ones (PLCδ , IP3R). As expected, we found that Ca2+ peaksfrequency depends on parameter values (Fig IV.3A). When the rate of Ca2+ influxthrough open IP3R channels µ or the binding rate constant to the first Ca IP3R sitea1 are too small, the model does not exhibit Ca2+ peaks at all, only fluctuationsaround a stationary state (Fig IV.3CF). This is in agreement with our analy-sis of the systems excitability above, that demonstrated excitability only for largeenough values of a1 (Figure IV.2D2). Note however that in the model, IP3R open-ings do not necessarily lead to a Ca2+ peak, especially for low values of both µ anda1 (Fig IV.3CF). Spontaneous Ca2+ transients are obtained in the particle-basedmodel beyond threshold of (µ, a1) values, with a peak frequency that increases withparameters values (Fig IV.3A). Inspection of the maximal number of open IP3Rper peak, defined as the average over 20 simulations of the maximum number ofopen IP3R per peak per simulation, reveals that not only the frequency, but alsothe type of these transient signals changes with parameters values (Fig IV.3A):the less frequent signals are generally associated with a single open IP3R per peak(Fig IV.3C�), corresponding to blips, whereas the high-frequency spontaneous sig-nals rely on the opening of 2 − 12 IP3R in a peak (Fig IV.3C•), correspondingto puffs. In agreement with experimental observations[265, 264], Ca2+ puffs in theparticle-based model are characterized by higher peak amplitude and peak durationcompared to blips.
Taken together, these results show that our particle-based model not only repro-duces the existence of spontaneous Ca2+ peaks in conditions of low copy numbers,but is also able to reproduce the existence of different types of localized Ca2+ tran-sients, in agreement with experimental measurements.
IV.2.3 Impact of Ca2+ diffusion coefficient on Ca2+ signals
Flegg et al [543] have demonstrated the necessity to account for the stochasticityinherent to Ca2+ diffusion when modeling Ca2+ signaling in small volumes. We nextinvestigated the impact of Ca2+ diffusion on Ca2+ dynamics in the particle-basedmodel. In neurons or astrocytes, the amount of endogenous Ca2+ buffers is large sothat the diffusion distance of free Ca2+ is believed to be very small. Many of theendogenous buffers are however mobile. Buffers can have a very significant effecton Ca2+ dynamics because they decrease the diffusion distance and the effectivediffusion coefficient of Ca2+ ions [544, 530, 545, 546, 547, 548]. Here, we have cho-sen not to include buffers explicitly in the model for the sake of model simplicity,but to account for their presence by decreasing the diffusion coefficient for Ca2+.Therefore, the latter is to be interpreted as an effective diffusion coefficient lumpingtogether Ca2+ buffering by mobile endogenous buffer and diffusion of these buffers.
Cette thèse est accessible à l'adresse : http://theses.insa-lyon.fr/publication/2019LYSEI093/these.pdf © [A. Denizot], [2019], INSA Lyon, tous droits réservés

IV.2. Results: effect of spatial properties on spontaneous Ca2+ activityin the 2D model 119
Figure IV.3: The particle-based model produces different Ca2+ activity regimes de-pending on parameter values. Color-coded map of variation of the peak frequency, expressedas the number of Ca2+ peaks per MC time step (A) and as the maximal number of IP3R chan-nel open per peak (B). The color scale is given for each map. The black area corresponds to thestationary regime. Note that the x and y-axis scales in (A) and (B) are not regularly spaced.The symbols F, � and • locate parameter pairs that are illustrative of the three dynamicalregimes shown in (C ): stationary (F, µ = 5, a1 = 0.5), blips (�, µ = 25, a1 = 2) and puffs(•, µ = 75, a1 = 7). Red crosses show the locations of peaks from automatic detection.DCa = DIP3 =∞, η = 1, Rγ = 200.
Cette thèse est accessible à l'adresse : http://theses.insa-lyon.fr/publication/2019LYSEI093/these.pdf © [A. Denizot], [2019], INSA Lyon, tous droits réservés

120IV. Towards a 2D spatial individual-based model of Ca2+ signaling in
small volumes
To confirm that explicit addition of buffers yields effects similar to a decrease of theCa2+ diffusion coefficient, we have both developed a mean field model of Ca2+ buffer-ing (see Appendix A.2.1.1) and a version of the 2D model described here in whichendogenous buffer molecules where explicitly added and in which the coefficient ofdiffusion was low for buffers and high for free Ca2+ ions (see Appendix A.2.1.2).These simulations confirm the absence of significant difference between simulationsobtained using fast Ca2+ diffusion and slow explicit buffers on the one hand, andour reference model without buffers but with an effective lower DCa on the otherhand (see Appendix A.2.1.2).
Moreover, several plasma membrane proteins, in particular the Na+-Ca2+ ex-changer (NCX) have been observed to co-localize with ER proteins in neurons andastrocytes [495]. Such a co-localization of Ca2+ signaling molecules might implyspatial organizations including raft-like micro-domains. This organization seemsessential for Ca2+ wave propagation in astrocytes [496]. mGluR5-ER proteins co-clusters have also been revealed in astrocytic processes and are mediated by aninteraction with Homer1 scaffold protein [497]. Homer1 is also known for increasingCa2+ activity in neurons by increasing IP3R-mGluR5 proximity [282]. Those exper-imental studies suggest that several Ca2+ sources are co-localized with ER proteinsin astrocytes and that it might alter Ca2+ dynamics. Such a co-localization couldbe crucial for Ca2+ signaling, in particular in small volumes. We thus placed ourstudy of the influence of Ca2+ mobility on Ca2+ signaling in a framework whereCa2+ sources (IP3R-dependent and IP3R-independent) can co-localize.
To this end, the IP3R-independent Ca2+ influx in the cytosol (from e.g. plasmamembrane transporters or channels) was made dependent on parameter Rγ , thatsets the distance from IP3R receptors within which new Ca2+ ions are injected inthe cytosol when they originate from IP3R-independent fluxes (see Methods section).When Rγ =0, the initial location of the new Ca2+ ion is shared with an IP3R channelwhereas when Rγ increases, the injection positions of new Ca2+ ions are increasinglyuncorrelated from those of the IP3R channels. When Rγ becomes as large as the sizeof the reaction surface (i.e. for Rγ =100), the injection position of the new Ca2+ ionis effectively independent of the positions of the IP3R channels.
Our simulations show that the impact of the Ca2+ diffusion coefficient is mainlyvisible when Ca2+ sources are co-localized, i.e. for small values ofRγ . Figures IV.4A-B compare a representative simulation obtained when Ca2+ diffuses slowly (A) witha simulation obtained with perfectly-mixed Ca2+ (B), in a case where the IP3R re-ceptors are not clustered (η = 1). Those representative simulations hint that thepeak frequency is much larger with slow Ca2+, and suggests that slow Ca2+ diffusionslightly favors the puff regime compared to perfect mixing. The systematic quantifi-
Cette thèse est accessible à l'adresse : http://theses.insa-lyon.fr/publication/2019LYSEI093/these.pdf © [A. Denizot], [2019], INSA Lyon, tous droits réservés

IV.2. Results: effect of spatial properties on spontaneous Ca2+ activityin the 2D model 121
Figure IV.4: Ca2+diffusion modulates the temporal characteristics of the signals uponco-localization. Representative simulations of the particle-based model showing both Ca2+
trace and number of open IP3R for co-localized Ca2+ sources (Rγ = 0) in the case of slowCa2+ diffusion (A) or perfect-mixing of Ca2+ (B). The red crosses show peak locations fromautomatic detection. The impact of Ca2+ diffusion coefficient DCa on peak frequency (C )and the amount of puff (D) are shown for different values of the co-localization parameter Rγ :from Rγ = 0 (IP3R are not clustered but co-localized with other Ca2+ sources) to Rγ = 100(IP3R are neither clustered nor co-localized). The puff ratio quantifies the fraction of peaksthat are puffs. (E ) and (F ) respectively present the probabilities that IP3R closure results frombinding of a Ca2+ to the inactivating site (probability to switch to state {111}, P110−>111) orunbinding of an IP3 (probability to switch to state {100}, P110−>100) depending on DCa andon Rγ . Probability of closure due to Ca2+ unbinding from activating site, P110−>010 can bededuced from 1 = P110−>010 +P110−>100+P110−>111. Data are presented as mean ± standarddeviation over 20 simulations. Lines are guide for the eyes. Note that the x-axis scales in (C ),(D), (E ) and (F ) are not regularly spaced. Other parameters: η = 1 (no clustering), a1 = 1,µ = 50.Cette thèse est accessible à l'adresse : http://theses.insa-lyon.fr/publication/2019LYSEI093/these.pdf
© [A. Denizot], [2019], INSA Lyon, tous droits réservés

122IV. Towards a 2D spatial individual-based model of Ca2+ signaling in
small volumes
cation of figure IV.4C-D confirms these interpretations: when IP3R-dependent andIP3R-independent Ca2+ sources are co-localized, i.e. for Rγ < 5, the value of DCa
controls Ca2+ transient frequency, as well as the probability to observe a puff. Theeffects are strong: for instance for Rγ = 0, decreasing DCa from 5 to 0.1 increasesthe frequency roughly threefold. However, when the IP3R-independent influx wasnot co-localized with IP3R channels (i.e. for Rγ ≥ 5), both the peak frequency andthe type of signal were found not to depend on the Ca2+ diffusion coefficient any-more. Those results suggest that Ca2+ diffusivity could control the frequency andtype of Ca2+ signals within astrocytes when IP3R channels are co-localized withIP3R-independent Ca2+ sources.
Once open, i.e in state {110}, the IP3R can switch to state {111} with probabilityP110−>111, due to binding of Ca2+ to the inactivating site. Open receptors can alsoswitch to state {100} (or {010}) with probability P110−>100 (or P110−>010, respec-tively), due to the unbinding of IP3 (or of Ca2+, respectively) from the activatingsite. Fig IV.4E-F shows how the probabilities P110−>111 and P110−>100 vary withDCa and Rγ (P110−>010 can be deduced from 1 = P110−>010 + P110−>100+P110−>111).In contrast, Rγ has no significant effect on P110−>111, P110−>100 and P110−>010 prob-abilities. The effect of the effective diffusion coefficient DCa is strong: when low,most of IP3R closure is due to the binding of Ca2+ to the inhibiting site. As DCa
increases, P110−>111 decreases and in well-mixed conditions (DCa = ∞), IP3R clo-sure is always due to the stochastic unbinding of IP3 and Ca2+. So, receptor closureis strongly dominated by binding of Ca2+ to the inactivating site when Ca2+ effec-tive diffusion is slow, but mostly relies on unbinding from the activating sites forfast Ca2+ effective diffusion. This result illustrates that well-mixed simulations arenot well-suited to study the self-inhibiting behaviour of IP3R, i.e the fact that theCa2+ influx resulting from the opening of a given IP3R can subsequently shut downthis very receptor. Therefore accounting for diffusion with spatial models appearsnecessary to the study of the dynamics of IP3R at the single-receptor scale.
IV.2.4 IP3R clustering controls Ca2+ signals when co-localized
Experimental data demonstrate that IP3R in SH-SY5Y and COS7 cells are notuniformly distributed on the ER membrane but form clusters [264, 265]. We nextinvestigated the impact of IP3R clustering on Ca2+ signal dynamics in our particle-based model. Simulations were performed with Dca=0.1 and various amounts ofco-localization between IP3R channels and other Ca2+ sources (parameter Rγ ).Representative simulations for uniformly-distributed IP3R channels (η = 1) andstrongly clustered IP3R (η = 50) are presented in figure IV.5A-B. In these two ex-amples, the IP3R were weakly co-localized with the IP3-independent Ca2+ sources
Cette thèse est accessible à l'adresse : http://theses.insa-lyon.fr/publication/2019LYSEI093/these.pdf © [A. Denizot], [2019], INSA Lyon, tous droits réservés

IV.3. Discussion 123
(i.e. Rγ = 10). These traces indicate that the frequency and type of Ca2+ sig-nal in this case is heavily dependent on the spatial distribution of IP3R channels:clustered IP3R seem to exhibit much larger peak frequency and slightly more fre-quent puffs. However, here again this effect is quite mitigated by the amount ofco-localization between IP3R channels and the IP3R-independent Ca2+ sources. Inparticular, the dynamical range of the modulation by IP3R cluster size η (i.e. theratio between the frequency at η = 50 and η = 1) is maximal for intermediate co-localizations (2 ≤Rγ ≤ 10) but the Ca2+ peak frequency is hardly dependent on ηwhen co-localization is either very strong (Rγ < 2) or very weak (Rγ ≥ 50). Increas-ing clustering also tends to improve the emergence of puffs, although the effect issignificant only for strong co-localization (Rγ ≤ 2, Fig IV.5D). We emphasize thatin such cases of strong co-localization, the regime of Ca2+ activity (puffs vs blips)changes by simply rearranging the spatial distribution of the IP3Rs, without chang-ing any of the kinetics parameters of the model.
Taken together, those simulation results pinpoint the interplay between Ca2+
source co-localization and the degree of IP3R clustering as a crucial modulator oftemporal characteristics of the Ca2+ signals and of the signaling regime. In partic-ular, they suggest that in the presence of certain amount of co-localization betweenIP3R channels and other sources of Ca2+ influx in the cytosol the spontaneous Ca2+
peak frequency can have a large amplitude variation. Within this range of parame-ters, Ca2+ peak frequency can be finely tuned by the geometry of the colocalization.
IV.3 Discussion
IP3R subunits cooperativity and spontaneous signals
IP3R channels assemble as tetramers and a recent experimental study suggestedthat the four subunits of the tetramer must be simultaneously bound to IP3 forthe tetramer to allow Ca2+ influx, independently of cytosolic Ca2+ or ATP concen-trations [275] (see section II.2). Actually, the original IP3R models predicted thatsubunit cooperativity for Ca2+ binding is also necessary to fit experimental data ofIP3R dynamics [8, 302]. Even though the IP3R binding sites for Ca2+ have beencharacterized, their roles in IP3R dynamics are still poorly understood [274]. Therequirement for inter-subunit cooperativity, in which the 4 IP3 binding sites shouldsimultaneously be bound for the tetramer to open, is expected to hinder the emer-gence of spontaneous Ca2+ events. In a subset of simulations, we have replaced ournon-cooperative IP3R model, in which the binding of a single IP3 site is enough toopen the monomer channel, with the cooperative model proposed by Bicknell and
Cette thèse est accessible à l'adresse : http://theses.insa-lyon.fr/publication/2019LYSEI093/these.pdf © [A. Denizot], [2019], INSA Lyon, tous droits réservés

124IV. Towards a 2D spatial individual-based model of Ca2+ signaling in
small volumes
Figure IV.5: IP3R clustering modulates Ca2+ signals when co-localized. Representativesimulations of the particle-based model with the corresponding IP3R distribution over space,the Ca2+ trace and number of open IP3R for weakly co-localized Ca2+ sources (Rγ = 10) inthe case of uniform distribution of the IP3R (A) or strongly clustered IP3R (B) are illustrated.The red crosses show peak locations from automatic detection. The impact of IP3R clustersize η on Ca2+ peak frequency (C ) and on the amount of puffs (D) are shown for differentvalues of the cluster size: from η = 1 (IP3R are not clustered) to η = 50 (strong clustering).Data are presented as mean ± standard deviation over 20 simulations. Lines are guide for theeyes. Other parameters : DCa = 0.1, a1 = 1, µ = 50.
Cette thèse est accessible à l'adresse : http://theses.insa-lyon.fr/publication/2019LYSEI093/these.pdf © [A. Denizot], [2019], INSA Lyon, tous droits réservés

IV.3. Discussion 125
collaborators [549]. With 100 nM basal IP3 and Ca2+ [550, 551], we could not pro-duce spontaneous Ca2+ signals, even after a search of the parameter space to locateparameters allowing spontaneous activity with this cooperative model. This issuemight reflect a general problem of the De Young Keizer model in discrete particle-based models with low copy number of particles. The De Young-Keizer model isbased on steady-state experimental data representing averages over time and overchannel populations, which proved sufficient to reproduce experimental statisticssuch as the average open time or the steady-state open probability. However, thismodel might not be suited to describe behaviors at the level of individual channelsand low copy number of particles. More recent models have been proposed that suc-cessfully reproduce the evolution with time of the open/close dynamics of a singleIP3R [380, 381]. In those models, the transition rates between different states ofthe IP3R are not triggered by Ca2+ or IP3 binding events but by complex contin-uous functions of their concentrations (see section III.2). We could not implementsuch complicated functions with a pure particle-based modeling strategy such asused here. Therefore, further investigation is needed to clarify the suitability of theDe Young-Keizer model in the context of particle-based spatially-explicit stochas-tic models. Alternatively, our results may be interpreted as casting doubts on theexistence of spontaneous Ca2+ signals in astrocytes when the basal IP3 and Ca2+
concentrations are of the order of 100 nM (see also section V.3).
Varying IP3R affinity for Ca2+ and the effective DCa as a mechanism forCa2+ signals diversity
In our model, the value of the rate constant for Ca2+ binding to IP3R changes thetype of spontaneous dynamics (e.g. blips vs puffs) in addition to its characteristics(frequency, amplitude). Experimentally, several post-transcriptional mechanismscan modulate IP3R affinity. For instance, phosphorylation of type-1 and -2 IP3Rby cAMP-activated PKA increases the affinity of IP3R to Ca2+ and IP3 [278]. At alarger time scale, the sensitivity of IP3R to Ca2+ is encoded in a sequence of Ca2+
sensor (Cas) region that differs depending on the IP3R isoform [552, 553, 266]. Sincemultiple IP3R isoforms seem to be involved in Ca2+ signaling within astrocytic pro-cesses [260], they could assemble into a variety of homo- or hetero- IP3R tetramersthat would exhibit a range of Ca2+ and IP3 affinity.
In addition, immobile or weakly mobile endogenous Ca2+ buffers are responsiblefor an effective intracellular Ca2+ diffusion that is an order of magnitude slowerthan free Ca2+ ions [554]. The variability of these endogenous Ca2+ buffers, withvarious kinetics and various diffusion coefficients, is large [555]. Some of them areoverexpressed in hippocampal and striatal astrocytes, possibly in a region-specific
Cette thèse est accessible à l'adresse : http://theses.insa-lyon.fr/publication/2019LYSEI093/these.pdf © [A. Denizot], [2019], INSA Lyon, tous droits réservés

126IV. Towards a 2D spatial individual-based model of Ca2+ signaling in
small volumes
pattern [28]. Our simulation results indicate that the value of the effective Ca2+
mobility also participates in the determination of the type and characteristics ofthe spontaneous events, thus confirming previous modeling approaches [543]. Sucha regional differential expression of the genes coding for endogenous Ca2+ bufferscould thus be involved in the regional variability of astrocytic Ca2+ signaling [64].
Therefore, the IP3R repertoire, the post-transcriptional regulation of IP3R affin-ity and the differential expression of endogenous Ca2+ buffers could also be potentialdeterminants allowing a range of responsiveness and spatio-temporal characteristicsof Ca2+ signals in astrocyte processes.
IP3R clustering as a potential mechanism for plastic information process-ing in astrocytes
For simplicity, IP3R clustering in our model was considered static during sim-ulation time. Experimentally, though, IP3R clustering might be highly dynamic[556, 557] even if reported not dynamic over minutes in HelA cells [480]. Severalmolecules can trigger IP3R clustering, including IP3 and Ca2+ themselves [557, 556],through a mechanism that may include the lateral diffusion of IP3R on the ER sur-face [557] or be independent from it [558]. Beyond this IP3R classification intoclustered and un-clustered populations, another approach is to quantify single IP3Rchannels based on their mobility. A recent study on HeLa cells [480] indicates thatCa2+ signals emerge most of the time from immobile IP3R channels, which are foundin apposition to ER-plasma membrane junctions, whereas the mobile IP3R fractionwould not be involved in Ca2+ influx. Our simulation results, in agreement with pre-vious IP3R-mediated Ca2+ models [369, 533], indicate that IP3R clustering can leadto an increase of the frequency and amplitude of their Ca2+ signals. This result is incontradiction with a previous modeling study that concluded in favor of a reductionof IP3R channel activity upon IP3R clustering [536]. This discrepancy might relyon the different modeling choices. In particular, the model in [536] incorporates a5-state IP3R model derived from [552, 559]. All of those modeling studies howeveragree that dynamical IP3R clustering could be a mechanism used by astrocyte pro-cesses to modulate their Ca2+ signals. This could provide astrocyte processes witha capacity for information processing plasticity.
Conclusion
In this chapter, a 2D individual-based model has been presented to investigateintracellular Ca2+ signaling based on CICR in small sub-cellular volumes. Simula-
Cette thèse est accessible à l'adresse : http://theses.insa-lyon.fr/publication/2019LYSEI093/these.pdf © [A. Denizot], [2019], INSA Lyon, tous droits réservés

IV.3. Discussion 127
tions of the model show that spontaneous Ca2+ signals arise in the model via theinterplay between the excitability of the system and its stochasticity. The modelaccounts for both types of Ca2+ signals in astrocytic ramifications ("blip" or "puff")and their frequencies depend on the spatial organization of the signaling molecules.Therefore, two ramifications expressing exactly the same Ca2+ channels can dis-play different types of Ca2+ signals depending on the spatial organization of theirchannels. Moreover, we found that co-localization of sources of Ca2+ influx in thecytosol is paramount to the diversity of the signals. It would thus be interestingto investigate whether those co-localizations can be observed at specific locations,such as at neuron-astrocyte contact sites. This model therefore represents a vali-dated spatially-extended stochastic tool to investigate Ca2+ signals and constitutesa significant advance in intracellular signaling in general because it presents the firstfully stochastic model suited to investigate Ca2+ dynamics in small compartments.
Cette thèse est accessible à l'adresse : http://theses.insa-lyon.fr/publication/2019LYSEI093/these.pdf © [A. Denizot], [2019], INSA Lyon, tous droits réservés

128IV. Towards a 2D spatial individual-based model of Ca2+ signaling in
small volumes
Cette thèse est accessible à l'adresse : http://theses.insa-lyon.fr/publication/2019LYSEI093/these.pdf © [A. Denizot], [2019], INSA Lyon, tous droits réservés

129
Chapter V
Modeling spontaneous Ca2+ signalsin realistic 3D geometries
The 2D simulations of the particle-based model presented in Chapter IV have theadvantage of a good computational efficiency, which makes them suitable for para-metric studies with averaging over a number of Monte-Carlo simulations. However,the 2D setting does not facilitate the comparison of the copy number of molecules inthe simulations with molecular concentrations as measured experimentally. More-over, it is difficult to investigate the impact of the localization of IP3R channels atthe surface of the ER membrane (rather than freely diffusing in the cytosol) with a2D setting. To address those questions, we have extended the model for simulationsin three-dimensional geometries, which will be presented in this chapter. In thisimplementation, molecular concentrations and volumes can be precisely adjusted toexperimental data from astrocytic processes.
The experimental work presented in this chapter has been performed by our col-laborators: U. V. Nägerl’s team, Interdisciplinary Institute for Neuroscience, Uni-versité de Bordeaux, France and C. Calì, BESE Division, King Abdullah Universityof Science and Technology, Thuwal, Saudi Arabia. They have conducted Ca2+ imag-ing experiments (see Arizono et al [9] for methods) and electron microscopy (see Calìet al [32] for methods), respectively.
V.1 Simulating Ca2+ signals in a simplified 3D PAPgeometry
As 80% of Ca2+ activity occurs in astrocytic ramifications that cannot be resolvedby optical microscopy [7], astrocytic Ca2+ signaling models must take into account
Cette thèse est accessible à l'adresse : http://theses.insa-lyon.fr/publication/2019LYSEI093/these.pdf © [A. Denizot], [2019], INSA Lyon, tous droits réservés

130 V. Modeling spontaneous Ca2+ signals in realistic 3D geometries
small volumes associated to it. This section presents simulations performed in asimplified 3D geometry that is suited for reproducing concentrations and volumesencountered in PAPs. After validating the model against experimental data, wehave investigated its behavior depending on spatial distributions of molecules andon cellular geometry.
V.1.1 Experimental measurements of Ca2+ signals
Experimental measurements of Ca2+ dynamics in microdomains in mice hip-pocampal organotypic culture have been performed by our collaborators (see FigV.2A for data and Arizono et al [9] for methods). Organotypic slices were usedas they provide better optical access and sample stability, which, combined withconfocal microscopy, enabled to distinguish individual processes (resolution ≈ 200nm VS ≈ 500 nm with two-photon microscopy in vivo). While this resolution wasnot enough to resolve the exact sizes of PAPs, it provided the most realistic Ca2+
dynamics experimentally available for Ca2+ transients occurring at fine astrocyticprocesses. Their data reveal the sponge-like structure of processes (Fig V.2A1), withlocalized submicron Ca2+ microdomains (regions of interest (ROI) in Fig V.2A2) ofsize that can be less than 0.5µm2. The corresponding Ca2+ traces display infre-quent (a few hundredths of Hz) peaks with average amplitude ≈ 2.5 (∆F/F ) andtypical duration of ≈ 2.7 seconds at FWHM (Fig V.2A3 and D). Notice that theseexperimental traces correspond to spontaneous signals to the extent that they weremeasured in the absence of any neuronal or astrocytic stimulation. In particular,TTX application in this preparation did not alter peak frequency [9]. Ca2+ tracesare available at https://figshare.com/articles/Astrocytic_calcium_traces_from_-organotypic_hippocampal_slices/8951006.
V.1.2 Modeling approach
In order to simulate Ca2+ dynamics within a 3D geometry with realistic volumesand concentrations, we have built a model in STEPS (http://steps.sourceforge.net/).STEPS is a software for voxel-based stochastic reaction-diffusion simulations withincomplex 3D geometries that simulates stochastic chemical reaction-diffusion with aspatialized version of Gillespie’s SSA, usually referred to as the reaction-diffusionmaster equation (RDME) [475] (see section III.4). STEPS uses a derivative of theSSA in tetrahedral voxels that allows for a better resolution than the cubic voxelsmostly used in voxel-based models [475].
Cette thèse est accessible à l'adresse : http://theses.insa-lyon.fr/publication/2019LYSEI093/these.pdf © [A. Denizot], [2019], INSA Lyon, tous droits réservés

V.1. Simulating Ca2+ signals in a simplified 3D PAP geometry 131
GeometryThe main advantage of STEPS in the context of this study is its automatic han-
dling of external and internal membranes [446]. Moreover, STEPS simulations caneasily be parallelized [560], a crucial property given the computational burden ofsuch compartmentalized 3D simulations. This allowed us to explicitly describe thepresence of the ER membrane inside the 3D cell cytoplasm and the fact that IP3Rchannels are located on the ER membrane. The geometry of the reaction volumeconsisted in a cylinder of length Lastro=1 µm and radius Rastro=0.1 µm. The ERwas modeled as a second cylinder, internal, with length LER=0.75 µm and radiusRER=0.03 µm. The resulting cytosolic volume (2.81 × 10⁻¹⁷ L) was meshed with11345 tetrahedra of individual volume 2.48× 10⁻²¹L, thus ensuring the well-mixedsubvolume condition [475]. The geometry is presented in Fig V.2B.
ReactionsIn this spatial configuration, we modeled the IP3R-mediated Ca2+ signaling ki-
netic scheme of Fig IV.1. Ca2+ ions and IP3 molecules diffuse in the bulk 3D spacelocated between the plasma membrane and that of the ER, while IP3R molecules aredistributed uniformly at random over ER membrane surface. Three model variantswere implemented:
• A first variant, referred to as the “No-GCaMP” model, did not include flu-orescent Ca2+ indicators. In this 3D model, parameter values were taken,whenever possible, from the literature (Table A.1). γ and α values were ad-justed to yield basal Ca2+ concentration 83 ± 29 nM [551, 177]. Likewise,β and µ were adjusted for a basal IP3 concentration of 120nM [550]. Notethat this value is based on recent, precise measurements of IP3 concentrationand differs by an order of magnitude from IP3 concentration values routinelyused in IP3R-mediated Ca2+ models [264, 561, 342]. IP3R density on the ERsurface has been measured by Wiltgen et al with TIRF-microscopy on cellcultures [481], reporting IP3R cluster diameters of 0.3 µm at most, with up to10 IP3R per cluster. The ER surface area in our model is 0.69 µm2. Ignoringthe potential unclustered IP3R channels [558], this represents a maximum of4 clusters, thus at most 40 IP3R channels. We thus set the number of IP3Rin our model to 50 channels on the ER surface. Finally, Ca2+ and IP3 bind-ing and dissociation constants to IP3R were adjusted to fit the experimentaldata from our collaborators of Ca2+ microdomains in organotypic cultures ofhippocampal astrocytes.
• A second variant of the 3D model, referred to as the “GCaMP”(=”GCaMP6s”)model, was obtained by adding GCaMP6s Ca2+ indicators in the cytosol.
Cette thèse est accessible à l'adresse : http://theses.insa-lyon.fr/publication/2019LYSEI093/these.pdf © [A. Denizot], [2019], INSA Lyon, tous droits réservés
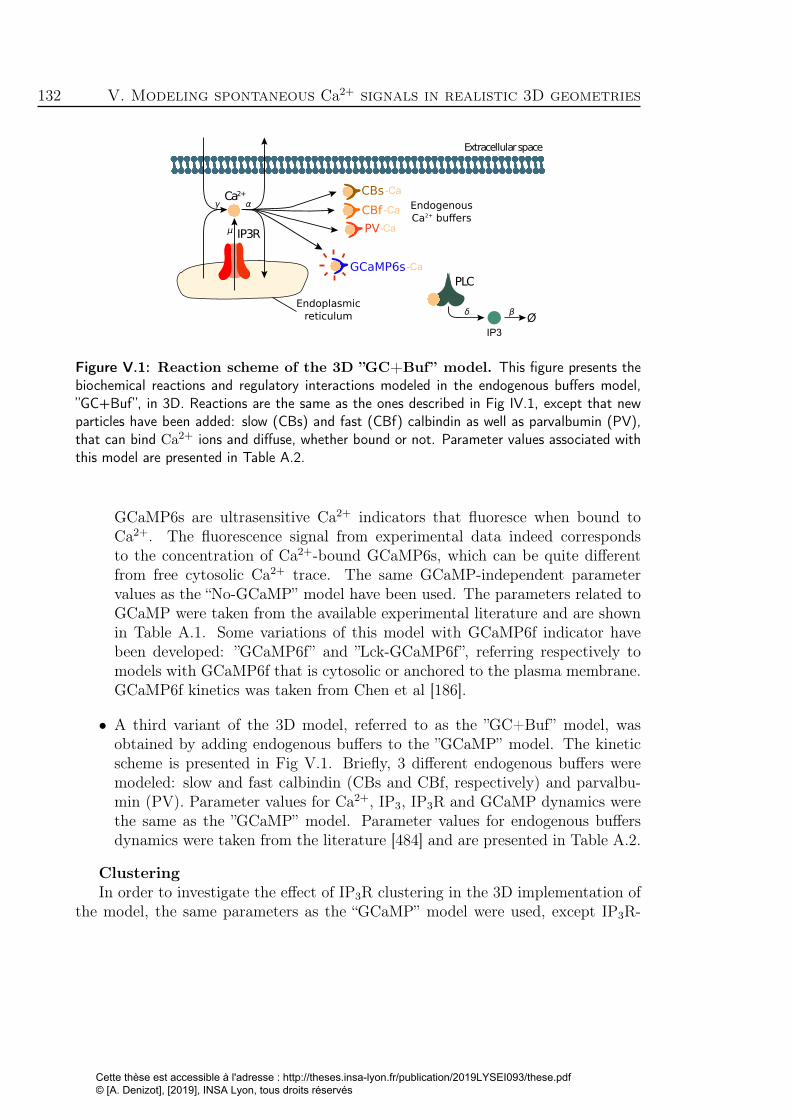
132 V. Modeling spontaneous Ca2+ signals in realistic 3D geometries
PLC
Øβ
Ca2+
IP3R
Extracellular space
α
μ
γ
δ
IP3
CBs
CBf
PV
GCaMP6s-Ca
Endoplasmicreticulum
EndogenousCa2+ buffers
-Ca
-Ca
-Ca
Figure V.1: Reaction scheme of the 3D ”GC+Buf” model. This figure presents thebiochemical reactions and regulatory interactions modeled in the endogenous buffers model,”GC+Buf”, in 3D. Reactions are the same as the ones described in Fig IV.1, except that newparticles have been added: slow (CBs) and fast (CBf) calbindin as well as parvalbumin (PV),that can bind Ca2+ ions and diffuse, whether bound or not. Parameter values associated withthis model are presented in Table A.2.
GCaMP6s are ultrasensitive Ca2+ indicators that fluoresce when bound toCa2+. The fluorescence signal from experimental data indeed correspondsto the concentration of Ca2+-bound GCaMP6s, which can be quite differentfrom free cytosolic Ca2+ trace. The same GCaMP-independent parametervalues as the “No-GCaMP” model have been used. The parameters related toGCaMP were taken from the available experimental literature and are shownin Table A.1. Some variations of this model with GCaMP6f indicator havebeen developed: ”GCaMP6f” and ”Lck-GCaMP6f”, referring respectively tomodels with GCaMP6f that is cytosolic or anchored to the plasma membrane.GCaMP6f kinetics was taken from Chen et al [186].
• A third variant of the 3D model, referred to as the ”GC+Buf” model, wasobtained by adding endogenous buffers to the ”GCaMP” model. The kineticscheme is presented in Fig V.1. Briefly, 3 different endogenous buffers weremodeled: slow and fast calbindin (CBs and CBf, respectively) and parvalbu-min (PV). Parameter values for Ca2+, IP3, IP3R and GCaMP dynamics werethe same as the ”GCaMP” model. Parameter values for endogenous buffersdynamics were taken from the literature [484] and are presented in Table A.2.
ClusteringIn order to investigate the effect of IP3R clustering in the 3D implementation of
the model, the same parameters as the “GCaMP” model were used, except IP3R-
Cette thèse est accessible à l'adresse : http://theses.insa-lyon.fr/publication/2019LYSEI093/these.pdf © [A. Denizot], [2019], INSA Lyon, tous droits réservés

V.1. Simulating Ca2+ signals in a simplified 3D PAP geometry 133
independent cytosolic Ca2+ influx, γ. Indeed, in order to facilitate the control ofthe localization of Ca2+ sources in STEPS, IP3R-independent cytosolic Ca2+ influxhas been implemented as channel-dependent Ca2+ fluxes. To do so, Ca2+ channels,γchPM
, were added to the model, located at the plasma membrane. There were asmany γchPM
on the plasma membrane as IP3R channels on the ER membrane: 50.γ in those simulations is 15× 10−8s−1.
• Clustering algorithmER surface was divided in triangles. As ER is cylindrical and in order tofacilitate the implementation of co-clustering, we have omitted the circles aspotential surface for IP3R clustering. Triangles that belong to the surface ofinterest were stored in a list. For each cluster, a triangle was chosen randomlywithin the list. If no cluster center existed yet, then cluster center was definedin this triangle. If some cluster centers already existed, then for each clustercenter, inter-cluster center distance had to be greater than 20nm. Then eachcluster center and its neighboring triangles formed the surface of an IP3Rcluster. Please note that this approach is simplistic and does not account forIP3R size ( 25nm [274]) or for inter-IP3R and inter-clusters distances foundin the literature [481]. Each cluster surface was then defined as a region ofinterest (ROI) as defined in STEPS. The given number of IP3R per clusterwas then added to this ROI.
• Co-clustering algorithmIf cocl=0, γchPM
Ca2+ channels were randomly distributed on the plasma mem-brane. If cocl=1, γchPM
channels were co-clustered with IP3Rs. Similarly toIP3R clustering algorithm, pumps were distributed into cluster patches on theplasma membrane. For each IP3R cluster center previously described, the clos-est triangle on plasma membrane was defined as the center for γchPM
cluster.Each γchPM
cluster patch was then defined as a ROI consisting in this centertriangle and its neighboring triangles. For simplicity, γchPM
cluster size wasidentical to IP3R cluster size.
Note that in order to avoid spatial overlapping of both IP3R and γchPMclusters,
the list of potential membranous triangles for positioning a new cluster center wasdeprived of the triangles that belonged to previously created clusters. Because ofthis implementation, clusters did not always consist in the same number of trian-gles. Indeed, most clusters contained the central triangle and its 3 neighbors butfew contained only 3 triangles as one of the neighbors already belonged to anothercluster. This effect occurred in simulations with a high number of clusters (i.e smallcluster size η).
Simulation code
Cette thèse est accessible à l'adresse : http://theses.insa-lyon.fr/publication/2019LYSEI093/these.pdf © [A. Denizot], [2019], INSA Lyon, tous droits réservés

134 V. Modeling spontaneous Ca2+ signals in realistic 3D geometries
The code of the ”GCaMP” variant of the model is available on ModelDB [562]at http://modeldb.yale.edu/247694.
Peak detection and analysisPeak detection was performed with the same strategy as presented in section IV.1.
Peak amplitude A was however rescaled to facilitate comparison with experimentaldata, using ∆F/F = (A − Cabaseline)/Cabaseline, where Cabaseline is the basal [Ca2+]and peak duration was expressed as full width at half maximum (FWHM).
V.1.3 Results
Simulations in a compartmentalized 3D geometry reproduce spontaneousCa2+ microdomains signals
Our first noticeable result is that the model is able to reproduce the emergence ofspontaneous Ca2+ peaks of comparable frequency, duration and signal-to-noise ratio(Fig V.2C) to those measured experimentally. This result therefore indicates thatspontaneous Ca2+ signals can emerge in fine processes even with a realistic basalCa2+ concentration of 83 ± 29 nM, which corresponds to only one to two Ca2+ ionsin the whole cylinder. Quantification of free Ca2+ signal properties (Fig V.2D) showsthat signals are quantitatively and qualitatively different from experimental signals(Fig V.2C, D, “No-GCaMP” simulations). Adding GCaMP6s to the model, andthus measuring GCaMP-Ca=Ca-GCaMP signals, improved drastically both quali-tatively and quantitatively the match between simulations and experimental data(Fig V.2C, D, “GCaMP” and ”GC+Buf” simulations), with no apparent differencebetween the ”GCaMP” and the ”GC+Buf” simulations. Note that our experimentalstatistics are tightly associated with the temporal sampling frequency used in theexperiments (2 Hz) since very fast Ca2+ events may be accessible only to highersampling frequencies [7]. In particular, the experimental peak frequency measuredmight have been higher with better temporal resolution. The spontaneous signalsmeasured in organotypic hippocampal cultures by our collaborators are of the sameorder of magnitude than the ones measured in vivo [563, 7]. In any case, our resultsshow that genetically encoded Ca2+ indicators (GECIs), such as GCaMP6s, maychange local Ca2+ concentration, in particular close to open IP3R channels, leadingto an increased peak duration. Those results are in accordance with previous stud-ies that demonstrate that Ca2+ buffers, such as GECIs, modulate signal readout[366, 545].
Together those results demonstrate that our model, without any endogenous
Cette thèse est accessible à l'adresse : http://theses.insa-lyon.fr/publication/2019LYSEI093/these.pdf © [A. Denizot], [2019], INSA Lyon, tous droits réservés

V.1. Simulating Ca2+ signals in a simplified 3D PAP geometry 135
Figure V.2: 3D model simulations in fine astrocyte processes successfully reproduceCa2+ microdomains signals. (A) Experimental monitoring of the spontaneous local Ca2+
signals in astrocytic sponge-like processes. Panel A1 shows a ’summed projection’ of a confocaltime lapse image stack of a GCaMP6s-expressing astrocyte. Panel A2 illustrates magnificationof the boxed region of panel A1. Panel A3 displays spontaneous Ca2+ traces from the regionsof interest shown in (A2). (B) The 3D geometry used for the 3D model is a cylinder oflength Lastro=1 µm and radius Rastro=0.1 µm, with ER as a thinner cylinder inside. Theinterior volume is roughly 0.03 fL. (C ) Representative simulations of Ca2+ dynamics within theabove cylinder with the “No-GCaMP”, ”GCaMP” and ”GC+Buf” simulations. The raw signalcorresponds to cytosolic free Ca2+ concentration for the “No-GCaMP” model and to Ca2+-bound GCaMP concentration for ”GCaMP” and ”GC+Buf” models. For all simulation types,parameter values were partly taken from the literature and partly adjusted for fitting Ca2+
traces shown in A (see Table A.1). (D) Quantitative comparisons of the spontaneous Ca2+
signals measured experimentally (black bars) or simulated with the “No-GCaMP”, “GCaMP”or ”GC+Buf” models (white bars). The compared quantities are peaks amplitude in terms of∆F/F ratio (D1), their frequency (measured in min−1 for each µm2 area, D2) and duration(expressed as full width at half maximum, FWHM, in s, D3). Significance is assigned by * forp ≤ 0.05, ** for p ≤ 0.01, *** for p ≤ 0.001.Cette thèse est accessible à l'adresse : http://theses.insa-lyon.fr/publication/2019LYSEI093/these.pdf
© [A. Denizot], [2019], INSA Lyon, tous droits réservés

136 V. Modeling spontaneous Ca2+ signals in realistic 3D geometries
buffers, is enough to reproduce Ca2+ signals within fine astrocytic processes in aquantitative way, making it a powerful tool to investigate Ca2+ dynamics in thesmall volumes associated with PAPs.
Effect of GCaMP properties on Ca2+ dynamics
Because ”GCaMP” simulations revealed that the use of GECIs may change lo-cal Ca2+ concentration and thus impact peak duration, we have next investigatedthe effect on Ca2+ dynamics of several parameters defining GCaMP molecules:their kinetics and their concentration. We tested to what extent using differentGECIs in our simulations impacted Ca2+ dynamics. We compared the dynamicsof [GCaMP6s-Ca] with those of cytosolic [GCaMP6f-Ca] and membrane-anchored,immobile, [Lck-GCaMP6f-Ca]. Although the total concentration of GECIs in thosethree models was identical, GCaMP6f-Ca signals displayed higher amplitude andsmaller duration than GCaMP6s-Ca signals (Fig V.3A1,3). No significant differencebetween GCaMP6f-Ca and Lck-GCaMP6f-Ca was observed (Fig V.3A1-3). Thoseresults are partially in agreement with experimental measurements [186] that havereported a similar decrease of peak duration when using GCaMP6f compared toGCaMP6s. However, experimental observations also included a decrease of thepeak amplitude with GCaMP6f, that we do not observe. This discrepancy could bedue to a higher fluorescence baseline of GCaMP6f-Ca in those experiments, leadingto decreased ∆F/F ratio.
As the concentration of GECIs cannot be controlled experimentally and is oftennot reported in Ca2+ imaging studies, we have next investigated its effect on Ca2+
signals (Fig V.3B). Our simulations demonstrate that an increased GCaMP concen-tration in the cell results in a linear increase of basal GCaMP-Ca levels (Fig V.3B1),with an unchanged basal concentration of free Ca2+. This result is consistent withsimulations of our ODE model of Ca2+ buffering (see section A.2.1.1). Increased[GCaMP] is associated with a decrease of GCaMP-Ca peak amplitude expressed interms of ∆F/F ratio (Fig V.3B2) and an increase of peak duration (Fig V.3B4).Interestingly, varying [GCaMP] does not seem to have an impact on peak frequency(Fig V.3B3), which is contradictory to Skupin et al’s results [530] that have demon-strated a non-linear increase of the average signal period with the concentrationof exogenous buffers. However, Skupin et al studied whole-cell EGTA or BAPTAdynamics, which is fundamentally different from the local spontaneous GCaMP-Casignals in the fine processes that we are modelling here. The fact that we mea-sure no significant difference between membrane-anchored and cytosolic GCaMPconcentration is against experimental observations [255] and, according to our sim-
Cette thèse est accessible à l'adresse : http://theses.insa-lyon.fr/publication/2019LYSEI093/these.pdf © [A. Denizot], [2019], INSA Lyon, tous droits réservés

V.1. Simulating Ca2+ signals in a simplified 3D PAP geometry 137
Figure V.3: The kinetics and concentration of GECIs strongly influence Ca2+ dynamics.(A) Quantitative comparisons of the spontaneous Ca2+ signals measured with “GCaMP6s”,”GCaMP6f” or ”Lck-GCaMP6f” as fluorescent reporters. The compared quantities are peaksamplitude in terms of ∆F/F ratio (A1), their frequency (measured inmin−1 for each µm2 area,A2) and duration (expressed as full width at half maximum, FWHM, in s, A3). Significance isassigned by * for p ≤ 0.05, ** for p ≤ 0.01, *** for p ≤ 0.001. (B) Impact of the concentrationof GCaMP6s on basal concentration of GCaMP-Ca (B1, ANOVA, p-value<0.0001 ***), on theGCaMP-Ca peak amplitude (B2, ANOVA, p-value<0.0001 ***), frequency (B3, ANOVA, p-value=0.0013 **) and duration (B4, ANOVA, p-value=0.049 *). Data are presented as mean± standard deviation over 20 simulations. Lines are guide for the eyes.
Cette thèse est accessible à l'adresse : http://theses.insa-lyon.fr/publication/2019LYSEI093/these.pdf © [A. Denizot], [2019], INSA Lyon, tous droits réservés

138 V. Modeling spontaneous Ca2+ signals in realistic 3D geometries
ulations, might reflect different levels of expression of Lck-GCaMP compared tocytosolic GCaMP. Local variations of GCaMP concentration might thus yield varia-tions of peak duration and amplitude, so that measuring GCaMP concentration andits variations along cellular compartments appears crucial to analyze Ca2+ signalsmore accurately.
Effect of IP3R clustering and of cellular geometry on spontaneous Ca2+
signals
As simulations in 2D suggested a role of IP3R clustering on Ca2+ dynamics (seeFig IV.5), we have investigated whether this effect could still be observed in thelow copy number 3D voxel-based implementation of the model. Since a recent EMstudy has detected contact sites between ER and plasma membrane (PM) in endfeet[30], we have investigated the effect of the juxtaposition of the endoplasmic (ER)and plasma (PM) membranes on Ca2+ dynamics. To do so, we have performedsimulations with 2 different ER cylinder radii, RER=30nm and 80nm and constantER surface (Fig V.4A), with different IP3R cluster sizes (η=1, 2, 5, 10, 25, 50) andconstant total number of IP3R=50, with or without co-clustering of Ca2+ sources(cocl=1 or 0, respectively) (Fig V.4B).
Ca2+ signals in geometries with an ER-PM distance at cluster sites that was20nm (RER=80nm) was associated with higher peak amplitude, frequency and du-ration compared to geometries with an ER-PM distance of 70 nm (RER=30nm)(Fig V.4C). Moreover, similarly to the 2D model, IP3R cluster size η had a low im-pact on Ca2+ signals when Ca2+ sources were not co-localized (cocl=0, mild increaseof peak frequency with η, no impact of η on peak duration and amplitude). As ob-served in the 2D version of the model (see Fig IV.5), IP3R cluster size η influencespeak amplitude and frequency in 3D but not its duration when Ca2+ sources areco-clustered (cocl=1), for RER = 80 (see Fig V.4D) and RER = 30 (not shown).
Overall, our results confirm the results from the 2D implementation of the model(see Chapter IV) that increased IP3R cluster size, when associated with the co-clustering of IP3R channels with other Ca2+ sources, results in an increase of bothpeak frequency and amplitude. Ca2+ peak amplitude and frequency are furthermoreincreased at ER-PM contact sites. This suggests that ER-PM contact sites couldconstitute preferential sites of Ca2+ signaling in the cell, favoring the existence oflocal ’hotspots’ of Ca2+ activity.
To conclude, we show that the spontaneous Ca2+ signals generated by the 3D im-plementation of the model with realistic process volume and astrocytic Ca2+ concen-trations successfully reproduce the spontaneous Ca2+ transients measured in Ca2+
Cette thèse est accessible à l'adresse : http://theses.insa-lyon.fr/publication/2019LYSEI093/these.pdf © [A. Denizot], [2019], INSA Lyon, tous droits réservés

V.1. Simulating Ca2+ signals in a simplified 3D PAP geometry 139
Figure V.4: IP3R clustering and ER-PM distance influence Ca2+ dynamics in 3D. (A) Inorder to test the impact of ER-plasma membrane (PM) distance on the effect of the co-clusteringof Ca2+ sources, geometries with different ER radii (RER) have been designed. RER=30nmcorresponds to the geometry used in previous simulations (see Fig V.2). RER=80nm, corre-sponds to an ER-PM distance of 20nm, mimicking ER-PM contact sites. The height of ERcylinders has been adapted so that varying RER does not affect total ER surface and IP3Rdensity. Screenshots of simulations (B) reveal the distribution of molecules in reaction spacewith varying cluster sizes (η=10 or 25) and the presence or absence of co-clustering of γchPM
with IP3R (respectively cocl=1 or 0, see section V.1.2). White arrows: IP3R clusters. Theinfluence of IP3R cluster size η on Ca2+ peak amplitude (C1, ANOVA, p-value<0.0001 *** forboth RER=30 and 80), peak frequency (C2, ANOVA, p-value=0.0084 ** for RER=30 and p-value=0.0092 ** for RER=80) and on peak duration (C3, ANOVA, p-value=0.81 for RER=30and p-value<0.0001 *** for RER=80) is shown for different values of cluster size: from η = 1(IP3R channels are not clustered) to η = 50 (strong clustering), with co-clustering, cocl=1and with RER= 30nm (red) or 80nm (black), DCa=13µm2.s−1.
Cette thèse est accessible à l'adresse : http://theses.insa-lyon.fr/publication/2019LYSEI093/these.pdf © [A. Denizot], [2019], INSA Lyon, tous droits réservés

140 V. Modeling spontaneous Ca2+ signals in realistic 3D geometries
Figure V.4: IP3R clustering and ER-PM distance influence Ca2+ dynamics in 3D(continued). (D) Quantification of the effect of cluster size on Ca2+ signals peak amplitude(D1, ANOVA, p-value=0.50 for cocl=0), frequency (D2, ANOVA, p-value=0.031 * for cocl=0)and duration (D3, ANOVA, p-value=0.091 for cocl=0), for cocl=0 (black) and cocl=1 (red),DCa=13µm2.s−1. Data are presented as mean ± standard deviation over 20 simulations. Linesare guide for the eyes. Significance of the difference between simulations with RER = 30 andRER = 80 (C) or cocl=0 and cocl=1 (D) is assigned by * for p ≤ 0.05, ** for p ≤ 0.01, ***for p ≤ 0.001.
micro-domains with confocal microscopy in organotypic culture of hippocampal as-trocytes. Our simulations predict that local variations of the concentration of Ca2+
indicators such as GECIs might contribute to the diversity of Ca2+ signals observedin astrocytes so that precise monitoring of their concentration should be performed.Finally, simulations in the 3D geometry confirm the results from the 2D implemen-tation of the model (see Fig IV.5) that increased IP3R cluster size, when associatedwith the co-clustering of IP3R channels with other Ca2+ sources, results in an in-crease of both peak frequency and amplitude. Furthermore, the 3D implementationof the model suggests that, in 3 spatial dimensions, those effects are particularlyenhanced at ER-PM contact sites.
V.1.4 Discussion
Ca2+ buffering in astrocytes is currently not well described. Ca2+ buffering coulddiffer depending on sub-cellular localization as some recent papers revealed the exis-tence of local translation in radial glia [564], in processes compared to soma [565] andin endfeet [30]. This could potentially allow for local sets of proteins to be expressedin different concentrations than in the soma. Immobile or weakly mobile endoge-nous Ca2+ buffers are responsible for an effective intracellular Ca2+ diffusion thatis an order of magnitude slower than free Ca2+ ions [554]. Our simulation resultsindicate that the value of the effective Ca2+ mobility participates in the determi-nation of the characteristics of the spontaneous events, thus confirming previousexperimental [566] and modeling studies [545, 567, 546, 490, 543]. Although oursimulations with both GCaMP and endogenous buffers,”GC+Buf”, overall displayedsimilar dynamics to the simulations without endogenous buffers (”GCaMP”), we notethat, similarly to the effect of GCaMP concentration, increasing the concentrationof endogenous buffers led to longer duration of the Ca2+ signals. Those results areconsistent with previous studies that have demonstrated significant effects of buffers[544] or of intra-cluster channel communication and coupling [545] on Ca2+ dynam-
Cette thèse est accessible à l'adresse : http://theses.insa-lyon.fr/publication/2019LYSEI093/these.pdf © [A. Denizot], [2019], INSA Lyon, tous droits réservés

V.2. Simulating Ca2+ signals in a 3D geometry extracted from EM 141
ics. Endogenous Ca2+ buffers display various kinetics and diffusion coefficients inastrocytes [555] and some of them are overexpressed in hippocampal and striatalastrocytes, possibly in a region-specific pattern [28], which could be involved in theregional variability of astrocytic Ca2+ signals [64]. Our study shows that preciselyaccounting for the effects of GECIs and endogenous Ca2+ buffers on Ca2+ dynam-ics is crucial for better interpreting Ca2+ signals in PAPs. Particular care shouldbe taken when interpreting GCaMP-Ca signals as GCaMP concentration is rarelymonitored although it could be partly responsible for the diversity of Ca2+ signalsobserved in PAPs.
V.2 Simulating Ca2+ signals in a 3D geometry ex-tracted from EM
Computational studies of fine astrocytic processes typically consider that theirgeometry can be simplified as being a cylinder of length ≈ 1µm and of radius ≈50-100 nm [429, 430], similar to the mesh that we have used in section V.1. Inorder to investigate whether the cylinder geometry presented in Fig V.2 is a goodapproximation of a fine astrocytic process, we have performed similar simulationswithin a realistic PAP geometry. This geometry, referred to as ’Real’ or ’Realistic’,was extracted from electron microscopy (EM) by our collaborator, C. Calì, KAUSTUniversity, Saudi Arabia. We have first compared Ca2+ dynamics in the ’Real’ ge-ometry to the dynamics in the simplified PAP geometry presented in section V.1,referred to as ’Cyl’ or ’Cylinder’. Next, we have investigated the impact of thegeometrical parameters that were isolated by our previous studies (see section IV.2and V.1) on Ca2+ dynamics in the realistic geometry.
V.2.1 Modeling approach
The realistic 3D mesh used in this study corresponds to a 220 µm3 hippocampalastrocyte extracted from electron microscopy by C. Calì, presented in Fig V.5A.From this mesh, we have extracted, in collaboration with Erik De Schutter’s team,Okinawa Institute for Science and Technology (OIST), Japan, a process that con-tains ER. A screenshot of a simulation in the resulting realistic PAP geometry ispresented in Fig V.5B. Cytosolic volume of the PAP mesh is 0.357µm3 and ER sur-
Cette thèse est accessible à l'adresse : http://theses.insa-lyon.fr/publication/2019LYSEI093/these.pdf © [A. Denizot], [2019], INSA Lyon, tous droits réservés

142 V. Modeling spontaneous Ca2+ signals in realistic 3D geometries
Figure V.5: Realistic astrocytic mesh extracted from EM. This figure presents the 3Dmesh that has been provided by C. Calì, which allowed us to perform simulations within arealistic PAP geometry. Panel A presents the mesh of the 220 µm3 hippocampal astrocyticvolume extracted and reconstructed from EM. Cytosol is in green and endoplasmic reticulum(ER) in yellow. One process from the reconstructed astrocyte that contains ER has beenisolated (B). The simulation screenshot presented in panel B displays 250 IP3R channels thatare organized in clusters of size η = 50 (white arrows) and 250 γchPM
channels that are randomlydistributed on the plasma membrane (yellow) (cocl = 0). ER is represented in light green andplasma membrane is transparent.
face is 0.891µm2 so that 250 IP3R channels must be placed on the membrane of theER in order to keep the same IP3R density as in the cylinder mesh (see section V.1).
Simulations were performed for different cluster sizes η, with and without co-clustering (cocl= 1 or 0, respectively) with the ”GCaMP” model from section V.1within the realistic PAP mesh presented in FigV.5B. Clustering and co-clusteringalgorithms were identical to the ones described in section V.1. In a subset of simu-lations, referred to as ’ER-PM cl’ (see Fig V.8A2), IP3R clusters were positioned atER sites that were the closest to the plasma membrane in the mesh. To do so, ERtriangles were sorted according to their distance to the closest plasma membranetriangle. Then, depending on the number of clusters in the simulation (250/η), theER triangle corresponding to the shortest ER-PM distance was selected as an IP3Rcluster site. Cluster area then consisted in this triangle and its 3 neighbors. Those 4triangles were then removed from the list of available ER triangles for placing IP3Rchannels. Thus, if a new cluster had to be placed, it would not be placed onto thosetriangles, avoiding cluster overlapping.
Parameter values were the same as in the simulations in the simplified geometry(see Table A.1), except γ. Indeed, as IP3R-independent Ca2+ influx γ occurs at
Cette thèse est accessible à l'adresse : http://theses.insa-lyon.fr/publication/2019LYSEI093/these.pdf © [A. Denizot], [2019], INSA Lyon, tous droits réservés

V.2. Simulating Ca2+ signals in a 3D geometry extracted from EM 143
individual channels γchPM, as the number of pumps is that of IP3R channels and as
the ER surface and cytosolic volume in the realistic mesh are roughly 5 and 12 timeslarger than in the cylinder mesh, respectively, the value of γ had to be adjusted forthis model and is 3× 10⁻²s−1.
V.2.2 Results
Simulations in realistic geometry reproduce spontaneous Ca2+ signalsmeasured experimentally
The simulations presented in section V.1 have the advantage of being performedin a simplified mesh, which results in a decreased computational cost of simula-tions. Moreover, the simplified mesh allows the study of the effect of geometricalparameters, which can be easily modified in the simple mesh, as e.g decreasing thedistance between the ER and PM membranes (see e.g RER=30 VS 80 in Fig V.4).However, it is not clear to what extent the symmetries inherent to the geometryof the cylinder by itself can influence Ca2+ dynamics, in particular in simulationswith co-clustering of Ca2+ channels of the ER and of the plasma membranes. Toaddress those questions, we have carried out simulations in the realistic PAP meshpresented in Fig V.5B. Ca2+ peak duration and frequency are both qualitatively(Fig V.6A3, B2, C2) and quantitatively (Fig V.6D) similar to experimental mea-surements of Ca2+ dynamics in mice hippocampal organotypic culture (Fig V.6A)and to simulations in the simplified cylinder (’Cyl.’) geometry (Fig V.6B). Peakamplitude, expressed as ∆F/F, is lower in the realistic mesh than in the ”GCaMP”simulations in the cylinder mesh (’Cyl.’, p-value=0.002 **) and than experimentaltraces (’Expe.’, black bar, p-value=0.012 *). This difference might be due to thelower basal [Ca-GCaMP] in ’Real’ compared to ’Cyl’ simulations. This hypothesiscould be tested by modifying the value of γ in ’Real’ simulations in order to reachthe same basal [Ca-GCaMP] in ’Real’ than in ’Cyl’ simulations.
Our first result is that, with no IP3R clustering (η=1) and with no co-clusteringof Ca2+ sources (cocl=0), simulations in the realistic PAP mesh are similar to sim-ulations in the simplified cylinder mesh.
Cette thèse est accessible à l'adresse : http://theses.insa-lyon.fr/publication/2019LYSEI093/these.pdf © [A. Denizot], [2019], INSA Lyon, tous droits réservés

144 V. Modeling spontaneous Ca2+ signals in realistic 3D geometries
Figure V.6: Simulations in a realistic 3D PAP geometry reproduce experimental as-trocytic Ca2+ traces. (A) Experimental monitoring of the spontaneous local Ca2+ signalsin astrocytic sponge-like processes. Panel A1 shows a ’summed projection’ of a confocal timelapse image stack of a GCaMP6s-expressing astrocyte. Panel A2 illustrates magnification ofthe boxed region of panel A1. Panel A3 displays spontaneous Ca2+ traces from the regions ofinterest shown in (A2). (B) The 3d simplified geometry used in section V.1 (B1) and represen-tative spontaneous Ca2+ traces from simulations of the ”GCaMP” model (B2). (C ) Screenshotof the 3d mesh extracted from electron microscopy, of similar length than the simplified PAPgeometry from Panel (B) and representative Ca2+ traces from simulations of the model (C2).(D) Quantitative comparisons of the spontaneous Ca2+ signals measured experimentally (blackbars) with simulations in the cylinder (’Cyl.’) or realistic (’Real.’) PAP meshes (white bars). Inthose simulations, η=1 and cocl=0, i.e IP3R and γchPM
channels are randomly distributed onthe ER and plasma membrane, respectively. Data are presented as mean ± standard deviationover 20 simulations. Significance is assigned by * for p ≤ 0.05, ** for p ≤ 0.01, *** forp ≤ 0.001.
Cette thèse est accessible à l'adresse : http://theses.insa-lyon.fr/publication/2019LYSEI093/these.pdf © [A. Denizot], [2019], INSA Lyon, tous droits réservés

V.2. Simulating Ca2+ signals in a 3D geometry extracted from EM 145
Effect of IP3R (co-)clustering on spontaneous Ca2+ signals in a realisticPAP mesh
As ’Cyl’ simulations revealed that increased IP3R cluster size, when associatedwith the co-clustering of IP3R channels with other Ca2+ sources, results in anincrease of both peak frequency and amplitude (Fig V.7D), we have investigatedwhether this effect could still be observed in ’Real’ simulations. The first noticeableresult is that the effect of cluster size η when cocl=1 observed in ’Cyl’ simulationsis not observed in ’Real’ simulations (see Fig V.7B). Note that, similarly to ’Cyl’simulations where RER = 30, no effect of IP3R cluster size was observed in ’Real’simulations when cocl=0 (not shown). Furthermore, even when Ca2+ sources wereco-clustered (cocl=1), contrary to the results in the cylinder mesh (see Fig V.4) ηhad no significant impact on peak amplitude (Fig V.7C1), frequency (Fig V.7C2)or duration (Fig V.7C3).
Overall, our simulations reveal that the effects of molecular distributions andco-clustering that were observed in the cylinder mesh no longer hold in a more re-alistic geometry. This could be due to the more complex geometry of the ER inthe realistic mesh, which results in smaller areas of ER that are close to the plasmamembrane compared to the cylinder mesh (see Fig V.4). Those results shed lightto the importance of the mesh that is chosen to perform simulations to investigateCa2+ dynamics in PAPs.
As ’Cyl’ simulations revealed that a decreased ER-PM distance at cluster sites(RER=80 VS 30) was associated with higher peak amplitude and frequency (seeFig V.4C), we have investigated whether those effects could be observed in ’Real’simulations. To do so, the closest ER sites to plasma membrane in the realistic meshwere selected (see section V.2.1). IP3R clusters were positioned at those sites, thusdecreasing ER-PM distance at cluster (and co-cluster) sites (see Fig V.8A, ’ER-PMcl’ VS ’random cl’), approximating the RER = 80 geometry in the cylinder mesh(see section V.1). No significant difference was observed between ’ER-PM cl’ and’random cl’ conditions, suggesting that, in the realistic mesh, the ER-PM contactsites are not large enough to impact Ca2+ peak amplitude and frequency.
Here again, our simulations demonstrate that the geometrical effects, here ofER-PM distance at cluster site, observed in ’Cyl’ simulations are no longer observedin ’Real’ simulations. Particular care should be taken when choosing a simplifiedgeometry in order to limit or at least be aware of the potential effects of its inherentgeometry on the dynamics of the system.
Overall, simulations in a realistic mesh extracted from electron microscopy dis-played similar Ca2+ dynamics to experimental data as well as to simulations in thecylinder mesh from section V.1 (Fig V.6). However, simulations did not reproduce
Cette thèse est accessible à l'adresse : http://theses.insa-lyon.fr/publication/2019LYSEI093/these.pdf © [A. Denizot], [2019], INSA Lyon, tous droits réservés

146 V. Modeling spontaneous Ca2+ signals in realistic 3D geometries
Figure V.7: Effect of IP3R clustering on spontaneous Ca2+ dynamics in a realistic PAPgeometry. (A) Screenshots displaying simulations with 5 clusters of size 50 (η = 50), with (A2)and without (A1) co-clustering of Ca2+ sources (cocl=1 or 0, respectively). When cocl=1, eachcluster of IP3R-independent Ca2+ sources, γchPM
, is placed on the plasma membrane area thatis the closest to the IP3R cluster (white arrow) to which it is co-localized. Note that the sizeof molecular species has been increased in those screenshots for a better visualization of theirlocalization. (B) Quantification of the effect of IP3R cluster size η on Ca2+ peak amplitude(B1), frequency (B2) and duration (B3) in the cylinder (black, RER=30, see section V.1)and realistic (red, see Fig V.5) meshes, cocl=1, DCa=13µm2.s−1. (C ) Comparison of Ca2+
peak amplitude (C1), frequency (C2) and duration (C3) with or without co-clustering of Ca2+
sources (cocl=1 or 0, respectively). Data are presented as mean ± standard deviation over 20simulations. Significance is assigned by * for p ≤ 0.05, ** for p ≤ 0.01, *** for p ≤ 0.001.
Cette thèse est accessible à l'adresse : http://theses.insa-lyon.fr/publication/2019LYSEI093/these.pdf © [A. Denizot], [2019], INSA Lyon, tous droits réservés

V.2. Simulating Ca2+ signals in a 3D geometry extracted from EM 147
Figure V.8: Clustering at ER-PM contact sites does not impact spontaneous Ca2+
signals. (A) Screenshots displaying simulations with 5 clusters of size 50 (η = 50, whitearrows), with co-clustering of Ca2+ sources (cocl=1), i.e each cluster of IP3R-independentCa2+ sources, γchPM
, is placed on the plasma membrane area that is the closest to the IP3Rcluster to which it is co-localized. ’Random cl’ (A1) corresponds to random distribution ofIP3R clusters onto the ER membrane. ’ER/PM cl’ (A2) corresponds to the positioning of IP3Rclusters at the closest ER-PM contact sites. Note that the size of molecular species has beenincreased in those screenshots for a better visualization of their localization. (B) Quantificationof Ca2+ signal amplitude (B1), frequency (B2) and duration (B3) for ’Random cl’ (black)and ’ER/PM cl’ (red) conditions. Data are presented as mean ± standard deviation over 20simulations. Significance is assigned by * for p ≤ 0.05, ** for p ≤ 0.01, *** for p ≤ 0.001.
Cette thèse est accessible à l'adresse : http://theses.insa-lyon.fr/publication/2019LYSEI093/these.pdf © [A. Denizot], [2019], INSA Lyon, tous droits réservés

148 V. Modeling spontaneous Ca2+ signals in realistic 3D geometries
the effect of spatial parameters that were observed in the cylinder mesh. Morespecifically, no effect of IP3R clustering was observed, even when co-clustered withother Ca2+ sources and when IP3R channels were clustered at the closest ER-PMcontact sites in the realistic mesh. Those results underline the importance of thegeometry chosen to investigate the phenomenon of interest.
V.2.3 Discussion
The differences observed between the cylinder VS realistic meshes regarding theeffect of ER-PM contact sites on Ca2+ signals may be due to the different ER ge-ometries in those two meshes. Indeed, the average distance of ER triangles to theclosest plasma membrane triangle is 168 ± 88 nm in the realistic mesh while it is70nm and 20 nm in cylinder meshes with RER=30 and 80, respectively (when onlyconsidering the surface on which IP3R clusters were positioned). Thus, the distancethat separates co-clusters of IP3R and γchPM
channels in the realistic mesh is 2 timeslarger than in the cylinder mesh, which increases the probability of Ca2+ to diffuseaway from the co-cluster site. Moreover, when IP3R clusters are positioned at theclosest ER-PM contact sites in the realistic mesh, the average distance of ER tri-angles to the closest plasma membrane goes from 19 nm (η=1) to 35.8 ± 7.6 nm(η=50). Those distances are closer to those observed in the cylinder mesh. How-ever, the cylinder geometry potentially allowed to create more efficient moleculartraps than the ER geometry of the realistic mesh, because of the larger area of ERbeing in close contact with the PM. Overall, the results presented in this sectiondemonstrate that a small ER-PM distance (e.g 19nm here) by itself is not enough togenerate Ca2+ hotspots and that further parameters might be at stake to enhancelocal Ca2+ activity. Those parameters could involve an increased surface of ER closeto plasma membrane at the contact site, increased local Ca2+ buffering or any otherparameter that could result in a decreased effective DCa at cluster site. Preliminarysimulations were thus performed with an effective Ca2+ coefficient of diffusion DCa
decreased by an order of magnitude (1.3µm2.s−1 instead of 13 µm2.s−1), which mim-ics the effect of Ca2+ buffering (see section IV.2.3 for further discussion). Ca2+ peaksin those simulations were characterized by increased peak amplitude (ANOVA, p-value=0.024 *) and frequency (ANOVA, 0.0099 **) with cluster size η with bothcocl=0 and cocl=1 (ANOVA, p-value=0.0008 *** and p-value<0.0001 *** for peakamplitude and frequency, respectively). Those results suggest that Ca2+ buffering,in particular when associated with the co-clustering of Ca2+ sources, influences Ca2+
dynamics, thus confirming the results from the 2D simulations (see Fig IV.4).
In order to get a better approximation of molecular localization and interactions
Cette thèse est accessible à l'adresse : http://theses.insa-lyon.fr/publication/2019LYSEI093/these.pdf © [A. Denizot], [2019], INSA Lyon, tous droits réservés

V.2. Simulating Ca2+ signals in a 3D geometry extracted from EM 149
in the ’Real’ simulations, quantified data on the size of IP3R channels as well asthe spacing within and between IP3R clusters are necessary. For example, as IP3Rchannels are ≈ 25 nm long, the minimal distance between the barycenters of twoadjacent IP3R channels would be at the very least 25nm, most probably higher.Furthermore, IP3R inter-cluster distance is thought to be ≈ 200nm on average [480]or even > 300-400nm [481]. Wiltgen et al [481] further reported that intra-clusterdistance between adjacent IP3R was > 100nm. The total area of ER in our 3D mesh(Fig V.5) does not allow to both comply with those geometrical rules and with thesupposed IP3R density proposed by Wiltgen et al. For example, the total ER areashould be larger than 2.1 × 10⁵nm2 for having only 4 clusters of size 2, while thecurrent area of the ER in the mesh is 1.76×10⁵nm2 in our the cylinder geometry, onwhich 50 IP3R channels must be positioned. This is also incompatible with having250 IP3R channels on the ER membrane of 8.91 × 10⁵nm2 of the realistic mesh.The predictions from Wiltgen et al might be wrong and over-estimate inter- andintra-cluster distances as they were based on 2D images. This nevertheless pointsout that further experimental investigation is needed to get a better approximationof both the density and intracellular distribution of IP3R channels in fine processes.
A straightforward extension of this work would be to investigate Ca2+ dynamicsupon neuronal stimulation, depending on neuron-astrocyte geometrical interaction.We have started to investigate the encoding of IP3 infusion at the tip of the pro-cess, emulating neuronal stimulation (Fig V.9A). For both cocl=0 and 1, increasingneuronal stimulation results in mild increase of Ca2+ peak amplitude (Fig V.9B1)and strong increase of peak frequency (Fig V.9B3). Overall, our simulations predictthat neuronal stimulation of astrocytes is mostly encoded in frequency modulation(FM) of Ca2+ signals, although further investigation is necessary to confirm thispreliminary result.
To go further, C. Calì [32] has provided us with a mesh that includes markers ofindividual PSDs at the vicinity of processes (see Fig V.10A). The mesh reveals thatperi-synaptic processes are extremely diverse regarding their intracellular content:some contain ER only, mitochondria only, both or are devoid of intracellular stores(Fig V.10B). This diversity could be responsible for part of the diversity of Ca2+
signals in PAPs. Simulations within those different types of processes upon neuronalstimulation will help investigate this hypothesis.
Cette thèse est accessible à l'adresse : http://theses.insa-lyon.fr/publication/2019LYSEI093/these.pdf © [A. Denizot], [2019], INSA Lyon, tous droits réservés

150 V. Modeling spontaneous Ca2+ signals in realistic 3D geometries
Figure V.9: Neuronal stimulation is encoded in amplitude and frequency of Ca2+
signals in PAPs. (A) Schematic representation of simulations of neuronal-induced Ca2+
signals in the realistic mesh. At time t=t0=1s, IP3inf molecules of IP3 (the number variesupon simulation) are injected at the tip of the astrocytic process, which models the effect ofneuronal stimulation. IP3R clusters are indicated with white arrows. (B) Quantification ofpeak amplitude (∆F/F , B1), frequency (µm2.s−1, B2) and duration (s, B3), for differentcluster sizes η, with co-clustering (cocl=1), with IP3inf=0 (black), 50 (red) or 100 (blue) IP3
molecules infused at t=1s. One-way ANOVA was performed to investigate the effect of thenumber of IP3 molecules infused (i.e the intensity of neuronal stimulation) on peak amplitude,duration and frequency. Significance is assigned by * for p ≤ 0.05, ** for p ≤ 0.01, *** forp ≤ 0.001.
V.3 Discussion
Controversies regarding the presence of ER in PAPs
Both meshes used in this study (Fig V.2B and Fig V.5B) correspond to geome-tries of an astrocytic process that contains ER. However, during the past few years,fine astrocytic processes have been regarded as devoid of ER [33, 430]. Thus, themesh extracted from electron microscopy used in section V.2 on its own (Fig V.5B)contradicts this strong belief in the field. Moreover, a recent EM study has alsoobserved that ER dynamically ramifies in astrocyte perivascular processes in vivo
Cette thèse est accessible à l'adresse : http://theses.insa-lyon.fr/publication/2019LYSEI093/these.pdf © [A. Denizot], [2019], INSA Lyon, tous droits réservés

V.3. Discussion 151
Figure V.10: Mesh extracted from electron microscopy revealing PSDs at the vicinityof PAPs. (A) Screenshot revealing the same 3D mesh extracted from electron microscopy thatwas presented in Fig V.5 but with further information on mitochondria localization (purple) andon the presence and size of neighboring neuronal PSDs (red). (B) Zoom on some peri-synapticprocesses, illustrating their diversity in terms of intracellular stores.
and detected contact sites between ER processes and plasma membrane [30]. Suchcontiguous membranous juxtapositions would definitely validate the presence of ERin PAPs.
Although dynamical ER remodeling has been reported in dissociated astrocyteculture [568], technical limitations have prevented direct investigation of ER local-ization within PAPs in vivo or in slices. Super-resolution microscopy of cellularER and mitochondrial dynamics and structure (resolution ≈ 100nm) has recentlybeen developed and could help answer those questions [569, 570]. Correlative super-resolution fluorescence imaging and electron microscopy approaches can yield a res-olution of less than 50 nm (down to 10nm) [571], which is very promising avenue toPAPs ultrastructure investigation. ER-bound GECIs, OER-GCaMP6f, have beenrecently developed and, combined with the use of ER luminal Ca2+ indicators suchas G-CEPIA1er [175], could help investigate the involvement of Ca2+ channels onthe ER membrane in Ca2+ dynamics depending on subcellular localization in as-trocytes [168]. Further investigation regarding ER sub-cellular localization, its sub-compartmentalization and dynamics in vivo are crucial for better understandingastrocyte information processing.
Cette thèse est accessible à l'adresse : http://theses.insa-lyon.fr/publication/2019LYSEI093/these.pdf © [A. Denizot], [2019], INSA Lyon, tous droits réservés

152 V. Modeling spontaneous Ca2+ signals in realistic 3D geometries
Controversies regarding the existence of spontaneous Ca2+ signals in as-trocytes
The simulations presented in Chapters IV and V aim at better understandingspontaneous Ca2+ activity in small volumes such as PAPs. The existence of spon-taneous Ca2+ signals in astrocytes is actually by itself a matter of debate. Evenin the absence of presynaptic neural activity, presynaptic axon terminals do proba-bilistically release neurotransmitter vesicles, generating so-called miniature EPSCs.Bafilomycin application has been used in several experimental studies to investi-gate the dependence of astrocytic Ca2+ signals on EPSCs, because this inhibitor ofV-ATPases inhibits miniature EPSCs by blocking the refill of presynaptic vesicles.However, the impact of bafilomycin bath application on the frequency of sponta-neous Ca2+ signals in astrocytes has proven variable (compare e.g. Sun et al [572],Arizono et al [9] and Agarwal et al [573]). As bafilomycin has a wide range of ef-fects on Ca2+ signaling that is independent of its effect on the refill of presynapticneurotransmitter vesicles [574, 575], we cannot conclude whether those signals aretriggered by EPSCs. Further investigation is needed to decipher whether the "spon-taneous" Ca2+ signals reported in astrocyte processes are due to spontaneous releaseof presynaptic vesicles or rely on a synapse-independent mechanism inherent to theCICR system.
ER-PM contact sites, privileged sites of Ca2+ signaling
A decade ago, Marchaland et al [576] proposed that localized Ca2+ signals inastrocytes could be mediated by contact sites between ER and plasma membranes(ER-PM contact sites). A more recent EM study from Boulay et al [30] has revealedthe presence of ER-PM contact sites in perivascular astrocytic processes. Actually,ER-PM contact sites can be observed in all cell types and represent 2-5% of the PMsurface [577] (for reviews, see e.g [578, 579]). ≈ 1000 ER-PM contact sites of variousgeometries can exist per cell. Moreover, a recent study on HeLA cells has reportedthat most Ca2+ signals occured at ER-PM contact sites [480], which were populatedwith immobile IP3R clusters of size 2-9. Whether such an organization exists inastrocytes is still to be uncovered. Finally, TIRF microscopy experiments haverevealed that ER-PM contact sites often form at the same location in a given cell,suggesting that they constitute stable structures [580]. Those observations, added tothe diversity of Ca2+ dynamics observed in our model depending on the geometry oftheir ER-PM contact sites, suggest that ER-PM contact sites are privileged sites ofCa2+ dynamics so that it is crucial to better estimate their localization in astrocytes.
Cette thèse est accessible à l'adresse : http://theses.insa-lyon.fr/publication/2019LYSEI093/these.pdf © [A. Denizot], [2019], INSA Lyon, tous droits réservés

V.3. Discussion 153
The presence of ER-PM contact sites in the gliapil near synapses could enhance localCa2+ activity and thus influence neuron-astrocyte communication.
Conclusion
In this chapter, a 3D voxel-based implementation of the 2D particle-based modelpresented in Chapter IV has been presented. Simulations of the model, both in asimplified and in a realistic mesh of a fine astrocytic process, were able to reproducespontaneous astrocytic Ca2+ transients measured in Ca2+ micro-domains. Further-more, our simulations predict that local variations of the concentration of Ca2+
buffers might contribute to the diversity of Ca2+ signals observed in astrocytes.Simulations in the simplified 3D geometry confirmed the results from the 2D im-plementation of the model (see Fig IV.5) that increased IP3R cluster size, whenassociated with their co-clustering with other Ca2+ sources, results in an increase ofboth Ca2+ peak frequency and amplitude. Furthermore, the model suggests that,in 3 spatial dimensions, those effects are particularly enhanced at ER-PM contactsites. However, neither the effect of IP3R clustering nor that of ER-PM contactsites were observed in the realistic mesh. As most models of astrocytic processesuse cylinder geometries, our results suggest that the characteristics of their Ca2+
dynamics might strongly rely on the geometry of their mesh.
Cette thèse est accessible à l'adresse : http://theses.insa-lyon.fr/publication/2019LYSEI093/these.pdf © [A. Denizot], [2019], INSA Lyon, tous droits réservés

154 V. Modeling spontaneous Ca2+ signals in realistic 3D geometries
Cette thèse est accessible à l'adresse : http://theses.insa-lyon.fr/publication/2019LYSEI093/these.pdf © [A. Denizot], [2019], INSA Lyon, tous droits réservés

155
Chapter VI
Modeling the onset and propagationof neuronal activity-induced Ca2+
signals in processes
Our collaborators [9] (Fig VI.1) as well as other studies [7, 581] have observedCa2+ waves that propagate along astrocytic processes. Those waves can be triggeredby increased neuronal firing and are associated with mouse movements in vivo [7].The concomitant existence of both focal and spreading Ca2+ signals in astrocytes inresponse to neuronal activity rises questions on the mechanisms that trigger wavepropagation. In small volumes such as PAPs, cellular geometry could be a factorinfluencing the isolation and/or the propagation of Ca2+ events.
In this chapter, we investigate the effect of cellular and ER geometry on theonset and propagation of neuronal-induced Ca2+ signals, contrary to Chapters IVand V, that focused on spontaneous Ca2+ activity. This work has been performedin collaboration with U. V. Nägerl’s team from the Interdisciplinary Institute forNeuroscience, Université de Bordeaux, France. They have provided us with in vitrostructural data and Ca2+ imaging. Furthermore, C. Calì, KAUST University, SaudiArabia, has provided us with quantified structural data from electron miscroscopy,notably on the intracellular localization of Ca2+ stores in a hippocampal astrocyte.They have conducted all the experimental work presented in this chapter.
Cette thèse est accessible à l'adresse : http://theses.insa-lyon.fr/publication/2019LYSEI093/these.pdf © [A. Denizot], [2019], INSA Lyon, tous droits réservés

156VI. Modeling the onset and propagation of neuronal activity-induced
Ca2+ signals in processes
Figure VI.1: Spontaneous Ca2+ waves propagate along astrocytic processes in thegliapil. This figure, taken from Arizono et al [9], presents time-lapse images of a Ca2+ wavepropagating in an astrocytic process located in the gliapil. Ca2+ signals are expressed as∆F/F0, as shown by the color scale bar.
VI.1 Simulating the propagation of Ca2+ signals inprocesses displaying node/shaft geometries
VI.1.1 Experimental background
A recent experimental study from our collaborators [9] has revealed new aspectsof the morphological architecture of the astrocytic spongiform domain. The gliapilappears as a succession of bulbous structures, referred to as nodes, that are con-nected with thinner structures, referred to as shafts (Fig VI.2A). Quantification ofthe widths of shafts and nodes as well as inter-node distance based on STED mi-croscopy are presented in Fig VI.2B. ≈ 70% of Ca2+ signals stayed localized in onenode and did not propagate.
Cette thèse est accessible à l'adresse : http://theses.insa-lyon.fr/publication/2019LYSEI093/these.pdf © [A. Denizot], [2019], INSA Lyon, tous droits réservés

VI.1. Simulating the propagation of Ca2+ signals in processes displayingnode/shaft geometries 157
Figure VI.2: Super-resolution microscopy reveals node/shaft structures in the gliapil.Confocal (A1) and STED (A2) microscopy images revealing the geometry of the spongiformdomain of astrocytes consisting in successions of nodes and shafts. Quantification of thedistribution of shaft width (B1), inter-node distance (B2) and node width (B3). Note thatshaft width is often below the diffraction limit of conventional light microscopy (≈ 250 nm, grayrectangle) so that super-resolution microscopy is mandatory for resolving those ultrastructures.This figure was adapted from Arizono et al [9].
In this section, we investigate the influence of such a node/shaft geometry onspatiotemporal characteristics of Ca2+ signals. Notably, we look for parameters thatcould prevent the propagation of Ca2+ signals.
VI.1.2 Modeling approach and geometry
In order to investigate the effect of node/shaft geometries on signal propagation,we have built geometries with different node/shaft width ratios δ using Trelis soft-ware (https://www.csimsoft.com/trelis), with constant node width (see Fig VI.3).The geometry of a node was approximated as being a sphere of diameter 380 nm.Shaft geometry consisted in a 1µm long cylinder. Shaft diameter was defined rela-
Cette thèse est accessible à l'adresse : http://theses.insa-lyon.fr/publication/2019LYSEI093/these.pdf © [A. Denizot], [2019], INSA Lyon, tous droits réservés

158VI. Modeling the onset and propagation of neuronal activity-induced
Ca2+ signals in processes
Figure VI.3: Geometries designed for investigating node/shaft structures of the gli-apil. Geometries constructed with Trelis software (https://www.csimsoft.com/trelis) to simu-late node/shaft geometries of the gliapil for different width ratios δ between nodes and shafts(from δ = 1 to 3). Nodes are represented as spheres and shafts as cylinders. Conic geometrieswere fused to connect spheres and cylinders in order to get smoother and a bit more realisticgeometries. The geometries presented here contain 5 identical nodes and 4 identical shafts.
tive to node width. Indeed, if node/shaft width ratio, δ, was 1, then shaft diameterwas the same as node diameter, i.e 380 nm. Similarly, shaft diameter was 190 nmfor δ=2 and 127 nm for δ=3. Cones were added between spheres and cylinders tocreate a smoother transition between nodes and shafts. Note that the values usedhere for node diameter and shaft length are not the exact median values presentedin Fig VI.2 as they correspond to the first values that were provided by our collab-orators. They are however of the same order of magnitude so that the geometriespresented in Fig VI.3 constitute a reasonable approximation of the observed gli-apil ultrastructure presented in Fig VI.5. The ER geometry was considered to beidentical to the geometry of the process: node/shaft successions. ER nodes werealigned with cytosolic nodes and ER volume was 10% of total process volume (seeFig VI.4C). While creating the geometry, different sub-regions were defined so thatthey could later be monitored independently using STEPS.
VI.1.3 Simulations reproduce bleaching experiments
Experimental results
In order to investigate whether nodes, depending on node/shaft width ratioδ, could function as diffusionally isolated compartments such as demonstrated in
Cette thèse est accessible à l'adresse : http://theses.insa-lyon.fr/publication/2019LYSEI093/these.pdf © [A. Denizot], [2019], INSA Lyon, tous droits réservés

VI.1. Simulating the propagation of Ca2+ signals in processes displayingnode/shaft geometries 159
mushroom-like spines [582, 488], our collaborators have performed photobleachingexperiments (FRAP). Briefly, they applied 2-photon laser pulses on a region ofinterest (node or shaft) and recorded the fluorescence recovery with confocal imaging.After bleaching, the fluorescence level in the region of interest decreases to I0. Then,fluorescence increases, because of the diffusion of fluorescent molecules that werenot bleached into the region of interest, until it reaches a new steady state, Iinf .We characterize node isolation by measuring the time taken by molecules to diffuseinto the node, τ , which depends on the diffusion of fluorescent molecules. In otherwords, a high node isolation will be associated with a high value of τ . Thus, 3 mainparameters characterize bleaching traces: I0, τ and Iinf (see also Fig VI.4E). Theresults from Arizono et al [9] are presented in Fig VI.4A,B and indicate that a highnode/shaft width ratio δ can result in an increased recovery time τ and thus in anincreased isolation of nodes.
Modeling approach
To test whether node/shaft geometry by itself can reproduce the results frombleaching experiments presented in Fig VI.4A,B, we have simulated bleaching ex-periments within the geometries presented in Fig VI.3. As experiments measuredfluorescence mediated by ZSGreen molecules, ZSGreen molecules were added to sim-ulation space. After 2 seconds of simulation, providing basal level of fluorescence,60% of ZSGreen molecules were bleached. As our collaborators have bleached a nodeduring 10 ms, the volume that was impacted by the bleaching, because of molecu-lar diffusion, was larger than the bleached region. Thus, in order to fit I0 and Iinf
that were measured experimentally, bleached volume in simulations was adjusted de-pending on the geometry (see Fig VI.4C). Bleaching was simulated as the transitionfrom ZSGreen to ZSGreen-bleached, the latter being accounted as non-fluorescingmolecules. The number of ZSGreen molecules was recorded over simulation timeand a fit was performed following equation VI.1 to determine the values of I0, Iinf
and τ (see Fig VI.4E).
I(t) = I0 − (I0 − Iinf)e−t/τ (VI.1)
Parameters that were adjusted to fit experimental data were the coefficient of dif-fusion of ZSGreen and its concentration. In the simulations presented here, thecoefficient of diffusion of ZSGreen, DZSGreen, is 90 µm2.s−1 and [ZSGreen]=10 µM.
Cette thèse est accessible à l'adresse : http://theses.insa-lyon.fr/publication/2019LYSEI093/these.pdf © [A. Denizot], [2019], INSA Lyon, tous droits réservés

160VI. Modeling the onset and propagation of neuronal activity-induced
Ca2+ signals in processes
Figure VI.4: Simulations confirm that node/shaft width ratio is a good predictor of thediffusional isolation of nodes. (A) Left: Representative astrocytic processes with δ=2 (A1,node) and δ=1 (A2, shaft). (B) Fluorescence recovery after photobleaching (FRAP) tracesobtained from A1 and A2, respectively, illustrating fluorescence recovery normalized to basalfluorescence before bleaching. (C ) Geometries of different node/shaft ratios (δ = 1, 2 or 3)used in our simulations. Blue color represents the bleached volume (adapted to fit experimentalvalues of I0 and Iinf) and green the remaining parts of the geometry. Note that blue volume istransparent, revealing the geometry of the ER. (D) Representative experimental and simulationtraces for different node/shaft width ratios δ. (E ) Example trace presenting the evolution of thenumber of fluorescing ZSGreen molecules over time. Vertical red line presents bleaching time.The parameters that characterize a bleaching experiment and the equation that fits bleachingrecovery are presented in red. (F ) Quantification of I0 (F1), Iinf (F2) and τ (F3) values insimulations compared to experiments. Note that we were not provided with experimental datafor δ = 3. In F1 and F2, n=5×2 and 20×3 for experiments and simulations respectively. Dataare presented as mean ± STD. In F3, n=66 and n=20×3 for experiments and simulations,respectively. τ is positively correlated to δ in experiments (n=66 from 7 slices; Spearmanr=0.7179, p<0.0001) and simulations (n=60; Spearman r=0.7520, p<0.0001). Black andred lines represent linear regressions of τ as a function of δ for experiments and simulations,respectively.Cette thèse est accessible à l'adresse : http://theses.insa-lyon.fr/publication/2019LYSEI093/these.pdf
© [A. Denizot], [2019], INSA Lyon, tous droits réservés

VI.1. Simulating the propagation of Ca2+ signals in processes displayingnode/shaft geometries 161
Results
In order to test the influence of the diverse node/shaft width ratios δ observedexperimentally on the isolation of nodes and in order to test whether the geometriespresented in Fig VI.3 are a good approximation of the spongiform ultrastructureobserved by our collaborators (Fig VI.2), we have simulated a protocol of photo-bleaching (see section VI.1.3 for details). The major result of our simulations is thatbleaching traces in simulations are both qualitatively (Fig VI.4D) and quantitatively(Fig VI.4F) similar to experimental bleaching traces, for node/shaft width ratios δ=1and 2. Indeed, no significant difference of I0 (Fig VI.4F1), Iinf (Fig VI.4F2) and τ(Fig VI.4F3) was observed between simulations and experimental traces for δ=1 and2. Simulations were also performed with δ=3 in order to investigate the correlationbetween bleaching recovery time τ and node/shaft width ratio δ (Fig VI.4F3). Notethat in order to verify that the geometries presented in Fig VI.4C are a reasonableapproximation of node/shafts geometries observed experimentally (Fig VI.4A,B), wehave also verified that the model reproduced the basal noise amplitude of [ZSGreen]and its auto-correlation (not shown). Overall, simulation results suggest that τ , andthus node isolation, increases linearly with node/shaft width ratio, which confirmsexperimental results.
To conclude, our model successfully reproduces FRAP experiments and predictsthat geometries of high node/shaft width ratio δ by themselves can result in anincreased node isolation. As those geometries successfully reproduce experimentalresults, they can reasonably be considered as a good approximation of the ultra-structure of the gliapil observed with STED microscopy by our collaborators (seeFig VI.2).
VI.1.4 Investigating signal propagation in node/shaft geome-tries
Experimental results
Arizono et al [9] have further demonstrated that 90% of dendritic spines werein contact with nodes and shafts (see Fig VI.5). ≈ 70% of Ca2+ signals occurredand stayed localized in one node and did not propagate to the neighboring one (seeFig VI.5A, B), suggesting that node/shaft geometries insulate Ca2+ hotspots withinnodes that are in the vicinity of synapses. Furthermore, they have reported a huge
Cette thèse est accessible à l'adresse : http://theses.insa-lyon.fr/publication/2019LYSEI093/these.pdf © [A. Denizot], [2019], INSA Lyon, tous droits réservés

162VI. Modeling the onset and propagation of neuronal activity-induced
Ca2+ signals in processes
variety of spine coverage by astrocytic processes (see Fig VI.5C). Contacts werestable with time and 88% of contact sites were specific (only one node contacteda given spine). Overall, their results suggest that nodes are preferential sites ofneuron-astrocyte communication at synapses.
Modeling approach
In order to investigate the propagation of Ca2+ signals from nodes that contactneuronal spines, we have developed 2 different protocols:
• In the first protocol, 100 IP3 molecules were infused in Node 1 at the end ofthe node/shaft geometry, at t=t0, while the activity in the neighboring node(Node 2) was recorded(see Fig VI.6A). Simulations were performed in geome-tries with varying node/shaft width ratio δ (see Fig VI.3).
• In the second protocol, we have investigated signal propagation in the node/shaftgeometry depending on δ when several nodes were successively stimulated (seeFig VI.7A). At t=t0=5s, 50 molecules of IP3 were infused in Node 1, mimick-ing neuronal activation of the astrocytic node. After a time period τIP3, thesame amount of IP3 was then infused in Node 2, at t0 + 2τIP3 in Node 3 andt0 + 3τIP3 in Node 4. During the whole simulation time, Ca2+ activity wasrecorded in Node 5.
In both protocols, the kinetic scheme of the model and the corresponding param-eter values were the same as the 3D ”GCaMP” model, presented in section V.1. Thegeometries correspond to those presented in Fig VI.3. Nodes and shafts were di-vided into separate regions of interest so that they could be stimulated and analyzedseparately.
Results
Investigating node to node signal propagation
As the experimental results presented in Fig VI.5 suggest that nodes are preferen-tial sites of neuron-astrocyte communication, we have next investigated the influenceof node/shaft width ratio δ on wave propagation in the context of neuronal-inducedastrocytic Ca2+ activity. To do so, we have first investigated the propagation of a
Cette thèse est accessible à l'adresse : http://theses.insa-lyon.fr/publication/2019LYSEI093/these.pdf © [A. Denizot], [2019], INSA Lyon, tous droits réservés

VI.1. Simulating the propagation of Ca2+ signals in processes displayingnode/shaft geometries 163
Figure VI.5: Nodes of the gliapil often interact with dendritic spines. Figure adaptedfrom Arizono et al [9]. (A) Confocal astrocytic Ca2+ signal mapped onto a dendritic spinemorphology, visualized with STED. (B1) Representative STED image of the morphological in-teractions between a GCaMP6s-expressing astrocyte (green) and a neighboring YFP-expressingneuron (magenta). (B2) Representative spontaneous Ca2+ traces from the 5 ROIs shown inpanel B1 (white circles). (C1) Representative images of spine/node (left), spine/shaft contacts(middle) and spines that do not contact any astrocytic structure (right). (C2) Distribution ofspines that contact nodes, shafts or no astrocytic structure (n = 188 from 21 slices). (C3) Rep-resentative image of extracellular space (black) surrounding a synapse (grey) and a neighboringastrocyte (yellow).
Cette thèse est accessible à l'adresse : http://theses.insa-lyon.fr/publication/2019LYSEI093/these.pdf © [A. Denizot], [2019], INSA Lyon, tous droits réservés

164VI. Modeling the onset and propagation of neuronal activity-induced
Ca2+ signals in processes
signal from one node (Node 1) to the neighboring node (Node 2) (see the proto-col described in Fig VI.6A). Representative Ca2+ traces in Node 2 are displayed inFig VI.6B, which illustrate the variability of Ca2+ signals depending on node/shaftwidth ratio δ=1, 2 and 3. Our first noticeable result is that the delay betweenthe stimulation of Node 1 and peak onset in Node 2 decreases with δ (Fig VI.6C),which suggests that signals propagate faster in geometries of increased node/shaftwidth ratio. Moreover, the probability of signal propagation to Node 2 increaseswith δ, which suggests that signal propagation is facilitated in geometries with highnode/shaft width ratio δ.
As IP3R molecules in this model were uniformly distributed onto the ER mem-brane and as the area of the ER varied between the geometries δ=1, 2 and 3, thetotal number of IP3R molecules varied depending on δ. The total number of IP3Rmolecules thus equaled 620, 363 and 283, for δ=1, 2 and 3, respectively, although theIP3R density remained the same in the geometry. To verify whether our results area consequence of the total number of IP3R molecules rather than of the geometries,we have performed additional simulations in which IP3R molecules were located onthe ER surface within nodes only. As nodes display exactly the same area in allgeometries δ=1, 2 and 3, the total number of IP3R molecules was identical regard-less of the geometry. Results were not significantly different from results presentedin Fig VI.6, confirming that the node/shaft width ratio δ influences the speed andprobability of signal propagation.
Overall, our results suggest that an increased node/shaft width ratio, althoughit diffusionally isolates nodes, favors higher probability and speed of Ca2+ signalpropagation.
Investigating signal propagation resulting from successive node stim-ulations
Our collaborators have observed that 55% of spines were connected to nodes(Fig VI.5) and that when Ca2+ signals propagated in several nodes, those nodeswere often associated with spines that belonged to the same dendrite. The fre-quency of node stimulation is believed to vary drastically depending on whethernodes are contacted by spines from the same dendrite or by spines that belong todifferent dendrites or even different neurons. In order to test the impact of such avariability of the frequency of the stimulation of neighboring nodes, we have per-formed simulations in which neighboring nodes were successively stimulated aftera time period τIP3 that varied from 50 ms to 5s (see protocol in Fig VI.7A). Rep-resentative Ca2+ traces in Node 5 are presented in Fig VI.7B and illustrate theirvariability depending on node/shaft width ratio δ. Our first result in that, similarlyto results presented in Fig VI.6, the time to 1st peak in Node 5 significantly de-creases when δ increases, whatever the value of τIP3 (Fig VI.7C). More specifically,
Cette thèse est accessible à l'adresse : http://theses.insa-lyon.fr/publication/2019LYSEI093/these.pdf © [A. Denizot], [2019], INSA Lyon, tous droits réservés

VI.1. Simulating the propagation of Ca2+ signals in processes displayingnode/shaft geometries 165
Figure VI.6: Study of the effect of node/shaft width ratio on signal propagation fromone node to a neighboring node. (A1) Schematic representing the approach that has beendeveloped for investigating the propagation of a neuronal-induced Ca2+ signal from node 1 tonode 2. Node 1 was stimulated (IP3 molecules infusion in node 1) at t=t0 while Ca2+ activitywas recorded in Node 2. (B) Representative Ca2+ traces in Node 2 for δ= 1 (red), 2 (black)and 3 (blue). (C ) Time to 1st peak in Node 2 after stimulation time of Node 1, t0, significantlydecreases with δ (ANOVA, p-value=0.005 **). (D) The percentage of signals that propagateto Node 2 significantly increases with δ (ANOVA, p-value < 0.0001 ***).
time to 1st peak is significantly higher for δ=1 compared to both δ=2 and δ=3, whiledifferences between δ=2 and 3 are not as striking (see Fig VI.7C). Note that thedifference between δ=1 and δ=2 or 3 increases with the delay between successivenode stimulation, τIP3. This suggests that geometries with δ=1 better discriminateslow from fast frequency of node stimulation compared to geometries with δ=2 or3. Note that Ca2+ signals were often saturated (Fig VI.7B), potentially displaying anon-physiological behavior. Indeed, Ca2+ signals lasted more than 15-20s and peakswere not terminating at the end of simulation time. This effect could be due to ourboundary conditions (reflective), which do not replicate the potential diffusion ofmolecules away from the process.
As simulations from Fig VI.6 suggested that the probability of signal propagationfrom one node to the neighboring one is lower in geometries with δ=1 compared toδ=2 or 3, we have investigated whether this effect is still visible when neighboringnodes are successively stimulated. Similarly to the results from Fig VI.6, geometries
Cette thèse est accessible à l'adresse : http://theses.insa-lyon.fr/publication/2019LYSEI093/these.pdf © [A. Denizot], [2019], INSA Lyon, tous droits réservés

166VI. Modeling the onset and propagation of neuronal activity-induced
Ca2+ signals in processes
with δ=1 are characterized by a lower probability of signal propagation. Moreover,the probability of signal propagation decreases as τIP3 increases for δ=1 (Fig VI.7D).This suggests that geometries with δ=1 can prevent the propagation of signals incase of successive node stimulation when the frequency of stimulation is low (τIP3 >2s).
In accordance with results presented in Fig VI.6, those results suggest that in-creased node/shaft width ratio δ is associated with both an increased probability ofsignal propagation as well as an increased propagation speed.
Together, our results suggest that geometries with δ=1 can prevent or at leastdecrease the probability of signal propagation in case of single node stimulation orif the frequency of stimulation of successive nodes is low (time period > 2s). As lowτIP3 might reflect neuronal stimulation from the same dendritic tree while high τIP3
would characterize signals from different neuronal populations, our results suggestthat geometries with low node/shaft width ratio (δ=1) might decrease both theprobability and speed of signal propagation when neighboring nodes are stimulatedby different neuronal populations.
VI.1.5 Investigating the influence of node branching on thepropagation of Ca2+ signals
Experimental background
Rather than presenting an aligned geometry in which one node connects 2 neigh-boring ones like the geometries that were used so far in this study (see Fig VI.3),nodes in the gliapil often consisted in branching points or even formed rings (seeFig VI.8 A, B, respectively). Arizono et al [9] indeed revealed that 75% of nodesconsist in branching points (Fig VI.8A3).
In the study presented in this section, we have investigated the effect of suchbranching points or ring geometries on Ca2+ signal propagation.
Modeling approach
In order to investigate the effect of branching at nodes, geometries with the samenumber of shafts and nodes (4 each) but with different branching properties weredesigned. Some geometries consisted in linear nodes, without any branching points(Fig VI.8C1), referred to as ’Align’, others possessed one branching point at node
Cette thèse est accessible à l'adresse : http://theses.insa-lyon.fr/publication/2019LYSEI093/these.pdf © [A. Denizot], [2019], INSA Lyon, tous droits réservés

VI.1. Simulating the propagation of Ca2+ signals in processes displayingnode/shaft geometries 167
Figure VI.7: Study of the effect of node/shaft width ratio on signal propagationupon successive neuronal stimuli. (A) At t=t0, Node 1 was stimulated. Then, τIP3 definesthe frequency at which a new node stimulation occurs so that node 2 is stimulated at timet0 + τIP3, node 3 at t0 + 2τIP3 and node 4 at t0 + 3τIP3. Ca2+ activity is recorded in node5. (B) Representative Ca2+ traces for δ= 1 (red), 2 (black) and 3 (blue), with τIP3=250msand 3000ms. (C ) Time to 1st peak significantly increases with τIP3 for δ=1 (ANOVA, p-value=0.00016 ***, red), δ=2 (ANOVA, p-value < 0.0001 ***, black) and δ=3 (ANOVA,p-value < 0.0001 ***, blue). T-tests revealed that for any value of τIP3, time to 1st peak issignificantly higher for δ=1 compared to both δ=2 and δ=3. Time to 1st peak is not significantlydifferent for δ=2 compared to δ=3, except for τIP3=250 (p=0.032 *), 500 (p=0.0025 **),1000 (p=0.034 *), 4000 (p=0.016 *) and 5000 (p=0.019 *) ms. (D) The probability of signalpropagation, expressed as the percentage of signals that propagated to Node 5, is significantlylower for δ = 1 compared to δ=2 and 3. The probability of signal propagation decreases asτIP3 increases for δ = 1 (ANOVA, p-value < 0.0001 ***).
Cette thèse est accessible à l'adresse : http://theses.insa-lyon.fr/publication/2019LYSEI093/these.pdf © [A. Denizot], [2019], INSA Lyon, tous droits réservés

168VI. Modeling the onset and propagation of neuronal activity-induced
Ca2+ signals in processes
Figure VI.8: Experimental analysis of node branching and designed geometries. (A, B)Experimental data. (A) Several shafts often branch from a single node. (A1) RepresentativeSTED images revealing branching at nodes (’Branched’). (A2) Representative node withoutbranching points (’En passant’). (A3) Quantification of the proportion of ’Branched’ VS ’Enpassant’ nodes (n = 261 from 14 slices). (B) STED images revealing ring-like geometries inthe gliapil. (B1) Representative ring structures observed in the gliapil. (B2) Orthogonal viewsof a representative ring structure, demonstrating a ring shape rather than a cup shape. Scalebar: 500 nm. (B3) 3D reconstruction of the ring presented in panel B2. (C ) Geometries with4 nodes and 4 shafts of the same size were built with linear nodes (C1, ’Align’), branched (C2,’Branching’) or forming a ring (C3, ’Ring’). Each geometry was built for node/shaft widthsratios δ=1, 2 and 3.
Cette thèse est accessible à l'adresse : http://theses.insa-lyon.fr/publication/2019LYSEI093/these.pdf © [A. Denizot], [2019], INSA Lyon, tous droits réservés

VI.1. Simulating the propagation of Ca2+ signals in processes displayingnode/shaft geometries 169
1 (Fig VI.8C2), referred to as ’Branching’ and some formed rings (Fig VI.8C3), re-ferred to as ’Ring’. All geometries were built for node/shaft width ratios δ=1, 2 or3.
At t=t0=5s, 25 IP3 molecules were infused in Node 1, mimicking neuronalstimulation. Similarly to the previous study (section VI.1.4), after a time periodτIP3=100ms, the same amount of IP3 was then infused in Node 2 and then at t0+2τIP3
in Node 3. During the whole simulation time, Ca2+ activity was recorded in Node4. The kinetic scheme of the model and the corresponding parameter values werethe same as the 3D ”GCaMP” model, presented in section V.1.
Results
As ≈ 75% of nodes of the gliapil consist in branching points (Fig VI.8), we haveinvestigated the propagation and characteristics of Ca2+ signals in structures withdifferent levels of branching: ’Align’, ’Branching’ and ’Ring’ (see section VI.1.5 formore details). Fig VI.9A presents representative Ca2+ traces in Node 4 for δ=1,2 and 3 in ’Align’ (Fig VI.9A1, black), ’Branching’ (Fig VI.9A2, red) and ’Ring’(Fig VI.9A3, blue) geometries, which suggest that ’Align’, ’Branching’ and ’Ring’geometries are associated with different Ca2+ dynamics. Here again, simulationsreveal that the time to 1st Ca2+ peak in Node 4 after the stimulation of Node 1, att0, decreases with node/shaft width ratio δ (Fig VI.9B1). Interestingly, time to 1st
peak is increased in ’Ring’ simulations compared to ’Align’ and ’Branching’, i.e thespeed of signal propagation is significantly decreased in ’Ring’ geometries, especiallyfor δ=2 and 3 (Fig VI.9B1).
As the probability of signal propagation in Fig VI.6 increased with δ in alignedgeometries, we have investigated whether this phenomenon could still be observed inbranched and ring-like geometries and if branching was somehow impacting signalpropagation. Similarly to the results presented in Fig VI.6 and Fig VI.7, an in-creased δ is also associated with a higher probability of signal propagation to Node4, for ’Align’, ’Branching’ as well as ’Ring’ geometries (Fig VI.9B2). Note that inaddition to a decreased propagation speed, ’Ring’ geometries are also associatedwith a lower probability of signal propagation to Node 4 compared to ’Align’ and’Branching’ geometries (Fig VI.9B2).
As Ca2+ traces presented in Fig VI.9A displayed diverse Ca2+ peak charac-teristics depending on the geometry, we have next investigated the effect of nodebranching and of ring-like structures on peak amplitude and duration. Our resultssuggest that both peak amplitude (Fig VI.9B3) and duration (Fig VI.9B4) increasewith δ, for ’Ring’, ’Align’ and ’Branching geometries. Interestingly, peak amplitudeand duration are significantly lower in ’Ring’ compared to ’Align’ or ’Branching’
Cette thèse est accessible à l'adresse : http://theses.insa-lyon.fr/publication/2019LYSEI093/these.pdf © [A. Denizot], [2019], INSA Lyon, tous droits réservés

170VI. Modeling the onset and propagation of neuronal activity-induced
Ca2+ signals in processes
geometries, whatever the value of δ. Moreover, peak amplitude and duration is sig-nificantly higher in ’Branching’ geometries compared to ’Align’, whatever the valueof δ.
Overall, node branching seems to increase local Ca2+ peak duration and am-plitude while its ’fusion’ into ring-like structures is associated with decreased peakamplitude and duration. Moreover, ring-like structures are characterized by bothlower probability and speed of signal propagation. Ring-like structures might thusbe associated with highly localized puncta of Ca2+ activity, potentially favoringneuron-astrocyte communication at the single-synapse level.
Conclusion
The geometries developed in this study, presented in Fig VI.4C and VI.8, emergeas interesting tools to investigate the influence of cellular geometry on Ca2+ dynam-ics in the gliapil. Our results suggest that high node/shaft ratios are associated withan increased diffusional isolation of nodes while favoring the propagation of signals,which is the opposite of the suggestions from Arizono et al[9]. Indeed, our collabo-rators suggested that the higher diffusional isolation of nodes for high δ could ’trap’Ca2+ signals in nodes and thus be responsible for the ≈ 70% of signals that stayedlocalized in nodes. Our simulations however predict that the greater δ, the higherthe probability and speed of signal propagation. This suggests that geometries withδ=1 might favor the existence of local communication at the node-spine level, i.e atthe single-synapse level. Finally, our results suggest that the formation of ring-likestructures might decrease both the probability and speed of signal propagation andthat signals in ring-like structures are characterized by decreased peak amplitudeand duration compared to the equivalent ’align’ or ’branching’ geometries. Ring-likestructures might thus favor local signaling rather than Ca2+ waves, which might havestrong implications on neuron-astrocyte communication at the sub-cellular level.
Together, our results suggest that the ≈ 70% of signals that stayed localized inone node [9] might result from a high density of ring-like structures and/or fromthe presence of processes with low node/shaft ratios. The remaining 30% of signalsthat propagated might result from aligned/branched geometries, potentially withhigher node/shaft width ratio. In any case, our results reveal potential geometricalproperties that can at least partially explain the variety of signal propagation cuesobserved experimentally.
Cette thèse est accessible à l'adresse : http://theses.insa-lyon.fr/publication/2019LYSEI093/these.pdf © [A. Denizot], [2019], INSA Lyon, tous droits réservés

VI.1. Simulating the propagation of Ca2+ signals in processes displayingnode/shaft geometries 171
Figure VI.9: Effect of node branching and of ring-like structures on signal propagation.(A) Representative [Ca-GCaMP] traces for δ=1, 2 and 3 and for ’Align’ (A1, black), ’Branching’(A2, red) and ’Ring’ (A3, blue) geometries. Panel B presents the quantification of the delaybetween stimulation time of Node 1 and peak onset in Node 4 (B1, ANOVA, p-values<0.0001*** for ’Align’ and ’Branching’ and p-value=0.0066 ** for ’Ring’), the percentage of simulationsin which signal propagated to Node 4 (B2, ANOVA, p-values<0.0001 ***), peak amplitude (B3,ANOVA, p-values<0.0001 ***) and peak duration (B4, ANOVA, p-values<0.0001 ***) in Node4, for δ=1, 2 and 3 and for ’Align’, ’Branching’ and ’Ring’ geometries, respectively. Data arerepresented as mean ± STD, n=50 for each condition. Significance of the difference between’Align’, ’Branching’ and ’Ring’ geometries is assigned by * for p ≤ 0.05, ** for p ≤ 0.01, ***for p ≤ 0.001.
Cette thèse est accessible à l'adresse : http://theses.insa-lyon.fr/publication/2019LYSEI093/these.pdf © [A. Denizot], [2019], INSA Lyon, tous droits réservés

172VI. Modeling the onset and propagation of neuronal activity-induced
Ca2+ signals in processes
VI.1.6 Discussion
For τIP3=4s and 5s and for δ=2 or 3, signals were detected in Node 5 ≈ 10safter the stimulation of Node 1 (at t0), which means that they occurred before thestimulation of Node 4 (t=t0 + 12s and t=t0 + 15s for τIP3=4s and 5s, respectively).This phenomenon was not observed in geometries with δ=1, for which time to 1st
peak when τIP3=4s was 23.67 ± 0.47 s, which is larger than stimulation time ofNode 4 (t=t0 + 12s). This suggests that for δ=2 and 3, contrary to δ=1, one nodestimulation can be omitted without having any consequence on signal propagation.Large node/shaft width ratio would thus result in a more robust signal propagation.In order to test this hypothesis, we plan to perform simulations of the protocol pre-sented in Fig VI.7 in which, for each node stimulation, IP3 infusion occurs with agiven probability of failure. The percentage of signals that propagate to Node 5,depending on the value of the probability of failure, reflects the robustness of signalpropagation and can be tested depending on δ.
As described above, our collaborators [9] have observed different fractions ofspines covered by astrocytes (Fig VI.5). The physiological implications of sucha variability is however not understood yet. Simulations with varying astrocyticplasma membrane areas contacted by the spine could help investigate this question.More particularly, those simulations would allow to study the influence of the sur-face of astrocytic processes that is contacted by a spine on the onset and probabilityof Ca2+ wave propagation.
The presence of "Rings" in the gliapil by itself is striking and requires further in-vestigation. Indeed, even if reported previously [541], those structures have not beenobserved using electron microscopy. This discrepancy could be due to possible tis-sue distortions associated to the chemical fixation of samples in electron microscopy[583] or to the poor resolution of STED in z (200nm), which might result in wrongreconstructions of the 3D structure. Combining those fluorescent techniques withexpansion microscopy [584, 585, 586, 587, 588] might increase the resolution of theimages and help better characterize those apparent "Rings". Indeed, for the momentwe cannot rule out whether those structures result from the fusion of membranes ofneighboring astrocytic processes or from the formation of inter-processes gap junc-tions. Better understanding the exact geometry of this structure and its formationas well as its potential dynamical restructuration is crucial for better understandingits impact on Ca2+ signaling in the gliapil. How do those structures form? Whendoes the formation of ring-like structures occur? Is this phenomenon plastic andrelated to neuronal activity? Many questions arise from this study, which couldhelp better understand neuron-astrocyte communication and information process-ing in astrocytes. In any case, the formation of ring-like structures might, accordingto our simulations, result in a decrease of the local speed and probability of signal
Cette thèse est accessible à l'adresse : http://theses.insa-lyon.fr/publication/2019LYSEI093/these.pdf © [A. Denizot], [2019], INSA Lyon, tous droits réservés

VI.1. Simulating the propagation of Ca2+ signals in processes displayingnode/shaft geometries 173
propagation, probably favoring local signaling between astrocytes and neurons.
Cette thèse est accessible à l'adresse : http://theses.insa-lyon.fr/publication/2019LYSEI093/these.pdf © [A. Denizot], [2019], INSA Lyon, tous droits réservés

174VI. Modeling the onset and propagation of neuronal activity-induced
Ca2+ signals in processes
VI.2 Simulating the effect of ER-PSD distance onneuronal activity-induced Ca2+ signals in as-trocytic processes
VI.2.1 Experimental background
During the past few years, fine astrocytic processes have been regarded as devoidof ER [33, 430]. As presented in section V.2, our collaborator C. Calì, KAUST, SaudiArabia, has detected ER in some PAPs using electron microscopy (see Fig V.5).Fig VI.10A presents different images from electron microscopy of a representativetripartite synapse, displaying a PAP that contains ER, with an ER-PSD (post-synaptic density) distance of ≈ 68nm. Fig VI.10B presents quantification of thedistance between the closest ER to PSD. According to those results, the closestastrocytic ER is at an average distance of 776 nm ± 567 nm from PSD and can be< 100 nm (see Fig VI.10B). Those results are very important as they contradict thestrong belief in the field that no ER is present in perisynaptic processes [33, 430].Minimal ER-synapse distance turns out to be extremely variable. In this study, wehave thus investigated the influence of such diverse ER-PSD distance on neuronal-induced Ca2+ signals (see Fig VI.11A).
VI.2.2 Modeling approach and geometry
Fig VI.11 presents the modeling approach developed in this study (Fig VI.11A)as well as the 3D geometries that were created to investigate the impact of thedistance between the ER and the tip of the process on Ca2+ signaling (Fig VI.11B).Similarly to simulations from section VI.1, neuronal stimulation was modeled as aninfusion of 25 IP3 molecules (i.e 460 nM for λ=0 nm and ≈ 200 nM for λ=1000 nm)at the tip of the process, at time t=2s. In order to get the same density of IP3Rchannels among simulations, the length and diameter of the ER was conserved (1µm long, 160nm in diameter), whatever the distance from the tip of the process λ,so that the total number of IP3R molecules was constant: 160. Therefore, changesof λ were obtained by varying the total process length, which was associated withmodifications of total cytosolic volume (see Fig VI.11B).
Cette thèse est accessible à l'adresse : http://theses.insa-lyon.fr/publication/2019LYSEI093/these.pdf © [A. Denizot], [2019], INSA Lyon, tous droits réservés

VI.2. Simulating the effect of ER-PSD distance on neuronalactivity-induced Ca2+ signals in astrocytic processes 175
Figure VI.10: Electron microscopy reveals the presence of ER in PAPS and its vicin-ity to synapses. (A) Electron microscopy images revealing a representative example of anastrocytic (green) process containing ER (yellow) that is in the vicinity of synaptic PSD(post-synaptic density, red). Axons are represented in grey. In this example, the ER is at a distance of68nm from the PSD. (B) Quantitative analysis of the distance of ER to PSD, of the perimeterand cross-section of the ER (in µm). The closest astrocytic ER is at an average distance of776 nm ± 567 nm from PSD, with some PSDs that are at < 100nm away from a PSD.
VI.2.3 Results: Effect of ER-PSD distance on the onset andcharacteristics of astrocytic Ca2+ signals
As our collaborator has reported diverse distances between synapses and theclosest astrocytic ER (ER-PSD distance, λ), we have investigated the effect of thevariability of this distance on Ca2+ signals in fine astrocytic processes. To do so,we have performed simulations within simplified cylinder geometries in which theER was positioned at various distances from IP3 infusion site, which reflects PSDlocation: from λ=0 to 1 µm. In order to visualize the propagation of Ca2+ signalswithin the process, space was discretized into 100 nm-long bins, so that the geome-try with λ=0nm (lastro=1µm) was discretized into 10 bins while the geometry with
Cette thèse est accessible à l'adresse : http://theses.insa-lyon.fr/publication/2019LYSEI093/these.pdf © [A. Denizot], [2019], INSA Lyon, tous droits réservés

176VI. Modeling the onset and propagation of neuronal activity-induced
Ca2+ signals in processes
Figure VI.11: Modeling approach for investigating the effect of ER-PSD distance onCa2+ signaling. (A) Schematic representation of the biological question. This study aims atinvestigating the effect of the distance between a synapse (PSD) and the closest astrocyticendoplasmic reticulum (ER) to PSD, λ, on the onset and characteristics of Ca2+ signals. (B)3D geometries that were designed for investigating the effect of λ on Ca2+ dynamics. ERsurface was constant across those geometries to ensure constant IP3R density.
λ=1µm (lastro=2µm) was discretized into 20 bins (see Fig VI.12A1). The resultingplots of Ca2+ dynamics in each bin from t=0 to t=50s reveal striking differences ofCa2+ dynamics depending on λ (Fig VI.12A2). Interestingly, [Ca-GCaMP] peaksplotted as a function of time and space consist in horizontal lines (Fig VI.12A2).This suggests that signals propagate very fast so that [Ca-GCaMP] in a PAP is soonhomogenized, preventing the observation and quantification of wave propagation atthis spatial scale. Ca2+ activity in the whole process qualitatively varied depend-ing on ER-PSD distance λ for a given neuronal stimulus (here 25 IP3 molecules)(Fig VI.12A3). Quantitative analysis of Ca2+ signals depending on λ are presented inFig VI.12B. Peak amplitude (Fig VI.12B1) and frequency (Fig VI.12B3) significantlydecreased when λ increased while time to 1st peak increased with λ (Fig VI.12B4).However, λ did not seem to impact peak duration (Fig VI.12B2). Note that we havechecked that spontaneous Ca2+ signals (number of IP3 infused=0) did not vary inamplitude, frequency and duration depending on λ (not shown, ANOVA, p-value=0.31, 0.18 and 0.63, respectively). Our results thus reveal a strong effect of ER-PSD
Cette thèse est accessible à l'adresse : http://theses.insa-lyon.fr/publication/2019LYSEI093/these.pdf © [A. Denizot], [2019], INSA Lyon, tous droits réservés

VI.2. Simulating the effect of ER-PSD distance on neuronalactivity-induced Ca2+ signals in astrocytic processes 177
distance on peak amplitude and frequency.Overall, our results suggest that the variety of PSD-ER distances that are ob-
served experimentally might partly be responsible for the diversity of both amplitudeand frequency of Ca2+ signals observed in fine processes. Please note that the ge-ometry used in this study is characterized by a slightly larger volume than that isbelieved to represent PAPs. In order to confirm whether our predictions are stillvalid for thinner processes of the gliapil, we plan to perform those simulations againwithin meshes of thinner processes (Rastro=100nm rather than 190nm).
VI.2.4 Discussion
The study presented in this section is similar to a previous dimensionless massdiffusion model from Montes de Oca Balderas [430], although their model was devoidof a degradation term for IP3, thus compromising interpretation of their simulationresults. Our predictions are in accordance with their finding: even if the ER islocated 1 µm away from the PSD, IP3R-dependent Ca2+ transients can be triggeredin the astrocyte. Our study however goes further in studying the effect of ER-PSDdistance on astrocytic Ca2+ signals. We show that peak amplitude and frequencystrongly decrease with ER-PSD distance, so that for a similar neuronal input andcellular location, varying ER-PSD distances can result in diverse Ca2+ signals.
Our results suggest that signals propagate very fast so that the concentration ofIP3 is soon homogenized within a fine process, resulting in the absence of a detectableCa2+ wave at this spatial scale. In fact, the coefficient of diffusion of IP3 moleculesin the model is DIP3=280 µm2.s−1, and that of GCaMP molecules is DGCaMP=50µm2.s−1 so that IP3 and Ca-GCaMP molecules can diffuse along the entire geometrywithin few ms. Overall, our results suggest that the increase of IP3 concentrationrather than its diffusion is critical for the onset of Ca2+ peaks in a PAP with theparameter values used in this model. Note that the coefficient of diffusion of IP3
available in the literature was measured in Xenopus laevis oocytes cytosolic extractsin the 1990s [554], which might not reflect its dynamics in astrocytes. Further exper-imental investigation on the coefficient of diffusion of molecules of the Ca2+ pathwayin astrocytes is crucial in order to better understand signal propagation in the smallvolumes that characterize processes of the gliapil.
As simulations in section V.2 have revealed that Ca2+ dynamics can vary dras-tically depending on the mesh in which simulations are performed, it would beinteresting to test the predictions of the simulations presented in this section in amore realistic PAP geometry. To do so, we plan to perform simulations with varying
Cette thèse est accessible à l'adresse : http://theses.insa-lyon.fr/publication/2019LYSEI093/these.pdf © [A. Denizot], [2019], INSA Lyon, tous droits réservés

178VI. Modeling the onset and propagation of neuronal activity-induced
Ca2+ signals in processes
Figure VI.12: ER-PSD distance influences Ca2+ peak duration and amplitude. (A1)Screenshots revealing the spatial discretization of processes into 100nm-long bins, for ER-PSDdistance λ=0, 500 and 1000 nm. One bin is highlighted in blue while the rest of the volume is ingreen. (A2) Representative plots illustrating the number of Ca2+ ions in each bin as a functionof time for geometries with λ=0, 500 and 1000nm, from t=0 to t=50s. (A3) Representativesimulations with ER-PSD distances λ=0nm, 500nm and 1 µm (see geometries in Fig VI.11B).(B) Quantification of peak amplitude (B1, ANOVA, p-value ≤ 0.0001 ***), frequency (B2,ANOVA, p-value ≤ 0.0001 ***), duration (B3, ANOVA, p-value= 0.16) and time to 1st peak(B4, ANOVA, p-value= 0.05 *) as a function of λ. Data are expressed as mean ± standarddeviation, n=20. Dashed lines are guides for the eye.
Cette thèse est accessible à l'adresse : http://theses.insa-lyon.fr/publication/2019LYSEI093/these.pdf © [A. Denizot], [2019], INSA Lyon, tous droits réservés

VI.3. Conclusion 179
ER-PSD distances in the realistic mesh presented in Fig V.5B. In order to inves-tigate the effect of ER-PSD distance in this mesh, we will perform simulations inwhich IP3 infusion will occur at different locations in the cell, associated with vary-ing distances to the closest ER. Simulations in larger volumes of the mesh presentedin Fig V.5A could also enable the investigation of signal propagation within a real-istic network of astrocytic processes. Such a larger volume would probably be moresuited to the study of signal propagation depending on ER-PSD distance and wouldhelp better understand signal integration in the gliapil, which might be importantfor neuron-astrocyte communication.
VI.3 Conclusion
In this chapter, we have used the 3D voxel-based implementation of our modelpresented in Chapter V in order to investigate the onset and propagation of neuronal-induced Ca2+ signals in astrocytes. More particularly, we have investigated theeffect of cellular and of ER geometry on the characteristics of induced Ca2+ signals.The geometries tested in this chapter were based on experimental data from ourcollaborators. Overall, our simulations suggest that the geometry of fine processesby itself can be responsible for various properties of signal propagation. Furthermore,dynamical remodeling of the geometry of processes, as e.g the formation of ring-likestructures observed by Arizono et al [9], can result in a striking modification of theprobability and speed of signal propagation in the structure. Finally, simulationsin a simplified cylinder mesh have enabled us to study the effect of the varyingER-PSD distances that were observed by our collaborator on local peak amplitudeand frequency in a fine astrocytic process. Cellular and ER geometries are thusimportant parameters that can influence focal VS spread Ca2+ activity in the gliapil.A thorough characterization of the ultrastructure of the gliapil should thus providea better understanding of information processing in astrocytes.
Cette thèse est accessible à l'adresse : http://theses.insa-lyon.fr/publication/2019LYSEI093/these.pdf © [A. Denizot], [2019], INSA Lyon, tous droits réservés

180VI. Modeling the onset and propagation of neuronal activity-induced
Ca2+ signals in processes
Cette thèse est accessible à l'adresse : http://theses.insa-lyon.fr/publication/2019LYSEI093/these.pdf © [A. Denizot], [2019], INSA Lyon, tous droits réservés

181
Chapter VII
Conclusion and perspectives
Conclusion
As all studies from Chapters IV, V and VI were presented together with dis-cussions on their results, limitations and perspectives, broader conclusion and per-spectives are presented here.
The small size of astrocytic processes that interact with neurons (< 200nm indiameter), associated to the low concentrations of molecular species such as Ca2+
ions (≈ 100 nM), implies that reactions that result in Ca2+ signals occur stochas-tically. Mathematical models of CICR-based signaling date back to the beginningof the 1990s (for recent reviews see e.g. [540, 287, 288]) and most assumed per-fect mixing of the molecules and deterministic kinetics (ODEs, see section III.1)[8, 300, 302]. Stochastic models of IP3R-mediated Ca2+ signaling have also beenproposed, that take into account the stochasticity associated with molecular inter-actions [377, 531, 545, 530]. Yet, none of those studies accounts both for the diffusionof molecular species and the stochasticity of the reactions taking place inside astro-cytes. Recently, individual-based modeling has been introduced to evaluate theimpact of diffusive noise on IP3R opening dynamics [491], but this simplified modeldisregarded IP3 dynamics and restricted stochasticity to the vicinity of the IP3Rchannels. To our knowledge, our model is the first fully stochastic individual-basedmodel that is suited to reproduce spontaneous Ca2+ signals in the finest astrocyteprocesses, where low copy number and spatial localization effects are expected to bemore prominent than in larger volumes.
Simulations in the 2D version of the model allowed for a better understanding ofits dynamics and of the basic spatial parameters that could influence the regime andtemporal characteristics of Ca2+ signals (Chapter IV). Simulations in 3D geome-tries representing PAP volumes and realistic molecular concentrations allowed us to
Cette thèse est accessible à l'adresse : http://theses.insa-lyon.fr/publication/2019LYSEI093/these.pdf © [A. Denizot], [2019], INSA Lyon, tous droits réservés

182 VII. Conclusion and perspectives
further investigate the impact of cellular geometry on spontaneous Ca2+ dynamics,notably the interplay between molecular clustering and the distance between plasmamembrane and intracellular Ca2+ stores (Chapter V). The last part of this thesisconsisted in investigating the impact of astrocytic geometry at the nanoscale onthe onset and propagation of neuronal-induced Ca2+ signals (Chapter VI). Overall,simulations of the model suggest that (1) molecular diffusion, strongly influenced bythe concentration and kinetics of endogenous and exogenous buffers, (2) intracellu-lar spatial organization of molecules, notably Ca2+ channels co-clustering, (3) ERgeometry and localization within the cell, (4) cellular geometry strongly influenceCa2+ dynamics and can be responsible for the striking diversity of astrocytic Ca2+
signals.All of the studies presented in this manuscript rely on IP3R-dependent Ca2+ sig-
nals. As the ER is most probably absent from some processes (see e.g Fig V.10), themodel developed in this thesis cannot fully represent the diversity of Ca2+ signalsencountered in astrocytes. For more details on the controversies and perspectiveson the presence of ER in processes and on the dependence of local Ca2+ signalson the ER, see dedicated discussion in section V.3. Similarly, experimental reportssuggest that the complete dependence of cytosolic Ca2+ transients on IP3R2 chan-nels is only observed in the astrocytic soma whereas Ca2+ signals measured withinastrocytic processes are a mix of IP3R2-dependent and IP3R2-independent Ca2+
signals [6, 254]. The identity, subtype and localization of the channels responsi-ble for IP3R2-independent Ca2+ signals in astrocytes are still to be uncovered. Ourstudy sheds light on the importance of the localization of these various Ca2+ sources,whatever their specific subtypes.
Overall, simulations of the model demonstrate that low copy number of moleculescan display dynamics that cannot be predicted by deterministic approaches andthat spatial modeling is crucial to better understand the effect of molecular distri-butions and of cellular geometry on Ca2+ dynamics in astrocytes. Recent studieshave proposed models for the simulation of astrocytic Na+ [429] and Ca2+ signals[589, 430, 405] in 3D with deterministic differential equation models that correspondto cellular volumes large enough to validate a law of large numbers. Since fineprocesses are thought to be the place of neuron-astrocyte interactions, we believethat this model, combined with models of signal propagation between astrocyticcompartments such as Savtchenko et al [405], might be useful to investigate thespatiotemporal integration of Ca2+ signals in the spongiform network of astrocyteprocesses.
Cette thèse est accessible à l'adresse : http://theses.insa-lyon.fr/publication/2019LYSEI093/these.pdf © [A. Denizot], [2019], INSA Lyon, tous droits réservés

VII. Conclusion and perspectives 183
Towards replicable and reproducible models
Several meta studies have put forward the different behaviors that models ofthe same biological system can display [590, 540]. Actually, reproducing the resultsfrom computational models, even though they do not suffer from experimental mea-surement errors, is not straightforward, which has been pointed out in several fields,including in models of astrocytes [591, 540]. One of the big challenges in the mod-eling community is to develop reproducible models. Models should be replicable,cross-replicable and reproducible (see [592] for details). Basically, the simulationresults should not depend on the code and tools used for implementing the model.
In order to improve the reproducibility of computational models, it is recom-mended to systematically share the code (with e.g ModelDB [593], see Crook et al[592] for other available model databases). Guidelines for sharing models have beensuggested in the form of Minimum Information Required in the Annotation of Mod-els (MIRIAM, http://co.mbine.org/standards/miriam) [594]. Those studies suggestthat all modeling studies should include model description, hypothesis, implemen-tation (providing the code is best), analysis, validation against experimental dataand justification. Using common languages for describing molecular interactionsindependently of the simulator can also promote cross-replicability of models. Themost popular of those languages is the Systems Biology Markup Language (SBML)[595] (but see Crook et al [592] for an overview of other markup languages). Finally,some platforms have started to build tools that allow for inter-operability of differentsimulators, as e.g the interface MUSIC [520].
Such initiatives have also emerged in the field of computational neuroscience.For example, PyNN and NeuroML provide simulation tools for standardized for-mats of neuroscience models. PyNN [596] is a programming interface using Pythonprogramming language, in which a growing toolbox is available for simulation anddata analysis. NeuroML is an XML-based programming interface, which enablesthe description of model components at various scales of the nervous system [597].
Overall, producing models that are better documented, easily reproducible andreplicable should help improve knowledge and collaborative work in the field ofcomputational neuroscience.
Perspectives
Since contact sites have been detected in perivascular astrocytic processes be-tween ER and plasma membrane (PM) [30] and as simulations of the model inChapter V suggested an effect of ER-PM distance on Ca2+ signals (see section V.3
Cette thèse est accessible à l'adresse : http://theses.insa-lyon.fr/publication/2019LYSEI093/these.pdf © [A. Denizot], [2019], INSA Lyon, tous droits réservés

184 VII. Conclusion and perspectives
for further discussion), we would like to investigate the impact of ER-PM contactsites on Ca2+ signals at the sub-cellular scale. To do so, we have started to develop amesh in which the main geometrical parameters of ER-PM contact sites can be mod-ified. Simulations in this mesh are characterized by the existence of a Ca2+ gradientfrom the contact site. To our knowledge, this is the first fully stochastic spatially-explicit model of Ca2+ nanodomains. Meanwhile, our collaborator is investigatingthe number and distribution of ER-PM contact sites in astrocytes. This study mightbe helpful to better understand the influence of ER-PM geometry on Ca2+ signaling.
IP3R-dependent Ca2+ signals can involve a substantial transient decrease of[Ca2+] within the ER. For simplicity, those variations have not been taken intoaccount in the models that have been presented in this manuscript. Local Ca2+
depletion in the ER could however strongly influence cytosolic Ca2+ signals, espe-cially in small volumes such as encountered within microdomains. In order to testthis hypothesis, we have adapted the ”GCaMP” model presented in section V.1 inorder to account for Ca2+ dynamics within the ER. This model is interesting forinvestigating local depletion of Ca2+ in the ER following Ca2+ activity, which hasnot been investigated so far to our knowledge in systems with low copy number ofmolecules.
One astrocyte can be viewed as the summation of units of signal integration, itsprocesses. However, whether processes consist in independent, heterogeneous unitsstill remains to be uncovered. More particularly, it is not known under which condi-tions signals emerging from independent processes can interact. A perspective of thework presented in this manuscript would be to simulate signals emerging from differ-ent processes and to investigate the integration of Ca2+ signals in this intracellularnetwork. As astrocytes in the rat hippocampus can contact simultaneously ≈ 100000 synapses [27] and human astrocytes could contact up to 2 000 000 synapses [37],this question is fundamental to understand the potential role that single astrocytescould play in connecting different neuronal networks. To model signal integrationand propagation within networks of astrocytic processes, we could create geometriesin which several processes are connected, each of them being stimulated by differ-ent neuronal sources, at different timing. We could also simulate signal integrationdirectly in our mesh of a realistic 3D astrocyte, with neuronal PSDs, extractedfrom electron microscopy (see Fig V.5A), although simulations in this geometrywith STEPS would probably take years to compute. Using hybrid approaches formodeling the integration of stochastic local signals and the subsequent global ac-tivity thus emerges as the best compromise to simulate signal integration withinwhole astrocytes. Those multiscale modeling studies will be of high importance forunderstanding the influence of information processing at the (sub-)cellular level on
Cette thèse est accessible à l'adresse : http://theses.insa-lyon.fr/publication/2019LYSEI093/these.pdf © [A. Denizot], [2019], INSA Lyon, tous droits réservés

VII. Conclusion and perspectives 185
higher-level brain functions.
Cette thèse est accessible à l'adresse : http://theses.insa-lyon.fr/publication/2019LYSEI093/these.pdf © [A. Denizot], [2019], INSA Lyon, tous droits réservés

186 VII. Conclusion and perspectives
Cette thèse est accessible à l'adresse : http://theses.insa-lyon.fr/publication/2019LYSEI093/these.pdf © [A. Denizot], [2019], INSA Lyon, tous droits réservés

187
Bibliography
[1] R. Ventura and K. M. Harris, “Three-Dimensional Relationships between Hip-pocampal Synapses and Astrocytes,” The Journal of Neuroscience, vol. 19,pp. 6897–6906, Aug. 1999.
[2] M. R. Witcher, S. A. Kirov, and K. M. Harris, “Plasticity of perisynapticastroglia during synaptogenesis in the mature rat hippocampus,” Glia, vol. 55,pp. 13–23, Jan. 2007.
[3] N. Bazargani and D. Attwell, “Astrocyte calcium signaling: the third wave,”Nature Neuroscience, vol. 19, pp. 182–189, Feb. 2016.
[4] J. P. Heller and D. A. Rusakov, “The Nanoworld of the Tripartite Synapse: In-sights from Super-Resolution Microscopy,” Frontiers in Cellular Neuroscience,vol. 11, 2017.
[5] S. Berlin, E. C. Carroll, Z. L. Newman, H. O. Okada, C. M. Quinn, B. Kallman,N. C. Rockwell, S. S. Martin, J. C. Lagarias, and E. Y. Isacoff, “Photoactivat-able genetically encoded calcium indicators for targeted neuronal imaging,”Nature Methods, vol. 12, pp. 852–858, Sept. 2015.
[6] R. Srinivasan, B. S. Huang, S. Venugopal, A. D. Johnston, H. Chai, H. Zeng,P. Golshani, and B. S. Khakh, “Ca(2+) signaling in astrocytes from Ip3r2(-/-)mice in brain slices and during startle responses in vivo,” Nature Neuroscience,vol. 18, pp. 708–717, May 2015.
[7] E. Bindocci, I. Savtchouk, N. Liaudet, D. Becker, G. Carriero, and A. Volterra,“Three-dimensional Ca2+ imaging advances understanding of astrocyte biol-ogy,” Science, vol. 356, p. eaai8185, May 2017.
[8] G. W. De Young and J. Keizer, “A single-pool inositol 1,4,5-trisphosphate-receptor-based model for agonist-stimulated oscillations in Ca2+ concentra-tion.,” Proceedings of the National Academy of Sciences, vol. 89, pp. 9895–9899, Oct. 1992.
Cette thèse est accessible à l'adresse : http://theses.insa-lyon.fr/publication/2019LYSEI093/these.pdf © [A. Denizot], [2019], INSA Lyon, tous droits réservés

188 BIBLIOGRAPHY
[9] M. Arizono, A. Panatier, V. V. G. K. Inavalli, T. Pfeiffer, J. Angibaud, J. Sto-bart, L. Bellocchio, G. Marsicano, K. Mikoshiba, S. H. R. Oliet, B. Weber,and U. V. Nägerl, “Structural Basis of Astrocytic Ca 2 Signals at Tripar-tite Synapses,” SSRN Scholarly Paper ID 3287791, Social Science ResearchNetwork, Rochester, NY, Nov. 2018.
[10] R. Virchow, “Die Cellularpathologie in ihrer Begr{\"u}ndung auf physiologis-che und pathologische Gewebelehre,” A. Hirschwald, vol. 1, 1862.
[11] C. Golgi, “Sulla sostanza connettiva del cervello (nevroglia),” Rendiconti delR Instituto Lombardo di Scienze e Lettere, vol. 3, pp. 275–277, 1870.
[12] C. Golgi, “Opera Omnia, Vol. 1,” Milano: U. Hoepli, p. 40, 1903.
[13] M. v Lenhossek, “Der feinere Bau des Nervensystems im Lichte neuesterForschung,” Fischer’s Medicinische Buchhandlung H. Kornfield, 1893.
[14] V. García-Marín, P. García-López, and M. Freire, “Cajal’s contributions toglia research,” Trends in Neurosciences, vol. 30, pp. 479–487, Sept. 2007.
[15] S. R. y Cajal, Algunas conjeturas sobre el mecanismo anatómico de la ideación,asociación y atención. 1895.
[16] F. De Castro, “The anatomical aspects of the ganglionic synaptic transmissionin mammals,” Archives internationales de physiologie, vol. 59, no. 4, p. 479,1951.
[17] R. Galambos, “A GLIA-NEURAL THEORY OF BRAIN FUNCTION,” Pro-ceedings of the National Academy of Sciences of the United States of America,vol. 47, pp. 129–136, Jan. 1961.
[18] A. Verkhratsky and M. Nedergaard, “Physiology of Astroglia,” PhysiologicalReviews, vol. 98, pp. 239–389, Jan. 2018.
[19] A. Chvátal, M. Anderová, M. Hock, I. Prajerová, H. Neprasová, V. Chvá-tal, F. Kirchhoff, and E. Syková, “Three-dimensional confocal morphometryreveals structural changes in astrocyte morphology in situ,” Journal of Neu-roscience Research, vol. 85, pp. 260–271, Feb. 2007.
[20] M. M. Boisvert, G. A. Erikson, M. N. Shokhirev, and N. J. Allen, “The AgingAstrocyte Transcriptome from Multiple Regions of the Mouse Brain,” CellReports, vol. 22, pp. 269–285, Jan. 2018.
Cette thèse est accessible à l'adresse : http://theses.insa-lyon.fr/publication/2019LYSEI093/these.pdf © [A. Denizot], [2019], INSA Lyon, tous droits réservés

BIBLIOGRAPHY 189
[21] Y. Zhang, K. Chen, S. A. Sloan, M. L. Bennett, A. R. Scholze, S. O’Keeffe,H. P. Phatnani, P. Guarnieri, C. Caneda, N. Ruderisch, S. Deng, S. A. Lid-delow, C. Zhang, R. Daneman, T. Maniatis, B. A. Barres, and J. Q. Wu, “AnRNA-sequencing transcriptome and splicing database of glia, neurons, andvascular cells of the cerebral cortex,” The Journal of Neuroscience: The Offi-cial Journal of the Society for Neuroscience, vol. 34, pp. 11929–11947, Sept.2014.
[22] Y. Zhang, S. A. Sloan, L. E. Clarke, C. Caneda, C. A. Plaza, P. D. Blumenthal,H. Vogel, G. K. Steinberg, M. S. B. Edwards, G. Li, J. A. Duncan, S. H.Cheshier, L. M. Shuer, E. F. Chang, G. A. Grant, M. G. H. Gephart, andB. A. Barres, “Purification and Characterization of Progenitor and MatureHuman Astrocytes Reveals Transcriptional and Functional Differences withMouse,” Neuron, vol. 89, pp. 37–53, Jan. 2016.
[23] W. Schulze, A. Hayata-Takano, T. Kamo, T. Nakazawa, K. Nagayasu, A. Ka-sai, K. Seiriki, N. Shintani, Y. Ago, C. Farfan, R. Hashimoto, A. Baba, andH. Hashimoto, “Simultaneous neuron- and astrocyte-specific fluorescent mark-ing,” Biochemical and Biophysical Research Communications, vol. 459, pp. 81–86, Mar. 2015.
[24] L. Zhuo, B. Sun, C.-L. Zhang, A. Fine, S.-Y. Chiu, and A. Messing, “LiveAstrocytes Visualized by Green Fluorescent Protein in Transgenic Mice,” De-velopmental Biology, vol. 187, pp. 36–42, July 1997.
[25] Y. Zuo, J. L. Lubischer, H. Kang, L. Tian, M. Mikesh, A. Marks, V. L.Scofield, S. Maika, C. Newman, P. Krieg, and W. J. Thompson, “FluorescentProteins Expressed in Mouse Transgenic Lines Mark Subsets of Glia, Neu-rons, Macrophages, and Dendritic Cells for Vital Examination,” Journal ofNeuroscience, vol. 24, pp. 10999–11009, Dec. 2004.
[26] E. Shigetomi, E. A. Bushong, M. D. Haustein, X. Tong, O. Jackson-Weaver,S. Kracun, J. Xu, M. V. Sofroniew, M. H. Ellisman, and B. S. Khakh, “Imag-ing calcium microdomains within entire astrocyte territories and endfeet withGCaMPs expressed using adeno-associated viruses,” The Journal of GeneralPhysiology, vol. 141, pp. 633–647, May 2013.
[27] E. A. Bushong, M. E. Martone, Y. Z. Jones, and M. H. Ellisman, “Proto-plasmic astrocytes in CA1 stratum radiatum occupy separate anatomical do-mains,” The Journal of Neuroscience: The Official Journal of the Society forNeuroscience, vol. 22, pp. 183–192, Jan. 2002.
Cette thèse est accessible à l'adresse : http://theses.insa-lyon.fr/publication/2019LYSEI093/these.pdf © [A. Denizot], [2019], INSA Lyon, tous droits réservés

190 BIBLIOGRAPHY
[28] H. Chai, B. Diaz-Castro, E. Shigetomi, E. Monte, J. C. Octeau, X. Yu,W. Cohn, P. S. Rajendran, T. M. Vondriska, J. P. Whitelegge, G. Coppola,and B. S. Khakh, “Neural Circuit-Specialized Astrocytes: Transcriptomic, Pro-teomic, Morphological, and Functional Evidence,” Neuron, vol. 95, pp. 531–549.e9, Aug. 2017.
[29] A. Reichenbach, A. Derouiche, and F. Kirchhoff, “Morphology and dynamicsof perisynaptic glia,” Brain Research Reviews, vol. 63, pp. 11–25, May 2010.
[30] A.-C. Boulay, B. Saubaméa, N. Adam, S. Chasseigneaux, N. Mazaré,A. Gilbert, M. Bahin, L. Bastianelli, C. Blugeon, S. Perrin, J. Pouch, B. Ducos,S. Le Crom, A. Genovesio, F. Chrétien, X. Declèves, J.-L. Laplanche, andM. Cohen-Salmon, “Translation in astrocyte distal processes sets molecularheterogeneity at the gliovascular interface,” Cell Discovery, vol. 3, p. 17005,Mar. 2017.
[31] N. Medvedev, V. Popov, C. Henneberger, I. Kraev, D. A. Rusakov, and M. G.Stewart, “Glia selectively approach synapses on thin dendritic spines,” Phil.Trans. R. Soc. B, vol. 369, p. 20140047, Oct. 2014.
[32] C. Calì, J. Baghabra, D. J. Boges, G. R. Holst, A. Kreshuk, F. A. Hamprecht,M. Srinivasan, H. Lehväslaiho, and P. J. Magistretti, “Three-dimensionalimmersive virtual reality for studying cellular compartments in 3d modelsfrom EM preparations of neural tissues,” Journal of Comparative Neurology,vol. 524, pp. 23–38, Jan. 2016.
[33] I. Patrushev, N. Gavrilov, V. Turlapov, and A. Semyanov, “Subcellular loca-tion of astrocytic calcium stores favors extrasynaptic neuron-astrocyte com-munication,” Cell Calcium, vol. 54, pp. 343–349, Nov. 2013.
[34] M. Pekny and M. Pekna, “Astrocyte Reactivity and Reactive Astrogliosis:Costs and Benefits,” Physiological Reviews, vol. 94, pp. 1077–1098, Oct. 2014.
[35] M. M. Halassa, T. Fellin, H. Takano, J.-H. Dong, and P. G. Haydon, “Synap-tic islands defined by the territory of a single astrocyte,” The Journal ofNeuroscience: The Official Journal of the Society for Neuroscience, vol. 27,pp. 6473–6477, June 2007.
[36] K. Ogata and T. Kosaka, “Structural and quantitative analysis of astrocytesin the mouse hippocampus,” Neuroscience, vol. 113, pp. 221–233, Aug. 2002.
[37] N. A. Oberheim, X. Wang, S. Goldman, and M. Nedergaard, “Astrocyticcomplexity distinguishes the human brain,” Trends in Neurosciences, vol. 29,pp. 547–553, Oct. 2006.
Cette thèse est accessible à l'adresse : http://theses.insa-lyon.fr/publication/2019LYSEI093/these.pdf © [A. Denizot], [2019], INSA Lyon, tous droits réservés

BIBLIOGRAPHY 191
[38] C. S. von Bartheld, J. Bahney, and S. Herculano-Houzel, “The search for truenumbers of neurons and glial cells in the human brain: A review of 150 yearsof cell counting,” The Journal of Comparative Neurology, vol. 524, no. 18,pp. 3865–3895, 2016.
[39] J. Bahney and C. S. von Bartheld, “Validation of the isotropic fractionator:Comparison with unbiased stereology and DNA extraction for quantificationof glial cells,” Journal of Neuroscience Methods, vol. 222, pp. 165–174, Jan.2014.
[40] R. Lent, F. A. C. Azevedo, C. H. Andrade-Moraes, and A. V. O. Pinto, “Howmany neurons do you have? Some dogmas of quantitative neuroscience underrevision,” The European Journal of Neuroscience, vol. 35, pp. 1–9, Jan. 2012.
[41] A. V. Molofsky, R. Krenick, E. Ullian, H.-h. Tsai, B. Deneen, W. D. Richard-son, B. A. Barres, and D. H. Rowitch, “Astrocytes and disease: a neurode-velopmental perspective,” Genes & Development, vol. 26, pp. 891–907, May2012.
[42] J. D. Cahoy, B. Emery, A. Kaushal, L. C. Foo, J. L. Zamanian, K. S. Christo-pherson, Y. Xing, J. L. Lubischer, P. A. Krieg, S. A. Krupenko, W. J. Thomp-son, and B. A. Barres, “A Transcriptome Database for Astrocytes, Neurons,and Oligodendrocytes: A New Resource for Understanding Brain Developmentand Function,” Journal of Neuroscience, vol. 28, pp. 264–278, Jan. 2008.
[43] J. P. Doyle, J. D. Dougherty, M. Heiman, E. F. Schmidt, T. R. Stevens, G. Ma,S. Bupp, P. Shrestha, R. D. Shah, M. L. Doughty, S. Gong, P. Greengard,and N. Heintz, “Application of a Translational Profiling Approach for theComparative Analysis of CNS Cell Types,” Cell, vol. 135, pp. 749–762, Nov.2008.
[44] W. H. Evans and P. E. M. Martin, “Gap junctions: structure and function(Review),” Molecular Membrane Biology, vol. 19, pp. 121–136, Jan. 2002.
[45] A. Nimmerjahn, E. A. Mukamel, and M. J. Schnitzer, “Motor Behavior Acti-vates Bergmann Glial Networks,” Neuron, vol. 62, p. 400, May 2009.
[46] N. Kuga, T. Sasaki, Y. Takahara, N. Matsuki, and Y. Ikegaya, “Large-ScaleCalcium Waves Traveling through Astrocytic Networks In Vivo,” Journal ofNeuroscience, vol. 31, pp. 2607–2614, Feb. 2011.
[47] H. Hirase, L. Qian, P. Bartho, and G. Buzsáki, “Calcium Dynamics of CorticalAstrocytic Networks In Vivo,” PLoS biology, vol. 2, p. E96, May 2004.
Cette thèse est accessible à l'adresse : http://theses.insa-lyon.fr/publication/2019LYSEI093/these.pdf © [A. Denizot], [2019], INSA Lyon, tous droits réservés

192 BIBLIOGRAPHY
[48] T. Sasaki, N. Kuga, S. Namiki, N. Matsuki, and Y. Ikegaya, “Locally Synchro-nized Astrocytes,” Cerebral Cortex, p. bhq256, Jan. 2011.
[49] V. Houades, N. Rouach, P. Ezan, F. Kirchhoff, A. Koulakoff, and C. Giaume,“Shapes of astrocyte networks in the juvenile brain,” Neuron Glia Biology,vol. 2, pp. 3–14, Feb. 2006.
[50] W. Meme, M. Vandecasteele, C. Giaume, and L. Venance, “Electrical couplingbetween hippocampal astrocytes in rat brain slices,” Neuroscience Research,vol. 63, pp. 236–243, Apr. 2009.
[51] C. Giaume, A. Koulakoff, L. Roux, D. Holcman, and N. Rouach, “Astroglialnetworks: a step further in neuroglial and gliovascular interactions,” NatureReviews Neuroscience, vol. 11, pp. 87–99, Feb. 2010.
[52] A. Rohlmann and J. R. Wolff, “Subcellular Topography and Plasticity of GapJunction Distribution on Astrocytes,” SpringerLink, pp. 175–192, 1996.
[53] T. Mishima and H. Hirase, “In vivo intracellular recording suggests that graymatter astrocytes in mature cerebral cortex and hippocampus are electrophys-iologically homogeneous,” The Journal of Neuroscience: The Official Journalof the Society for Neuroscience, vol. 30, pp. 3093–3100, Feb. 2010.
[54] A. Louise and D. M. Lovinger, “Electrophysiological properties and gap junc-tion coupling of striatal astrocytes,” Neurochemistry international, vol. 52,pp. 1365–1372, June 2008.
[55] V. Parpura and P. G. Haydon, eds., Astrocytes in (Patho)Physiology of theNervous System. Springer US, 2009.
[56] J. Emsley and J. Macklis, “Astroglial heterogeneity closely reflects theneuronal-defined anatomy of the adult murine CNS.,” Neuron Glia Biol, vol. 2,no. 3, 2006.
[57] N. A. Oberheim, S. A. Goldman, and M. Nedergaard, “Heterogeneity of as-trocytic form and function,” Methods in Molecular Biology (Clifton, N.J.),vol. 814, pp. 23–45, 2012.
[58] A. V. Molofsky, K. W. Kelley, H.-H. Tsai, S. A. Redmond, S. M. Chang,L. Madireddy, J. R. Chan, S. E. Baranzini, E. M. Ullian, and D. H. Rowitch,“Astrocyte-encoded positional cues maintain sensorimotor circuit integrity,”Nature, vol. 509, pp. 189–194, May 2014.
Cette thèse est accessible à l'adresse : http://theses.insa-lyon.fr/publication/2019LYSEI093/these.pdf © [A. Denizot], [2019], INSA Lyon, tous droits réservés

BIBLIOGRAPHY 193
[59] S. Shah, E. Lubeck, W. Zhou, and L. Cai, “In Situ Transcription Profiling ofSingle Cells Reveals Spatial Organization of Cells in the Mouse Hippocampus,”Neuron, vol. 92, pp. 342–357, Oct. 2016.
[60] N. Takata and H. Hirase, “Cortical Layer 1 and Layer 2/3 Astrocytes ExhibitDistinct Calcium Dynamics In Vivo,” PLOS ONE, vol. 3, p. e2525, June 2008.
[61] R. D’Ambrosio, J. Wenzel, P. A. Schwartzkroin, G. M. McKhann, and D. Jan-igro, “Functional specialization and topographic segregation of hippocampalastrocytes,” The Journal of Neuroscience: The Official Journal of the Societyfor Neuroscience, vol. 18, pp. 4425–4438, June 1998.
[62] E. W. Kostuk, J. Cai, and L. Iacovitti, “Subregional differences in astrocytesunderlie selective neurodegeneration or protection in Parkinson’s disease mod-els in culture,” Glia, vol. 0, no. 0, 2019.
[63] O. A. Bayraktar, L. C. Fuentealba, A. Alvarez-Buylla, and D. H. Rowitch,“Astrocyte Development and Heterogeneity,” Cold Spring Harbor Perspectivesin Biology, vol. 7, p. a020362, Jan. 2015.
[64] L. B. Haim and D. H. Rowitch, “Functional diversity of astrocytes in neuralcircuit regulation,” Nature Reviews Neuroscience, vol. 18, pp. 31–41, Jan. 2017.
[65] B. Zhou, Y.-X. Zuo, and R.-T. Jiang, “Astrocyte morphology: Diversity, plas-ticity, and role in neurological diseases,” CNS neuroscience & therapeutics,Mar. 2019.
[66] F. W. Pfrieger and B. A. Barres, “Synaptic Efficacy Enhanced by Glial Cellsin Vitro,” Science, vol. 277, pp. 1684–1687, Sept. 1997.
[67] M. R. Freeman, “Specification and morphogenesis of astrocytes,” Science (NewYork, N.Y.), vol. 330, pp. 774–778, Nov. 2010.
[68] E. Blanco-Suarez, T.-F. Liu, A. Kopelevich, and N. J. Allen, “Astrocyte-Secreted Chordin-like 1 Drives Synapse Maturation and Limits Plasticity byIncreasing Synaptic GluA2 AMPA Receptors,” Neuron, vol. 100, pp. 1116–1132.e13, Dec. 2018.
[69] K. K. Murai, L. N. Nguyen, F. Irie, Y. Yamaguchi, and E. B. Pasquale, “Con-trol of hippocampal dendritic spine morphology through ephrin-A3/EphA4signaling,” Nature Neuroscience, vol. 6, pp. 153–160, Feb. 2003.
[70] H. Nishida and S. Okabe, “Direct Astrocytic Contacts Regulate Local Mat-uration of Dendritic Spines,” Journal of Neuroscience, vol. 27, pp. 331–340,Jan. 2007.
Cette thèse est accessible à l'adresse : http://theses.insa-lyon.fr/publication/2019LYSEI093/these.pdf © [A. Denizot], [2019], INSA Lyon, tous droits réservés

194 BIBLIOGRAPHY
[71] M. R. Regan, Y. H. Huang, Y. S. Kim, M. I. Dykes-Hoberg, L. Jin, A. M.Watkins, D. E. Bergles, and J. D. Rothstein, “Variations in Promoter ActivityReveal a Differential Expression and Physiology of Glutamate Transporters byGlia in the Developing and Mature CNS,” Journal of Neuroscience, vol. 27,pp. 6607–6619, June 2007.
[72] M. Nedergaard and A. Verkhratsky, “Artifact versus reality–how astrocytescontribute to synaptic events,” Glia, vol. 60, pp. 1013–1023, July 2012.
[73] A. Verkhratsky and M. Nedergaard, “Astroglial cradle in the life of thesynapse,” Philosophical Transactions of the Royal Society B: Biological Sci-ences, vol. 369, Oct. 2014.
[74] G. Dallérac, J. Zapata, and N. Rouach, “Versatile control of synaptic circuitsby astrocytes: where, when and how?,” Nature reviews. Neuroscience, Nov.2018.
[75] T. Ishibashi, K. A. Dakin, B. Stevens, P. R. Lee, S. V. Kozlov, C. L. Stewart,and R. D. Fields, “Astrocytes promote myelination in response to electricalimpulses,” Neuron, vol. 49, pp. 823–832, Mar. 2006.
[76] L. E. Clarke and B. A. Barres, “Emerging roles of astrocytes in neural circuitdevelopment,” Nature reviews. Neuroscience, vol. 14, pp. 311–321, May 2013.
[77] J. Schiweck, B. J. Eickholt, and K. Murk, “Important Shapeshifter: Mecha-nisms Allowing Astrocytes to Respond to the Changing Nervous System Dur-ing Development, Injury and Disease,” Frontiers in Cellular Neuroscience,vol. 12, 2018.
[78] A. I. Amaral, T. W. Meisingset, M. R. Kotter, and U. Sonnewald, “MetabolicAspects of Neuron-Oligodendrocyte-Astrocyte Interactions,” Frontiers in En-docrinology, vol. 4, 2013.
[79] E. R. Kandel, T. M. Jessell, J. H. Schwartz, S. A. Siegelbaum, and A. J. Hud-speth, Principles of Neural Science, Fifth Edition. McGraw Hill Professional,2013.
[80] D. Lee-Liu, G. Edwards Faret, V. S. Tapia, and J. Larraín, “Spinal cord re-generation: Lessons for mammals from non mammalian vertebrates,” genesis,vol. 51, no. 8, pp. 529–544, 2013.
[81] W. Walz, “Role of glial cells in the regulation of the brain ion microenviron-ment,” Progress in Neurobiology, vol. 33, pp. 309–333, Jan. 1989.
Cette thèse est accessible à l'adresse : http://theses.insa-lyon.fr/publication/2019LYSEI093/these.pdf © [A. Denizot], [2019], INSA Lyon, tous droits réservés

BIBLIOGRAPHY 195
[82] N. C. Danbolt, “Glutamate uptake,” Progress in Neurobiology, vol. 65, pp. 1–105, Sept. 2001.
[83] F. A. Chaudhry, K. P. Lehre, M. v. L. Campagne, O. P. Ottersen, N. C. Dan-bolt, and J. Storm-Mathisen, “Glutamate transporters in glial plasma mem-branes: Highly differentiated localizations revealed by quantitative ultrastruc-tural immunocytochemistry,” Neuron, vol. 15, pp. 711–720, Sept. 1995.
[84] M. Bélanger, I. Allaman, and P. Magistretti, “Brain Energy Metabolism: Fo-cus on Astrocyte-Neuron Metabolic Cooperation,” Cell Metabolism, vol. 14,pp. 724–738, Dec. 2011.
[85] L. Pellerin and P. J. Magistretti, “Glutamate uptake into astrocytes stimulatesaerobic glycolysis: a mechanism coupling neuronal activity to glucose utiliza-tion,” Proceedings of the National Academy of Sciences, vol. 91, pp. 10625–10629, Oct. 1994.
[86] G. K. Gandhi, N. F. Cruz, K. K. Ball, and G. A. Dienel, “Astrocytes arepoised for lactate trafficking and release from activated brain and for supplyof glucose to neurons,” Journal of Neurochemistry, vol. 111, no. 2, pp. 522–536,2009.
[87] P. Ballabh, A. Braun, and M. Nedergaard, “The blood–brain barrier: anoverview: Structure, regulation, and clinical implications,” Neurobiology ofDisease, vol. 16, pp. 1–13, June 2004.
[88] M. R. Metea and E. A. Newman, “Glial Cells Dilate and Constrict BloodVessels: A Mechanism of Neurovascular Coupling,” Journal of Neuroscience,vol. 26, pp. 2862–2870, Mar. 2006.
[89] S. Mulligan and B. A MacVicar, “Calcium transients in astrocyte endfeet causecerebrovascular constrictions.,” Nature, vol. 431, pp. 195–9, Oct. 2004.
[90] T. Takano, G.-F. Tian, W. Peng, N. Lou, W. Libionka, X. Han, and M. Ned-ergaard, “Astrocyte-mediated control of cerebral blood flow,” Nature Neuro-science, vol. 9, pp. 260–267, Feb. 2006.
[91] E. Dossi, F. Vasile, and N. Rouach, “Human astrocytes in the diseased brain,”Brain Research Bulletin, vol. 136, pp. 139–156, Jan. 2018.
[92] L. Ben Haim, M.-A. Carrillo-de Sauvage, K. Ceyzériat, and C. Escartin,“Elusive roles for reactive astrocytes in neurodegenerative diseases,” Frontiersin Cellular Neuroscience, vol. 9, Aug. 2015.
Cette thèse est accessible à l'adresse : http://theses.insa-lyon.fr/publication/2019LYSEI093/these.pdf © [A. Denizot], [2019], INSA Lyon, tous droits réservés

196 BIBLIOGRAPHY
[93] G. O. Mizuno, Y. Wang, G. Shi, Y. Wang, J. Sun, S. Papadopoulos, G. J.Broussard, E. K. Unger, W. Deng, J. Weick, A. Bhattacharyya, C.-Y. Chen,G. Yu, L. L. Looger, and L. Tian, “Aberrant Calcium Signaling in AstrocytesInhibits Neuronal Excitability in a Human Down Syndrome Stem Cell Model,”Cell Reports, vol. 24, pp. 355–365, July 2018.
[94] G. Dallérac and N. Rouach, “Astrocytes as new targets to improve cognitivefunctions,” Progress in Neurobiology, vol. 144, pp. 48–67, 2016.
[95] H. Wang, G. Song, H. Chuang, C. Chiu, A. Abdelmaksoud, Y. Ye, and L. Zhao,“Portrait of glial scar in neurological diseases,” International Journal of Im-munopathology and Pharmacology, vol. 31, p. 2058738418801406, Dec. 2018.
[96] K. L. Adams and V. Gallo, “The diversity and disparity of the glial scar,”Nature Neuroscience, vol. 21, pp. 9–15, Jan. 2018.
[97] M. V. Sofroniew, “Molecular dissection of reactive astrogliosis and glial scarformation,” Trends in neurosciences, vol. 32, pp. 638–647, Dec. 2009.
[98] R. Brambilla, “Neuroinflammation, the thread connecting neurological dis-ease,” Acta Neuropathologica, Apr. 2019.
[99] M. A. Anderson, J. E. Burda, Y. Ren, Y. Ao, T. M. O’Shea, R. Kawaguchi,G. Coppola, B. S. Khakh, T. J. Deming, and M. V. Sofroniew, “Astrocyte scarformation aids central nervous system axon regeneration,” Nature, vol. 532,pp. 195–200, Apr. 2016.
[100] A. R. Filous and J. Silver, “"Targeting astrocytes in CNS injury and disease: Atranslational research approach",” Progress in Neurobiology, vol. 144, pp. 173–187, 2016.
[101] K. Ceyzériat, L. Ben Haim, A. Denizot, D. Pommier, M. Matos, O. Guille-maud, M.-A. Palomares, L. Abjean, F. Petit, P. Gipchtein, M.-C. Gail-lard, M. Guillermier, S. Bernier, M. Gaudin, G. Aurégan, C. Joséphine,N. Déchamps, J. Veran, V. Langlais, K. Cambon, A. P. Bemelmans, J. Bai-jer, G. Bonvento, M. Dhenain, J.-F. Deleuze, S. H. R. Oliet, E. Brouillet,P. Hantraye, M.-A. Carrillo-de Sauvage, R. Olaso, A. Panatier, and C. Es-cartin, “Modulation of astrocyte reactivity improves functional deficits inmouse models of Alzheimer’s disease,” Acta Neuropathologica Communica-tions, vol. 6, p. 104, Oct. 2018.
[102] J. E. Burda and M. V. Sofroniew, “Reactive gliosis and the multicellular re-sponse to CNS damage and disease,” Neuron, vol. 81, pp. 229–248, Jan. 2014.
Cette thèse est accessible à l'adresse : http://theses.insa-lyon.fr/publication/2019LYSEI093/these.pdf © [A. Denizot], [2019], INSA Lyon, tous droits réservés

BIBLIOGRAPHY 197
[103] J. E. Burda, A. M. Bernstein, and M. V. Sofroniew, “Astrocyte roles in trau-matic brain injury,” Experimental Neurology, vol. 275 Pt 3, pp. 305–315, Jan.2016.
[104] S. A. Liddelow and B. A. Barres, “Reactive Astrocytes: Production, Function,and Therapeutic Potential,” Immunity, vol. 46, pp. 957–967, June 2017.
[105] W.-S. Chung, C. A. Welsh, B. A. Barres, and B. Stevens, “Do glia drivesynaptic and cognitive impairment in disease?,” Nature Neuroscience, vol. 18,pp. 1539–1545, Nov. 2015.
[106] S. A. Liddelow and M. V. Sofroniew, “Astrocytes usurp neurons as a diseasefocus,” Nature Neuroscience, p. 1, Mar. 2019.
[107] A. Soung and R. S. Klein, “Viral Encephalitis and Neurologic Diseases: Focuson Astrocytes,” Trends in Molecular Medicine, Oct. 2018.
[108] R. K. Orkand, J. G. Nicholls, and S. W. Kuffler, “Effect of nerve impulseson the membrane potential of glial cells in the central nervous system of am-phibia,” Journal of Neurophysiology, vol. 29, pp. 788–806, July 1966.
[109] H. Sontheimer, “Voltage-dependent ion channels in glial cells,” Glia, vol. 11,pp. 156–172, June 1994.
[110] A. Cornell-Bell, S. Finkbeiner, M. Cooper, and S. Smith, “Glutamate inducescalcium waves in cultured astrocytes: long-range glial signaling,” Science,vol. 247, pp. 470–473, Jan. 1990.
[111] M. A. Di Castro, J. Chuquet, N. Liaudet, K. Bhaukaurally, M. Santello,D. Bouvier, P. Tiret, and A. Volterra, “Local Ca2+ detection and modulationof synaptic release by astrocytes,” Nature Neuroscience, vol. 14, pp. 1276–1284,Oct. 2011.
[112] M. Gómez-Gonzalo, M. Navarrete, G. Perea, A. Covelo, M. Martín-Fernández,R. Shigemoto, R. Luján, and A. Araque, “Endocannabinoids Induce LateralLong-Term Potentiation of Transmitter Release by Stimulation of Gliotrans-mission,” Cerebral Cortex (New York, N.Y.: 1991), vol. 25, pp. 3699–3712,Oct. 2015.
[113] A. Panatier, D. T. Theodosis, J.-P. Mothet, B. Touquet, L. Pollegioni, D. A.Poulain, and S. H. R. Oliet, “Glia-Derived d-Serine Controls NMDA ReceptorActivity and Synaptic Memory,” Cell, vol. 125, pp. 775–784, May 2006.
Cette thèse est accessible à l'adresse : http://theses.insa-lyon.fr/publication/2019LYSEI093/these.pdf © [A. Denizot], [2019], INSA Lyon, tous droits réservés

198 BIBLIOGRAPHY
[114] N. Takata, T. Mishima, C. Hisatsune, T. Nagai, E. Ebisui, K. Mikoshiba, andH. Hirase, “Astrocyte calcium signaling transforms cholinergic modulation tocortical plasticity in vivo,” The Journal of Neuroscience: The Official Journalof the Society for Neuroscience, vol. 31, pp. 18155–18165, Dec. 2011.
[115] Y. Bernardinelli, D. Muller, and I. Nikonenko, “Astrocyte-Synapse StructuralPlasticity,” Neural Plasticity, vol. 2014, 2014.
[116] J. Grosche, V. Matyash, T. Möller, A. Verkhratsky, A. Reichenbach, andH. Kettenmann, “Microdomains for neuron–glia interaction: parallel fiber sig-naling to Bergmann glial cells,” Nature Neuroscience, vol. 2, pp. 139–143, Feb.1999.
[117] M. A. Xu-Friedman, K. M. Harris, and W. G. Regehr, “Three-DimensionalComparison of Ultrastructural Characteristics at Depressing and FacilitatingSynapses onto Cerebellar Purkinje Cells,” Journal of Neuroscience, vol. 21,pp. 6666–6672, Sept. 2001.
[118] J. Grosche, H. Kettenmann, and A. Reichenbach, “Bergmann glial cells formdistinct morphological structures to interact with cerebellar neurons,” Journalof Neuroscience Research, vol. 68, pp. 138–149, Apr. 2002.
[119] L. Pasti, A. Volterra, T. Pozzan, and G. Carmignoto, “Intracellular calciumoscillations in astrocytes: a highly plastic, bidirectional form of communicationbetween neurons and astrocytes in situ,” The Journal of Neuroscience: TheOfficial Journal of the Society for Neuroscience, vol. 17, pp. 7817–7830, Oct.1997.
[120] J. Kang, L. Jiang, S. A. Goldman, and M. Nedergaard, “Astrocyte-mediatedpotentiation of inhibitory synaptic transmission,” Nature Neuroscience, vol. 1,pp. 683–692, Dec. 1998.
[121] M. Navarrete, G. Perea, D. Fernandez de Sevilla, M. Gómez-Gonzalo,A. Núñez, E. D. Martín, and A. Araque, “Astrocytes mediate in vivocholinergic-induced synaptic plasticity,” PLoS biology, vol. 10, p. e1001259,Feb. 2012.
[122] Z. U. Khan, P. Koulen, M. Rubinstein, D. K. Grandy, and P. S. Goldman-Rakic, “An astroglia-linked dopamine D2-receptor action in prefrontal cortex,”Proceedings of the National Academy of Sciences of the United States of Amer-ica, vol. 98, pp. 1964–1969, Feb. 2001.
Cette thèse est accessible à l'adresse : http://theses.insa-lyon.fr/publication/2019LYSEI093/these.pdf © [A. Denizot], [2019], INSA Lyon, tous droits réservés

BIBLIOGRAPHY 199
[123] P. Jourdain, L. H. Bergersen, K. Bhaukaurally, P. Bezzi, M. Santello,M. Domercq, C. Matute, F. Tonello, V. Gundersen, and A. Volterra, “Glu-tamate exocytosis from astrocytes controls synaptic strength,” Nature Neuro-science, vol. 10, pp. 331–339, Mar. 2007.
[124] M. Santello, P. Bezzi, and A. Volterra, “TNFα Controls Glutamatergic Glio-transmission in the Hippocampal Dentate Gyrus,” Neuron, vol. 69, pp. 988–1001, Mar. 2011.
[125] Y. Bernardinelli, C. Salmon, E. V. Jones, W. T. Farmer, D. Stellwagen, andK. K. Murai, “Astrocytes Display Complex and Localized Calcium Responsesto Single-Neuron Stimulation in the Hippocampus,” Journal of Neuroscience,vol. 31, pp. 8905–8919, June 2011.
[126] M. Navarrete and A. Araque, “Endocannabinoids Mediate Neuron-AstrocyteCommunication,” Neuron, vol. 57, pp. 883–893, Mar. 2008.
[127] M. Navarrete and A. Araque, “Endocannabinoids Potentiate Synaptic Trans-mission through Stimulation of Astrocytes,” Neuron, vol. 68, pp. 113–126, Oct.2010.
[128] R. Min and T. Nevian, “Astrocyte signaling controls spike timing–dependentdepression at neocortical synapses,” Nature Neuroscience, vol. 15, pp. 746–753,May 2012.
[129] K. Matsui and C. E. Jahr, “Differential Control of Synaptic and Ectopic Vesic-ular Release of Glutamate,” Journal of Neuroscience, vol. 24, pp. 8932–8939,Oct. 2004.
[130] V. Parpura and R. Zorec, “Gliotransmission: Exocytotic release from astro-cytes,” Brain Research Reviews, vol. 63, pp. 83–92, May 2010.
[131] M. Zonta, A. Sebelin, S. Gobbo, T. Fellin, T. Pozzan, and G. Carmignoto,“Glutamate-mediated cytosolic calcium oscillations regulate a pulsatileprostaglandin release from cultured rat astrocytes,” The Journal of Physi-ology, vol. 553, pp. 407–414, Dec. 2003.
[132] G. Perea, M. Navarrete, and A. Araque, “Tripartite synapses: astrocytesprocess and control synaptic information,” Trends in Neurosciences, vol. 32,pp. 421–431, Aug. 2009.
[133] A. Araque, G. Carmignoto, P. G. Haydon, S. H. R. Oliet, R. Robitaille, andA. Volterra, “Gliotransmitters travel in time and space,” Neuron, vol. 81,pp. 728–739, Feb. 2014.
Cette thèse est accessible à l'adresse : http://theses.insa-lyon.fr/publication/2019LYSEI093/these.pdf © [A. Denizot], [2019], INSA Lyon, tous droits réservés

200 BIBLIOGRAPHY
[134] N. B. Hamilton and D. Attwell, “Do astrocytes really exocytose neurotrans-mitters?,” Nature Reviews. Neuroscience, vol. 11, pp. 227–238, Apr. 2010.
[135] I. Savtchouk and A. Volterra, “Gliotransmission: Beyond Black-and-White,”Journal of Neuroscience, vol. 38, pp. 14–25, Jan. 2018.
[136] T. A. Fiacco and K. D. McCarthy, “Multiple Lines of Evidence Indicate ThatGliotransmission Does Not Occur under Physiological Conditions,” Journal ofNeuroscience, vol. 38, pp. 3–13, Jan. 2018.
[137] S. Guerra-Gomes, N. Sousa, L. Pinto, and J. F. Oliveira, “Functional Rolesof Astrocyte Calcium Elevations: From Synapses to Behavior,” Frontiers inCellular Neuroscience, vol. 11, 2018.
[138] A. Perez-Alvarez, M. Navarrete, A. Covelo, E. D. Martin, and A. Araque,“Structural and functional plasticity of astrocyte processes and dendritic spineinteractions,” The Journal of Neuroscience: The Official Journal of the Societyfor Neuroscience, vol. 34, pp. 12738–12744, Sept. 2014.
[139] D. T. Theodosis, D. A. Poulain, and S. H. R. Oliet, “Activity-dependent struc-tural and functional plasticity of astrocyte-neuron interactions,” PhysiologicalReviews, vol. 88, pp. 983–1008, July 2008.
[140] J. P. Heller and D. A. Rusakov, “Morphological plasticity of astroglia: Un-derstanding synaptic microenvironment,” Glia, vol. 63, pp. 2133–2151, Dec.2015.
[141] V. Dave, G. W. Gordon, and K. D. McCarthy, “Cerebral type 2 astroglia areheterogeneous with respect to their ability to respond to neuroligands linkedto calcium mobilization,” Glia, vol. 4, no. 5, pp. 440–447, 1991.
[142] M. O. K. Enkvist, I. Holopainen, and K. E. O. Åkerman, “Glutamate receptor-linked changes in membrane potential and intracellular Ca2+ in primary ratastrocytes,” Glia, vol. 2, no. 6, pp. 397–402, 1989.
[143] C. H. Kastritsis, A. K. Salm, and K. McCarthy, “Stimulation of the P2ypurinergic receptor on type 1 astroglia results in inositol phosphate formationand calcium mobilization,” Journal of Neurochemistry, vol. 58, pp. 1277–1284,Apr. 1992.
[144] W. T. Kim, M. G. Rioult, and A. H. Cornell-Bell, “Glutamate-induced calciumsignaling in astrocytes,” Glia, vol. 11, pp. 173–184, June 1994.
Cette thèse est accessible à l'adresse : http://theses.insa-lyon.fr/publication/2019LYSEI093/these.pdf © [A. Denizot], [2019], INSA Lyon, tous droits réservés

BIBLIOGRAPHY 201
[145] K. D. McCarthy and A. K. Salm, “Pharmacologically-distinct subsets of as-troglia can be identified by their calcium response to neuroligands,” Neuro-science, vol. 41, pp. 325–333, Jan. 1991.
[146] M. J. Berridge, M. D. Bootman, and H. L. Roderick, “Calcium signalling:dynamics, homeostasis and remodelling,” Nature Reviews. Molecular Cell Bi-ology, vol. 4, pp. 517–529, July 2003.
[147] M. Glitsch, “Mechano- and pH-sensing convergence on Ca2+-mobilising pro-teins – a recipe for cancer?,” Cell Calcium, Mar. 2019.
[148] A. Maklad, A. Sharma, and I. Azimi, “Calcium Signaling in Brain Cancers:Roles and Therapeutic Targeting,” Cancers, vol. 11, p. 145, Feb. 2019.
[149] R. Rizzuto and T. Pozzan, “Microdomains of Intracellular Ca2+: MolecularDeterminants and Functional Consequences,” Physiological Reviews, vol. 86,pp. 369–408, Jan. 2006.
[150] G. Dupont, M. Falcke, V. Kirk, and J. Sneyd, “Some Background Physiology,”inModels of Calcium Signalling (G. Dupont, M. Falcke, V. Kirk, and J. Sneyd,eds.), Interdisciplinary Applied Mathematics, pp. 3–27, Cham: Springer In-ternational Publishing, 2016.
[151] H. Plattner and A. Verkhratsky, “The ancient roots of calcium signalling evo-lutionary tree,” Cell Calcium, vol. 57, pp. 123–132, Mar. 2015.
[152] K. K. Baskin, C. A. Makarewich, S. M. DeLeon, W. Ye, B. Chen, N. Beetz,H. Schrewe, R. Bassel-Duby, and E. N. Olson, “MED12 regulates a transcrip-tional network of calcium-handling genes in the heart,” JCI Insight, vol. 2,July 2017.
[153] B. N. Armbruster, X. Li, M. H. Pausch, S. Herlitze, and B. L. Roth, “Evolvingthe lock to fit the key to create a family of G protein-coupled receptors potentlyactivated by an inert ligand,” Proceedings of the National Academy of Sciencesof the United States of America, vol. 104, pp. 5163–5168, Mar. 2007.
[154] G. Ma, S. Wen, L. He, Y. Huang, Y. Wang, and Y. Zhou, “Optogenetic toolkitfor precise control of calcium signaling,” Cell Calcium, vol. 64, pp. 36–46, 2017.
[155] Z.-G. Ji and H. Wang, “Optogenetic control of astrocytes: Is it possible to treatastrocyte-related epilepsy?,” Brain Research Bulletin, vol. 110, pp. 20–25, Jan.2015.
Cette thèse est accessible à l'adresse : http://theses.insa-lyon.fr/publication/2019LYSEI093/these.pdf © [A. Denizot], [2019], INSA Lyon, tous droits réservés
202 BIBLIOGRAPHY
[156] A. X. Xie, J. Petravicz, and K. D. McCarthy, “Molecular approaches for ma-nipulating astrocytic signaling in vivo,” Frontiers in Cellular Neuroscience,vol. 9, p. 144, 2015.
[157] G. Losi, L. Mariotti, M. Sessolo, and G. Carmignoto, “New Tools to StudyAstrocyte Ca2+ Signal Dynamics in Brain Networks In Vivo,” Frontiers inCellular Neuroscience, vol. 11, p. 134, 2017.
[158] D. A. Rusakov, “Disentangling calcium-driven astrocyte physiology,” NatureReviews Neuroscience, vol. 16, pp. 226–233, Apr. 2015.
[159] A. Volterra, N. Liaudet, and I. Savtchouk, “Astrocyte Ca2+ signalling: anunexpected complexity,” Nature Reviews Neuroscience, vol. 15, pp. 327–335,Apr. 2014.
[160] A. Panatier, J. Vallée, M. Haber, K. K. Murai, J.-C. Lacaille, and R. Ro-bitaille, “Astrocytes are endogenous regulators of basal transmission at centralsynapses,” Cell, vol. 146, pp. 785–798, Sept. 2011.
[161] X. Tong, E. Shigetomi, L. L. Looger, and B. S. Khakh, “Genetically encodedcalcium indicators and astrocyte calcium microdomains,” The Neuroscientist:A Review Journal Bringing Neurobiology, Neurology and Psychiatry, vol. 19,pp. 274–291, June 2013.
[162] N. A. Smith, B. T. Kress, Y. Lu, D. Chandler-Militello, A. Benraiss, andM. Nedergaard, “Fluorescent Ca2+ indicators directly inhibit the Na,K-ATPase and disrupt cellular functions,” Sci. Signal., vol. 11, p. eaal2039, Jan.2018.
[163] S. A. Hires, L. Tian, and L. L. Looger, “Reporting neural activity with ge-netically encoded calcium indicators,” Brain Cell Biology, vol. 36, p. 69, Aug.2008.
[164] L. Tian, S. A. Hires, and L. L. Looger, “Imaging Neuronal Activity with Genet-ically Encoded Calcium Indicators,” Cold Spring Harbor Protocols, vol. 2012,p. pdb.top069609, June 2012.
[165] L. Ye, M. A. Haroon, A. Salinas, and M. Paukert, “Comparison of GCaMP3and GCaMP6f for studying astrocyte Ca2+ dynamics in the awake mousebrain,” PLOS ONE, vol. 12, p. e0181113, July 2017.
[166] R. Srinivasan, T. Y. Lu, H. Chai, J. Xu, B. S. Huang, P. Golshani, G. Cop-pola, and B. S. Khakh, “New Transgenic Mouse Lines for Selectively TargetingAstrocytes and Studying Calcium Signals in Astrocyte Processes In Situ andIn Vivo,” Neuron, vol. 92, no. 6, pp. 1181–1195, 2016.
Cette thèse est accessible à l'adresse : http://theses.insa-lyon.fr/publication/2019LYSEI093/these.pdf © [A. Denizot], [2019], INSA Lyon, tous droits réservés

BIBLIOGRAPHY 203
[167] F. Niwa, S. Sakuragi, A. Kobayashi, S. Takagi, Y. Oda, H. Bannai, andK. Mikoshiba, “Dissection of local Ca(2+) signals inside cytosol by ER-targeted Ca(2+) indicator,” Biochemical and Biophysical Research Commu-nications, vol. 479, no. 1, pp. 67–73, 2016.
[168] H. Bannai, M. Hirose, F. Niwa, and K. Mikoshiba, “Dissection of Local Ca2+Signals in Cultured Cells by Membrane-targeted Ca2+ Indicators,” JoVE(Journal of Visualized Experiments), p. e59246, Mar. 2019.
[169] E. Shigetomi, S. Kracun, M. V. Sofroniew, and B. S. Khakh, “A geneticallytargeted optical sensor to monitor calcium signals in astrocyte processes,”Nature Neuroscience, vol. 13, pp. 759–766, June 2010.
[170] Y. Zhao, S. Araki, J. Wu, T. Teramoto, Y.-F. Chang, M. Nakano, A. S.Abdelfattah, M. Fujiwara, T. Ishihara, T. Nagai, and R. E. Campbell, “AnExpanded Palette of Genetically Encoded Ca2+ Indicators,” Science, vol. 333,pp. 1888–1891, Sept. 2011.
[171] M. J. Henderson, H. A. Baldwin, C. A. Werley, S. Boccardo, L. R. Whitaker,X. Yan, G. T. Holt, E. R. Schreiter, L. L. Looger, A. E. Cohen, D. S. Kim,and B. K. Harvey, “A Low Affinity GCaMP3 Variant (GCaMPer) for Imagingthe Endoplasmic Reticulum Calcium Store,” PLOS ONE, vol. 10, p. e0139273,Oct. 2015.
[172] J. Suzuki, K. Kanemaru, K. Ishii, M. Ohkura, Y. Okubo, and M. Iino, “Imagingintraorganellar Ca2+ at subcellular resolution using CEPIA,” Nature Commu-nications, vol. 5, p. 4153, June 2014.
[173] J. Suzuki, K. Kanemaru, and M. Iino, “Genetically Encoded FluorescentIndicators for Organellar Calcium Imaging,” Biophysical Journal, vol. 111,pp. 1119–1131, Sept. 2016.
[174] H. Li, X. Wang, N. Zhang, M. K. Gottipati, V. Parpura, and S. Ding,“Imaging of mitochondrial Ca2+ dynamics in astrocytes using cell-specificmitochondria-targeted GCaMP5g/6s: Mitochondrial Ca2+ uptake and cy-tosolic Ca2+ availability via the endoplasmic reticulum store,” Cell calcium,vol. 56, pp. 457–466, Dec. 2014.
[175] Y. Okubo, K. Kanemaru, J. Suzuki, K. Kobayashi, K. Hirose, and M. Iino,“Inositol 1,4,5-trisphosphate receptor type 2-independent Ca2+ release fromthe endoplasmic reticulum in astrocytes,” Glia, vol. 67, no. 1, pp. 113–124,2019.
Cette thèse est accessible à l'adresse : http://theses.insa-lyon.fr/publication/2019LYSEI093/these.pdf © [A. Denizot], [2019], INSA Lyon, tous droits réservés

204 BIBLIOGRAPHY
[176] H. A. Zariwala, B. G. Borghuis, T. M. Hoogland, L. Madisen, L. Tian,C. I. D. Zeeuw, H. Zeng, L. L. Looger, K. Svoboda, and T.-W. Chen, “A Cre-Dependent GCaMP3 Reporter Mouse for Neuronal Imaging In Vivo,” Journalof Neuroscience, vol. 32, pp. 3131–3141, Feb. 2012.
[177] E. Shigetomi, S. Patel, and B. S. Khakh, “Probing the Complexities of Astro-cyte Calcium Signaling,” Trends in Cell Biology, vol. 26, pp. 300–312, Apr.2016.
[178] B. R. Conway and K. T. Demarest, “The Use of Biosensors to Study GPCRFunction: Applications for High-Content Screening,” Receptors and Channels,vol. 8, pp. 331–341, Jan. 2002.
[179] F. Ataei, M. Torkzadeh-Mahani, and S. Hosseinkhani, “A novel luminescentbiosensor for rapid monitoring of IP3 by split-luciferase complementary assay,”Biosensors and Bioelectronics, vol. 41, pp. 642–648, Mar. 2013.
[180] A. Tanimura, T. Mochizuki, T. Morita, A. Nezu, Y. Tojyo, M. Arisawa,and S. Shuto, “A fluorescence-based method for evaluating inositol 1,4,5-trisphosphate receptor ligands: Determination of subtype selectivity and par-tial agonist effects,” Journal of Biotechnology, vol. 167, pp. 248–254, Sept.2013.
[181] A. Miyamoto and K. Mikoshiba, “Probes for manipulating and monitoringIP3,” Cell Calcium, vol. 64, pp. 57–64, June 2017.
[182] F. Barbagallo, B. Xu, G. R. Reddy, T. West, Q. Wang, Q. Fu, M. Li, Q. Shi,K. S. Ginsburg, W. Ferrier, A. M. Isidori, F. Naro, H. H. Patel, J. Bossuyt,D. Bers, and Y. K. Xiang, “Genetically Encoded Biosensors Reveal PKA Hy-perphosphorylation on the Myofilaments in Rabbit Heart Failure,” Circulationresearch, vol. 119, pp. 931–943, Sept. 2016.
[183] N. C. Surdo, M. Berrera, A. Koschinski, M. Brescia, M. R. Machado, C. Carr,P. Wright, J. Gorelik, S. Morotti, E. Grandi, D. M. Bers, S. Pantano, andM. Zaccolo, “FRET biosensor uncovers cAMP nano-domains at β-adrenergictargets that dictate precise tuning of cardiac contractility,” Nature Communi-cations, vol. 8, p. 15031, Apr. 2017.
[184] D. L. Prole and C. W. Taylor, “A genetically-encoded toolkit of functional-ized nanobodies against fluorescent proteins for visualizing and manipulatingintracellular signalling,” bioRxiv, p. 544700, Feb. 2019.
[185] H. Dana, Y. Sun, B. Mohar, B. Hulse, J. P. Hasseman, G. Tsegaye, A. Tsang,A. Wong, R. Patel, J. J. Macklin, Y. Chen, A. Konnerth, V. Jayaraman,
Cette thèse est accessible à l'adresse : http://theses.insa-lyon.fr/publication/2019LYSEI093/these.pdf © [A. Denizot], [2019], INSA Lyon, tous droits réservés

BIBLIOGRAPHY 205
L. L. Looger, E. R. Schreiter, K. Svoboda, and D. S. Kim, “High-performanceGFP-based calcium indicators for imaging activity in neuronal populationsand microcompartments,” bioRxiv, p. 434589, Oct. 2018.
[186] T.-W. Chen, T. J. Wardill, Y. Sun, S. R. Pulver, S. L. Renninger, A. Bao-han, E. R. Schreiter, R. A. Kerr, M. B. Orger, V. Jayaraman, L. L. Looger,K. Svoboda, and D. S. Kim, “Ultrasensitive fluorescent proteins for imagingneuronal activity,” Nature, vol. 499, pp. 295–300, July 2013.
[187] S. Tang, F. Reddish, Y. Zhuo, and J. J. Yang, “Fast kinetics of calcium signal-ing and sensor design,” Current Opinion in Chemical Biology, vol. 27, pp. 90–97, Aug. 2015.
[188] L. Lindenburg and M. Merkx, “Engineering Genetically Encoded FRET Sen-sors,” Sensors, vol. 14, pp. 11691–11713, July 2014.
[189] T. A. Weissman, P. A. Riquelme, L. Ivic, A. C. Flint, and A. R. Kriegstein,“Calcium Waves Propagate through Radial Glial Cells and Modulate Prolif-eration in the Developing Neocortex,” Neuron, vol. 43, pp. 647–661, Sept.2004.
[190] M. R. Metea and E. A. Newman, “Calcium Signaling in Specialized GlialCells,” Glia, vol. 54, pp. 650–655, Nov. 2006.
[191] J. Yang, H. Yang, Y. Liu, X. Li, L. Qin, H. Lou, S. Duan, and H. Wang, “Astro-cytes contribute to synapse elimination Via type 2 inositol 1,4,5-trisphosphatereceptor-dependent release of ATP,” eLife, vol. 5, no. APRIL2016, 2016.
[192] S. Sultan, L. Li, J. Moss, F. Petrelli, F. Cassé, E. Gebara, J. Lopatar,F. Pfrieger, P. Bezzi, J. Bischofberger, and N. Toni, “Synaptic Integrationof Adult-Born Hippocampal Neurons Is Locally Controlled by Astrocytes,”Neuron, vol. 88, pp. 957–972, Dec. 2015.
[193] S. A. Hill, A. Blaeser, A. Coley, Y. Xie, K. A. Shepard, C. Harwell, W.-J.Gao, and A. D. R. Garcia, “Sonic hedgehog signaling in astrocytes mediatescell-type-specific synaptic organization,” bioRxiv, p. 537860, Feb. 2019.
[194] M. Nedergaard, “Direct signaling from astrocytes to neurons in cultures ofmammalian brain cells,” Science, vol. 263, pp. 1768–1771, Mar. 1994.
[195] V. Parpura, T. A. Basarsky, F. Liu, K. Jeftinija, S. Jeftinija, and P. G. Haydon,“Glutamate-mediated astrocyte–neuron signalling,” Nature, vol. 369, p. 744,June 1994.
Cette thèse est accessible à l'adresse : http://theses.insa-lyon.fr/publication/2019LYSEI093/these.pdf © [A. Denizot], [2019], INSA Lyon, tous droits réservés

206 BIBLIOGRAPHY
[196] I. R. Winship, N. Plaa, and T. H. Murphy, “Rapid astrocyte calcium signalscorrelate with neuronal activity and onset of the hemodynamic response invivo,” The Journal of Neuroscience: The Official Journal of the Society forNeuroscience, vol. 27, pp. 6268–6272, June 2007.
[197] E. Shigetomi, X. Tong, K. Y. Kwan, D. P. Corey, and B. S. Khakh, “TRPA1channels regulate astrocyte resting calcium and inhibitory synapse efficacythrough GAT-3,” Nature Neuroscience, vol. 15, pp. 70–80, Jan. 2012.
[198] J. A. Filosa, A. D. Bonev, S. V. Straub, A. L. Meredith, M. K. Wilkerson,R. W. Aldrich, and M. T. Nelson, “Local potassium signaling couples neuronalactivity to vasodilation in the brain,” Nature Neuroscience, vol. 9, pp. 1397–1403, Nov. 2006.
[199] D. Attwell, A. M. Buchan, S. Charpak, M. Lauritzen, B. A. MacVicar, andE. A. Newman, “Glial and neuronal control of brain blood flow,” Nature,vol. 468, pp. 232–243, Nov. 2010.
[200] Y. Bernardinelli, J. Randall, E. Janett, I. Nikonenko, S. König, E. V. Jones,C. E. Flores, K. K. Murai, C. G. Bochet, A. Holtmaat, and D. Muller,“Activity-dependent structural plasticity of perisynaptic astrocytic domainspromotes excitatory synapse stability,” Current biology: CB, vol. 24, pp. 1679–1688, Aug. 2014.
[201] D. Molotkov, S. Zobova, J. M. Arcas, and L. Khiroug, “Calcium-induced out-growth of astrocytic peripheral processes requires actin binding by Profilin-1,”Cell Calcium, vol. 53, pp. 338–348, May 2013.
[202] M. Tanaka, P.-Y. Shih, H. Gomi, T. Yoshida, J. Nakai, R. Ando, T. Furuichi,K. Mikoshiba, A. Semyanov, and S. Itohara, “Astrocytic Ca2+ signals arerequired for the functional integrity of tripartite synapses,” Molecular Brain,vol. 6, p. 6, 2013.
[203] T. Sasaki, N. Matsuki, and Y. Ikegaya, “Action-Potential Modulation DuringAxonal Conduction,” Science, vol. 331, pp. 599–601, Feb. 2011.
[204] M. C. Angulo, A. S. Kozlov, S. Charpak, and E. Audinat, “Glutamate Releasedfrom Glial Cells Synchronizes Neuronal Activity in the Hippocampus,” Journalof Neuroscience, vol. 24, pp. 6920–6927, Aug. 2004.
[205] T. Fellin, O. Pascual, S. Gobbo, T. Pozzan, P. G. Haydon, and G. Carmignoto,“Neuronal Synchrony Mediated by Astrocytic Glutamate through Activationof Extrasynaptic NMDA Receptors,” Neuron, vol. 43, pp. 729–743, Sept. 2004.
Cette thèse est accessible à l'adresse : http://theses.insa-lyon.fr/publication/2019LYSEI093/these.pdf © [A. Denizot], [2019], INSA Lyon, tous droits réservés

BIBLIOGRAPHY 207
[206] P. Morquette, D. Verdier, A. Kadala, J. Féthière, A. G. Philippe, R. Robitaille,and A. Kolta, “An astrocyte-dependent mechanism for neuronal rhythmogen-esis,” Nature Neuroscience, vol. 18, no. 6, pp. 844–854, 2015.
[207] K. E. Poskanzer and R. Yuste, “Astrocytic regulation of cortical UP states,”Proceedings of the National Academy of Sciences, vol. 108, pp. 18453–18458,Nov. 2011.
[208] T. Sasaki, T. Ishikawa, R. Abe, R. Nakayama, A. Asada, N. Matsuki, andY. Ikegaya, “Astrocyte calcium signalling orchestrates neuronal synchroniza-tion in organotypic hippocampal slices,” The Journal of Physiology, vol. 592,pp. 2771–2783, July 2014.
[209] K. E. Poskanzer and R. Yuste, “Astrocytes regulate cortical state switching invivo,” Proceedings of the National Academy of Sciences of the United Statesof America, vol. 113, pp. E2675–2684, May 2016.
[210] J. F. Oliveira, V. M. Sardinha, S. Guerra-Gomes, A. Araque, and N. Sousa,“Do stars govern our actions? Astrocyte involvement in rodent behavior,”Trends in Neurosciences, vol. 38, pp. 535–549, Sept. 2015.
[211] M. Tanaka, X. Wang, K. Mikoshiba, H. Hirase, and Y. Shinohara, “Rearing-environment-dependent hippocampal local field potential differences in wild-type and inositol trisphosphate receptor type 2 knockout mice,” The Journalof Physiology, vol. 595, pp. 6557–6568, Oct. 2017.
[212] J. Petravicz, K. M. Boyt, and K. D. McCarthy, “Astrocyte IP3r2-dependentCa2+ signaling is not a major modulator of neuronal pathways governingbehavior,” Frontiers in Behavioral Neuroscience, vol. 8, Nov. 2014.
[213] V. M. Sardinha, S. Guerra-Gomes, I. Caetano, G. Tavares, M. Martins, J. S.Reis, J. S. Correia, A. Teixeira-Castro, L. Pinto, N. Sousa, and J. F. Oliveira,“Astrocytic signaling supports hippocampal–prefrontal theta synchronizationand cognitive function,” Glia, vol. 65, pp. 1944–1960, Dec. 2017.
[214] A. Adamsky, A. Kol, T. Kreisel, A. Doron, N. Ozeri-Engelhard, T. Melcer,R. Refaeli, H. Horn, L. Regev, M. Groysman, M. London, and I. Goshen,“Astrocytic Activation Generates De Novo Neuronal Potentiation and MemoryEnhancement,” Cell, vol. 174, pp. 59–71.e14, June 2018.
[215] X. Han, M. Chen, F. Wang, M. Windrem, S. Wang, S. Shanz, Q. Xu, N. A.Oberheim, L. Bekar, S. Betstadt, A. J. Silva, T. Takano, S. A. Goldman, and
Cette thèse est accessible à l'adresse : http://theses.insa-lyon.fr/publication/2019LYSEI093/these.pdf © [A. Denizot], [2019], INSA Lyon, tous droits réservés

208 BIBLIOGRAPHY
M. Nedergaard, “Forebrain engraftment by human glial progenitor cells en-hances synaptic plasticity and learning in adult mice,” Cell Stem Cell, vol. 12,pp. 342–353, Mar. 2013.
[216] M. Santello, N. Toni, and A. Volterra, “Astrocyte function from informationprocessing to cognition and cognitive impairment,” Nature Neuroscience, p. 1,Jan. 2019.
[217] X. Wang, N. Lou, Q. Xu, G.-F. Tian, W. G. Peng, X. Han, J. Kang, T. Takano,and M. Nedergaard, “Astrocytic Ca2+ signaling evoked by sensory stimulationin vivo,” Nature Neuroscience, vol. 9, pp. 816–823, June 2006.
[218] K. Kanemaru, H. Sekiya, M. Xu, K. Satoh, N. Kitajima, K. Yoshida,Y. Okubo, T. Sasaki, S. Moritoh, H. Hasuwa, M. Mimura, K. Horikawa,K. Matsui, T. Nagai, M. Iino, and K. Tanaka, “In Vivo Visualization of Sub-tle, Transient, and Local Activity of Astrocytes Using an Ultrasensitive Ca2+Indicator,” Cell Reports, vol. 8, pp. 311–318, July 2014.
[219] Y. Otsu, K. Couchman, D. G. Lyons, M. Collot, A. Agarwal, J.-M. Mallet,F. W. Pfrieger, D. E. Bergles, and S. Charpak, “Calcium dynamics in astro-cyte processes during neurovascular coupling,” Nature Neuroscience, vol. 18,pp. 210–218, Feb. 2015.
[220] J. Schummers, H. Yu, and M. Sur, “Tuned responses of astrocytes and theirinfluence on hemodynamic signals in the visual cortex,” Science (New York,N.Y.), vol. 320, pp. 1638–1643, June 2008.
[221] N. Chen, H. Sugihara, J. Sharma, G. Perea, J. Petravicz, C. Le, and M. Sur,“Nucleus basalis-enabled stimulus-specific plasticity in the visual cortex ismediated by astrocytes,” Proceedings of the National Academy of Sciences,vol. 109, pp. E2832–E2841, Oct. 2012.
[222] H. Monai, M. Ohkura, M. Tanaka, Y. Oe, A. Konno, H. Hirai, K. Mikoshiba,S. Itohara, J. Nakai, Y. Iwai, and H. Hirase, “Calcium imaging reveals glialinvolvement in transcranial direct current stimulation-induced plasticity inmouse brain,” Nature Communications, vol. 7, p. 11100, Mar. 2016.
[223] P. Cao, G. Donovan, M. Falcke, and J. Sneyd, “A stochastic model of calciumpuffs based on single-channel data,” Biophysical Journal, vol. 105, pp. 1133–1142, Sept. 2013.
[224] X. Cao, L.-P. Li, Q. Wang, Q. Wu, H.-H. Hu, M. Zhang, Y.-Y. Fang, J. Zhang,S.-J. Li, W.-C. Xiong, H.-C. Yan, Y.-B. Gao, J.-H. Liu, X.-W. Li, L.-R. Sun,
Cette thèse est accessible à l'adresse : http://theses.insa-lyon.fr/publication/2019LYSEI093/these.pdf © [A. Denizot], [2019], INSA Lyon, tous droits réservés
BIBLIOGRAPHY 209
Y.-N. Zeng, X.-H. Zhu, and T.-M. Gao, “Astrocyte-derived ATP modulatesdepressive-like behaviors,” Nature Medicine, vol. 19, pp. 773–777, June 2013.
[225] M. Martin-Fernandez, S. Jamison, L. M. Robin, Z. Zhao, E. D. Martin,J. Aguilar, M. A. Benneyworth, G. Marsicano, and A. Araque, “Synapse-specific astrocyte gating of amygdala-related behavior,” Nature Neuroscience,vol. 20, pp. 1540–1548, Nov. 2017.
[226] C. Agulhon, K. M. Boyt, A. X. Xie, F. Friocourt, B. L. Roth, and K. D.McCarthy, “Modulation of the autonomic nervous system and behaviour byacute glial cell Gq protein-coupled receptor activation in vivo,” The Journalof Physiology, vol. 591, pp. 5599–5609, Nov. 2013.
[227] C. H. T. Tran, G. Peringod, and G. R. Gordon, “Astrocytes Integrate Behav-ioral State and Vascular Signals during Functional Hyperemia,” Neuron, Oct.2018.
[228] X. Yu, A. M. W. Taylor, J. Nagai, P. Golshani, C. J. Evans, G. Coppola, andB. S. Khakh, “Reducing Astrocyte Calcium Signaling In Vivo Alters StriatalMicrocircuits and Causes Repetitive Behavior,” Neuron, vol. 99, pp. 1170–1187.e9, Sept. 2018.
[229] M. P. Mattson and S. L. Chan, “Neuronal and glial calcium signaling inAlzheimer’s disease,” Cell Calcium, vol. 34, pp. 385–397, Nov. 2003.
[230] K. V. Kuchibhotla, C. R. Lattarulo, B. T. Hyman, and B. J. Bacskai, “Syn-chronous Hyperactivity and Intercellular Calcium Waves in Astrocytes inAlzheimer Mice,” Science, vol. 323, pp. 1211–1215, Feb. 2009.
[231] D. Lim, J. J. Rodríguez-Arellano, V. Parpura, R. Zorec, F. Zeidán-Chuliá,A. A. Genazzani, and A. Verkhratsky, “Calcium signalling toolkits in as-trocytes and spatio-temporal progression of Alzheimer’s disease,” CurrentAlzheimer Research, vol. 13, no. 4, pp. 359–369, 2016.
[232] N. Vardjan, A. Verkhratsky, and R. Zorec, “Astrocytic Pathological CalciumHomeostasis and Impaired Vesicle Trafficking in Neurodegeneration,” Interna-tional Journal of Molecular Sciences, vol. 18, Feb. 2017.
[233] J. J. Rodríguez-Arellano, V. Parpura, R. Zorec, and A. Verkhratsky, “Astro-cytes in physiological aging and Alzheimer’s disease,” Neuroscience, vol. 323,pp. 170–182, May 2016.
[234] H. D. Booth, W. D. Hirst, and R. Wade-Martins, “The Role of AstrocyteDysfunction in Parkinson’s Disease Pathogenesis,” Trends in Neurosciences,vol. 40, pp. 358–370, June 2017.
Cette thèse est accessible à l'adresse : http://theses.insa-lyon.fr/publication/2019LYSEI093/these.pdf © [A. Denizot], [2019], INSA Lyon, tous droits réservés

210 BIBLIOGRAPHY
[235] P. Bedner, A. Dupper, K. Hüttmann, J. Müller, M. K. Herde, P. Dublin,T. Deshpande, J. Schramm, U. Häussler, C. A. Haas, C. Henneberger,M. Theis, and C. Steinhäuser, “Astrocyte uncoupling as a cause of humantemporal lobe epilepsy,” Brain, vol. 138, pp. 1208–1222, May 2015.
[236] G. Seifert, G. Carmignoto, and C. Steinhäuser, “Astrocyte dysfunction inepilepsy,” Brain Research Reviews, vol. 63, pp. 212–221, May 2010.
[237] A. Goudriaan, C. de Leeuw, S. Ripke, C. M. Hultman, P. Sklar, P. F. Sullivan,A. B. Smit, D. Posthuma, and M. H. G. Verheijen, “Specific Glial FunctionsContribute to Schizophrenia Susceptibility,” Schizophrenia Bulletin, vol. 40,pp. 925–935, July 2014.
[238] J. Nagai, A. K. Rajbhandari, M. R. Gangwani, A. Hachisuka, G. Coppola,S. C. Masmanidis, M. S. Fanselow, and B. S. Khakh, “Hyperactivity withDisrupted Attention by Activation of an Astrocyte Synaptogenic Cue,” Cell,Apr. 2019.
[239] G. Schmunk, R. L. Nguyen, D. L. Ferguson, K. Kumar, I. Parker, and J. J.Gargus, “High-throughput screen detects calcium signaling dysfunction in typ-ical sporadic autism spectrum disorder,” Scientific Reports, vol. 7, p. 40740,Feb. 2017.
[240] R. Moraga-Amaro, J. M. Jerez-Baraona, F. Simon, and J. Stehberg, “Role ofastrocytes in memory and psychiatric disorders,” Journal of Physiology-Paris,vol. 108, pp. 240–251, Sept. 2014.
[241] E. Shigetomi, K. Saito, F. Sano, and S. Koizumi, “Aberrant Calcium Signals inReactive Astrocytes: A Key Process in Neurological Disorders,” InternationalJournal of Molecular Sciences, vol. 20, p. 996, Jan. 2019.
[242] M. Nedergaard, J. J. Rodríguez, and A. Verkhratsky, “Glial calcium and dis-eases of the nervous system,” Cell Calcium, vol. 47, pp. 140–149, Feb. 2010.
[243] M. Pekny, M. Pekna, A. Messing, C. Steinhäuser, J.-M. Lee, V. Parpura, E. M.Hol, M. V. Sofroniew, and A. Verkhratsky, “Astrocytes: a central elementin neurological diseases,” Acta Neuropathologica, vol. 131, pp. 323–345, Mar.2016.
[244] J. R. Jones, L. Kong, M. G. Hanna, B. Hoffman, R. Krencik, R. Bradley,T. Hagemann, J. Choi, M. Doers, M. Dubovis, M. A. Sherafat, A. Bhat-tacharyya, C. Kendziorski, A. Audhya, A. Messing, and S.-C. Zhang, “Muta-tions in GFAP Disrupt the Distribution and Function of Organelles in HumanAstrocytes,” Cell Reports, vol. 25, pp. 947–958.e4, Oct. 2018.
Cette thèse est accessible à l'adresse : http://theses.insa-lyon.fr/publication/2019LYSEI093/these.pdf © [A. Denizot], [2019], INSA Lyon, tous droits réservés

BIBLIOGRAPHY 211
[245] J. W. Dani, A. Chernjavsky, and S. J. Smith, “Neuronal activity triggers cal-cium waves in hippocampal astrocyte networks,” Neuron, vol. 8, pp. 429–440,Mar. 1992.
[246] E. A. Newman and K. R. Zahs, “Calcium waves in retinal glial cells,” Science(New York, N.Y.), vol. 275, pp. 844–847, Feb. 1997.
[247] C. G. Schipke, C. Boucsein, C. Ohlemeyer, F. Kirchhoff, and H. Kettenmann,“Astrocyte Ca2+ waves trigger responses in microglial cells in brain slices,”FASEB journal: official publication of the Federation of American Societiesfor Experimental Biology, vol. 16, pp. 255–257, Feb. 2002.
[248] M. Paukert, A. Agarwal, J. Cha, V. A. Doze, J. U. Kang, and D. E. Bergles,“Norepinephrine controls astroglial responsiveness to local circuit activity,”Neuron, vol. 82, pp. 1263–1270, June 2014.
[249] F. Ding, J. O’Donnell, A. S. Thrane, D. Zeppenfeld, H. Kang, L. Xie, F. Wang,and M. Nedergaard, “α1-Adrenergic receptors mediate coordinated Ca2+ sig-naling of cortical astrocytes in awake, behaving mice,” Cell Calcium, vol. 54,pp. 387–394, Dec. 2013.
[250] P. B. Guthrie, J. Knappenberger, M. Segal, M. V. Bennett, A. C. Charles, andS. B. Kater, “ATP released from astrocytes mediates glial calcium waves,” TheJournal of Neuroscience: The Official Journal of the Society for Neuroscience,vol. 19, pp. 520–528, Jan. 1999.
[251] M. L. Cotrina, J. H. Lin, J. C. López-García, C. C. Naus, and M. Nedergaard,“ATP-mediated glia signaling,” The Journal of Neuroscience: The OfficialJournal of the Society for Neuroscience, vol. 20, pp. 2835–2844, Apr. 2000.
[252] C. E. Stout, J. L. Costantin, C. C. G. Naus, and A. C. Charles, “Intercellularcalcium signaling in astrocytes via ATP release through connexin hemichan-nels,” The Journal of Biological Chemistry, vol. 277, pp. 10482–10488, Mar.2002.
[253] C. Giaume and L. Venance, “Intercellular calcium signaling and gap junctionalcommunication in astrocytes,” Glia, vol. 24, pp. 50–64, Sept. 1998.
[254] M. D. Haustein, S. Kracun, X.-H. Lu, T. Shih, O. Jackson-Weaver, X. Tong,J. Xu, X. W. Yang, T. J. O’Dell, J. S. Marvin, M. H. Ellisman, E. A. Bushong,L. L. Looger, and B. S. Khakh, “Conditions and constraints for astrocytecalcium signaling in the hippocampal mossy fiber pathway,” Neuron, vol. 82,pp. 413–429, Apr. 2014.
Cette thèse est accessible à l'adresse : http://theses.insa-lyon.fr/publication/2019LYSEI093/these.pdf © [A. Denizot], [2019], INSA Lyon, tous droits réservés

212 BIBLIOGRAPHY
[255] E. Shigetomi, S. Kracun, and B. S. Khakh, “Monitoring astrocyte calciummicrodomains with improved membrane targeted GCaMP reporters,” NeuronGlia Biology, vol. 6, pp. 183–191, Aug. 2010.
[256] S. V. Straub, A. D. Bonev, M. K. Wilkerson, and M. T. Nelson, “Dynamicinositol trisphosphate-mediated calcium signals within astrocytic endfeet un-derlie vasodilation of cerebral arterioles,” The Journal of General Physiology,vol. 128, pp. 659–669, Dec. 2006.
[257] K. M. Dunn, D. C. Hill-Eubanks, W. B. Liedtke, and M. T. Nelson, “TRPV4channels stimulate Ca2+-induced Ca2+ release in astrocytic endfeet and am-plify neurovascular coupling responses,” Proceedings of the National Academyof Sciences of the United States of America, vol. 110, pp. 6157–6162, Apr.2013.
[258] R. Zorec, A. Araque, G. Carmignoto, P. G. Haydon, A. Verkhratsky, andV. Parpura, “Astroglial excitability and gliotransmission: an appraisal of Ca2+as a signalling route,” ASN NEURO, vol. 4, Mar. 2012.
[259] D. A. Rusakov, L. Bard, M. G. Stewart, and C. Henneberger, “Diversity ofastroglial functions alludes to subcellular specialisation,” Trends in Neuro-sciences, vol. 37, pp. 228–242, Apr. 2014.
[260] M. W. Sherwood, M. Arizono, C. Hisatsune, H. Bannai, E. Ebisui, J. L. Sher-wood, A. Panatier, S. H. R. Oliet, and K. Mikoshiba, “Astrocytic IP3rs: Con-tribution to Ca2+ signalling and hippocampal LTP,” Glia, vol. 65, pp. 502–513, Mar. 2017.
[261] I. Bosanac, J.-R. Alattia, T. K. Mal, J. Chan, S. Talarico, F. K. Tong, K. I.Tong, F. Yoshikawa, T. Furuichi, M. Iwai, T. Michikawa, K. Mikoshiba, andM. Ikura, “Structure of the inositol 1,4,5-trisphosphate receptor binding corein complex with its ligand,” Nature, vol. 420, pp. 696–700, Dec. 2002.
[262] M. J. Berridge, “Inositol trisphosphate and calcium signalling,” Nature,vol. 361, pp. 315–325, Jan. 1993.
[263] I. Parker and I. Ivorra, “Inhibition by Ca2+ of Inositol Trisphosphate-MediatedCa2+ Liberation: A Possible Mechanism for Oscillatory Release of Ca2+,”Proceedings of the National Academy of Science, vol. 87, pp. 260–264, Jan.1990.
[264] G. Dickinson, D. Swaminathan, and I. Parker, “The Probability of TriggeringCalcium Puffs Is Linearly Related to the Number of Inositol Trisphosphate
Cette thèse est accessible à l'adresse : http://theses.insa-lyon.fr/publication/2019LYSEI093/these.pdf © [A. Denizot], [2019], INSA Lyon, tous droits réservés
BIBLIOGRAPHY 213
Receptors in a Cluster,” Biophysical Journal, vol. 102, pp. 1826–1836, Apr.2012.
[265] I. F. Smith, S. M. Wiltgen, J. Shuai, and I. Parker, “Ca2+ Puffs Originatefrom Preestablished Stable Clusters of Inositol Trisphosphate Receptors,” Sci.Signal., vol. 2, pp. ra77–ra77, Nov. 2009.
[266] L. E. Wagner and D. I. Yule, “Differential regulation of the InsP3 receptor type-1 and -2 single channel properties by InsP3, Ca2+ and ATP,” The Journal ofPhysiology, vol. 590, pp. 3245–3259, July 2012.
[267] G. Dupont, M. Falcke, V. Kirk, and J. Sneyd, “The Calcium Toolbox,” inModels of Calcium Signalling (G. Dupont, M. Falcke, V. Kirk, and J. Sneyd,eds.), Interdisciplinary Applied Mathematics, pp. 29–96, Cham: Springer In-ternational Publishing, 2016.
[268] K. Thurley, A. Skupin, R. Thul, and M. Falcke, “Fundamental properties ofCa2 + signals,” Biochimica et Biophysica Acta (BBA) - General Subjects,vol. 1820, pp. 1185–1194, Aug. 2012.
[269] H. Ivanova, T. Vervliet, L. Missiaen, J. B. Parys, H. De Smedt, and G. Bul-tynck, “Inositol 1,4,5-trisphosphate receptor-isoform diversity in cell death andsurvival,” Biochimica et Biophysica Acta (BBA) - Molecular Cell Research,vol. 1843, pp. 2164–2183, Oct. 2014.
[270] C. W. Taylor and S. C. Tovey, “IP3 Receptors: Toward Understanding TheirActivation,” Cold Spring Harbor Perspectives in Biology, vol. 2, p. a004010,Dec. 2010.
[271] M.-D. Seo, M. Enomoto, N. Ishiyama, P. B. Stathopulos, and M. Ikura, “Struc-tural insights into endoplasmic reticulum stored calcium regulation by inositol1,4,5-trisphosphate and ryanodine receptors,” Biochimica Et Biophysica Acta,vol. 1853, pp. 1980–1991, Sept. 2015.
[272] T. Furuichi, S. Yoshikawa, A. Miyawaki, K. Wada, N. Maeda, andK. Mikoshiba, “Primary structure and functional expression of the inositol1,4,5-trisphosphate-binding protein P400,” Nature, vol. 342, pp. 32–38, Nov.1989.
[273] G. Fan, M. L. Baker, Z. Wang, M. R. Baker, P. A. Sinyagovskiy, W. Chiu, S. J.Ludtke, and I. I. Serysheva, “Gating machinery of InsP3R channels revealedby electron cryomicroscopy,” Nature, vol. 527, pp. 336–341, Nov. 2015.
Cette thèse est accessible à l'adresse : http://theses.insa-lyon.fr/publication/2019LYSEI093/these.pdf © [A. Denizot], [2019], INSA Lyon, tous droits réservés

214 BIBLIOGRAPHY
[274] I. I. Serysheva, M. R. Baker, and G. Fan, “Structural Insights intoIP<Subscript>3</Subscript>R Function,” in Membrane Dynamics and Cal-cium Signaling, Advances in Experimental Medicine and Biology, pp. 121–147,Springer, Cham, 2017.
[275] K. J. Alzayady, A. Sebé-Pedrós, R. Chandrasekhar, L. Wang, I. Ruiz-Trillo,and D. I. Yule, “Tracing the Evolutionary History of Inositol, 1, 4, 5-Trisphosphate Receptor: Insights from Analyses of Capsaspora owczarzakiCa2+ Release Channel Orthologs,” Molecular Biology and Evolution, vol. 32,pp. 2236–2253, Sept. 2015.
[276] L. Ionescu, C. White, K.-H. Cheung, J. Shuai, I. Parker, J. E. Pearson, J. K.Foskett, and D.-O. D. Mak, “Mode Switching Is the Major Mechanism ofLigand Regulation of InsP3 Receptor Calcium Release Channels,” The Journalof General Physiology, vol. 130, pp. 631–645, Dec. 2007.
[277] V. D. Lupu, E. Kaznacheyeva, U. M. Krishna, J. R. Falck, and I. Bezproz-vanny, “Functional coupling of phosphatidylinositol 4,5-bisphosphate to in-ositol 1,4,5-trisphosphate receptor,” The Journal of Biological Chemistry,vol. 273, pp. 14067–14070, June 1998.
[278] C. W. Taylor, “Regulation of IP3 receptors by cyclic AMP,” Cell Calcium,vol. 63, pp. 48–52, May 2017.
[279] T.-S. Tang, H. Tu, Z. Wang, and I. Bezprozvanny, “Modulation of Type 1Inositol (1,4,5)-Trisphosphate Receptor Function by Protein Kinase A andProtein Phosphatase 1α,” Journal of Neuroscience, vol. 23, pp. 403–415, Jan.2003.
[280] H. Sipma, P. De Smet, I. Sienaert, S. Vanlingen, L. Missiaen, J. B. Parys, andH. De Smedt, “Modulation of inositol 1,4,5-trisphosphate binding to the re-combinant ligand-binding site of the type-1 inositol 1,4, 5-trisphosphate recep-tor by Ca2+ and calmodulin,” The Journal of Biological Chemistry, vol. 274,pp. 12157–12162, Apr. 1999.
[281] N. Nadif Kasri, G. Bultynck, I. Sienaert, G. Callewaert, C. Erneux, L. Mis-siaen, J. B. Parys, and H. De Smedt, “The role of calmodulin for inositol1,4,5-trisphosphate receptor function,” Biochimica et Biophysica Acta (BBA)- Proteins and Proteomics, vol. 1600, pp. 19–31, Nov. 2002.
[282] B. Xiao, J. C. Tu, and P. F. Worley, “Homer: a link between neural activityand glutamate receptor function,” Current Opinion in Neurobiology, vol. 10,pp. 370–374, June 2000.
Cette thèse est accessible à l'adresse : http://theses.insa-lyon.fr/publication/2019LYSEI093/these.pdf © [A. Denizot], [2019], INSA Lyon, tous droits réservés

BIBLIOGRAPHY 215
[283] H. Ivanova, L. E. Wagner, A. Tanimura, E. Vandermarliere, T. Luyten,K. Welkenhuyzen, K. J. Alzayady, L. Wang, K. Hamada, K. Mikoshiba,H. De Smedt, L. Martens, D. I. Yule, J. B. Parys, and G. Bultynck, “Bcl-2 and IP3 compete for the ligand-binding domain of IP3rs modulating Ca2+signaling output,” Cellular and Molecular Life Sciences, Apr. 2019.
[284] I. Bosanac, T. Michikawa, K. Mikoshiba, and M. Ikura, “Structural insightsinto the regulatory mechanism of IP3 receptor,” Biochimica et Biophysica Acta(BBA) - Molecular Cell Research, vol. 1742, pp. 89–102, Dec. 2004.
[285] C. W. Taylor and V. Konieczny, “IP3 receptors: take four IP3 to open,” Sciencesignaling, vol. 9, p. pe1, Apr. 2016.
[286] I. I. Serysheva and S. J. Ludtke, “Chapter 8 - 3d Structure of IP3 Receptor,”in Current Topics in Membranes (I. I. Serysheva, ed.), vol. 66 of Structure andFunction of Calcium Release Channels, pp. 171–189, Academic Press, Jan.2010.
[287] F. Oschmann, H. Berry, K. Obermayer, and K. Lenk, “From in silico astrocytecell models to neuron-astrocyte network models: A review,” Brain ResearchBulletin, Feb. 2017.
[288] T. Manninen, R. Havela, and M.-L. Linne, “Computational Models forCalcium-Mediated Astrocyte Functions,” Frontiers in Computational Neuro-science, vol. 12, Apr. 2018.
[289] M. D. Pittà and H. Berry, Computational Glioscience. Springer, Jan. 2019.Google-Books-ID: LcKEDwAAQBAJ.
[290] D. Gonze, C. Gérard, B. Wacquier, A. Woller, A. Tosenberger, A. Goldbeter,and G. Dupont, “Modeling Based Investigation of the Effect of Noise in CellularSystems,” Frontiers in Molecular Biosciences, vol. 5, Apr. 2018.
[291] M. B. Elowitz, A. J. Levine, E. D. Siggia, and P. S. Swain, “Stochastic geneexpression in a single cell,” Science (New York, N.Y.), vol. 297, pp. 1183–1186,Aug. 2002.
[292] T. Székely and K. Burrage, “Stochastic simulation in systems biology,” Com-putational and Structural Biotechnology Journal, vol. 12, pp. 14–25, Nov. 2014.
[293] Cornish-Bowden, Fundamentals of Enzyme Kinetics. Portland Press, cornish-3rd ednma, l. e ed., 2004.
[294] J. C. Butcher, Numerical Methods for Ordinary Differential Equations. JohnWiley & Sons, Aug. 2016. Google-Books-ID: JlSvDAAAQBAJ.
Cette thèse est accessible à l'adresse : http://theses.insa-lyon.fr/publication/2019LYSEI093/these.pdf © [A. Denizot], [2019], INSA Lyon, tous droits réservés

216 BIBLIOGRAPHY
[295] J. E. Marsden and M. McCracken, The Hopf Bifurcation and Its Applica-tions. Springer Science & Business Media, Dec. 2012. Google-Books-ID:FTv0BwAAQBAJ.
[296] G. Dupont, M. Falcke, V. Kirk, and J. Sneyd, “Basic Modelling Principles: De-terministic Models,” in Models of Calcium Signalling (G. Dupont, M. Falcke,V. Kirk, and J. Sneyd, eds.), Interdisciplinary Applied Mathematics, pp. 97–161, Cham: Springer International Publishing, 2016.
[297] S. Girard, A. Lückhoff, J. Lechleiter, J. Sneyd, and D. Clapham, “Two-dimensional model of calcium waves reproduces the patterns observed in Xeno-pus oocytes,” Biophysical Journal, vol. 61, pp. 509–517, Feb. 1992.
[298] M. S. Jafri and A. Ullah, “Calcium Waves,” in Encyclopedia of ComputationalNeuroscience (D. Jaeger and R. Jung, eds.), pp. 1–11, New York, NY: SpringerNew York, 2013.
[299] A. Goldbeter, Biochemical Oscillations and Cellular Rhythms: The MolecularBases of Periodic and Chaotic Behaviour. Cambridge University Press, Jan.1996. Google-Books-ID: 6stfQgAACAAJ.
[300] A. Goldbeter, G. Dupont, and M. J. Berridge, “Minimal Model for Signal-Induced Ca2+ Oscillations and for Their Frequency Encoding Through Pro-tein Phosphorylation,” Proceedings of the National Academy of Science,vol. 87, pp. 1461–1465, Feb. 1990.
[301] G. Dupont and A. Goldbeter, “One-pool model for Ca2+ oscillations involvingCa2+ and inositol 1,4,5-trisphosphate as co-agonists for Ca2+ release,” CellCalcium, vol. 14, pp. 311–322, Apr. 1993.
[302] Y.-X. Li and J. Rinzel, “Equations for InsP3 Receptor-mediated [Ca2+]i Os-cillations Derived from a Detailed Kinetic Model: A Hodgkin-Huxley LikeFormalism,” Journal of Theoretical Biology, vol. 166, pp. 461–473, Feb. 1994.
[303] M. De Pittà, V. Volman, H. Levine, and E. Ben-Jacob, “Multimodal encodingin a simplified model of intracellular calcium signaling,” Cognitive Processing,vol. 10 Suppl 1, pp. S55–70, Feb. 2009.
[304] Y. Timofeeva, “Intracellular Calcium Dynamics: Biophysical and SimplifiedModels,” in Computational Glioscience (M. De Pittà and H. Berry, eds.),Springer Series in Computational Neuroscience, pp. 69–90, Cham: SpringerInternational Publishing, 2019.
Cette thèse est accessible à l'adresse : http://theses.insa-lyon.fr/publication/2019LYSEI093/these.pdf © [A. Denizot], [2019], INSA Lyon, tous droits réservés

BIBLIOGRAPHY 217
[305] T. Meyer and L. Stryer, “Molecular model for receptor-stimulated calciumspiking,” Proceedings of the National Academy of Sciences, vol. 85, pp. 5051–5055, July 1988.
[306] G. Dupont and C. Erneux, “Simulations of the effects of inositol 1,4,5-trisphosphate 3-kinase and 5-phosphatase activities on Ca2+ oscillations,” CellCalcium, vol. 22, pp. 321–331, Nov. 1997.
[307] G. Dupont, O. Koukoui, C. Clair, C. Erneux, S. Swillens, and L. Combettes,“Ca2+ oscillations in hepatocytes do not require the modulation of InsP3 3-kinase activity by Ca2+,” FEBS Letters, vol. 534, no. 1-3, pp. 101–105, 2003.
[308] I. Bezprozvanny, J. Watras, and B. E. Ehrlich, “Bell-shaped calcium-responsecurves of Ins(1,4,5)P3- and calcium-gated channels from endoplasmic reticu-lum of cerebellum,” Nature, vol. 351, pp. 751–754, June 1991.
[309] S. K. Joseph, H. L. Rice, and J. R. Williamson, “The effect of external calciumand pH on inositol trisphosphate-mediated calcium release from cerebellummicrosomal fractions,” Biochemical Journal, vol. 258, pp. 261–265, Feb. 1989.
[310] J. Watras, I. Bezprozvanny, and B. E. Ehrlich, “Inositol 1,4,5-trisphosphate-gated channels in cerebellum: presence of multiple conductance states,” Jour-nal of Neuroscience, vol. 11, pp. 3239–3245, Oct. 1991.
[311] H. G. Othmer and Y. Tang, “Oscillations and Waves in a Model of InsP3-Controlled Calcium Dynamics,” in Experimental and Theoretical Advances inBiological Pattern Formation (H. G. Othmer, P. K. Maini, and J. D. Murray,eds.), pp. 277–300, Boston, MA: Springer US, 1993.
[312] I. Bezprozvanny, “Theoretical analysis of calcium wave propagation based oninositol (1,4,5)-trisphosphate (InsP3) receptor functional properties,” Cell Cal-cium, vol. 16, pp. 151–166, Sept. 1994.
[313] J. Shuai, J. E. Pearson, J. K. Foskett, D.-O. D. Mak, and I. Parker, “A kineticmodel of single and clustered IP3 receptors in the absence of Ca2+ feedback,”Biophysical Journal, vol. 93, pp. 1151–1162, Aug. 2007.
[314] J. Sneyd and J.-F. Dufour, “A dynamic model of the type-2 inositol trispho-sphate receptor,” Proceedings of the National Academy of Sciences, vol. 99,pp. 2398–2403, Feb. 2002.
[315] G. Ullah and P. Jung, “Modeling the Statistics of Elementary Calcium ReleaseEvents,” Biophysical Journal, vol. 90, pp. 3485–3495, May 2006.
Cette thèse est accessible à l'adresse : http://theses.insa-lyon.fr/publication/2019LYSEI093/these.pdf © [A. Denizot], [2019], INSA Lyon, tous droits réservés

218 BIBLIOGRAPHY
[316] J. W. Shuai, D. P. Yang, J. E. Pearson, and S. Rüdiger, “An investigationof models of the IP3r channel in Xenopus oocyte.,” Chaos (Woodbury, N.Y.),Chaos, vol. 19, 19, pp. 037105–037105, Sept. 2009.
[317] Y. X. Li, S. S. Stojilković, J. Keizer, and J. Rinzel, “Sensing and refillingcalcium stores in an excitable cell,” Biophysical Journal, vol. 72, pp. 1080–1091, Mar. 1997.
[318] J. Wagner, Y.-X. Li, J. Pearson, and J. Keizer, “Simulation of the FertilizationCa2+ Wave in Xenopus laevis Eggs,” Biophysical Journal, vol. 75, pp. 2088–2097, Oct. 1998.
[319] Y.-X. Li, “Tango waves in a bidomain model of fertilization calcium waves,”Physica D: Nonlinear Phenomena, vol. 186, pp. 27–49, Dec. 2003.
[320] S. Schuster, M. Marhl, and T. Höfer, “Modelling of simple and complex calciumoscillations,” European Journal of Biochemistry, vol. 269, no. 5, pp. 1333–1355,2002.
[321] G. Dupont, M. Falcke, V. Kirk, and J. Sneyd, Models of Calcium Signalling,vol. 43 of Interdisciplinary Applied Mathematics. Cham: Springer Interna-tional Publishing, 2016.
[322] G. Ullah, P. Jung, and A. H. Cornell-Bell, “Anti-phase calcium oscillationsin astrocytes via inositol (1, 4, 5)-trisphosphate regeneration,” Cell Calcium,vol. 39, pp. 197–208, Mar. 2006.
[323] M. Lavrentovich and S. Hemkin, “A mathematical model of spontaneous cal-cium(II) oscillations in astrocytes,” Journal of Theoretical Biology, vol. 251,pp. 553–560, Apr. 2008.
[324] S. Zeng, B. Li, S. Zeng, and S. Chen, “Simulation of Spontaneous Ca2+ Os-cillations in Astrocytes Mediated by Voltage-Gated Calcium Channels,” Bio-physical Journal, vol. 97, pp. 2429–2437, Nov. 2009.
[325] F. Oschmann, K. Mergenthaler, E. Jungnickel, and K. Obermayer, “Spatialseparation of two different pathways accounting for the generation of calciumsignals in astrocytes,” PLOS Computational Biology, vol. 13, p. e1005377, Feb.2017.
[326] I. Goto, S. Kinoshita, and K. Natsume, “The model of glutamate-inducedintracellular Ca2+ oscillation and intercellular Ca2+ wave in brain astrocytes,”Neurocomputing - IJON, vol. 58, pp. 461–467, June 2004.
Cette thèse est accessible à l'adresse : http://theses.insa-lyon.fr/publication/2019LYSEI093/these.pdf © [A. Denizot], [2019], INSA Lyon, tous droits réservés

BIBLIOGRAPHY 219
[327] M. Stamatakis and N. V. Mantzaris, “Modeling of ATP-mediated signal trans-duction and wave propagation in astrocytic cellular networks,” Journal of The-oretical Biology, vol. 241, pp. 649–668, Aug. 2006.
[328] F. Wei and J. Shuai, “Intercellular calcium waves in glial cells with bistabledynamics,” Physical biology, vol. 8, p. 026009, Mar. 2011.
[329] A. Di Garbo, M. Barbi, S. Chillemi, S. Alloisio, and M. Nobile, “Calciumsignalling in astrocytes and modulation of neural activity,” Biosystems, vol. 89,pp. 74–83, May 2007.
[330] M. D. Pittà, V. Volman, H. Berry, and E. Ben-Jacob, “A Tale of Two Sto-ries: Astrocyte Regulation of Synaptic Depression and Facilitation,” PLOSComputational Biology, vol. 7, p. e1002293, Dec. 2011.
[331] M. R. Bennett, L. Farnell, and W. G. Gibson, “Origins of blood volume changedue to glutamatergic synaptic activity at astrocytes abutting on arteriolarsmooth muscle cells,” Journal of Theoretical Biology, vol. 250, pp. 172–185,Jan. 2008.
[332] J. Riera, R. Hatanaka, T. Uchida, T. Ozaki, and R. Kawashima, “Quantifyingthe Uncertainty of Spontaneous Ca2+ Oscillations in Astrocytes: Particularsof Alzheimer’s Disease,” Biophysical Journal, vol. 101, pp. 554–564, Aug. 2011.
[333] M. De Pittà, M. Goldberg, V. Volman, H. Berry, and E. Ben-Jacob, “Glu-tamate regulation of calcium and IP3 oscillating and pulsating dynamics inastrocytes,” Journal of Biological Physics, vol. 35, pp. 383–411, Oct. 2009.
[334] M. De Pittà, E. Ben-Jacob, and H. Berry, “G Protein-Coupled Receptor-Mediated Calcium Signaling in Astrocytes,” in Computational Glioscience(M. De Pittà and H. Berry, eds.), Springer Series in Computational Neu-roscience, pp. 115–150, Cham: Springer International Publishing, 2019.
[335] J. Lallouette, Modélisation des réponses calciques de réseaux d’astrocytes :Relations entre topologie et dynamiques. thesis, Lyon, INSA, Dec. 2014.
[336] Y. Tang, J. L. Stephenson, and H. G. Othmer, “Simplification and analysis ofmodels of calcium dynamics based on IP3-sensitive calcium channel kinetics,”Biophysical Journal, vol. 70, pp. 246–263, Jan. 1996.
[337] T. Höfer, L. Venance, and C. Giaume, “Control and Plasticity of IntercellularCalcium Waves in Astrocytes: A Modeling Approach,” Journal of Neuro-science, vol. 22, pp. 4850–4859, June 2002.
Cette thèse est accessible à l'adresse : http://theses.insa-lyon.fr/publication/2019LYSEI093/these.pdf © [A. Denizot], [2019], INSA Lyon, tous droits réservés

220 BIBLIOGRAPHY
[338] U. Kummer, L. F. Olsen, C. J. Dixon, A. K. Green, E. Bornberg-Bauer, andG. Baier, “Switching from Simple to Complex Oscillations in Calcium Signal-ing,” Biophysical Journal, vol. 79, pp. 1188–1195, Sept. 2000.
[339] R. Thul, T. C. Bellamy, H. L. Roderick, M. D. Bootman, and S. Coombes,“Calcium Oscillations,” in Cellular Oscillatory Mechanisms (M. Maroto andN. A. M. Monk, eds.), Advances in Experimental Medicine and Biology, pp. 1–27, New York, NY: Springer New York, 2009.
[340] G. Dupont and J. Sneyd, “Recent developments in models of calcium sig-nalling,” Current Opinion in Systems Biology, vol. 3, pp. 15–22, June 2017.
[341] I. Siekmann, P. Cao, J. Sneyd, and E. J. Crampin, “Data-driven modellingof the inositol trisphosphate receptor (IPR) and its role in calcium inducedcalcium release (CICR),” ResearchGate, July 2015.
[342] K. Hituri and M.-L. Linne, “Comparison of Models for IP3 Receptor KineticsUsing Stochastic Simulations,” PLOS ONE, vol. 8, p. e59618, Apr. 2013.
[343] Y. Togashi and K. Kaneko, “Transitions Induced by the Discreteness ofMolecules in a Small Autocatalytic System,” Physical Review Letters, vol. 86,pp. 2459–2462, Mar. 2001.
[344] N. M. Shnerb, Y. Louzoun, E. Bettelheim, and S. Solomon, “The importanceof being discrete: Life always wins on the surface,” Proceedings of the NationalAcademy of Sciences, vol. 97, pp. 10322–10324, Sept. 2000.
[345] D. Frigola, L. Casanellas, J. M. Sancho, and M. Ibañes, “Asymmetric Stochas-tic Switching Driven by Intrinsic Molecular Noise,” PLOS ONE, vol. 7,p. e31407, Feb. 2012.
[346] D. T. Gillespie, “Exact stochastic simulation of coupled chemical reactions,”The Journal of Physical Chemistry, vol. 81, pp. 2340–2361, Dec. 1977.
[347] N. G. V. Kampen, Stochastic Processes in Physics and Chemistry. Elsevier,Aug. 2011.
[348] A. B. Bortz, M. H. Kalos, and J. L. Lebowitz, “A new algorithm for MonteCarlo simulation of Ising spin systems,” Journal of Computational Physics,vol. 17, pp. 10–18, Jan. 1975.
[349] P. Kratzer, “Monte Carlo and kinetic Monte Carlo methods,” arXiv:0904.2556[cond-mat, physics:physics], Apr. 2009. arXiv: 0904.2556.
Cette thèse est accessible à l'adresse : http://theses.insa-lyon.fr/publication/2019LYSEI093/these.pdf © [A. Denizot], [2019], INSA Lyon, tous droits réservés

BIBLIOGRAPHY 221
[350] J. R. Winkler, “Numerical recipes in C: The art of scientific computing, secondedition,” Endeavour, vol. 17, p. 201, Jan. 1993.
[351] D. J. Wilkinson, Stochastic Modelling for Systems Biology. CRC Press, Nov.2011. Google-Books-ID: 7jnNBQAAQBAJ.
[352] Singh Abhyudai and Hespanha João P., “Stochastic hybrid systems for study-ing biochemical processes,” Philosophical Transactions of the Royal SocietyA: Mathematical, Physical and Engineering Sciences, vol. 368, pp. 4995–5011,Nov. 2010.
[353] D. Higham., “An Algorithmic Introduction to Numerical Simulation ofStochastic Differential Equations,” SIAM Review, vol. 43, pp. 525–546, Jan.2001.
[354] P. E. Kloeden and E. Platen, “Stochastic Differential Equations,” in NumericalSolution of Stochastic Differential Equations (P. E. Kloeden and E. Platen,eds.), Applications of Mathematics, pp. 103–160, Berlin, Heidelberg: SpringerBerlin Heidelberg, 1992.
[355] D. T. Gillespie, “Stochastic simulation of chemical kinetics,” Annual Reviewof Physical Chemistry, vol. 58, pp. 35–55, 2007.
[356] D. Higham, “Modeling and Simulating Chemical Reactions,” SIAM Review,vol. 50, pp. 347–368, Jan. 2008.
[357] D. T. Gillespie and E. Seitaridou, Simple Brownian Diffusion: An Introductionto the Standard Theoretical Models. OUP Oxford, 2013.
[358] M. A. Gibson and J. Bruck, “Efficient exact stochastic simulation of chemi-cal systems with many species and many channels,” The Journal of PhysicalChemistry A, vol. 104, no. 9, pp. 1876–1889, 2000.
[359] Y. Cao, D. Gillespie, and L. Petzold, “Multiscale stochastic simulation algo-rithm with stochastic partial equilibrium assumption for chemically reactingsystems,” Journal of Computational Physics, vol. 206, pp. 395–411, July 2005.
[360] W. E, D. Liu, and E. Vanden-Eijnden, “Nested stochastic simulation algo-rithms for chemical kinetic systems with multiple time scales,” Journal ofComputational Physics, vol. 221, pp. 158–180, Jan. 2007.
[361] E. L. Haseltine and J. B. Rawlings, “Approximate simulation of coupled fastand slow reactions for stochastic chemical kinetics,” The Journal of ChemicalPhysics, vol. 117, pp. 6959–6969, Sept. 2002.
Cette thèse est accessible à l'adresse : http://theses.insa-lyon.fr/publication/2019LYSEI093/these.pdf © [A. Denizot], [2019], INSA Lyon, tous droits réservés

222 BIBLIOGRAPHY
[362] D. T. Gillespie and L. R. Petzold, “Improved leap-size selection for acceleratedstochastic simulation,” The Journal of Chemical Physics, vol. 119, pp. 8229–8234, Oct. 2003.
[363] T. Tian and K. Burrage, “Binomial leap methods for simulating stochasticchemical kinetics,” The Journal of Chemical Physics, vol. 121, pp. 10356–10364, Nov. 2004.
[364] J. Pahle, “Biochemical simulations: stochastic, approximate stochastic andhybrid approaches,” Briefings in Bioinformatics, vol. 10, pp. 53–64, Jan. 2009.
[365] J. Goutsias and G. Jenkinson, “Markovian dynamics on complex reaction net-works,” Physics Reports, vol. 529, pp. 199–264, Aug. 2013.
[366] A. Skupin, H. Kettenmann, U. Winkler, M. Wartenberg, H. Sauer, S. C. Tovey,C. W. Taylor, and M. Falcke, “How Does Intracellular Ca2+ Oscillate: ByChance or by the Clock?,” Biophysical Journal, vol. 94, pp. 2404–2411, Mar.2008.
[367] M. Perc, A. K. Green, C. J. Dixon, and M. Marhl, “Establishing the stochasticnature of intracellular calcium oscillations from experimental data,” Biophys-ical Chemistry, vol. 132, pp. 33–38, Jan. 2008.
[368] J. S. Marchant and I. Parker, “Role of elementary Ca2+ puffs in generatingrepetitive Ca2+ oscillations,” The EMBO Journal, vol. 20, pp. 65–76, Jan.2001.
[369] J. W. Shuai and P. Jung, “Optimal ion channel clustering for intracellularcalcium signaling,” Proceedings of the National Academy of Sciences, vol. 100,pp. 506–510, Jan. 2003.
[370] A. Skupin and M. Falcke, “From puffs to global Ca2+ signals: how molecularproperties shape global signals,” Chaos (Woodbury, N.Y.), vol. 19, p. 037111,Sept. 2009.
[371] K. Thurley, S. C. Tovey, G. Moenke, V. L. Prince, A. Meena, A. P. Thomas,A. Skupin, C. W. Taylor, and M. Falcke, “Reliable encoding of stimulus intensi-ties within random sequences of intracellular Ca2+ spikes,” Science Signaling,vol. 7, p. ra59, June 2014.
[372] G. Dupont, L. Combettes, G. S. Bird, and J. W. Putney, “Calcium Oscilla-tions,” Cold Spring Harbor Perspectives in Biology, vol. 3, Mar. 2011.
Cette thèse est accessible à l'adresse : http://theses.insa-lyon.fr/publication/2019LYSEI093/these.pdf © [A. Denizot], [2019], INSA Lyon, tous droits réservés

BIBLIOGRAPHY 223
[373] J.-W. Shuai and P. Jung, “Stochastic Properties of Ca2+ Release of Inositol1,4,5-Trisphosphate Receptor Clusters,” Biophysical Journal, vol. 83, pp. 87–97, July 2002.
[374] G. Dupont, A. Abou-Lovergne, and L. Combettes, “Stochastic Aspects ofOscillatory Ca2+ Dynamics in Hepatocytes,” Biophysical Journal, vol. 95,pp. 2193–2202, Sept. 2008.
[375] D.-O. D. Mak, S. M. J. McBride, and J. K. Foskett, “Spontaneous ChannelActivity of the Inositol 1,4,5-Trisphosphate (InsP3) Receptor (InsP3r). Ap-plication of Allosteric Modeling to Calcium and InsP3 Regulation of InsP3rSingle-channel Gating,” The Journal of General Physiology, vol. 122, pp. 583–603, Nov. 2003.
[376] I. Baran, “Integrated Luminal and Cytosolic Aspects of the Calcium ReleaseControl,” Biophysical Journal, vol. 84, pp. 1470–1485, Mar. 2003.
[377] M. Falcke, L. Tsimring, and H. Levine, “Stochastic spreading of intracellularCa(2+) release,” Physical Review. E, Statistical Physics, Plasmas, Fluids, andRelated Interdisciplinary Topics, vol. 62, pp. 2636–2643, Aug. 2000.
[378] M. Bär, M. Falcke, H. Levine, and L. S. Tsimring, “Discrete stochastic model-ing of calcium channel dynamics,” Physical Review Letters, vol. 84, pp. 5664–5667, June 2000.
[379] D.-O. D. Mak, J. E. Pearson, K. P. C. Loong, S. Datta, M. Fernández-Mongil,and J. K. Foskett, “Rapid ligand-regulated gating kinetics of single inositol1,4,5-trisphosphate receptor Ca2+ release channels,” EMBO reports, vol. 8,pp. 1044–1051, Nov. 2007.
[380] E. Gin, M. Falcke, L. E. Wagner, D. I. Yule, and J. Sneyd, “A Kinetic Modelof the Inositol Trisphosphate Receptor Based on Single-Channel Data,” Bio-physical Journal, vol. 96, pp. 4053–4062, May 2009.
[381] I. Siekmann, L. Wagner, D. Yule, E. Crampin, and J. Sneyd, “A Kinetic Modelfor Type I and II IP3r Accounting for Mode Changes,” Biophysical Journal,vol. 103, pp. 658–668, Aug. 2012.
[382] G. Ullah, D.-O. D. Mak, and J. E. Pearson, “A data-driven model of a modalgated ion channel: The inositol 1,4,5-trisphosphate receptor in insect Sf9 cells,”The Journal of General Physiology, vol. 140, pp. 159–173, Aug. 2012.
[383] I. Bezprozvanny, “The inositol 1,4,5-trisphosphate receptors,” Cell Calcium,vol. 38, pp. 261–272, Sept. 2005.
Cette thèse est accessible à l'adresse : http://theses.insa-lyon.fr/publication/2019LYSEI093/these.pdf © [A. Denizot], [2019], INSA Lyon, tous droits réservés

224 BIBLIOGRAPHY
[384] S. Rüdiger, “Excitability in a stochastic differential equation model for calciumpuffs,” Physical Review E, vol. 89, June 2014.
[385] V. Nguyen, R. Mathias, and G. D. Smith, “A stochastic automata networkdescriptor for Markov chain models of instantaneously coupled intracellularCa2+ channels,” Bulletin of Mathematical Biology, vol. 67, pp. 393–432, May2005.
[386] G. Dupont, M. Falcke, V. Kirk, and J. Sneyd, “Hierarchical and StochasticModelling,” in Models of Calcium Signalling (G. Dupont, M. Falcke, V. Kirk,and J. Sneyd, eds.), Interdisciplinary Applied Mathematics, pp. 163–205,Cham: Springer International Publishing, 2016.
[387] H. Li, Z. Hou, and H. Xin, “Internal noise stochastic resonance for intracellularcalcium oscillations in a cell system,” Physical Review E, vol. 71, p. 061916,June 2005.
[388] C.-l. Zhu, Y. Jia, Q. Liu, L.-j. Yang, and X. Zhan, “A mesoscopic stochasticmechanism of cytosolic calcium oscillations,” Biophysical Chemistry, vol. 125,pp. 201–212, Jan. 2007.
[389] A. Tilunaite, W. Croft, N. Russell, T. C. Bellamy, and R. Thul, “A Bayesianapproach to modelling heterogeneous calcium responses in cell populations,”PLOS Computational Biology, vol. 13, p. e1005794, Oct. 2017.
[390] M. Falcke, M. Moein, A. Tilunaite, R. Thul, and A. Skupin, “On the phasespace structure of IP3 induced Ca2+ signalling and concepts for predictivemodeling,” Chaos, vol. 28, Mar. 2018.
[391] M. Falcke, “On the Role of Stochastic Channel Behavior in Intracellular Ca2+Dynamics,” Biophysical Journal, vol. 84, pp. 42–56, Jan. 2003.
[392] S. Rüdiger and J. Shuai, “Modeling of Stochastic$$\mathrm{{ca}}^{2+}$$Signals,” in Computational Glioscience(M. De Pittà and H. Berry, eds.), Springer Series in ComputationalNeuroscience, pp. 91–114, Cham: Springer International Publishing, 2019.
[393] M. De Pittà and N. Brunel, “Modulation of Synaptic Plasticity by Gluta-matergic Gliotransmission: A Modeling Study,” Neural Plasticity, vol. 2016,2016.
[394] A. M. Turing, “The chemical basis of morphogenesis,” Philosophical Transac-tions of the Royal Society of London. Series B, Biological Sciences, vol. 237,pp. 37–72, Aug. 1952.
Cette thèse est accessible à l'adresse : http://theses.insa-lyon.fr/publication/2019LYSEI093/these.pdf © [A. Denizot], [2019], INSA Lyon, tous droits réservés

BIBLIOGRAPHY 225
[395] C. Nicholson, K. C. Chen, S. Hrabětová, and L. Tao, “Diffusion of moleculesin brain extracellular space: theory and experiment,” in Progress in BrainResearch, vol. 125 of Volume Transmission Revisited, pp. 129–154, Elsevier,Jan. 2000.
[396] N. J. Eungdamrong and R. Iyengar, “Computational approaches for modelingregulatory cellular networks,” Trends in Cell Biology, vol. 14, pp. 661–669,Dec. 2004.
[397] G. D. Smith, Numerical Solution of Partial Differential Equations: Finite Dif-ference Methods. Clarendon Press, 1985. Google-Books-ID: hDpvljaHOrMC.
[398] B. M. Slepchenko, J. C. Schaff, I. Macara, and L. M. Loew, “Quantitative cellbiology with the Virtual Cell,” Trends in Cell Biology, vol. 13, pp. 570–576,Nov. 2003.
[399] F. Sayyid and S. Kalvala, “On the importance of modelling the internal spatialdynamics of biological cells.,” Bio Systems, vol. 145, pp. 53–66, July 2016.
[400] J. M. Bower and D. Beeman, The Book of GENESIS: Exploring RealisticNeural Models with the GEneral NEural SImulation System. Springer Science& Business Media, Dec. 2012. Google-Books-ID: f4PTBwAAQBAJ.
[401] K. T. Blackwell and J. H. Kotaleski, “Modeling The Dynamics of Second Mes-senger Pathways,” in Neuroscience Databases: A Practical Guide (R. Kötter,ed.), pp. 63–79, Boston, MA: Springer US, 2003.
[402] S. Ray and U. S. Bhalla, “PyMOOSE: interoperable scripting in Python forMOOSE,” Frontiers in Neuroinformatics, vol. 2, 2008.
[403] M. L. Hines and N. T. Carnevale, “Neuron: A Tool for Neuroscientists,” TheNeuroscientist, vol. 7, pp. 123–135, Apr. 2001.
[404] A. J. H. Newton, R. A. McDougal, M. L. Hines, and W. W. Lytton, “Us-ing NEURON for Reaction-Diffusion Modeling of Extracellular Dynamics,”Frontiers in Neuroinformatics, vol. 12, 2018.
[405] L. P. Savtchenko, L. Bard, T. P. Jensen, J. P. Reynolds, I. Kraev, N. Medvedev,M. G. Stewart, C. Henneberger, and D. A. Rusakov, “Disentangling astroglialphysiology with a realistic cell model in silico,” Nature Communications, vol. 9,no. 1, p. 3554, 2018.
[406] R. A. McDougal, R. Wang, T. M. Morse, M. Migliore, L. Marenco,T. Carnevale, M. Hines, and G. M. Shepherd, “ModelDB,” in Encyclopedia
Cette thèse est accessible à l'adresse : http://theses.insa-lyon.fr/publication/2019LYSEI093/these.pdf © [A. Denizot], [2019], INSA Lyon, tous droits réservés

226 BIBLIOGRAPHY
of Computational Neuroscience (D. Jaeger and R. Jung, eds.), pp. 1–4, NewYork, NY: Springer New York, 2013.
[407] B. M. Slepchenko, J. C. Schaff, J. H. Carson, and L. M. Loew, “ComputationalCell Biology: Spatiotemporal Simulation of Cellular Events,” Annual Reviewof Biophysics and Biomolecular Structure, vol. 31, no. 1, pp. 423–441, 2002.
[408] Chen Xi, Guo Liang, Kang Jianhong, Huo Yunlong, Wang Shiqiang, and TanWenchang, “Calcium waves initiating from the anomalous subdiffusive calciumsparks,” Journal of The Royal Society Interface, vol. 11, p. 20130934, Feb.2014.
[409] G. Weng, U. S. Bhalla, and R. Iyengar, “Complexity in Biological SignalingSystems,” Science, vol. 284, pp. 92–96, Apr. 1999.
[410] J. T. Koivumäki, T. Korhonen, and P. Tavi, “Impact of Sarcoplasmic Reticu-lum Calcium Release on Calcium Dynamics and Action Potential Morphologyin Human Atrial Myocytes: A Computational Study,” PLOS ComputationalBiology, vol. 7, p. e1001067, Jan. 2011.
[411] S. R. Neves and R. Iyengar, “Models of Spatially Restricted Biochemical Reac-tion Systems,” Journal of Biological Chemistry, vol. 284, pp. 5445–5449, Feb.2009.
[412] M. J. Berridge, “Elementary and global aspects of calcium signalling.,” TheJournal of Physiology, vol. 499, pp. 291–306, Mar. 1997.
[413] J. Marchant, N. Callamaras, and I. Parker, “Initiation of IP3 mediated Ca2+waves in Xenopus oocytes,” The EMBO Journal, vol. 18, pp. 5285–5299, Oct.1999.
[414] J. Keizer and G. D. Smith, “Spark-to-wave transition: saltatory transmissionof calcium waves in cardiac myocytes,” Biophysical Chemistry, vol. 72, pp. 87–100, May 1998.
[415] S. P. Dawson, J. Keizer, and J. E. Pearson, “Fire–diffuse–fire model of dy-namics of intracellular calcium waves,” Proceedings of the National Academyof Sciences, vol. 96, pp. 6060–6063, May 1999.
[416] S. Coombes, “The Effect of Ion Pumps on the Speed of Travelling Waves inthe Fire-diffuse-fire Model of Ca2+Release,” Bulletin of Mathematical Biology,vol. 63, pp. 1–20, Jan. 2001.
Cette thèse est accessible à l'adresse : http://theses.insa-lyon.fr/publication/2019LYSEI093/these.pdf © [A. Denizot], [2019], INSA Lyon, tous droits réservés

BIBLIOGRAPHY 227
[417] R. Thul, G. D. Smith, and S. Coombes, “A bidomain threshold model of propa-gating calcium waves,” Journal of Mathematical Biology, vol. 56, pp. 435–463,Apr. 2008.
[418] R. Thul, S. Coombes, and G. D. Smith, “Sensitisation waves in a bidomainfire-diffuse-fire model of intracellular Ca2+ dynamics,” Physica D: NonlinearPhenomena, vol. 238, pp. 2142–2152, Nov. 2009.
[419] B. Pando, J. Pearson, and S. Ponce Dawson, “Sheet Excitability and NonlinearWave Propagation,” Physical review letters, vol. 91, p. 258101, Jan. 2004.
[420] C. C. Fink, B. Slepchenko, I. I. Moraru, J. Watras, J. C. Schaff, and L. M.Loew, “An Image-Based Model of Calcium Waves in Differentiated Neuroblas-toma Cells,” Biophysical Journal, vol. 79, pp. 163–183, July 2000.
[421] K. Samanta, P. Kar, G. Mirams, and A. Parekh, “Ca2+ Channel Re-localization to Plasma-Membrane Microdomains Strengthens Activation ofCa2+-Dependent Nuclear Gene Expression,” Cell Reports, vol. 12, pp. 203–216, July 2015.
[422] E. McIvor, S. Coombes, and R. Thul, “Three-dimensional spatio-temporalmodelling of store operated Ca2+ entry: Insights into ER refilling and thespatial signature of Ca2+ signals,” Cell Calcium, vol. 73, Apr. 2018.
[423] D. E. Postnov, R. N. Koreshkov, N. A. Brazhe, A. R. Brazhe, and O. V.Sosnovtseva, “Dynamical patterns of calcium signaling in a functional modelof neuron–astrocyte networks,” Journal of Biological Physics, vol. 35, pp. 425–445, Oct. 2009.
[424] M. Kang and H. G. Othmer, “Spatiotemporal characteristics of calcium dy-namics in astrocytes,” Chaos, vol. 19, Jan. 2009.
[425] M. Goldberg, M. D. Pittà, V. Volman, H. Berry, and E. Ben-Jacob, “NonlinearGap Junctions Enable Long-Distance Propagation of Pulsating CalciumWavesin Astrocyte Networks,” PLOS Computational Biology, vol. 6, p. e1000909,Aug. 2010.
[426] J. Lallouette, M. De Pittà, E. Ben-Jacob, and H. Berry, “Sparse short-distanceconnections enhance calcium wave propagation in a 3d model of astrocytenetworks,” Frontiers in Computational Neuroscience, vol. 8, p. 45, 2014.
[427] A. R. Brazhe, D. E. Postnov, and O. Sosnovtseva, “Astrocyte calcium sig-naling: Interplay between structural and dynamical patterns,” Chaos: AnInterdisciplinary Journal of Nonlinear Science, vol. 28, p. 106320, Oct. 2018.
Cette thèse est accessible à l'adresse : http://theses.insa-lyon.fr/publication/2019LYSEI093/these.pdf © [A. Denizot], [2019], INSA Lyon, tous droits réservés

228 BIBLIOGRAPHY
[428] S. Y. Gordleeva, S. A. Lebedev, M. A. Rumyantseva, and V. B. Kazantsev,“Astrocyte as a Detector of Synchronous Events of a Neural Network,” JETPLetters, vol. 107, pp. 440–445, Apr. 2018.
[429] K. Breslin, J. J. Wade, K. Wong-Lin, J. Harkin, B. Flanagan, H. V. Zalinge,S. Hall, M. Walker, A. Verkhratsky, and L. McDaid, “Potassium and sodiummicrodomains in thin astroglial processes: A computational model study,”PLOS Computational Biology, vol. 14, p. e1006151, May 2018.
[430] P. Montes de Oca Balderas and H. Montes de Oca Balderas, “Synaptic neuron-astrocyte communication is supported by an order of magnitude analysis ofinositol tris-phosphate diffusion at the nanoscale in a model of peri-synapticastrocyte projection,” BMC Biophysics, vol. 11, p. 3, Feb. 2018.
[431] T. Mazel, R. Raymond, M. Raymond-Stintz, S. Jett, and B. S. Wilson,“Stochastic Modeling of Calcium in 3d Geometry,” Biophysical Journal, vol. 96,pp. 1691–1706, Mar. 2009.
[432] P. K. Maini, K. J. Painter, and H. N. P. Chau, “Spatial pattern formation inchemical and biological systems,” Journal of the Chemical Society, FaradayTransactions, vol. 93, pp. 3601–3610, Jan. 1997.
[433] A. H. Elcock, “Models of Macromolecular Crowding Effects & the Need forQuantitative Comparisons with Experiment,” Current opinion in structuralbiology, vol. 20, pp. 196–206, Apr. 2010.
[434] M. Tomita, “Whole-cell simulation: a grand challenge of the 21st century,”Trends in Biotechnology, vol. 19, pp. 205–210, June 2001.
[435] D. Fange and J. Elf, “Noise-Induced Min Phenotypes in E. coli,” PLOS Com-putational Biology, vol. 2, p. e80, June 2006.
[436] K. Lipkow, S. S. Andrews, and D. Bray, “Simulated Diffusion of Phosphory-lated CheY through the Cytoplasm of Escherichia coli,” Journal of Bacteriol-ogy, vol. 187, pp. 45–53, Jan. 2005.
[437] K. Takahashi, S. Tanase-Nicola, and P. R. ten Wolde, “Spatio-temporal corre-lations can drastically change the response of a MAPK pathway,” Proceedingsof the National Academy of Sciences of the United States of America, vol. 107,pp. 2473–2478, Feb. 2010.
[438] T. Erdmann, M. Howard, and P. R. ten Wolde, “Role of Spatial Averaging inthe Precision of Gene Expression Patterns,” Physical Review Letters, vol. 103,p. 258101, Dec. 2009.
Cette thèse est accessible à l'adresse : http://theses.insa-lyon.fr/publication/2019LYSEI093/these.pdf © [A. Denizot], [2019], INSA Lyon, tous droits réservés

BIBLIOGRAPHY 229
[439] J. S. van Zon, M. J. Morelli, S. Tănase-Nicola, and P. R. ten Wolde, “Diffusionof transcription factors can drastically enhance the noise in gene expression,”Biophysical Journal, vol. 91, pp. 4350–4367, Dec. 2006.
[440] K. Burrage, P. M. Burrage, A. Leier, T. Marquez-Lago, and D. V. Nico-lau, “Stochastic Simulation for Spatial Modelling of Dynamic Processes ina Living Cell,” in Design and Analysis of Biomolecular Circuits: Engi-neering Approaches to Systems and Synthetic Biology (H. Koeppl, G. Setti,M. di Bernardo, and D. Densmore, eds.), pp. 43–62, New York, NY: SpringerNew York, 2011.
[441] S. Smith and R. Grima, “Spatial Stochastic Intracellular Kinetics: A Reviewof Modelling Approaches,” Bulletin of Mathematical Biology, May 2018.
[442] K. Takahashi, S. N. V. Arjunan, and M. Tomita, “Space in systems biology ofsignaling pathways – towards intracellular molecular crowding in silico,” FEBSLetters, vol. 579, no. 8, pp. 1783–1788, 2005.
[443] C. Lemerle, B. D. Ventura, and L. Serrano, “Space as the final frontier instochastic simulations of biological systems,” FEBS Letters, vol. 579, no. 8,pp. 1789–1794, 2005.
[444] S. A. Isaacson and D. Isaacson, “The Reaction-Diffusion Master Equation,Diffusion Limited Reactions, and Singular Potentials,” Physical Review. E,Statistical, Nonlinear, and Soft Matter Physics, vol. 80, p. 066106, Dec. 2009.
[445] L. Boulianne, S. Al Assaad, M. Dumontier, and W. J. Gross, “GridCell: astochastic particle-based biological system simulator,” BMC Systems Biology,vol. 2, p. 66, July 2008.
[446] S. Wils and E. De Schutter, “STEPS: Modeling and Simulating ComplexReaction-Diffusion Systems with Python,” Frontiers in Neuroinformatics,vol. 3, p. 15, 2009.
[447] I. Hepburn, R. Cannon, and E. De Schutter, “Efficient calculation of the quasi-static electrical potential on a tetrahedral mesh and its implementation inSTEPS,” Frontiers in Computational Neuroscience, vol. 7, Oct. 2013.
[448] R. Erban, “From molecular dynamics to Brownian dynamics,” Proc. R. Soc.A, vol. 470, p. 20140036, July 2014.
[449] A. Ghosh, A. Leier, and T. T. Marquez-Lago, “The Spatial Chemical LangevinEquation and Reaction Diffusion Master Equations: moments and qualitativesolutions,” Theoretical Biology & Medical Modelling, vol. 12, Feb. 2015.
Cette thèse est accessible à l'adresse : http://theses.insa-lyon.fr/publication/2019LYSEI093/these.pdf © [A. Denizot], [2019], INSA Lyon, tous droits réservés

230 BIBLIOGRAPHY
[450] R. Erban and S. J. Chapman, “Stochastic modelling of reaction–diffusionprocesses: algorithms for bimolecular reactions,” Physical Biology, vol. 6,p. 046001, Aug. 2009.
[451] I. C. Agbanusi and S. A. Isaacson, “A Comparison of Bimolecular ReactionModels for Stochastic Reaction–Diffusion Systems,” Bulletin of MathematicalBiology, vol. 76, pp. 922–946, Apr. 2014.
[452] R. Grima and S. Schnell, “A systematic investigation of the rate laws valid inintracellular environments,” Biophysical Chemistry, vol. 124, pp. 1–10, Oct.2006.
[453] S. S. Andrews, N. J. Addy, R. Brent, and A. P. Arkin, “Detailed Simula-tions of Cell Biology with Smoldyn 2.1,” PLOS Computational Biology, vol. 6,p. e1000705, Mar. 2010.
[454] J. S. van Zon and P. R. ten Wolde, “Green’s-function reaction dynamics:A particle-based approach for simulating biochemical networks in time andspace,” The Journal of Chemical Physics, vol. 123, p. 234910, Dec. 2005.
[455] S. S. Andrews, “Particle-Based Stochastic Simulators,” in Encyclopedia ofComputational Neuroscience (D. Jaeger and R. Jung, eds.), pp. 1–5, NewYork, NY: Springer New York, 2018.
[456] S. Engblom, L. Ferm, A. Hellander, and P. Lötstedt, “Simulation of Stochas-tic Reaction-Diffusion Processes on Unstructured Meshes,” SIAM Journal onScientific Computing, vol. 31, pp. 1774–1797, Jan. 2009.
[457] R. Erban, J. Chapman, and P. Maini, “A practical guide to stochastic simu-lations of reaction-diffusion processes,” arXiv:0704.1908 [physics, q-bio], Apr.2007. arXiv: 0704.1908.
[458] S. Isaacson and C. Peskin, “Incorporating Diffusion in Complex Geometriesinto Stochastic Chemical Kinetics Simulations,” SIAM Journal on ScientificComputing, vol. 28, pp. 47–74, Jan. 2006.
[459] S. Hellander, A. Hellander, and L. Petzold, “Reaction-diffusion master equa-tion in the microscopic limit,” Physical Review E, vol. 85, p. 042901, Apr.2012.
[460] U. S. Bhalla, “Multiscale Modeling and Synaptic Plasticity,” Progress in Molec-ular Biology and Translational Science, vol. 123, pp. 351–386, Jan. 2014.
Cette thèse est accessible à l'adresse : http://theses.insa-lyon.fr/publication/2019LYSEI093/these.pdf © [A. Denizot], [2019], INSA Lyon, tous droits réservés

BIBLIOGRAPHY 231
[461] A. Leier and T. T. Marquez-Lago, “Correction factors for boundary diffu-sion in reaction-diffusion master equations,” The Journal of Chemical Physics,vol. 135, p. 134109, Oct. 2011.
[462] S. Isaacson, “The Reaction Diffusion Master Equation as an Asymptotic Ap-proximation of Diffusion to a Small Target,” SIAM Journal on Applied Math-ematics, vol. 70, pp. 77–111, Jan. 2009.
[463] T. T. Marquez-Lago and K. Burrage, “Binomial tau-leap spatial stochasticsimulation algorithm for applications in chemical kinetics,” The Journal ofChemical Physics, vol. 127, p. 104101, Sept. 2007.
[464] M. B. Flegg, S. J. Chapman, and R. Erban, “The two-regime method foroptimizing stochastic reaction-diffusion simulations., The two-regime methodfor optimizing stochastic reaction–diffusion simulations,” Journal of the RoyalSociety, Interface, Journal of the Royal Society Interface, vol. 9, 9, pp. 859,859–868, May 2012.
[465] S. N. V. Arjunan and M. Tomita, “A new multicompartmental reaction-diffusion modeling method links transient membrane attachment of E. coliMinE to E-ring formation,” Systems and Synthetic Biology, vol. 4, pp. 35–53,Mar. 2010.
[466] K. T. Blackwell, “Approaches and tools for modeling signaling pathways andcalcium dynamics in neurons,” Journal of Neuroscience Methods, vol. 220,pp. 131–140, Nov. 2013.
[467] C. A. Smith and C. A. Yates, “Spatially extended hybrid methods: a review,”Journal of the Royal Society, Interface, vol. 15, no. 139, 2018.
[468] M. Dobrzyński, J. V. Rodríguez, J. A. Kaandorp, and J. G. Blom, “Computa-tional methods for diffusion-influenced biochemical reactions,” Bioinformatics,vol. 23, pp. 1969–1977, Aug. 2007.
[469] J. Schöneberg, A. Ullrich, and F. Noé, “Simulation tools for particle-basedreaction-diffusion dynamics in continuous space,” BMC Biophysics, vol. 7,p. 11, Oct. 2014.
[470] S. Anders, D. Minge, S. Griemsmann, M. K. Herde, C. Steinhäuser, andC. Henneberger, “Spatial properties of astrocyte gap junction coupling in therat hippocampus,” Philosophical Transactions of the Royal Society B: Biolog-ical Sciences, vol. 369, Oct. 2014.
Cette thèse est accessible à l'adresse : http://theses.insa-lyon.fr/publication/2019LYSEI093/these.pdf © [A. Denizot], [2019], INSA Lyon, tous droits réservés

232 BIBLIOGRAPHY
[471] J. Hattne, D. Fange, and J. Elf, “Stochastic reaction-diffusion simulation withMesoRD,” Bioinformatics, vol. 21, pp. 2923–2924, June 2005.
[472] M. Tomita, K. Hashimoto, K. Takahashi, T. S. Shimizu, Y. Matsuzaki,F. Miyoshi, K. Saito, S. Tanida, K. Yugi, J. C. Venter, and C. A. Hutchison,“E-CELL: software environment for whole-cell simulation.,” Bioinformatics,vol. 15, pp. 72–84, Jan. 1999.
[473] K. Takahashi, K. Kaizu, B. Hu, and M. Tomita, “A multi-algorithm, multi-timescale method for cell simulation,” Bioinformatics, vol. 20, pp. 538–546,Mar. 2004.
[474] B. Drawert, S. Engblom, and A. Hellander, “URDME: a modular frameworkfor stochastic simulation of reaction-transport processes in complex geome-tries,” BMC Systems Biology, vol. 6, p. 76, 2012.
[475] I. Hepburn, W. Chen, S. Wils, and E. De Schutter, “STEPS: efficient simu-lation of stochastic reaction–diffusion models in realistic morphologies,” BMCSystems Biology, vol. 6, no. 1, p. 36, 2012.
[476] S. J. Plimpton and A. Slepoy, “ChemCell : a particle-based model of pro-tein chemistry and diffusion in microbial cells.,” Tech. Rep. SAND2003-4509,Sandia National Laboratories, Dec. 2003.
[477] R. Kerr, T. Bartol, B. Kaminsky, M. Dittrich, J. Chang, S. Baden, T. Se-jnowski, and J. Stiles, “Fast Monte Carlo Simulation Methods for BiologicalReaction-Diffusion Systems in Solution and on Surfaces,” SIAM Journal onScientific Computing, vol. 30, pp. 3126–3149, Jan. 2008.
[478] C. Sanford, M. L. K. Yip, C. White, and J. Parkinson, “Cell++—simulatingbiochemical pathways,” Bioinformatics, vol. 22, pp. 2918–2925, Dec. 2006.
[479] J. Schöneberg and F. Noé, “ReaDDy - A Software for Particle-Based Reaction-Diffusion Dynamics in Crowded Cellular Environments,” PLOS ONE, vol. 8,p. e74261, Sept. 2013.
[480] N. B. Thillaiappan, A. Chavda, S. Tovey, D. Prole, and C. Taylor, “Ca2+signals initiate at immobile IP3 receptors adjacent to ER-plasma membranejunctions,” Nature Communications, vol. 8, Dec. 2017.
[481] S. M. Wiltgen, I. F. Smith, and I. Parker, “Superresolution localization ofsingle functional IP3r channels utilizing Ca2+ flux as a readout,” BiophysicalJournal, vol. 99, pp. 437–446, July 2010.
Cette thèse est accessible à l'adresse : http://theses.insa-lyon.fr/publication/2019LYSEI093/these.pdf © [A. Denizot], [2019], INSA Lyon, tous droits réservés

BIBLIOGRAPHY 233
[482] I. F. Smith and I. Parker, “Imaging the quantal substructure of single IP3rchannel activity during Ca2+ puffs in intact mammalian cells,” Proceedings ofthe National Academy of Sciences, vol. 106, pp. 6404–6409, Apr. 2009.
[483] M. Kraus, B. Wolf, and B. Wolf, “Crosstalk between cellular morphology andcalcium oscillation patterns Insights from a stochastic computer model,” CellCalcium, vol. 19, pp. 461–472, June 1996.
[484] H. Anwar, I. Hepburn, H. Nedelescu, W. Chen, and E. D. Schutter, “StochasticCalcium Mechanisms Cause Dendritic Calcium Spike Variability,” Journal ofNeuroscience, vol. 33, pp. 15848–15867, Oct. 2013.
[485] P. Smolen, D. A. Baxter, and J. H. Byrne, “Molecular Constraints on SynapticTagging and Maintenance of Long-Term Potentiation: A Predictive Model,”PLOS Computational Biology, vol. 8, p. e1002620, Aug. 2012.
[486] S. Khan, Y. Zou, A. Amjad, A. Gardezi, C. L. Smith, C. Winters, and T. S.Reese, “Sequestration of CaMKII in dendritic spines in silico,” Journal of Com-putational Neuroscience, vol. 31, pp. 581–594, Nov. 2011.
[487] B. Kim, S. L. Hawes, F. Gillani, L. J. Wallace, and K. T. Blackwell, “SignalingPathways Involved in Striatal Synaptic Plasticity are Sensitive to TemporalPattern and Exhibit Spatial Specificity,” PLOS Computational Biology, vol. 9,p. e1002953, Mar. 2013.
[488] C. M. Simon, I. Hepburn, W. Chen, and E. D. Schutter, “The role of den-dritic spine morphology in the compartmentalization and delivery of surfacereceptors,” Journal of Computational Neuroscience, vol. 36, pp. 483–497, June2014.
[489] R. L. Winslow, A. Tanskanen, M. Chen, and J. L. Greenstein, “MultiscaleModeling of Calcium Signaling in the Cardiac Dyad,” Annals of the New YorkAcademy of Sciences, vol. 1080, no. 1, pp. 362–375, 2006.
[490] N. Wieder, R. Fink, and F. von Wegner, “Exact Stochastic Simulation ofa Calcium Microdomain Reveals the Impact of Ca2+ Fluctuations on IP3rGating,” Biophysical Journal, vol. 108, pp. 557–567, Feb. 2015.
[491] U. Dobramysl, S. Rüdiger, and R. Erban, “Particle-Based Multiscale Modelingof Calcium Puff Dynamics,” Multiscale Modeling & Simulation, pp. 997–1016,Jan. 2016.
[492] S. Coombes and Y. Timofeeva, “Sparks and waves in a stochastic fire-diffuse-fire model of ${\mathrm{Ca}}^{2+}$ release,” Physical Review E, vol. 68,p. 021915, Aug. 2003.
Cette thèse est accessible à l'adresse : http://theses.insa-lyon.fr/publication/2019LYSEI093/these.pdf © [A. Denizot], [2019], INSA Lyon, tous droits réservés

234 BIBLIOGRAPHY
[493] A. Calabrese, D. Fraiman, D. Zysman, and S. Ponce Dawson, “Stochasticfire-diffuse-fire model with realistic cluster dynamics,” Physical Review. E,Statistical, Nonlinear, and Soft Matter Physics, vol. 82, p. 031910, Sept. 2010.
[494] M. Arizono, H. Bannai, K. Nakamura, F. Niwa, M. Enomoto, T. Matsu-ura,A. Miyamoto, M. W. Sherwood, T. Nakamura, and K. Mikoshiba, “Receptor-Selective Diffusion Barrier Enhances Sensitivity of Astrocytic Processes toMetabotropic Glutamate Receptor Stimulation,” Sci. Signal., vol. 5, pp. ra27–ra27, Apr. 2012.
[495] L. Lencesova, A. O’Neill, W. G. Resneck, R. J. Bloch, and M. P. Blaustein,“Plasma membrane-cytoskeleton-endoplasmic reticulum complexes in neuronsand astrocytes,” The Journal of Biological Chemistry, vol. 279, pp. 2885–2893,Jan. 2004.
[496] S. H. Weerth, L. A. Holtzclaw, and J. T. Russell, “Signaling proteins in raft-like microdomains are essential for Ca2+ wave propagation in glial cells,” CellCalcium, vol. 41, pp. 155–167, Feb. 2007.
[497] L. Buscemi, V. Ginet, J. Lopatar, V. Montana, L. Pucci, P. Spagnuolo,T. Zehnder, V. Grubišić, A. Truttman, C. Sala, L. Hirt, V. Parpura, J. Puyal,and P. Bezzi, “Homer1 Scaffold Proteins Govern Ca2+ Dynamics in Normaland Reactive Astrocytes,” Cerebral Cortex (New York, N.Y.: 1991), Apr.2016.
[498] E. Cresswel-Clay, N. Crock, J. Tabak, and G. Erlebacher, “A Compartmen-tal Model to Investigate Local and Global Ca2+ Dynamics in Astrocytes,”Frontiers in Computational Neuroscience, vol. 12, 2018.
[499] S. Winkelmann and C. Schütte, “Hybrid models for chemical reaction net-works: Multiscale theory and application to gene regulatory systems,” TheJournal of Chemical Physics, vol. 147, p. 114115, Sept. 2017.
[500] A. Hellander and P. Lötstedt, “Hybrid method for the chemical master equa-tion,” Journal of Computational Physics, vol. 227, pp. 100–122, Nov. 2007.
[501] A. Duncan, R. Erban, and K. Zygalakis, “Hybrid framework for the simulationof stochastic chemical kinetics,” Journal of Computational Physics, vol. 326,pp. 398–419, Dec. 2016.
[502] M. H. A. Davis, “Piecewise-Deterministic Markov Processes: A General Classof Non-Diffusion Stochastic Models,” Journal of the Royal Statistical Society.Series B (Methodological), vol. 46, no. 3, pp. 353–388, 1984.
Cette thèse est accessible à l'adresse : http://theses.insa-lyon.fr/publication/2019LYSEI093/these.pdf © [A. Denizot], [2019], INSA Lyon, tous droits réservés

BIBLIOGRAPHY 235
[503] F. von Wegner, N. Wieder, and R. H. A. Fink, “Simulation strategies forcalcium microdomains and calcium-regulated calcium channels,” Advances inExperimental Medicine and Biology, vol. 740, pp. 553–567, 2012.
[504] Y. Cao, D. T. Gillespie, and L. R. Petzold, “The slow-scale stochastic simu-lation algorithm,” The Journal of Chemical Physics, vol. 122, p. 014116, Dec.2004.
[505] A. Crudu, A. Debussche, and O. Radulescu, “Hybrid stochastic simplificationsfor multiscale gene networks,” BMC Systems Biology, vol. 3, p. 89, Sept. 2009.
[506] H. Salis and Y. Kaznessis, “Accurate hybrid stochastic simulation of a sys-tem of coupled chemical or biochemical reactions,” The Journal of ChemicalPhysics, vol. 122, p. 054103, Jan. 2005.
[507] A. Alfonsi, E. Cancès, G. Turinici, B. Di Ventura, and W. Huisinga, “Adap-tive simulation of hybrid stochastic and deterministic models for biochemicalsystems,” ESAIM: Proceedings, vol. 14, pp. 1–13, Sept. 2005.
[508] A. Ganguly, D. Altintan, and H. Koeppl, “Jump-Diffusion Approximation ofStochastic Reaction Dynamics: Error Bounds and Algorithms,” MultiscaleModeling & Simulation, vol. 13, pp. 1390–1419, Jan. 2015.
[509] K. Vasudeva and U. S. Bhalla, “Adaptive stochastic-deterministic chemicalkinetic simulations,” Bioinformatics, vol. 20, pp. 78–84, Jan. 2004.
[510] S. Zeiser, U. Franz, and V. Liebscher, “Autocatalytic genetic networks mod-eled by piecewise-deterministic Markov processes,” Journal of MathematicalBiology, vol. 60, p. 207, Feb. 2010.
[511] S. Zeiser, U. Franz, O. Wittich, and V. Liebscher, “Simulation of genetic net-works modelled by piecewise deterministic Markov processes,” IET SystemsBiology, vol. 2, pp. 113–135, May 2008.
[512] Yates Christian A. and Flegg Mark B., “The pseudo-compartment methodfor coupling partial differential equation and compartment-based models ofdiffusion,” Journal of The Royal Society Interface, vol. 12, p. 20150141, May2015.
[513] L. Ferm, A. Hellander, and P. Lötstedt, “An adaptive algorithm for simulationof stochastic reaction–diffusion processes,” Journal of Computational Physics,vol. 229, pp. 343–360, Jan. 2010.
Cette thèse est accessible à l'adresse : http://theses.insa-lyon.fr/publication/2019LYSEI093/these.pdf © [A. Denizot], [2019], INSA Lyon, tous droits réservés

236 BIBLIOGRAPHY
[514] C. Nagaiah, S. Rüdiger, G. Warnecke, and M. Falcke, “Adaptive space and timenumerical simulation of reaction–diffusion models for intracellular calcium dy-namics,” Applied Mathematics and Computation, vol. 218, pp. 10194–10210,June 2012.
[515] S. Engblom, A. Hellander, and P. Lötstedt, “Multiscale Simulation of Stochas-tic Reaction-Diffusion Networks,” in Stochastic Processes, Multiscale Model-ing, and Numerical Methods for Computational Cellular Biology (D. Holcman,ed.), pp. 55–79, Cham: Springer International Publishing, 2017.
[516] J. C. Schaff, F. Gao, Y. Li, I. L. Novak, and B. M. Slepchenko, “NumericalApproach to Spatial Deterministic-Stochastic Models Arising in Cell Biology,”PLOS Computational Biology, vol. 12, p. e1005236, Dec. 2016.
[517] N. Dudani, U. S. Bhalla, and S. Ray, “MOOSE, the Multiscale Object-OrientedSimulation Environment,” in Encyclopedia of Computational Neuroscience(D. Jaeger and R. Jung, eds.), pp. 1–4, New York, NY: Springer New York,2013.
[518] M. Robinson, S. S. Andrews, and R. Erban, “Multiscale reaction-diffusionsimulations with Smoldyn,” Bioinformatics, vol. 31, pp. 2406–2408, July 2015.
[519] B. Franz, M. Flegg, S. Chapman, and R. Erban, “Multiscale Reaction-DiffusionAlgorithms: PDE-Assisted Brownian Dynamics,” SIAM Journal on AppliedMathematics, vol. 73, pp. 1224–1247, Jan. 2013.
[520] M. Djurfeldt, J. Hjorth, J. M. Eppler, N. Dudani, M. Helias, T. C. Potjans,U. S. Bhalla, M. Diesmann, J. Hellgren Kotaleski, and O. Ekeberg, “Run-TimeInteroperability Between Neuronal Network Simulators Based on the MUSICFramework,” Neuroinformatics, vol. 8, pp. 43–60, Mar. 2010.
[521] M. Brandi, E. Brocke, H. Talukdar, M. Hanke, U. S. Bhalla, J. Kotaleski, andM. Djurfeldt, “Connecting MOOSE and NeuroRD through MUSIC: towardsa communication framework for multi-scale modeling,” BMC Neuroscience,vol. 12, no. Suppl 1, p. P77.
[522] R. Hinch, J. L. Greenstein, A. J. Tanskanen, L. Xu, and R. L. Winslow, “Asimplified local control model of calcium-induced calcium release in cardiacventricular myocytes,” Biophysical Journal, vol. 87, pp. 3723–3736, Dec. 2004.
[523] M. D. Stern, L. S. Song, H. Cheng, J. S. Sham, H. T. Yang, K. R. Boheler,and E. Ríos, “Local control models of cardiac excitation-contraction coupling.A possible role for allosteric interactions between ryanodine receptors,” TheJournal of General Physiology, vol. 113, pp. 469–489, Mar. 1999.
Cette thèse est accessible à l'adresse : http://theses.insa-lyon.fr/publication/2019LYSEI093/these.pdf © [A. Denizot], [2019], INSA Lyon, tous droits réservés
BIBLIOGRAPHY 237
[524] M. Rückl, I. Parker, J. S. Marchant, C. Nagaiah, F. W. Johenning, andS. Rüdiger, “Modulation of Elementary Calcium Release Mediates a Tran-sition from Puffs to Waves in an IP3r Cluster Model,” PLOS ComputationalBiology, vol. 11, p. e1003965, Jan. 2015.
[525] M. Rückl and S. Rüdiger, “Calcium waves in a grid of clustered channels withsynchronous IP3 binding and unbinding,” The European Physical Journal E,vol. 39, p. 108, Nov. 2016.
[526] J. W. Shuai and P. Jung, “Optimal Intracellular Calcium Signaling,” PhysicalReview Letters, vol. 88, p. 068102, Jan. 2002.
[527] S. Rüdiger, J. W. Shuai, and I. M. Sokolov, “Law of mass action, detailedbalance, and the modeling of calcium puffs,” Physical Review Letters, vol. 105,p. 048103, July 2010.
[528] L. Diambra and J. S. Marchant, “Inositol (1,4,5)-Trisphosphate Receptor Mi-croarchitecture Shapes Ca2+ Puff Kinetics,” Biophysical Journal, vol. 100,pp. 822–831, Feb. 2011.
[529] G. S. B. Williams, E. J. Molinelli, and G. D. Smith, “Modeling local and globalintracellular calcium responses mediated by diffusely distributed inositol 1,4,5-trisphosphate receptors,” Journal of Theoretical Biology, vol. 253, pp. 170–188,July 2008.
[530] A. Skupin, H. Kettenmann, and M. Falcke, “Calcium Signals Driven by SingleChannel Noise,” PLoS computational biology, vol. 6, Aug. 2010.
[531] S. Rüdiger, J. W. Shuai, W. Huisinga, C. Nagaiah, G. Warnecke, I. Parker,and M. Falcke, “Hybrid stochastic and deterministic simulations of calciumblips,” Biophysical Journal, vol. 93, pp. 1847–1857, Sept. 2007.
[532] S. Swillens, G. Dupont, L. Combettes, and P. Champeil, “From calcium blipsto calcium puffs: theoretical analysis of the requirements for interchannel com-munication,” Proceedings of the National Academy of Sciences of the UnitedStates of America, vol. 96, pp. 13750–13755, Nov. 1999.
[533] A. Skupin and M. Falcke, “The role of IP3r clustering in Ca2+ signal-ing,” Genome Informatics. International Conference on Genome Informatics,vol. 20, pp. 15–24, 2008.
[534] S. Braichenko, A. Bhaskar, and S. Dasmahapatra, “Phenomenological cluster-based model of ${\text{Ca}}^{2+}$ waves and oscillations for inositol1,4,5-trisphosphate receptor (${\mathrm{IP}}_{3}\mathrm{R}$) channels,”Physical Review E, vol. 98, p. 032413, Sept. 2018.
Cette thèse est accessible à l'adresse : http://theses.insa-lyon.fr/publication/2019LYSEI093/these.pdf © [A. Denizot], [2019], INSA Lyon, tous droits réservés

238 BIBLIOGRAPHY
[535] J. W. Shuai, Y. D. Huang, and S. Rüdiger, “Puff-wave transition in an inhomo-geneous model for calcium signals,” Physical Review. E, Statistical, Nonlinear,and Soft Matter Physics, vol. 81, p. 041904, Apr. 2010.
[536] S. Means, A. J. Smith, J. Shepherd, J. Shadid, J. Fowler, R. J. H. Wojcikiewicz,T. Mazel, G. D. Smith, and B. S. Wilson, “Reaction Diffusion Modeling ofCalcium Dynamics with Realistic ER Geometry,” Biophysical Journal, vol. 91,pp. 537–557, July 2006.
[537] G. E. P. Box, “Sampling and Bayes’ Inference in Scientific Modelling andRobustness,” Journal of the Royal Statistical Society: Series A (General),vol. 143, no. 4, pp. 383–404, 1980.
[538] G. Dupont and H. Croisier, “Spatiotemporal organization of Ca2+ dynamics:A modeling based approach,” HFSP Journal, vol. 4, pp. 43–51, Apr. 2010.
[539] S. Rüdiger, “Stochastic models of intracellular calcium signals,” Physics Re-ports, vol. 534, pp. 39–87, Jan. 2014.
[540] T. Manninen, R. Havela, and M.-L. Linne, “Reproducibility and Comparabilityof Computational Models for Astrocyte Calcium Excitability,” Frontiers inNeuroinformatics, vol. 11, 2017.
[541] A. Panatier, M. Arizono, and U. V. Nägerl, “Dissecting tripartite synapseswith STED microscopy,” Phil. Trans. R. Soc. B, vol. 369, p. 20130597, Oct.2014.
[542] I. F. Smith, S. M. Wiltgen, and I. Parker, “Localization of puff sites adjacent tothe plasma membrane: Functional and spatial characterization of Ca2+ signal-ing in SH-SY5y cells utilizing membrane-permeant caged IP3,” Cell Calcium,vol. 45, pp. 65–76, Jan. 2009.
[543] M. B. Flegg, S. Rüdiger, and R. Erban, “Diffusive spatio-temporal noise ina first-passage time model for intracellular calcium release,” The Journal ofChemical Physics, vol. 138, p. 154103, Apr. 2013.
[544] B. Pando, S. P. Dawson, D.-O. D. Mak, and J. E. Pearson, “Messages diffusefaster than messengers,” Proceedings of the National Academy of Sciences,vol. 103, pp. 5338–5342, Apr. 2006.
[545] S. Rüdiger, C. Nagaiah, G. Warnecke, and J. Shuai, “Calcium Domains aroundSingle and Clustered IP3 Receptors and Their Modulation by Buffers,” Bio-physical Journal, vol. 99, pp. 3–12, July 2010.
Cette thèse est accessible à l'adresse : http://theses.insa-lyon.fr/publication/2019LYSEI093/these.pdf © [A. Denizot], [2019], INSA Lyon, tous droits réservés

BIBLIOGRAPHY 239
[546] D. Fraiman and S. P. Dawson, “Buffer regulation of calcium puff sequences,”Physical Biology, vol. 11, p. 016007, Feb. 2014.
[547] M. Falcke, “Buffers and oscillations in intracellular Ca2+ dynamics,” Biophys-ical Journal, vol. 84, pp. 28–41, Jan. 2003.
[548] J. Shuai, J. E. Pearson, and I. Parker, “Modeling Ca2+ Feedback on a SingleInositol 1,4,5-Trisphosphate Receptor and Its Modulation by Ca2+ Buffers,”Biophysical Journal, vol. 95, pp. 3738–3752, Oct. 2008.
[549] B. A. Bicknell and G. J. Goodhill, “Emergence of ion channel modal gatingfrom independent subunit kinetics,” Proceedings of the National Academy ofSciences, vol. 113, pp. E5288–E5297, Sept. 2016.
[550] T. Oura, K. Murata, T. Morita, A. Nezu, M. Arisawa, S. Shuto, and A. Tan-imura, “Highly Sensitive Measurement of Inositol 1,4,5-Trisphosphate by Usinga New Fluorescent Ligand and Ligand Binding Domain Combination,” Chem-biochem: A European Journal of Chemical Biology, vol. 17, no. 16, pp. 1509–1512, 2016.
[551] K. Zheng, L. Bard, J. P. Reynolds, C. King, T. Jensen, A. Gourine, andD. Rusakov, “Time-Resolved Imaging Reveals Heterogeneous Landscapes ofNanomolar Ca2+ in Neurons and Astroglia,” Neuron, vol. 88, pp. 277–288,Oct. 2015.
[552] H. Tu, Z. Wang, and I. Bezprozvanny, “Modulation of Mammalian Inositol1,4,5-Trisphosphate Receptor Isoforms by Calcium: A Role of Calcium SensorRegion,” Biophysical Journal, vol. 88, pp. 1056–1069, Feb. 2005.
[553] E. C. Thrower, R. E. Hagar, and B. E. Ehrlich, “Regulation of Ins(1,4,5)P3receptor isoforms by endogenous modulators,” Trends in Pharmacological Sci-ences, vol. 22, pp. 580–586, Nov. 2001.
[554] N. L. Allbritton, T. Meyer, and L. Stryer, “Range of messenger action of cal-cium ion and inositol 1,4,5-trisphosphate,” Science (New York, N.Y.), vol. 258,pp. 1812–1815, Dec. 1992.
[555] B. Schwaller, “Cytosolic Ca2+ buffers,” Cold Spring Harbor Perspectives inBiology, vol. 2, p. a004051, Nov. 2010.
[556] B. S. Wilson, J. R. Pfeiffer, A. J. Smith, J. M. Oliver, J. A. Oberdorf,and R. J. H. Wojcikiewicz, “Calcium-dependent Clustering of Inositol 1,4,5-Trisphosphate Receptors,” Molecular Biology of the Cell, vol. 9, pp. 1465–1478,June 1998.
Cette thèse est accessible à l'adresse : http://theses.insa-lyon.fr/publication/2019LYSEI093/these.pdf © [A. Denizot], [2019], INSA Lyon, tous droits réservés

240 BIBLIOGRAPHY
[557] T. Rahman, “Dynamic clustering of IP 3 receptors by IP 3,” Biochemical So-ciety Transactions, vol. 40, pp. 325–330, Apr. 2012.
[558] I. Smith, D. Swaminathan, G. Dickinson, and I. Parker, “Single-MoleculeTracking of Inositol Trisphosphate Receptors Reveals Different Motilities andDistributions,” Biophysical Journal, vol. 107, pp. 834–845, Aug. 2014.
[559] H. Tu, Z. Wang, E. Nosyreva, H. De Smedt, and I. Bezprozvanny, “Func-tional Characterization of Mammalian Inositol 1,4,5-Trisphosphate ReceptorIsoforms,” Biophysical Journal, vol. 88, pp. 1046–1055, Feb. 2005.
[560] W. Chen and E. De Schutter, “Parallel STEPS: Large Scale Stochastic SpatialReaction-Diffusion Simulation with High Performance Computers,” Frontiersin Neuroinformatics, vol. 11, 2017.
[561] D. Swaminathan and P. Jung, “The Role of agonist-independent conforma-tional transformation (AICT) in IP3 cluster behavior,” Cell Calcium, vol. 49,pp. 145–152, Mar. 2011.
[562] R. A. McDougal, T. M. Morse, T. Carnevale, L. Marenco, R. Wang,M. Migliore, P. L. Miller, G. M. Shepherd, and M. L. Hines, “Twenty yearsof ModelDB and beyond: building essential modeling tools for the future ofneuroscience,” Journal of Computational Neuroscience, vol. 42, pp. 1–10, Feb.2017.
[563] J. L. Stobart, K. D. Ferrari, M. J. P. Barrett, M. J. Stobart, Z. J. Looser,A. S. Saab, and B. Weber, “Long-term In Vivo Calcium Imaging of AstrocytesReveals Distinct Cellular Compartment Responses to Sensory Stimulation,”Cerebral Cortex (New York, N.Y.: 1991), vol. 28, pp. 184–198, Jan. 2018.
[564] L.-J. Pilaz, A. L. Lennox, J. P. Rouanet, and D. L. Silver, “Dynamic mRNATransport and Local Translation in Radial Glial Progenitors of the DevelopingBrain,” Current Biology, vol. 26, pp. 3383–3392, Dec. 2016.
[565] R. Thomsen, J. Pallesen, T. F. Daugaard, A. D. Børglum, and A. L. Nielsen,“Genome wide assessment of mRNA in astrocyte protrusions by direct RNAsequencing reveals mRNA localization for the intermediate filament proteinnestin,” Glia, vol. 61, pp. 1922–1937, Nov. 2013.
[566] Z. Wang, M. Tymianski, O. T. Jones, and M. Nedergaard, “Impact of Cy-toplasmic Calcium Buffering on the Spatial and Temporal Characteristics ofIntercellular Calcium Signals in Astrocytes,” Journal of Neuroscience, vol. 17,pp. 7359–7371, Oct. 1997.
Cette thèse est accessible à l'adresse : http://theses.insa-lyon.fr/publication/2019LYSEI093/these.pdf © [A. Denizot], [2019], INSA Lyon, tous droits réservés

BIBLIOGRAPHY 241
[567] S. Zeller, S. Rüdiger, H. Engel, J. Sneyd, G. Warnecke, I. Parker, and M. Fal-cke, “Modeling of the modulation by buffers of Ca2+ release through clustersof IP3 receptors,” Biophysical Journal, vol. 97, pp. 992–1002, Aug. 2009.
[568] V. C. Jones, L. McKeown, A. Verkhratsky, and O. T. Jones, “LV-pIN-KDEL: anovel lentiviral vector demonstrates the morphology, dynamics and continuityof the endoplasmic reticulum in live neurones,” BMC Neuroscience, vol. 9,p. 10, Jan. 2008.
[569] J. Nixon-Abell, C. J. Obara, A. V. Weigel, D. Li, W. R. Legant, C. S. Xu, H. A.Pasolli, K. Harvey, H. F. Hess, E. Betzig, C. Blackstone, and J. Lippincott-Schwartz, “Increased spatiotemporal resolution reveals highly dynamic densetubular matrices in the peripheral ER,” Science, vol. 354, p. aaf3928, Oct.2016.
[570] M. Brunstein, K. Wicker, K. Hérault, R. Heintzmann, and M. Oheim, “Full-field dual-color 100-nm super-resolution imaging reveals organization and dy-namics of mitochondrial and ER networks,” Optics Express, vol. 21, pp. 26162–26173, Nov. 2013.
[571] B. G. Kopek, M. G. Paez-Segala, G. Shtengel, K. A. Sochacki, M. G. Sun,Y. Wang, C. S. Xu, S. B. van Engelenburg, J. W. Taraska, L. L. Looger,and H. F. Hess, “Diverse protocols for correlative super-resolution fluorescenceimaging and electron microscopy of chemically fixed samples,” Nature proto-cols, vol. 12, pp. 916–946, May 2017.
[572] M.-Y. Sun, P. Devaraju, A. X. Xie, I. Holman, E. Samones, T. R. Murphy, andT. A. Fiacco, “Astrocyte calcium microdomains are inhibited by BafilomycinA1 and cannot be replicated by low-level Schaffer collateral stimulation insitu,” Cell Calcium, vol. 55, pp. 1–16, Jan. 2014.
[573] A. Agarwal, P.-H. Wu, E. G. Hughes, M. Fukaya, M. A. Tischfield, A. J.Langseth, D. Wirtz, and D. E. Bergles, “Transient Opening of the Mitochon-drial Permeability Transition Pore Induces Microdomain Calcium Transientsin Astrocyte Processes,” Neuron, vol. 93, pp. 587–605.e7, Feb. 2017.
[574] C. Mauvezin and T. P. Neufeld, “Bafilomycin A1 disrupts autophagic fluxby inhibiting both V-ATPase-dependent acidification and Ca-P60a/SERCA-dependent autophagosome-lysosome fusion,” Autophagy, vol. 11, no. 8,pp. 1437–1438, 2015.
[575] G. Roest, R. M. La Rovere, G. Bultynck, and J. B. Parys, “IP3 Receptor Prop-erties and Function at Membrane Contact Sites,” Advances in ExperimentalMedicine and Biology, vol. 981, pp. 149–178, 2017.
Cette thèse est accessible à l'adresse : http://theses.insa-lyon.fr/publication/2019LYSEI093/these.pdf © [A. Denizot], [2019], INSA Lyon, tous droits réservés

242 BIBLIOGRAPHY
[576] J. Marchaland, C. Calì, S. M. Voglmaier, H. Li, R. Regazzi, R. H. Edwards,and P. Bezzi, “Fast Subplasma Membrane Ca2+ Transients Control Exo-Endocytosis of Synaptic-Like Microvesicles in Astrocytes,” Journal of Neu-roscience, vol. 28, pp. 9122–9132, Sept. 2008.
[577] M. M Wu, E. D Covington, and R. Lewis, “Single-molecule analysis of diffu-sion and trapping of STIM1 and Orai1 at ER-plasma membrane junctions,”Molecular biology of the cell, vol. 25, July 2014.
[578] Y. Elbaz and M. Schuldiner, “Staying in touch: the molecular era of organellecontact sites,” Trends in Biochemical Sciences, vol. 36, pp. 616–623, Nov. 2011.
[579] H. Wu, P. Carvalho, and G. K. Voeltz, “Here, there, and everywhere: Theimportance of ER membrane contact sites,” Science, vol. 361, p. eaan5835,Aug. 2018.
[580] J. T. Smyth, W. I. DeHaven, G. S. Bird, and J. W. Putney, “Ca2+-store-dependent and -independent reversal of Stim1 localization and function,” JCell Sci, vol. 121, pp. 762–772, Mar. 2008.
[581] T. A. Fiacco and K. D. McCarthy, “Intracellular Astrocyte Calcium WavesIn Situ Increase the Frequency of Spontaneous AMPA Receptor Currents inCA1 Pyramidal Neurons,” Journal of Neuroscience, vol. 24, pp. 722–732, Jan.2004.
[582] R. Yuste, A. Majewska, and K. Holthoff, “From form to function: calcium com-partmentalization in dendritic spines,” Nature Neuroscience, vol. 3, pp. 653–659, July 2000.
[583] N. Korogod, C. C. Petersen, and G. W. Knott, “Ultrastructural analysisof adult mouse neocortex comparing aldehyde perfusion with cryo fixation,”eLife, vol. 4, p. e05793, 2015.
[584] X. Li, Y. Tao, R. Bradley, Z. Du, Y. Tao, L. Kong, Y. Dong, J. Jones, Y. Yan,C. R. K. Harder, L. M. Friedman, M. Bilal, B. Hoffmann, and S.-C. Zhang,“Fast Generation of Functional Subtype Astrocytes from Human PluripotentStem Cells,” Stem Cell Reports, vol. 11, pp. 998–1008, Oct. 2018.
[585] H. Cang, Z. Tong, P. Beuzer, Q. Ye, J. Axelrod, and Z. Hong, “Ex-STORM:Expansion Single Molecule Nanoscopy,” bioRxiv, p. 049403, Apr. 2016.
[586] M. Gao, R. Maraspini, O. Beutel, A. Zehtabian, B. Eickholt, A. Honig-mann, and H. Ewers, “Expansion Stimulated Emission Depletion Microscopy(ExSTED),” ACS Nano, vol. 12, pp. 4178–4185, May 2018.
Cette thèse est accessible à l'adresse : http://theses.insa-lyon.fr/publication/2019LYSEI093/these.pdf © [A. Denizot], [2019], INSA Lyon, tous droits réservés

BIBLIOGRAPHY 243
[587] A. R. Halpern, G. C. M. Alas, T. J. Chozinski, A. R. Paredez, and J. C.Vaughan, “Hybrid Structured Illumination Expansion Microscopy Reveals Mi-crobial Cytoskeleton Organization,” ACS Nano, vol. 11, pp. 12677–12686, Dec.2017.
[588] Y. Wang, Z. Yu, C. K. Cahoon, T. Parmely, N. Thomas, J. R. Unruh, B. D.Slaughter, and R. S. Hawley, “Combined expansion microscopy with structuredillumination microscopy for analyzing protein complexes,” Nature Protocols,vol. 13, p. 1869, Aug. 2018.
[589] M. U. Khalid, A. Tervonen, I. Korkka, J. Hyttinen, and K. Lenk, “Geometry-based Computational Modeling of Calcium Signaling in an Astrocyte,” in EM-BEC & NBC 2017, IFMBE Proceedings, pp. 157–160, Springer, Singapore,June 2017.
[590] E. Nordlie, M.-O. Gewaltig, and H. E. Plesser, “Towards Reproducible De-scriptions of Neuronal Network Models,” PLOS Computational Biology, vol. 5,p. e1000456, Aug. 2009.
[591] S. M. Crook, A. P. Davison, and H. E. Plesser, “Learning from the Past: Ap-proaches for Reproducibility in Computational Neuroscience,” in 20 Years ofComputational Neuroscience (J. M. Bower, ed.), Springer Series in Computa-tional Neuroscience, pp. 73–102, New York, NY: Springer New York, 2013.
[592] S. Crook, “Model Reproducibility: Overview,” in Encyclopedia of Computa-tional Neuroscience (D. Jaeger and R. Jung, eds.), pp. 1–3, New York, NY:Springer New York, 2013.
[593] M. Migliore, T. M. Morse, A. P. Davison, L. Marenco, G. M. Shepherd, andM. L. Hines, “ModelDB,” Neuroinformatics, vol. 1, pp. 135–139, Mar. 2003.
[594] N. L. Novère, A. Finney, M. Hucka, U. S. Bhalla, F. Campagne, J. Collado-Vides, E. J. Crampin, M. Halstead, E. Klipp, P. Mendes, P. Nielsen, H. Sauro,B. Shapiro, J. L. Snoep, H. D. Spence, and B. L. Wanner, “Minimum informa-tion requested in the annotation of biochemical models (MIRIAM),” NatureBiotechnology, vol. 23, pp. 1509–1515, Dec. 2005.
[595] M. Hucka, A. Finney, H. M. Sauro, H. Bolouri, J. C. Doyle, H. Kitano, A. P.Arkin, B. J. Bornstein, D. Bray, A. Cornish-Bowden, A. A. Cuellar, S. Dronov,E. D. Gilles, M. Ginkel, V. Gor, I. I. Goryanin, W. J. Hedley, T. C. Hodg-man, J.-H. Hofmeyr, P. J. Hunter, N. S. Juty, J. L. Kasberger, A. Kremling,U. Kummer, N. Le Novère, L. M. Loew, D. Lucio, P. Mendes, E. Minch, E. D.Mjolsness, Y. Nakayama, M. R. Nelson, P. F. Nielsen, T. Sakurada, J. C.
Cette thèse est accessible à l'adresse : http://theses.insa-lyon.fr/publication/2019LYSEI093/these.pdf © [A. Denizot], [2019], INSA Lyon, tous droits réservés

244 Bibliographie
Schaff, B. E. Shapiro, T. S. Shimizu, H. D. Spence, J. Stelling, K. Takahashi,M. Tomita, J. Wagner, and J. Wang, “The systems biology markup language(SBML): a medium for representation and exchange of biochemical networkmodels,” Bioinformatics, vol. 19, pp. 524–531, Mar. 2003.
[596] A. P. Davison, D. Brüderle, J. M. Eppler, J. Kremkow, E. Muller, D. Pecevski,L. Perrinet, and P. Yger, “PyNN: a common interface for neuronal networksimulators,” Frontiers in Neuroinformatics, vol. 2, 2009.
[597] S. Crook, P. Gleeson, F. Howell, J. Svitak, and R. A. Silver, “MorphML:Level 1 of the NeuroML Standards for Neuronal Morphology Data and ModelSpecification,” Neuroinformatics, vol. 5, pp. 96–104, Apr. 2007.
[598] S. M. T. Hernández-Sotomayor, C. D. L. Santos-Briones, J. A. Muñoz-Sánchez,and V. M. Loyola-Vargas, “Kinetic Analysis of Phospholipase C from Catha-ranthus roseus Transformed Roots Using Different Assays,” Plant Physiology,vol. 120, pp. 1075–1082, Aug. 1999.
[599] J. Akerboom, T.-W. Chen, T. J. Wardill, L. Tian, J. S. Marvin, S. Mutlu,N. C. Calderón, F. Esposti, B. G. Borghuis, X. R. Sun, A. Gordus, M. B.Orger, R. Portugues, F. Engert, J. J. Macklin, A. Filosa, A. Aggarwal, R. A.Kerr, R. Takagi, S. Kracun, E. Shigetomi, B. S. Khakh, H. Baier, L. Lagnado,S. S.-H. Wang, C. I. Bargmann, B. E. Kimmel, V. Jayaraman, K. Svoboda,D. S. Kim, E. R. Schreiter, and L. L. Looger, “Optimization of a GCaMPcalcium indicator for neural activity imaging,” The Journal of Neuroscience:The Official Journal of the Society for Neuroscience, vol. 32, pp. 13819–13840,Oct. 2012.
[600] A. Michailova, F. Del Principe, M. Egger, and E. Niggli, “SpatiotemporalFeatures of Ca2+ Buffering and Diffusion in Atrial Cardiac Myocytes withInhibited Sarcoplasmic Reticulum,” Biophysical journal, vol. 83, pp. 3134–51,Jan. 2003.
Cette thèse est accessible à l'adresse : http://theses.insa-lyon.fr/publication/2019LYSEI093/these.pdf © [A. Denizot], [2019], INSA Lyon, tous droits réservés

245
Appendix A
Supplemental methods and modelvalidation
“There is always time for another last minute”Terry Pratchett
A.1 Parameter values
Table A.1 presents the parameter values that have been used in the ”GCaMP”,“No-GCaMP”, ”GCaMP6f” and ”Lck-GCaMP6f” 3D models (see section V.1). Ta-ble A.2 presents the additional parameter values that were added in the ”GC+Buf”model, which accounts for endogenous Ca2+ buffers, their diffusion and interactionswith Ca2+ ions (see section V.1 and Fig V.1).
A.2 Validation of modeling strategies
A.2.1 Study of the effect of endogenous buffers on the effec-tive DCa
A.2.1.1 Mean field model of Ca2+ buffering
In the 2D implementation of the model, the effect of Ca2+ buffers has beenaccounted by decreasing the effective Ca2+ coefficient of diffusion, DCa (see Chap-
Cette thèse est accessible à l'adresse : http://theses.insa-lyon.fr/publication/2019LYSEI093/these.pdf © [A. Denizot], [2019], INSA Lyon, tous droits réservés

246 A. Supplemental methods and model validation
Table A.1: Parameter values and initial conditions of the 3D model. The parametervalues of the 3D model listed here correspond to the ”GCaMP” model. The parameter valuesfor the “No-GCaMP” model, devoid of GCaMP, are the same except that [GCaMP6s] = 0 nM. In”GCaMP6f” and ”Lck-GCaMP6f” models, Gcampf = 1.05×10⁷M−1.s−1 and Gcampb = 3.93s−1.Parameter values have been adjusted to optimize the match with experimental data (see Fig V.2).Note that the values for Ca2+ and IP3 binding or unbinding to IP3R, i.e. the ai’s and bj ’sparameters below, are smaller in our model than in the literature, probably because our modelis not cooperative. For GCaMP6s and cytosolic GCaMP6f, we used the diffusion coefficient ofcalmodulin. The initial number of Ca2+ ions was adjusted so that the measured basal GCaMP6s-Ca concentration was around 300nM [177, 551].
Parameter Description Value in 3D GCaMP model ReferenceV Cell volume 2.81× 10⁻¹⁷ L [32]
IP3 dynamicsIP0 Initial IP3 number/conc 3 molec. i.e 177 nM [550]DIP3 IP3 diffusion 280 µm2.s−1 [554]Nplc PLCδ number/conc. 1696 molec. i.e 100 µM [598]δ PLCδmax rate 1 s−1 -β IP3 decay 1.2× 10⁻⁴ s−1 -
Ca2+ dynamicsCa0 Initial Ca2+ number/conc. 5 molec. i.e 295 nM [551]DCa Ca2+ diffusion 13 µm2.s−1 [554]µ Ca2+ flux through open IP3R 6× 10³ s−1 -γ Cytosolic Ca2+ influx 1.5× 10⁻⁷ s−1 -α Ca2+ decay rate 30 s−1 -
GCaMP6sCGCa GCaMP6s conc. 169 molec. i.e 10 µM [599, 163]DGCaMP GCaMP6s diffusion 50 µm2.s−1 [600]Gcampf GCaMP6s Ca binding rate 7.78× 10⁶ M−1.s−1 [185]Gcampb GCaMP6s-Ca dissociation rate 1.12 s−1 [185]
IP3RNIP3R IP3R number 50 molec. [481]dIP3R IP3R interact. distance 1 mesh triangle -
IP3R bindinga1 First Ca 1.2× 10⁶ M−1.s−1 -a2 IP3 4.1× 10⁷ M−1.s−1 -a3 Second Ca 1.6× 10⁴ M−1.s−1 -
IP3R dissociationb1 First Ca 50 s−1 -b2 IP3 400 s−1 -b3 Second Ca 100 s−1 -
Cette thèse est accessible à l'adresse : http://theses.insa-lyon.fr/publication/2019LYSEI093/these.pdf © [A. Denizot], [2019], INSA Lyon, tous droits réservés

A.2. Validation of modeling strategies 247
Table A.2: Parameter values and initial conditions associated to endogenous buffersin the 3D ”GC+Buf” model. Parameter values for the ”GC+Buf” 3D model (Fig V.1) are thesame as in ”GCaMP” model (Table A.1). Parameter values associated with the kinetics and diffusionof endogenous buffers were taken from a study that modeled Ca2+ dynamics in dendrites [484]. Notethat total endogenous buffer concentration in our model is 2 orders of magnitude lower than in thisstudy.
Parameter Description Value in 3D ReferenceCPV Initial PV conc. 260 nM [484]CPVCa Initial PV-Ca conc. 400 nM [484]DPV PV diffusion 43 µm2.s−1 [484]PVf PV Ca binding rate 10.7× 10⁷ M−1.s−1 [484]PVb PV-Ca dissociation rate 0.95 s−1 [484]CCBs Initial CBs conc. 110 nM [484]CCBsCa Initial CBsCa conc. 200 nM [484]CCBsCa2 Initial CBsCa2 conc. 200 nM [484]DCBs CBs diffusion 28 µm2.s−1 [484]CBsf CBs Ca binding rate 5.5× 10⁶ M−1.s−1 [484]CBsb CBs-Ca dissociation rate 2.6 s−1 [484]CBsCaf CBs-Ca Ca binding rate 5.5× 10⁶ M−1.s−1 [484]CBsCab CBs-Ca2 dissociation rate 2.6 s−1 [484]CCBf Initial CBf conc. 110 nM [484]CCBfCa Initial CBfCa conc. 200 nM [484]CCBfCa2 Initial CBfCa2 conc. 200 nM [484]DCBf CBf diffusion 28 µm2.s−1 [484]CBff CBf Ca binding rate 4.35× 10⁷ M−1.s−1 [484]CBfb CBf-Ca dissociation rate 35.8 s−1 [484]CBfCaf CBf-Ca Ca binding rate 4.35× 10⁷ M−1.s−1 [484]CBfCab CBf-Ca2 dissociation rate 35.8 s−1 [484]
Cette thèse est accessible à l'adresse : http://theses.insa-lyon.fr/publication/2019LYSEI093/these.pdf © [A. Denizot], [2019], INSA Lyon, tous droits réservés

248 A. Supplemental methods and model validation
Table A.3: Parameter values and initial conditions of the ODE model of Ca2+
buffering. Table presenting parameter values of the ODE model of Ca2+ buffering, presentedin Fig A.1A. a.u : arbitrary unit.
Parameter Description Value in ODE modelCa2+ dynamics
Ca0 Initial Ca2+ number 50 molec.α cytosolic Ca2+ influx 50 a.uβ Ca2+ decay rate 1.0 a.u
Buffers dynamicsnbbuf Total number of buffers variedCaBuf0 Initial number of Ca2+-bound buffers 0 molec.Dbuf Coefficient of diffusion of buffers 0.1 a.ukon Ca2+ binding rate 3.5 a.ukoff CaBuf dissociation rate 0.05 a.u
ter IV), which thus lumps together Ca2+ buffering by mobile endogenous buffers aswell as the diffusion of these buffers. In order to better understand the dynamics ofour model when Ca2+ buffers are explicitly added in the model, we have developeda simple mean field (ODE) model of Ca2+ buffering. The reactions of the modeland the corresponding ODEs are presented in Fig A.1A. Fig A.1B presents the Ca2+
response to an injection of 100 Ca2+ ions in the system at t=150 dt. Results suggestthat an increase in the number of buffers leads to a slight decrease of Ca2+ peakamplitude. Interestingly, we show that the basal concentration of Ca2+ remains un-changed (Fig A.1B) while the concentration of Ca-bound buffers (CaBuf) increaseslinearly with the number of buffers (Fig A.1C). Finally, peak amplitude of CaBuf(which is what is measured with fluorescent Ca2+ indicators) decreases exponen-tially with the number of Buf molecules (Fig A.1D). This result is due to the factthat peak amplitude is measured as ∆F/F ratio, which decreases exponentially withthe number of buffer molecules. Those preliminary results have helped us betterunderstand the dynamics of Ca2+ buffering.
A.2.1.2 2D model of Ca2+ buffering
To test whether adding explicitly buffers in the model yields effects similar to adecrease of Ca2+ diffusion coefficient DCa (see Chapter IV), we have added buffers tothe 2D implementation of the model, which kinetic scheme is presented in Fig IV.1.The kinetic scheme of the 2D model with explicit Ca2+ buffering is presented inFig A.2A and the associated parameter values are presented in Table A.4. We com-
Cette thèse est accessible à l'adresse : http://theses.insa-lyon.fr/publication/2019LYSEI093/these.pdf © [A. Denizot], [2019], INSA Lyon, tous droits réservés

A.2. Validation of modeling strategies 249
Figure A.1: Mean field study of the effect of Ca2+ buffering. (A) Reactions of themodel and the corresponding ODEs for the 3 variables: the concentration of Ca2+, Ca, theconcentration of Ca2+-bound buffers, CaBuf and the concentration of unbound buffers, Buf.Ca2+ enters the cytosol with rate α. Likewise, cytosolic Ca2+ exits the cytosol at rate β.Ca2+ and Buf molecules bind at rate kon to form CaBuf molecules. CaBuf molecules dissociateinto Ca2+ and Buf molecules at rate koff . ξ term is the Ca2+ injection term, correspondingto an addition of 100 Ca2+ ions in the system at time t=150 dt. nbbuf corresponds to thetotal number of buffers, including both bound and unbound molecules. Parameter values arepresented in Table A.3
pared Ca2+ dynamics in the reference model presented in Chapter IV with this 2DCa2+ buffering model. The buffering model is characterized by a faster Ca2+ ionsdiffusion but a lower CaBuf diffusion coefficient (see Fig A.2 and Table A.4). Nosignificant effect of the number of buffers was observed on basal Ca2+ concentration(Fig A.2B), peak amplitude (Fig A.2C) and frequency (Fig A.2D) compared to sim-ulations in which the effect of buffers was accounted for by a decreased effective DCa.Those results suggest that simulating Ca2+ diffusion in our 2D implementation ofthe model with a decreased effective coefficient of diffusion is equivalent to explicitlyadding endogenous buffers in the system.
Cette thèse est accessible à l'adresse : http://theses.insa-lyon.fr/publication/2019LYSEI093/these.pdf © [A. Denizot], [2019], INSA Lyon, tous droits réservés
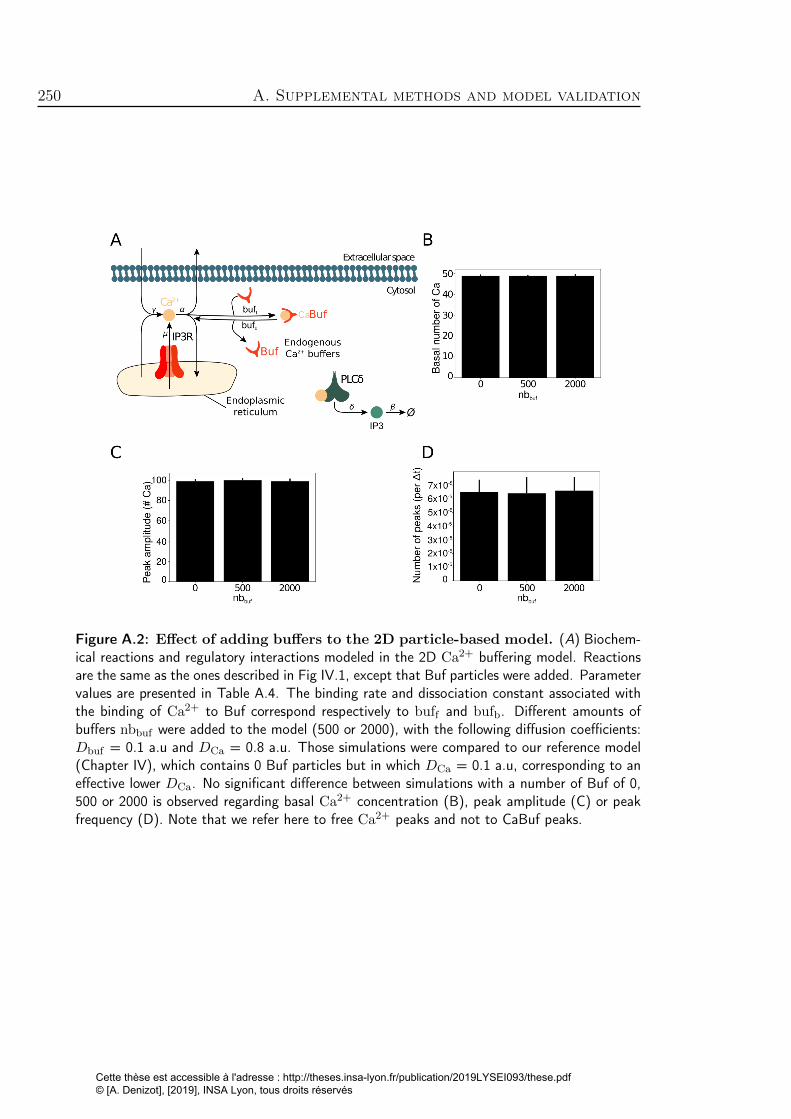
250 A. Supplemental methods and model validation
Figure A.2: Effect of adding buffers to the 2D particle-based model. (A) Biochem-ical reactions and regulatory interactions modeled in the 2D Ca2+ buffering model. Reactionsare the same as the ones described in Fig IV.1, except that Buf particles were added. Parametervalues are presented in Table A.4. The binding rate and dissociation constant associated withthe binding of Ca2+ to Buf correspond respectively to buff and bufb. Different amounts ofbuffers nbbuf were added to the model (500 or 2000), with the following diffusion coefficients:Dbuf = 0.1 a.u and DCa = 0.8 a.u. Those simulations were compared to our reference model(Chapter IV), which contains 0 Buf particles but in which DCa = 0.1 a.u, corresponding to aneffective lower DCa. No significant difference between simulations with a number of Buf of 0,500 or 2000 is observed regarding basal Ca2+ concentration (B), peak amplitude (C) or peakfrequency (D). Note that we refer here to free Ca2+ peaks and not to CaBuf peaks.
Cette thèse est accessible à l'adresse : http://theses.insa-lyon.fr/publication/2019LYSEI093/these.pdf © [A. Denizot], [2019], INSA Lyon, tous droits réservés

A.2. Validation of modeling strategies 251
Table A.4: Parameter values and initial conditions of the 2D model of Ca2+
buffering. Table presenting parameter values of the 2D model of Ca2+ buffering, presentedin Fig A.2A. Parameter values were the same as the model presented in Chapter IV (Table IV.1).The additional parameter values associated with buffers and their interactions with Ca2+ ionsare presented below. a.u : arbitrary unit.
Parameter Description Value in 2D modelV Cell volume 200× 200 a.u.
Ca2+ dynamicsCa0 Initial Ca2+ number 50 molec.α cytosolic Ca2+ influx 50 a.uβ Ca2+ decay rate 1.0 a.u
Buffer dynamicsnbbuf Total number of buffers variedCaBuf0 Initial number of Ca2+-bound buffers 0 molec.buff Ca2+ binding rate 3.5 a.ubufb CaBuf dissociation rate 0.05 a.u
A.2.2 Validation of the 3D model implemented in STEPS
As explained in section V.1, the parameters used in our 3D model were based onvalues extracted from experimental data whenever available and the other param-eters were adjusted to fit experimental recordings of Ca2+ dynamics. In order tovalidate the 3D voxel-based model presented in section V.1, we have compared itsCa2+ dynamics to that of the 2D particle-based implementation of the model, pre-sented in Chapter IV. To do so, we have built a sheet-like 3D geometry (Fig A.3A)in which simulations with similar parameter values to that of the 2D model (seeTable IV.1) were performed. The evolution of [IP3] and [Ca2+] displayed Ca2+ dy-namics that was similar to that of the 2D particle-based implementation of themodel (Fig A.3B) and reproduced the main results from section IV.2 (Fig A.3C).Those results validate the implementation of our 3D voxel-based model.
Cette thèse est accessible à l'adresse : http://theses.insa-lyon.fr/publication/2019LYSEI093/these.pdf © [A. Denizot], [2019], INSA Lyon, tous droits réservés

252 A. Supplemental methods and model validation
Figure A.3: Validation of the 3D model. (A) Geometry that was designed for comparingthe behavior of the 2D (Chapter IV) and of the 3D (Chapter V) implementations of the model.The geometry corresponds to a sheet of size 200 x 200 x 1 nm3. Panel A1 presents a screenshotof a representative simulation, displaying IP3R clusters of size η=4 on the membrane. PanelA2 presents a screenshot that reveals the sheet-like geometry of the mesh used in this study.(B1) Representative simulation traces displaying the evolution of the number of IP3 and ofCa2+ particles over time in a model of IP3 and Ca2+ degradation. Simulations in the 2Dparticle-based (red and blue for Ca2+ and IP3, respectively) and in the 3D voxel-based imple-mentation of the model (black and green for Ca2+ and IP3, respectively) were compared. (B2)Representative simulation traces of the complete reference model presented in Chapter IV, witheither a 2D particle-based (red and blue for Ca2+ and IP3 respectively) or a 3D voxel-basedimplementation of the model (black and green for Ca2+ and IP3 respectively). (C ) Similarlyto the 2D model (Fig IV.5), increasing IP3R cluster size η resulted in an increase of puff ratio(C1) and of the number of peaks during simulation time (C2). Data are presented as mean ±standard deviation over 20 simulations.
Cette thèse est accessible à l'adresse : http://theses.insa-lyon.fr/publication/2019LYSEI093/these.pdf © [A. Denizot], [2019], INSA Lyon, tous droits réservés

FOLIO ADMINISTRATIF
THESE DE L’UNIVERSITE DE LYON OPEREE AU SEIN DE L’INSA LYON
NOM : DENIZOT DATE de SOUTENANCE : 08/11/2019
Prénoms : Audrey
TITRE : Simulation de la signalisation calcique dans les prolongements fins astrocytaires
NATURE : Doctorat Numéro d'ordre : 2019LYSEI093
Ecole doctorale : École Doctorale Informatique et Mathématiques (ED512)
Spécialité : Informatique
RESUME :
Les astrocytes ont récemment été identifiés comme partenaires essentiels des neurones pour le traitement del'information dans le cerveau. Les astrocytes répondent à une stimulation neuronale par des variations deconcentration en calcium, ce qui entraîne une modulation de l'efficacité de la communication neuronale. Cesinteractions sont essentielles aux fonctions cérébrales et sont altérées dans les maladies du cerveau, comme lecancer, l'épilepsie et les maladies neurodégénératives. La modélisation est cruciale pour étudier ces signaux, carla plupart d'entre eux se produisent dans des ramifications cellulaires qui sont trop fines pour être résolues par lestechniques de microscopie optique classiques. Des études en microscopie électronique ont révélé une grandediversité des géométries de ces ramifications. Les rôles fonctionnels de cette diversité géométrique n'ontcependant pas été étudiés car les modèles d'astrocytes actuellement disponibles ne permettent pas unemodélisation spatiale au sein de petits volumes. Cette thèse vise à fournir des modèles stochastiques réalistesd’un point de vue biologique afin de simuler le traitement de l'information par les astrocytes et d’étudier l'influencede la géométrie cellulaire sur les signaux calciques. Dans l'ensemble, cette recherche contribuera à une meilleurecompréhension de l'intégration spatio-temporelle des signaux calciques astrocytaires, une condition préalable à lacompréhension de la communication neurones-astrocytes et de son influence sur les fonctions cérébrales.
MOTS-CLÉS : Astrocytes, signalisation calcique, neurosciences computationnelles, réaction-diffusion, géométrie,
Laboratoire (s) de recherche : Laboratoire d'Informatique en Image et Systèmes d'information
LIRIS CNRS UMR5205
Directeur de thèse: Hugues Berry, INRIA Président de jury : Laurent Venance, INSERM
Composition du jury : Geneviève Dupont (Directeur de Recherche ULB, rapportrice)Leonid Savtchenko (Senior Research Scientist , rapporteur)Laurent Venance (Directeur de Recherche INSERM, examinateur)Aude Panatier (Chargée de Recherche CNRS, examinatrice)Christian Henneberger (Assistant Professor Uni. Bonn, examinateur)Guillaume Beslon (Professeur INSA, examinateur)Hédi Soula (Professeur UPMC, co-directeur de thèse, invité)Hugues Berry (Directeur de recherche INRIA, directeur de thèse)
Cette thèse est accessible à l'adresse : http://theses.insa-lyon.fr/publication/2019LYSEI093/these.pdf © [A. Denizot], [2019], INSA Lyon, tous droits réservés


![Astrocytic tracer dynamics estimated from [1-11C]-acetate PET measurements](https://static.fdokumen.com/doc/165x107/6334cca03e69168eaf070c95/astrocytic-tracer-dynamics-estimated-from-1-11c-acetate-pet-measurements.jpg)