Silicon Deficiency Induces Alkaline Phosphatase Enzyme Activity in Cultures of Four Marine Diatoms
15
1 23 !" #$##%#&' !
-
Upload
algenolbiofuels -
Category
Documents
-
view
2 -
download
0
Transcript of Silicon Deficiency Induces Alkaline Phosphatase Enzyme Activity in Cultures of Four Marine Diatoms

1 23
�������� ���������������� ������ ������ ����������������� ���������������� ��� ����������� �!"���#$�##�%���� ��#� ��&���'
�������� ���������������������������������������������������������� ���!�����������
�������� ����������������������� � �������

1 23
Your article is protected by copyright andall rights are held exclusively by Coastaland Estuarine Research Federation (outsidethe USA). This e-offprint is for personaluse only and shall not be self-archivedin electronic repositories. If you wish toself-archive your article, please use theaccepted manuscript version for posting onyour own website. You may further depositthe accepted manuscript version in anyrepository, provided it is only made publiclyavailable 12 months after official publicationor later and provided acknowledgement isgiven to the original source of publicationand a link is inserted to the published articleon Springer's website. The link must beaccompanied by the following text: "The finalpublication is available at link.springer.com”.
Silicon Deficiency Induces Alkaline Phosphatase EnzymeActivity in Cultures of Four Marine Diatoms
Soledad Fuentes & Gary H. Wikfors & Shannon Meseck
Received: 27 June 2012 /Revised: 29 July 2013 /Accepted: 2 August 2013# Coastal and Estuarine Research Federation (outside the USA) 2013
Abstract Alkaline phosphatase (AP) was detected usingELF-97® in silicon-starved Pseudo -nitzschia multiseriescells; thus, we tested two, alternative hypotheses: Pseudo-nitzschia multiseries has a high phosphate demand, showingsigns of phosphate deficiency even when concentrations oforthophosphate are high, or silicate deficiency can stimulatethe AP enzyme in this species. We also studied the effect ofsilicon deficiency on AP in three other common marine dia-toms: Thalassiosira pseudonana , Nitzschia pusilla , andNitschia closterium . Each of the species tested showed adifferent pattern of AP regulation. AP levels, however, in-creased in the four diatoms as a result of silicon deficiency,suggesting that AP may be involved in a variety of intracel-lular processes related to silicon deficiency. Additionally, theresults of this study indicate that AP could be stimulated bystressors other than phosphate deficiency, such as silicondeficiency; therefore, it should be used cautiously as an indi-cator of phosphate limitation.
Keywords Alkaline phosphatase . Phosphate . Silicon .
ELF-97
Introduction
Phosphorus (P) is an essential element that is a critical com-ponent of nucleic acids, proteins, and ATP; hence, this
element is crucial for phytoplankton metabolism. In manyfreshwater environments, P is considered to be the limitingnutrient (Schindler 1977; Räike et al. 2003), but in marineenvironments P often is considered non-limiting for growth(Howarth 1988). Seasonal mixing of freshwater with seawaterin estuaries and coastal zones can result in seasonal variationin P limitation of phytoplankton growth (Nauch et al. 2004;Harrison et al. 1990). When the most bioavailable form of P,orthophosphate (Reynolds 2006), becomes a limiting re-source, many phytoplankton species are capable of activatinga group of metalloenzyme, alkaline phosphatases (AP), tosustain growth by utilizing organic P sources, both intracellu-lar and extracellular (Kuenzler and Perras 1965). This class ofenzymes, often associated with the cell membrane, hydrolyzesester bonds between phosphate and organic molecules(Cembella et al. 1984), thereby dephosphorylating organiccompounds and releasing orthophosphate. Alkaline phospha-tases, therefore, has been used to assess the P status of phyto-plankton communities in both freshwater and marine environ-ments (Perry 1972; Li et al. 1998; Dyhrman and Ruttenberg2006).
There is evidence, however, that alkaline phosphatase ac-tivity (APA) can be affected by factors other than phosphateavailability. AP belong to a two-component regulatory systemphoBR, with many different families of phosphatase(Kathurla andMartiny 2011). Two common phosphatase fam-ilies are phoA and phoX, with phoA being a group ofmetalloenzymes that usually use metals such as zinc, whilephoA use calcium as a cofactor (Roy et al. 1982; Coleman1992). The activity of phoA phosphatase, consequently, de-creases with decreasing zinc availability (Rueter and Morel1981). Furthermore, it has been reported that, in the diatomThalassiosira pseudonana , the metal ion cofactor of the en-zyme, zinc, can be displaced by copper, resulting in loss ofenzyme activity (Rueter 1983). Spectral composition andintensity of light also have been shown to affect P-uptake
Communicated by Pat Glibert
S. Fuentes :G. H. Wikfors : S. Meseck (*)Department of Commerce, National Oceanographic andAtmospheric Administration/NMFS, 212 Rogers Avenue, Milford,CT 06460, USAe-mail: [email protected]
S. FuentesAlgenol Biofuels, 16121 Lee Rd, Fort Myers, FL 33912, USA
Estuaries and CoastsDOI 10.1007/s12237-013-9695-z
Author's personal copy
kinetics and AP in Dunaliella tertiolecta , T. pseudonana ,Phaeodactylum tricornutum , and Prymnesium parvum(Wynne and Rhee 1988). These studies suggest that all thefactors that influence AP are not clearly understood and that itshould be used cautiously as an indicator of orthophosphatelimitation. Nevertheless, AP continues to be used as a proxyfor P deficiency in marine and freshwater phytoplankton(Petterson 1980; Palenik and Dyhrman 1998; Rengeforset al. 2003).
In the past, bulk AP activity was used to measure phosphatedeficiency in phytoplankton communities (Healey and Hendzel1980; Zohar and Robarts 1998). Several studies have shown agood correlation between AP activity and decreasing concentra-tions of orthophosphate (Nausch 1998). Bulk AP activity mea-surements, however, do not allow for the source of the freedissolved AP activity to be determined (i.e., bacterial, algal, orzooplankton). Current technologies allow researchers to deter-mine if the AP enzyme is activated at the individual cell level byusing the Enzyme-Labeled Fluorescence substrate 2-(5!-chloro-2!-phosphoryloxyphenyl)-6-chloro-4-(3H)-quinazolinone ( ELF-97®1) (Huang et al. 1993). ELF-97 is soluble and has lowfluorescencewhen theAP enzyme is not present; however, whenit reacts with AP enzyme, the probe produces a fluorescentyellow–green product called CHPQ [(2-(5!-chloro-2!-hydroxyphenyl)-6-chloro-4-(3H)-quinazolinone] at the site ofAPA (Singer et al. 1994). This fluorescent precipitate can beidentified by either fluorescence microscope or flow cytometry.This technique overcomes the problems of the traditionalmethods, which cannot differentiate between AP produced bydifferent species of microalgae and/or bacteria. González-Gilet al. (1998) found that bulk APA correlated well with threedifferent species of phytoplankton cells stained with ELF-97.Further laboratory studies found that, for a variety of marinephytoplankton, ELF-97 can be used to determine when the APenzyme is activated (Yamaguchi et al. 2006; Mesecket al. 2009). Based on laboratory studies, ELF-97 isnow used in a variety of natural environments to determineAPA in phytoplankton from freshwater, estuaries, and theopen ocean (Rengefors et al. 2001; Dyhrman and Palenik2001; Nicholson et al. 2006).
The activity of the AP enzyme is often thought to correlatewith limiting phosphate. In coastal zones around the world,however, AP has been observed coincident with relatively highconcentrations of dissolved phosphate (Sebastián et al. 2004;Nicholson et al. 2006; Sylvan et al. 2011). Nicholson et al.(2006) found phytoplankton species expressingAP at relativelylow N/P ratios and at soluble reactive phosphate (SRP) con-centrations higher than concentrations normally consideredlimiting for phytoplankton (i.e., 1–15 μmol L!1). Laboratory
experiments by Meseck et al. (2009) found that, in five coastalmarine species of microalgae (Chaetoceros neogracile ,Chlorella autotrophica , Isochrysis sp., Prorocentrum mini-mum , and Tetraselmis chui), the threshold concentrations ofSRP at which the phytoplankton cells activate the alkalinephosphate enzyme in response to phosphate deficiency wasrelatively high (10.1–16.4 μmol L!1) but consistent with somenatural phytoplankton observations (Dyhrman and Ruttenberg2006; Nicholson et al. 2006). Low dissolved phosphate con-centration and high N/P ratios would suggest that cells shouldnot be activating AP enzymes; however, usually 10 to 100% ofthe phytoplankton community shows detectable AP(Rengefors et al. 2001; Nicholson et al. 2006). These studiessuggest that some coastal, marine phytoplankton may have amuch higher phosphate demand than thought previously.
While screening cultures of the diatom Pseudo-nitzschiamultiseries for experimental purposes, we found that silicon-limited cells showed positive ELF-97® staining at high con-centrations of dissolved inorganic phosphate. These findingsled us to consider two hypotheses: Pseudo -nitzschiamultiseries either has a high phosphate demand, showingsigns of phosphate limitation even when concentrations oforthophosphate are high, or alternatively, silicon limitationcan stimulate AP in this species. Even though silicon has notbeen linked directly to AP in phytoplankton, there are studiesindicating that AP might be linked to silica in some biologicalsystems. For example, in human oesteoblasts and in quail, thepresence of dissolved silicon increased AP production(Ponirakis and Gough 2006; Sahin et al. 2006). To test thehypotheses that silicon deficiency induces the AP enzyme inPseudo-nitzschia multiseries , we carried out a two-part ex-periment. The first part of the experiment was designed todetermine if AP presence could be detected, not only underphosphate deficiency but also under silicon deficiency. In thesecond part of this study, we analyzed whether or not APexpression decreased (i.e., “turn off” of the enzyme) by theaddition of phosphate or silicon back into nutrient-deficientcultures. In addition to Pseudo-nitzschia multiseries , we usedT. pseudonana , Nitzschia pusilla , and Nitzschia closterium ,which represent common centric and pennate diatoms. Thesefour marine diatoms are found in both Pacific and Atlanticcoastal zones.
Materials and Methods
Cultures
Pseudo-nitzschia multiseries strain (CCL69) was obtainedfrom the Culture Collection of Algae and Protozoa. T.pseudonana (3H), N . pusilla (O-7), and N . closterium(D828) were obtained from bacteria-free cultures in theMilford Laboratory Marine Microalgal Culture Collection.
1 Use of trade names does not imply endorsement by NOAA FisheriesService.
Estuaries and Coasts
Author's personal copy

The cultures were maintained in 500-mL polystyrene cultureflasks (total volume 250 mL) at 16±1 °C on a 12/12-h light/dark cycle and under a light intensity of 110 μmolphotons m!2 s!1. Bacterial contamination was assessed by mi-croscopic examination and flow cytometry. The inoculum(stock) culture for each species was grown in SargassoSeawater enriched with nutrients at f/2 concentrations. To re-move any phosphate or silicon left in the media, the cells werecentrifuged at 1,000!g for 10 min at 16 °C. The overlying waterwas decanted, and the cells were re-suspended in SargassoSeawater. Culture flasks were inoculated with a starting celldensity of approximately 20,000 cells mL!1 for each species.
The four species were grown in Sargasso Seawater enrichedwith nutrients at f/2 concentrations. Three treatments (N =4)were used in the first part of the experiment; a control treatmentwith both silicon and phosphate enrichment (76.08±0.58 and40.76±1.08 μmol L!1, respectively), and two experimentaltreatments: silicon deficient (17.94±1.67 μmol L!1silicate)and phosphate deficient (6.18±1.22 μmol L!1 phosphate), thelast of which was a positive control for ELF-97® staining.Nutrients were not added further to maintain the initial concen-trations, thus P starvation was a function of initial dissolvedphosphate and algal uptake over time. Growth of the cultureswas measured every day by flow cytometry (FACScan, BDBioSciences, San Jose, CA) using the FL3 (red chlorophyllfluorescence) detector to discriminate living cells. Divisionrates (per day) were calculated during the exponential growthfor each species. When a significant difference in cell growthbetween the experimental treatments and the control was de-tected, samples were tested for positive ELF-97 staining,dissolved phosphate concentrations, and particulate P. If therewas no difference in the AP detection (positive ELF-97 stain-ing), the samples were allowed to continue to grow until adifference in AP detection with the control could be detected.
As soon as the percentage of cells expressing ELF-97staining in the experimental treatments was significantly dif-ferent from the control, only the no phosphate and no siliconcultures were split into the following four treatments: (1) nonutrients added, (2) phosphate added (43.46±1.51 μmol L!1),(3) sodium silicate added (115.05±1.47 μmol L!1), and (4)both phosphate and sodium silicate added. As with the stockcultures, these subcultures were allowed to grow until signif-icantly different growth and APA were detected. Once thesedifferences were detected, the samples were taken for partic-ulate and dissolved phosphate concentrations.
Dissolved and Particulate Nutrient Analysis
Ten milliliters of each sample was filtered through a GF/F filter.Dissolved nutrients were quantified by using a TRAACS 800autoanalyzer (Bran and Luebbe, Delavan, WI, USA), followingthe protocol described by Hansen and Koroleff (1999).Dissolved phosphate concentrations were determined by using
the phosphomolybdenum complex (detection limit0.08 μmol L!1). Dissolved silicon concentrations were deter-mined based upon the formation of a blue silicomolybdic com-plex (detection limit 0.1 μmol L!1). A red azo dye was used todetermine nitrate + nitrite (detection limit 0.05 μmol L!1) con-centrations after passage through a cadmium column. Nitrate +nitrite were determined only to ensure that the media were notnitrogen-depleted during the experiment. Nitrate + nitrite con-centrations never fell below 300 μmol L!1 for any of thetreatments and, therefore, will not be discussed any further.
Particulate samples were taken on Whatman GF/F muffledfilters (baked at 450 ° C for 12 h). Sample volumes varied (6 to15 mL) according to cell densities of each treatment.Intracellular, particulate phosphorus (IPP) contents were de-termined following the protocol described by Solórzano andSharp (1980).
ELF-97® Assay
The ELF-97 probe fluoresces bright green at the locationwhere a phosphatase enzyme has been activated. Five millili-ters of sample was collected from each culture. The sampleswere centrifuged at 16 °C for 10 min at 1,000!g . The super-natant was discarded, and the pellet was resuspended in 95 μLof synthetic seawater (pH 8.2). Five microliters of 5 mmol L!1
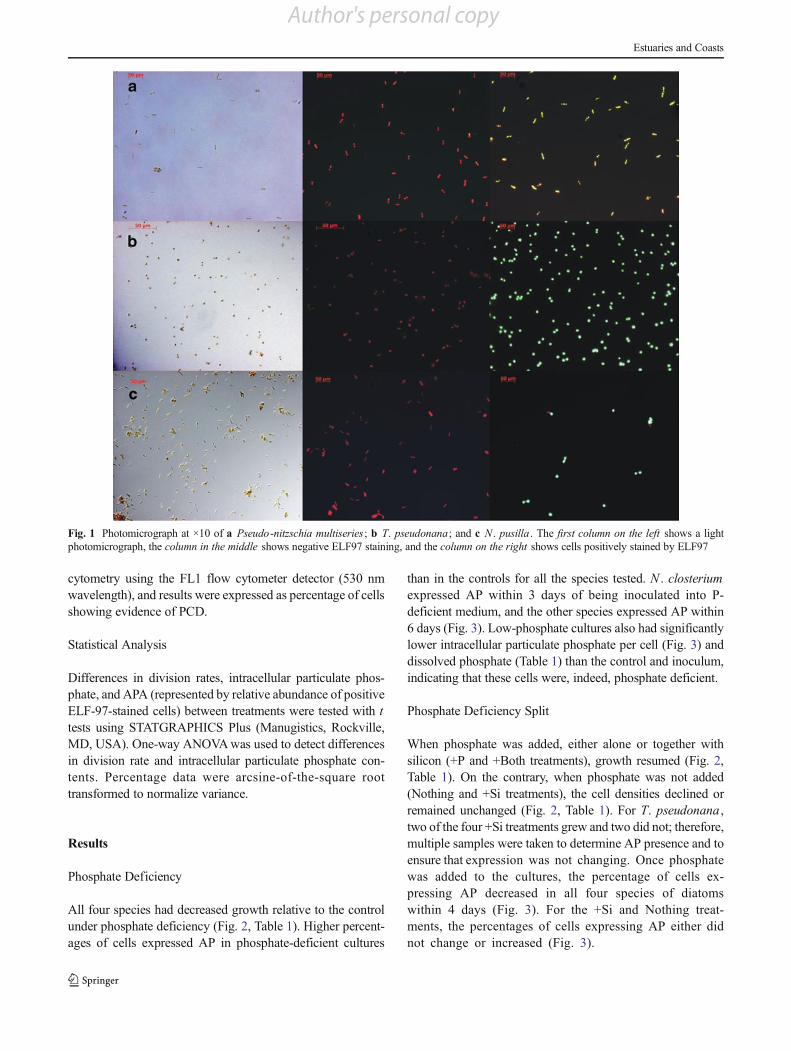
ELF-97 (Invitrogen, Molecular Probes, ELF-97®, catalog no.E-6589) was added to each sample. The samples were allowedto react for 30 min in the dark, and then the cells were washedthree times with synthetic seawater to stop any further reactionand to wash out any product that could have remained outsideof the cells. Stained samples were visualized and counted in aZeiss Axioscop 2 MOT Plus microscope with a 4!,6-diamidino-2-phenyl-indole filter set, using a magnificationof !20. Random microscopic fields were screened for relativequantification of positive, ELF-97-stained cells. Positive cellstaining was identified based upon the presence of a yellow-green fluorescent ELF-97 product. To be considered AP pos-itive, the surface of each cell should be complete or partiallycovered by ELF precipitate (Fig. 1). At least 100 cells werecounted in each sample, and then the percentage of cells thatexpressed positive staining was calculated.
Programmed Cell Death Measurements
Because nutrient limitation has been linked with programmedcell death (PCD) (Berges and Falkowski 1998), and to makesure that APA observed in silicon-starved cultures was aconsequence of silicon deficiency and not cell mortality,PCD was assessed in all the four species using the annexinV probe. This probe binds phosphatidylserine exposed on theouter leaflet of the plasma membrane as PCD proceeds(Koopman et al. 1994; Bidle and Bender 2008).Fluorescence of cells undergoing PCD was detected by flow
Estuaries and Coasts
Author's personal copy
cytometry using the FL1 flow cytometer detector (530 nmwavelength), and results were expressed as percentage of cellsshowing evidence of PCD.
Statistical Analysis
Differences in division rates, intracellular particulate phos-phate, and APA (represented by relative abundance of positiveELF-97-stained cells) between treatments were tested with ttests using STATGRAPHICS Plus (Manugistics, Rockville,MD, USA). One-way ANOVAwas used to detect differencesin division rate and intracellular particulate phosphate con-tents. Percentage data were arcsine-of-the-square roottransformed to normalize variance.
Results
Phosphate Deficiency
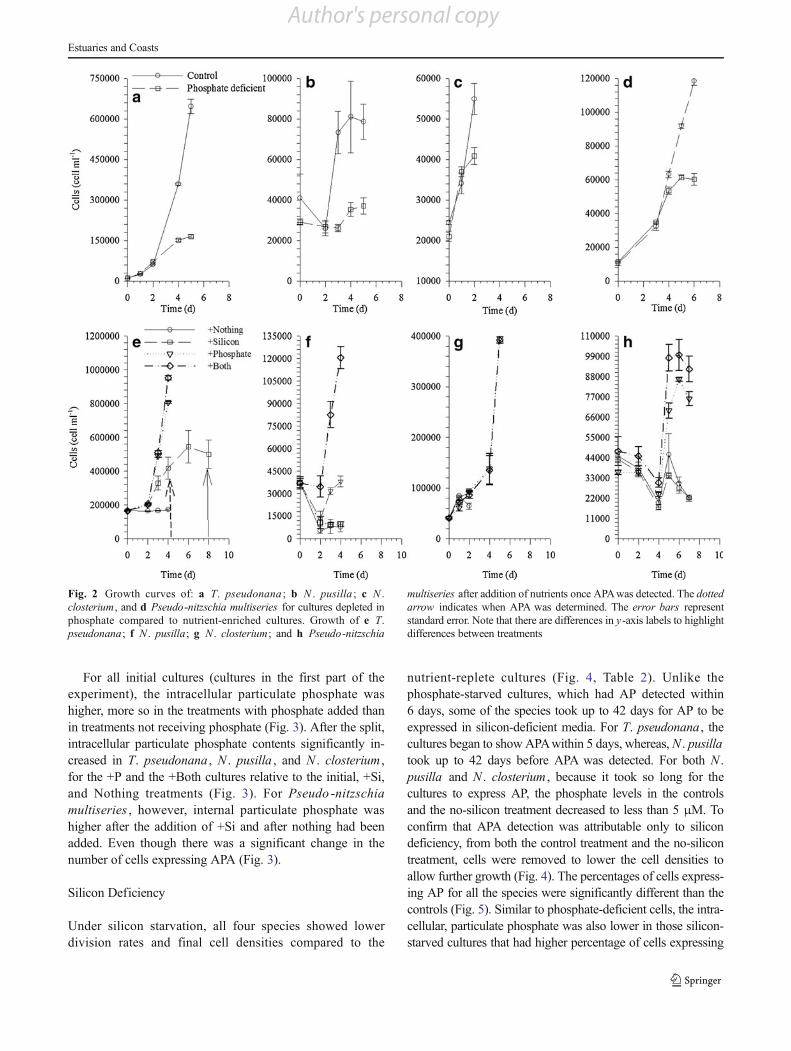
All four species had decreased growth relative to the controlunder phosphate deficiency (Fig. 2, Table 1). Higher percent-ages of cells expressed AP in phosphate-deficient cultures
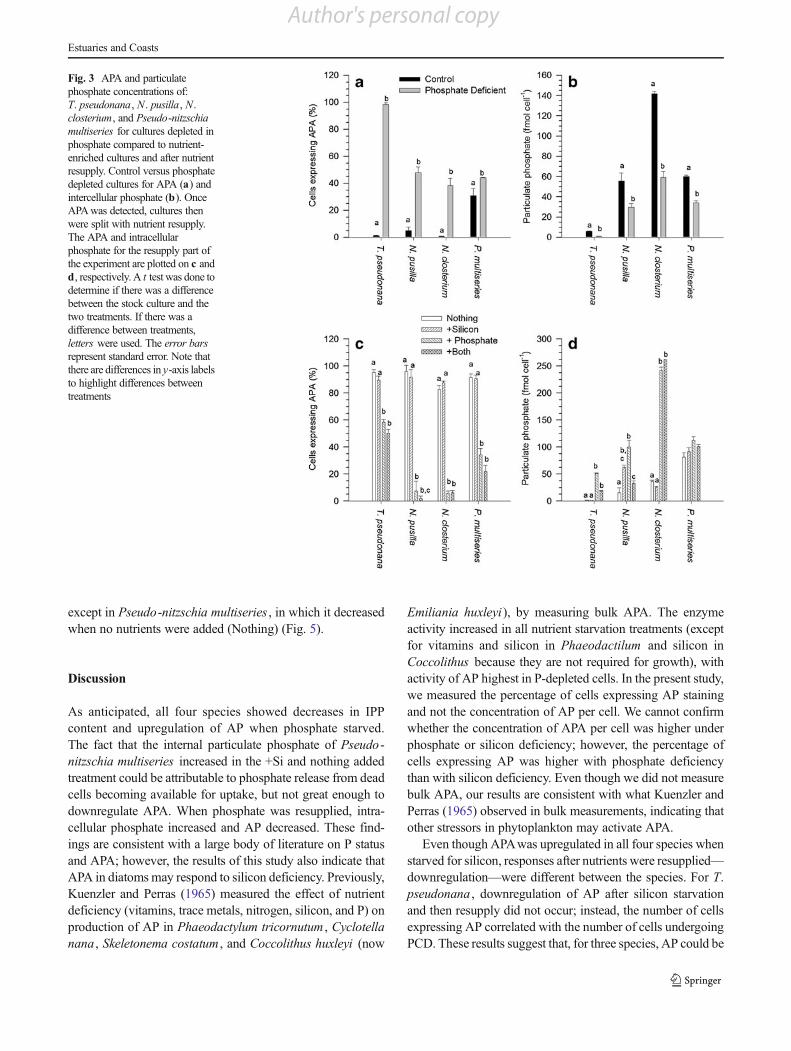
than in the controls for all the species tested. N . closteriumexpressed AP within 3 days of being inoculated into P-deficient medium, and the other species expressed AP within6 days (Fig. 3). Low-phosphate cultures also had significantlylower intracellular particulate phosphate per cell (Fig. 3) anddissolved phosphate (Table 1) than the control and inoculum,indicating that these cells were, indeed, phosphate deficient.
Phosphate Deficiency Split
When phosphate was added, either alone or together withsilicon (+P and +Both treatments), growth resumed (Fig. 2,Table 1). On the contrary, when phosphate was not added(Nothing and +Si treatments), the cell densities declined orremained unchanged (Fig. 2, Table 1). For T. pseudonana ,two of the four +Si treatments grew and two did not; therefore,multiple samples were taken to determine AP presence and toensure that expression was not changing. Once phosphatewas added to the cultures, the percentage of cells ex-pressing AP decreased in all four species of diatomswithin 4 days (Fig. 3). For the +Si and Nothing treat-ments, the percentages of cells expressing AP either didnot change or increased (Fig. 3).
Fig. 1 Photomicrograph at !10 of a Pseudo-nitzschia multiseries ; b T. pseudonana; and c N . pusilla. The first column on the left shows a lightphotomicrograph, the column in the middle shows negative ELF97 staining, and the column on the right shows cells positively stained by ELF97
Estuaries and Coasts
Author's personal copy
For all initial cultures (cultures in the first part of theexperiment), the intracellular particulate phosphate washigher, more so in the treatments with phosphate added thanin treatments not receiving phosphate (Fig. 3). After the split,intracellular particulate phosphate contents significantly in-creased in T. pseudonana , N . pusilla , and N . closterium ,for the +P and the +Both cultures relative to the initial, +Si,and Nothing treatments (Fig. 3). For Pseudo -nitzschiamultiseries , however, internal particulate phosphate washigher after the addition of +Si and after nothing had beenadded. Even though there was a significant change in thenumber of cells expressing APA (Fig. 3).
Silicon Deficiency
Under silicon starvation, all four species showed lowerdivision rates and final cell densities compared to the
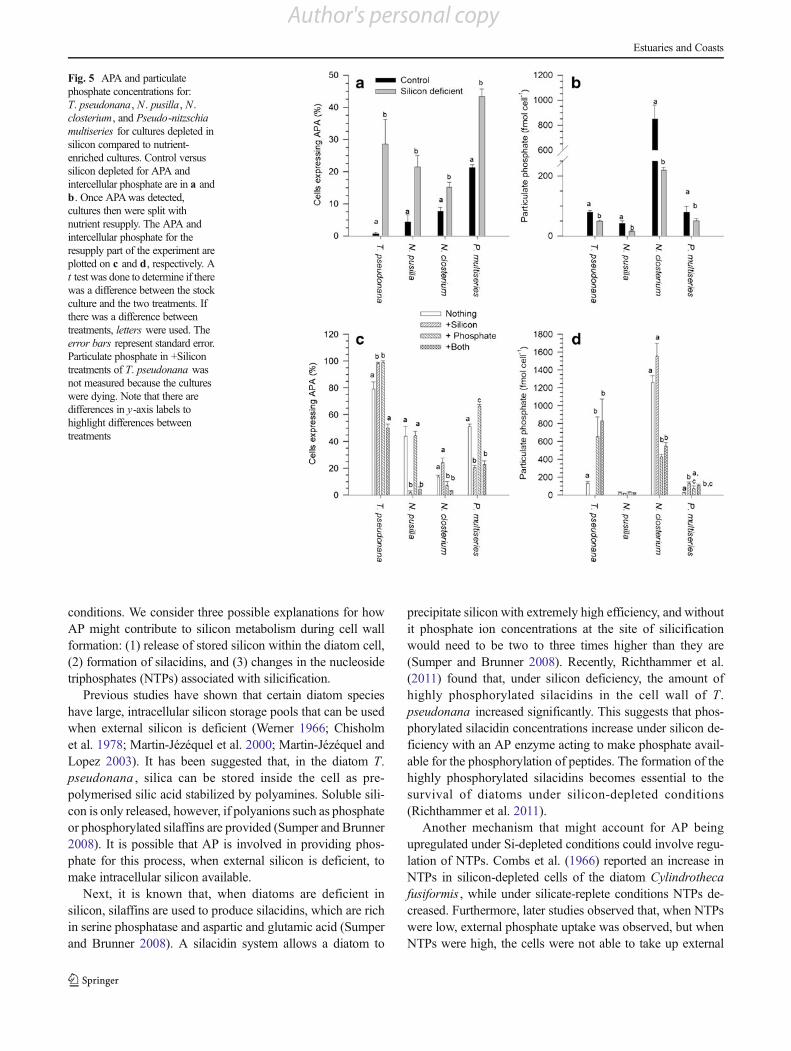
nutrient-replete cultures (Fig. 4, Table 2). Unlike thephosphate-starved cultures, which had AP detected within6 days, some of the species took up to 42 days for AP to beexpressed in silicon-deficient media. For T. pseudonana , thecultures began to show APAwithin 5 days, whereas,N . pusillatook up to 42 days before APA was detected. For both N .pusilla and N . closterium , because it took so long for thecultures to express AP, the phosphate levels in the controlsand the no-silicon treatment decreased to less than 5 μM. Toconfirm that APA detection was attributable only to silicondeficiency, from both the control treatment and the no-silicontreatment, cells were removed to lower the cell densities toallow further growth (Fig. 4). The percentages of cells express-ing AP for all the species were significantly different than thecontrols (Fig. 5). Similar to phosphate-deficient cells, the intra-cellular, particulate phosphate was also lower in those silicon-starved cultures that had higher percentage of cells expressing
Fig. 2 Growth curves of: a T. pseudonana ; b N . pusilla ; c N .closterium, and d Pseudo-nitzschia multiseries for cultures depleted inphosphate compared to nutrient-enriched cultures. Growth of e T.pseudonana; f N . pusilla; g N . closterium; and h Pseudo-nitzschia
multiseries after addition of nutrients once APAwas detected. The dottedarrow indicates when APA was determined. The error bars representstandard error. Note that there are differences in y-axis labels to highlightdifferences between treatments
Estuaries and Coasts
Author's personal copy

AP, even though the dissolved phosphate concentration washigh (Table 2).
Two of the species tested, N . pusilla and T. pseudonana ,showed additional responses to silicon stress. Cells of N .pusilla attached in stacks that increased in number of cellsas silicon was being depleted (Fuentes and Meseck, in prep-aration, for a complete description of this process). Cultures ofT. pseudonana lowered the number of cells, and auxosporeformation was observed. Concerned that the APA was anindication of cell mortality and not silicon deficiency, wetested silicon-starved cultures for PCD. Silicon-starved cul-tures of T. pseudonana showed 27.2±5.12% of cells express-ing PCD, which was approximately the same percentage ofcells expressing APA, indicating that the APA observed in T.pseudonana was possibly related to PCD.
Silicon Deficiency Split
Silicon-deficient cells resumed growth when either silicon wasadded alone (+Si) or together with phosphate (+Both, Fig. 4,Table 2) for all species except T. pseudonana . Silicon-starved
cultures of T. pseudonana were unable to recover and eitherformed auxospores or died.
The percentage of T. pseudonana cells expressing APAincreased for all the treatments after being split, whichcorresponded well with the number of cells undergoing PCD(Fig. 5). Dying cells of T. pseudonana were, thus, unable tomodify AP expression. The percentage of cells expressingAPA decreased in cultures ofN . pusilla and Pseudo-nitzschiamultiseries when silicon was added (+Si and+Both). In bothspecies, the numbers of cells expressing APA increased afternothing was added or only +P was added. For N . closteriumcultures, on the other hand, percentages of AP-positive cellsdecreased only when phosphate was added (+P and +Both).These cells were, however, difficult to work with because ofextremely rapid division rates, so even though subsampleswere taken multiple times to try to ensure that the cells werenot deficient in phosphate, it appears that this may not havebeen achieved. Intracellular, particulate phosphate was higherin the control and than in No Silicon treatment (Fig. 5). Oncesplit, intracellular particulate phosphate increased in all treat-ments of T. pseudonana , N . pusilla , and N . closterium ,
Table 1 Dissolved nitrate + nitrite, phosphate, and silicate concentrations of the media in the controls and phosphate-deficient treatments with thestandard error between the replicates for Pseudo-nitzchia multiseries , T. pseudonana , N . pusilla, and N . closterium
Species Treatment Division rate (day!1) Dissolved nitrate + nitrite (μM) Dissolved silicate (μM) Dissolved phosphate (μM)
P. multiseries Control 0.43±0.02a 424.58±47.11 53.33±11.44 24.63±13.68
Phosphate deficient 0.38±0.01b 517.06±8.96 29.48±7.62 1.86±0.21
T. pseudonana Control 0.82±0.04a 633.55±37.78 20.69±1.47 35.09±0.29
Phosphate deficient 0.67±0.05b 708.63±29.41 59.65±0.33 2.76±0.07
N . pusilla Control 0.57±0.02a 555.03±7.73 89.91±0.97 2.56±0.51
Phosphate deficient 0.12±0.04b 592.96±4.91 72.04±0.51 0.05±0.11
N . closterium Control 0.40±0.02a 740.28±12.42 107.98±12.42 5.82±0.77
Phosphate deficient 0.33±0.03b 780.52±19.52 97.82±5.62 0.25±1.00
Split phosphate deficient
P. multiseries No addition !0.06±0.02a 420.85±24.56 27.56±2.45 0.56±1.42
+Silicon !0.06±0.04a 453.25±10.84 98.52±1.25 1.26±0.75
+Phosphate 0.38±0.02b 375.91±12.73 26.96±4.52 6.36±1.53
+Both 0.37±0.03b 365.25±17.84 16.25±1.36 5.67±0.98
T. pseudonana No addition 0.04±0.03a 641.87±11.67 46.40±0.07 3.15±0.18
+Silicon 0.23±0.02b 618.48±17.99 132.64±8.56 3.04±1.14
+Phosphate 0.40±0.02c 466.12±5.27 46.04±0.40 6.83±0.14
+Both 0.44±0.04c 490.82±7.78 86.96±1.38 6.04±0.17
N . pusilla No addition !0.38±0.05a 550.86±10.84 70.51±6.54 <0.01±1.21
+Silicon !0.33±0.08a 565.35±10.54 150.25±4.52 <0.01±2.35
+Phosphate 0.52±0.04b 463.52±10.25 25.25±8.25 8.45±0.58
+Both 0.62±0.05c 425.63±25.46 10.52±1.03 6.45±0.25
N . closterium No addition 0.23±0.02a 630.09±11.78 92.50±6.12 0.21±0.08
+Silicon 0.34±0.01b 624.34±4.87 148.47±9.42 0.18±0.01
+Phosphate 0.45±0.04c 652.32±23.09 10.57±0.21 6.83±1.45
+Both 0.45±0.05c 608.77±42.67 18.09±4.41 5.75±2.45
Estuaries and Coasts
Author's personal copy
except in Pseudo-nitzschia multiseries , in which it decreasedwhen no nutrients were added (Nothing) (Fig. 5).
Discussion
As anticipated, all four species showed decreases in IPPcontent and upregulation of AP when phosphate starved.The fact that the internal particulate phosphate of Pseudo -nitzschia multiseries increased in the +Si and nothing addedtreatment could be attributable to phosphate release from deadcells becoming available for uptake, but not great enough todownregulate APA. When phosphate was resupplied, intra-cellular phosphate increased and AP decreased. These find-ings are consistent with a large body of literature on P statusand APA; however, the results of this study also indicate thatAPA in diatoms may respond to silicon deficiency. Previously,Kuenzler and Perras (1965) measured the effect of nutrientdeficiency (vitamins, trace metals, nitrogen, silicon, and P) onproduction of AP in Phaeodactylum tricornutum , Cyclotellanana , Skeletonema costatum , and Coccolithus huxleyi (now
Emiliania huxleyi), by measuring bulk APA. The enzymeactivity increased in all nutrient starvation treatments (exceptfor vitamins and silicon in Phaeodactilum and silicon inCoccolithus because they are not required for growth), withactivity of AP highest in P-depleted cells. In the present study,we measured the percentage of cells expressing AP stainingand not the concentration of AP per cell. We cannot confirmwhether the concentration of APA per cell was higher underphosphate or silicon deficiency; however, the percentage ofcells expressing AP was higher with phosphate deficiencythan with silicon deficiency. Even though we did not measurebulk APA, our results are consistent with what Kuenzler andPerras (1965) observed in bulk measurements, indicating thatother stressors in phytoplankton may activate APA.
Even though APAwas upregulated in all four species whenstarved for silicon, responses after nutrients were resupplied—downregulation—were different between the species. For T.pseudonana , downregulation of AP after silicon starvationand then resupply did not occur; instead, the number of cellsexpressing AP correlated with the number of cells undergoingPCD. These results suggest that, for three species, AP could be
Fig. 3 APA and particulatephosphate concentrations of:T. pseudonana, N. pusilla, N.closterium, and Pseudo-nitzschiamultiseries for cultures depleted inphosphate compared to nutrient-enriched cultures and after nutrientresupply. Control versus phosphatedepleted cultures for APA (a) andintercellular phosphate (b). OnceAPAwas detected, cultures thenwere split with nutrient resupply.The APA and intracellularphosphate for the resupply part ofthe experiment are plotted on c andd, respectively. A t test was done todetermine if there was a differencebetween the stock culture and thetwo treatments. If there was adifference between treatments,letters were used. The error barsrepresent standard error. Note thatthere are differences in y-axis labelsto highlight differences betweentreatments
Estuaries and Coasts
Author's personal copy

upregulated by silicon deficiency, whereas, for T .pseudonana , it appeared that AP was upregulated in cellsdying from silicon starvation. Resupply of silicon to silicon-deficientN . pusilla and Pseudo-nitzschia multiseries induceddownregulation of AP activity. In contrast, N . closterium thatappeared to be silicon deficient showed AP downregulationonly when phosphate was added to the cultures, suggestingthat these cells were either experiencing phosphate not silicondeficiency or were co-limited by these two nutrients. Liebig!slaw of the minimum states that the growth of a plant islimited by the resource obtained in the smallest amountrelative to need; however, this is not always the case asplant growth is often co-limited by two or more resources(Harpole et al. 2011). Synergistic interactions between siliconand phosphate might have led to phosphate limitation thatresulted in upregulation of AP when silicon was deficient.
Consequently, AP downregulation was observed when phos-phate was resupplied. N . pusilla and Pseudo -nitzschiamultiseries , on the contrary, did not showed the same kindof interaction between the two nutrients. Phosphate additiondid not decrease the number of cells expressing AP but itrather enhanced it. Based upon these differences, we suggestthat the specific physiological process that triggers AP undersilicon deficiency may not be the same for all the phytoplank-ton species, despite their relative close relation, indicating thatnot all the species behave the same with respect to nutrientlimitation.
Similar to the other diatoms tested, under silicon limitation,T. pseudonana cultures upregulated AP, but unlike the otherdiatoms, T. pseudonana did not recover from prolongedsilicon deficiency and either formed auxospores, which lacksilicon frustules and have been linked to silicon depletion in
Fig. 4 Growth curves of: a T. pseudonana; b N . pusilla; c N . closterium;and d Pseudo-nitzschia multiseries for cultures depleted in silicon com-pared to nutrient enriched cultures. Growth of: e T. pseudonana; f N .pusilla; g N. closterium, and h Pseudo-nitzschia multiseries after addition
of nutrients once alkaline phosphate activity was detected. For b N. pusillaand c N . closterium , the growth rate from the sub-sampling forward isplotted. The error bars represent standard error. Note that there are differ-ences in y-axis labels to highlight differences between treatments
Estuaries and Coasts
Author's personal copy

the diatom S . costatum (Davis 1973, cited by Harrison et al.1976) or PCD. Several studies have demonstrated that stressfactors such as nutrient deficiency and oxidative stress caninitiate the cascade of signaling pathways that result in PCD(Berges and Falkowski 1998; Vardi et al. 1999). Milligan andMorel (2002) demonstrated that biosilica in frustules is usedas a buffer in the reaction between bicarbonate and CO2;accordingly, silicon deficiency can lead to CO2 limitation andreduced photosynthetic efficiency (Lippemeier et al. 1999). Inthe process of photosynthesis, reactive oxygen species (ROS),which have been suggested as signals modulating PCD (Fleuryet al. 2002), are produced mainly as by-products of reactioncenters PSI and PSII. When CO2 availability is restricted, ROSincreases as a result of decreasing efficiency of photosynthesis(Butow et al. 1998). Furthermore, phosphate uptake is mediat-ed mainly by the energy derived from photosynthesis (Kumaret al. 2009); thus, silicon deficiency could also lead to phos-phate deficiency, thereby upregulating AP activity.Additionally, when studying PCD (referred to as “autophagy”),which has been suggested to be a survival process undernutrient starvation conditions, Ki!!ová et al. (2006) found a
correlation between the expression of the proapoptotic proteinBax and APA. If silicon deficiency indirectly produced phos-phate starvation, resulting in upregulation of AP, adding phos-phate to Si-deficient cells would have downregulated APA.Because T. pseudonana cells could not recover from Si-depletion, we were unable to confirm this in this species.
For AP to be activated under Si-depleted conditions, one oftwo conditions must exist: either AP is not specific to justphosphate uptake, or that the formation of silicon cell wallshas an indirect effect on intracellular phosphate metabolismthat induces APA. With well over 50 years of literature on theAP enzyme being responsible for the removal of phosphategroups from many types of molecules in bacteria, inverte-brates, vertebrates, and plants, it appears unlikely that APenzymes have undiscovered functions other than removal ofphosphate groups from organic molecules. All of the enzymesand proteins involved in biomineralization of diatom cellwalls, however, are still largely unknown (Martin-Jézéquelet al. 2000; Sumper and Brunner 2008; Richthammer et al.2011). It is possible, therefore, that AP may be activatedduring silicon cell wall formation under Si-depleted
Table 2 Dissolved nitrate + nitrite, phosphate, and silicate concentrations of the media in the controls and silicon-deficient treatments with the standarderror between the replicates for Pseudo-nitzchia multiseries , T. pseudonana , N . pusilla, and N . closterium
Species Treatment Division rate (day!1) Dissolved nitrate + nitrite (μM) Dissolved silicate (μM) Dissolved phosphate (μM)
P. multiseries Control 0.18±0.05a 424.58±47.11 53.33±11.44 24.63±13.68
Silicon deficient 0.04±0.03b 517.06±8.96 5.78±5.01 18.91±0.21
T. pseudonana Control 0.88±0.04a 426.72±7.86 6.83±0.16 28.30±0.29
Silicon deficient 0.64±0.06b 515.20±9.01 1.04±0.06 40.50±0.46
N . pusilla Control 0.34±0.02a 555.03±7.73 89.91±0.97 2.56±0.51
Silicon deficient 0.36±0.04a 552.04±12.35 5.33±1.31 39.68±0.67
N . closterium Control 0.59±0.02a 740.28±12.42 107.98±12.42 5.82±0.77
Silicon deficient 0.54±0.01a 549.99±71.22 0.24±0.44 2.83±0.64
Split silicon deficient
P. multiseries No addition !0.03±0.02a 650.45±12.85 2.78±1.25 17.89±1.25
+Silicon 0.14±0.04b 624.31±10.25 25.63±3.67 8.56±0.58
+Phosphate 0.01±0.03a 600.13±4.12 1.78±0.68 36.25±3.47
+Both 0.15±0.04 b 650.12±10.25 23.45±2.58 18.96±1.24
T. pseudonana No addition !0.05±0.04a 562.08±11.77 1.31±0.55 28.31±0.74
+Silicon !0.03±0.02a 525.35±12.58 100.52±10.43 38.56±1.52
+Phosphate !0.02±0.03a 536.75±10.52 0.75±1.52 53.45±4.88
+Both !0.05±0.05a 473.91±22.43 123.93±4.18 19.87±0.43
N . pusilla No addition 0.11±0.03a 300.56±13.45 <0.01±0.21 0.08±0.02
+Silicon 0.30±0.05b 310.52±6.97 16.29±0.88 0.05±0.01
+Phosphate 0.13±0.04a 312.58±5.82 <0.01±0.13 0.56±0.25
+Both 0.27±0.05b 330.85±7.43 27.78±0.92 0.10±0.02
N . closterium No addition 0.23±0.02a 380.31±11.72 <0.10±0.31 1.74±0.14
+Silicon 0.40±0.01c 350.17±11.63 9.98±0.80 1.62±0.06
+Phosphate 0.33±0.04a,b 400.17±15.63 <0.10±0.23 13.04±1.14
+Both 0.37±0.02b,c 250.56±14.73 3.41±1.84 2.85±0.24
Estuaries and Coasts
Author's personal copy
conditions. We consider three possible explanations for howAP might contribute to silicon metabolism during cell wallformation: (1) release of stored silicon within the diatom cell,(2) formation of silacidins, and (3) changes in the nucleosidetriphosphates (NTPs) associated with silicification.
Previous studies have shown that certain diatom specieshave large, intracellular silicon storage pools that can be usedwhen external silicon is deficient (Werner 1966; Chisholmet al. 1978; Martin-Jézéquel et al. 2000; Martin-Jézéquel andLopez 2003). It has been suggested that, in the diatom T.pseudonana , silica can be stored inside the cell as pre-polymerised silic acid stabilized by polyamines. Soluble sili-con is only released, however, if polyanions such as phosphateor phosphorylated silaffins are provided (Sumper and Brunner2008). It is possible that AP is involved in providing phos-phate for this process, when external silicon is deficient, tomake intracellular silicon available.
Next, it is known that, when diatoms are deficient insilicon, silaffins are used to produce silacidins, which are richin serine phosphatase and aspartic and glutamic acid (Sumperand Brunner 2008). A silacidin system allows a diatom to
precipitate silicon with extremely high efficiency, and withoutit phosphate ion concentrations at the site of silicificationwould need to be two to three times higher than they are(Sumper and Brunner 2008). Recently, Richthammer et al.(2011) found that, under silicon deficiency, the amount ofhighly phosphorylated silacidins in the cell wall of T.pseudonana increased significantly. This suggests that phos-phorylated silacidin concentrations increase under silicon de-ficiency with an AP enzyme acting to make phosphate avail-able for the phosphorylation of peptides. The formation of thehighly phosphorylated silacidins becomes essential to thesurvival of diatoms under silicon-depleted conditions(Richthammer et al. 2011).
Another mechanism that might account for AP beingupregulated under Si-depleted conditions could involve regu-lation of NTPs. Combs et al. (1966) reported an increase inNTPs in silicon-depleted cells of the diatom Cylindrothecafusiformis , while under silicate-replete conditions NTPs de-creased. Furthermore, later studies observed that, when NTPswere low, external phosphate uptake was observed, but whenNTPs were high, the cells were not able to take up external
Fig. 5 APA and particulatephosphate concentrations for:T. pseudonana, N. pusilla, N.closterium, and Pseudo-nitzschiamultiseries for cultures depleted insilicon compared to nutrient-enriched cultures. Control versussilicon depleted for APA andintercellular phosphate are in a andb. Once APAwas detected,cultures then were split withnutrient resupply. The APA andintercellular phosphate for theresupply part of the experiment areplotted on c and d, respectively. At test was done to determine if therewas a difference between the stockculture and the two treatments. Ifthere was a difference betweentreatments, letters were used. Theerror bars represent standard error.Particulate phosphate in +Silicontreatments of T. pseudonana wasnot measured because the cultureswere dying. Note that there aredifferences in y-axis labels tohighlight differences betweentreatments
Estuaries and Coasts
Author's personal copy

sources of phosphate (Singer et al. 1994). These observationssuggest that internal phosphate pools were mobilized. Theresearch by Coombs et al. (1966, 1967) suggests that NTPsparticipate in the silicon metabolism of cell wall formation.More recently, Gillard et al. (2008) found that, if NTPs are notpresent, the formation of the diatom cell wall cannot becompleted, suggesting that there is a direct link betweenNTPs and silicon biomineralization. Further, Sullivan andVolcani (1973), studying the role of silicon in Cylindrothecafusiformis metabolism, found that the dNTP pools are alwaystightly regulated, as there were no significant differences inconcentrations of NTPs and dNTPs between synchronized,silicon-starved cultures and controls. It is possible, therefore,that AP has a role in NTP regulation, which has been shown tobe influenced by silicon concentrations (Coombs et al. 1967;Gillard et al. 2008).
Although aquatic ecology studies have focused on AP as abiomarker for P deficiency in microalgae, continuing biomed-ical studies have sought to elucidate mechanisms andmetaboliccontrols surroundingAP enzymes involved in bone growth andhomeostasis (Posen 1967; Waymire et al. 1995; Hessle et al.2002) and in cell cycle regulation disruptions in cancerous cells(Wick et al. 1987). Despite this long history of research, acomplete understanding of AP function in mammalian cellsand in bacterial models (Torriani 1960) remains elusive (Harris1989). The perceived relevance of bacterial studies of AP tohuman biology implies that APs are considered to be highlyconserved in evolution. Hence, it is important to be cautiouswhen using AP as proxy for phosphate deficiency inmicroalgae; phosphate metabolism is involved in many cellularprocesses, and controlling factors are still not fully understoodin intensively studied clinical models. The present study indi-cates that this class of enzyme, alkaline phosphatases, may beactivated in microalgae under diverse stressors, including sili-con deficiency, which confers and alternative explanation forthe high levels of APA observed in phosphate-rich systems.The role of APA as an indicator of phosphate limitation inmarine environments, therefore, should be used with caution.
Acknowledgments We thank Jennifer H. Alix and Kimberly Dickinson,for their assistance during the experiment. This worked was supported bythe NOAA Aquaculture Program through the National Research CouncilPostdoctoral Associateship Program.
References
Berges, J.A., and P.G. Falkowski. 1998. Physiological stress and celldeath in marine phytoplankton: induction of proteases in responseto nitrogen or light limitation. Limnol Oceanogr 43: 129–135.
Bidle, K.D., and S.J. Bender. 2008. Iron starvation and culture ageactivate metacaspases and programmed cell death in the marinediatom Thalassiosira pseudonana. Eukaryotic Cell 7: 223–236.
Butow, B., D. Wynne, A. Sukenik, O. Hadas, and E. Tel-Or. 1998. Thesynergistic effect of carbon concentration and high temperature onlipid peroxidation in Peridinium gatunense . J Plankton Res 20:355–369.
Cembella, A.D., N.J. Antia, and P.J. Harrison. 1984. The utilization ofinorganic and organic phosphorus compounds as nutrients by eu-karyotic microalgae: a multidisciplinary perspective: part 1.Crit RevMicrobiol 10: 317–91.
Chisholm, S.W., F. Azam, and R.W. Eppley. 1978. Silicic acid incorpo-ration in marine diatoms on light:dark cycles: use of an assay forphased cell division. Limnol Oceanogr 23: 518–529.
Coleman, J.E. 1992. Structure and mechanism of alkaline phosphatase.Annu Rev Biophys Biomol Struct 21: 441–483.
Coombs, J., P.J. Halicki, O. Holm-Hansen, and B.E. Volcani. 1967.Studies on the biochemistry and fine structure of silica shell forma-tion in diatoms: changes in concentration of nucleoside triphos-phates during synchronized division of Cylindrotheca fusiformisReimann and Lewin. Exp. Cell Res 47: 302–314.
Dyhrman, S.T., andB. Palenik. 2001. Single-cell immunoassay for phosphatestress in the dinoflagellate Prorocentrum minimum (Dinophyceae). JPhycol 37: 400–410.
Dyhrman, S.T., and K.C. Ruttenberg. 2006. Presence and regulation ofalkaline phosphatase activity in eukaryotic phytoplankton from thecoastal ocean: Implications for dissolved organic phosphorusremineralization. Limnol Oceanogr 51: 1381–1390.
Fleury, C., B. Mignotte, and J.L. Vayssiere. 2002. Mitochondrial reactiveoxygen species in cell death signaling. Biochimie 84: 131–141.
González-Gil, S., B. Keafer, R.W.M. Jovine, A. Aguilera, S. Lu, andD.M. Anderson. 1998. Detection and quantification of alkalinephosphatase in single cells of phosphorus-depleted marine phyto-plankton. Mar Ecol Prog Ser 164: 21–35.
Gillard, J., V. Devos, M.J.J. Huysman, L. De Veylder, S. D'Hondt, C.Martens, P. Vanormelingen, K. Vannerum, K. Sabbe, V.A.Chepurnov, D. Inzé, M. Vuylsteke, and W. Vyverman. 2008.Physiological and transcriptomic evidence for a close coupling betweenchloroplast ontogeny and cell cycle progression in the pennate diatomSeminavis robusta. Plant Physiol 148: 1394–1411.
Hansen, H.P., and F. Koroleff. 1999. Determination of nutrient. InMethods of seawater analysis, ed. K. Grasshoff, K. Kremling, andM. Ehrhardt, 159–228. Weinheim: Wiley.
Harpole, W.S., J.T. Ngai, E.E. Cleland, E.W. Seabloom, E.T. Borer,M.E.S. Bracken, J.J. Elser, D.S. Gruner, H. Hillebrand, J.B.Shurin, and J.E. Smith. 2011. Nutrient co-limitation of primaryproducer communities. Ecol Lett 14: 852–862.
Harris, H. 1989. The human alkaline phosphatases: what we know andwhat we don’t know. Clin. Chim. Acta 186: 133–150.
Harrison, P.J., H.L. Conway, and R.C. Dugdale. 1976. Marine diatomsgrown in chemostats under silicate or ammonium limitation. I.Cellular chemical composition and steady-state growth kinetics ofSkeletonema costatum. Mar. Biol 35: 177–186.
Harrison, P.J., M.H. Hu, Y.P. Yang, and X. Lu. 1990. Phosphate limitationin estuarine and coastal waters of China. J. of Exp. Mar. Biol. Ecol140: 79–87.
Huang, Z., W. You, R.P. Haugland, V.B. Paragas, N.A. Olson, and R.P.Haugland. 1993. A novel fluorogenic substrate for detecting alkalinephosphatase activity in situ. J Histochem Cytochem 41: 313–317.
Healey, R.P., and L.L. Hendzel. 1980. Physiological indicators of nutrientdeficiency in lake phytoplankton. Can J Fish Aquat Sci 37: 442–453.
Hessle, L., K.A. Johnson, H.C. Anderson, S. Narisawa, A. Sali, J.W.Goding, R. Terkeltaub, and J.L. Millán. 2002. Tissue-nonspecificalkaline phosphatase and plasma cell membrane glycoprotein-1 arecentral antagonistic regulators of bone mineralization. Proc NatlAcad Sci U S A 99: 9445–9449.
Howarth, R.W. 1988. Nutrient limitation of net primary production inmarine ecosystems. Ann. Rev. Ecol. Syst 19: 89–110.
Estuaries and Coasts
Author's personal copy

Kathurla, S., and A.C. Martiny. 2011. Prevalence of a calcium-basedalkaline phosphatase associated with the marine cyanobacteriumProchlorococcus and other ocean bacteria. Envir. Microbiol 13:74–83.
Ki!!ová, I., L.T. Plamondon, L. Brisson, M. Priault, V. Renouf, J.Schaeffer, N. Camougrand, and S. Manon. 2006. Evaluation of theroles of apoptosis, autophagy and mitophagy in the loss of platingefficiency induced by bax expression in yeast. J Biol Chem 281:36187–36197.
Koopman, G., C.P. Reutelingsperger, G.A. Kuijten, R.M. Keehnen, S.T.Pals, and M.H. van Oers. 1994. AnnexinV for flow cytometricdetection of phosphatidylserine expression on B cells undergoingapoptosis. Blood 84: 1415–1420.
Kuenzler, E.J., and J.P. Perras. 1965. Phosphatase of marine algae. BiolBull 128: 271–284.
Kumar, N.A., V.N.R. Rao, and R. Rengasamy. 2009. Size differentialgrowth and uptake kinetics of inorganic phosphate in some marinediatoms. Journal of Phytology 1: 75–85.
Li, H., M.J.W. Veldhuis, and A.F. Post. 1998. Alkaline phosphataseactivities among planktonic communities in the Northern Red Sea.Mar Ecol Prog Ser 173: 107–115.
Lippemeier, S., P. Hartig, and F. Colijn. 1999. Direct impact of silicate onthe photosynthetic performance of the diatom Thalassiosiraweissflogii assessed by on- and off-line PAM fluorescence measure-ments. J Plankton Res 21: 269–283.
Martin-Jézéquel, V., M. Hildebrand, and M.A. Brzezinski. 2000. Siliconmetabolism in diatoms: implications for growth. J Phycol 36: 821–840.
Martin-Jézéquel, V., and P.J. Lopez. 2003. Silicon—a central metabolitefor diatom growth and morphogenesis. Prog Mol Subcell Biol 33:99–124.
Meseck, S.L., J.H. Alix, G.H. Wikfors, and J.E. Ward. 2009. Differencesin the soluble, residual phosphate concentrations at which coastalphytoplankton species up-regulate alkaline-phosphatase expression,as measured by flow-cytometric detection of positive ELF-97®fluorescence. Estuar. Coast 32: 1195–1204.
Milligan, A.J., and F.M.M.Morel. 2002. A proton buffering role for silicain diatoms. Science 297: 1848–1850.
Nausch, M. 1998. Alkaline phosphatase activities and the relationship toinorganic phosphate in the Pomeranian Bight (southern Baltic Sea).Aquat Microb Ecol 16: 87–94.
Nauch, M., G. Nausch, and N. Wasmund. 2004. Phosphorus dynamicsduring the transition from nitrogen to phosphate limitation in thecentral Baltic Sea. Mar Ecol Prog Ser 266: 15–25.
Nicholson, D., S. Dyhrman, F. Chavez, and A. Paytan. 2006. Alkalinephosphate activity in the phytoplankton communities of MontereyBay and San Francisco Bay. Limnol Oceanogr 51: 874–883.
Palenik, B., and S.T. Dyhrman. 1998. Recent progress in understanding theregulation of marine primary production by phosphorus. InPhosphorus in plant biology: regulating roles in molecular, cellular,organismic and ecosystem processes, ed. J.P. Lynch and J. Diekman,26–38. Rockville: American Society of Plant Physiologists.
Perry, M.J. 1972. Alkaline phosphatase activity in subtropical CentralNorth Pacific waters using a sensitive fluorometric method. MarBiol 15: 113–119.
Petterson, K. 1980. Alkaline phosphatase activity and algal surplusphosphorus as phosphorus-deficiency indicators in Lake Erken.Arch Hydrobiol 89: 54–87.
Ponirakis, G., and J.E. Gough. 2006. The effects of sodium trisilicate onbone resorption and healing. Eur. Cells Mater 11: 27.
Posen, S. 1967. Alkaline phosphatase. Ann. Inter. Med 67: 183–203.Räike, A., O.-P. Pietiläinen, S. Rekolainen, P. Kauppila, H. Pitkänen, J.
Niemi, A. Raateland, and J. Vuorenmaa. 2003. Trends of phosphorus,
nitrogen and chlorophyll a concentrations in Finnish rivers and lakesin 1975–2000. Sci Total Environ 310: 47–59.
Rengefors, K., K. Pettersson, T. Blenckner, and D.M. Anderson. 2001.Species-specific alkaline phosphatase activity in freshwater springphytoplankton: application of a novel method. J Plankton Res 23:435–443.
Rengefors, K., K.C. Ruttenburg, C.L. Haupert, C. Taylor, B.L. Howes,and D.M. Anderson. 2003. Experimental investigation of taxon-specific response of alkaline phosphatase activity in natural fresh-water phytoplankton. Limnol Oceanogr 48: 1167–1175.
Reynolds, C.S. 2006. The ecology of phytoplankton . Cambridge:Cambridge University Press.
Richthammer, P., M. Börmel, M.E. Brunner, and K. van Pée. 2011.Biomineralization in diatoms: the role of silacidins. ChemBioChem12: 1362–1366.
Roy, N.K., R.K. Ghosh, and J. Das. 1982. Monomeric alkaline phospha-tase of Vibrio cholerae . J Bacteriol 150: 1033–1039.
Rueter, J.G., and F.M.M. Morel. 1981. The interaction between zincdeficiency and copper toxicity as it affects the silicic acid uptakemechanisms in Thalassiosira pseudonana. Limnol Oceanogr 26:67–73.
Rueter, J.G. 1983. Alkaline phosphatase limitation by copper: implica-tions for phosphorus nutrition and use as a biochemical marker.Limnol Oceanogr 28: 743–748.
Sahin, K., M. Onderci, N. Sahin, T.A. Balci, M.F. Gursu, V. Jutura, andO.Kucuk. 2006. Dietary arginine silicate inositol complex improvesbone mineralization in quail. Poultry Sci. 85: 486–492.
Schindler, D.W. 1977. Evolution of phosphorus limitation in lakes.Science 195: 260–262.
Sebastián, M., J.A. Aristegui, M.F. Montero, and F.X. Niell. 2004.Kinetics of alkaline phosphatase activity and effects of phosphateenrichment a case study in the NWAfrican upwelling region. MarEcol Prog Ser 270: 1–13.
Singer, V.L., V.B. Paragas, K.D. Larison, K.S. Wells, C.J. Fox, andR.P. Haugland. 1994. Fluorescence-based signal amplificationtechnology. Am Biothechnol Lab 12: 55–58.
Solórzano, L., and J.H. Sharp. 1980. Determination of total dissolvedphosphorus and particulate phosphorus in natural waters. LimnolOceanogr 24: 754–758.
Sullivan, C.W., and B.E. Volcani. 1973. Role of silicon in diatom metab-olism II. Endogenous nucleoside triphosphate pools during silicicacid starvation of synchronized Cylindrotheca fusiformis. Biochem.Biophys. Acta 308: 205–211.
Sumper, M., and E. Brunner. 2008. Silica biomineralisation in diatoms:the model organism Thalassiosira pseudonana. ChemBioChem 9:1187–1194.
Sylvan, J.B., A. Quigg, S. Tozzi, and J.W. Ammerman. 2011. Mappingphytoplankton community physiology on a river impacted conti-nental shelf: testing a multifaceted approach. Estuaries and Coasts34: 1220–1233.
Torriani, A. 1960. Influence of organic phosphate in the formation ofphosphatases byEscherichia coli.Biochim Biophys Acta 38: 460–479.
Vardi, A., I. Berman-Frank, T. Rozenberg, O. Hadas, A. Kaplan, and A.Levine. 1999. Programmed cell death of the dinoflagellatePeridinium gatunense is mediated by CO2 limitation and oxidativestress. Curr Biol 9: 1061–1064.
Waymire, K.G., J.D. Mahuren, J.M. Jaje, T.R. Guilarte, S.P. Coburn, andG.R. MacGregor. 1995. Mice lacking tissue non-specific alkalinephosphatase die from seizures due to defective metabolism of vita-min B-6. Nat Genet 2: 45–51.
Werner, D. 1966. Die Kieselsaure im Stoffwechsel von Cyclotellacryptica Reimann, Lewin und Guil- lard. Arch. Mikrobiol. 55:278–308.
Estuaries and Coasts
Author's personal copy

Wick, M.R., P.E. Swanson, and J.C. Manivel. 1987. Placental-like alka-line phosphatase reactivity in human tumors: an immunohistochem-ical study of 520 cases. Hum Pathol 18: 946–954.
Wynne, D., and G.Y. Rhee. 1988. Changes in alkaline phosphataseactivity and phosphate uptake in P-limited phytoplankton, inducedby light intensity and spectral quality. Hydrobiol 160: 173–178.
Yamaguchi, H., M. Yamaguchi, and M. Adachi. 2006. Specific-detectionof alkaline phosphatase activity in individual species of marinephytoplankton. Plankton Benthos Res 4: 214–217.
Zohar, T., and R.D. Robarts. 1998. Experimental study of microbial Plimitation in the eastern Mediterranean. Limnol Oceanogr 43: 387–395.
Estuaries and Coasts
Author's personal copy