Short-term variations in the occurrence of heavy metals in Antarctic snow from Coats Land since the...
14
The Science of the Total Environment 300 (2002) 129–142 0048-9697/02/$ - see front matter 2002 Elsevier Science B.V. All rights reserved. PII: S0048-9697 Ž 02 . 00277-2 Short-term variations in the occurrence of heavy metals in Antarctic snow from Coats Land since the 1920s Frederic A.M. Planchon , Claude F. Boutron , Carlo Barbante *, Giulio Cozzi , a a,b c,d, c ´´ Vania Gaspari , Eric W. Wolff , Christophe P. Ferrari , Paolo Cescon c e a,f c,d Laboratoire de Glaciologie et Geophysique de l’Environnement du C.N.R.S., 54, rue Moliere, Boıte Postale 96, a ´ ` ˆ 38402 Saint Martin d’Heres, France Observatoire des Sciences de l’Univers et Unite de Formation et de Recherche de Physique, b ´ Universite Joseph Fourier de Grenoble (Institut Universitaire de France), Boıte Postale 68, 38041 Grenoble, France ´ ˆ Department of Environmental Sciences, University of Venice, Ca’Foscari, 30123 Venice, Italy c Institute for the Dynamics of Environmental Processes – CNR, University of Venice, Ca’Foscari, 30123 Venice, Italy d British Antarctic Survey, High Cross, Madingley Road, Cambridge CB3 0ET, UK e Institut des Sciences et Techniques de Grenoble, Universite Joseph Fourier de Grenoble, 28, avenue Benoıt Frachon, f ´ ˆ Boıte postale 53, 38041 Grenoble, France ˆ Received 11 December 2001; accepted 26 June 2002 Abstract Short-term variations in heavy metals concentrations in Antarctic snow have been investigated by analysing 13 metals (Al, V, Cr, Mn, Co, Cu, Zn, Ag, Cd, Ba, Pb, Bi and U) in a series of ultraclean samples collected from two snow pits in Coats Land in the Atlantic sector of Antarctica. The samples covered a ;70 years time period from the 1920s to 1990. They were analysed by inductively coupled plasma sector field mass spectrometry and graphite furnace atomic absorption spectrometry. The results conclusively show that there is a pronounced short-term (intra- and inter-annual) variability of heavy metal in Antarctic snow, with the highest concentrations being up to 100 times higher than the lowest ones for metal such as Cr, Mn, Pb and U. Contributions from the different possible natural and anthropogenic sources are found to be extremely variable. This is especially due to the large variability in the transport patterns of heavy metals from Southern America, Southern Africa and Australia to the Antarctic continent. Inputs from several volcanic events were identified in our samples from non-seasalt sulfate concentrations profiles. The only ones that gave clear signals for heavy metals were eruptions at Deception Island the proximity of which allowed for tropospheric transport to Coats Land. 2002 Elsevier Science B.V. All rights reserved. Keywords: Heavy metals; Snow; Antarctica; Short-term variations; Natural and anthropogenic sources; Volcanism *Corresponding author. Tel: q39-41-2348942; fax: 39-41-2348549. E-mail address: [email protected] (C. Barbante).
Transcript of Short-term variations in the occurrence of heavy metals in Antarctic snow from Coats Land since the...

The Science of the Total Environment 300(2002) 129–142
0048-9697/02/$ - see front matter� 2002 Elsevier Science B.V. All rights reserved.PII: S0048-9697Ž02.00277-2
Short-term variations in the occurrence of heavy metals inAntarctic snow from Coats Land since the 1920s
Frederic A.M. Planchon , Claude F. Boutron , Carlo Barbante *, Giulio Cozzi ,a a,b c,d, c´ ´Vania Gaspari , Eric W. Wolff , Christophe P. Ferrari , Paolo Cesconc e a,f c,d
Laboratoire de Glaciologie et Geophysique de l’Environnement du C.N.R.S., 54, rue Moliere, Boıte Postale 96,a ´ ` ˆ38402 Saint Martin d’Heres, France
Observatoire des Sciences de l’Univers et Unite de Formation et de Recherche de Physique,b ´Universite Joseph Fourier de Grenoble (Institut Universitaire de France), Boıte Postale 68, 38041 Grenoble, France´ ˆ
Department of Environmental Sciences, University of Venice, Ca’Foscari, 30123 Venice, Italyc
Institute for the Dynamics of Environmental Processes – CNR, University of Venice, Ca’Foscari, 30123 Venice, Italyd
British Antarctic Survey, High Cross, Madingley Road, Cambridge CB3 0ET, UKe
Institut des Sciences et Techniques de Grenoble, Universite Joseph Fourier de Grenoble, 28, avenue Benoıt Frachon,f ´ ˆBoıte postale 53, 38041 Grenoble, Franceˆ
Received 11 December 2001; accepted 26 June 2002
Abstract
Short-term variations in heavy metals concentrations in Antarctic snow have been investigated by analysing 13metals(Al, V, Cr, Mn, Co, Cu, Zn, Ag, Cd, Ba, Pb, Bi and U) in a series of ultraclean samples collected from twosnow pits in Coats Land in the Atlantic sector of Antarctica. The samples covered a;70 years time period from the1920s to 1990. They were analysed by inductively coupled plasma sector field mass spectrometry and graphitefurnace atomic absorption spectrometry. The results conclusively show that there is a pronounced short-term(intra-and inter-annual) variability of heavy metal in Antarctic snow, with the highest concentrations being up to 100 timeshigher than the lowest ones for metal such as Cr, Mn, Pb and U. Contributions from the different possible naturaland anthropogenic sources are found to be extremely variable. This is especially due to the large variability in thetransport patterns of heavy metals from Southern America, Southern Africa and Australia to the Antarctic continent.Inputs from several volcanic events were identified in our samples from non-seasalt sulfate concentrations profiles.The only ones that gave clear signals for heavy metals were eruptions at Deception Island the proximity of whichallowed for tropospheric transport to Coats Land.� 2002 Elsevier Science B.V. All rights reserved.
Keywords: Heavy metals; Snow; Antarctica; Short-term variations; Natural and anthropogenic sources; Volcanism
*Corresponding author. Tel:q39-41-2348942; fax: 39-41-2348549.E-mail address: [email protected](C. Barbante).
130 F.A. Planchon et al. / The Science of the Total Environment 300 (2002) 129–142
1. Introduction
Considerable efforts have been made over thelast decades to determine long term time trends inheavy metal concentrations in Antarctic snow andice. The two main objectives of these studies wereas follows. The first was to investigate past naturalchanges during the last climatic cycle, to betterassess the relative importance of the differentnatural sources and their variations between glacialand interglacial periods(Boutron and Patterson,1986; Boutron et al., 1987, 1990, 1993; Vandal etal., 1993). The second was to document thepossible rise in anthropogenic inputs of heavymetals to the Antarctic ice-sheet since the Indus-trial Revolution to determine to what extent themost remote areas of our planet are now contam-inated by heavy metals(Murozumi et al., 1969;Boutron and Patterson, 1983; Gorlach and Bou-¨tron, 1992; Wolff and Suttie, 1994; Barbante etal., 1997, 1998; Wolff et al., 1999; Planchon etal., 2002; Planchon et al., in press).
In addition, there are almost no data on short-term (inter- and intra-annual) variations of heavymetals in Antarctic snow and ice, although suchstudies could provide a wealth of very valuableinformation. In particular, they have the potentialto reveal the changing patterns of heavy metalsinputs from mid latitude natural andyor anthropo-genic sources to the remote Antarctic continent.Also, they can for instance be most useful foridentifying fallouts from volcanic events bothwithin Antarctica and outside. Finally, they couldallow better assessment of the influence of thesurrounding Southern Ocean both for seasalt sprayand marine biogenic activity as a function of thechanging extension of sea-ice coverage.
The only previous publications we could findare the works by Suttie and Wolff(1992), Honget al. (2000). Suttie and Wolff(1992) analysed asequence of snow blocks for Cu, Zn, Cd and Pbcovering 2 years’ accumulation(1984y85) col-lected from a 1.7-m snow pit dug at DollemanIsland (708359S, 608569W), a low altitude site onthe east coast of the Antarctic Peninsula. The 4metals showed important variations throughout theyear. Pb had peaks in the autumnywinter period
when both the crustal and marine aerosols are alsoat their maxima. However, no clear seasonal cyclewas observed for the other metals. Hong et al.(2000) analysed the Al, Mn and Pb concentrationsin a series of snow samples collected from a 1.5-m snow pit dug at Livingston Island(628379S,608159W), a low altitude site at the northern tip ofthe Antarctic Peninsula. Their samples coveredless than 1 year’s snow accumulation. Pronouncedvariations in concentrations were observed in theprofile, with a spring maxima being observed.
Both studies deal with low altitude high accu-mulation coastal sites along the Antarctic Penin-sula. We could not find any reliable study ofshort-term variations of heavy metals in Antarcticsnow or ice at inland locations either in Westernor Eastern Antarctica.
We present here comprehensive data on short-term variations of 13 metals(Al, V, Cr, Mn, Cu,Zn, Co, Ag, Cd, Ba, Pb, Bi and U) in Antarcticsnow dated from the 1920s to the 1990s. Theywere obtained by analysing a series of large sizesnow blocks collected from clean snow pits handdug at two remote sites in Coats Land, Antarctica.Laboratory subsampling of the snow blocksallowed centimetre scale depth resolution. Mostanalyses were performed with the ultra sensitiveinductively coupled plasma sector field mass spec-trometry(ICP-SFMS) technique. The results allowa better insight into the changing patterns of heavymetal deposition in Antarctica.
2. Experimental
2.1. Samples
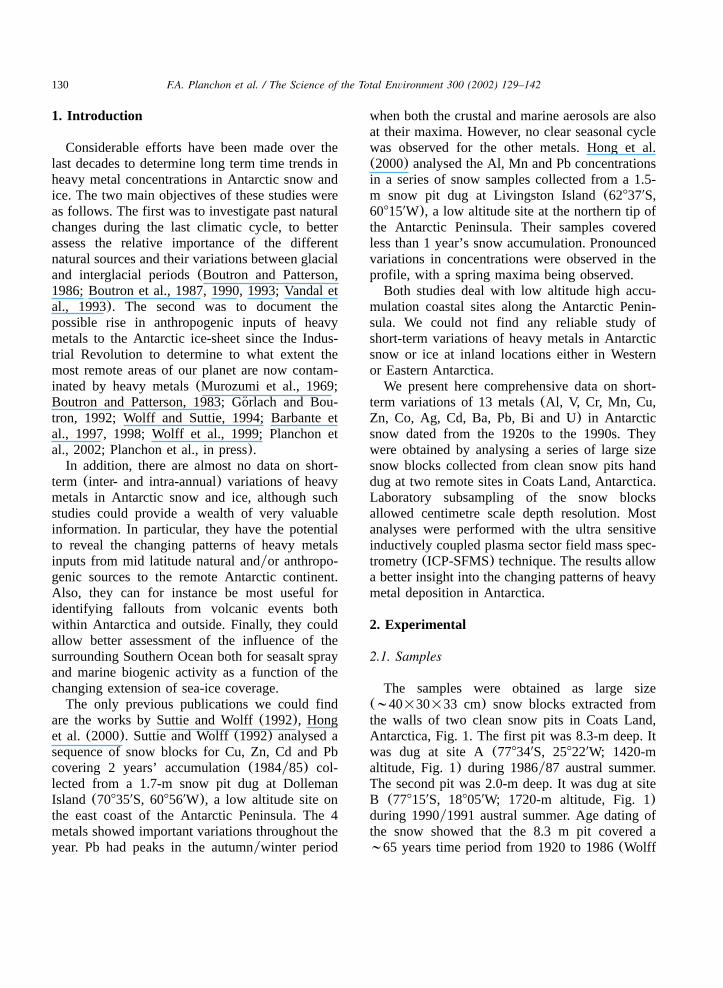
The samples were obtained as large size(;40=30=33 cm) snow blocks extracted fromthe walls of two clean snow pits in Coats Land,Antarctica, Fig. 1. The first pit was 8.3-m deep. Itwas dug at site A(778349S, 258229W; 1420-maltitude, Fig. 1) during 1986y87 austral summer.The second pit was 2.0-m deep. It was dug at siteB (778159S, 188059W; 1720-m altitude, Fig. 1)during 1990y1991 austral summer. Age dating ofthe snow showed that the 8.3 m pit covered a;65 years time period from 1920 to 1986(Wolff
131F.A. Planchon et al. / The Science of the Total Environment 300 (2002) 129–142
Fig. 1. Map showing the two sampling sites in Coats Land,Antarctica.
et al., 1999), while the 2.0 m pit covered a;15years time period from 1975 to 1990. Extremeprecautions described in detail elsewhere(Plan-
chon et al., 2001) were taken to minimise contam-ination of the snow blocks during field sampling.The snow blocks were packed inside double acidcleaned low density polyethylene(LDPE) bags,brought back frozen to the laboratory and keptfrozen until analysis.
2.2. Laboratory subsampling of the snow blocks
Each snow block was subsampled inside alaminar flow clean bench in a cold laboratory,using ultraclean procedures described in detail byPlanchon et al.(2001). Approximately 5 cm ofsnow was first trimmed from each face to removethe outside part of the block, which might havebeen slightly contaminated during field samplingdespite the extreme precautions taken to minimisefield contamination problems. Various subsampleswere then taken from the remaining part of theblock with centimetre scale depth resolution asrequired(Planchon et al., 2001). In most cases, asingle subsample was taken for a given depthinterval. In one particular snow block, however,we took pairs of parallel subsamples for the dif-ferent depth intervals. The analysis of these parallelsubsamples showed a good agreement(Planchonet al., 2001).
Each subsample was transferred into a 1-l widemouth acid cleaned(Boutron, 1990) LDPE bottle,and melted at room temperature inside the newclean laboratory of the Laboratoire de Glaciologieet Geophysique de l’Environnement(LGGE) (Fer-´rari et al., 2000; Planchon et al., 2001). Acidifiedaliquots (1% ultrapure HNO produced by sub-3
boiling distillation at Curtin University of Tech-nology (Vallelonga et al., 2002)) were thentransferred into acid cleaned 15 ml LDPE bottlesfor the determination of 13 metals by ICP-SFMSand graphite furnace atomic absorption spectrom-etry (GF-AAS). All aliquots were kept frozen untilanalysis.
Parallel subsamples were also taken with centi-metre scale depth resolution for the determinationof various anions and cations by Ion Chromatog-raphy (Legrand et al., 1993). In particular, wemeasured Na , SO and methanesulfonateq 2y
4
(MSA:CH SO ). The corresponding data werey3 3
132 F.A. Planchon et al. / The Science of the Total Environment 300 (2002) 129–142
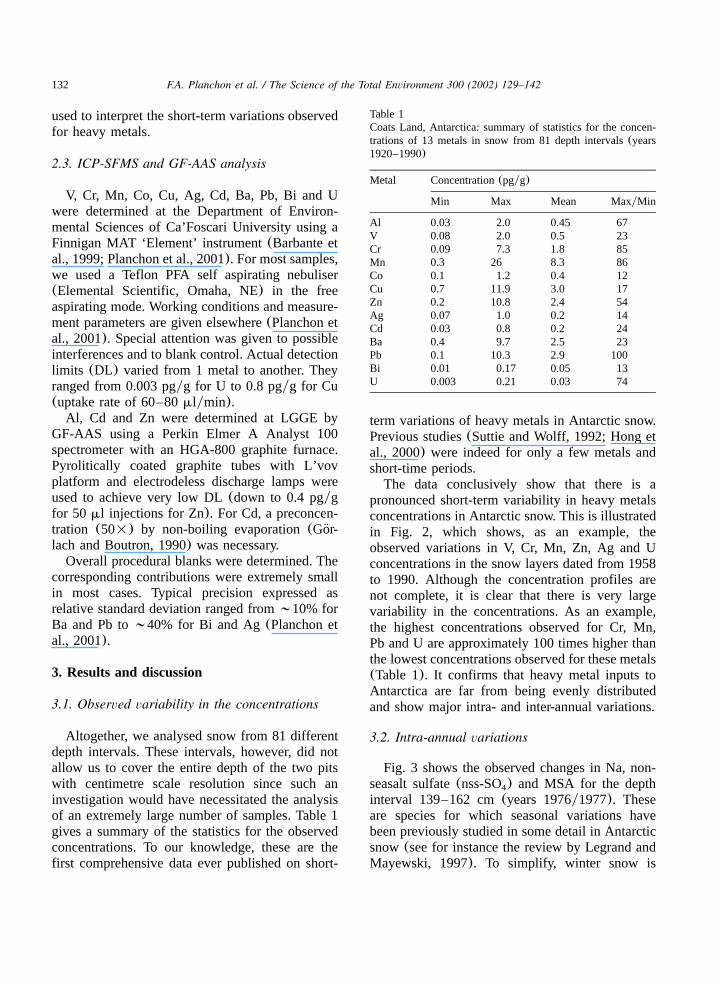
Table 1Coats Land, Antarctica: summary of statistics for the concen-trations of 13 metals in snow from 81 depth intervals(years1920–1990)
Metal Concentration(pgyg)
Min Max Mean MaxyMin
Al 0.03 2.0 0.45 67V 0.08 2.0 0.5 23Cr 0.09 7.3 1.8 85Mn 0.3 26 8.3 86Co 0.1 1.2 0.4 12Cu 0.7 11.9 3.0 17Zn 0.2 10.8 2.4 54Ag 0.07 1.0 0.2 14Cd 0.03 0.8 0.2 24Ba 0.4 9.7 2.5 23Pb 0.1 10.3 2.9 100Bi 0.01 0.17 0.05 13U 0.003 0.21 0.03 74
used to interpret the short-term variations observedfor heavy metals.
2.3. ICP-SFMS and GF-AAS analysis
V, Cr, Mn, Co, Cu, Ag, Cd, Ba, Pb, Bi and Uwere determined at the Department of Environ-mental Sciences of Ca’Foscari University using aFinnigan MAT ‘Element’ instrument(Barbante etal., 1999; Planchon et al., 2001). For most samples,we used a Teflon PFA self aspirating nebuliser(Elemental Scientific, Omaha, NE) in the freeaspirating mode. Working conditions and measure-ment parameters are given elsewhere(Planchon etal., 2001). Special attention was given to possibleinterferences and to blank control. Actual detectionlimits (DL) varied from 1 metal to another. Theyranged from 0.003 pgyg for U to 0.8 pgyg for Cu(uptake rate of 60–80mlymin).
Al, Cd and Zn were determined at LGGE byGF-AAS using a Perkin Elmer A Analyst 100spectrometer with an HGA-800 graphite furnace.Pyrolitically coated graphite tubes with L’vovplatform and electrodeless discharge lamps wereused to achieve very low DL(down to 0.4 pgygfor 50 ml injections for Zn). For Cd, a preconcen-tration (50=) by non-boiling evaporation(Gor-¨lach and Boutron, 1990) was necessary.
Overall procedural blanks were determined. Thecorresponding contributions were extremely smallin most cases. Typical precision expressed asrelative standard deviation ranged from;10% forBa and Pb to;40% for Bi and Ag(Planchon etal., 2001).
3. Results and discussion
3.1. Observed variability in the concentrations
Altogether, we analysed snow from 81 differentdepth intervals. These intervals, however, did notallow us to cover the entire depth of the two pitswith centimetre scale resolution since such aninvestigation would have necessitated the analysisof an extremely large number of samples. Table 1gives a summary of the statistics for the observedconcentrations. To our knowledge, these are thefirst comprehensive data ever published on short-
term variations of heavy metals in Antarctic snow.Previous studies(Suttie and Wolff, 1992; Hong etal., 2000) were indeed for only a few metals andshort-time periods.
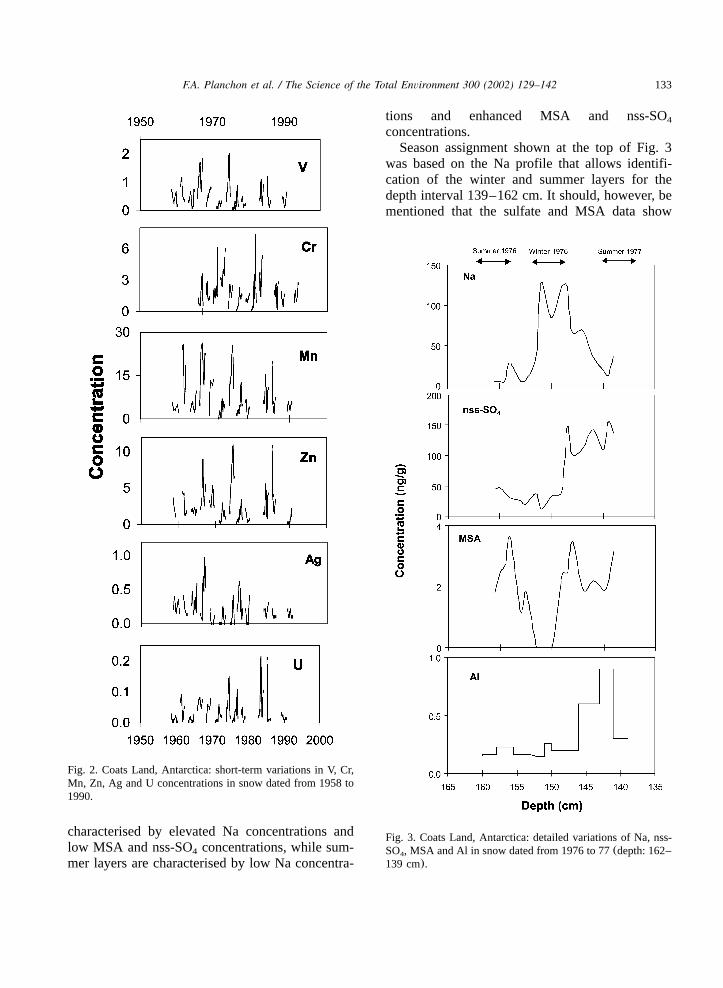
The data conclusively show that there is apronounced short-term variability in heavy metalsconcentrations in Antarctic snow. This is illustratedin Fig. 2, which shows, as an example, theobserved variations in V, Cr, Mn, Zn, Ag and Uconcentrations in the snow layers dated from 1958to 1990. Although the concentration profiles arenot complete, it is clear that there is very largevariability in the concentrations. As an example,the highest concentrations observed for Cr, Mn,Pb and U are approximately 100 times higher thanthe lowest concentrations observed for these metals(Table 1). It confirms that heavy metal inputs toAntarctica are far from being evenly distributedand show major intra- and inter-annual variations.
3.2. Intra-annual variations
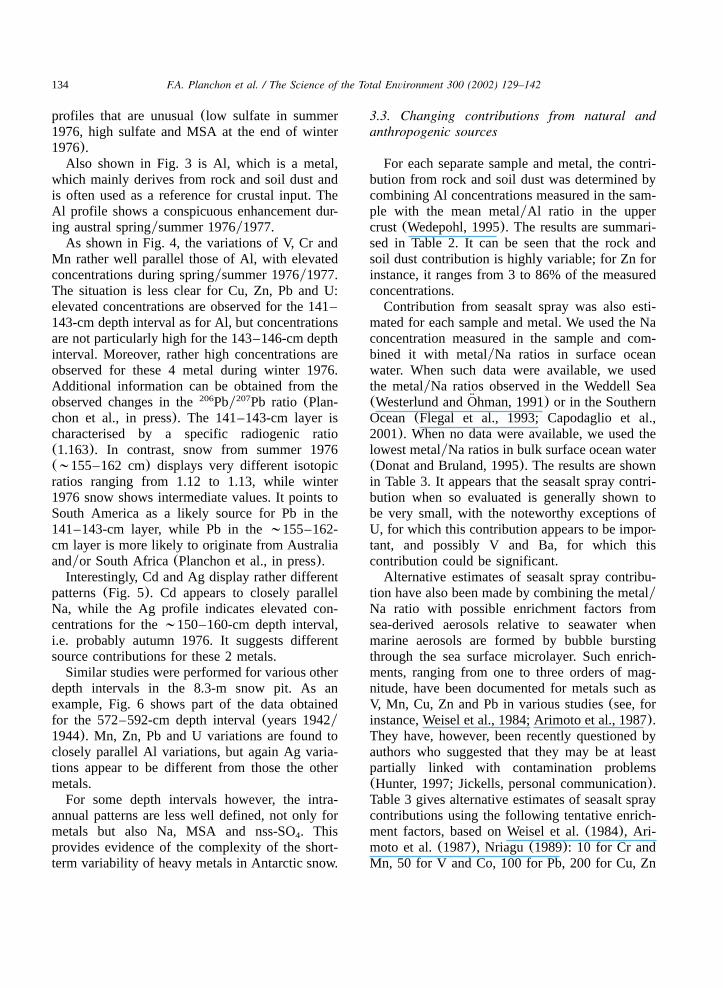
Fig. 3 shows the observed changes in Na, non-seasalt sulfate(nss-SO) and MSA for the depth4
interval 139–162 cm(years 1976y1977). Theseare species for which seasonal variations havebeen previously studied in some detail in Antarcticsnow(see for instance the review by Legrand andMayewski, 1997). To simplify, winter snow is
133F.A. Planchon et al. / The Science of the Total Environment 300 (2002) 129–142
Fig. 2. Coats Land, Antarctica: short-term variations in V, Cr,Mn, Zn, Ag and U concentrations in snow dated from 1958 to1990.
Fig. 3. Coats Land, Antarctica: detailed variations of Na, nss-SO , MSA and Al in snow dated from 1976 to 77(depth: 162–4
139 cm).
characterised by elevated Na concentrations andlow MSA and nss-SO concentrations, while sum-4
mer layers are characterised by low Na concentra-
tions and enhanced MSA and nss-SO4
concentrations.Season assignment shown at the top of Fig. 3
was based on the Na profile that allows identifi-cation of the winter and summer layers for thedepth interval 139–162 cm. It should, however, bementioned that the sulfate and MSA data show
134 F.A. Planchon et al. / The Science of the Total Environment 300 (2002) 129–142
profiles that are unusual(low sulfate in summer1976, high sulfate and MSA at the end of winter1976).
Also shown in Fig. 3 is Al, which is a metal,which mainly derives from rock and soil dust andis often used as a reference for crustal input. TheAl profile shows a conspicuous enhancement dur-ing austral springysummer 1976y1977.
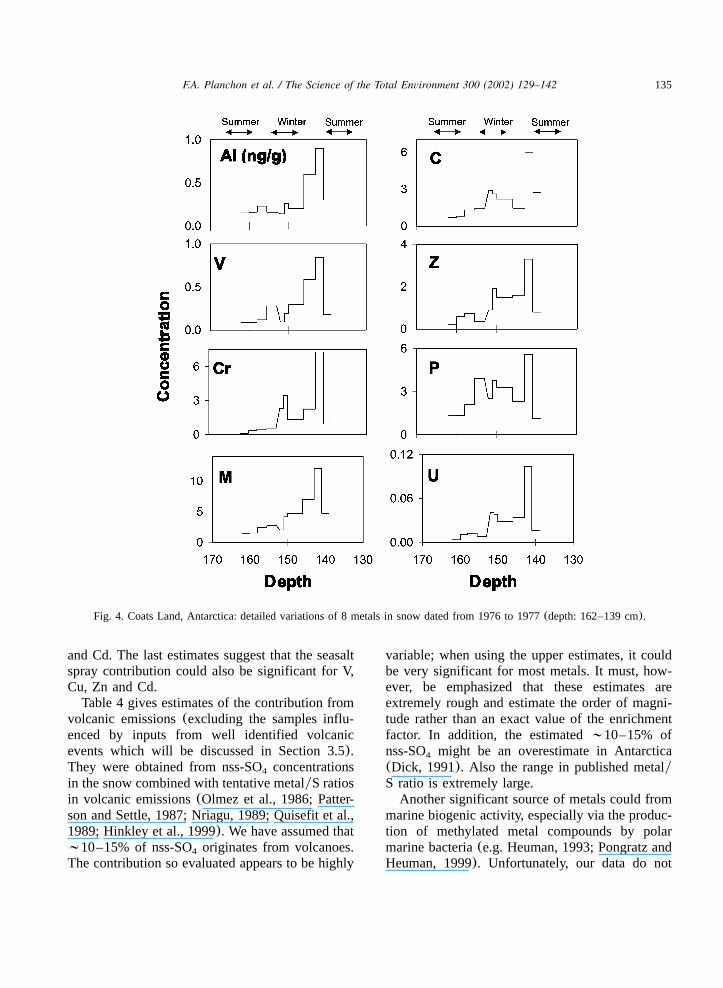
As shown in Fig. 4, the variations of V, Cr andMn rather well parallel those of Al, with elevatedconcentrations during springysummer 1976y1977.The situation is less clear for Cu, Zn, Pb and U:elevated concentrations are observed for the 141–143-cm depth interval as for Al, but concentrationsare not particularly high for the 143–146-cm depthinterval. Moreover, rather high concentrations areobserved for these 4 metal during winter 1976.Additional information can be obtained from theobserved changes in the Pby Pb ratio (Plan-206 207
chon et al., in press). The 141–143-cm layer ischaracterised by a specific radiogenic ratio(1.163). In contrast, snow from summer 1976(;155–162 cm) displays very different isotopicratios ranging from 1.12 to 1.13, while winter1976 snow shows intermediate values. It points toSouth America as a likely source for Pb in the141–143-cm layer, while Pb in the;155–162-cm layer is more likely to originate from Australiaandyor South Africa(Planchon et al., in press).
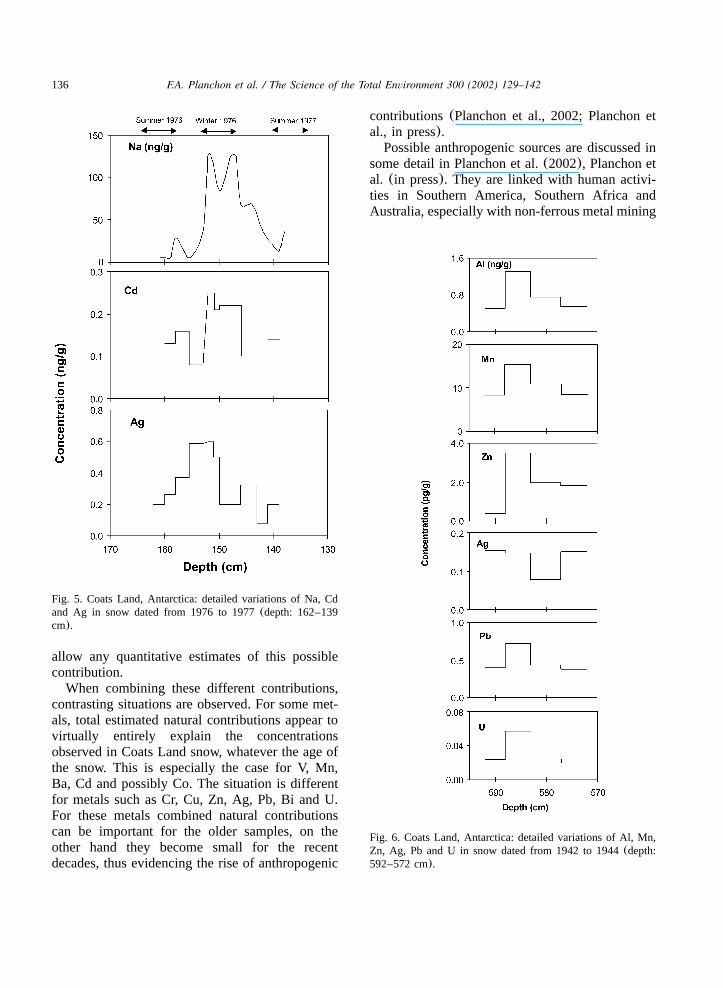
Interestingly, Cd and Ag display rather differentpatterns(Fig. 5). Cd appears to closely parallelNa, while the Ag profile indicates elevated con-centrations for the;150–160-cm depth interval,i.e. probably autumn 1976. It suggests differentsource contributions for these 2 metals.
Similar studies were performed for various otherdepth intervals in the 8.3-m snow pit. As anexample, Fig. 6 shows part of the data obtainedfor the 572–592-cm depth interval(years 1942y1944). Mn, Zn, Pb and U variations are found toclosely parallel Al variations, but again Ag varia-tions appear to be different from those the othermetals.
For some depth intervals however, the intra-annual patterns are less well defined, not only formetals but also Na, MSA and nss-SO . This4
provides evidence of the complexity of the short-term variability of heavy metals in Antarctic snow.
3.3. Changing contributions from natural andanthropogenic sources
For each separate sample and metal, the contri-bution from rock and soil dust was determined bycombining Al concentrations measured in the sam-ple with the mean metalyAl ratio in the uppercrust(Wedepohl, 1995). The results are summari-sed in Table 2. It can be seen that the rock andsoil dust contribution is highly variable; for Zn forinstance, it ranges from 3 to 86% of the measuredconcentrations.
Contribution from seasalt spray was also esti-mated for each sample and metal. We used the Naconcentration measured in the sample and com-bined it with metalyNa ratios in surface oceanwater. When such data were available, we usedthe metalyNa ratios observed in the Weddell Sea(Westerlund and Ohman, 1991) or in the Southern¨
Ocean (Flegal et al., 1993; Capodaglio et al.,2001). When no data were available, we used thelowest metalyNa ratios in bulk surface ocean water(Donat and Bruland, 1995). The results are shownin Table 3. It appears that the seasalt spray contri-bution when so evaluated is generally shown tobe very small, with the noteworthy exceptions ofU, for which this contribution appears to be impor-tant, and possibly V and Ba, for which thiscontribution could be significant.
Alternative estimates of seasalt spray contribu-tion have also been made by combining the metalyNa ratio with possible enrichment factors fromsea-derived aerosols relative to seawater whenmarine aerosols are formed by bubble burstingthrough the sea surface microlayer. Such enrich-ments, ranging from one to three orders of mag-nitude, have been documented for metals such asV, Mn, Cu, Zn and Pb in various studies(see, forinstance, Weisel et al., 1984; Arimoto et al., 1987).They have, however, been recently questioned byauthors who suggested that they may be at leastpartially linked with contamination problems(Hunter, 1997; Jickells, personal communication).Table 3 gives alternative estimates of seasalt spraycontributions using the following tentative enrich-ment factors, based on Weisel et al.(1984), Ari-moto et al.(1987), Nriagu (1989): 10 for Cr andMn, 50 for V and Co, 100 for Pb, 200 for Cu, Zn
135F.A. Planchon et al. / The Science of the Total Environment 300 (2002) 129–142
Fig. 4. Coats Land, Antarctica: detailed variations of 8 metals in snow dated from 1976 to 1977(depth: 162–139 cm).
and Cd. The last estimates suggest that the seasaltspray contribution could also be significant for V,Cu, Zn and Cd.
Table 4 gives estimates of the contribution fromvolcanic emissions(excluding the samples influ-enced by inputs from well identified volcanicevents which will be discussed in Section 3.5).They were obtained from nss-SO concentrations4
in the snow combined with tentative metalyS ratiosin volcanic emissions(Olmez et al., 1986; Patter-son and Settle, 1987; Nriagu, 1989; Quisefit et al.,1989; Hinkley et al., 1999). We have assumed that;10–15% of nss-SO originates from volcanoes.4
The contribution so evaluated appears to be highly
variable; when using the upper estimates, it couldbe very significant for most metals. It must, how-ever, be emphasized that these estimates areextremely rough and estimate the order of magni-tude rather than an exact value of the enrichmentfactor. In addition, the estimated;10–15% ofnss-SO might be an overestimate in Antarctica4
(Dick, 1991). Also the range in published metalyS ratio is extremely large.
Another significant source of metals could frommarine biogenic activity, especially via the produc-tion of methylated metal compounds by polarmarine bacteria(e.g. Heuman, 1993; Pongratz andHeuman, 1999). Unfortunately, our data do not
136 F.A. Planchon et al. / The Science of the Total Environment 300 (2002) 129–142
Fig. 5. Coats Land, Antarctica: detailed variations of Na, Cdand Ag in snow dated from 1976 to 1977(depth: 162–139cm).
Fig. 6. Coats Land, Antarctica: detailed variations of Al, Mn,Zn, Ag, Pb and U in snow dated from 1942 to 1944(depth:592–572 cm).
allow any quantitative estimates of this possiblecontribution.
When combining these different contributions,contrasting situations are observed. For some met-als, total estimated natural contributions appear tovirtually entirely explain the concentrationsobserved in Coats Land snow, whatever the age ofthe snow. This is especially the case for V, Mn,Ba, Cd and possibly Co. The situation is differentfor metals such as Cr, Cu, Zn, Ag, Pb, Bi and U.For these metals combined natural contributionscan be important for the older samples, on theother hand they become small for the recentdecades, thus evidencing the rise of anthropogenic
contributions(Planchon et al., 2002; Planchon etal., in press).
Possible anthropogenic sources are discussed insome detail in Planchon et al.(2002), Planchon etal. (in press). They are linked with human activi-ties in Southern America, Southern Africa andAustralia, especially with non-ferrous metal mining
137F.A. Planchon et al. / The Science of the Total Environment 300 (2002) 129–142
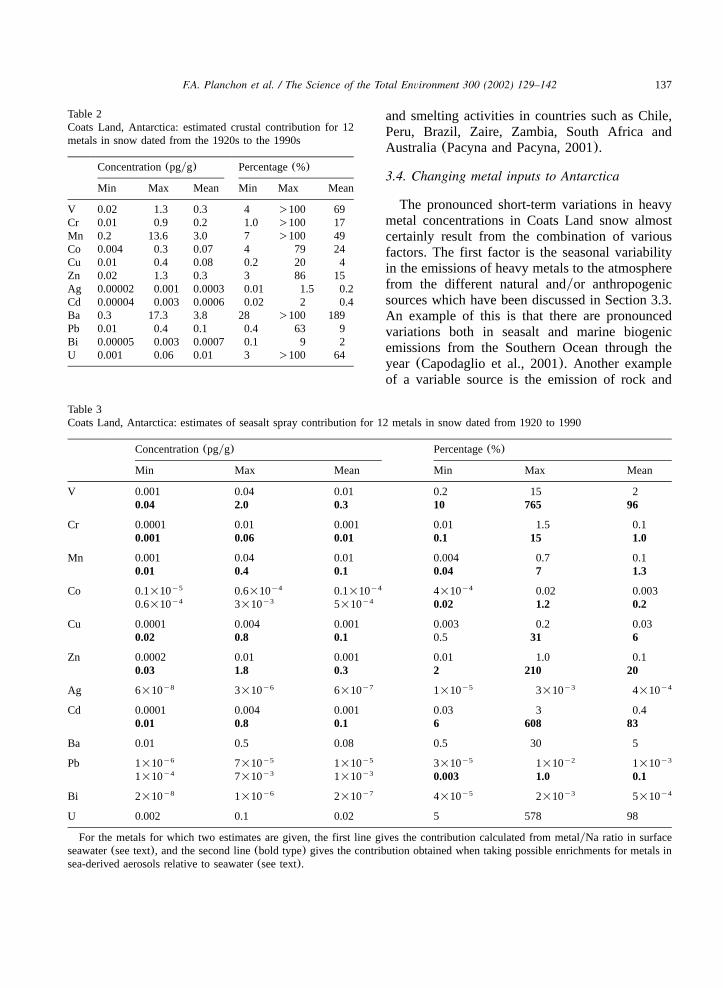
Table 2Coats Land, Antarctica: estimated crustal contribution for 12metals in snow dated from the 1920s to the 1990s
Concentration(pgyg) Percentage(%)
Min Max Mean Min Max Mean
V 0.02 1.3 0.3 4 )100 69Cr 0.01 0.9 0.2 1.0 )100 17Mn 0.2 13.6 3.0 7 )100 49Co 0.004 0.3 0.07 4 79 24Cu 0.01 0.4 0.08 0.2 20 4Zn 0.02 1.3 0.3 3 86 15Ag 0.00002 0.001 0.0003 0.01 1.5 0.2Cd 0.00004 0.003 0.0006 0.02 2 0.4Ba 0.3 17.3 3.8 28 )100 189Pb 0.01 0.4 0.1 0.4 63 9Bi 0.00005 0.003 0.0007 0.1 9 2U 0.001 0.06 0.01 3 )100 64
Table 3Coats Land, Antarctica: estimates of seasalt spray contribution for 12 metals in snow dated from 1920 to 1990
Concentration(pgyg) Percentage(%)
Min Max Mean Min Max Mean
V 0.001 0.04 0.01 0.2 15 20.04 2.0 0.3 10 765 96
Cr 0.0001 0.01 0.001 0.01 1.5 0.10.001 0.06 0.01 0.1 15 1.0
Mn 0.001 0.04 0.01 0.004 0.7 0.10.01 0.4 0.1 0.04 7 1.3
Co 0.1=10y5 0.6=10y4 0.1=10y4 4=10y4 0.02 0.0030.6=10y4 3=10y3 5=10y4 0.02 1.2 0.2
Cu 0.0001 0.004 0.001 0.003 0.2 0.030.02 0.8 0.1 0.5 31 6
Zn 0.0002 0.01 0.001 0.01 1.0 0.10.03 1.8 0.3 2 210 20
Ag 6=10y8 3=10y6 6=10y7 1=10y5 3=10y3 4=10y4
Cd 0.0001 0.004 0.001 0.03 3 0.40.01 0.8 0.1 6 608 83
Ba 0.01 0.5 0.08 0.5 30 5
Pb 1=10y6 7=10y5 1=10y5 3=10y5 1=10y2 1=10y3
1=10y4 7=10y3 1=10y3 0.003 1.0 0.1
Bi 2=10y8 1=10y6 2=10y7 4=10y5 2=10y3 5=10y4
U 0.002 0.1 0.02 5 578 98
For the metals for which two estimates are given, the first line gives the contribution calculated from metalyNa ratio in surfaceseawater(see text), and the second line(bold type) gives the contribution obtained when taking possible enrichments for metals insea-derived aerosols relative to seawater(see text).
and smelting activities in countries such as Chile,Peru, Brazil, Zaire, Zambia, South Africa andAustralia(Pacyna and Pacyna, 2001).
3.4. Changing metal inputs to Antarctica
The pronounced short-term variations in heavymetal concentrations in Coats Land snow almostcertainly result from the combination of variousfactors. The first factor is the seasonal variabilityin the emissions of heavy metals to the atmospherefrom the different natural andyor anthropogenicsources which have been discussed in Section 3.3.An example of this is that there are pronouncedvariations both in seasalt and marine biogenicemissions from the Southern Ocean through theyear (Capodaglio et al., 2001). Another exampleof a variable source is the emission of rock and
138 F.A. Planchon et al. / The Science of the Total Environment 300 (2002) 129–142
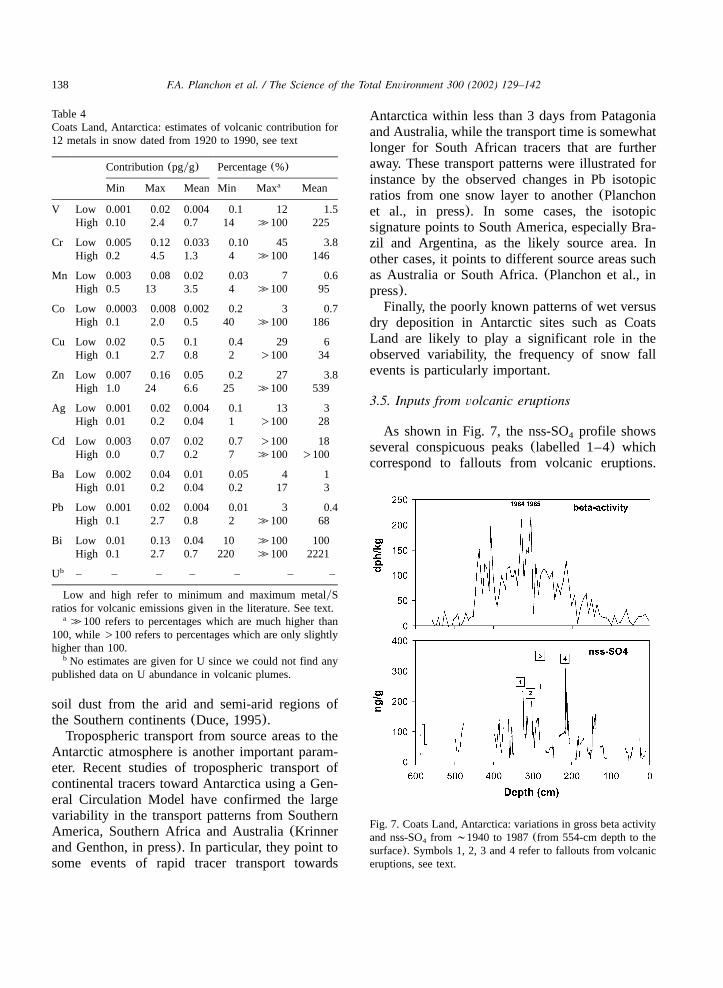
Table 4Coats Land, Antarctica: estimates of volcanic contribution for12 metals in snow dated from 1920 to 1990, see text
Contribution(pgyg) Percentage(%)
Min Max Mean Min Maxa Mean
V Low 0.001 0.02 0.004 0.1 12 1.5High 0.10 2.4 0.7 14 4100 225
Cr Low 0.005 0.12 0.033 0.10 45 3.8High 0.2 4.5 1.3 4 4100 146
Mn Low 0.003 0.08 0.02 0.03 7 0.6High 0.5 13 3.5 4 4100 95
Co Low 0.0003 0.008 0.002 0.2 3 0.7High 0.1 2.0 0.5 40 4100 186
Cu Low 0.02 0.5 0.1 0.4 29 6High 0.1 2.7 0.8 2 )100 34
Zn Low 0.007 0.16 0.05 0.2 27 3.8High 1.0 24 6.6 25 4100 539
Ag Low 0.001 0.02 0.004 0.1 13 3High 0.01 0.2 0.04 1 )100 28
Cd Low 0.003 0.07 0.02 0.7 )100 18High 0.0 0.7 0.2 7 4100 )100
Ba Low 0.002 0.04 0.01 0.05 4 1High 0.01 0.2 0.04 0.2 17 3
Pb Low 0.001 0.02 0.004 0.01 3 0.4High 0.1 2.7 0.8 2 4100 68
Bi Low 0.01 0.13 0.04 10 4100 100High 0.1 2.7 0.7 220 4100 2221
Ub – – – – – – –
Low and high refer to minimum and maximum metalySratios for volcanic emissions given in the literature. See text.
4100 refers to percentages which are much higher thana
100, while)100 refers to percentages which are only slightlyhigher than 100.
No estimates are given for U since we could not find anyb
published data on U abundance in volcanic plumes.
Fig. 7. Coats Land, Antarctica: variations in gross beta activityand nss-SO from;1940 to 1987(from 554-cm depth to the4
surface). Symbols 1, 2, 3 and 4 refer to fallouts from volcaniceruptions, see text.
soil dust from the arid and semi-arid regions ofthe Southern continents(Duce, 1995).
Tropospheric transport from source areas to theAntarctic atmosphere is another important param-eter. Recent studies of tropospheric transport ofcontinental tracers toward Antarctica using a Gen-eral Circulation Model have confirmed the largevariability in the transport patterns from SouthernAmerica, Southern Africa and Australia(Krinnerand Genthon, in press). In particular, they point tosome events of rapid tracer transport towards
Antarctica within less than 3 days from Patagoniaand Australia, while the transport time is somewhatlonger for South African tracers that are furtheraway. These transport patterns were illustrated forinstance by the observed changes in Pb isotopicratios from one snow layer to another(Planchonet al., in press). In some cases, the isotopicsignature points to South America, especially Bra-zil and Argentina, as the likely source area. Inother cases, it points to different source areas suchas Australia or South Africa.(Planchon et al., inpress).
Finally, the poorly known patterns of wet versusdry deposition in Antarctic sites such as CoatsLand are likely to play a significant role in theobserved variability, the frequency of snow fallevents is particularly important.
3.5. Inputs from volcanic eruptions
As shown in Fig. 7, the nss-SO profile shows4
several conspicuous peaks(labelled 1–4) whichcorrespond to fallouts from volcanic eruptions.
139F.A. Planchon et al. / The Science of the Total Environment 300 (2002) 129–142
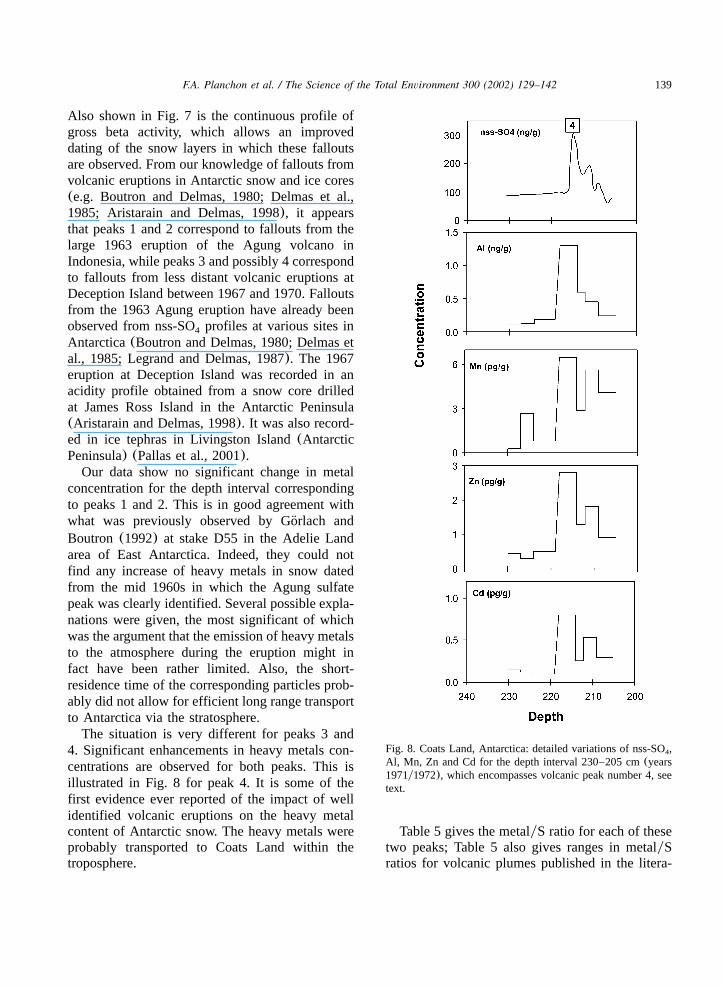
Fig. 8. Coats Land, Antarctica: detailed variations of nss-SO ,4
Al, Mn, Zn and Cd for the depth interval 230–205 cm(years1971y1972), which encompasses volcanic peak number 4, seetext.
Also shown in Fig. 7 is the continuous profile ofgross beta activity, which allows an improveddating of the snow layers in which these falloutsare observed. From our knowledge of fallouts fromvolcanic eruptions in Antarctic snow and ice cores(e.g. Boutron and Delmas, 1980; Delmas et al.,1985; Aristarain and Delmas, 1998), it appearsthat peaks 1 and 2 correspond to fallouts from thelarge 1963 eruption of the Agung volcano inIndonesia, while peaks 3 and possibly 4 correspondto fallouts from less distant volcanic eruptions atDeception Island between 1967 and 1970. Falloutsfrom the 1963 Agung eruption have already beenobserved from nss-SO profiles at various sites in4
Antarctica(Boutron and Delmas, 1980; Delmas etal., 1985; Legrand and Delmas, 1987). The 1967eruption at Deception Island was recorded in anacidity profile obtained from a snow core drilledat James Ross Island in the Antarctic Peninsula(Aristarain and Delmas, 1998). It was also record-ed in ice tephras in Livingston Island(AntarcticPeninsula) (Pallas et al., 2001).
Our data show no significant change in metalconcentration for the depth interval correspondingto peaks 1 and 2. This is in good agreement withwhat was previously observed by Gorlach and¨Boutron (1992) at stake D55 in the Adelie Landarea of East Antarctica. Indeed, they could notfind any increase of heavy metals in snow datedfrom the mid 1960s in which the Agung sulfatepeak was clearly identified. Several possible expla-nations were given, the most significant of whichwas the argument that the emission of heavy metalsto the atmosphere during the eruption might infact have been rather limited. Also, the short-residence time of the corresponding particles prob-ably did not allow for efficient long range transportto Antarctica via the stratosphere.
The situation is very different for peaks 3 and4. Significant enhancements in heavy metals con-centrations are observed for both peaks. This isillustrated in Fig. 8 for peak 4. It is some of thefirst evidence ever reported of the impact of wellidentified volcanic eruptions on the heavy metalcontent of Antarctic snow. The heavy metals wereprobably transported to Coats Land within thetroposphere.
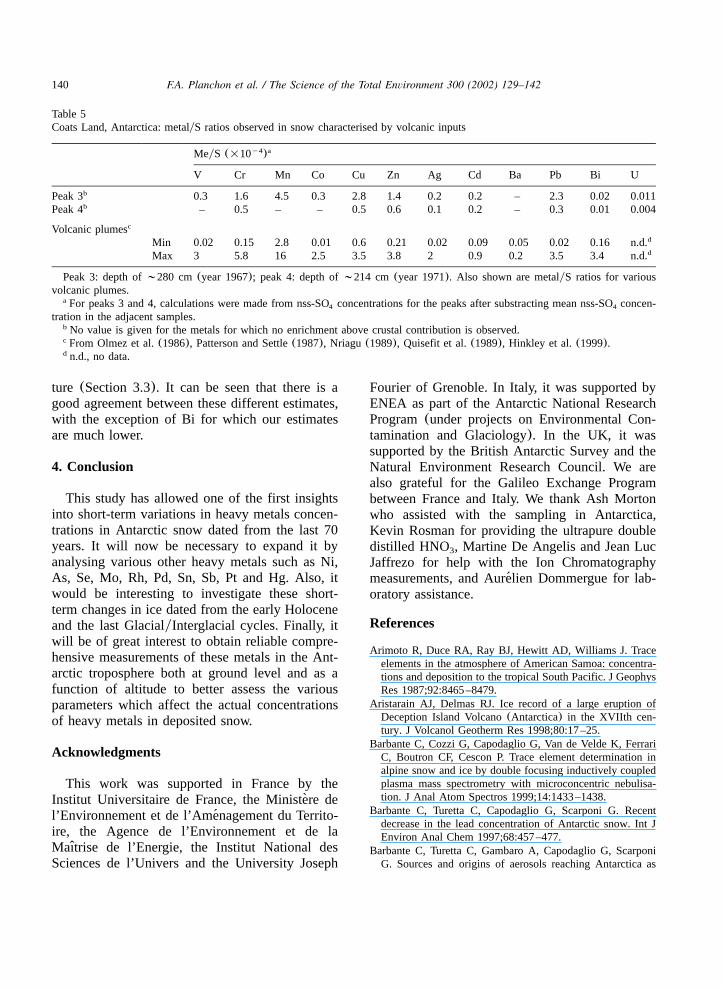
Table 5 gives the metalyS ratio for each of thesetwo peaks; Table 5 also gives ranges in metalySratios for volcanic plumes published in the litera-
140 F.A. Planchon et al. / The Science of the Total Environment 300 (2002) 129–142
Table 5Coats Land, Antarctica: metalyS ratios observed in snow characterised by volcanic inputs
MeyS (=10 )y4 a
V Cr Mn Co Cu Zn Ag Cd Ba Pb Bi U
Peak 3b 0.3 1.6 4.5 0.3 2.8 1.4 0.2 0.2 – 2.3 0.02 0.011Peak 4b – 0.5 – – 0.5 0.6 0.1 0.2 – 0.3 0.01 0.004
Volcanic plumesc
Min 0.02 0.15 2.8 0.01 0.6 0.21 0.02 0.09 0.05 0.02 0.16 n.d.d
Max 3 5.8 16 2.5 3.5 3.8 2 0.9 0.2 3.5 3.4 n.d.d
Peak 3: depth of;280 cm(year 1967); peak 4: depth of;214 cm(year 1971). Also shown are metalyS ratios for variousvolcanic plumes.
For peaks 3 and 4, calculations were made from nss-SO concentrations for the peaks after substracting mean nss-SO concen-a4 4
tration in the adjacent samples.No value is given for the metals for which no enrichment above crustal contribution is observed.b
From Olmez et al.(1986), Patterson and Settle(1987), Nriagu (1989), Quisefit et al.(1989), Hinkley et al.(1999).c
n.d., no data.d
ture (Section 3.3). It can be seen that there is agood agreement between these different estimates,with the exception of Bi for which our estimatesare much lower.
4. Conclusion
This study has allowed one of the first insightsinto short-term variations in heavy metals concen-trations in Antarctic snow dated from the last 70years. It will now be necessary to expand it byanalysing various other heavy metals such as Ni,As, Se, Mo, Rh, Pd, Sn, Sb, Pt and Hg. Also, itwould be interesting to investigate these short-term changes in ice dated from the early Holoceneand the last GlacialyInterglacial cycles. Finally, itwill be of great interest to obtain reliable compre-hensive measurements of these metals in the Ant-arctic troposphere both at ground level and as afunction of altitude to better assess the variousparameters which affect the actual concentrationsof heavy metals in deposited snow.
Acknowledgments
This work was supported in France by theInstitut Universitaire de France, the Ministere de`l’Environnement et de l’Amenagement du Territo-´ire, the Agence de l’Environnement et de laMaıtrise de l’Energie, the Institut National desˆSciences de l’Univers and the University Joseph
Fourier of Grenoble. In Italy, it was supported byENEA as part of the Antarctic National ResearchProgram(under projects on Environmental Con-tamination and Glaciology). In the UK, it wassupported by the British Antarctic Survey and theNatural Environment Research Council. We arealso grateful for the Galileo Exchange Programbetween France and Italy. We thank Ash Mortonwho assisted with the sampling in Antarctica,Kevin Rosman for providing the ultrapure doubledistilled HNO , Martine De Angelis and Jean Luc3
Jaffrezo for help with the Ion Chromatographymeasurements, and Aurelien Dommergue for lab-´oratory assistance.
References
Arimoto R, Duce RA, Ray BJ, Hewitt AD, Williams J. Traceelements in the atmosphere of American Samoa: concentra-tions and deposition to the tropical South Pacific. J GeophysRes 1987;92:8465–8479.
Aristarain AJ, Delmas RJ. Ice record of a large eruption ofDeception Island Volcano(Antarctica) in the XVIIth cen-tury. J Volcanol Geotherm Res 1998;80:17–25.
Barbante C, Cozzi G, Capodaglio G, Van de Velde K, FerrariC, Boutron CF, Cescon P. Trace element determination inalpine snow and ice by double focusing inductively coupledplasma mass spectrometry with microconcentric nebulisa-tion. J Anal Atom Spectros 1999;14:1433–1438.
Barbante C, Turetta C, Capodaglio G, Scarponi G. Recentdecrease in the lead concentration of Antarctic snow. Int JEnviron Anal Chem 1997;68:457–477.
Barbante C, Turetta C, Gambaro A, Capodaglio G, ScarponiG. Sources and origins of aerosols reaching Antarctica as
141F.A. Planchon et al. / The Science of the Total Environment 300 (2002) 129–142
revealed by lead concentrations profiles in shallow snow.Ann Glaciol 1998;27:674–678.
Boutron CF, Delmas R. Are the past variations of the strato-sphere sulfate burden recorded in central Antarctic snowand ice layers? J Geophys Res 1980;85:5645–5649.
Boutron CF, Patterson CC, Barkov NI. The occurrence of zincin Antarctic ancient ice and recent snow. Earth Planet SciLett 1990;101:248–259.
Boutron CF, Patterson CC, Petrov VN, Barkov NI. Preliminarydata on changes of lead concentrations in Antarctic ice from155 000 to 26 000 years BP. Atmos Environ 1987;21:1197–1202.
Boutron CF, Patterson CC. Lead concentration changes inAntarctic ice during the WisconsinyHolocene transition.Nature 1986;323:222–225.
Boutron CF, Patterson CC. The occurrence of lead in Antarcticrecent snow, film deposited over the last two centuries andprehistoric ice. Geochim Cosmochim Acta 1983;47:1355–1368.
Boutron CF, Rudniev SN, Bolshov MA, Koloshnikov VG,Patterson CC, Barkov NI. Changes in cadmium concentra-tions in Antarctic ice and snow during the past 155 000years. Earth Planet Sci Lett 1993;117:431–441.
Boutron CF. A clean laboratory for ultralow concentrationheavy metal analysis. Fresenius Z Anal Chem1990;337:482–491.
Capodaglio G, Barbante C, Cescon P. Trace metals in Antarcticseawater. In: Caroli S, Cescon P, Walton DWH, editors.Environmental contamination in Antarctica, a challenge toanalytical chemistryElsevier Science BV, 2001. p. 107–154.
Delmas RJ, Legrand M, Aristarain J, Zanolini F. Volcanicdeposits in Antarctic snow and ice. J Geophys Res1985;90:901–920.
Dick AL. Concentrations and sources of metals in theAntarctic Peninsula aerosol. Geochim Cosmochim Acta1991;55:1827–1836.
Donat JR, Bruland KW. Trace elements in the oceans. In:Salbu B, Steines E, editors. Trace elements in natural waters.Boca Raton: CRC Press, 1995. p. 247–280.
Duce RA. Sources, distributions, and fluxes of mineral aerosolsand their relationship to climate. In: Charlson RJ, Heintz-enberg J, editors. Aerosol forcing of climate. Wiley, 1995.p. 43–72.
Ferrari CP, Moreau AL, Boutron CF. Clean conditions for thedetermination of ultralow levels of mercury in ice and snowsamples. Fresenius Z Anal Chem 2000;366:433–437.
Flegal AR, Maring H, Niemeyer S. Anthropogenic Pb inAntarctic sea water. Nature 1993;360:242–244.
Gorlach U, Boutron CF. Changes in heavy metals concentra-¨tions in Antarctic snows from 1940 to 1980. J Atmos Chem1992;14:205–222.
Gorlach U, Boutron CF. Preconcentration of lead, cadmium,¨copper and zinc in water at the pgyg level by non-boilingevaporation. Anal Chim Acta 1990;236:391–398.
Heuman KG. Determination of inorganic and organic traces inthe clean room compartment of Antarctica. Anal Chim Acta1993;283:230–245.
Hinkley TK, Lamothe PL, Wilson SA, Finnegan DL, GerlachTM. Metal emissions from Kilauea, and suggested revisionof the estimated worldwide metal output by quiescentdegassing of volcanoes. Earth Planet Sci Lett1999;170:315–325.
Hong S, Lee G, Van de Velde K, Boutron CF. Variability ofPb, Mn, Al and Na concentrations in snow deposited fromwinter to early summer 1998 in Livingston Island, AntarcticPeninsula. J Korean Soc Atmos Environ. 2000;16:85–96.
Hunter KA. Chemistry of the sea-surface microlayer. In: LissPS, Duce RA, editors. The sea surface and global change,Cambridge University Press 1997. p. 287–319.
Krinner G, Genthon C. Tropospheric transport of continentaltracers towards Antarctica under varying climatic conditions.Tellus, in press.
Legrand M, Delmas RJ. A 220-years continuous record ofvolcanic H SO in the Antarctic ice sheet. Nature2 4
1987;327:671–676.Legrand M, Mayewski P. Glaciochemistry of polar ice cores:
a review. Rev Geophys 1997;35:219–243.Legrand M, De Angelis M, Maupetit F. Field investigation of
major and minor ions along Summit(Central Greenland)ice cores by ion chromatography. J Chromatogr1993;640:251–258.
Murozumi M, Chow TJ, Patterson CC. Chemical concentra-tions of pollutant lead aerosols, terrestrial dusts and seasalts in Greenland and Antarctic snow strata. GeochimCosmochim Acta 1969;33:1247–1294.
Nriagu JO. A global assessment of natural sources of atmos-pheric trace metals. Nature 1989;338:47–49.
Olmez I, Finnegan DL, Zoller WH. Iridium emissions fromKilauea volcano. J Geophys Res 1986;91:653–663.
Pacyna JM, Pacyna EG. An assessment of global and regionalemissions of trace metals to the atmosphere from anthro-pogenic sources worldwide. Environ Rev 2001;9:269–298.
Pallas R, Smellie JL, Casas JM, Calvet J. Using tephrochron-ology to date temperate ice: correlation between ice tephrason Livingston island and eruptive units on Deception Islandvolcano (South Shetlands Islands, Antarctica). Holocene2001;11:149–160.
Patterson CC, Settle DM. Magnitude of lead flux to theatmosphere from volcanoes. Geochim Cosmochim Acta1987;51:675–681 (erratum 1988;52:245).
Planchon FAM, Boutron CF, Barbante C, Wolff EW, Cozzi G,Gaspari V, Ferrari CP, Cescon P. Ultrasensitive determinationof heavy metals at the sub-picogram per gram level inultraclean Antarctic snow samples by inductively coupledplasma sector field mass spectrometry. Anal Chim Acta2001;450:193–205.
Planchon FAM, Boutron CF, Barbante C, Wolff EW, Cozzi G,Gaspari V, Ferrari CP, Cescon P. Changes in atmosphericheavy metals in Antarctic snow from Coats Land since themid-nineteenth century. Earth Planet Sci Lett2002;200:207–222.
Planchon FAM, Van de Velde K, Rosman KJR, Wolff EW,Ferrari CP, Boutron CF. A 150 year record of lead isotopesin Antarctic snow. Geochim. Cosmochim. Acta, in press.
142 F.A. Planchon et al. / The Science of the Total Environment 300 (2002) 129–142
Pongratz R, Heuman KG. Production of methylated mercury,lead and cadmium by marine bacteria as a significant sourcefor atmospheric heavy metals in polar regions. Chemosphere1999;39:89–102.
Quisefit JP, Touting JP, Bergametti G, Javoy M, Cheynet B,Person A. Evolution versus cooling of gaseous volcanicemissions from Momotombo volcano, Nicaragua: thermo-chemical model and observations. Geochim CosmochimActa 1989;53:2591–2608.
Suttie ED, Wolff EW. Seasonal input of heavy metals toAntarctic snow. Tellus 1992;44B:351–357.
Vallelonga P, Van de Velde K, Candelone JP, Ly C, RosmanKJR, Boutron CF, Morgan VI, Mackey DJ. Recent advancesin measurement of Pb isotopes in polar ice and snow atsub-picogram per gram concentrations using thermal ioni-sation mass spectrometry. Anal Chim Acta 2002;453:1–12.
Vandal GM, Fitzgerald WF, Boutron CF, Candelone JP. Vari-ations in mercury deposition to Antarctica over the past34 000 years. Nature 1993;362:621–623.
Wedepohl KH. The composition of the continental crust.Geochim Cosmochim Acta 1995;59:1217–1232.
Weisel CP, Duce RA, Fasching JL, Heaton RW. Estimates ofthe transport of trace metals from the ocean to the atmos-phere. J Geophys Res 1984;89:11607–11618.
Westerlund S, Ohman P. Cadmium, copper, cobalt, lead and¨
zinc in the water column of the Weddel Sea, Antarctica.Geochim Cosmochim Acta 1991;55:2127–2146.
Wolff EW, Suttie ED, Peel DA. Antarctic snow record ofcadmium, copper and zinc content during the twentiethcentury. Atmos Environ 1999;33:1535–1541.
Wolff EW, Suttie ED. Antarctic snow record of SouthernHemisphere lead pollution. Geophys Res Lett 1994;21:781–784.