Short-term employment transitions of the Canadian labour force: rural–urban differences in...
34
1 SHORT-TERM EMPLOYMENT TRANSITIONS OF THE CANADIAN LABOUR FORCE: RURAL- URBAN DIFFERENCES* Esperanza Vera –Toscano (corresponding author) Department of Agricultural and Resource Economics University of California, Davis One Shields Avenue Davis, CA 95616 Tel: (530) 752 9376 Fax: (530) 752 5614 Email: [email protected] Euan Phimister Department of Economics University of Aberdeen Aberdeen, Scotland Tel: 01224 273855 Fax: 01224 272181 Email: [email protected] Alfons Weersink Department of Agricultural Economics and Business University of Guelph Guelph, Ontario N1G 2W1 Tel: (519) 824-4120 ext 2766 Fax: (519) 767-1510 Email: [email protected] * This paper was written while Esperanza Vera-Toscano held a postgraduate studentship at Statistics Canada in Ottawa. The permission of Statistics Canada to access the data used in this paper and their financial support is gratefully acknowledged. All usual caveats apply.
Transcript of Short-term employment transitions of the Canadian labour force: rural–urban differences in...

1
SHORT-TERM EMPLOYMENT TRANSITIONS OF THE CANADIAN LABOUR
FORCE: RURAL- URBAN DIFFERENCES*
Esperanza Vera –Toscano (corresponding author)Department of Agricultural and Resource EconomicsUniversity of California, DavisOne Shields AvenueDavis, CA 95616Tel: (530) 752 9376Fax: (530) 752 5614Email: [email protected]
Euan PhimisterDepartment of EconomicsUniversity of AberdeenAberdeen, ScotlandTel: 01224 273855Fax: 01224 272181Email: [email protected]
Alfons WeersinkDepartment of Agricultural Economics and BusinessUniversity of GuelphGuelph, OntarioN1G 2W1Tel: (519) 824-4120 ext 2766Fax: (519) 767-1510Email: [email protected]
* This paper was written while Esperanza Vera-Toscano held a postgraduate studentship
at Statistics Canada in Ottawa. The permission of Statistics Canada to access the data
used in this paper and their financial support is gratefully acknowledged. All usual
caveats apply.

2
SHORT-TERM EMPLOYMENT TRANSITIONS OF THE CANADIAN LABOUR
FORCE: RURAL- URBAN DIFFERENCES
ABSTRACT. Using data from the Canadian Survey of Labour and Income
Dynamics (SLID) for the period 1993-1996, we examine patterns and determinants
of labour force transitions of adequately employed and underemployed workers in an
attempt to explore whether employment dynamics significantly differ between rural
and urban workers so as to disadvantage rural economic performance. The results
indicate that rural underemployed workers in Canada are, in the short run (year-to
year transitions) equally likely to enter adequate employment as adequately
employed individuals are to enter underemployment. Further, we also found there is
weak evidence that education level of rural workers has a lower impact on the
probability of moving out of underemployment than in urban areas. In addition rural
women are significantly less likely than their male counterparts and urban workers to
enter adequate employment although the presence of young children does not seem
to especially constrain rural women’s employment. The results suggest that labour
force transition in and out of adequate employment, and particularly
underemployment, significantly differ between rural and urban workers and should
be taken into account when evaluating employment hardship in rural Canada.
JEL: R11, R23, J63
Keywords: Rural Development; Structural Change; Regional Labour Markets; Mobility;
Underemployment.
3
SHORT-TERM EMPLOYMENT TRANSITIONS OF THE CANADIAN LABOUR
FORCE: RURAL- URBAN DIFFERENCES
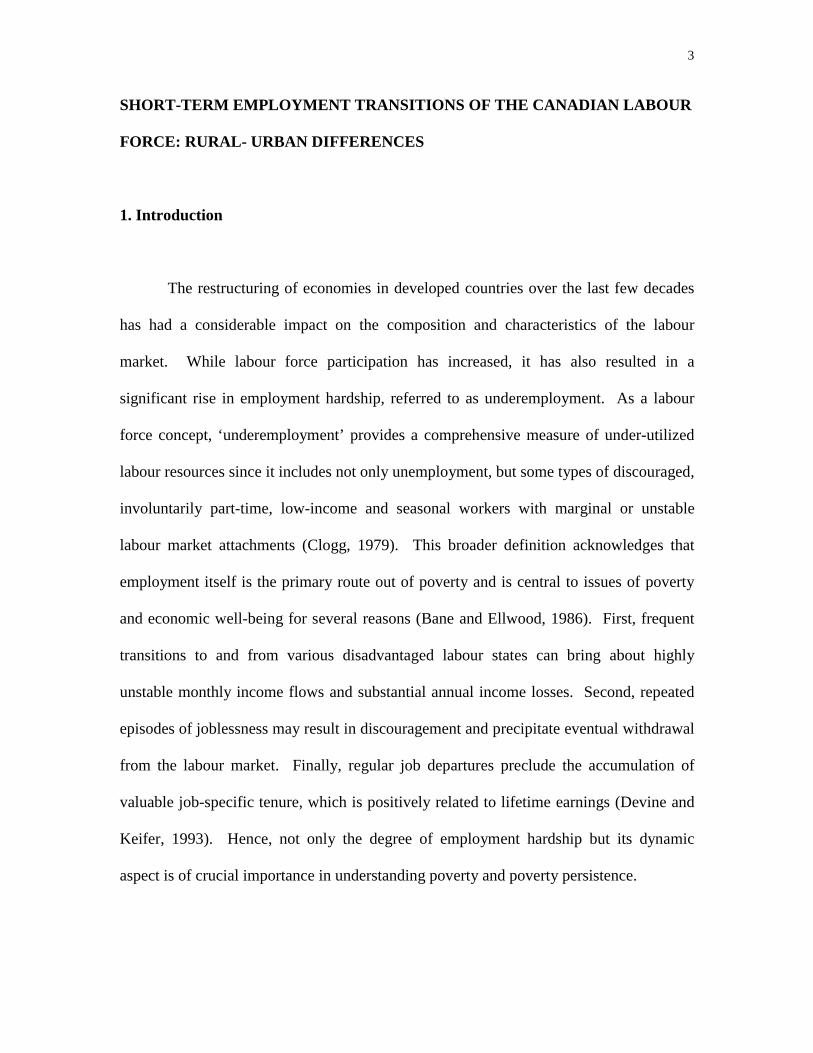
1. Introduction
The restructuring of economies in developed countries over the last few decades
has had a considerable impact on the composition and characteristics of the labour
market. While labour force participation has increased, it has also resulted in a
significant rise in employment hardship, referred to as underemployment. As a labour
force concept, ‘underemployment’ provides a comprehensive measure of under-utilized
labour resources since it includes not only unemployment, but some types of discouraged,
involuntarily part-time, low-income and seasonal workers with marginal or unstable
labour market attachments (Clogg, 1979). This broader definition acknowledges that
employment itself is the primary route out of poverty and is central to issues of poverty
and economic well-being for several reasons (Bane and Ellwood, 1986). First, frequent
transitions to and from various disadvantaged labour states can bring about highly
unstable monthly income flows and substantial annual income losses. Second, repeated
episodes of joblessness may result in discouragement and precipitate eventual withdrawal
from the labour market. Finally, regular job departures preclude the accumulation of
valuable job-specific tenure, which is positively related to lifetime earnings (Devine and
Keifer, 1993). Hence, not only the degree of employment hardship but its dynamic
aspect is of crucial importance in understanding poverty and poverty persistence.
4
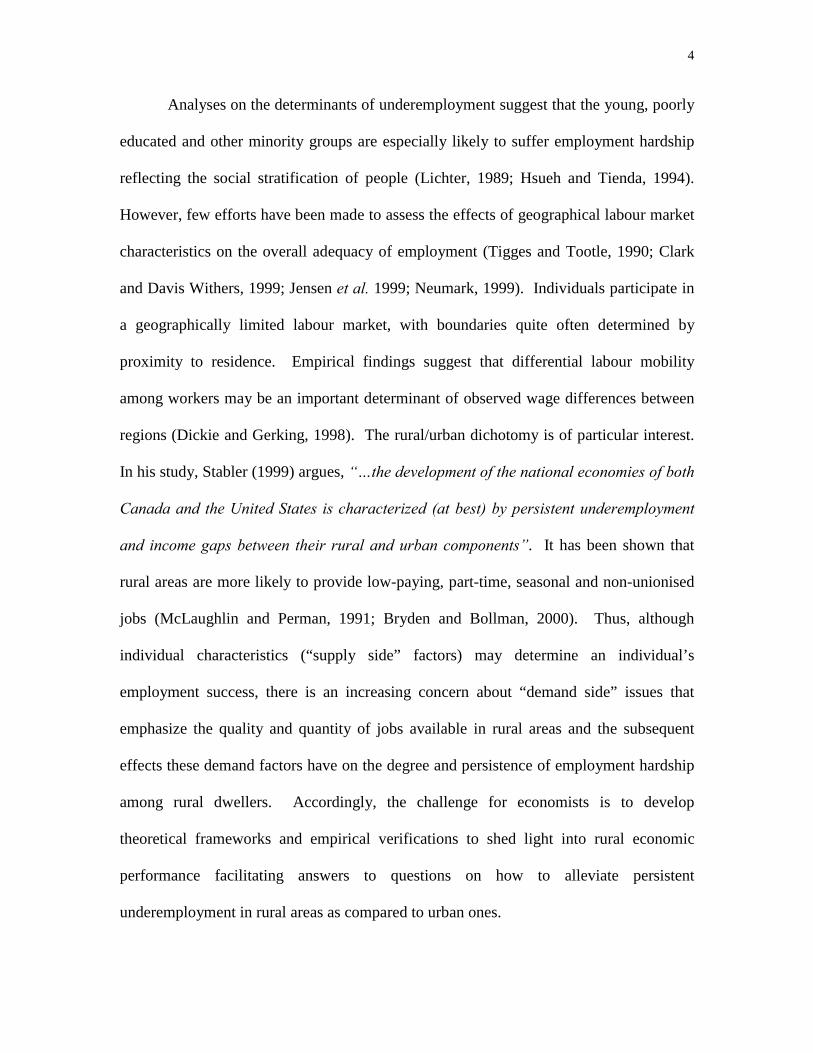
Analyses on the determinants of underemployment suggest that the young, poorly
educated and other minority groups are especially likely to suffer employment hardship
reflecting the social stratification of people (Lichter, 1989; Hsueh and Tienda, 1994).
However, few efforts have been made to assess the effects of geographical labour market
characteristics on the overall adequacy of employment (Tigges and Tootle, 1990; Clark
and Davis Withers, 1999; Jensen et al. 1999; Neumark, 1999). Individuals participate in
a geographically limited labour market, with boundaries quite often determined by
proximity to residence. Empirical findings suggest that differential labour mobility
among workers may be an important determinant of observed wage differences between
regions (Dickie and Gerking, 1998). The rural/urban dichotomy is of particular interest.
In his study, Stabler (1999) argues, “…the development of the national economies of both
Canada and the United States is characterized (at best) by persistent underemployment
and income gaps between their rural and urban components”. It has been shown that
rural areas are more likely to provide low-paying, part-time, seasonal and non-unionised
jobs (McLaughlin and Perman, 1991; Bryden and Bollman, 2000). Thus, although
individual characteristics (“supply side” factors) may determine an individual’s
employment success, there is an increasing concern about “demand side” issues that
emphasize the quality and quantity of jobs available in rural areas and the subsequent
effects these demand factors have on the degree and persistence of employment hardship
among rural dwellers. Accordingly, the challenge for economists is to develop
theoretical frameworks and empirical verifications to shed light into rural economic
performance facilitating answers to questions on how to alleviate persistent
underemployment in rural areas as compared to urban ones.

5
The principal objective of this paper is to explore empirically whether
employment dynamics of individuals experiencing underemployment in rural areas
differs from those in urban areas. In particular, as the focus is on regional differences in
labour market conditions, two specific questions are to be addressed. First, are there
residential differences in the probability of making transitions into and out of
underemployment that work to disadvantage rural individuals after controlling for socio-
demographic and labour market characteristics. Second, do significant differences exist
in any of the determinants affecting the transitions between labour force states between
rural and urban individuals.
This paper seeks to address these seldom explored questions by providing a
comparative picture of the employment transitions in “rural” and “urban” sub-samples
of individuals drawn from the Survey of Labor and Income Dynamics (SLID)1 of
Canada. Few empirical studies of transitions between labour force states and the
difference between rural and urban dwellers have been undertaken so far (Lichter et al.,
1991; Jensen et al., 1999). The unavailability of longitudinal data, together with an
appropriate rural sample (in size and definition) has precluded the possibility of
adequately examining and explaining underemployment transitions to determine whether
a rural disadvantage exists. The time series and cross-sectional nature of the SLID data
allows a wide range of factors such as human capital, job type, firm and market
characteristics to be used to explain short-term transitions into and out of different labour
1 The data used in this paper were made available through Statistics Canada. Statistics Canada
does not bear any responsibility for the analyses or interpretation presented here.
6
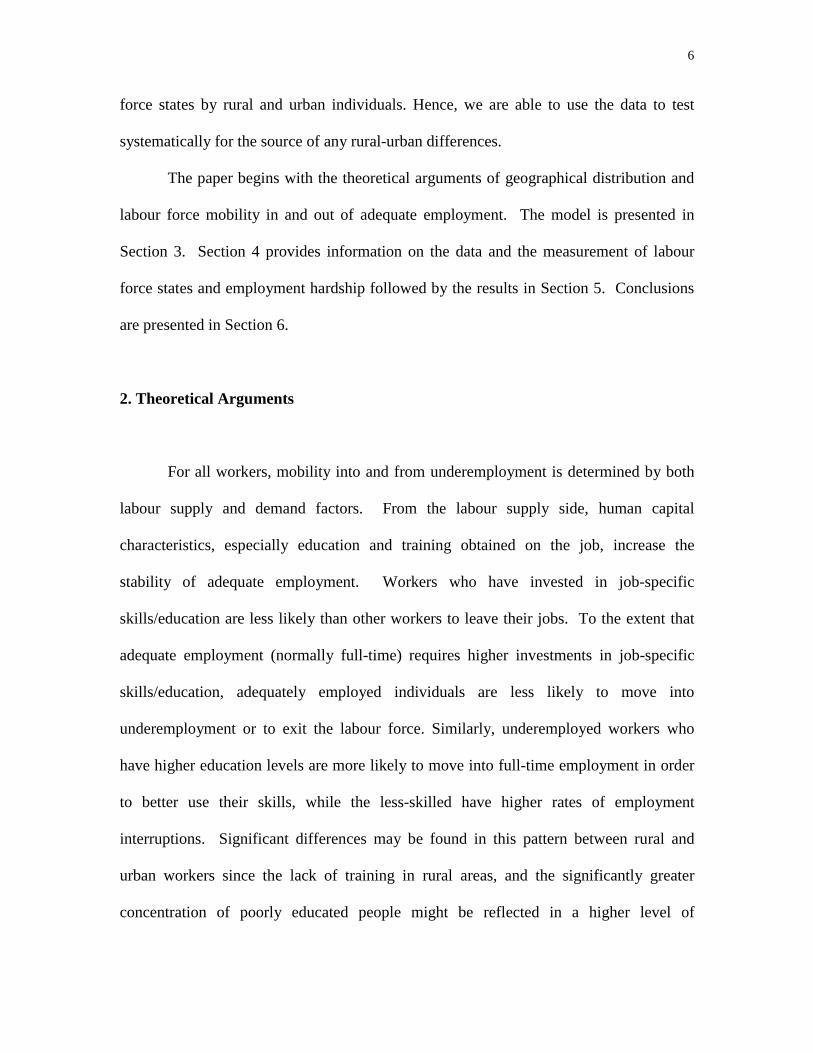
force states by rural and urban individuals. Hence, we are able to use the data to test
systematically for the source of any rural-urban differences.
The paper begins with the theoretical arguments of geographical distribution and
labour force mobility in and out of adequate employment. The model is presented in
Section 3. Section 4 provides information on the data and the measurement of labour
force states and employment hardship followed by the results in Section 5. Conclusions
are presented in Section 6.
2. Theoretical Arguments
For all workers, mobility into and from underemployment is determined by both
labour supply and demand factors. From the labour supply side, human capital
characteristics, especially education and training obtained on the job, increase the
stability of adequate employment. Workers who have invested in job-specific
skills/education are less likely than other workers to leave their jobs. To the extent that
adequate employment (normally full-time) requires higher investments in job-specific
skills/education, adequately employed individuals are less likely to move into
underemployment or to exit the labour force. Similarly, underemployed workers who
have higher education levels are more likely to move into full-time employment in order
to better use their skills, while the less-skilled have higher rates of employment
interruptions. Significant differences may be found in this pattern between rural and
urban workers since the lack of training in rural areas, and the significantly greater
concentration of poorly educated people might be reflected in a higher level of

7
underemployment. Thus, Lichter and Constanzo (1987) identify educational composition
as a major factor accounting for the metropolitan-nonmetropolitan underemployment
differential. However, among those not completing high school, nonmetropolitan
underemployment rates were higher than metropolitan ones. Further, Sheets et al. (1987)
also find higher median education lowers metropolitan underemployment.
Other socio-demographic characteristics, such as age, gender and marital status,
are also likely to influence the transition into and from underemployment. A woman’s
employment decisions are determined, for the most part, by factors at the family level and
the roles imposed on them by society. Women experience a variety of transitions among
different employment statuses over their family life cycle, and not many of them work
continuously in full-time jobs. Some women drop out of paid employment to take care of
the household when they have children, while others maintain their attachment to the
labour market by moving into part-time employment (Moen, 1985). The more traditional
role imposed on women is likely to have a greater effect on the labour force transitions in
many rural areas than in urban ones.
The move into and out of underemployment is also conditioned by occupation and
by the industrial structure of the labour market (labour demand characteristics). From a
dual economy perspective (Doeringer, 1984), high paid, high-skilled jobs are
concentrated in the industries that constitute the core segment of the market, while the
less stable, lower-skilled jobs are more likely to be in the periphery. Core workers, who
are usually highly skilled and most attractive to employers, have a high holding power
over their jobs, and for them mobility takes place within internal, vertical ladders. In the
secondary market, job stability is lower; workers move between occupations and jobs, but

8
are less likely to enter primary jobs. Thus, above and beyond socio-demographic
constraints, workers employed in core industries and occupations are less likely to move
into underemployment and out of the labour force because of the high opportunity costs
involved in such moves. The greater presence of low-skilled, low-paying jobs in rural
areas is likely to significantly differentiate the transition into underemployment and out
of the labour force for rural workers versus urban ones (Bluestone and Harrison, 1982).
Finally, place of residence other than the rural/urban dichotomy is likely to
influence the transitions between labour force states by individuals. Provinces with
greater economic development and employment opportunities are more likely to increase
adequate employment. In contrast, the probability of moving to a state of
underemployment with all else constant is likely to be greater in regions with sluggish
economies.
The probability of transitions to and from underemployment, the mobility
between different employment states, and the differences found between rural and urban
workers, are at the centre of the current study. Following the above discussion, the study
focuses on the role socio-demographic characteristics and occupational and industry
structures play in determining the probability of changes in a worker’s employment status
in the Canadian labour market. Three general hypotheses are examined:
(a) Higher education (as a proxy for skill level) increases the stability of adequate
employment for those holding such jobs, and increases the likelihood of entering
adequate employment for those underemployed. For rural workers, we expect education
to have a significantly lower impact on the probability of moving out of
underemployment given the characteristics of the labour market in rural areas.

9
(b) Being a female worker and having family responsibilities (i.e. presence of
children in the household) decreases the stability of adequate employment and increases
the likelihood of entering underemployment. The more traditional role of women within
the family sustained by rural communities is likely to significantly increase this tendency
in rural areas.
(c) Employment in high skilled jobs lowers the chances of exiting the labour force
and of moving into underemployment, while the opposite is expected in low-skilled
secondary occupations. The greater presence of secondary/low-skills job types in rural
areas is likely to increase labour force instability among rural workers.
3. The Model
The approach for examining the factors that influence the shifts from one labour
force status to another involves estimating logistic regression models of employment
transitions. For each labour force state, the probabilities of shifting from the initial labour
force state to each of the other two states are estimated. The employment states are
denoted as 0 for underemployment, 1 for adequate employment, and 2 if the individual is
out of the labour force. To analyse the corresponding transitions between states, we
estimate the following multinomial logit model:
∑=
′′
=
2,1,0
)exp()exp(
)(
mijm
ijkiijk
xβx
xβ
λ (1)
m= underemployment (0); adequate employment (1); out of the labour force (2).
10
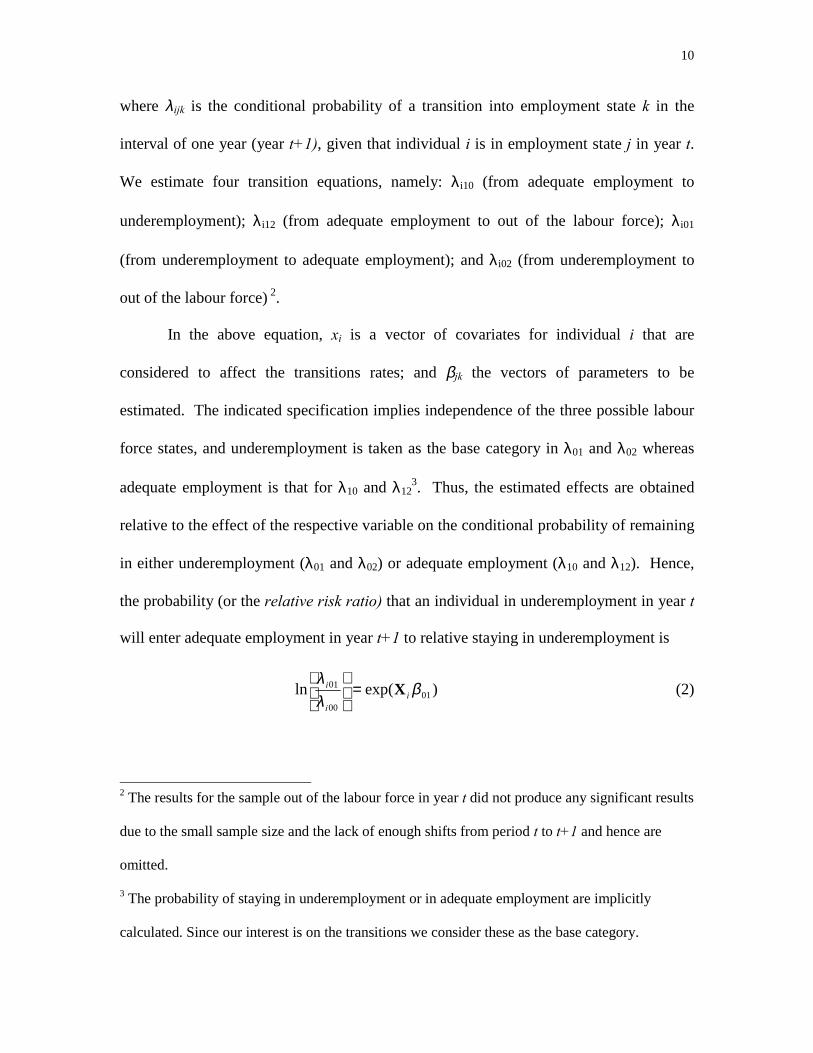
where λijk is the conditional probability of a transition into employment state k in the
interval of one year (year t+1), given that individual i is in employment state j in year t.
We estimate four transition equations, namely: λ i10 (from adequate employment to
underemployment); λ i12 (from adequate employment to out of the labour force); λ i01
(from underemployment to adequate employment); and λ i02 (from underemployment to
out of the labour force) 2.
In the above equation, xi is a vector of covariates for individual i that are
considered to affect the transitions rates; and βjk the vectors of parameters to be
estimated. The indicated specification implies independence of the three possible labour
force states, and underemployment is taken as the base category in λ01 and λ02 whereas
adequate employment is that for λ10 and λ123. Thus, the estimated effects are obtained
relative to the effect of the respective variable on the conditional probability of remaining
in either underemployment (λ01 and λ02) or adequate employment (λ10 and λ12). Hence,
the probability (or the relative risk ratio) that an individual in underemployment in year t
will enter adequate employment in year t+1 to relative staying in underemployment is
)exp(ln 0100
01 βλλ
ii
i X=
(2)
2 The results for the sample out of the labour force in year t did not produce any significant results
due to the small sample size and the lack of enough shifts from period t to t+1 and hence are
omitted.
3 The probability of staying in underemployment or in adequate employment are implicitly
calculated. Since our interest is on the transitions we consider these as the base category.

11
and the same rule would apply to the other scenarios, namely: (a) being out of the labour
force relative to underemployment )exp( 02βiX ; (b) being in underemployment relative
to adequate employment )exp( 10βiX ; and (c) being out of the labour force relative to
adequate employment )exp( 12βiX .
Following the hypotheses presented above, the vector of covariates (xi) indicates
the three dimensions that are expected to affect any labour market related move: socio-
demographic characteristics, labour market characteristics (occupation and industry), and
region. Education, which serves as a proxy for skills, is differentiated into three levels:
less than high school (as the omitted category), high school and more than high school.
Other socio-demographic variables are the age of the worker and age squared, marital
status, gender and the interaction of gender with the presence of children below 5 years of
age. Market characteristics are denoted by the type of occupation ranging from less
skilled individuals to professionals (6 categorical variables). Dummies for four industry
groups are also included: (1) resource based activities; (2) manufacturing; (3)
construction, distribution and transport; and (4) service and financial sector as the omitted
category. Finally, dummy variables for each province are used to capture the state of the
local labour market, as is the inclusion of the rural dummy. Year dummies are also
included to adjust for employment trends across all regions.
Later, we estimate residence-specific models to ascertain whether the
determinants of upward or downward employment transitions significantly differ
between rural and urban areas. Thus, we redefine the multinomial model such that:

12
∑=
+′+′
=
2,1,0)exp(
)exp()(
miijmijm
iijkijkiijk dxxβ
dxxx
δδβ
λ (3)
where di is the rural residence dummy variable (equal to one if individual i is a resident in
a rural area in year t). The parameter vector β measures the impact of the explanatory
variables on the probability of moving from employment state j in year t to any of the
other two categories k in year t+1 for the urban sample. The vector δ measures the extent
of the rural effect for each of the explanatory variables with the overall impact of the
explanatory variables in the rural sample given by β + δ. The significance of the rural
effect for each of the relevant issues can be tested by the hypothesis H0: δ = 0 on each of
the corresponding coefficients. These residence-specific models permit the calculation of
the predicted transitions for rural individuals supposing they live in an urban area,
thereby allowing another comparison between rural and urban labour market
performance. The probability (or the relative risk ratio) that a rural individual in
underemployment in year t will enter adequate employment in year t+1 to relative
staying in underemployment is )](exp[ 0101 δβ +iX , whereas if this same individual lived
in an urban area that probability would be ]exp[ 01βiX . The same reasoning applies to
the other transitions.
4. Data and Definitions
Data description and definitions
The data is derived from the first four years (1993-1996) of the Survey of Labor
and Income Dynamics (SLID). This consists of a longitudinal household survey
conducted by Statistics Canada of a national representative sample of approximately

13
15,000 households containing a total of around 31,000 individuals aged 16 and over. The
survey is designed to capture changes in the economic well being of individuals and
households over time and contains the detailed information on adults within households
needed to operationalise the different states of employment hardship and many socio-
demographic correlates of employment hardship. Individuals originally selected for the
sample are interviewed once or twice a year, as is any person who lives with the original
respondent. From this data a balanced panel was drawn of individuals aged between 18
or more in 1993 and 60 or less in 1996 that provided complete information at each of the
four interview dates. This sample consisted of 10,479 individuals, of which 24 percent
were classified as living in rural areas.
The SLID sample is drawn using a stratified, multi-stage design using probability
sampling. The principal stratification of the sample takes place by province, economic
regions, and urban and rural areas. Primary sampling units were selected in different
ways depending upon whether the relevant part of the stratum was deemed to be urban or
rural. The definition of the rural and urban samples is based upon the concept of the
relevant geographically limited labour market rather than a simple population based
measure. The Large Urban sample (henceforth the urban sample) is composed of Census
metropolitan areas and Census Agglomeration (CMA/CA) containing large urban areas,
together with adjacent urban and rural areas that have a high degree of economic and
social integration with that urban area (Howatson, 1995). The Rural and Small Town
sample (henceforth the rural sample) is composed of Non-CMA and Non-CA areas.
As discussed earlier, the measure of underemployment is a useful one to classify
different kinds of employment hardship. It goes beyond the limited measure of

14
unemployment (being out of the job and looking for one), to include the working poor as
well as discouraged, part-time, and seasonal workers with marginal or unstable labour-
market attachments. We follow Salinas’ (1982) definition of underemployment and refer
to the inability of the labour-force participants to earn poverty-level wages and salaries4
(125 percent of poverty-level income) through their labour-market activity over the
previous year (see also Nord, 1989 for further empirical applications of the concept).
Further, a labour force participant is defined as a non-student adult aged between 18 and
60 who has been employed or seeking employment for at least 15 weeks over the
previous year. The SLID data set provides a useful poverty-level threshold defined by the
Canadian Government (i.e., Low-Income Cut-off –LICO). The exact level of the
threshold is based on data from the Canadian family expenditure survey and varies by
household and community size, the latter being extremely important to us due to the
geographical component of our study as it alleviates/mitigates the cost-of-living problem
(Noreau, 1997). The concept of underemployment then, provides a comprehensive and
detailed way to assess the level of, and dynamics in, employment hardship in the
Canadian population.
Descriptive Analysis
Selected characteristics of workers (both underemployed and adequately
employed) are presented in Table 1. Slightly more than half of the sample was adequately
employed both in rural and urban areas with a larger proportion being underemployed in
4 Self-employed are also included. The strong presence of self-employed (e.g., farmers) in rural
areas justifies its inclusion in this study.

15
the rural sample (32%) versus the urban households (26.5%). In general, underemployed
and adequately employed workers show interesting differences across both regions. A
greater concentration of underemployment is found among the younger age categories,
those with less education, and the most un-skilled occupations. In addition, the
underemployed tend to consist of a higher proportion of female workers, particularly
those with young children which may indicate that family responsibilities affect women
employment decisions.
The rural underemployed are differentiated from their urban counterparts and the
adequately employed sample in several respects. First, they are the less educated group
as 42% have less than a high school education as compared to 25% or less of the workers
in the other three categories. The rural underemployed also tend to be concentrated in the
less-skilled occupations and working in resource-based activities. The proportion of
underemployed rural women is lower than that of urban ones, and the same applies to
rural women with young children. This may be because rural women are more likely to
drop out the labour force than to remain underemployed. These differences in socio-
demographic and labour market characteristics of the underemployed workforce, and
particularly in rural areas, are ultimately reflected in their annual earnings and hourly
wages that are significantly less than those adequately employed.
The mobility between employment states for individuals in rural versus urban
areas is indicated in Table 2 by the 'average’ movements over the 3 years (1994-1996) of
individuals into and out of adequate employment5. The estimated Markov transition
5 Note that because of the definition of employment hardship is based on previous year poverty
threshold, we lose 1993 year for the rest of the paper.

16
matrices (StataCorp 1997, p. 652) in Table 2 provide little evidence that rural individuals
are more likely to suffer employment hardship than their urban counterparts. In the rural
sample, 78% of those underemployed in given year were still in underemployment the
following year. In contrast, 17% moved to adequate employment, and the remaining
approximately 5% per cent were no longer in the labour force. The mobility of those
designated as underemployed in year t is practically identical over the rural and urban
sub-samples. The null hypothesis that regional location (rural vs. urban) is independent
of employment state in the previous period for the underemployed can be rejected at the
27% significance level which provides little support for the hypothesis that overall
mobility from the underemployment category differs over the two sub-samples.
However, for individuals who are adequately employed in a given year there is a
significant difference in the transitions to other employment states between the rural and
urban households. A lower proportion of the rural sample (90%) remains in the adequate
employment category the following year as compared to the urban sample (93%). In
addition, there is a greater probability that an adequately employed individual will move
into underemployment in the rural area (9%) versus 6% for someone in an urban area.
Statistically, the two distributions are significantly different (at 1 percent), providing
strong evidence that overall mobility from the adequately employed category differs over
the rural and urban samples.
While the information given in Table 2 provides a picture of the extent of overall
employment mobility, it assumes mobility is identical for all individuals. However, the
probabilities of moving between employment states will vary across individuals due to
individual characteristics, such as education level, and market characteristics. To control

17
these effects, it is necessary to statistically model the transition process, so we can find
out the extent to which these residential differences can be accounted for by other
observable characteristics. In the remainder of the paper we endeavour to do this.
5. Empirical Results
The next stage of the analysis examines the factors that influence the transition
from one employment status to another using a multinomial logit framework. The effects
of the sampling design used by the SLID data and in particular, the clustering,
stratification and unequal selection probabilities means that for analysis it cannot be
assumed that the sample is drawn from independent and identical distributions. If the
assumption of a randomly drawn sample were valid, estimation of equations (1) –(4)
could use the standard maximum likelihood estimator for the multinomial logit model.
However, the complex sample design means that these equations must be estimated using
a pseudo–maximum likelihood estimator otherwise the Type I error rates would be
substantially above their nominal level α. While the estimates of the parameters β, γ and
δ generated are therefore not efficient, they are consistent and the estimator of the
associated covariance matrix is robust (Eltinge and Sribney 1997). In the pseudo-
maximum likelihood function, it is assumed that sample clusters are independent, while
within cluster correlation is not specified but may be of any general form. Hence,
although not explicitly modelled the correlation which will occur between observations
of the same individual over time are accounted for within this approach (Lehtonen and
Pahkinen, 1994). Finally, the use of this estimation technique does preclude the use of

18
the likelihood ratio test so that any joint hypothesis test results must be calculated from
an adjusted Wald test procedure (Eltinge and Sribney, 1997).
The estimated results of the multinomial logit model are presented in Table 3.
The first column presents the relative risk ratios (RRR) of entering underemployment in
year (t+1) from adequate employment in year t. As expected, the chances of entering
underemployment diminish at an increasing rate with age. The higher the education
level the less likely individuals are to make a transition into underemployment (as
opposed to the reference category, which is less than a high school education). In
addition, and as anticipated, women are significantly more likely to move into
underemployment than their male counterparts, especially if there are young children in
the household.
In terms of labour market characteristics, individuals with high skill occupations
are less likely to slide into underemployment. Further, compared to those adequately
employed in service/financial sector (omitted category), those in manufacturing are
significantly less likely to (roughly 40 per cent) fall into underemployment, which is
consistent with the documented higher presence of low-paid, unstable, more
discontinuous jobs in the service sector (Nord, 1989). There are also differences by
regions with residents from British Columbia, the Prairies, Quebec and the Maritimes
being significantly more likely to move out of adequate employment as compared to
individuals from Ontario, which is expected due to the relative economic prosperity in the
province of Ontario6.
6 More disaggregated analysis at province level was also undertaken, however results did not
differ significantly for these presented here.

19
Concentrating now on the rural effect, the estimated parameter on the rural
dummy indicates that, other things equal, individuals living in rural areas are significantly
more likely (approximately 30%) to enter underemployment than their urban
counterparts. Therefore, even after controlling for socio-demographic and labour market
characteristics, the rural disadvantage observed in Table 2 remains.
The relative risk ratios of entering adequate employment for those who left
underemployment are in Column 2 of Table 3. Age has a weak (albeit insignificant)
increasing effect on the probability of entering adequate employment from
underemployment. Higher levels of education are associated with increasing transition
rates to adequate employment. Marriage increases the probability of moving into
adequate employment and, surprisingly being female with young children also increases
the transition rate into adequate employment although at a lower rate (RRR = 1.557) than
moving into underemployment from adequate employment (RRR = 3.792). However,
being a single female significantly decreases the likelihood of entering adequate
employment. Additionally, higher skill, professional jobs are associated with increasing
transition rates to adequate employment, as does employment in manufacturing (as
opposed to employment in service and financial sector). As for the regional dummies,
only those people in the Maritimes are significantly less likely to move up to adequate
employment than people from Ontario.
If we now consider rural differences, we find that, after controlling for differences
in observed characteristics, individuals living in rural areas are significantly more likely
(approximately 30 %) to move from underemployment into adequate employment from
one year to the next than their urban counterparts. Given the raw transitions results in

20
Table 2 indicated no significant difference in overall mobility from underemployment,
this is a somewhat surprising result. Further, as both entry and exit rates to and from
underemployment are higher in the rural sample, this suggests that the “persistence” of
rural underemployment is likely to be less but the extent of cycling between
underemployment and adequate employment seems higher in rural areas.
The last two columns of Table 3 present the relative risk ratios of transitions out
of the labour force from each type of employment. Although these findings should be
interpreted carefully as sample sizes are small, they suggest that the likelihood of
dropping out of the labour force from adequate employment in the previous year
significantly decreases with age. We also find that women with children are significantly
more likely to leave the labour force as are semi-skilled workers compared to unskilled
ones. As for the underemployed sample in year t, education decreases the transitions
from this category to out of the labour force. Women in general and those with young
children are more likely to leave the labour force. Lastly, living in a rural area and being
underemployed in period t significantly reduces the likelihood of exiting the labour force.
As hypothesized, the findings suggest that the lower the education level for an
individual worker, the greater the probability of moving into underemployment. Also,
for those workers with adequate employment, women are more likely to enter
underemployment or drop out of the labour force than their male counterparts, especially
if family responsibilities exist. Further, workers in high-skill occupations have lower
chances of exiting the labour market or entering underemployment relative to unskilled
workers. Finally, place of residence (rural/urban dichotomy) also seems strongly related
to the likelihood of labour market mobility. Living in a rural area significantly increases

21
the likelihood of entering underemployment from an adequate job. We also found how
the rural underemployed are more likely to remain so than to drop out of the labour force
as compared to their urban counterparts. However, living in a rural area does not simply
"disadvantage" workers as previous work has suggested. Rather, because rural
individuals who are underemployed are also more likely than those in urban areas to get
an adequate job than remain underemployed, mobility between underemployment and
adequate employment states appears higher in rural areas. Thus, after controlling for
socio-demographic and labour market characteristics, there does seem to be a regional
component to labour market mobility but its character is somewhat different from prior
expectations.
We move on now into our second question and search for significant differences
between rural and urban individuals in the determinants of labour force transitions. To
determine whether the effects of the socio-economic (supply) and labour market
(demand) covariates (xi) differ by rural/urban residence, we re-estimated the transition
equations (1-4) separately for rural and urban residents. The results of the regional
specific models presented in Table 4 include significance tests for the differences in
coefficients between the rural model and the urban one7. In general, across the two
samples, the explanatory variables have no significant differences on the probability of
making any of the transitions between employment states.
7 The statistical significance of coefficient differences across urban-rural models is computed by
dividing the absolute difference in the logistic regression coefficients by the square root of the
sum of their respective squared standard errors.

22
We hypothesized earlier that education was expected to have less of an impact on
the transitions out of underemployment in rural areas. The urban underemployed have a
higher chance of entering adequate employment the higher their education level as
compared to those in rural areas (but these differences are not statistically significant).
Also, a high school education reduces the probability of the urban underemployed
dropping out of the labour force to a greater extent than for the rural underemployed. We
do observe for the rural adequately employed sample, that the highest the level of
education does not necessarily lower the chances of entering underemployment.
However, as high school level adequately employed workers in rural areas are roughly
52% less likely to enter underemployment ( 477.0738.0ˆˆ === −+ eeRRR δβ ), whereas the
probability decreases to 40% when we consider more than high school level (RRR
= 598.0514.0 =−e ). Thus, there is weak evidence that education levels in rural areas have a
lower impact on the transitions out of underemployment than in urban areas.
Further, we also hypothesized a significantly different effect of gender in rural
areas. Accordingly, we find that rural women are significantly less likely than their male
counterparts to enter adequate employment )318.0( 145.1 == −eRRR , and this likelihood
significantly differs from urban women ( 482.0728.0 == −eRRR ) at a 10% significance
level (columns 3 and 4 Table 4 –Other Demographic characteristics section). Further,
underemployed urban women are more likely to drop out of the labour force than their
rural counterparts (albeit not significant). Thus, though women seem equally likely to
enter underemployment (columns 1 and 2 Table 4) both in rural and urban areas, rural
women seem significantly more likely to remain underemployed than moving back into
adequate employment or dropping out of the labour force. The presence of young

23
children does not seem to especially constrain rural women as compared to their urban
counterparts.
Lastly, we consider the greater presence of secondary/low-skill job types in rural
areas to increase labour force instability among rural workers. Looking at columns 1 and
2 –Occupation section, we observed how the higher the level of skills the less likely
workers are to slip into underemployment, however this relationship is less strong among
rural workers (although not significant h). This might be a weak evidence of the
suspected greater instability in rural areas, which seems supported with the results in
columns 5 and 6 where rural worker seem far more likely to drop out of the labour force
than urban ones (not significant difference except for semi-professional, technical and
middle management). Further, underemployed workers seem less likely to drop out of the
labour force in rural areas than their urban counterparts, and they are less likely to enter
adequate employment than urban workers at the higher level of skill occupations (i.e.,
professional and semi-professional, technical and middle management) although results
are not significantly difference between the two groups.
To judge the empirical significance of differences in the responses across the rural
and urban sample, we use the estimated urban and rural coefficients from Table 4 to
calculate predicted transition probabilities for the rural sample. The values using the
urban coefficients may be interpreted as the average predicted transition probabilities for
the rural sample if rural behaviour were identical to urban ones. Hence, comparing these
predicted values with the predictions using the estimated rural coefficients provides a
method of measuring the overall impact of rural-urban differences while controlling for
observed characteristics.
24
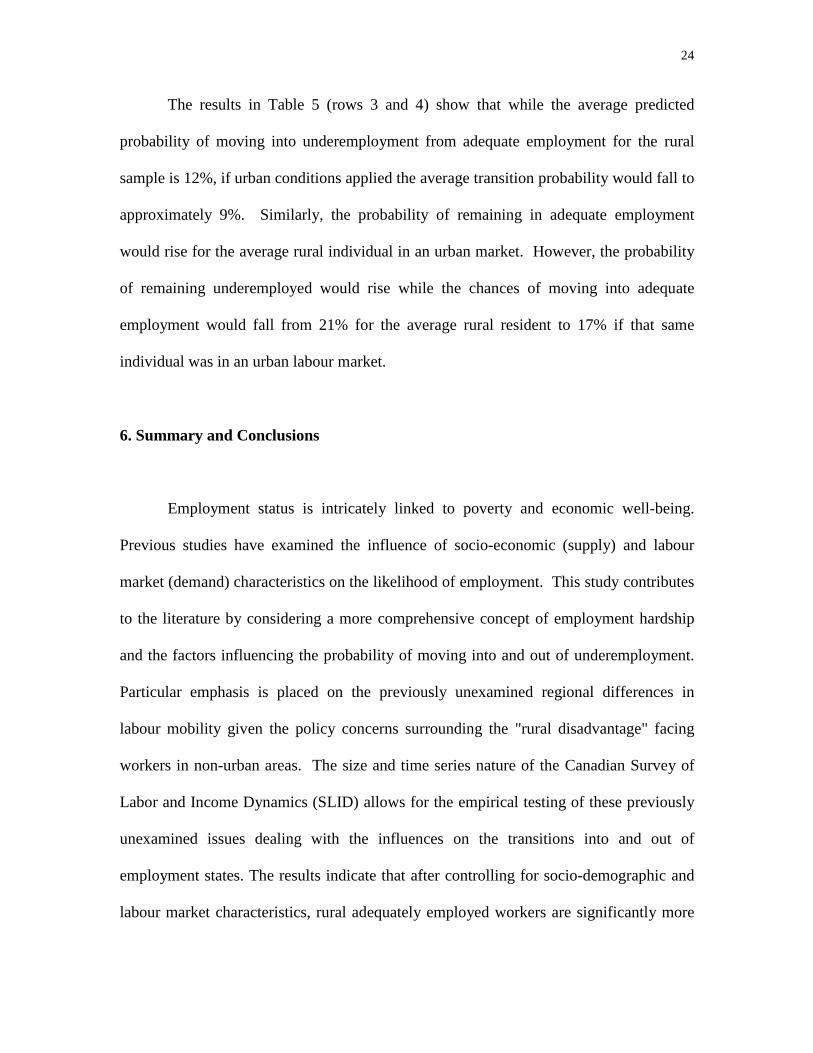
The results in Table 5 (rows 3 and 4) show that while the average predicted
probability of moving into underemployment from adequate employment for the rural
sample is 12%, if urban conditions applied the average transition probability would fall to
approximately 9%. Similarly, the probability of remaining in adequate employment
would rise for the average rural individual in an urban market. However, the probability
of remaining underemployed would rise while the chances of moving into adequate
employment would fall from 21% for the average rural resident to 17% if that same
individual was in an urban labour market.
6. Summary and Conclusions
Employment status is intricately linked to poverty and economic well-being.
Previous studies have examined the influence of socio-economic (supply) and labour
market (demand) characteristics on the likelihood of employment. This study contributes
to the literature by considering a more comprehensive concept of employment hardship
and the factors influencing the probability of moving into and out of underemployment.
Particular emphasis is placed on the previously unexamined regional differences in
labour mobility given the policy concerns surrounding the "rural disadvantage" facing
workers in non-urban areas. The size and time series nature of the Canadian Survey of
Labor and Income Dynamics (SLID) allows for the empirical testing of these previously
unexamined issues dealing with the influences on the transitions into and out of
employment states. The results indicate that after controlling for socio-demographic and
labour market characteristics, rural adequately employed workers are significantly more

25
likely to enter underemployment than urban ones. Surprisingly however, once they are
underemployed, they have a higher probability of re-entering adequate employment the
following period, suggesting that the extent of cycling between underemployment and
adequate employment seems higher in rural areas. We also found that the rural
underemployed are more likely to remain underemployed than to drop out of the labour
force as compared to their urban counterparts which may be a sign of the different labour
market characteristics in rural areas. Further, we also found weak evidence that education
level in rural workers has less of an impact on the probability out of underemployment
than in urban areas. In addition, women are significantly less likely than their male
counterparts to enter adequate employment, and this effect is more pronounced in rural
areas. Rural women are significantly more likely to remain underemployed than to move
back into adequate employment or drop out of the labour force. The presence of young
children does not seem to especially constrain employment for rural women as compared
to their urban counterparts. Overall, our findings seem to corroborate the apparently
more precarious position of rural individuals in terms of labour market transition in and
out of adequate employment, which should be taken into account when evaluating
employment hardship in rural Canada.
26
REFERENCES
Bane Mary J. And David T. Ellwood. 1986. Slipping into and out of poverty: The
dynamics of spells. Journal of Human Resources, 21, 1-23.
Bluestone, Barry and Bennett Harrison. 1982. The Deindustrialization of America. New
York: Basic Books.
Bryden, John and Ray Bollman. 2000. Rural employment in industrialised countries.
Agricultural Economics, 22, 185-197.
Clark, Willian A. and Suzanne Davis Withers. 1999. Changing Jobs and Changing
Houses: Mobility Outcomes of Employment Transitions. Journal of Regional Science,
39, 653-673.
Clogg, Clifford C. 1979 Measuring Underemployment: Demographic Indicators for the
United States. New York: Academic Press.
Devine, T. J., and N. M. Keifer. 1993. The empirical status of job search theory. Labor
Economics 1, 3–24.
Dickie, Mark and Shelby Gerking. 1998. Interregional wage disparities, relocations costs
and labor mobility in Canada. Journal of Regional Science, 38, 61-87
Doeringer, P.B. 1984. Internal labor markets and paternalism in rural areas In Osterman,
P., (ed.) Internal Labor Market,Cambridge: MIT. pp.272-289
Eltinge, J. and W. Sribney. 1997. Some basic concepts for the design based analysis of
complex survey data. STB 31, (1997): 208-212. College Station, TX: Stata Corporation.
Howatson, l. and I. Earl. 1995. A New Approach to Non-CMA/CA areas. Statistics
Canada, Working Paper N. 31.
27
Hsueh, Sheri, and Marta Tienda. 1994. Race and labor force instability. Pp. 95–100 in
1993 Proceedings of the Annual Meetings of the American Statistical Association, Social
Statistics Section, pp. 95–100, American Statistical Assoc., Washington, DC.
Jensen, Leif, and D.J. Eggebeen. 1994. Nonmetropolitan poor children and reliance on
public assistance. Rural Sociology, 59, 45-65.
Jensen, Leif, Findeis, Jill L, Hsu, Wan-Ling and Jason P. Schachter. 1999. Slipping into
and out of underemployment: Another disadvantage for nonmetropolitan workers? Rural
Sociology 64, 417-438.
Lehtonen, Risto and Erkki Pahkinen 1994 Practical methods for design and analysis of
complex surveys. New York: John Wiley.
Lichter, Daniel T. and Janice Costanzo. 1987. Nonmetropolitan underemployment and
labor force composition. Rural Sociology, 52, 329-344.
Lichter, Daniel T. 1989. The Underemployment of American Rural Women: Prevalence,
Trends, and Spatial Inequality. Journal of Rural Studies, 5,199-208.
Lichter, Daniel T. and David Landry. 1991. “Labor force transitions: the stratification of
male and female workers” in Althauser R. and M. Wallace (eds.) Research in Social
Stratification and Mobility. Vol. 10. Greenwich, CT: JAI Press. pp. 73-87
McLaughlin, D.M. and L. Perman. 1991. Returns vs. Endowments in the Earnings
attainments process for metropolitan and nonmetropolitan men and women. Rural
Sociology 56, 339-365.
Moen, Phyllis. 1985. “Continuities and Discontinuities in Women’s Labor Force
Activity” In G.H. Elder ed., Life Course Dynamics: Trajectories and Transitions, 1968-
1980. Ithaca, N.Y.: Cornell University Press, pp.113-55.
28
Neumark D, Polsky D, Hansen D. 1999. Has job stability declined yet? New evidence for
the 1990s. Journal of Labor Economics 17 (4): S29-S64, Part 2
Nord, Stephen. 1989. The relationships among labor-force participation, service-sector
employment , and underemployment. Journal of Regional Science, 29, 407-421.
Noreau, Natalie, Webber, Marianne, Giles, Phil and Alison Hale. 1997. Crossing the Low
Income Line. Statistics Canada. Catalogue No. 97-11.
Salinas, Patricia W. 1982. Longevity of Individual Low Income Employment in Growing
and Declining Metropolitan Areas. Journal of Regional Science, 22, 367-371.
Sheets, R. G., Stephen Nord, and John J. Phelps. 1987. The Impact of Service Industries
on Underemployment in Metropolitan Economies. Lexington, MA: Lexington Books.
Stabler, Jack C. 1999. Rural America: A challenge to regional scientists. Annals of
Regional Science, 33, 1-14.
STATACORP. 1997. Stata Statistical Software : Release 5.0 (Reference Manuals).,TX:
Stata Corporation.
Statistics Canada. 1999. Survey of Labor and Income Dynamics: Microdata User’s
Guide. Ottawa, Canada.
Tigges, Leann M. and Deborah M. Tootle. 1990. Labor supply, labor demand, and men’s
underemployment in rural and urban labor markets. Rural Sociology 55, 328-356.

29
TABLE 1: Socio-Economic Characteristics of Canadian Workers aged 18-60
by employment status and place of residence
Group Underemployment Adequate employmentRural Urban Rural Urban
Age Group< 25 7.07 5.49 2.2 0.925-34 25.55 27.82 21.55 19.4735-44 32.86 31.78 38.58 37.51>44 34.52 34.91 37.68 42.03
EducationLess High School 41.69 24.09 24.17 15.00High School 19.25 20.67 18.99 16.07More High School 39.06 55.24 56.84 68.93
Other Demographic Characteristics% Women 57.59 61.36 32.06 36.12% Married 77.58 69.52 81.48 77.86% Women with young children 11.31 13.11 5.3 5.9
OccupationProfessional 2.86 4.61 11.59 18.14Semi-Professional, TechnicalMiddle management
5.37 7.42 9.29 11.78
Supervisor 8.94 12.73 19.00 19.32Skilled, Worker employee, Farmer 10.88 15.37 19.25 20.74Semi-skilled worker 31.54 34.15 18.71 15.58Unskilled-worker 40.41 25.73 22.17 14.43
IndustryResource based activities 16.78 3.30 13.20 3.69Manufacturing 12.89 10.58 19.26 19.59Construction, Distribution and Transport 31.72 36.93 28.56 28.65Service and Financial sector 38.60 49.20 38.98 48.07
Total Earnings (inc. self-employed) 9978.92 12493.1 36058.38 44378.59Hourly wages (employees only) 10.28 10.72 17.48 20.38Na 4304
(31.73)5047
(26.50)6192
(51.54)10767(57.4)
a The remainder of the sample was out of the labour force in year t (16.73% for urban and 16.10% forrural)

30
TABLE 2: Transitions from labour force states (%)State Period t+1
State Period t Underemp Ad. Emp Out LFRural 78.5 16.95 4.55
UnderemploymentUrban 77.87 16.31 5.82
52.13)2(2 =χ (p-value 0.2724)Adequate Rural 8.57 90.03 1.4Employment
Urban 5.85 92.94 1.21615.45)2(2 =χ (p-value 0.0008)

31
TABLE 3Multinomial Logistic Regression for Transition
From one employment Type to another(Relative Risk Ratios - eββββ)
EnteringUnderemploym
ent
EnteringAdequate
Employment
Exiting the Labour Force
Independent VariableFrom
AdequateEmployment
FromUnderemploym
ent
FromAdequate
Employment
FromUnderemploym
ent
Age VariablesAge 0.826** 1.056 0.700** 1.004Age Square 1.002** 0.999* 1.005** 1.000
EducationHigh School 0.684** 1.190 0.972 0.463**More High School 0.712** 1.494** 0.778 0.437**
Other DemographicCharacteristics
Female 1.557** 0.429** 1.342 2.134**Married 1.001 1.278 1.348 0.930Women with young children 3.792** 1.557** 6.400** 3.249**
OccupationProfessional 0.206** 3.014** 0.942 0.260**Semi-Professional, TechnicalMiddle management
0.344** 2.672** 0.717 0.731
Supervisor 0.571** 1.981** 1.730 0.500Skilled, Worker employee,Farmer
0.606** 1.768** 1.188 0.673
Semi-skilled worker 0.711** 0.973 2.051** 0.430**Industry
Resource based activities 0.894 0.845 0.9601 0.717Manufacturing 0.631** 1.850** 0.904 1.604Construction, Distribution andTransport
1.008 1.051 0.384** 0.919
Regional VariablesBritish Columbia 1.461* 1.275 0.707 0.511*Prairies 1.418** 0.848 0.875 0.474**Quebec 1.476** 0.808 1.100 0.605**Maritimes 1.480** 0.546** 1.568 0.730Rural Dummiesa 1.322** 1.321** 1.151 0.664**
N Moved 824 973 146 306% of Sampleb 6.45 16.48 1.25 5.48a Likelihood ratio test of joint significance of the rural dummies was undertaken in both regressions. Theresults indicate that the variables were significant at p<0.1b It refers to the percentage of people within certain employment type in time t that move to anotheremployment type in time (t+1).Omitted categories: Less than High School, Ontario, Unskilled Worker, Service and Financial sector, 1996.* p<0.1** p<0.05

32
TABLE 4Log-likelihood parameter estimates for transition from one employment type to
another – specific rural/urban estimatesEntering
UnderemploymentEntering Adequate
Employment Exiting the Labour ForceFrom Adequate
EmploymentFrom
UnderemploymentFrom Adequate
EmploymentFrom Underemployment
Independent Variable Urban Rural Urban Rural Urban Rural Urban RuralAge Variables
Age -0.214** -0.159** 0.070 0.028 -0.257* -0.545** -0.016 0.062Age squared 0.002** 0.002** -0.001 -0.0005 0.004** 0.007** 0.001 -0.0002
EducationHigh school only
-0.144-
0.738**!0.250 0.075 0.007 -0.167 -0.933** -0.112!
More than high school-0.222 -0.514** 0.475** 0.292** -0.332 -0.249 -0.934** -0.359
Other DemographicCharacteristics
Female0.443**
0.415** -0.728** -1.145**!
0.052 0.812* 0.966** 0.194*!
Married -0.058 0.189 0.326* -0.028 0.366 0.231 -0.095 0.067Women w/ children 1.476** 0.904** 0.389* 0.571** 2.276** 0.514*! 1.283** 0.799**
OccupationProfessional -1.595** -1.596** 1.160** 0.752 -0.640 1.985**! -1.58** -0.543Semi-Professional,Technical Middlemanagement -1.067** -1.146** 1.038** 0.721* -0.839* 1.539**! -0.158 -0.984Supervisor
-0.661** -0.286 0.547** 1.175** 0.401 1.309* -0.588 -3.226**!Skilled, Workeremployee, Farmer -0.533** -0.423* 0.508** 0.746** 0.049 0.886 -0.342 -0.794
Semi-skilled worker -0.433** -0.168 -0.099 0.209 0.521 1.628**! -0.913** -0.744**Industry
Resource basedactivities -0.329 -0.074 -0.356 -0.293 -1.341** 1.170**! -0.004 -0.763*Manufacturing -0.398** -0.639** 0.592** 0.693** -0.290 0.666 0.573 0.197Construction,Distribution andTransport 0.046 -0.154 0.191 -0.336*! -0.969** -0.914 0.072 -0.662*
Regional VariablesBritish Columbia 0.482* 0.013 0.061 1.022**! -0.207 -0.615 -0.752* -0.384
Prairies 0.412** 0.141 -0.308* 0.186! 0.074 -0.639-0.917**
-0.157Quebec 0.388 0.394 -0.199 -0.265 0.094 -0.039 -0.524* -0.234
Maritimes 0.465** 0.220 -0.582** -0.559** 0.712* -0.098 -0.621** 0.250!N Moved 577 427 659 522 130 72 216 179* p<0.05** p<0.1! Coefficient significantly different from that for urban areas at p<0.1

33
TABLE 5Average Predicted Probabilities
(Using Rural and Urban Coefficients for Rural Characteristics- Standard Errors in brackets)
Period t EstimatedCoefficients used
Underemployment AdequateEmployment
Out of theLabour Force
Rural 0.7371(0.0035)
0.2177(0.0039)
0.0451(0.0007)
Underemployment Urban 0.7676(0.0023)
0.1705(0.0026)
0.0618(0.0011)
AdequateRural 0.1213
(0.0018)0.8647(0.0017)
0.0139(0.000)
Employment Urban 0.0929(0.0015)
0.8873(0.0017)
0.0196(0.0005)

34