Managing Global Transitions 15_3
107
Volume 15 Number 3 Fall 2017 editor Suzana Laporšek
-
Upload
khangminh22 -
Category
Documents
-
view
1 -
download
0
Transcript of Managing Global Transitions 15_3

Volume 15Number 3
Fall 2017
editorSuzana Laporšek

Managing Global TransitionsInternational Research Journalissn 1854-6935 · www.mgt.fm-kp.si
editorSuzana Laporsek, University of Primorska,Slovenia, [email protected]
associate editorRobert D. Hisrich, Thunderbird School ofGlobal Management, usa,[email protected]
managing and production editorAlen Ježovnik, University of Primorska,Slovenia, [email protected]
editorial boardJani Bekő, Univerza v Mariboru, Slovenia,[email protected]
Heri Bezić, University of Rijeka, Croatia,[email protected]
Guido Bortoluzzi, University of Trieste, Italy,[email protected]
Branko Bučar,Walsh University, usa,[email protected]
Suzanne Catana, State University of NewYork, Plattsburgh, usa,[email protected]
David L. Deeds, University of St. Thomas,usa, [email protected]
Evan Douglas, Griffith Universitiy, Australia,[email protected]
Dean Fantazzini,Moscow School ofEconomics, Russia [email protected]
Jeffrey Ford, The Ohio State University, usa,[email protected]
William C. Gartner, University of Minnesota,usa, [email protected]
Noel Gough, La Trobe University, Australia,[email protected]
Henryk Gurgul, agh University of Scienceand Technology, Poland,[email protected]
José Solana Ibáñez, University Centre ofDefence San Javier – Technical Universityof Cartagena, Spain,[email protected]
András Inotai, Hungarian Academy ofSciences, Hungary,[email protected]
Hun Joon Park, Yonsei University, SouthKorea, [email protected]
Renata Karkowska, University of Warsaw,Poland, [email protected]
Tanja Kosi Antolič, Institute ofMacroeconomic Analysis andDevelopment, Slovenia,[email protected]
Leonard H. Lynn, Case Western ReserveUniversity, usa, [email protected]
Monty Lynn, Abilene Christian University,usa, [email protected]
Massimiliano Marzo, University of Bologna,Italy, [email protected]
Luigi Menghini, University of Trieste, Italy,[email protected]
Karim Moustaghfir, Al Akhawayn Universityin Ifrane, Morocco, [email protected]
Kevin O’Neill, State University of New York,Plattsburgh, usa,[email protected]
Hazbo Skoko, Charles Sturt University,Australia, [email protected]
David Starr-Glass, State University of NewYork – Empire State College, usa,[email protected]
Ian Stronach, The University of Manchester,uk, [email protected]
Marinko Škare, University of Pula, Croatia,[email protected]
Nada Trunk Širca, International School ofSocial and Business Studies, Slovenia,[email protected]
Irena Vida, Univerza v Ljubljani, Slovenia,[email protected]
Manfred Weiss, Johann Wolfgang GoetheUniversity, Germany,[email protected]
indexing and abstractingManaging Global Transitions is indexed/listed in the International Bibliographyof the Social Sciences, EconLit, doaj,Erih Plus, EconPapers, Cabell’s, ebsco,and ProQuest.

Managing Global TransitionsInternational Research Journalvolume 15 · number 3 · fall 2017 · issn 1854-6935
215 Maximizing Decision Making Style and ManagerialEffectiveness: Understanding How Maximizing and Locusof Control Impact Managers’ Performance on the JobBrandon William Soltwisch and Keiko Krahnke
231 The Unemployment-Stock Market Relationshipin South Africa: Evidence from Symmetricand Asymmetric Cointegration ModelsAndrew Phiri
255 Business Model Concept: An IntegrativeFramework ProposalMarko Perić, Vanja Vitezić, and Jelena Ðurkin
275 Clusters in the Renewable Energy Sector in PolandMichał Staszków, Michał Borychowski, and Filip Nowacki
291 The Growth Challenge of Western smes in EmergingMarkets: An Exploratory Framework and PolicyImplicationsMitja Ruzzier, Yusaf H. Akbar, Guido Bortoluzzi,and Andrea Tracogna
315 Abstracts in Slovene
https://doi.org/10.26493/1854-6935.15_3

aims and scopeTransition is the widely accepted term forthe thorough going political, institutio-nal, organizational, social, and technolo-gical changes and innovations as well aseconomy-wide and sector changes in soci-eties, countries and businesses to establishand enhance a sustainable economic enviro-nment.Managing Global Transitions is a social sci-ences’ interdisciplinary research journal.The aim of this journal is to publish rese-arch articles which analyse all aspects oftransitions and changes in societies, eco-nomies, cultures, networks, organizations,teams, and individuals, and the processesthat are most effective in managing largescale transitions from dominant structuresto more evolutionary, developmental forms,in a global environment. The journal seeksto offer researchers and professionals theopportunity to discuss the most demandingissues regarding managing of those transi-tions to establish and enhance a sustainableeconomic environment.
topics covered• Business (accounting, entrepreneurship,finance, marketing, informatics, techno-logy, innovations, . . .)
• Business law, law and economics, busi-ness ethics
• Demographic and labour economics, hu-man resources, knowledge management
• Econometric and mathematical model-ling of business and economic processes,operations research
• Globalisation, international economics• Historical transitions, transition experi-ments, transition pathways and mechani-sms, visions of the future
• Macroeconomics (growth, development,business cycles, government regulation,fiscal policy, monetary and public econo-mics, welfare, . . .)
• Microeconomics (theory and applica-tions, industrial organisation, marketstructure, competition, innovation, . . .)
• Sociological, psychological and politolo-gical issues of transitions
• Sustainability issues, environmental busi-ness and economics
• Urban, rural, regional economics
contentsManaging Global Transitions publishesoriginal and review articles and case studies.
submissionsThe manuscripts should be submitted ase-mail attachment to the editorial office [email protected]. Detailed guide for authorsand publishing ethics statement are availa-ble at www.mgt.fm-kp.si.Managing Global Transitions is an openaccess journal distributed under the termsof the Creative Commons cc by-nc-nd4.0 License. No author fees are charged.
editorial officeUniversity of PrimorskaFaculty of ManagementCankarjeva 5, 6104 Koper, [email protected] · www.mgt.fm-kp.si
published byUniversity of Primorska PressTitov trg 4, 6000 Koper, [email protected] · www.hippocampus.si
Revija Managing Global Transitions je na-menjena mednarodni znanstveni javnosti;izhaja v angleščini s povzetki v slovenščini.Izid revije je finančno podprla Javna agen-cija za raziskovalno dejavnost RepublikeSlovenije iz sredstev državnega proračuna iznaslova razpisa za sofinanciranje izdajanjadomačih znanstvenih periodičnih publikacij.

Maximizing Decision Making Styleand Managerial Effectiveness: UnderstandingHow Maximizing and Locus of Control ImpactManagers’ Performance on the JobBrandonWilliam SoltwischUniversity of Northern Colorado, [email protected]
Keiko KrahnkeUniversity of Northern Colorado, [email protected]
This study investigates the impact ofmaximizing decision-making style onmanagerial effectiveness with a group of 319 working managers in the us.Findings suggest that managers who apply a maximizing decision makingstyle weremore effective than those who satisfice. It was also found that lo-cus of control plays a mediating role in this relationship. Maximizers whohave an internal locus of control were significantly more likely to be effec-tive in their positions. The results suggest that the combination of maxi-mizing and internality of control provide a powerful recipe for managerialsuccess. Results, implications, and future research directions are discussedin relation to the current findings.Key Words:maximizing, satisficing, decision making, managerialeffectivenessjel Classification: l2, m12https://doi.org/10.26493/1854-6935.15.215-230
IntroductionAs individuals face overwhelming amounts of information, they are lesslikely to find the optimal solution due to information processing limi-tations (Simon 1972). At the time, bounded rationality was proposed asa cognitive constraint hindering decision makers from finding the bestchoice. Research has recently built on Simon’s earlier work to show thatindividuals differ in their preference toward finding the optimal solution(see Schwartz et al. 2002; Diab, Gillespie, and Highhouse 2008; Lai 2010).Maximizers prefer to spend more time and energy to find the best pos-sible choice, while satisficers tend to settle for ‘good enough’ options thatmeet their minimum criteria (Schwarz et al. 2002).
Managing Global Transitions 15 (3): 215–230

216 Brandon William Soltwisch and Keiko Krahnke
For example, a maximizer may search extensively to find the best cam-era by browsing many different consumer reports and product featuresbefore selecting. On the other hand, a satisficer would be less likely to in-vestigate as many products, andmore likely to select the first product thatmeets their minimum standards. Because of their intensive search, max-imizers sometimes experience negative psychological outcomes associ-ated with a decision because they may look at what could have been donedifferently. This ‘grass is greener on the other side of the fence’ philoso-phy may cause maximizers to be less happy with their decision outcomes(Bergman, Nyland, and Burns, 2007; Polman 2010; Schwartz at al. 2002)and experience more post decision regret (Schwartz et al. 2002; Parker,Bruine de Bruin, and Fischhoff 2007; Purvis, Howell, and Iyer 2011).However, there are also some benefits to a maximizing approach.
Maximizers prefer to have more options available when making deci-sions (Chowdury, Ratnershwar andMohanty 2009) and identify a greaternumber of potential outcomes of those options, both positive and neg-ative (Polman 2010). Their additional effort to seek out more optionspays off in the career search process by landing better jobs. By apply-ing for more jobs, maximizers ended up with starting salaries of about$7,500 higher than satisficers (Iyengar, Wells and Schwartz 2006). Max-imizers play an important role as devil’s advocate since they are morelikely to compare options (Schwartz et al. 2002) and engage in coun-terfactual thinking to produce alternative arguments (Leach and Patall2013). They also have a more optimistic life view as they see positive re-sults within their reach (Lai 2010). Although most of the work on thistopic thus far has focused on psychological processes and outcomes, thisstudy provides a first look at how this decision-making preference im-pacts managers’ performance. Specifically, it investigates the relationshipbetween decision making styles and managers’ effectiveness on the jobusing a sample of 319 working managers in the us. The data suggest thatmanagers who apply a maximizing decision making style are more effec-tive than those who satisfice. In addition, this study identifies the role oflocus of control in mediating the relationship, finding that the combina-tion of a maximizing decision making style and internal locus of controlprovides a powerful recipe for effective managers.
Maximizing and Managerial EffectivenessBroadly, effective managers deliver results and add value to the com-pany. They do this by tackling many different challenges and roles within
Managing Global Transitions

Maximizing Decision Making Style and Managerial Effectiveness 217
the company. Mintzberg (1973) observed that all managerial jobs sharesimilar characteristics and can be described by three broad roles: inter-personal, informational, and decisional. He noted that managers can beeffective in different jobs by exuding various combinations of skills inthese categories. Others have identified that effective managers work onboth current and future performance issues simultaneously. For example,Gupta (1996, 399) has defined managerial effectiveness as ‘the ability of amanager to carry out the activities required of his position while achiev-ing the results both current and in terms of developing further potential.’This forward-thinking mentality helps managers develop future strate-gies to achieve long-term performance.Personal characteristics that make it easier to get along with others in-
creasemanagerial effectiveness (Nair and Yuvaraj 2000). Successfulman-agers are able to find amatch between their personality type andmanage-rial role. For example, Rastogi andDave (2004) found that type B person-alities are more effective at managing production departments, and typeA personalities are better suited tomanage marketing departments. Theynote that constructive management requires a clear formulation of goalsand specific steps to achieve them, including motivating others to worktoward those goals. Interestingly, they found that type B personalities areoftenmore successful than type As in topmanagement positions becausethey are more patient and take a broader perspective on problems (Ras-togi and Dave 2004).In the last few decades, management scholars have applied positive
psychology knowledge tomanagement in order to better understand howpeople can flourish in organizational context. Positive organizational be-havior shifted leaders’ focus from fixing problems and weaknesses toleveraging strengths, and positive psychological resources have been con-sidered to have desirable outcomes on work performance (Luthans 2002;Youssef and Luthans 2007).The social and emotional climate of the workplace has a large influ-
ence on how people interact and engage with their work. Positive en-vironments increase motivation, allowing managers to achieve superiorperformance. On the other hand, negative environments make workersuncomfortable, leading to worse performance. Because of this, consci-entious leaders have more productive exchanges with their subordinates,allowing them to be more effective (Deluga 1998). A successful managerknows how their workforce is feeling at any given time. Emotional in-telligence is the ability to control one’s own and others’ emotions in so-
Volume 15 · Number 3 · Fall 2017

218 Brandon William Soltwisch and Keiko Krahnke
cial situations (Mayer et al. 1997). A study of 305 managers showed thatemotionally intelligent managers are more effective than those who arenot (Gupta 2010). The ability to empathize with others and control theirown emotions during heated situations allows managers to better navi-gate complex social interactions, creating positive and productive work-ing environments.Managers need to understand how their decisions will impact those
around them in addition to themselves. They must take a broad focusto understand how different alternatives may impact various stakeholdergroups, and their businessmoving forward. Individualswho are emotion-ally intelligent are more likely to apply a maximizing decision makingstyle as they search for more information to identify the best solutionsfor themselves and others over time (Soltwisch and Krahnke in press).Thus, those who take more time to analyze their options may be morein tune with how their decisions impact their own and others’ emotionalstates. This is a critical skill for successfully leading teams through diffi-cult projects where the results may not be achieved for some time. Beingaware of their own actions and the impact of their decisions is an impor-tant skill for leaders facing increasingly complex challenges. Taking timeto reflect on their options and possibilities would allow us to put ourselvesin the shoes of others who operate in other systems. Senge and Krahnke(2013) call this ability transcendent empathy.Effective management has also been associated with specific decision
making processes. Understanding counterarguments and others point ofview allows managers to make more informed decisions. Research hasfound that the practices of dialectic inquiry (Mason andMitroff 1981) anddevil’s advocate (Cosier and Rechner 1985) have produced better decisionmaking results than consensus building (Schwenk 1988). The basic idea isthat analyzing competing ideas and understanding different perspectivesor arguments helps the decision maker to discover the truth. Managerswho ignore counterarguments are more likely to overlook significant ob-stacles that may hinder performance. Others have linked decision mak-ing process to effectiveness, showing that a more rational decision mak-ing process leads to more effective decision outcomes. In a longitudinalfield study of 52 major decisions in 24 companies, Dean and Sharfman(1996) found that managers who applied procedural rationality, meaningthat they took more time to collect information and use that informationin making a choice, were far more effective in making strategic decisionsthat met performance objectives. Applying a rational process allows de-cision makers to form theories about which strategies will be successful
Managing Global Transitions

Maximizing Decision Making Style and Managerial Effectiveness 219
as they gather information about different options (Dean and Sharfman1996).Maximizers tend to utilize a rational decision making process as they
search for more information to reach optimal solutions (Schwarz et al.2002). They engage inmore counterfactual thinking by producingmulti-ple arguments to inform their decisions (Leach and Patall 2013). This roleof devil’s advocate may help them more accurately evaluate the opportu-nities and threats in their environment before making a decision. Maxi-mizers prefer to have additional options available whenmaking decisions(Chowdury, Ratnershwar, and Mohanty 2009), and identify more poten-tial outcomes of those options (Polman 2010). Doing so is not easy in ourfast-paced society, but maximizers take the time to look at issues moredeeply and critically. They practice mindfulness by not making reactive,quick judgments and jumping to premature conclusions. In addition,maximizers are more emotionally intelligent (Soltwisch and Krahnke inpress), allowing them to have more positive interactions with colleaguesand build support to achieve their goals. Because of this, it is predictedthatmanagerswho apply amaximizing decisionmaking stylewill achievesuperior performance than those who satisfice:h1 Managers who maximize will be more effective than those who sat-
isfice.
Locus of Control and Leadership BehaviorLocus of control plays an important role in individuals’ behavior and de-cision making, and its effects have been studied in a number of disci-plines. Rotter (1990) defined the internal locus of control as ‘the degreeto which persons expect that a reinforcement or an outcome of their be-havior is contingent on their own behavior or personal characteristics’and the external locus of control as ‘the degree to which persons expectthat the reinforcement or outcome is a function of chance, luck, or fate, isunder the control of powerful others, or is simply unpredictable’ (p. 489).In other words, those with internal locus of control tend to believe thatthey can make a difference and also accept the blame for negative situa-tions or failures. People with external locus of control may assume thatthey cannot do anything to control the situation and attribute both theirsuccesses and failures to the external circumstances or luck.Studies conducted to date have revealed that internal locus of con-
trol is associated with positive leadership behavior. Leaders with inter-nal locus of control were found to cope with stress better and use task-centered coping behaviors more than those with external locus of control
Volume 15 · Number 3 · Fall 2017

220 Brandon William Soltwisch and Keiko Krahnke
(Anderson 1977). Miller and Toulouse’s (1986) empirical investigation onthe relationship between ceos personalities and their performance in-dicated that ceos with internal locus of control were more innovativeand future-oriented. A more recent study by Howell and Avolio (1993)discovered that transformational leadership measures; such as charisma,intellectual stimulation, and individualized consideration; were associ-ated with high internal locus of control and positive business unit per-formance. Baldacchino et al. (2016) investigated the impact of organiza-tional culture and individual audit personnel characteristics on dysfunc-tional audit practices. People with external locus of control tend to feelpowerless because they perceive that they have no control. A possible ex-planation is that these individuals may manipulate or deceive others topractice some control over the environment (Gabe and Dangello 1994).Baldacchino et al.’s study (2016) confirmed the earlier research and con-cluded that external locus of control was a significant predictor of dys-functional audit behavior, meaning that individuals with external locusof control are more accepting of dysfunctional audit behavior than thosewith internal locus of control.Forte’s study (2005) investigated managers’ locus of control and the
likelihood of each individual’s engaging in unethical behavior in an orga-nization. The study revealed that managers with internal locus of controlthought that they themselves decided what was ethical and appropriatebut those with external locus of control relied on others to determinewhat was appropriate (Forte 2005). Implications of this study are signif-icant. Internal or external locus of control in managers influences theirmoral reasoning and ultimately their ethical decision making. Lookingto others for moral reasoning can be a concern.Internal locus of control has also been found to be positively linked
to concern for global warming (Mostafa 2016), and this finding is con-sistent with previous studies. Individuals with internal locus of controlbelieve that their actions will make a difference and have demonstratedmore concern for the environment than those with external locus of con-trol who tend to feel lack of control. Generally, research has shown thatinternal locus of control is associated with positive behavior in managersand leaders.
Locus of Control and CultureAlthough cultural discussions are not within the scope of this paper, it isimportant to keep in mind that locus of control and its effects can have
Managing Global Transitions

Maximizing Decision Making Style and Managerial Effectiveness 221
different meaning in other parts of the world. Individuals’ need for con-trol over their environment varies from culture to culture (Adler 2000).For example, Japanese are more likely to adjust their feelings and reac-tion to the environment in stressful situations, while Americans tendto change the environment (Morling, Kitayama, and Miyamoto 2002).Americans generally believe that they have direct control over what hap-pens in their lives, while people in other cultures think that they havelittle control over what happens to them. They attribute life’s events tocircumstances. One of the values in the American culture is creating one’sown reality and building one’s future. We make things happen. It’s a ‘do-ing’ culture. In such cultures, individuals are encouraged to be the ‘doer,’who can control the environment and the outcome. On the other hand,in ‘being’ cultures, people value relationships and believe that they donot have much control over the environment. In planning, ‘being’ peopletend to believe that change occurs at its own pace and feel that things willhappen if and when they are meant to happen. Evans’ (1981) study us-ing word association responses examined the phenomenological dimen-sions of locus of control among Japanese and American students, andthe results showed that Japanese students gave more external word asso-ciations. Although research to date has found internal locus of controlto be associated with positive behavior, there may be exceptions. Exter-nal and internal locus of control may manifest differently from culture toculture. Japanese people are known to cope with traumatic natural disas-ters in an orderly, stoic manner (Rees 2011). They may accept fate morereadily (external locus of control) than those in most Western cultures,but with an emphasis on the sense of community, Japanese people acceptwhat has already happened and do the best they can tomove forward andrebuild their community. A Japanese phrase, ‘Shikata ga nai’ meaning ‘Itcan’t be helped’ or ‘It is what it is. We can’t do anything about it,’ is oftenheard after an undesirable or unfortunate incident. It may sound weak orhelpless in a Western mindset, it may be the sense of accepting fate andconstant change in nature, which is an underlying concept in Buddhism(Rees 2011).
Locus of Control and Managerial EffectivenessManagerial effectiveness can vary depending on the nature of industryand the type of organization. AlthoughMintzberg’s (1973) tenmanagerialroles in three categories (interpersonal, informational, and decisional)suggest a common set of skills in all managerial jobs, managerial effec-
Volume 15 · Number 3 · Fall 2017

222 Brandon William Soltwisch and Keiko Krahnke
tiveness is considered to be different in various settings and based ondifferent needs. Both organizational culture and national culture shouldinfluence the norms and expectations of an effective manager. Nationalculture, for example, significantly influences what constitutes managerialeffectiveness, and it is an important variable in determining managerialand leadership effectiveness (Javidan and Carl 2004). An effective man-ager in Japan is a manager who focuses on both goal attainment and so-cial stability (Misumi 1989). In Taiwan and Mexico, directive leadershipstyle has positive impact on employees according to a study by Dorf-man et al. 1997). There is a plethora of models of managerial effective-ness that focus on managers’ skills and competencies. Locus of controlhas gained some attention as a personality trait that impacts managerialeffectiveness.Being entrepreneurial and innovative is an increasingly important as-
pect of managerial effectiveness. Mueller and Thomas’ study (2001) ex-amined two entrepreneurial traits, internal locus of control and inno-vativeness, with culture as a contextual factor. The results of this studyconducted in nine countries showed that people in individualistic cul-tures, who generally have an internal locus of control, were more en-trepreneurial and innovative. Similar results were found in a study byMiller, Kets de Vries, and Toulouse (1982), and they noted that chief ex-ecutives with internal control pursue innovation, take more risks, andlead competitors. Brownell’s study (1981) with a group of undergraduateaccounting students and a group of managers from a large manufactur-ing company found that budgetary participation has a positive effect forpeople with internal locus of control. The result implies that being ableto participate appeal to the internal locus individuals’ sense of ownershipand control over the outcome. Brownell (1981) also noted in his studythat managers were far more internal than students, which leads us toask the question about the effects of age on locus of control. One age-related study on locus of control by Bradley and Webb (1976) found thatindividuals over 60 were more external and those who were 35–50; there-fore, locus of control may be affected by age. It can be explained by thefact that we are physically and emotionally affected by inevitable effectsof aging, over which we have no control.A maximizer attempts to find the best option rather than settling for
‘good enough’ solutions (Schwartz et al. 2002). In doing this, they exudemore effort and energy during the search process. Managers who expendmore energy to find the best results would be likely to expect that out-
Managing Global Transitions

Maximizing Decision Making Style and Managerial Effectiveness 223
comes are related to their own doing rather than by happenstance. There-fore, the following hypothesis is offered.h2 Managers who maximize will have a more internal locus of control
than those who satisfice.Several studies have correlated locus of control with organizational
variables. Individuals having an internal locus of control are more moti-vated towork (Lief andPritchard 1976),more involved in theirwork (Nairand Yuvaraj 2000), and more likely to emerge as leaders (Schneier 1978).Another study investigated the relationship between locus of control andmanagerial effectiveness using the Managerial Effectiveness Question-naire (Gupta 1996). The data from 72 executives andmanagers found thatthose with an internal locus of control were significantly more effectivethan those with an external locus of control (Nair and Yuvaraj 2000). Theauthors note that ‘since internals believe in their own skills and abilities,feel more responsible and exercise more control in situations, they aremore likely to be effective managers.’ (Nair and Yuvaraj 2000, 44). In linewith this finding, it is expected that internality of locus of control will besignificantly related to managerial effectiveness (Nair and Yuvaraj 2000):h3 Managers who have an internal locus of control will be more effective
than those who have an external locus of control.Taking hypotheses 2 and 3 together suggests that locus of control may
mediate the relationship between maximizing decision making style andmanagerial effectiveness. Amanager who exudes additional effort to findthe best option (maximizer) and believes that they are in control of fol-lowing through on that option to produce results (internal locus of con-trol) may provide a powerful combination for getting things done. There-fore, it is predicted that internal locus of control willmediate the relation-ship between maximization and managerial effectiveness:h4 Locus of control will mediate the relationship between maximizing
and managerial effectiveness.
Methods and ResultsData was gathered from a sample of 319 working managers in variousfields including: food service, sales, entertainment, logistics, government,and healthcare. Respondents had an average of 10 years of experience asa manager and were in the age group of 21 to 78, with a mean age of 40.Thirty eight percent of the responding managers were female. The Man-agerial Effectiveness Questionnaire (Gupta 1996) was used to measure
Volume 15 · Number 3 · Fall 2017

224 Brandon William Soltwisch and Keiko Krahnke
table 1 Correlations of Key Variables
Variables
. Gender
. Maximization .
. Locus of Control . .**
. Managerial Effectiveness .* .** .**
. Happiness with Position . .** .** .*
notes * p < 0.05, ** p < 0.01.
managerial effectiveness. Respondents were asked to indicate how fre-quently they behave or act in a specific way using a five point Likert scalewith ratings (5 = Always; 4 = Usually; 3 = Doubtful; 2 = Sometimes; 1 =never). A high score indicates high overall managerial effectiveness. Thisscale has shown satisfactory reliability and validity (Gupta 1996; Nair andYuvaraj 2000). Managers were also asked how satisfied they were withtheir current position on a scale of (0 = not at all satisfied, 100 = very sat-isfied). This Maximization was measured using the Maximization Ten-dency Scale (Diab, Gillespie, and Highhouse 2008). Example items onthis scale included: (1) No matter what it takes, I always try to choose thebest thing; (2) I never settle; (3)Mydecisions arewell thought through (1 =completely disagree; 7 = completely agree). This scale has shown satisfac-tory reliability and validity (Diab,Gillespie, andHighhouse 2008). A highscore indicates maximizing and a low score indicates satisficing. Locus ofcontrol was measured using the Internality subscale of Levenson’s (1981)Internal, Powerful Others and Chace (ipc) Scale. This scale has showngood reliability (Judge et al. 2002) and has been used to predict outcomesin a variety of samples (Levenson 1981; Judge et al. 2002). Example itemsincluded (1)When Imake plans, I am almost certain to make them work.(2) My life is determined by my own actions (1 = strongly disagree; 7 =strongly agree).Multiple regression analysis was used to test the hypotheses. Gender
was controlled for in the model as it was significantly correlated withmanagerial effectiveness. Hypothesis one investigated the relationshipbetween maximization and managerial effectiveness. Results indicate asignificant positive relationship between maximizing and managerial ef-fectiveness (β = 0.45, p < 0.01). Thus, hypothesis 1 is supported suggest-ing that managers who apply a maximizing decision making approachare significantly more likely to be effective than managers who apply a
Managing Global Transitions

Maximizing Decision Making Style and Managerial Effectiveness 225
Maximizing
Locus of Control
ManagerialEffectiveness
h .** h .**
h .**
figure 1 Mediation Model – Locus of Control Mediating the Relationship BetweenMaximizing and Managerial Effectiveness
satisficing style. Maximizers were significantly more likely to apply an in-ternal locus of control (β = 0.55, p < 0.01), suggesting support for h2.Results indicate that managers who have an internal locus of control aresignificantly more likely to be effective (β = 0.56, p < 0.01), supportingh3. Preacher and Hayes (2013) mediation analysis was conducted usingProcess. Sobel’s test indicated a significant decrease (z = 6.71, p < 0.01, k2
= 0.17) in the relationship betweenmaximizing andmanagerial effective-ness when locus of control was added. Thus, indicating support for h4.
Conclusions, Implications and Future Research Directions
This study has several implications for management theory and practice.First, this study extends the existing literature on maximizing and sat-isficing by investigating the relationship between decision making styles(maximizing or satisficing) and managerial performance using a sampleof workingmanagers in the field. Prior studies have recognized that max-imizers land better jobs post-graduation (Iyengar, Wells, and Schwartz2006). This study extends this work by looking at the upper echelon of or-ganizations to understand how decision making styles impact managers’performance. The results suggest that managers who maximize are sig-nificantly more effective because they spend additional time and effortto find optimal strategies. Since maximizers are more emotionally intel-ligent (Soltwisch and Krahnke in press), it is likely that they utilize thisforward-thinking ability to build support and commitment for projectsearly on, making them more likely to succeed.Interestingly, a spotlight analysis revealed that managers were signifi-
cantly (p > 0.05) more likely to apply a maximizing decisionmaking stylethan a sample of 218 college students. This suggests that those who aredecision optimizing are more likely to advance through the ranks within
Volume 15 · Number 3 · Fall 2017

226 Brandon William Soltwisch and Keiko Krahnke
their organizations. The question of whether this is the product of self-selection or performance needs to be further examines. A longitudinalfield study could improve our understanding of howmanagers utilize thisinformation competency to get things done by investigating managerialdecisions over time.This study also explores the role that locus of control plays in assisting
maximizers to be more effective. The results suggest that maximizers aremore likely to have an internal locus of control. Thus, managers who arelooking for more information are also more likely to follow through onthat information as they see themselves personally responsible for theirown outcomes.Managers with internality of control were alsomore likelyto be effective, replicating previous work by Nair and Yuvaraj (2000).These findings together suggest that maximizers with an internal locusof control provides a powerful recipe for managerial performance. Thismakes sense from a logical standpoint. Managers who spend more ef-fort to find the ‘best’ option will be more likely to follow through on thatoption if they feel in control of their own destiny. Since implementationis so critical to success, following through on the best option will likelyproduce better results.This study may open many new outlets of inquiry in the management
field. For example, the length of time available to decide could be an-other important variable to investigate. Eisenhardt (1989) found that fastdecision makers utilize more information and develop a greater amountof options than slower decision makers. Future studies could investigatewhether maximizers are willing to satisfice when needed, or if they aremore likely to become overwhelmed by information overload. Anotherinteresting question is whether maximizers process information fasterthan satisficers? Alternatively, they may simply be willing to spend moretime gathering information during the search process.This research stream may also open new outlets to advance the litera-
ture on top management teams. What is the right combination of max-imizers and satisficers among top management teams? One could guessthat too many maximizers in a roommay produce information overload,leading to analysis paralysis. Perhaps having a balance of maximizers andsatisficers on the team offers complementary skillsets that enhance groupdecisionmaking. For practitioners, understanding differences in decisionmaking styles may provide another tool to help identify employees whoare ready to take on leadership roles within the company. Amaximizationquestionnaire could be administered to help find employees who have the
Managing Global Transitions

Maximizing Decision Making Style and Managerial Effectiveness 227
decision-making skills necessary to be effective leaders. Although thisstudy has taken some important first steps toward understanding howmanagers utilize decision-making styles to be more effective, there arelikely many new and interesting opportunities for researchers to explore.Hopefully this study will openmany new areas of inquiry, enhancing ourunderstanding of what makes managers successful.
References
Adler, N. J. 2000. International Dimensions of Organizational Behavior.Cincinnati, oh: South-Western.
Anderson, C. R. 1977. ‘Locus of Control, Coping Behaviors, and Perfor-mance in a Stress Setting: A Longitudinal Study.’ Journal of Applied Psy-chology 62 (4): 446–51.
Baldacchino, P., N. Tabone, J. Agius, and F. Bezzina. 2016. ‘OrganizationalCulture, Personnel Characteristics and Dysfunctional Audit Behavior.’iup Journal of Accounting Research and Audit Practice 15 (3): 34–63.
Bergman, A. J., J. E. Nyland, and L. R. Burns. 2007. ‘Correlates with Per-fectionism and the Utility of a Dual Process Model.’ Personality andIndividual Differences 43 (2): 389–99.
Bradley, R. H., and R. Webb. 1976. ‘Age-Related Differences in Locus ofControl Orientation in Three Behavior Domains.’ Human Develop-ment 19 (1): 49–55.
Brownell, P. 1981. ‘Participation in Budgeting, Locus of Control and Orga-nizational Effectiveness.’ The Accounting Review 56 (4): 844–60.
Chowdhury, T. G., S. Ratneshwar, P. Mohanty. 2009. ‘The Time-HarriedShopper: Exploring the Differences between Maximizers and Satisfi-cers.’Marketing Letters 20 (2): 155–67.
Cosier, R. A., and P. L. Rechner. 1985. ‘Inquiry Method Effects on Perfor-mance in a Simulated Business Environment.’Organizational Behaviorand Human Decision Processes 36 (1): 79–95.
Dean, J. W., and M. P. Sharfman. 1996. ‘Does Decision Process Matter? AStudy of Strategic Decision-Making Effectiveness.’ Academy of Man-agement Journal 39 (2): 368–92.
Deluga, R. J. 1998. ‘Leader-Member Exchange Quality and EffectivenessRatings the Role of Subordinate-Supervisor Conscientiousness Simi-larity.’ Group and Organization Management 23 (2): 189–216.
Diab, D. L., M. A. Gillespie, and S. Highhouse. 2008. ‘Are Maximizers Re-ally Unhappy? The Measurement of Maximizing Tendency.’ Judgmentand Decision Making 3 (5): 364–70.
Dorfman, P. W., J. P. Howell, S. Hibino, J. K. Lee, U. Tate, and A. Bautista.1997. ‘Leadership inWestern andAsian Countries: Commonalities and
Volume 15 · Number 3 · Fall 2017

228 Brandon William Soltwisch and Keiko Krahnke
Differences in Effective Leadership Processes across Cultures.’ Leader-ship Quarterly 8 (3): 233–74.
Eisenhardt, K. M. 1989. ‘Making Fast Strategic Decisions in High-VelocityEnvironments.’ Academy of Management Journal 32 (3): 543–76.
Forte, A. 2005. ‘Locus of Control and the Moral Reasoning of Managers.’Journal of Business Ethics 58 (1–3): 65–77.
Evans, H. M. (1981). ‘Internal-External Locus of Control and Word Asso-ciation.’ Journal of Cross-Cultural Psychology 12 (3): 372–82.
Gable, M., and F. Dangello. 1994. ‘Locus of Control, Machiavellianism, andManagerial Job Performance.’ The Journal of Psychology 128 (5): 599–608.
Gupta, S. 1996. ‘Managerial Effectiveness: Conceptual Framework andScale Development.’ Indian Journal of Industrial Relations 31 (3): 392–409.
Howell, J. M., and B. J. Avolio. 1993. ‘Transformational Leadership, Trans-actional Leadership, Locus ofControl, and Support for Innovation:KeyPredictors of Consolidated-Business-Unit Performance.’ Journal of Ap-plied Psychology 78 (6): 891–902.
Iyengar, S. S., R. E. Wells, and B. Schwartz. 2006. ‘Doing Better But FeelingWorse Looking for the “Best” Job Undermines Satisfaction.’ Psycholog-ical Science 17 (2): 143–50.
Javidan,M., andD. E. Carl. 2004. ‘EastMeetsWest: ACross-Cultural Com-parison of Charismatic Leadership Among Canadian and Iranian Ex-ecutives.’ Journal of Management Studies 41 (4): 665–91.
Judge, T. A., A. Erez, J. E. Bono, and C. J. Thoresen. 2002. ‘Are Measuresof Self-Esteem, Neuroticism, Locus of Control, and Generalized Self-Efficacy Indicators of a Common Core Construct?’ Journal of Person-ality and Social Psychology 83 (3): 693–710.
Lai, L. 2010. ‘Maximizing withoutDifficulty: AModifiedMaximizing Scaleand its Correlates.’ Judgment and Decision Making 5 (3): 164–75.
Leach, J. K., E. A. Patall. 2013. ‘Maximizing and Counterfactual Thinkingin Academic Major Decision Making.’ Journal of Career Assessment 21(3): 414–29.
Levenson, H. 1981. ‘Differentiating among Internality, Powerful Others,and Chance.’ In Research with the Locus of Control Construct, editedby H. Lefcourt, 15–63. New York: Academic Press.
Lied, T. R., and R. D. Pritchard. 1976. ‘Relationships between PersonalityVariables and Components of the Expectancy-Valence Model.’ Journalof Applied Psychology 61 (4): 463–7.
Luthans, F. 2002. ‘The Need for and Meaning of Positive OrganizationalBehavior.’ Journal of Organizational Behavior 23 (6): 695–706.
Managing Global Transitions

Maximizing Decision Making Style and Managerial Effectiveness 229
Mason, R. O., and I. I. Mitroff. 1981. ‘The Metaphysics of Policy and Plan-ning: A reply to Cosier.’Academy of Management Review 6 (4): 649–51.
Mayer, J. D., P. Salovey, D. R. Caruso, and G. Sitarenios. 2001. ‘EmotionalIntelligence as a Standard Intelligence.’ Emotion 1 (3): 232–42.
Miller, D., M. Kets de Vries, and J. M. Toulouse. 1982. ‘Top Executives Lo-cus of Control and its Relationship to Strategy-Making, Structure, andEnvironment.’ Academy of Management Journal 25 (2): 237–53.
Miller, D., and J. M. Toulouse. 1986. ‘Strategy, Structure, ceo Personalityand Performance in Small Firms.’ American Journal of Small Business15:47–62.
Mintzberg, H. 1973. ‘Strategy-Making in ThreeModes.’California Manage-ment Review 16 (2): 44–53.
Misumi, J. 1989. ‘Research on Leadership and Group Decision in JapaneseOrganisations.’ Applied Psychology 38:321–36.
Mueller, S. L., and A. S. Thomas. 2001. ‘Culture and Entrepreneurial Po-tential: ANine Country Study of Locus of Control and Innovativeness.’Journal of Business Venturing 16 (1): 51–75.
Morling, B., S. Kitayama, and Y. Miyamoto. 2002. ‘Cultural Practices Em-phasize Influence in the United States and Adjustments in Japan.’ Per-sonality and Social Psychology Bulletin 28 (23): 311–23.
Mostafa, M. M. 2016. ‘Post-Materialism, Religiosity, Political Orientation,Locus ofControl andConcern forGlobalWarming: AMultilevel Anal-ysis Across 40 Nations.’ Social Indicators Research 128 (3): 1273–98.
Nair, S. K., and S. Yuvaraj. 2000. ‘Locus of Control and Managerial Effec-tiveness.’ Indian Journal of Industrial Relations 36:41–52.
Parker, A. M., W. B. De Bruin, and B. Fischhoff. 2007. ‘Maximizers Ver-sus Satisficers: Decision-Making Styles, Competence, and Outcomes.’Judgment and Decision Making 2 (6): 342–50.
Polman, E. 2010. ‘Why Are Maximizers Less Happy than Satisficers? Be-cause They Maximize Positive and Negative Outcomes.’ Journal of Be-havioral Decision Making 23 (2): 179–90.
Preacher, K. J., and A. F. Hayes. 2004. ‘spss and sas Procedures for Esti-mating Indirect Effects in SimpleMediationModels.’Behavior ResearchMethods 36 (4): 717–31.
Purvis, A., R. T.Howell, andR. Iyer. 2011. ‘Exploring the Role of Personalityin the Relationship betweenMaximization andWell-Being.’Personalityand Individual Differences 50 (3): 370–5.
Rastogi, R., and V. Dave. 2004. ‘Managerial Effectiveness: A Function ofPersonality Type andOrganisational Components.’ SingaporeManage-ment Review 26 (2): 79–87.
Rees, G. 2011. ‘Japan: How resilient a nation.’ Dart Center, 14 March.https://dartcenter.org/content/how-resilient-is-japan
Volume 15 · Number 3 · Fall 2017

230 Brandon William Soltwisch and Keiko Krahnke
Rotter, J. B. 1990. ‘Internal Versus External Control of Reinforcement.’American Psychological Association 45 (4): 489–93.
Schneier, C. E. 1978. ‘The ContingencyModel of Leadership: An Extensionto Emergent Leadership and Leader’s Sex.’Organizational Behavior andHuman Performance 21 (2): 220–39.
Schwartz, B., A. Ward, J. Monterosso, S. Lyubomirsky, K. White, and D. R.Lehman. 2002. ‘Maximizing versus Satisficing: Happiness is a Matterof Choice.’ Journal of Personality and Social Psychology 83 (5): 1178–97.
Schwenk, C. R. 1988. ‘The Cognitive Perspective on Strategic DecisionMaking.’ Journal of management studies 25 (1): 41–55.
Senge, P., and K. Krahnke. 2013. ‘Transcendent Empathy.’ In Organizingthrough Empathy, edited byK. Pavlovich andK.Krahnke, 185–202.NewYork: Routledge.
Simon, H. A. 1972. ‘Theories of Bounded Rationality.’ Decision and Orga-nization 1 (1): 161–76.
Soltwisch, B. W., and K. Krahnke. In press. ‘Maximizing or Satisficing De-cision Making Styles and Emotional Intelligence: An Empirical Inves-tigation.’ International Journal of Business and Applied Sciences.
Youssef, C. M., and F. Luthans. 2007. Emerging Positive Organizational Be-havior. Journal of Management 33 (3): 321–49.
This paper is published under the terms of the Attribution-NonCommercial-NoDerivatives 4.0 International (cc by-nc-nd 4.0)License (http://creativecommons.org/licenses/by-nc-nd/4.0/).
Managing Global Transitions
The Unemployment-Stock Market Relationshipin South Africa: Evidence from Symmetricand Asymmetric Cointegration ModelsAndrew PhiriNelson Mandela University, South [email protected]
In this study, we examine linear and nonlinear cointegration and causal re-lations between unemployment and stock market returns in South Africausing quarterly data collected between 1994:q1 and 2016:q1. Our empiri-cal results reveal significant cointegration effects between the time seriesin both linear and nonlinear models, even though both frameworks ulti-mately reject the notion of any causal relations between the variables. Col-lectively, our study rejects the notion of unemployment being a good pre-dictor for stock market returns and neither do developments in the stockmarket have any effect on the unemployment rate. Such evidence advocatesfor weak-form efficiency in the jse equity prices whereby unemploymentdata cannot help investors to predict the movement of future share pricesand further suggests that policymakers cannot rely on stock market de-velopment as an avenue towards lowering the prevailingly high levels ofunemployment as set in current macroeconomic policy objectives.Key Words: stock market returns, unemployment, cointegration, causalityeffects, mtar model, South Africajel Classification: c13, c22, c52, e24, e44https://doi.org/10.26493/1854-6935.15.231-254
Introduction
The Johannesburg Stock Exchange (jse) is the 2nd oldest stock marketin Africa, the 17th largest stock exchange in the world, the sixth largestamong emerging economies and the largest within the African conti-nent, with over 400 listed companies, over 900 securities and a marketcapitalization of over 900 billion us dollars in 2013 (Hussan 2013). Thejse also has the largest number of cross-listed firms compared to otherAfrican stock exchanges and conducts trade on international platformssuch as the London Stock Exchange (lse), the New York Stock Exchange(nyse), the Frankfurt Stock Exchange (fse) and the six Swiss Exchange.Moreover, the jse has recently introduced collation centres countrywide
Managing Global Transitions 15 (3): 231–254

232 Andrew Phiri
which allows for trades to be conducted 400 times faster and currently thenumber of trades is up by 57 percent, volumes are up by 4 percent and thevalue of trades up by almost 21 percent (Yartey 2008). Notwithstandingthe relative size and increasing sophistication of the jse, unemploymentandpoverty in SouthAfrica remains one of the highest in theworld due tothe lingering effects of the previous Apartheid legacy. The South Africangovernment is currently embarking on macroeconomic policies such asthe New Growth Path (ngp), which aims to reduce unemployment fromits current figure of 25 percent to 15 percent by the year 2020. It wouldtherefore be of great interest to policymakers and investors alike to de-duce an empirical relationship between stock market development andunemployment in South Africa, with the hope that stock market returnscould help foster amacroeconomic environment conducive towards low-ering unemployment or that stock returns can be used as an indicator forfuture movements in stock returns.Even though the current literature contends that stock market devel-
opment is an important condition for economic growth in South Africa(Nyasha and Odhiambo 2015; Phiri 2015b), very little is known concern-ing the relationship between stock market activity and unemploymentin the country. This is highly noteworthy since unemployment is tradi-tionally known as a measure of the health of an economy and of recenthas been viewed as a highly efficient predictor of stock market behaviourespecially in developed stock market exchanges (Boyd, Hu, and Jagan-nathan 2005).There are two viewpoints to this debate. On one hand, unemployment
can be found to granger cause stockmarket returns. Such evidence wouldviolate the conventional view of the jse being weak-form efficient (seeAppiah-Kusi and Menyah 2003; Phiri 2015a) and implies that investorscan base their future investment decisions on actual or expected unem-ployment data. On the other hand, if stock market returns are foundto lead unemployment, stock market development can be thought of asa vehicle towards eradicating unemployment and poverty in the coun-try. In also considering the historical combination of constant growthin stock returns and South Africa’s high unemployment rate in post-Apartheid regime, it would not seem unreasonable to speculate that un-employment and stock market activity are positively correlated for theeconomy. Notably, South Africa’s situation is similar to that of Nigeriawhere high stock performance has been accompanied with soaring un-employment rates (Bamidele 2015). Yet, South Africa’s situation is contra-
Managing Global Transitions

The Unemployment-Stock Market Relationship in South Africa 233
dictory to that of other leading African stock exchanges such as in Mau-ritius (Stock Exchange of Mauritius), Egypt (Egyptian Stock exchange)andMorocco (Casablanca Stock Exchange) which have highly developedstock exchanges in combination with low unemployment rates of 7, 9 and13 percent, respectively.Thus far, the bulk of the current empirical literature examining the re-
lationship between unemployment and stock exchange activity is con-centrated on industrialized economies (Farmer 2015 for the us; Farsioand Fazel 2013 for the us, China and Japan, and Fitoussi et al. 2000 for19 oecd countries). With exception of the work of Bamidele (2015) forNigeria, there is virtually no other empirical research existing for otherAfrican countries on the subject matter. Moreover, a majority of previousempirical works have traditionally conducted their investigations by rely-ing on symmetric cointegration frameworks of Engle and Granger (1987)and Johansen (1991) (see Jagannathan andWang 1993; Jagannathan, Kub-ota, and Takehara 1998; Farsio and Fazel 2013; Farmer 2015; Bamidele2015). It has recently become well known that these linear cointegrationframeworks have low testing power and inferior size properties in thepresence of asymmetric adjustment between a pair of time series. Besides,previous empirical evidence of nonlinearity existing in the individualtimes series of unemployment and stock market returns data for SouthAfrica has also been recently provided in the studies of Phiri (2014) andPhiri (2015a), respectively. Primarily motivated by this, our current studycontributes to the literature by examining cointegration and causal rela-tions between unemployment and stockmarket returns for SouthAfricandata. In order to increase the robustness of our study we employ two em-pirical frameworks for our analysis; the first being the linear cointegrationframework of Engle andGranger (1987) supplementedwith cointegrationtests proposed by Johansen (1991), and second is the momentum thresh-old autoregressive model of Engle and Granger (1998) and Enders andSilkos (2001). We conduct our empirical analysis on quarterly data col-lected post-Apartheid period of 1994:q1 to 2016:q1.Against this background, we structure the remainder of the paper as
follows. The next section provides a synopsis of the relationship betweenstock returns and unemployment in the form of a literature review. Thethird section of the paper focuses on stock market and unemploymentdevelopments in South Africa from a historic perspective. The researchmethodology is outlined in the fourth section of the paper whilst the dataand the empirical results are given in the fifth section of the paper. The
Volume 15 · Number 3 · Fall 2017

234 Andrew Phiri
study is concluded in the sixth section in the form of policy discussionsas well as avenues for future research.
Literature ReviewMainstream economy theory depicts on a strong link between stockmar-ket activity and unemployment. The capital asset price model (capm) aspioneered by Sharpe (1964), Lintner (1965a; 1965b), Mossin (1966) andBlack (1972) as well as the discounted cash flow (dcf) model of Gra-ham and Dodd (1934) were amongst the first frameworks used to depicta causal relation between stock prices and unemployment. Within thecapm model, correlating movements between stock market prices andunemployment is facilitated through one or more of the following threeprimitive factors; (i) the risk-free rate of interest, (ii) the expected growthrate of corporate earnings and dividends, and (iii) the equity risk pre-mium (Boyd, Hu, and Jagannathan 2005). On the other hand, the stan-dard dcf model equates the stock price to the discounted present valueof a firm’s future cash flows, which in turn is linked to the labour de-mand of firms through the wage curve. A number of empirical papershave provided support for an equilibrium relationship between unem-ployment and stock market variables based on the channels depictedin the capm and dcf models. For instance, the earlier studies such asFama (1981), Chen, Roll, and Ross (1986), Geske and Roll (1983) andMan-delker and Tandon (1985) were able to demonstrate that a large numberof economic and non-equity financial variables affect discount rates, theability of firm’s to generate cash flows, and future dividend payments. Alatter group of studies exclusively found an equilibrium relationship be-tween stock market returns and unemployment. Amongst these studiesare the works of Jagannathan andWang (1993), Jagannathan, Kubota, andTakehara (1998), Phelps (1999), Farsio and Fazel (2013), Farmer (2015) andBamidele (2015).Another theoretical proposition linking stock market prices and un-
employment is based on the sectoral shift hypothesis of Lilien (1982). Ac-cording to this theory, unemployment is, in part, the result of labour shiftsfrom those sectors where relative wages are declining to those sectorswere relative wages are expanding. Initially Lilien (1982) demonstratedthat the dispersion of unemployment across industries was a useful proxyin explaining movements in the unemployment rate. However, Lilien’s(1982) index was criticized by Abraham and Katz (1986) on the basis ofbeing contaminated with by aggregate demand influences. Consequen-
Managing Global Transitions
The Unemployment-Stock Market Relationship in South Africa 235
tially, Black (1987), Loungani, Rush, and Tave (1990), Brainard and Cut-ler (1993), Fourtin and Thivierge (1997) and Loungani and Trehan (1997)improved on Lilien’s (1982) index by demonstrating that stockmarket dis-persion is a much better proxy for the volume of intersectoral shifts sinceit gives an early signal of shocks that affect sectors differently and putsmore weight on shocks that investors expect to be permanent. These de-velopments resulted in a handful of studies investigating the effects ofstock market diversion on unemployment and the evidence provided sofar can at best be described as inconclusive. For instance, Dopke andPierdzioch (2000) find that the influence of stock market diversion onoutput and unemployment is significant but rather small. Conversely,Chehal, Loungani, and Trehal (2010) find that stock market dispersionleads to unemployment over the short-run but not over the long-run.On the other hand, Chen et al. (2011) find that stock market dispersionaccounts for a significant portion of both long-term and short-term usunemployment even after controlling for aggregate factors, such that anincrease in stockmarket dispersion leads to an increase in the unemploy-ment level. Furthermore, Jorgensen, Li, and Sadka (2012) find a positivebut weak effect from us earnings dispersion to unemployment for thedata and this result is similar to that obtained in Dopke and Pierdzioch(2000). And even more recently, Kalay, Nallareddy, and Sadka (2015)found that us earnings dispersion is associated with higher unemploy-ment and lower industrial production during recession periods, whereasduring expansions dispersion has an insignificant impact on unemploy-ment and production.The final theoretical propositions linking unemployment to stock re-
turns can be attributed to two framework’s, the first being Blanchard’s(1981) is-lm model and the second being the Diamond-Mortensen-Pissarides (dmp) model of Diamond (1982), Mortensen and Pissarides(1994) and Pissarides (1985). On one hand, Blanchard (1981) develop anis-lm model which in equilibrium,macroeconomic news can be good orbad depending on the state of the economy.Cutler, Poterba, and Summers(1988), Orphanides (1992), McQueen and Roley (1993), Veronesi (1999),Boyd, Hu, and Jagannathan (2005), Cakan (2012), Krueger and Fortson(2003), and Cakan, Doytch, and Upadhyaya (2015) all offer support onthe notion that stock returns react to unemployment news. On the otherhand, the dmp model specifically relates unemployment to job-creationincentives. When the incentive for job creation falls, the labour mar-ket slackens and unemployment increases. The dmp model has been
Volume 15 · Number 3 · Fall 2017

236 Andrew Phiri
recently used as a theoretical workhorse to demonstrate the effects ofunemployment on the stock market. For instance, Mukoyama (2009)demonstrate that discount factors of either entrepreneurs or workers areprocyclical and these procyclical discount factors can magnify labourmarket volatility and thus influence unemployment. In particular, theauthor discovers that entrepreneurs discount factors exerts a larger influ-ence on labour market volatilities compared to the discount factors forworkers. In a different study, Kuehn, Petrosky-Nadeau, and Zhang (2012)build a general-equilibrium model, which combines a dmp labour mar-ket with full treatment of financial markets. In the model, volatility inallocations resulting from amplified productivity shocks in the labourmarket causes financial volatility, which then widens the equity premiumin financial markets. The authors demonstrate that equity premium iscountercyclical and can be predicted by labour market tightness. Fur-thermore, Hall (2014) use a dmp labour market to show that discountrate is the driving force of unemployment such that stock market fallsduring recessionary periods because the discount rate rises. However,the author is unable to account for why the discount rate falls so muchduring recessionary periods like the 2009 global recessionary period.Meanwhile, Kilic andWachter (2015) develop amodel with a dmp labourmarket with an ad-hoc sticky-wage specification as a means of furtherinvestigating the underlying force behind the cyclical behaviour and un-employment and vacancies in relation to equity markets. The authorsfind that during rare disaster events such as the global recession period,high-unlevered equity premium is the source of labour and stock marketvolatility, which simultaneously lowers stock market valuation and risesunemployment. Finally, Miao, wang, and Xu (2016) introduce credit con-straint within a dmp labour market, which produces multiple equilibriapositions. In one equilibrium, there exists bubble in the stock market,which relaxes credit constraints and allows firms to increase investmentand hire more workers. However, when the bubble bursts credit con-straints tighten causing firms to decreasing investment and cut workershence creating unemployment.
Stock Market and Unemployment Developmentsin South Africa: A Post-Apartheid Synopsis
From a historical perspective, both stock market returns and the unem-ployment rate in the post-apartheid era appear to have beenmore-or-lesspositively correlated, with increases in stock market activity appearing
Managing Global Transitions

The Unemployment-Stock Market Relationship in South Africa 237
to go hand-in-hand with increases in the unemployment rate. Follow-ing South Africa’s democratic transition of 1994, unemployment in thecountry averaged just above 16 percent and at this time jse stock returnsaveraged slightly over 2 percent. In 1994, the jse proposed amendmentsto national government, which were designed to improve the efficiencyand the liquidity of the stock exchange. On the other hand, fiscal authori-ties implemented two policy programmes; firstly the Reconstruction andDevelopment Programme (rdp) in 1994, and then secondly the Growth,Employment and Redistribution (gear) programme in 1996. The laterprogramme was seen as an upgrade of the former and aimed to specif-ically create 400 000 new jobs every year through various public worksprogrammes. However, between 1996 and 1998, unemployment had risenfrom 19 percent to just under 26 percent whilst at the same time jsemarket returns increased from 2.5 percent to 3.5 percent. According toVon Fintel and Burger (2014), this sharp increase in unemployment inearly post-Apartheid period is a result of long-run generational changesin which older ‘more-employable’ generations were exiting the labourmarket whilst the younger generation entered the labour market with agreater probability of remaining unemployed and this created a new highunemployment equilibrium. Improvements experienced in stock marketreturns during the 1996 to 1998 period can be attributed to (i) the intro-duction of the electronic trading system, the jet system, which was anupgrade from the previous outcry system; (ii) the launching of the real-time stock exchange news service (sens) which enhanced transparencyand investor confidence and (iii) the opening of trading to foreign nation-als. Collectively, this resulted in a drastic increase in stock trades volumesand market liquidity.However, following the Asian financial crisis in 1998, stock prices re-
turns in South Africa averaged –0.7 percent between 1998 and early 1999,and then picked up to 3.5 percent in late 1999. In 2001, the jse enteredinto an agreement with the lse and in 2002 began trading on the lseusing the lse stock exchange electronic trading system (sets). This wasaccompanied with exceptional stock market performance with returnsaveraging over 4 percent between 2001 and 2003 except for the periodimmediately following the September 11 attacks on theWorld Trade Cen-ter, when the jse experienced a slump averaging –0.45 percent in stockreturns. Also in the aftermath of the 9/11 event, South Africa experiencedher worst unemployment rates, averaging a record-high 30 percent in2002, thus ranking it as the 5th highest in the world. Further contributing
Volume 15 · Number 3 · Fall 2017

238 Andrew Phiri
to South Africa’s woes was the shrinkingmining sector, which further ex-acerbated the already increasing unemployment rates. In 2004, the gearpolicy programmewas phased out and ultimately replaced byAcceleratedand Growth Initiative for South Africa (asgisa). This government pro-gramme was mandated to halve unemployment by the year 2014 mainlythrough the vehicle of job creation. Unemployment rates fell from aver-ages of 28 percent to 21 percent between 2004 and 2007, which partiallyreflected the implementation of the asgisa programme. On the otherhand, stock prices were on an upward trend from 2003 up until early2006 averaging 2 percent returns. In 2007, the jse experienced a signif-icant shift in her trading mechanism when the lse leased yet anothertrading platform to jse, the jse TradeElect trading system.However, thecollapse of Lehman Brothers in September 2008 eventually took a toll onthe South African economy. During the period of 2007 to 2009, marketreturn averages fell from 1.7 percent to –3 percent and unemployment in-creased from 21 to 25 percent with over 1 million jobs being lost duringthe recessionary period of 2009.Nevertheless, the jse began to recover from the recession in late 2009
averaging 1.9 percent in stock returns whilst unemployment slightly de-creased to an average rate of 24 percent. In 2010, government announcedthe New Growth Path (ngp) programme, which set explicit goals of cre-ating 5 million jobs and reducing unemployment to 15 percent by 2030.However, between 2010 and 2013 unemployment and stock market re-turns both remained more-or-less at steady levels averaging 25 percentand 1.2 percent respectively during this period. In 2013, the jse decidedto shift the trading platform from London back to Johannesburg undera new trading platform, the Millennium exchange-trading platform. It isunder this platform that the jse ushered in collation facilities, which in-creased transactions by almost 400 times faster than the previous Trade-Elect system. This consequentially resulted in stock returns increasingto rates as high as 6 percent in 2015. On the other hand, governmentintroduced the national development plan (ndp) in 2013 and this pro-gramme is working on a long-term plan to reduce poverty and eliminateinequality by 2030 through sectoral employment programmes. Neverthe-less, unemployment has not improved since then and is currently aver-aging 25.1 percent thus ranking the country as having the eighth highestunemployment rate in the world. Figure 1 presents a graphical depictionof the seemingly positive co-movement between jse stockmarket pricesand unemployment in the post-Apartheid era.
Managing Global Transitions

The Unemployment-Stock Market Relationship in South Africa 239
-
-
figure 1 jse Stock Returns (Light) and Unemployment (Dark) (1994–2015)
Empirical Framework
linear cointegration model
Since it is well known that both unemployment and stock returns are en-dogenous variables, we base our empirical framework on the premise ofspecifying two long-run bivariate regression equations. Under the firstregression, stock returns is set-up as the dependent variable, i.e.
smrt = αt + βunempt + et, (1)
where smrt are stock market returns, unempt is the unemployment rateand et is the long-run regression error term. Under the second regression,unemployment is specified as the dependent variable, i.e.
unempt = αt + βsmrt + et. (2)
According to Engle and Granger (1987), any long-run regression which isestimated for a pair of time series variables will produce spurious resultsif the times series are not found to be cointegrated over time. Therefore,Engle and Granger (1987) suggest that cointegration within the system ofequations can be validated if the individual time series are first differencestationary (i.e. integrated of order I(1)) and the cointegration residualsare found to be levels stationary (i.e. integrated of order I(0)) such thereexists a cointegration vector comprising of a linear combination of thetime series. Furthermore, the residuals of the cointegration vector can benormalized for the time series through an error correction model (ecm)which measures the deviation of the series from its steady-state equilib-rium. In its simplest form, a bi-variate error correction model (ecm) be-tween the two time series, smrt and unempt, assumes the following func-tional form:
Volume 15 · Number 3 · Fall 2017

240 Andrew Phiri
ΔsmrtΔunempt
= γectt−1 +p∑
i=1αΔsmrt−i +
p∑
i=1βΔunempt−i + μt , (3)
where ectt−1 is the error correction term of the time series towards itslong-run equilibrium and the coefficients α and βmeasure the short-runeffects of the time series variables on the dynamicmodel. Granger causal-ity can further facilitated under the ecm framework. In particular, smrtgranger causeunempt if theα coefficients are found to be significantly dif-ferent from zero whereas unempt granger cause smrt if the β coefficientsare significantly different from zero.
threshold cointegration model
Even though Engle and Granger’s (1987) cointegration procedure is usu-ally appraised for it’s computational ease, it has come under severe crit-icism by the likes of Enders and Granger (1998) and Enders and Silkos(2001), who demonstrate that the conventional linear cointegation frame-work exhibits lowpower andpoor size properties in the presence of asym-metric adjustment. As a means of circumventing this issue, Enders andSilkos (2001) allow the residual deviations (ξti) of the long-run cointe-gration regression to behave as threshold processes. In particular, theseauthors propose two variants of the threshold process. The first processis the tar model, which captures deep movements in the equilibriumerrors and is specified as follows:
et = ρ1et(et < τ) + ρ2et(et ≥ τ) + νt. (4)
The second process is the mtar and is designed to capture sharp move-ments in the equilibrium errors:
et = ρ1et(Δet < τ) + ρ2et(Δet < τ) + νt, (5)
where τ is unknown threshold level which is estimated using the min-imization criterion proposed by Hansen (2000), ρ1 measures asymmet-ric adjustment when the equilibrium error is below its threshold and ρ2measures asymmetric adjustment when the equilibrium error is below itsthreshold. For both tar and mtar versions of the model, Enders andSilkos (2001) advice on the testing of two hypothesis, namely, for cointe-gration relations between the time series and then for asymmetric coin-tegration relations. The null hypothesis of no cointegration is given ash10: ρ1 = ρ2 and is tested against the alternative of cointegration amongstthe variables (i.e. h11: ρ1 � ρ2) using a standard F-test denoted as Φ.If the null hypothesis of no cointegration is rejected, then one can pro-ceed to further test for the null hypothesis of linear cointegration (i.e.
Managing Global Transitions

The Unemployment-Stock Market Relationship in South Africa 241
h20: ρ1 = ρ2 = 0) against the alternative of asymmetric cointegration(h21: ρ1 � ρ2 � 0) using a modified F-test denoted as Φ*. Once the nullhypothesis linear cointegration is rejected in favour of asymmetric coin-tergation, then corresponding threshold error correction (tec) modelscan be specified as follows:
ΔsmrtΔunempt
= γ1ectt−1(ectt < τ) +p∑
i=1αΔsmrt−i +
p∑
i=1βΔunempt−i
+
⎧⎪⎪⎨⎪⎪⎩γ2ectt−1(ectt ≥ τ) +p∑
i=1αΔsmrt−i
+
p∑
i=1βΔunempt−i
⎫⎪⎪⎬⎪⎪⎭ + νt, (6)
ΔsmrtΔunempt
= γ1ectt−1(ectt < Δτ) +p∑
i=1αΔsmrt−i +
p∑
i=1βΔunempt−i
+
⎧⎪⎪⎨⎪⎪⎩γ2ectt−1(ectt ≥ Δτ) +p∑
i=1αΔsmrt−i
+
p∑
i=1βΔunempt−i
⎫⎪⎪⎬⎪⎪⎭ + νt. (7)
Regressions (7) and (8) are formally known as the tar-tec and mtar-tec regressions, respectively. Based on these threshold error correc-tion (tec) regressions, two main sets of hypothesis can be tested for.Firstly, the null hypothesis of no asymmetric error correction model (i.e.h30: γ1 � γ2) can be tested against the alternative of threshold errorcorrection model (i.e. h31: γ1 = γ2). Secondly, the direction of causalityamongst the time series can be evaluated by testing whether the coef-ficient values of Δsmrt−i and Δunempt−i are significantly different fromzero. In particular, the null hypothesis that smrt does not granger causeunempt is tested as h40: αi = 0 whereas the null hypothesis that unemptdoes not granger cause smrt is tested as h50: βi = 0. The aforementionedgranger tests are facilitated through F-tests.
Empirical Analysis
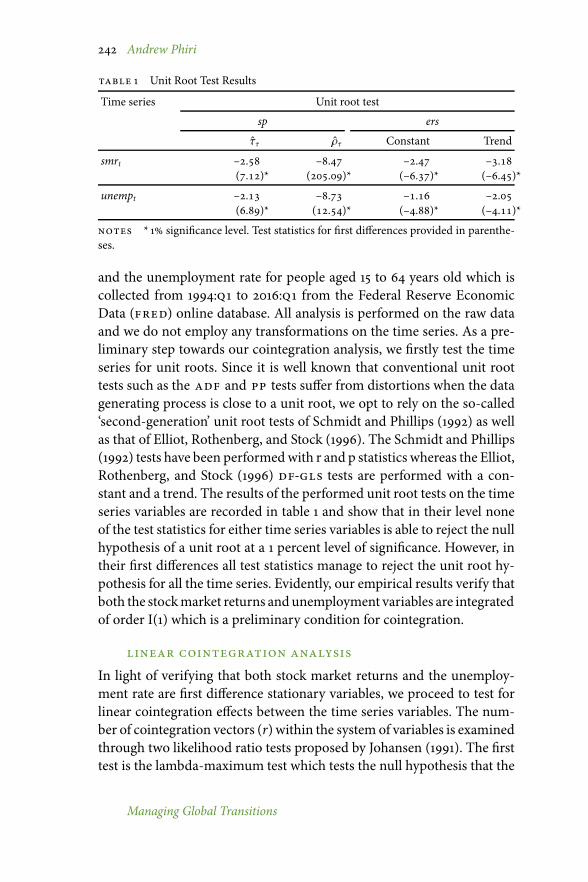
data and unit root tests
Our empirical analysis makes use of quarterly time series data of per-centage change in the total share prices for all shares in South Africa
Volume 15 · Number 3 · Fall 2017
242 Andrew Phiri
table 1 Unit Root Test Results
Time series Unit root test
sp ers
ττ ρτ Constant Trend
smrt –.(.)*
–.(.)*
–.(–.)*
–.(–.)*
unempt –.(.)*
–.(.)*
–.(–.)*
–.(–.)*
notes * 1 significance level. Test statistics for first differences provided in parenthe-ses.
and the unemployment rate for people aged 15 to 64 years old which iscollected from 1994:q1 to 2016:q1 from the Federal Reserve EconomicData (fred) online database. All analysis is performed on the raw dataand we do not employ any transformations on the time series. As a pre-liminary step towards our cointegration analysis, we firstly test the timeseries for unit roots. Since it is well known that conventional unit roottests such as the adf and pp tests suffer from distortions when the datagenerating process is close to a unit root, we opt to rely on the so-called‘second-generation’ unit root tests of Schmidt and Phillips (1992) as wellas that of Elliot, Rothenberg, and Stock (1996). The Schmidt and Phillips(1992) tests have been performedwith r and p statistics whereas the Elliot,Rothenberg, and Stock (1996) df-gls tests are performed with a con-stant and a trend. The results of the performed unit root tests on the timeseries variables are recorded in table 1 and show that in their level noneof the test statistics for either time series variables is able to reject the nullhypothesis of a unit root at a 1 percent level of significance. However, intheir first differences all test statistics manage to reject the unit root hy-pothesis for all the time series. Evidently, our empirical results verify thatboth the stockmarket returns andunemployment variables are integratedof order I(1) which is a preliminary condition for cointegration.
linear cointegration analysisIn light of verifying that both stock market returns and the unemploy-ment rate are first difference stationary variables, we proceed to test forlinear cointegration effects between the time series variables. The num-ber of cointegration vectors (r) within the system of variables is examinedthrough two likelihood ratio tests proposed by Johansen (1991). The firsttest is the lambda-maximum test which tests the null hypothesis that the
Managing Global Transitions

The Unemployment-Stock Market Relationship in South Africa 243
table 2 Maximum Eigen and Trace Cointegration Test Results
h0 h1 Jmax c.v. Jtrace c.v.
With a constant
r ≥ 1 r = 1(r ≥ 2) . . . .
r ≥ 0 r = 0(r ≥ 1) . . . .
With a trend
r ≥ 1 r = 1(r ≥ 2) . . . .
r ≥ 0 r = 0(r ≥ 1) . . . .
notes Lag length for the maximum Eigen and trace tests have is 3 s determined by theaic and bic.
cointegration rank is equal to r against the alternative that the cointegra-tion rank is equal to r+1. The test statistic used is amaximumgeneralizedeigenvalue, which is computed as:
Jmax = −TIn(1 − λi), (8)
where T is the sample size and λi is the ith largest canonical correlation.The second cointegration test is the trace test, which tests the null hy-pothesis that the cointegration matrix is equal to r against an alternativeof the cointegration rank being equal to k. The test statistic used is thetrace of a diagonal matrix of generalized eigenvalue and is computed as:
Jtrace = −Tn∑
r+1In(1 − λi). (9)
Two versions of aforementioned cointegration tests have been performedon our data, the first with a drift and the second with a trend, with theresults being reported in table 2.As can be observed from the cointegration test results reported in table
2, the computed Eigen and Trace statistics advocate for at least one coin-tegration vector between the time series variables. In particular, whentesting the null of no cointegration effects for cointegration rank r = 0inclusive of a constant, we obtain Jmax and Jtrace statistics values of 35.30and 39.39, respectively. Notably these values exceed their correspondingcritical values at all levels of significance hence rejecting the null hypoth-esis of no cointegration vectors. Similarly, when the testing procedure isinclusive of a trend, the Jmax and Jtrace statistics exceed their critical val-ues at all significance levels, with values of 36.86 and 41.62, respectively.However, in proceeding to test the null hypothesis of one cointegrationrelation against the alternative of two cointegration vectors, we obtain
Volume 15 · Number 3 · Fall 2017

244 Andrew Phiri
table 3 Long-Run Regression Results and Linear Error Correction Model Analysis
smrt unemptΨ0 . (.) . (.)***
Ψ1 . (.) . (.)
Δsmrt Δuempt Δsmrt ΔunemptΔsmrt−1 .
(.).(.)
–.(.)***
.(.)
Δsmrt−2 .(.)
.(.)
–.(.)***
.(.)
Δsmrt−3 .(.)
–.(.)
–.(.)*
–.(.)
Δunempt−1 –.(.)
–.(.)
.(.)
–.(.)
Δunempt−2 –.(.)*
–.(.)*
–.(.)
–.(.)
Δunempt−3 –.(.)
–.(.)
–.(.)
–.(.)
ectt−1 –.(.)***
–.(.)
.(.)
–.(.)*
R2 . . . .
dw .(.)
.(.)
.(.)
.(.)
lb . . . .
h01: jse→ unemp . (.)
h02: unemp→ jse . (.)notes
Jmax and Jtrace statistics of 4.59 and 4.09, respectively, when the test is per-formed with a constant, whereas both Jmax and Jtrace statistic produce asimilar value of 4.76 when the test is performedwith a trend.We note thatthese statistics, performed with a constant and a trend, fail to reject thenull of one cointegration relation at all significance levels. Nevertheless,in view of verifying one cointegration relation, we conclude on unani-mous evidence of linear cointegration existing among the variables andthat the estimation of long-run and short-run relations can be conductedwithout concern of obtaining spurious results. We therefore proceed toestimate the long-run regression equations (1) and (2) and their corre-sponding error correction model equations (3) and (4) for the time se-
Managing Global Transitions

The Unemployment-Stock Market Relationship in South Africa 245
ries variables and report the results of this empirical exercise in table 3.In referring to our long-run regression estimates, the slope regression
coefficients are reported in the top portion of table 3.We particularly findthat when stock returns is the dependent variable we obtain an estimateof 0.02 whereas when unemployment is the dependent variable the co-efficient estimate is 0.01. However, based on the corresponding p-valuesthese estimates are rendered as being insignificant. The error correctionterms, as report in themiddle of table 3, produce a significant negative es-timate of –1.03 when stock market returns is the dependent variable andthe driving variable in the system. This implies that 103 percent of devia-tions are corrected each quarter when shock is induced on stock returns.On the other hand, when unemployment is both the dependent variableand the driving variable in the system the error correction term producesa significant negative coefficient of –0.10, which implies that 10 percent ofdeviations from the steady state are corrected each quarter. Furthermore,we note the lack of significant short run effects in the error correctionmodels hence implying there are no short-term equilibrium reverting ef-fects between stock returns and unemployment. In finally turning to ourcausality results, as reported at the bottom of table 3, we find F-values of0.37 when testing the null that stock returns does not ganger cause un-employment and a F-value of 0.26 when testing the other null hypothesisthat unemployment does not granger cause stock returns. Based on the p-values associatedwith both test statistics, we are unable to reject both nullhypotheses thus implying that there are no causality effects between bothtime series variables. We note that this result in line with that obtainedin Farsio and Fazel (2013) who also find that no causality effects betweenunemployment and stock returns for the more developed economies ofthe usa, Chain and Japan.
threshold regression analysisHaving examined linear cointegration effects between the time series, wenow turn our attention towards possible nonlinear cointegration relationsbetween the variables. To do so,we firstly perform the two threshold coin-tegration tests of Enders and Siklos (2001). To recall, the first test is testingthe null hypothesis of no cointegration effects against the alternative oflinear cointegration effects using theΦ statisticswhereas the second test istesting the null hypothesis of linear cointegation against the alternative ofthreshold cointegrationusing theΦ* statistic. As reported in the top panelof table 5, we find that the Φ statistics produces values of 26.36 and 25.38
Volume 15 · Number 3 · Fall 2017

246 Andrew Phiri
for the tar and mtar regressions, respectivelywhen stock returns vari-able is employed as the endogenous variable in the system. Notably, thesestatistics indicate that wemust reject the null of no cointegration at all sig-nificance levels. On the other hand, we obtain weaker Φ statistic valuesof 3.40 and 2.79 for the tar and mtar regressions, respectively, whenunemployment is the dependent variable and these statistics manage toreject the null of no cointegration at a 10 percent significance level. In pro-ceeding to test for threshold cointegration effects we observe that the Φ*statistic produces values of 6.05 and 4.77 for the tar and mtar regres-sions, respectively when stock returns is the dependent variable whereaswe find values of 1.94 and 0.78 for tar and mtar regressions, respec-tively, when unemployment is the dependent variable. Both Φ* statisticsfor the stockmarket regressions reject the linearity hypothesis at a 10 per-cent level of significancewhereas both statistics under the unemploymentregressions fail to reject the linearity hypothesis.Considering that we find significant tar and mtar cointegration ef-
fects for the stock market returns regressions, we then exclusively esti-mate the associated long-run regression coefficients and the thresholderror correction terms for these particular regressions. In similarity tothe long-run coefficient obtained under our linear cointegration analy-sis, we find a positive yet insignificant estimate of 0.72. In turning to theestimates of our threshold error terms, we report significant estimates of–1.13 and –0.59 for ρ1 and ρ2, respectively under the tar model whereaswe also obtain significant estimates of –1.05 and –0.74 for ρ1 and ρ2 forthe mtar specification. Notably, these estimates satisfy the asymmetricequilibrium convergence condition ρ1, ρ2 < 0, which, according to En-ders and Silkos (2001) ensures that the equilibrium error terms are sta-tionary and yet exhibit asymmetric behaviour. In paying closer attentionto the threshold equilibrium error term estimates we further note that forboth tar and mtar specifications, ρ2 < ρ1, hence implying that posi-tive deviations from the equilibrium are corrected quicker than negativedeviations. Interpretively, our results imply that the variables revert totheir steady state position by 113 percent in the case of a negative devi-ation and by 59 percent for a positive deviation, for the case of the tarmodel. On the other hand, equilibrium reversion occurs by 105 percentfor negative deviations and by 74 percent for positive deviations whendictated by mtar dynamics. Overall, this implies that negative shocks,commonly in the form of adverse external shocks, to either stock returnsor the unemployment rate are quickly absorbed in the system in com-
Managing Global Transitions

The Unemployment-Stock Market Relationship in South Africa 247
table 4 tar and mtar Cointegration Tests and Estimates
smrt unempttar mtar tar mtar
Φ
h00: ρ1 = ρ2 = 0.(.)***
.(.)***
.(.)*
.(.)*
Φ*h01: ρ1 = ρ2
.(.)*
.(.)*
.(.)
.(.)
τ . . . .
Ψ0 .(.)
.(.)
Ψ1 .(.)
.(.)
ρ1 –.(.)***
–.(.)***
ρ2 –.(.)***
–.(.)***
notes p-values are reported in parentheses. ***, ** and * represent 1, 5 and 10significance levels, respectively.
parison to positive shocks, which may be in the form of government andother regulatory policies.In light of evidence supporting asymmetric adjustment existing be-
tween jse stock returns and the unemployment rate, we present thethreshold error correction (tec) test and model estimates of the tarand mtar variants using the consistent threshold estimates obtained inour previous threshold cointegration regressions. In firstly testing the nullhypothesis of no threshold error correction effects against the alternativeof threshold error correction effects, we find insignificant statistics of 1.45and 1.41, respectively, for tar and mtar variants of the tec specifica-tions when unemployment is the driving variable in the system. Thisresult implies that there are no significant tec effects when unemploy-ment is the driving variable in the system. Conversely, when stock returnsis the driving variable in the system, the statistics of 4.25 and 2.65, respec-tively obtained for the tar and mtar models are significant and henceimply that we cannot reject the null hypothesis of tec effects. More-over, when stock returns is the driving variable in the system we find anegative and significant error correction terms of –1.18 and –1.11 respec-tively for the tar and mtar models in the lower regime of the tecspecifications. On the other hand, the error correction terms for the tar
Volume 15 · Number 3 · Fall 2017

248 Andrew Phiri
table 5 Threshold Error Correction Tests and Estimates
tar mtar
Δsmrt Δunempt Δsmrt ΔunemptΔsmr−t−1 .
(.).(.)
.(.)
.(.)
Δunemp−t−1 .(.)
–.(.)
.(.)
–.(.)
ect−t−1 –.(.)***
–.(.)
–.(.)***
–.(.)
Δsmr+t−1 .(.)
–.(.)
.(.)
–.(.)
Δunemp+t−1 –.(.)
–.(.)
–.(.)
–.(.)
ect+t−1 –.(.)**
.(.)
–.(.)*
.(.)
R2 . . . .
dw .(.)
.(.)
.(.)
.(.)
lb . . . .
h30: γ1 → γ2 .(.)**
.(.)
.(.)*
.(.)
h40: smr → unemp .(.)
.(.)
.(.)
.(.)
h50: unemp→ smr .(.)
.(.)
.(.)
.(.)
notes p-values are reported in parentheses. ***, **, and * represent 1, 5 and 10significance levels, respectively. The Durbin Watson (dw) statistic for serial correlationindicates that all regressions are free from serial correlation whereas the Ljung-Box (lb)statistic for autocorrelation shows that only the regressions with stock market returns(smr) are free from autocorrelation.
and mtar specifications in the upper regime of the tec systemproducenegative and significant estimates of –0.60 and –0.57, respectively, whenstock returns is the driving variable in the system. Collectively, we treatthis as evidence of long-run equilibrium reverting behaviour in the faceof shock to the system. We also observe insignificant short-run coeffi-cients regardless of whether stock returns or unemployment is the driv-ing variable in the system for both tar and mtar variants of the tecregressions. Note that this result is on par with that obtained in our linearerror correction model estimates. In lastly testing for causality effects be-
Managing Global Transitions

The Unemployment-Stock Market Relationship in South Africa 249
tween unemployment and stock returns, none of the test statistics for thetar and mtar models is able to reject neither null that unemploymentdoes not granger cause stock returns or that stock returns does not causeunemployment. Once again, these results are in coherence with thosepresented in our linear cointegration analysis and with those presentedby Farsio and Fazel (2013) for the usa, China and Japan.
ConclusionThis study becomes the first to investigate the empirical relationship be-tween stock market returns and unemployment for the South Africaneconomy using post-Apartheid quarterly data collected from 1994:01 to2016:01. To ensure a considerable level of robustness the empirical analy-sis was performed using both linear and nonlinear cointegration frame-works. Linear cointegration was conducted using Engle and Granger(1987) two-step cointegration procedure and this was supplemented withJohansen (1991) cointegration tests. On the other hand, nonlinear coin-tegration analysis was done through the testing and estimation of tarand mtar models as outlined in Enders and Granger (1987) as well as inEnders and Silkos (2001).Overall, our empirical results reveal the following. First, we find that
both linear and nonlinear cointegration frameworks validate the pres-ence of long-run steady-state equilibrium between the time series. How-ever, we are unable to find any short-term cointegration effects betweenthe variables under both frameworks. Secondly, the long-run relation-ship found between stock market returns and unemployment is positiveand yet insignificant. This finding implies that any seemingly positivestock returns-unemployment relationship that may be visually observedby chartists is purely coincidental. Thirdly, we do not find any causalityeffects between the time series; that is to say that the information frompast values of stock market returns do not feed into the unemploymentrate, and vice versa. Therefore, whereas we have established cointegrationrelations between the time series, changes in these variables will not affectthe counter variable.There are a number of interesting phenomenon that policymakers, in-
vestors and academics can derive from the empirical results obtained inour study. For instance, policymakers must be aware that the insignifi-cant relationship between stock market returns and unemployment im-plies that the jse cannot be used in any direct way to alleviate the ever-troublesome problem of high unemployment in the country. In other
Volume 15 · Number 3 · Fall 2017

250 Andrew Phiri
words, policymakers are encouraged to stick to their more direct con-ventionalmethods of dealing with unemployment such as infrastructuralspending and other labour market related strategies. Another implica-tion, which can be drawn from our study, is that investors or specula-tors cannot use the domestic unemployment rate to predict or to ‘beat’the stock market and thus gain superior returns on their investments.This also implies that the jse displays elements of weak-form efficiencyin the sense that publically available information concerning unemploy-ment cannot be used to predict the direction of stock market returns andthis is not surprising given that the jse has been recently ranked as themost efficiently regulated exchange in the world by the World EconomicForum. However, this matter concerning the weak-form efficiency of thejse is not all conclusive seeing that the unemployment rate was the onlymacroeconomic variable that was tested for a relationship with stock re-turns. Therefore future research endeavoursmay directed towards testingthe predictability of the stockmarket returns against a host of other finan-cial andmacroeconomic variables such as the exchange rate, the inflationrate, interest rates, economic growth.
References
Abraham, K., and L. Katz. 1986. ‘Cyclical Unemployment: Sectoral Shiftsor Aggregate Disturbances?’ Journal of Political Economy 94:507–22.
Appiah-Kusi, J., and K. Menyah. 2003. ‘Return Predictability in AfricanStock Markets.’ Review of Financial Economics 12:247–70.
Bamidele, I. 2015. ‘Capital Market and Unemployment in Nigeria.’ ActaUniversitatis Dabubius 11 (5): 129–40.
Black, F. 1972. ‘Capital Market Equilibrium with Restricted Borrowing.’Journal of Business 45 (3): 444–55.
Black, F. 1987. Business Cycles and Equilibrium.New York: Blackwell.Blanchard, O. 1981. ‘Output, the Stock Market and Interest Rates.’ The
American Economic Review 11:177–85.Boyd, J., J. Hu, and R. Jagannathan. 2005. ‘The Stock Market’s Reaction to
Unemployment News:Why Bad News is Usually Good for Stocks.’ TheJournal of Finance 60 (2): 649–72.
Brainard, S., and D. Cutler. 1993. ‘Sectoral Shifts and Cyclical Unemploy-ment Reconsidered.’ The Quarterly Journal of Economics 108 (1): 219–43.
Cakan, E. 2012. ‘The Business Cycle and Impacts of Economic News onFinancial Markets.’ Journal of Business and Economics Research 10 (6):385–90.
Managing Global Transitions

The Unemployment-Stock Market Relationship in South Africa 251
Cakan, E., N. Doytch, and K. Upadhyaya. 2015. ‘Does us MacroeconomicNews Make Emerging Financial Markets Riskier.’ Borsa Instanbul Re-view 15 (1): 37–43.
Chehal, P., P. Loungani, and B. Trehan. 2010. ‘Stock-Market-Based Mea-sures of Sectoral Shocks and the Unemployment Rate.’ frbsf Eco-nomic Letter 2010-23, Federal Reserve Bank of San Francisco, SanFrancisco.
Chen, N., R. Roll, and S. Ross. 1986. ‘Economic Forces and Stock Market.’Journal of Business 39:313–29.
Chen, J., P. Kannan, P. Loungani, and B. Trehan. 2011. ‘New Evidence onCyclical and Structural Sources of Unemployment.’ imf Working Pa-per 11-106, International Monetary Fund, Washington, dc.
Cutler, D., J. Poterba, and L. Summers. 1988. ‘What Moves Stock Prices?’nber Working Paper 2538, National Bureau of Economic Research,Cambridge, ma.
Diamond, P. 1982. ‘Wage Determination and Efficiency in Search Equilib-rium.’ The Review of Economic Studies 49:217–27.
Dopke, J., and C. Pierdzioch. 2000. ‘Stock Market Dispersion, SectoralShocks, and the German Business Cycle.’ KielWorking Paper 966, KielInstitute of World Economics, Kiel.
Duca, G. 2007. ‘The Relationship between the StockMarket and the Econ-omy: Experience from International FinancialMarkets.’Bank ofValletaReview, no. 36: 1–12.
Elliot, G., T. Rothenberg, and J. Stock. 1996. ‘Efficient Tests for an Autore-gressive Time Series with a Unit Root.’ Econometrica 64:813–36.
Enders, W., and C. Granger. 1998. ‘Unit Root Tests and Asymmetric Ad-justment with an Example Using the Term Structure of Interest Rates.’Journal of Business and Economic Statistics 16 (3): 304–11.
Enders,W., and P. Siklos. 2001. ‘Cointegration and Threshold Adjustment.’Journal of Business and Economic Statistics 19 (2): 166–76.
Engle, R., andC.Granger. 1987. ‘Co-Integration andErrorCorrection: Rep-resentation, Estimation and Testing.’ Econometrica 55 (2): 251–76.
Fama, E. 1981. ‘Stock Returns, Real Activity, Inflation and Money.’ Ameri-can Economic Review 71 (4): 383–403.
Farmer, R. 2015. ‘The Stock Market Crash Really Did Cause the Great Re-cession.’ Oxford Bulletin of Economics and Statistics 77 (5): 617–33
Farsio, F., and S. Fazel. 2013. ‘The Stock Market/Unemployment Relation-ship in us, China and Japan.’ International Journal of Economics andFinance 5 (3): 24–9.
Fourtin, M., and C. Thivierge. 1997. ‘Sectoral Shifts, Stock Market Disper-sion andUnemployment in Canada.’Applied Economics 29 (6): 829–39.
Fitoussi, J., D. Jestaz, E. Phelps, and G. Zoega. 2000. ‘Roots of the Recent
Volume 15 · Number 3 · Fall 2017

252 Andrew Phiri
Recoveries: Labor Reforms or Private Sector Forces.’ Brookings Paperson Economic Activity, no. 1: 237–312.
Geske, R., and R. Roll. 1983. ‘The Fiscal and Monetary Linkage betweenStock Returns and Inflation.’ Journal of Finance 38 (1): 7–33.
Graham, B., and D. Dodd. 1934. ‘Security Analysis: Principles and Tech-niques.’ New York: McGraw-Hill.
Hall, R. 2014. ‘High Discounts and High Unemployment.’ nber WorkingPaper 19871, National Bureau of Economic Research, Cambridge, ma.
Hansen, B. 2000. ‘Sample Splitting and Threshold Estimation.’ Economet-rica 68 (3): 575–603.
Hussan, S. 2013. ‘South African Capital Markets: An Overview.’ WorkingPaper 2013-04, South African Reserve Bank, Pretoria.
Jagannathan, R., K. Kubota, and H. Takehara. 1998. ‘Relationship betweenLabor-Income Risk and Average Return: Empirical Evidence from theJapanese Stock Market.’ Journal of Business 71 (3): 319–47.
Jagannathan, R., and Z. Wang. 1993. ‘The capm is Alive and Well.’ StaffPaper 165, Federal Reserve Bank of Minneapolis, Minneapolis, mn.
Jorgensen, B., J. Li, andG. Sadka. 2012. ‘EarningsDispersion andAggregateStock Returns.’ Journal of Accounting and Economics 53 (1–2): 1–20.
Johansen, S. 1991. ‘Estimation and Hypothesis Testing of CointegrationVectors in Gaussian Vector Autoregressive Models.’ Econometrica 59(6): 1551–80.
Kalay, A., S. Nallareddy, and G. Sadka. 2015. ‘Conditionally Earnings Dis-persion, the Macroeconomy and Aggregate Stock Returns.’ WorkingPaper, Colombia University and the University of Texas at Dallas.
Kilic, M., and J. Wachter. 2015. ‘Risk, Unemployment, and the Stock Mar-ket: ARare-Event-BasedExplanation of LaborMarketVolatility.’ nberWorking Paper 21575, National Bureau of Economic Research, Cam-bridge, ma.
Krueger, A., and K. Fortson. 2003. ‘Do Markets Respond More to MoreReliable Labor Market Data? A Test of Market Rationality.’ Journal ofEuropean Economic Association 1 (4): 931–57.
Kuehn, L., N. Petrosky-Nadeau, and L. Zhang. 2012. ‘An Equilibrium AssetPricing Model with Labour Search.’ nber Working Paper 17742, Na-tional Bureau of Economic Research, Cambridge, ma.
Lilien, D. 1982. ‘Sectoral Shifts and Cyclical Unemployment.’ Journal of Po-litical Economy 90 (4): 777–93.
Lintner, J. 1965a. ‘The Valuation of Risk Assets and the Selection of RiskyInvestments in Stock Portfolios and Capital Budgets.’ The Review ofEconomics and Statistics 47:13–37.
———. 1965b. ‘Securities Prices, Risk, and Maximal Gains from Diversifi-cation.’ The Journal of Finance 20 (4): 587–615.
Managing Global Transitions

The Unemployment-Stock Market Relationship in South Africa 253
Loungani, P., M. Rush, and W. Tave. 1990. ‘Stock Market Dispersion andUnemployment.’ Journal of Monetary Economics 25 (3): 367–88
Loungani, P., and B. Trehan. 1997. ‘Explaining Unemployment: Sectoral vs.Aggregate Shocks.’ frbsf Economic Review 97 (1): 3–15.
Mandelker, G., and K. Tandon. 1985. ‘Common Stock Returns, Real Ac-tivity, Money and Inflation: Some International Evidence.’ Journal ofInternational Money and Finance 4 (2): 267–86.
McQueen, G., and V. Roley. 1993. ‘Stock Prices, News, and Business Con-ditions.’ Review of Financial Studies 6:683–707.
Miao, J., P. Wang, and L. Xu. 2016. ‘Stock Market Bubbles and Unemploy-ment.’ Economic Theory 61 (2): 273–307.
Mukoyama, T. 2009. ‘A Note on Cyclical Discount Factors and LabourMarketVolatility.’ mpra Paper 74101,MunichPersonal RepecArchive,Munich.
Mortensen, D., and C. Pissarides. 1994. ‘Job Creation and Job Destruc-tion in the Theory of Unemployment.’ The Review of Economic Studies61:397–415.
Mossin, J. 1966. ‘Equilibrium in a Capital Asset Market.’ Econometrica 34(4): 768–83.
Nyasha, S., and N. Odhiambo. 2015. ‘Banks, Stock Market Developmentand Economic Growth in South Africa.’ Applied Economic Letters 22(18): 1480–5.
Orphanides, A. 1992. ‘When Good News is Bad News: MacroeconomicNews and the Stock Market.’ Working Paper, Board of Governors ofthe Federal Reserve System, Washington, dc.
Phelps, E. 1999. ‘Behind this Structural Boom: The Role of Asset Valua-tions.’ American Economic Review 89 (2): 63–8.
Phiri, A. 2014. ‘NonlinearCointegration betweenUnemployment andEco-nomic Growth in South Africa.’ Managing Global Transitions 12 (4),303–24.
———. 2015a. ‘EfficientMarket Hypothesis in South Africa: Evidence fromLinear and Nonlinear Unit Root Tests.’Managing Global Transitions 13(4): 369–87.
———. 2015b. ‘Asymmetric Cointegraiton and Causality Effects betweenFinancial Development and Economic Growth in South Africa.’ Jour-nal of Economic Studies 32 (4): 464–84.
Pissarides, C. 1985. ‘Short-Run Equilibrium Dynamics of Unemployment,Vacancies, and Real Wages.’ American Economic Review 85:676–90.
Schmidt, P., and P. Phillips. 1992. ‘Testing for a Unit Root in the Presenceof Deterministic Trends.’ Oxford Bulletin of Economics and Statistics54:257–88.
Volume 15 · Number 3 · Fall 2017

254 Andrew Phiri
Sharpe, W. 1964. ‘Capital Asset Prices: A Theory of Market Equilibriumunder Conditions of Risk.’ The Journal of Finance 19 (3): 425–42.
Veronesi, P. 1999. ‘StockMarketOverreaction to BadNews inGood Times:A Rationale Expectations Equilibrium Model.’ Review of FinancialStudies 12 (5): 975–1007.
Von Fintel, D., and R. Burger. 2014. ‘Determining the Causes of the RisingSouth African Unemployment Rate: An Age, Period and GenerationalAnalysis.’ Studies in Economics and Econometrics 38 (1): 35–64.
Yartey, C. 2008. ‘The Determinants of Stock Market Development inEmerging Economies: is South Africa Different?’ imf Working Pa-per 2008-32, International Monetary Fund, Washington, dc.
This paper is published under the terms of the Attribution-NonCommercial-NoDerivatives 4.0 International (cc by-nc-nd 4.0)License (http://creativecommons.org/licenses/by-nc-nd/4.0/).
Managing Global Transitions

Business Model Concept: An IntegrativeFramework ProposalMarko PerićUniversity of Rijeka, [email protected]
Vanja VitezićUniversity of Rijeka, [email protected]
Jelena ÐurkinUniversity of Rijeka, [email protected]
Every firm employs a particular business model seeking competitive ad-vantage. However, this pursuit is difficult, and sometimes unsuccessful.The reasons for failure should be sought in the managers’ lack of under-standing of their organisations’ business models, their unique buildingblocks, and the potential that they have. To help managers better under-stand business models, this paper reviews the extant literature and iden-tifies the elements of business models cited therein. Further, consideringthe new needs on the changing markets and the prevailing search for sus-tainability beyond profit, this paper portrays essential business model el-ements in an integrated framework. An updated generic business modelframework consists of four primary categories, namely, value proposition,value capture, value creation, and value network, and could be useful fora variety of organisations, profit and non-profit, with various mission andvision orientations and interaction with the environment.Key Words: business model, value proposition, value creation, valuecapture, value networkjel Classification: m10, l26https://doi.org/10.26493/1854-6935.15.255-274
IntroductionToday, business model (bm) is a frequently used buzzword in businessand management practice. Everyone talks about bms, associating theterm with a firm’s strategy, competitive advantage, e-commerce, innova-tion, or performance. A search (in December 2015) for the term busi-ness model on Google and Google Scholar produced 25 million hitsand 450,000 hits, respectively. Since every viable organisation is built
Managing Global Transitions 15 (3): 255–274

256 Marko Perić, Vanja Vitezić, and Jelena Ðurkin
on a sound bm (Magretta 2002) and bm design has become a key to en-trepreneurial performance and success (Zott and Amit 2007; Kesting andGünzel-Jensen 2015), constant scientific research on bm concept is im-portant for the theoretical development, as well as for venture creation.This is particularly evident in the last 15 years, with academics from var-ious fields of research trying to further explore what stands behind bmconcept (Chen 2003; Lam and Harrison-Walker 2003; Seelos and Mair2005; Chesbrough 2007; Johnson, Christensen, and Kagermann 2008;Zott, Amit, and Massa 2011; Arend 2013; Klang, Wallnöfer, and Hack-lin 2014; Zandoval Bonazzi and Zilber 2014; Mosleh, Nosratabadi, andBahrami 2015). Their efforts indicate that a bm is a particular conceptualtool reflected by the business’s core value proposition(s) for customers,its configured value network to provide that value, and its continued sus-tainability (Osterwalder, Pigneur, and Tucci 2005; Voelpel et al. 2005). Itis a concise representation of a firm’s underlying core logic and strategicchoices for creating sustainable competitive advantage (Morris, Schin-dehutte, and Allen 2005) and for creating and capturing value within avalue network (Shafer, Smith, and Linder 2005; Teece 2010). Put simply, abm is a simplified and aggregated representation of the relevant activitiesof a company (Wirtz et al. 2016), the way a company structures its ownactivities (Onetti et al. 2012), i.e. the story that explains how an enterpriseworks (Magretta 2002).Despite the lacking consensus on bm definition that according to
Shafer, Smith and Linder (2005) may be in part attributed to interdis-ciplinary scholarly perspectives and approaches, academics agree thata bm is an abstract description of how companies create and capturevalue. However, business practice on the one hand and organisationaland system theory on the other do not tolerate ambiguity and vaguenessin definitions. Therefore, both academics and practitioners are strivingto make a ‘big picture’ by putting the pieces of business together. Iden-tification of bm elements and their relationships is an attempt to makethis abstract notion more operative and considerable efforts in definingthese elements have been made in recent years (Hedman and Kalling2003; Johnson, Christensen, and Kagermann 2008; Richardson 2008;Osterwalder and Pigneur 2010; Zott and Amit 2010; Arend 2013; Mat-zler et al. 2013; Bocken et al. 2014; Roome and Louche 2016). In addi-tion, efforts have been made in reviewing the extant literature suggest-ing new, or confirming old, elements and grouping them into logicalunits (e.g. see Shafer, Smith, and Linder 2005; Morris, Schindehutte,
Managing Global Transitions

Business Model Concept: An Integrative Framework Proposal 257
and Allen 2005; Ghaziani and Ventresca 2005; Zott, Amit, and Massa2011; Onetti et al. 2012; Klang, Wallnöfer, and Hacklin 2014; Wirtz et al.2016). One proposal got quite attention in the recent years (especiallyamong practitioners). Osterwalder and Pigneur (2010) focused on howthe business model design and decision-making process can be sup-ported and proposed a handy tool called the ‘Business Model Canvas’(bmc). It consists of nine building blocks (customer segments, customerrelationships, value propositions, channels, key activities, key resources,key partners, cost structure, and revenue streams) and reflects the com-municative nature of the business model generation tool with a graphi-cal outlook. As Faganel, Biloslavo and Janeš (2016) argue, the use of thebmc helps to assess where company’s current business model stands inrelation to its potential, and what should be appropriate next steps forthe further development of that model. Despite the fact that many aca-demics used (andmodified) the bmc within their studies as a conceptualframework (e.g. Zolnowski et al. 2013; Kajanus et al. 2014; Mosleh, Nos-ratabadi, and Bahrami 2015; Faganel, Biloslavo, and Janeš 2016), overallfindings and proposals are not consistent and indicate a variety of dif-ferent bm elements, partial models, and possible interpretations. Sucha high degree of complexity of the subject area surely requires moreresearch.Furthermore, new trends including demand for implementation of
sustainability practices in every business sector, increase of non-for-profitorganisations with entrepreneurial market strategies and overall blurringof boundaries between public, private and civil sector, are calling for newgeneric business model proposals. The emerging literature on sustain-able business models and/or business models for sustainability (bmfs)in recent years (Boons and Lüdeke-Freund 2013; Bocken et al. 2014; Ab-delkafi and Täuscher 2016; Faganel, Biloslavo, and Janeš 2016; Roomeand Louche 2016; to list only a few) contributes to the discussion, butmost of the studies are still focused on for-profit firms thus neglectingother types of organisations within the so-called hybrid spectrum; hy-brid meaning exhibiting qualities of both non-profit and for-profit enter-prises with the commitment to making positive social or environmen-tal impacts. Hybrid organisations usually include social enterprises andnon-for-profits with income generating activities (Monroe-White 2014)as more mission-oriented organisations, but can be extended to sociallyresponsible businesses and corporations practicing social responsibility,which are profit-making motivated (Alter 2003).
Volume 15 · Number 3 · Fall 2017

258 Marko Perić, Vanja Vitezić, and Jelena Ðurkin
This paper builds on these recent works, proposing an updated bmframework based on the research results in terms of elements most fre-quently mentioned in the papers, as well as based on the new needs onthe changing markets and the prevailing search for sustainability beyondprofit. Having in mind the three main levels of abstraction in terms ofbms (Moyon and Lecocq 2013), the proposal made in this paper is ageneric/ideal type model, not specific to a single sector or company, butcomprehensive enough to be useful for a variety of organisations withvarious mission and vision orientations and interaction with the envi-ronment (for classic for-profit enterprises, non-profit organisations, so-cial enterprises and other hybrid organisations).
MethodologyIn this paper, critical analysis of previous research on bm models andtheir elements was conducted as a part of the research design, more pre-cisely, as the first step in the creation of new bm proposal.In conducting the analysis, a multistep process was used in terms of
identifying research criteria, searching for resources, and accessing andevaluating resources. For the analysis to be scientifically traceable, thisstudy examined the existing scientific contribution in the field of litera-ture on bm definitions and elements. First, it searched for articles pub-lished in leading academic and practitioner-oriented management jour-nals from the early publishing dates toDecember 2015. The list of journalsincluded the Academy of Management Journal (amj), Academy of Man-agement Review (amr), Academy of Management Perspectives (amp),Administrative Science Quarterly (asq), Journal of Management (jom),Journal of Management Studies (jms), Management Science (ms), misQuarterly, Organization Science (os), and Strategic Management Jour-nal (smj) as academic journals, and the California Management Review(cmr),Harvard Business Review (hbr), and mit Sloan Management Re-view (msm) as the leading practitioner-oriented journals. Focusing onarticles that contain the term business model in the title or keywords, thissearch revealed 277 articles on bms, of which only 21 had been publishedin academic journals, while 256 had appeared in practitioner-orientedjournals.Next, examining meta-science databases was confirmed as appropri-
ate method for exploring extant literature on bms (Ghaziani and Ven-tresca 2005; Morris, Schindehutte, and Allen 2005; Mäkinen and Seppä-nen 2007; Zott, Amit, and Massa 2011; Boons and Lüdeke-Freund 2013;
Managing Global Transitions

Business Model Concept: An Integrative Framework Proposal 259
Klang, Wallnöfer, and Hacklin 2014; Wirtz et al. 2016). The research wastherefore extended to the abi/inform database because internationalcoverage makes this base one of the most complete sources on businessstudies. The database was searched for academic articles published inscholarly journals in the English language, from all dates but finishingwith December 2015, and containing the term business model in the titleor abstract. As a result of this process, 4,028 articles were obtained andadded to the initial sample of 277 articles. As 16 of the newly found articleswere already present in the initial sample, our overall sample contained4,289 articles.An initial cursory analysis of these 4,289 publications, performed by
reading article titles, publication names, abstracts, and introductions, re-vealed that many of the selected publications would not be useful for fur-ther analysis. Many of these articles were case studies, reports, or stud-ies in which the bm is not really the subject of the analysis. To identifyrelevant articles, the following three additional criteria were introduced.First, to be included in this analysis, an articlemust dealwith the bm con-cept in a nontrivial and non-marginal way. Second, an article also mustrefer to the bm as a concept related to business firms (as opposed to eco-nomic cycles or models, for example). Finally, an article must directlyrefer to the constitute elements or components of a bm. As a result, 4,187articles that did not fit the suggested criteria were eliminated, which leftus with a sample of 102 articles. Through careful reading of these publi-cations, further works on bms were found, primarily books and workingpapers that appeared relevant for this review. The final sample, therefore,contained 108 publications.To gain additional insight, the Shafer, Smith and Linder (2005) ap-
proach was followed by developing an affinity diagram to categorise thefirst- and second-order themes of bm that were cited four or more times.According to Pyzdek (2003), affinity diagrams are a popular business toolfor organising ideas into categories based on their natural relationshipsand underlying similarity and help to identify patterns and establish re-lated groups that exist in qualitative datasets. To develop the affinity dia-gram all three authors worked independently to (a) compare the modelsmentioned most often and study their components, (b) cluster into cate-gories bm components, and (c) develop a descriptive name for each cate-gory. At that point, the preliminary clusters were shared, and the authorsdiscussed the individually developed clusters to reach a consensus.After the literature analysis and affinity diagram creation, main groups
Volume 15 · Number 3 · Fall 2017

260 Marko Perić, Vanja Vitezić, and Jelena Ðurkin
of bm elements were discussed with emphasis on their coverage andoverlapping. The focus of discussion was on the creation of new bmframework suitable for various types of organisations. Results of the lit-erature analysis were taken into consideration, but some elements werere-arranged and new elements and groups introduced in order to supportinnovative businessmodel scheme, comprehensive and simple enough sothat it can be easily understood, communicated, and remembered.
Insights of Literature Analysis
As described in the previous section, this study identified 108 differentpublications that deal with bm elements. Across these 108 publications,one can find 387 different first- and second-order themes, i.e. bm com-ponents, unique building blocks or elements. Given the space and scopeconsiderations for this article, however, only a brief review of these adja-cent literatures is presented in table 1 (the full version is available uponrequest).
table 1 Business Model Elements
Author(s) (year) Business model themes
Mahadevan (2000) Value stream, logistical stream, and revenue stream.
Chesbrough andRosenbloom(2002)
Value proposition, target markets, internal value chain structure,cost structure and profit model, value network, and competitivestrategy.
Hedman andKalling (2003)
Customers, competitors, offering, activities and organization,resources, suppliers of factor and production inputs, and scope ofmanagement.
Voelpel, Leibold,and Tekie (2004)
New customer value proposition, a value network(re)configuration (internal and external structures and processes,core strategy, vision, mission, objective, technology, economics,legal issues), and leadership capabilities.
Morris, Schinde-hutte, and Allen(2005)
Product offering, market factors, internal capability factors, com-petitive strategy factors, economic factors, and growth/exit fac-tors.
Shafer, Smith, andLinder (2005)
Strategic choices (customer, value proposition, capabilities/com-petences, revenue/pricing, competitors, output, strategy, brand-ing, differentiation, mission), value networks (suppliers, cus-tomer information, customer relationship, information flows,product/service flows), creating value (resources/assets, pro-cesses/activities), and capturing value (cost, profit).
Continued on the next page
Managing Global Transitions

Business Model Concept: An Integrative Framework Proposal 261
table 1 Continued from the previous page
Kandampully(2006)
Corporate intent, strategic direction, core capabilities (technol-ogy, networks, relationships, employees), customer, and valueproposition.
Chesbrough (2007) Value proposition, target market, value chain, revenue mecha-nism(s), value network or ecosystem, and competitive strategy.
Johnson, Chris-tensen, and Kager-mann (2008)
Customer value proposition – cvp (target customer, job to bedone, offering), key resources (people, technology, products,facilities, equipment, information, channels, partnerships, al-liances, brand), key processes (processes: design, product de-velopment, sourcing, manufacturing, marketing, hiring andtraining, it; rules and metrics, and norms), and profit formula(revenue model, cost structure, margin model, resource velocity).
Demil and Lecocq(2010)
Resources and competences, organizational structure, and propo-sitions for value delivery.
Kujala et al. (2010) Customer, value proposition for the customer, competitive strat-egy, position in the value network, suppliers’ internal organiza-tion/key capabilities, and logic of revenue generation.
Osterwalder andPigneur (2010)
Customer segments, customer relationships, value propositions,channels, key activities, key resources, key partners, cost struc-ture, and revenue streams.
Zott and Amit(2010)
Design elements (activity system content, structure and gover-nance), and design themes (novelty, lock-in, complementarities,efficiency).
Arend (2013) Value, resources, capabilities, partners (e.g. In interdependentnetworks), structures (e.g. Governance choices), and economicengine.
Matzler et al. (2013) Positioning (customer need), product and service logic (productsand services), value creation architecture (core competencies,core processes), sales and marketing logic, and profit formula(revenue model and cost model).
Research results confirm previously mentioned lack of consensus onbm elements. It seems that some of the components appear in only onedefinition, but others are seen time and time again. For instance, fourelements (value proposition, customer, product, and resources) are men-tioned in more than 20 publications, and 60 out of 387 elements arementioned at least four times. In addition, 16 elements are mentionedthree times, 49 elements two times and 262 elements are mentioned onlyonce. However, regardless of the existing disagreement and large numberof perspectives provided when bm elements are concerned, something
Volume 15 · Number 3 · Fall 2017

262 Marko Perić, Vanja Vitezić, and Jelena Ðurkin
consistently recognised was that definitions often included those ele-ments that comprise the concept of value. Second, some elements couldhave similar or even overlapping meaning. For instance, value, valueproposition, customer value proposition or value offering all indicatethe value that is delivered to a customer, while revenues, revenue model,revenue stream, and revenue sources all refer to revenues within the fi-nancial aspect of a bm.Identified elements are presented through affinity diagram with six
major categories, namely value proposition, value network, value capture,resources, processes, and strategic elements (table 2).The list of elements and their frequencies in the selected body of liter-
ature grouped in the form of affinity diagram is the starting point for fur-ther elaboration on important segments of a generic bm. Simplifying theunderlying logic in overlapping elements and categories of bm, as well asintroducing new elements, important for successfully achieving goals be-yond profit in the form of comprehensive and easily implemented genericbm framework is the task of the next chapter.
Proposal of a Generic Business Model Framework
The importance of the concept of value in bm literature is visible throughan analysis of its frequency, but the context of using value-oriented el-ements differs and the concept should be implemented carefully in thegeneral bm. Mostly defined as a desired product of business operations,or more precisely, as a result of exploitation of business opportunities(Amit and Zott 2010), value is at the heart of many aforementioned def-initions of a bm. However, in order to create comprehensive bm frame-work, it is essential to distinguish between two of the most importanttypes of value relevant for the enterprise:
1. Value that is created and delivered for the purpose of satisfying theneeds of customers or other end-users (see more in Zolnowski et al.2013; Mosleh, Nosratabadi, and Bahrami 2015).
2. Value created to be captured by the enterprise itself for innovatingand/or achieving other goals set in the enterprise’s strategy (seemorein Shaffer, Smith, and Linder 2005; Osterwalder and Pigneur 2010).
Considering that the value does not occur by itself, it is crucial to pro-vide sufficient resources, transform resources into valuable products andservices, and deliver those to customers through different distributionchannels. All of this occurs in a specific strategic context and previous
Managing Global Transitions

Business Model Concept: An Integrative Framework Proposal 263
table 2 Affinity Diagram of Business Model Elements
Element(s) f Element(s) f
Value proposition Value capture
Value proposition . Revenue model .
Customer . Cost structure .
Product . Value capture .
Target Customer . Cost .
Value . Financial aspects .
Customer segments . Revenue stream .
Services . Revenues .
Value offering . Price .
New cust. value proposition . Pricing .
Resources Profit formula .
Resources . Revenue sources .
Technology . Financial model .
Core competencies . Processes
Capabilities . Value creation .
Competences . Processes .
Key resources . Value configuration .
Assets . Infrastructure management .
Brand . Manufacturing .
Information . Activities .
Infrastructure . Value delivery .
Strategic resources . Strategic elements
Value network Mission .
Value network . Structure .
Relationship . Governance .
Customer interface . Network .
Partners . Organisation .
Channels . Scope .
Customer relationship . Competitive strategy .
Distribution Channel . Competitors .
Partner Network . Strategy .
Architecture of value . Management .
Suppliers .
Volume 15 · Number 3 · Fall 2017
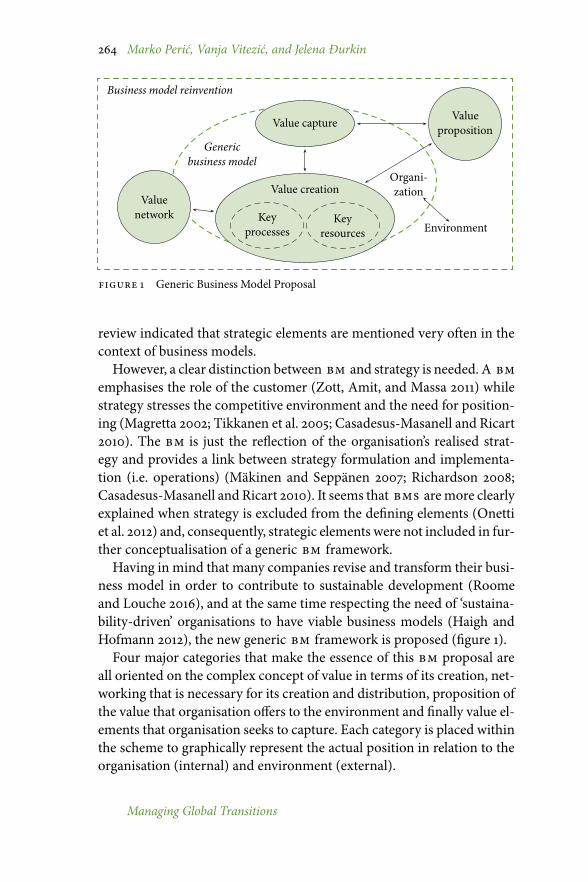
264 Marko Perić, Vanja Vitezić, and Jelena Ðurkin
Business model reinvention
Genericbusiness model
Organi-zation
Environment
ValuepropositionValue capture
Valuenetwork
Value creation
Keyprocesses
Keyresources
figure 1 Generic Business Model Proposal
review indicated that strategic elements are mentioned very often in thecontext of business models.However, a clear distinction between bm and strategy is needed. A bm
emphasises the role of the customer (Zott, Amit, and Massa 2011) whilestrategy stresses the competitive environment and the need for position-ing (Magretta 2002; Tikkanen et al. 2005; Casadesus-Masanell and Ricart2010). The bm is just the reflection of the organisation’s realised strat-egy and provides a link between strategy formulation and implementa-tion (i.e. operations) (Mäkinen and Seppänen 2007; Richardson 2008;Casadesus-Masanell and Ricart 2010). It seems that bms aremore clearlyexplained when strategy is excluded from the defining elements (Onettiet al. 2012) and, consequently, strategic elements were not included in fur-ther conceptualisation of a generic bm framework.Having in mind that many companies revise and transform their busi-
ness model in order to contribute to sustainable development (Roomeand Louche 2016), and at the same time respecting the need of ‘sustaina-bility-driven’ organisations to have viable business models (Haigh andHofmann 2012), the new generic bm framework is proposed (figure 1).Four major categories that make the essence of this bm proposal are
all oriented on the complex concept of value in terms of its creation, net-working that is necessary for its creation and distribution, proposition ofthe value that organisation offers to the environment and finally value el-ements that organisation seeks to capture. Each category is placed withinthe scheme to graphically represent the actual position in relation to theorganisation (internal) and environment (external).
Managing Global Transitions

Business Model Concept: An Integrative Framework Proposal 265
value propositionValue proposition is a concept that explains what benefits (products andservices) an organisation provides and to whom it provides. For thatreason, the perception of value proposition has wide currency in eco-nomics. Chesbrough and Rosenbloom (2002), Voelpel, Leibold and Tekie(2004), Osterwalder, Pigneur and Tucci (2005), Kandampully (2006)and Carayannis, Sindakis and Walter (2015) are only some of the au-thors defining value proposition concept as the core of organisations thatare striving to become and remain sustainable, profitable, and scalable.Evenmore, in today’s complex environment the value proposition shouldprovide measurable ecological and/or social value built into the prod-uct/service offered, in synergy with economic value (Boons and Lüdeke-Freund 2013; Faganel, Biloslavo and Janeš 2016). In analysing consumersof a final product/service, for-profit motivated organisations use the con-cept of customers, traditional non-profits think of their consumer baseas beneficiaries, while hybrid organisations, especially social enterprises,break the customer-beneficiary dichotomy by providing products andservices that, when consumed, produce social value (Battiliana et al.2012). Hence, within the value proposition in the generic bm proposal,both consumers and beneficiaries are listed as end-users of the productsand services.
value captureValue capture defines how an operating mechanism of the organisationproduces financial and non-financial gains, generating it from its valueproposition. As one of the key issues in designing a business model, con-ception of value capture already shifted focus of some scholarly research(see Shafer, Smith, and Linder 2005; Teece 2010; Abdelkafi and Tauscher2015; Roome and Louche 2016). Following Johnson (2010), the questionsof how big an organisation must become in order to break even, what isthe structure of fixed and variable costs, how much money can be madedefining gross and net margins, and how fast the organisation turns overits assets are defined in an economic blueprint called the profit formula. Inspite of the fact that some researchers equate the terms value capture andprofit formula (Johnson, Christensen, and Kagermann 2008; Abdelkafi,Makhotin, and Posselt 2013; Matzler et al. 2013), we propose two elementsunder the heading of value capture, aforementioned profit-formula andnon-profit formula. Therefore, the profit formula consists of costs, rev-enues, and margin model. Having in mind complex environment, sus-
Volume 15 · Number 3 · Fall 2017

266 Marko Perić, Vanja Vitezić, and Jelena Ðurkin
tainable development notion and need for innovativeness as a source ofcompetitiveness, non-profit formula is the second value capture element.It deals with non-financial benefits, which an organisation aims to ‘cap-ture’ and use for further development and fulfilment of mission objec-tives. Although non-profit formula represents a very wide range of el-ements relevant from the perspective of various types of organisations,the authors would like to highlight two key elements:
1. Intellectual ‘added value’ capital – referred to as knowledge that canbe converted into future profits and encompasses various resourcessuch as ideas, inventions, technologies, designs, processes, and soft-ware (Sullivan 1999; Liu 2011). Intellectual added value capital is ac-counted as the difference between the value of an organisation’s out-put intellectual capital and the cost of the organisation’s input intel-lectual capital. Unlike intellectual property (ip) which can be legallyprotected (patented), intellectual capital as a superset is more intan-gible (e.g. the owner of ip has to make a full disclosure of the prop-erty) and does not usually have a legal title of ownership attachedto it. Intellectual capital does not have life expiration date and withpropermanagement, it creates extra value. Therewith, increasing in-tellectual capital ensures the long-term viability of the organisationthat goes beyond profit generation.Obviously, there is a strong coali-tion between intellectual capital and value creation, which is mani-fested within the interaction between assets, processes, and networkgaining core competencies and the organisation’s market value.
2. Public (social) value – a concept very important for non-profitand hybrid organisations because it captures the initial objectiveof their existence and principles related to their core purpose (incases where it is only partially or not at all covered by value propo-sition). It is hard to provide a unified definition of social value(s)because it varies depending on the types of organisations, their mis-sion drivers, and system of internal and external stakeholders. Incase of cooperatives, their internal organisation and common prin-ciples (democracy, cooperation, contribution to the community,etc.) represent value for itself, while in some other organisations,increased public awareness related to the organisations’ activitiesrepresents important value in terms of incentive for future effortsto stay worthy of social approval (Battiliana et al. 2012). Idea to putsocial values and stakeholder interests in business model context
Managing Global Transitions

Business Model Concept: An Integrative Framework Proposal 267
is not completely new, some researchers implemented it using con-cept of social value/social profit formula (e.g. Yunus,Moingeon, andLehmann-Ortega 2010; Pels and Kidd 2015).
It is important to emphasize that the profit formula and non-profit for-mula are both important for various organisations, but probablywith var-ious intensity. Social enterprises are, regardless of their mission orienta-tion, very concerned with profit formula elements in order to ensure eco-nomic sustainability. At the same time, profit-oriented organisations needto keep in mind that mere profit earning without contributing to the in-tellectual capital and broader public benefits might be a shortsighted wayof doing business.
value creationHaving value proposition and value capture already proposed as separatebm elements, the focus is now shifted onmore operational issues, i.e. howthese values are produced. Value creation is therefore operationalised asan organisation’s capacity of creating value and derives from its key re-sources and key processes. Although the link between exploitation of re-sources and benefits created to be captured by the enterprise itself is ob-vious, the emphasis of the value creation is on operating mechanisms es-tablished to create and deliver value to the end-users of the products andservices, i.e. customers and/or beneficiaries.The definition of value creation implies the dynamism of a resource
transformation, that is, the governance transactions designed to createvalue (Amit and Zott 2001; Voelpel, Leibold, and Tekie 2004; Zott andAmitt 2007; Zähringer et al. 2011; Abdelkafi, Makhotin, and Posselt 2013;Roome and Louche 2016). Indeed, what are the key bottleneck assetsto own/control in order to create and capture value is one of the cru-cial issues of a sustainable bm (Teece 2010). Here we propose employees,infrastructure, technology, information, and ip as five inter-dependentkey resources. The value of intangible assets has increased over time andthese assets often constitute a significant proportion of business value(Gomezelj Omerzel and Gulev 2011). Nowadays intangibles often repre-sent a major source of productivity growth with immense interest frominvestors. Despite having huge relevance, we found only a few elements inthe whole sample, so including ip is very meaningful. ip is a result of alldepartments working together in a creative and innovative process, en-deavouring to protect and foster the sustainable value of a brand. More-over, beneficial partnerships and relationships can be developed by own-
Volume 15 · Number 3 · Fall 2017

268 Marko Perić, Vanja Vitezić, and Jelena Ðurkin
ing ip. With constant changes in product and service offerings, organi-sations must perpetually innovate their key processes. This includes notonly manufacturing as an obvious resource transformation activity, butalso marketing, ict, hrm, infrastructure and innovation management,and even financing. Value creation and delivery are sometimes treated asone integral element of a bm (Abdelkafi and Täuscher 2016; Roome andLouche 2016). For instance, in hospitality industry, delivery is inseparablepart of product/service creation. Delivery, as well as all other listed pro-cesses within the value creation category, is directly related to the valuenetwork.
value networkIt is very important for any organisation to focus on its core capabili-ties and outsource other activities or cooperate with partners. Organi-sations must develop new bms, in which both value creation and valuecapture occur in a value network (Hamel 2000), creating a new valuesystem within which different economic players (i.e. suppliers, partners,customers/beneficiaries, distribution channels, allies, and other forms ofcoalition) work together toward one goal, the co-production of value.Value network, called also as an ecosystem (see Chesbrough 2007) fo-cuses therefore on stakeholder involvement (Voelpel, Leibold, and Tekie2005; Kesting 2015). Additionally, from this network perspective, mostlyexternal interactions occur that can have a great influence on the valuecreation and value capture of a company (Ge, Hisrich, and Dong 2009;Puslecki and Staszkow 2015; Wirtz et al. 2016).The interaction of a value network and other bm categories in the form
of two-way value-creating processes can have a direct effect on an organ-isation’s processes and internal capabilities as well. For instance, distri-bution channels, although occasionally treated as a part of a customerdimension (Osterwalder, Pigneur, and Tucci 2005; Zähringer et al. 2011),belong to value network and represent an immediate link to delivery pro-cesses within the scope of value creation. This interdependence amongbm categories can result in gaining expertise and competency in the formof increased relationship reliance and new knowledge focused on realis-ing value as well as providing value.
conclusionsTaking into consideration the significant disagreement and large num-ber of perspectives on bm elements, the authors have created an affin-
Managing Global Transitions

Business Model Concept: An Integrative Framework Proposal 269
ity diagram to associate the key concepts most frequently mentionedin the literature. Based on in-depth analysis of identified affinity dia-gram clusters, the authors have proposed a generic conceptual bm forvarious types of organisations. The offered bm framework mechanism isdescribed through four major categories strongly emphasizing the con-cept of value, namely, value proposition, value creation (involving key re-sources and processes), value capture, and value network. Summarisingthe essence of these four categories, a bm explains the interplay of organ-isation’s resources and partnering ecosystem to create value for end-usersand the organisation itself.The novelty in this approach lies in integrating the principal bm con-
siderations of all organisationswithmarket-oriented activities (regardlessof their pure for-profit, non-profit or hybrid nature) into single frame-work. This extended and integration approach in creating a ‘one-for-all’bm proposal is in line with the notion that any organisation that wants tobe relevant, to deliver the value at scale and to sustain itself, must clearlyarticulate its bm (Kaplan 2011). It is important to note that respondingwith innovations to constant global changes and challenges sometimesprovokes bm reinvention, of course without interfering in organisationstrategy. Furthermore, the capacity of an organisation to capture valuewill be severely compromised if there is no capacity to reinvent its bm orcreate new one. Unique and difficult to imitate bms have greater chancesto be successful and this should be the ultimate aim of every bm reinven-tion or innovation (see also Chesbrough 2007; Johnson, Christensen, andKagermann 2008; Teece 2010; Zott, Amit, and Massa 2011; Matzler et al.2013).From amanagerial viewpoint, this framework may be of particular in-
terest to practitioners. Being aware of distinct pieces of business and theirinterrelationships is decisive when dealing with complex market and en-vironmental challenges. This is true regardless of whether companies arealready in business or just entering it (e.g. start-ups). Therefore, practi-tioners should work with this framework in order to evaluate the busi-ness idea together with different aspects, that is, to have a more holisticunderstanding of their businesses. Despite certain limitations (overgen-eralising in an attempt to create a one-size-fits-all solution, dealing withdivergent literature), the proposal given in this paper can be used for fur-ther scientific research or it can be tested (and, if necessary, revised) on aparticular industry/sector or even on a specific organisational type (e.g.bm for family enterprises, museums, hospitals, etc.).
Volume 15 · Number 3 · Fall 2017

270 Marko Perić, Vanja Vitezić, and Jelena Ðurkin
Acknowledgments
This work has been supported in part by the Croatian Science Foundation(grant number uip-2014-09-1214).
References
Abdelkafi, N., S. Makhotin, and T. Posselt. 2013. ‘Business Models Innova-tion for Electric Mobility: What Can Be Learned from Existing Busi-ness Model Patterns?’ International Journal of Innovation Management17 (1): 1–41.
Abdelkafi, N., and K. Täuscher. 2016. ‘Business Models for Sustainabilityfrom a SystemDynamics Perspective.’Organization & Environment 29(1): 74–96.
Alter, K. S. 2003. ‘Social Enterprise: ATypology of the Field Contextualizedin Latin America.’Working Paper, Inter-AmericanDevelopment Bank,Washington, dc. http://idbdocs.iadb.org/wsdocs/getdocument.aspx?docnum=383929
Amit, R., and C. Zott. 2001. ‘Value Creation in E-Business.’ Strategic Man-agement Journal 22 (6–7): 493–520.
Arend, J. R. 2013. ‘The Business Model: Present and Future – Beyond aSkeumorph.’ Strategic Organization 11 (4): 390–402.
Battiliana, J., M. Lee, C. Walker and C. Dorsey. 2012. ‘In Search of the Hy-brid Ideal.’ Stanford Social Innovation Review 10 (3): 50–55.
Bocken, N. M. P., S. Short, P. Rana, and S. Evans. 2014. ‘A Literature andPractice Review to Develop Sustainable Business Model Archetypes.’Journal of Cleaner Production 65:42–56.
Boons, F., and F. Lüdeke-Freund. 2013. ‘BusinessModels for Sustainable In-novation: State-of-the-Art and Steps towards a Research Agenda.’ Jour-nal of Cleaner Production 45:9–19.
Casadesus-Masanell, R., and J. E. Ricart. 2010. ‘From Strategy to BusinessModels and to Tactics.’ Long Range Planning 43 (2–3): 195–215.
Carayannis, E. G., S. Sindakis, and C. Walter. 2015. ‘Business Model Inno-vation as Lever of Organizational Sustainability.’ The Journal of Tech-nology Transfer 40 (1): 85–104.
Chen, S. 2003. ‘The Real Value of “E-Business Models.”’ Business Horizons46 (6): 27–33.
Chesbrough,H. 2007. ‘BusinessModel Innovation: It’sNot Just about Tech-nology Anymore.’ Strategy & Leadership 35 (6): 12–17.
Chesbrough, H., and R. S. Rosenbloom. 2002. ‘The Role of the BusinessModel in CapturingValue from Innovation: Evidence fromXeroxCor-poration’s Technology Spin-off Companies.’ Industrial and CorporateChange 11 (3): 529–55.
Managing Global Transitions

Business Model Concept: An Integrative Framework Proposal 271
Demil, B., and X. Lecocq. 2010. ‘Business Model Evolution: In Search ofDynamic Consistency.’ Long Range Planning 43 (2–3): 227–46.
Faganel, A., R. Biloslavo and A. Janeš. 2016. ‘The Aquaculture Industryand Opportunities for Sustainable Tourism.’Academica Turistica 9 (2):27–43.
Ge, B., R. D. Hisrich, and B. Dong. 2009. ‘Networking, Resource Acqui-sition, and the Performance of Small and Medium-Sized Enterprises:An Empirical Study of Three Major Cities in China.’ Managing GlobalTransitions 7 (3): 221–39.
Ghaziani, A., and M. J. Ventresca. 2005. ‘Keywords and Cultural Change:Frame Analysis of Business Model Public Talk 1975–2000.’ SociologicalForum 20 (4): 523-59.
Gomezelj Omerzel, D., and R. E. Gulev. 2011. ‘Knowledge Resources andCompetitive Advantage.’Managing Global Transitions 9 (4): 335–54.
Hamel, G. 2000. Leading the Revolution. Cambridge, ma: Harvard Busi-ness School Press.
Haigh,N., andA. J.Hoffman. 2012. ‘HybridOrganizations: TheNextChap-ter of Sustainable Business.’ Organizational Dynamics 41 (2): 126–34.
Hedman, J., and T. Kalling. 2003. ‘The Business Model Concept: Theoret-ical Underpinnings and Empirical Illustrations.’ European Journal ofInformation Systems 12 (1): 49–59.
Johnson, M. W. 2010. Seizing the White Space: Business Model Innovationfor Growth and Renewal. Boston, ma: Harvard Business Press.
Johnson,M.W., C.M.Christensen, andH.Kagermann. 2008. ‘ReinventingYour Business Model.’ Harvard Business Review 86 (12): 50–9.
Kandampully, J. 2006. ‘The New Customer-Centred Business Model forthe Hospitality Industry.’ International Journal of Contemporary Hospi-tality Management 18 (3): 173–87.
Kajanus,M.,A. Iire, T. Eskelinen,M.Heinonen, andE.Hansen. 2014. ‘Busi-nessModel Design: New Tools for Business Systems Innovation.’ Scan-dinavian Journal of Forest Research 29 (6): 603–14.
Kaplan, S. 2011. ‘Business Models Aren’t Just for Business.’ Harvard Busi-ness Review, 19 April. https://hbr.org/2011/04/business-models-arent-just-for
Kesting, P., and F. Günzel-Jensen. 2015. ‘smes and New Ventures NeedBusiness Model Sophistication.’ Business Horizons 58 (3): 285–93.
Klang, D., M. Wallnöfer, and F. Hacklin. 2014. ‘The Business Model Para-dox: A Systematic Review and Exploration of Antecedents.’ Interna-tional Journal of Management Reviews 16 (4): 454–78.
Kujala, S., K. Artto, P. Aaltonen, and V. Turkulainen. 2010. ‘Business Mod-els in Project-Based Firms.’ International Journal of Project Manage-ment 28 (2): 96–106.
Volume 15 · Number 3 · Fall 2017

272 Marko Perić, Vanja Vitezić, and Jelena Ðurkin
Lam, L. W., and L. J. Harrison-Walker. 2003. ‘Toward an Objective-Basedtypology of E-Business Models.’ Business Horizons 46 (6): 17–26.
Liu, C. C. 2011. ‘DevelopingMeasures of Intellectual Capital for theVentureCapital Industry in Taiwan.’Managing Global Transitions 9 (1): 81–100.
Magretta, J. 2002. ‘WhyBusinessModelsMatter?’Harvard Business Review80 (5): 3–8.
Mahadevan, B. 2000. ‘Business Models for Internet-Based E-Commerce.’California Management Review 42 (4): 55–69.
Mäkinen, S., and M. Seppänen. 2007. ‘Assessing Business Model Conceptswith Taxonomical Research Criteria.’ Management Research News 30(10): 735–48.
Matzler, K., F. Bailom, S. F. von den Eichen, and T. Kohler. 2013. ‘BusinessModel Innovation: Coffee Triumphs for Nespresso.’ Journal of BusinessStrategy 34 (2): 30–7.
Monroe-White, T. 2014. ‘Creating Public Value: An Examination of Tech-nological Social Enterprise.’ In Emerging Research Directions in SocialEntrepreneurship, edited by L. Pate. and C. Wankel, 85–111. Dordrecht:Springer Science+Business Media.
Morris, M., M. Schindehutte, and J. Allen. 2005. ‘The Entrepreneur’s Busi-nessModel: Toward a Unified Perspective.’ Journal of Business Research58 (6): 726–35.
Mosleh, A., S. Nosratabadi, and P. Bahrami. 2015. ‘Recognizing the Busi-nessModels Types inTourismAgencies: Utilizing theClusterAnalysis.’International Business Research 8 (2): 173–80.
Moyon, E., and X. Lecocq. 2011. ‘Adopting a Business Model View toStudy Industry Change: The Case of the French Record Industry.’ Pa-per presented at the xxii Conférence Internationale de ManagementStratégique, Clermont-Ferrand, 10–12 June. http://www.businessmodelcommunity.com/fs/Root/azvs0-MOYON_et_lecocq.pdf
Onetti, A., A. Zucchella, M. V. Jones, and P. P. McDougall-Covin. 2012. ‘In-ternationalization, Innovation and Entrepreneurship: BusinessModelsfor New Technology-Based Firms.’ Journal of Management & Gover-nance 16 (3): 337–68.
Osterwalder, A., and Y. Pigneur. 2010. BusinessModel Generation: AHand-book for Visionaries, Game Changers, and Challengers. Hoboken, nj:Wiley.
Osterwalder, A., Y. Pigneur, and C. L. Tucci. 2005. ‘Clarifying BusinessModels: Origins, Present, and Future of the Concept.’Communicationsof the Association for Information Systems 16:1–25.
Pels, J., and T. A. Kidd. 2015. ‘Business Model Innovation: Learning froma High-Tech-Low-Fee Medical Health Care Model for the bop.’ Inter-
Managing Global Transitions

Business Model Concept: An Integrative Framework Proposal 273
national Journal of Pharmaceutical and Health Care Marketing 9 (3):200–18.
Puslecki, L., andM. Staszkow. 2015. ‘New Cooperation Modes: An Oppor-tunity for Polish Biotechnological Clusters.’ Managing Global Transi-tions 13 (2): 171–88.
Pyzdek, T. 2003. The Six Sigma Handbook. New York: McGraw-Hill.Richardson, J. 2008. ‘The Business Model: An Integrative Framework for
Strategy Execution.’ Strategic Change 17 (5–6): 133–44.Roome, N., and C. Louche. 2016. ‘Journeying Toward Business Models for
Sustainability: A Conceptual Model Found inside the Black Box of Or-ganisational Transformation.’ Organization & Environment 29 (1): 11–35.
Seelos, C., and J. Mair. 2005. ‘Social Entrepreneurship: Creating New Busi-ness Models to Serve the Poor.’ Business Horizons 48 (3): 241–6.
Shafer, S. M., H. J. Smith, and J. C. Linder. 2005. ‘The Power of BusinessModels.’ Business Horizons 48 (3): 199–207.
Sullivan, P. H. 1999. ‘Profiting From Intellectual Capital.’ Journal of Knowl-edge Management 3 (2):, 132–42.
Teece, D. J. 2010. ‘BusinessModels, Business Strategy and Innovation.’ LongRange Planning 43 (2–3): 172–94.
Tikkanen, H., J.-A. Lamberg, P. Parvinen, and J.-H. Kallunki. 2005. ‘Man-agerial Cognition, Action and the Business Model of the Firm.’ Man-agement Decision 43 (6): 789–809.
Voelpel, S. C., M. Leibold, and E. B. Tekie. 2004. ‘The Wheel of BusinessModel Reinvention: How to Reshape Your BusinessModel to LeapfrogCompetitors.’ Journal of Change Management 4 (3): 259–76.
Voelpel, S. C., M. Leibold, E. B. Tekie, and G. von Krogh. 2005. ‘Escapingthe Red Queen Effect in Competitive Strategy: Sense-Testing BusinessModels.’ European Management Journal 23 (1): 37–49.
Wirtz, B. W., A. Pistoia, S. Ullrich, and V. Göttel. 2016. ‘Business Models:Origin, Development and Future Research Perspectives.’ Long RangePlanning 49 (1): 36–54.
Yunus, M., B. Moingeon, and L. Lehmann-Ortega. 2010. ‘Building SocialBusiness Models: Lessons from the Grameen Experience.’ Long RangePlanning 43 (2–3): 308–25.
Zandoval Bonazzi, F. L., and M. A. Zilber. 2014. ‘Innovation and BusinessModel: A Case Study about Integration of Innovation Funnel and Busi-ness Model Canvas.’ Review of Business Management 16 (53): 616–37.
Zähringer, D., J. Niederberger, K. Blind, andA. Schletz. 2011. ‘RevenueCre-ation: Business Models for Product-Related Services in InternationalMarkets – The Case of Zwick GmbH & Co. kg.’ The Service IndustriesJournal 31 (4): 629–41,
Volume 15 · Number 3 · Fall 2017

274 Marko Perić, Vanja Vitezić, and Jelena Ðurkin
Zolnowski, A., M. Semmann, S. Amrou, and T. Böhmann. 2013. ‘Identify-ing Opportunities for Service Productivity ImprovementUsing a Busi-ness Model Lens.’ The Service Industries Journal 33 (3–4): 409–25.
Zott, C., and R. Amit. 2007. ‘Business Model Design and the Performanceof Entrepreneurial Firms.’ Organization Science 18 (2): 181–99.
———. 2010. ‘Business Model Design: An Activity System Perspective.’Long Range Planning 43 (2–3): 216–26.
Zott, C., R. Amit, and L. Massa. 2011. ‘The Business Model: Recent Devel-opments and Future Research.’ Journal of Management 37 (4): 1019–42.
This paper is published under the terms of the Attribution-NonCommercial-NoDerivatives 4.0 International (cc by-nc-nd 4.0)License (http://creativecommons.org/licenses/by-nc-nd/4.0/).
Managing Global Transitions

Clusters in the Renewable Energy Sectorin PolandMichał StaszkówPoznan University of Economics and Business, [email protected]
Michał BorychowskiPoznan University of Economics and Business, [email protected]
Filip NowackiPoznan University of Economics and Business, [email protected]
The paper is a review work, which presents the problem of a renewableenergy in Poland supplemented with a case study. To reduce gas emissionand to improve energy efficiency the European Union’s Member States areobliged to obtain more energy from renewable sources. Our goal is to testhow cluster may help in achieving the provisions of 3 × 20 package. Thecase study of Baltic Eco-Energy Cluster is presented as a successful exam-ple of the biggest energy cluster in the country, which can be treated as abenchmark for other sector clusters that are willing to contribute positivelyto changes in Polish energy sector.Key Words: clusters, renewable energy, 3 × 20 packagejel Classification: e00, o13, p28, q20, q4https://doi.org/10.26493/1854-6935.15.275-290
IntroductionThe very concept of a cluster is not new, but there is a lack of scientificstudies that explore clusters in the renewable energy sector. Polish lawdoes not specify clearly the concept of the cluster, and the law on renew-able energy sources came into force in February 2015. In the presentedpaper, the authors conduct a critical literature review on the topic of clus-ters and renewable energy industry. Analysis of the literature concernsscientific papers, regulations and law provided by the European Union,as well as the websites of the Polish Agency for Enterprise Developmentand the various clusters in Poland and the European Union. The adoptedtime range of analysis is 2004–2014, mainly due to the date of Poland’saccession to the European Union. The authors prepared a case study of
Managing Global Transitions 15 (3): 275–290

276 Michał Staszków, Michał Borychowski, and Filip Nowacki
the Baltic Eco-Energy Cluster (beec) based on the website of the PolishAgency for Enterprise Development. Despite the fact that in each regionof Poland there are different clusters focused on the topic of renewableenergy, it seems that only this one presented cluster has a great potentialfor success.Baltic Eco-Energy Cluster located in the north of Poland (which con-
tributes mostly to the production of a renewable energy in the country) isthe biggest energy cluster and the most active one. Therefore, this clusteris a subject of prepared case study, which aims to present a tips and solu-tions for other clusters that may benchmark against beec and improvetheir own organizationmodel. The case study is based on secondary datafrom websites and branch reports. The data for a whole paper will besupplemented with secondary data, mainly from the Central StatisticalOffice of Poland and the data available on the website of the EuropeanCommission (Eurostat).The main aim of this paper is to identify and present the concept of
clusters in the renewable energy sector in Poland. In 2007, the EuropeanCommission presented the climate and energy package briefly named 3×20 package. It imposes a reduction in greenhouse gas emissions by atleast 20, compared to year 1990. The other objective of the package isto increase the share of renewable energy in final energy consumption by20 (for Poland it is reduced to 15) and increase in energy efficiency by20. All of these goals are to be met by 2020. In the paper, the authorswould like to examinewhether the clusters in the renewable energy sectorin Poland have a chance to support fulfilling the goals of the 3 × 20package.Preliminary literature review allows creating some hypothesis on the
subject addressed. The location of clusterwill not be probably determinedby natural factors (existence of water bodies or favourable wind condi-tions), but economic and political factors, associated with the eu funds.Thanks to those funds, clusters in the renewable energy sector have theopportunity for further development, and thus can become an effectivetool for the implementation of the 3×20 package. Another problem arethe global benefits of artificially imposed European Union’s climate andenergy package. It can occur that the energy-intensive production willbe transferred to countries, which are not restricted with climate pack-age. Such situation surprisingly could cause more problems (mainly eco-nomic) for eu Member States than not fulfilling the goals of climate andenergy package.
Managing Global Transitions

Clusters in the Renewable Energy Sector in Poland 277
Clusters: Literature ReviewIn Poland, there are many ongoing initiatives and projects referring tothe concept of cluster. Objectives and structure of these projects, how-ever, have a large variation. The most common definition of a clusterwas developed by Porter (1998), according to whom a cluster is a groupof companies existing in a geographical neighbourhood along with theinstitutions, which are related to them and deal with a particular activ-ity, connected by similarities and competing with one another. The mostimportant in this definition are relationships, cooperation and territorialbonds, which in consequence should generate added value and lead toa competitive advantage on the market (Ratajczak-Mrozek and Herbeć2013).Following papers of Jankowska andPietrzykowski (2013), Ketels (2004)
defined main attributes of clusters:• Proximity: the entities need to be sufficiently and spatially close topermit positive spill-over and enable the sharing of common re-sources to occur;
• Linkages: their activities need to share a common goal for them tobe able to profit from proximity and interactions;
• Interactions: being close andworking on related issues does not seemto be enough – some level of interaction is essential;
• Critical mass: a sufficient number of participants being present isrequired for the interactions to have a meaningful impact on com-panies.
Similar definition was provided by European Commission (2003):Clusters are groups of independent companies and associated institu-tions that are:
• Collaborating and competing;• Geographically concentrated in one or several regions, even thoughthe cluster may have global extensions;
• Specialized in a particular field, linked by common technologies andskills;
• Either science-based or traditional;• Clusters can be either institutionalized (they have a proper clustermanager) or non institutionalized.
According to above-mentioned definitions, there are usually severalparties in cluster initiatives. Those are first of all entrepreneurs, but also
Volume 15 · Number 3 · Fall 2017

278 Michał Staszków, Michał Borychowski, and Filip Nowacki
Entrepreneurs 61r&d institutions 13
Business related inst. 11Other 15
figure 1 Entities Identified as Participants in Clusters and Cluster Initiatives Relatedto Energy in Poland (adapted from Feltynowski and Rzeńca 2012)
financial institutions, public entities – such as local authorities, universi-ties, media and organizations stimulating cooperation (Jankowska 2011).The situation in which the initiative to establish the cluster goes out offirms and is managed by them is so-called bottom-up approach, in con-trary to top-down approach, where activities are undertaken by publicauthorities. Bottom-upmodel seems to bemore effective because it arisesfrom the need of the market (as can be seen in case study of Baltic Eco-Energy Cluster, paragraph 3). This does not exclude cooperation withpublic authorities and public institutions, but allows building trust, whichin effect brings specific benefits (Cook and Morgan 2002):
• Improving the economic efficiency by saving time and effort relatedto specific activities, because they can rely on the word of partner;
• Reduction of the risk associated with the activity;• The development of the ability to learn by the fact that institutionsand companies are parties in the process of information exchange.
The results of research conducted by Feltynowski and Rzeńca (2012)(see figure 1) indicate that the structure of the participants of clusters inPoland favours and confirms bottom-up model.In addition to mentioned benefits, cluster development can contribute
to faster economic growth, increase productivity and profits, attract fdi(foreign direct investment), increase exports and create new jobs thanksto the dynamic growth in the number of enterprises. The resulting com-petitive advantage given location manifests itself nationally and often in-ternationally. Feltynowski and Rzeńca (2012) determined goals of clustersactive in renewable energy sources (res) sector:
• The use and promotion of the region’s potential in the field of res;• Maximizing the use of existing local potential energy (wind powerdevelopment, based on biomass and others);
• Stimulating activities to improve energy efficiency in businesses,households, public buildings;
Managing Global Transitions

Clusters in the Renewable Energy Sector in Poland 279
• Improving energy efficiency leading to energy savings in three areas:final usage, in industry and in the distribution and finally in manu-facture;
• Improving local energy security;• Promotion of Polish energy and environmental technologies;• Promoting innovation in environmental protection and energy;• Minimizing financial, organizational, technical andmental barriers;• Environmental education in all mentioned areas.
Poland provides favourable conditions for the development of inno-vations and entrepreneurship. In recent years, mainly thanks to the eufunds, in Poland were created many business-related institutions aimedat supporting the business and science in the implementation of var-ious types of business ventures and r&d (research and development).These institutions offer, among others, office space, specialized laborato-ries equipment and specialized business consulting. In 2010, a total of 735work centres for innovation and entrepreneurship were active, includ-ing 24 technology parks, 40 business incubators, 90 technology trans-fer centres and 317 training, consulting and information services (Pol-ska Agencja Rozwoju 2012). According to Polish Enterprise DevelopmentAgency, until end of 2015 there were 130 established clusters in Poland(Buczyńska, Fraczek, and Kryjom 2016).Analysis of the structure of Polish cluster initiatives shows that clus-
ters exist in sectors that are considered innovative, as well as more tra-ditional. The most common sector is ict (information and communi-cations technology) (19 clusters), eco-energy (16) and construction (12),medicine and biotechnology (11). As can be seen, the eco-energy sectoris highly ranked among clusters in Poland, as well as the biotechnolog-ical clusters that have been described by Puślecki and Staszków (2015).To understand the reason, it is important to explain the role of so-calledclimate and energy package.
Renewable Energy Sector in the European Union
As a result of the adoption in 2007 by the European Union the so-calledclimate and energy package (3× 20) the eu is required to achieve untilyear 2020 three following key objectives (European Parliament and theCouncil 2009): (1) to reduce greenhouse gas emissions by at least 20compared to 1990; (2) to improve energy efficiency by 20; (3) to increase
Volume 15 · Number 3 · Fall 2017

280 Michał Staszków, Michał Borychowski, and Filip Nowacki
the share of renewable energy in total energy consumption to 20, in-cluding 10 of biofuels in overall fuel consumption in transport. Renew-able energy sources include wind, solar, hydro, geothermal, biomass. Infact, 20 for three objectives is valid in the European Union as a whole,and in the member states, the objectives differ from 20. This applies toboth the size of the planned reduction of carbon dioxide (or even plannedincrease of emissions) and to improve energy efficiency and the share ofenergy from renewable sources in gross final energy consumption. Onlythe target for the share of biofuels in transport fuels of 10 is applicablein all member states.In Poland, the share of renewable energy in the total energy consump-
tion by 2020 is expected to reach 15 due to limited resources and theefficiency of renewable energy sources (res). At the same time there isa possibility that in Poland by 2020 compared to 2005 greenhouse gasemissions will increase in selected sectors of the economy (up by 14)due to lower Gross Domestic Product (gdp) per capita than the averagein the eu (Energia i Środowisko n. d.). As a result, the Polish economy isto remain more competitive (using smaller environmental constraints).This is to allow catching up with more developed eu countries. Thereare some reasons for development of the renewable energy sector, amongothers (European Parliament and the Council 2009; Rifkin 2012):
• The ability to reduce its dependence on energy imports (mainlycrude oil, natural gas) and strengthening energy security;
• Significant economic benefits and positive stimulus for the economy- progress and technological development, creation of new jobs inthe internal market (in the eu), including rural areas;
• Environmental protection and indirect responsibility for the envi-ronment in the countries exporting energy resources to the eu;
• Renewable nature and natural origin.
According to the directive, these objectives are appropriate and achiev-able. They offer companies also stability of their potential investments.Those goals must be achieved cost-effectively (European Parliament andthe Council 2009), suggesting that economic factors should be moreimportant than imposed from administrative regulations. Meanwhilethe cost-effectiveness (economical and environmental) of certain invest-ments in renewable energy sources is questionable and sometimes un-dermined. Other issues and concerns referring to the package 3 × 20,and regarding Poland are as follows (pap 2015):
Managing Global Transitions

Clusters in the Renewable Energy Sector in Poland 281
• Lack of diversification of energy supply sources and the dominanceof coal as an energy source (in Poland –more than 90 of electricityis produced from coal and lignite);
• Economic development is associated with an increase in demandfor energy, thus increasing environmental requirements may eveninhibit economic development;
• The risk of non-competitive renewable energy sector in comparisonto the traditional energy sector, which could lead to the transfer ofenergy-intensive production outside the eu;
• Consequences of political instability andunpredictability – inPolandthe law on renewable energy sources came into force only in Febru-ary 2015 thus this industry was not properly regulated for a longtime.
Except of a number of ongoing discussions on the above package, setwere further targets for climate and energy in the range of competitive,secure and low-carbon eu economy for the year 2030. They plan to cutgreenhouse gas emissions by 40 below 1990 levels and to increase theshare of energy from renewable sources to 27 (this target is not a bindingtarget for eachMember State, but for the whole eu) (European Commis-sion 2014). In August 2014, the Committee of the Regions1 stated that itshould adopted more ambitious targets for the new climate and energypackage. It is about reducing greenhouse gas emissions by 50 comparedto 1990, achieving the share of energy from renewable sources at 40and the reduction of primary energy consumption by 40 compared to2005 (Opinion 2014). These objectives are aimed to avoid warming ex-ceeding 2 degrees Celsius and achieve long-term eu target for reducinggreenhouse gas emissions by 80-95. It seems that these demands are notavailable in someMember States, because there are problems now – withimplementation of the package 3×20. Finally, during the negotiations atthe European Council in October 2014 from the Polish point of view theymanaged to achieve relatively favourable results, i.e. reducing emissionsby 40 compared to 1990 and the share of res of 27 by 2030. In termsof energy efficiency improvements at the level of the eu was establishedindicative target of at least 27 (European Council 2014).Table 1 presents some data on the implementation of one of the basic
objective of the package 3 × 20 – the share of energy from renewablesources in all Members States of the European Union in 2013 and targetsfor 2020. By calculating these indicators the energy consumption in ev-
Volume 15 · Number 3 · Fall 2017

282 Michał Staszków, Michał Borychowski, and Filip Nowacki
ery country was taken into account, and as mentioned, the value of thisindicator in different countries differ from each other, as they depend onthe state of economic development and the potential for growth in theproduction of energy from renewable sources (resource capabilities).It is worth noting that the objective of the share of renewable energy in
2020 at the level ofmore than 20 (the average share of the eu) have bothsome developed countries and less developed countries. On the otherhand, the level of 20 or the lower level was planned in some rich andpoor countries when the level of gdp per capita is taken into account.The share of energy from renewable sources in excess of 20 is realized,inter alia, in the Scandinavian countries (Sweden 49, Finland 38,Den-mark 30), inAustria (34) and France (23), but also in the Baltic States(Estonia 25, Lithuania 23, Latvia 40), in Portugal (31), Romania(24) and Slovenia (25). The share of less than 20 is in some oldMem-ber States, among others: Belgium, Germany, Great Britain, Greece, Ire-land, Italy, the Netherlands, as well as in the new Member States (whichjoined the eu in 2004 and later) – Bulgaria, Czech Republic, Hungary,Poland, Slovakia.It is worth to look also at the degree of achievement of expected de-
mands. Some of the countries already in 2013 reached 2020 plan includingSweden, Austria, Bulgaria and Estonia. Especially the first two countriesare leaders in the development of the renewable energy sector. Howeverin other situations (very low level of implementation of the targeted shareof renewable energy) are inter alia the Netherlands (4.8 compared with14 of the plan, resulting in the degree of implementation at the level of34) and the uk (the share of 4.9 to 15 of the plan, which gives thedegree of implementation of less than 33). In Poland, currently closeto 11.5 of the energy is produced from renewable sources. This meansthat the plan for 2020 is implemented in around 76, which poses a realchance that Polandwill achieve its goal in a few years. In similar situationsare Germany, Hungary, Slovakia and Spain. The higher degree of imple-mentation (over 90) have two Scandinavian countries – Denmark andFinland and three new Member States – Latvia, Lithuania and Romania.It can be assumed that the continuation of the development of renewableenergy sector in these countries will let to fulfil and maintain their ownobjectives to 2020.According to data from the Central Statistical Office, the share of re-
newable energy in total energy consumption is growing. It can be seenmainly in northern Poland (see figure 2), which is associated on the one
Managing Global Transitions

Clusters in the Renewable Energy Sector in Poland 283
table 1 Renewable Energy Sources Share in European Union in 2013and Target for 2020 ()
Specification The share ofrenewable energysources in
The targeted shareof renewable energy
sources in
The current level ofimplementation
Austria . .
Belgium . .
Bulgaria . .
Croatia . .
Cyprus . .
Czech Republic . .
Denmark . .
Estonia . .
Finland . .
France . .
Germany . .
Greece . .
Hungary . .
Ireland . .
Italy . .
Latvia . .
Lithuania . .
Luxembourg . .
Malta . .
Netherlands . .
Poland . .
Portugal . .
Romania . .
Slovakia . .
Slovenia . .
Spain . .
Sweden . .
United Kingdom . .
Eu . .
notes The current level of implementation was calculated as quotient (share in2013/targeted share in 2020). Calculations based on data from European EnvironmentAgency (2015).
Volume 15 · Number 3 · Fall 2017

284 Michał Staszków, Michał Borychowski, and Filip Nowacki
Less than 1 1.00–3.00 3.01–7.50 7.51–16.00 More than 16figure 2 The Share of Renewable Energy in Total Energy Production in Regions
in 2005 and 2009 (adapted from Feltynowski and Rzeńca 2012)
table 2 Structure of Use of Renewable Energy Sources in Poland in 2004–2015 ()
Year Renewable energysources –Electricity
Renewable energysources –Transport
Renewable energysources – Heating
and Cooling
Renewable energysources
. . . .
. . . .
. . . .
. . . .
. . . .
. . . .
. . . .
. . . .
. . . .
. . . .
. . . .
. . . .
notes Based on data from Eurostat (http://ec.europa.eu/eurostat).
hand with favourable natural conditions, while on the other with the ac-tivity of energy clusters, such as Baltic Eco-Energy Cluster.Table 2 analyses the structure of energy consumption from renewable
sources divided into the consumption of electricity, heating and cooling,and transport, in relation to the total energy consumption in a given area.
Managing Global Transitions

Clusters in the Renewable Energy Sector in Poland 285
Relatively minor importance in the early years were res for electricityand transport. With time, however, it was changed. In 2004, electricitywas obtained primarily from the water, followed by solid biofuels, butover time, this trend was reversed. Currently, the most important renew-able source of electricity are just solid biofuels, then wind and hydro. Theshare of renewable energy sources in gross final consumption in Polandis currently (in 2013) of 11.3. According to the strategy of indirect objec-tives (indicative trajectory) designated by the eu, Poland should achievein 2013–2014 the share of 9.5. This means that Poland is well on the wayto 2020 to achieve its target for renewable energy.
Baltic Eco-Energy Cluster Case StudyEven despite the fact that in Poland are located more than 20 clusters fo-cused on a renewable energy sector (Feltynowski and Rzeńca 2012), onlya few of them are active entities. Some of the existing clusters are notconducting any activities, while some others are active to a very limitedextent. The cluster, which is a distinguishing one, which other clustersmay even benchmark against, is the Baltic Eco-Energy Cluster.The Baltic Eco-Energy Cluster was established in 2007, so it is not the
oldest one. Therefore, it may be presumed that the factor of the length ofthe existence on the market is not the dominating element of a success.However, most of the clusters in renewable energy were established inyears 2006–2009, when Polish Agency for Enterprise Development wasfinancially supporting a positive attitude against such cluster initiatives.It may be the reason of the existence of a number of inactive clusters thatwere established on the wave of their boom and positive prosperity. Eventhough the Baltic Cluster is located in Gdańsk, like it was stated earlier,the city of location is not a very strict factor. It is only the main headoffice of cluster’s coordinator. In the cluster included are entities fromthree regions, namely Kujawsko-Pomorskie, Pomorskie andWarmińsko-Mazurskie, so Gdańsk is important city but does not play a dominant rolewithin the cluster.In each of mentioned regions, energy production from renewable re-
sources was very important. In 2009 in Warmińsko-Mazurskie 42 ofproduced energy came from renewable resources, while in Kujawsko-Pomorskie over one-third and Pomorskie almost one-third (Feltynowskiand Rzeńca 2012). It confirms the great importance of renewable energyin this region of Poland and a positive attitude against new technologies.Therefore, it is not surprising that within two years of a time of creation,
Volume 15 · Number 3 · Fall 2017

286 Michał Staszków, Michał Borychowski, and Filip Nowacki
Baltic Eco-Energy Cluster was the most important cluster in the region.According to the most relevant data (http://www.imp.gda.pl/projekty/
bkee/uczestnicy), the beec consists of 174 entities, including:• 133 enterprises;• 14 government entities (small communities, towns and municipaloffices);
• 14 science entities (high schools and universities);• 13 other institutions (foundations, etc.).
While it is believed that due to a maintenance and management issuesa number of participants of energy cluster should not exceed 40 enti-ties (Mazowiecka Agencja Energetyczna 2013) this cluster stays in oppo-sition. The reason is that, this cluster is administrated by Gdański Insty-tut Maszyn Przemysłowych (Gdansk Institute for Industrial Machinery),that coordinates all cluster activities. Therefore the large number of par-ticipants instead of being a problem for a cluster determines its strength.The coordinator cannot dominate over other entities and be a competitiveunit. In case of beec, Gdansk Institute for Industrial Machinery helps inraising external financial funds and establishing collaboration betweenscience and business. Also small clusters may achieve a competitive ad-vantage from specialization. They should focus on some niche as Ekolog-iczny Dom Energooszczedny (Ecological Energy Efficient Home), wheremarket is not so strongly saturated and then strive for perfection in thisspecific area.One of the main companies involved in beec is Energa, one of the
biggest energy companies in the country. In most of the cases such, a bigpartner could act as a threat for other smaller companies. In Baltic Clus-ter, the relations between engaged companies and institutionswere solvedto satisfy all participants. Energa is included only in the biggest researchprojects, so smaller companies can gain experience through cooperationand play the main role in smaller projects. Thanks to that, all companiesare satisfied and potential of each of them is fully exploited.In some cases participants of a cluster (mostly in its initial stage), may
suffer from not possessing a legal personality. It may be solved by theusage of a legal personality of a coordinator of a cluster or one of its par-ticipants (what happened at the beginning also in beec). It is even easierwhen a cluster consists of a large number of participants.The main aim of Baltic Cluster is to introduce and promote a widely
understood idea of distributed co-generation, understood as simultane-
Managing Global Transitions

Clusters in the Renewable Energy Sector in Poland 287
ous small andmedium scale production of thermal energy and electricityfrom renewable energy sources, mainly biomass, but also by convertingwater, solar and wind energy. The advantage of big clusters like beec isa possibility of being active in many areas. beec, due to a large numberof involved entities is active in four main spheres of activities:
• Raw materials based mostly on using biomass;• Research and Development focused on development of new tech-nologies and competitiveness of involved companies in terms ofma-chinery;
• Creating energy from renewable resources and development ofsmall biomass producers;
• Production of machinery for a purpose of bio energy.The Baltic Cluster is active through all stages of work – in – projects as
it is involved both, in development of new research projects and their im-plementation. It is also active in international environment, taking activepart inmeetings of EuropeanCommission advisory groups, internationalprojects, conferences or workshops. The cluster is also aware of the im-portance of good Public Relations. Therefore, it cares about a promotionand organizes conferences, seminars and competitions for junior schools.For the success of beec, very important role-plays a support from in-
volved governmental entities. In case when a cluster does not consist ofsuch entities, it is necessary to ensure a formal cooperationwith cities andinstitutions. Another important factor is a strong support from science tobeec. Because this cluster works together with the best local technologyuniversities, high schools of economy and management and machineryinstitutes, it has a direct access to knowledge resources. It may not suf-fer from a scarcity of well-educated people, who strongly contributes tothe newest technologies used in renewable energy sector. Clusters basedon an expertise that comes from Research and Development work hasa great possibility of receiving attractive funds from grants. More appli-cations for grants does cluster send, increased is its experience. beec isalso an example of open cluster, which co-operates also with other clus-ters (from their proximity). Because to some extent all energy clustersare working on similar tasks, it is much easier for them to co-operate andeven together apply for some external financial resource. The successfulcollaboration between beec and relatively very small (with 16 entities)Nadwiślański Klaster Energii Odnawialnej (Vistula River Valley EnergyCluster) may encourage other clusters to consider working together. Big
Volume 15 · Number 3 · Fall 2017

288 Michał Staszków, Michał Borychowski, and Filip Nowacki
clusters gain knowledge from niche market, while small entity has accessto greater resources. The only important thing is to have a common goal,which both clusters want to achieve.Based on Baltic Eco-Energy Cluster, clusters focused on renewably en-
ergy that are interested in success should follow the following rules:
• Cluster has to be open place, without limit of number of participantsand willing to collaborate with other clusters and institutions;
• Applying for external funds is very important for the functioning ofthe cluster;
• The role of coordinator needs to be made carefully to choose entity,which will not dominate other participants.
ConclusionsThe idea of clusters was known many years, but in Poland, it was de-veloped mainly in the last decade thanks to the eu funds. Clusters areconsidered to be a tool which helps developing innovativeness and im-proving the competitiveness of companies, cities or entire regions. Boomon clusters however causes that this term is overused and often used un-duly. Some clusters are dead formations, created with funds from the eu,in which innovation and cooperation does not have a chance to be devel-oped. At the end of 2015, there were 130 clusters in Poland, of which 16supposed to represent eco-energy sector. This is an area where the con-cept of clustering has greater sense of existence and where well-managedclusters can be a tool for achieving the objectives of the climate package.The case study of Baltic Eco-Energy Cluster is presented as example ofsuccessful and the biggest energy cluster in the country, whichmay act asa benchmark for other sector clusters that are willing to contribute posi-tively to changes in Polish energy sector.
Notes1 Committee of the Regions is a consultative body for the institutions of theEuropeanUnion (EuropeanCommission, Council of the EuropeanUnion,the European Parliament), which represents local and regional authoritiesin the eu.
References
Buczyńska, G., D. Fraczek, and P. Kryjom. 2016. Raport z inwentaryzacjiklastrów w Polsce 2015.Warsaw: Polska Agencja Rozwoju Przedsiebior-czości.
Managing Global Transitions

Clusters in the Renewable Energy Sector in Poland 289
Cooke, P., and K. Morgan. 2002. The Associational Economy: Firms, Re-gions and Innovation. New York: Oxford University Press.
Energia i Środowisko. N. d. ‘Pakiet klimatyczno-energetyczny.’ http://www.energiaisrodowisko.pl/zarzadzanie-energia-i-srodowiskiem/pakiet-klimatyczno-energetyczny
European Commission. 2003 ‘Final Report of the Expert Group on Enter-prise Clusters and Networks.’ European Commission, Brussels.
———. 2014. ‘2030 Climate and Energy Goals for a Competitive, SecureandLow-Carbon eu Economy.’ Press release, 22 January. http://europa.eu/rapid/press-release_IP-14-54_en.htm
EuropeanCouncil. ‘Conclusions on 2030Climate andEnergyPolicy Frame-work.’ euco 169/14, European Council, Brussels.
European Environment Agency. 2015. Renewable Energy in Europe: Ap-proximated Recent Growth and Knock-on Effects. Luxembourg: Publi-cations Office of the European Union.
European Parliament and the Council. 2009. ‘Directive 2009/28/ec of theEuropean Parliament and of the Council of 23 April 2009 on the Pro-motion of the Use of Energy from Renewable Sources and Amendingand Subsequently Repealing Directives 2001/77/ec and 2003/30/ec.’Official Journal of the European Union, l 140.
EuropeanUnion. 2014. ‘Opinion: A Policy Framework for Climate and En-ergy in the Period from 2020 to 2030.’ enve-v-047, Committee of theRegions. https://webapi.cor.europa.eu/documentsanonymous/COR-2014-02691-00-00-AC-TRA-EN.doc/content
Feltynowski, M., andA. Rzeńca. 2012.Klastry energetyczne w Polsce. Szcze-cin: Uniwersytet Szczeciński.
Jankowska, B. 2011. ‘Klastry na usługach innowacyjności przedsiebiorstw.’In Przedsiebiorstwo na rynku miedzynarodowym, edited by J. Schroe-der, 67–77. Poznan: Wydawnictwo Uniwersytetu Ekonomicznego wPoznaniu.
Jankowska, B., andM. Pietrzykowski. 2013. ‘Clusters as Absorbers andDif-fusers of Knowledge.’PoznańUniversity of Economics Review 13 (1): 68–88.
Ketels, C. H. M. ‘European Clusters.’ In Innovative City and Business Re-gions, vol. 3, edited by T. Mentzel, 1–5. Bollschweil: Hagbarth.
pap. 2015. ‘Sejm uchwalił ustawe o odnawialnych źródłach energii.’wnp.plPortalGospodarczy, 16 January. http://energetyka.wnp.pl/sejm-uchwalil-ustawe-o-odnawialnych-zrodlach-energii,242496_1_0_0.html
Polska Agencja Rozwoju. 2012. Klastry w Polsce: Katalog. 2012. Warsaw:Polska Agencja Rozwoju Przedsiebiorczości.
Mazowiecka Agencja Energetyczna. 2013. ‘Analiza rynku klastrów ener-getycznych i innychw środowisku polskim, niemieckim i francuskim–
Volume 15 · Number 3 · Fall 2017

290 Michał Staszków, Michał Borychowski, and Filip Nowacki
raport z badania Desk Research.’ http://www.mae.com.pl/files/analiza-klastrow_www-tryb-zgodnosci.pdf
Porter,M. E. 1998. ‘Clusters and the New Economics of Competition.’Har-vard Business Review 76 (6): 77–90.
Puślecki, Ł., andM. Staszków. 2015. ‘New Cooperation Modes: An Oppor-tunity for Polish Biotechnological Clusters.’ Managing Global Transi-tions 13 (2): 171–18.
Ratajczak Mrozek, M., and M. Herbeć. 2013. ‘Actie and Inactive Clustersin Polish Furniture Industry: The Industrial Network Approach.’ Inter-cathedra 29 (3): 85–94.
Rifkin, J. 2012. Trzecia rewolucja przemysłowa. Katowice: Sonia Draga.
This paper is published under the terms of the Attribution-NonCommercial-NoDerivatives 4.0 International (cc by-nc-nd 4.0)License (http://creativecommons.org/licenses/by-nc-nd/4.0/).
Managing Global Transitions

The Growth Challenge of Western smesin Emerging Markets: An ExploratoryFramework and Policy ImplicationsMitja RuzzierUniversity of Primorska, [email protected]
Yusaf H. AkbarCentral European University, [email protected]
Guido BortoluzziUniversity of Trieste, [email protected]
Andrea TracognaUniversity of Trieste, [email protected]
In this paper, we explore the main inhibiting factors associated with theprocess of entry and escalation of smes in international markets, with afocus on Emerging Markets. We identify and propose seven main cate-gories of Institutional Voids and three main types of resources that maycritically determine smes’ performances on ems, namely, international-ization knowledge, social capital resources and marketing capabilities. In-stitutional Voids and resources are brought together within a conceptualframework suggesting that resource-scarce smes will hold back in theirattempts to commit further to Emerging Markets and will be further dis-suaded the higher the Institutional Voids in the market. The paper con-tributes to the policy literature on sme internationalization by focusingon two areas of public policy action that could have a clear and manifestimpact on smes conduct in Emerging Markets, the first related to the re-sources available to and exploitable by smes and the latter associated withInstitutional Voids.Key Words: smes, emerging markets, institutional voids, resourcesjel Classification: f23, m16, o31https://doi.org/10.26493/1854-6935.15.291-314
Introductionsmes are generally believed to be fundamental to the long-term eco-nomic development of both developed and developing countries. In the
Managing Global Transitions 15 (3): 291–314

292 Mitja Ruzzier, Yusaf H. Akbar, Guido Bortoluzzi, and Andrea Tracogna
Western world, several public programs and policies are aimed at sup-porting the start and establishment of smes, as well as their growth,wherever it takes place, both at the national and at the international level.Due to economic slowdown in developed countries, a growing number
of smes is today entering and trying to establish in Emerging Markets(ems). Yet, after the first market access, these firms are discovering thatthe process of growth is particularly challenging. This is due to two fac-tors. First, smes are typically resource-constrainedwhen comparedwiththeir larger brethren. Second, ems are characterized by ‘unfamiliar con-ditions and problems’ (Arnold and Quelch 1998, 8) that Khanna, Palepuand Sinha (2005) first termed as Institutional Voids.Past research has thoroughly investigated the factors affecting firm
growth on international markets from different perspectives. The adop-tion of theResource-BasedTheory (rbt) in the study of firm internation-alization in general (e.g., Erramilli, Agarwal, and Dev 2002; BrouthersandHennart 2007), and of smes in particular (Ruzzier, Hisrich, and An-toncic 2006; Wright, Westhead, and Ukbasaran 2007), has produced im-portant results, and notably that resourcesmatter in the success of a firm’sinternationalization strategy, especially when entering ems. Further, cur-rent research on ems has shown that Institutional Voids impact the effec-tiveness of the firms’ resources and can impede or even block the progressof these firms in international markets (Meyer et al. 2009; Khanna andPalepu 2010).Our study aims at further investigating the features of the evolution
of Western smes’ internationalization strategies in ems, beyond the en-try mode and the impact of resource-based advantages and institutionalfactors in that process. The aim of this paper is to generate and evalu-ate specific policy frameworks that can facilitate the success of smes inems.We identify the different obstacles that can limit the growth of smesin the ems and suggest a set of effective policies to support such compa-nies in their attempts to escalate in these markets. To do so, we combinethe Resource-Based Theory of the firm (rbt) with an ems’ institutionalperspective.Our paper is structured as follows. First, we discuss Western smes’
weaknesses in ems, through the theoretical lenses of the Uppsala model(Johanson and Vahlne 1977) and the Resource-Based Theory (Barney1991). Second, we describe ems regarding their fundamental characteris-tics, andwith a focus on Institutional Voids. Third, we focus on the role ofsmes’ resources and capabilities in determining their international per-
Managing Global Transitions

The Growth Challenge of Western smes in Emerging Markets 293
formance. Then, we describe how escalation of commitment of smes inems might be constrained by the presence of a weak resource and ca-pabilities base and of significant Institutional Voids. Lastly, we derive aset of policy proposals for governments in their efforts to promote smedevelopment in ems.
Background
smes and their liabilities when enteringemerging markets
The stage-based model of internationalization (Uppsala model) is one ofthe most enduring frameworks in the International Business theory (Jo-hansson and Vahlne 1977; Petersen and Pedersen 1997). According to it,firms choose their optimal mode of serving a foreignmarket by consider-ing their costs and risks in this particular market and their own availableresources (Hood and Young 1979). The level of market-entry commit-ment is related to the firm’s familiarity with the market: the more psy-chically distant the market, the riskier it becomes for the firm to servethis market; hence, the firm tries to minimize its investments by choos-ing a less resource-intensive mode of operation. Later on, firms learnfrom their current operations and activities in the foreign market, and,over time, this learning reduces the level of uncertainty and allows firmsto strengthen their market position and eventually escalate their com-mitment. This process of increasing commitment is not designed to bedeterministic: indeed, it has been recently suggested that commitmentmight decline or even cease if performance prospects are not sufficientlypromising (Johanson and Vahlne 2009).Since the pioneering work of Johanson and Vahlne (1977) on the role
exerted by the accumulation of market knowledge in reducing the psy-chic distance of firms in foreign markets, the Resource-Based Theory(Wernerfelt 1984; Barney 1991) has drawn increasing attention in the In-ternational Business literature (Ruzzier, Hisrich, and Antončič 2006)and has been successfully applied also to the case of smes enteringems (Balboni, Bortoluzzi, and Grandinetti 2013; Bortoluzzi et al. 2014).The difficulties faced by small firms in the international markets havebeen traditionally described and discussed as ‘the cost of doing businessabroad’ (Hymer 1976) and as the ‘liability of foreigners’ (Zaheer 1995).The Resource-Based Theory posits that the generation and the preserva-tion of a competitive advantage is related to the firm’s ability to develop
Volume 15 · Number 3 · Fall 2017

294 Mitja Ruzzier, Yusaf H. Akbar, Guido Bortoluzzi, and Andrea Tracogna
and control specific assets that are valuable, rare, difficult for competitorsto imitate, and difficult if not impossible to replace with other resourcesand capabilities (Barney 1991; Teece, Pisano, and Shuen 1997). Therefore,a difference in the endowment of resources and capabilities explains whyfirms operating in the same sector – thus subject to the same competitivedynamics at the industry level – exhibit different performance levels in amarket (Grant 1991).The same resource-based explanation can be applied to the process of
a firm’s expansion in international markets. Cuervo-Cazurra, Maloney,and Manrakhan (2007) identify three different categories of resource-based challenges in international markets: the loss of an advantage whentransferring a valuable resource into a new country; the creation of a dis-advantage due to the transfer of resources into a new country; the lackof complementary resources to operate abroad. The last category in turngenerates three sub-categories, or ‘liabilities’: liability of expansion, re-lated to the need to operate at a larger scale than before; liability of new-ness (Stinchcombe 1965; Shepherd, Douglas, and Shanley 2000), due tothe need to learn and adapt to a new market, and liability of foreignness,which is mainly related to the difficulties in operating within a new insti-tutional environment.Such liabilities appear to be particularly significant for smes as they
generate competitive advantages based on tacit resources (knowledge)that are not easily transferrable to other markets. Furthermore, their lim-ited resource endowment and their lack of investment capacity generateadditional obstacles in entering and being established in new markets.On top of this, weak managerial and marketing resources may generatefurther problems, explaining their preference for less demanding formsof presence (export-based modes).The limits of an sme’s resource and capabilities base are clearly ob-
servable when they try to enter ems. Compared to developed markets,smes encounter very different institutional environments in ems andoften lack the needed market and cultural understanding, as well as thebusiness and non-business relationships and the associated social capi-tal (in the form of reputation, established relationships and brands). Inthis paper, we argue that smes suffer more such limitations in ems thanin developed markets and comparatively more than larger multinationalfirms, compounded by their weak base of resources and capabilities andthe significant contextual differences they must deal with (Vianelli, deLuca, and Bortoluzzi 2012). Due to such intrinsic weaknesses, there is a
Managing Global Transitions

The Growth Challenge of Western smes in Emerging Markets 295
need for specific policies aimed at supporting and promoting their en-trance and growth in ems.
emerging markets and institutional voidsWhile historically being considered as locations for cost-saving opportu-nities for Western firms (Cavusgil, Knight, and Riesenberger 2012), emsare now experiencing a remarkable growth of purchasing power alongwith mounting expectations of local consumers. These changes push anincreasing number of Western firms to enter those markets to exploittheir potential opportunities involving increased exports, as well as there-location of capital and production and the shift of supplier networksat the global level (Jansson 2007). Yet, despite a positive ems dynamic,a limited group of European smes export to ems (approximately sevento ten per cent of smes according to the European Commission 2011).To explain the phenomenon, some scholars studying developed countryfirms entering ems have drawn attention to the peculiarity and idiosyn-cratic nature of em contexts and to the degree of (under)-development oftheir institutions. Arnold and Quelch (1998, 8) stated that ems are char-acterized by ‘unfamiliar conditions and problems’, which include poorlyfunctioning or non-existent logistical infrastructure (highways, railways,harbours, airports, ict networks), weak market systems and channels(i.e. sales and distribution networks) and important differences in buyerbehaviour that developed country companiesmay find difficult to under-stand and adapt to.The business strategies of firms from developed countries are fre-
quently predicated on institutions that guarantee protection of their tan-gible and intangible resources. The absence of such institutions generatesobstacles to being established in ems. Such Institutional Voids relate tounfamiliar conditions and problems that characterize these markets andcan deter firms from entering them or call for a modification of the entrymodes (Arnold and Quelch 1998; Steenkamp 2005; Khanna and Palepu2010).Notable taxonomies of Institutional Voids include Khanna, Palepu and
Sinha (2005) ‘dimensions of institutional contexts’ and the World Bank’s‘Ease of Doing Business’ survey. The World Bank has ten indices thatmeasure the ease with which companies can do business in a country.Khanna, Palepu and Sinha (2005) developed an exhaustive taxonomy ofpotential Institutional Voids that they gathered into five categories. Thefirst group is the ‘political and social system’ that includes political stabil-
Volume 15 · Number 3 · Fall 2017
296 Mitja Ruzzier, Yusaf H. Akbar, Guido Bortoluzzi, and Andrea Tracogna
ity of the country, the degree of protection of private property and intel-lectual rights and the efficacy of the judiciary system. The second group,called ‘openness’, considers the existence of discriminatory legal restric-tions and constraints facing foreign investors. The third describes Insti-tutional Voids in ‘product markets’ and relates to the ease of access tovaluable information on consumers and market trends, the existence ofan adequate distribution system and the extent of product-related envi-ronmental and safety regulations. The fourth group is concerned with theconditions and flexibility of the ‘labour market’ and deals with the avail-ability and quality of human capital in a specific institutional setting. Thefifth and last category represents the ‘capital market’ and examines theextent and quality of financial intermediaries, venture capital investors,stock markets and regulatory systems (Welter and Smallbone 2011; Gao,Ballantyne, and Knight 2010; Meyer et al. 2009).The core implication of these Institutional Voids taxonomies is that
while the direct cost of doing business in ems may be lower relative todeveloped country markets, Institutional Voids raise both risk and trans-action costs of doing business. Institutional Voids are believed to cre-ate both barriers for firms entering ems and to impose limitations ontheir commitment even if they decide to enter. A weak institutional envi-ronment, in terms of high Institutional Voids, may dissuade firms fromcommitting time and resources in the market, as noted both by Broad-man et al. (2004) and Welter and Smallbone (2011). Further, as reportedby Khanna and Palepu (2010), a major problem in operating in ems isthe lack of ‘intermediaries’ (such as market research firms, developmentagencies, headhunting firms, business schools, advisors, regulators, legis-lators, judiciary system) who can reduce or eliminate Institutional Voids.This is a problem especially for foreign smes, which – due to their lim-ited resource base and lack of experience – would very much like to re-fer to such intermediaries to enter and be established in the ems. Forinstance, Sousa and Bradley (2008) found that the institutional environ-ment, expressed in terms of communication and marketing infrastruc-ture, technical requirements, legal regulations and economic/industrialdevelopment, exerts a significant impact on the export performance ofthe firm. In a later study comparing the internationalization processesof smes in eu, China and Russia, Hilmersson and Jansson (2012) foundthe institutional setting of ems to limit the positive effect provided by theinternationalization knowledge on the internationalization process of thefirm. In a recent qualitative study analysing three European firms, Bor-
Managing Global Transitions

The Growth Challenge of Western smes in Emerging Markets 297
toluzzi et al. (2014) found Institutional Voids to severely affect the wayentering firms set their distribution channels in ems and the decision toinvest in the use of more resource-demanding modes of presence. Fur-ther research also confirmed the role of institutional heterogeneity (anddysfunction) relative to developing country contexts and their impact ona firm’s entry decisions and the effectiveness of subsequent steps in ems(Khanna and Palepu 2010; Ferreira, Li, and Yong Suk 2009; Henisz 2004;Xu and Shenkar 2002; Kostova and Zaheer 1999). Overall, this researchstream has led to a broad-based acceptance that institutions that supportmarkets play a greater role in firm performance (Oliver 1997), ‘directlydetermine what arrows a firm has in its quiver’ (Ingram and Silverman2002, 20), and represent ‘one leg that helps sustaining a [firm’s] strategytripod’ along with the firm’s resources and capabilities and industry con-ditions (Peng, Wang, and Jiang 2008, 921).
Towards Developing a New Framework of smes’ Escalationin Emerging Markets
the drivers of sme escalation in emerging markets
Past research has primarily addressed the theme of Institutional Voidsto investments made by multinationals, frequently contrasting wholly-owned subsidiary (wos) with joint venture (jv) modes (e.g. Brouthers2002; Brouthers and Hennart 2007; Hill, Hwang, and Kim 1990; Puck,Holtbrugge, and Mohr 2009) thus perpetuating a simplified view of thereality, in which smes typically enter foreign markets through export-based modes. Such studies have taken into consideration the limits andconstraints of smes going abroad, suggesting that such firms are lesslikely to pursue high-commitment forms of presence while preferring toapproach foreign markets through direct or indirect exports (Gankema,Snuif, and Zwart 2000; Jansson and Sandberg 2008). Furthermore, whilemany smes enter ems, only a few of them escalate to more resource-committed forms of presence (Akbar, Bortoluzzi, and Tracogna 2014).In this paper, we refer to two types of escalation of commitment in
foreign markets: the first (between-modes) occurs through the adop-tion of riskier modes of operation, as typically described by the stage-based internationalization theory (Johanson and Vahlne 1977); the sec-ond (within-modes) results in the escalation of resource commitmentwithin the initial mode of operation. This latter type of escalation re-lates to the degree to which additional resources, both organisational and
Volume 15 · Number 3 · Fall 2017

298 Mitja Ruzzier, Yusaf H. Akbar, Guido Bortoluzzi, and Andrea Tracogna
managerial, are allocated to operations within a specific em after the en-try phase. Such a concept of escalation is not new to the internationalbusiness literature: indeed, stage-based theories of internationalizationare built around the process of committing additional resources in amar-ket, because of the accumulation of international experience and marketknowledge (Johanson and Vahlne 1977). However, this process of grad-ual establishment in a market (within-modes) is rarely considered as akey dimension of the internationalization process of firms and has beeneven less analysed in the context of ems relative to the first type of esca-lation of commitment (between-modes), which results in the adoption ofa higher mode in the establishment chain, ranging from: indirect export;direct export; strategic alliance (non-equity based agreements includingalso franchising); joint ventures (equity-based agreements) and ForeignDirect Investment (fdi) (Swoboda, Olejnik, and Morschett 2011).Within the framework we are developing, and based on the rbt, three
variables have amajor direct and positive effect on the escalation of smesin the ems: the international knowledge of the firm or entrepreneurs (a),the social capital resources of entrepreneurs and their firms (b) and themarketing capabilities (c). We will refer to the above as the ‘resource andcapabilities base’ (rcb) of smes.Several studies confirm the existence of a positive relationship between
accumulated internationalization knowledge (a) and a firm’s interna-tional achievements. Internationalization knowledge is the outcome ofa learning process-taking place through and after the entry in foreignmarkets (Cavusgil, Knight, and Riesenberger 2012; Dean, Mengüç, andMyers 2000; Johanson and Vahlne 1977). According to Eriksson et al.(1997), such knowledge informs a firm’s entry decision into a foreignmarket. It includes, for instance, the specific rules and customs of themarket, the attitudes and preferences of local consumers, and the specificinformation about local suppliers and distributors. Internationalizationknowledge accumulates over time, as the firm continues to operate in for-eign markets (Blomstermo, Eriksson, and Sharma 2004; Autio, Sapienza,and Almeida 2000). Conversely, should a firm exit foreign markets, itsaccumulated knowledge rapidly obsolesces. The gradual accumulationof internationalization knowledge supports the further internationaliza-tion of firms, encouraging them to enter new, distant markets, and toescalate their existing commitments in already served markets (Francisand Collins-Dodd 2004; Prasad, Ramamurthy, and Naidu 2001). Fran-cis and Collins-Dodd (2004) found a significant relationship between a
Managing Global Transitions

The Growth Challenge of Western smes in Emerging Markets 299
firm’s degree of export commitment, as a proxy of its accumulated expe-rience, and its ability to further expand in foreign markets. Prasad, Ra-mamurthy, and Naidu (2001) found that the international knowledge ofa firm moderates the relationship between its marketing capabilities andits international achievements. In other words, when a firm accumulatesinternational knowledge, it becomes more able to exploit with successits marketing resources and capabilities in international markets. Inter-nationalization knowledge allows managers to better understand foreignmarkets (Axinn 1989) and to better detect additional international op-portunities there (White, Griffith, and Ryans 1998). This is especiallyrelevant for smes whose expansion processes are typically more gradualthan those of mnes (Hilmersson and Jansson 2012). Thus, we can expectthat internationalization knowledge positively impacts a firm’s interna-tional market performance and establishment (Akbar, Bortoluzzi, andTracogna 2014). In other words, smes endowed with greater amounts ofinternationalization knowledge will be better positioned to expand theirbusiness and to succeed also in the context of ems.The importance of social capital resources (b) in the internationaliza-
tion process of smes was identified in different studies (Ruzzier and An-tončič 2007; Birley 1985; Ostgaard and Birley 1994) and will represent oursecond main driver of sme escalation in ems. Social capital, being a re-source itself, is usually embedded within, available through, and derivedfrom the network of relationships at the individual and firm level (Na-hapiet andGhoshal 1998). Regarding the network content, entrepreneurs’social networks can provide entrepreneurs and their firms with informa-tion and access to other scarce resources (Ostgaard and Birley 1994; LiaoandWelsch 2003), and facilitate their identification, collection and alloca-tion (Birley 1985). Social networks help firms expose new opportunities,obtain knowledge and learn from experiences (Chetty and Holm 2000),and establish formal relationships with lending institutions (Honig 1998).Peng and Luo (2000) stated that the social capital embedded in manage-rial ties may be more important in situations of imperfect competition,characterized by weak institutional support and distorted information(such as the ems). The more uncertain the environment, the more likelyinformal ties with managers in other firms will be mobilized (Pfeffer andSalancik 1978).It is broadly accepted that marketing capabilities (c) are a primary
driver of a firm’s competitiveness (Merrilees, Rundle-Thiele, and Lye 2011;Vorhies and Morgan 2005; Weerawardena 2003), while a wide literature
Volume 15 · Number 3 · Fall 2017

300 Mitja Ruzzier, Yusaf H. Akbar, Guido Bortoluzzi, and Andrea Tracogna
recognizes the relevance of such capabilities also when firms enter for-eign markets (Morgan, Katsikeas, and Vorhies 2012). Marketing capabil-ities refer to a firm’s general ability to manage product offerings, businesspartners and distribution systems, as well as advertising and communi-cation activities and pricing (Zhou, Wu, and Barnes 2012; O’Cass and Ju-lian 2003). Cavusgil and Nevin (1981) were among the first to demon-strate that the export propensity of a firm is related to its ability to de-velop effective marketing plans. Zou and Stan (1998) explored ten yearsof empirical literature in this subject and found that the organization ofmarketing resources within a firm and its capacity to manage market re-search and its distribution network are important explanatory variablesof the international presence of firms. More recent studies sharing a sim-ilar conceptual tradition include Hitt et al. (2000), Isobe et al. (2000),Minbaeva et al. (2003), Ruzzier, Hisrich, and Antoncic (2006), Hsu andPereira (2008). Other studies, that explicitly adopted the rbt approach,confirmed this finding. Haar andOrtiz-Buonafina (1995) found thatmar-keting capabilities positively impact the export development of Brazilianfirms. Along the same lines, Lu et al. (2009) found that smes in posses-sion of more adaptive marketing capabilities perform better in foreignmarkets. We can thus conclude that smes that are better equipped withmarketing capabilities will also better perform in the context of ems.
the frameworkThe set of resources described above do not only show a direct positiveeffect on the escalation processes of smes in ems. Indeed, their effect onescalation is negatively moderated by the presence of Institutional Voids.In other words, resources and capabilities have a value that is contingenton the institutional conditions in which they are leveraged: InstitutionalVoids decrease the contextual value of the resources and capabilities andeventually determine, other conditions being equal, a lower-commitmentpresence and a less rapid escalation in the market.Based on the above, we can introduce a set of propositions, which con-
ceptually link smes’ escalation in ems to the resource and capabilitiesvector (rcb), with Institutional Voids playing both a direct and a mod-erating role:proposition 1 The Resource and Capabilities Base (rcb) positively
affects smes’ escalation in ems.proposition 2 Higher institutional voids exert a negative effect on
smes escalation in ems.
Managing Global Transitions

The Growth Challenge of Western smes in Emerging Markets 301
Resources andcapabilities base
Institutionalvoids
Marketescalation(+)
(–)
(–)
figure 1 Framework of smes’ Escalation in Emerging Markets
proposition 3 Institutional Voids negatively moderate the directpositive relation of rcb on smes’ escalation in ems.
The Impact of Institutional Voids on smes’ Escalationin Emerging Markets
In delineating and characterizing Institutional Voids, we have referred tothe World Bank’s Ease of Doing Business Index. For the purposes of ourresearch, we have selected 4 out of 10 sub-indices, namely:
1. Starting (and developing) a business, that is related to the time, costsand red tape that are needed to open a new business;
2. Protecting investors, which measures the strength of shareholderprotection including transparency and the ability to sue officers anddirectors for misconduct;
3. Trading across borders, which is related to the ease of managing im-port/export activities (time, documents and costs);
4. Enforcing contracts, that refers to the ease of procedures and thetime and costs needed to enforce a commercial contract.
Furthermore, we have enlarged the list of institutional factors to in-clude other variables, which are relevant in influencing the mode of pres-ence and operations, and namely:
5. Availability of data and information on the market, related to theease (and cost) of access to relevant information and data that candrive firms’ decisions;
6. Intellectual Property (ip) laws and regulations, that refers to the levelof protection guaranteed to foreign firms’ intellectual capital;
7. Labour contract laws, dealing with the existence of restrictive rulesand regulations to hire (and fire) workers.
Volume 15 · Number 3 · Fall 2017

302 Mitja Ruzzier, Yusaf H. Akbar, Guido Bortoluzzi, and Andrea Tracogna
table 1 Effects of Institutional Voids on smes Escalation in Emerging Markets
Institutional void Potential impact on market escalation
Starting anddeveloping abusiness
The factor is relevant to the theme of escalation when a firm whowas previously exporting in ems decides to establish a direct, localpresence in the market (hence escalating from lower to higherresource commitment modes). In this case, significant difficultyin starting and developing a business locally can discourage a firmfrom growing.
Protecting in-vestors
A lack of protection of foreign investors has a heavy impact on afirm’s escalation process. In such cases, firms will tend to keep anexport-based presence in the market and avoid any investment inproprietary facilities (shops, plants, warehouses, other facilities)given the difficulties in recovering or liquidating assets in the coun-try.
Trading acrossborders
Restrictive trading legislation and practices could have very dif-ferent impacts on firms’ resource commitment decisions. Tradingrestrictions could hamper firms from escalating to heavier modes(i.e., switching from export to fdi) or, conversely, could force firmsto have a local presence right from the beginning due to trade bar-riers that discourage the import of specific goods. Such barriersnormally discourage smaller firms, more than bigger ones. In somecases, restrictive trade rules could disguise the real magnitude offirms’ escalation in a market. For example, rather than pursuing awholly owned fdi project, the firm may prefer or be required toform a Joint Venture instead – implicitly limiting its escalation.
Enforcing con-tracts
An unreliable judiciary system represents a serious impediment tothe international commitment of firms. Firms are less willing to ex-pand their presence in a market if they are not sure to be protectedin case of disputes related to contracts and agreements. In theseinstances, they will prefer to manage sales and supply activitiesthrough spot contracts.
Continued on the next page
Such seven institutional factors can deter firms from entering themor call for a modification of the modes of presence (Steenkamp 2005;Khanna and Palepu 2010). In particular, high levels of Institutional Voidsmight explain why firms adopt a lower-commitment entrymode in inter-national markets (Meyer et al. 2009), because of the higher risks and un-certainties posed on the firm’s investments.Moreover, persistent high lev-els of Institutional Voids may also discourage further escalation of com-mitment once a firm has already entered a market.In table 1, we have described more specifically how each identified In-
stitutional Void affects the escalation of smes in ems.
Managing Global Transitions

The Growth Challenge of Western smes in Emerging Markets 303
table 1 Continued from the previous page
Institutional void Potential impact on market escalation
Availability ofdata and infor-mation on themarket
A lack of data and information can prevent firms from exploitingemerging opportunities in foreign markets hence delaying invest-ments in the development of a proprietary distribution system (i.e.,franchising, directly operated stores, showrooms)
IntellectualProperty (ip)protection andregulations
A special attention is here given to firms that tend to relocate inems their production and new product development activities tobetter meet local specificities. Usually, production activities areassociated with the disclosure of trade secrets and knowledge trans-fers. However, weak ip protection could hamper smaller firms frommoving their activities in ems, thus limiting their commitment offinancial, technological and human resources.
Labour Law Smaller firms normally start escalating in a market by hiring localstaff such as sales agents, area managers and quality controllers.If labour norms and regulations are too complex, firms will bediscouraged in escalating their mode of presence. Conversely, whenlabour norms and regulations are not well defined, smes mightfind it too risky to enter into ill-defined transactions.
Public Policy Proposals to Support smes Escalation in ems
Our conceptual framework of smes escalation in ems holds severalmanagerial and public policy implications. About the managerial im-plications, smes based in advanced economies need to confront the in-stitutional ‘reality’ that their marketing capabilities and knowledge-basedresources – originally built in developed countries – may need to be sup-plemented with new ones to cope with institutional weaknesses inherentin ems. In practice, smes must be aware of the effect that InstitutionalVoids will have on their resources and capabilities and hence be availableto make additional investments to reinforcing them. This implies thatsmes both develop existing resources and capabilities but also supple-ment them with new ones (Bortoluzzi et al. 2014). An effective means ofresource adjustment and development is through networking, especiallyto accelerate the process of knowledge sharing and transfer between firms(Sandberg 2014). Thus, marketing and export partnerships should be en-couraged between smes confronting similar challenges in ems as wellas the building of local marketing networks.Regarding public policy implications, if governmentswish for smes to
be able to fully exploit their current array of marketing and knowledge-based resources and capabilities, there is an onus on them to more ac-
Volume 15 · Number 3 · Fall 2017

304 Mitja Ruzzier, Yusaf H. Akbar, Guido Bortoluzzi, and Andrea Tracogna
tively develop resources that can help smes thrive in ems. Indeed, thelack of specific resources and capabilities and the existence of numerousInstitutional Voids in ems, and their possible negative impact on smes,call for a dedicated set of public policies aimed at supporting firms andhelping them overcome several liabilities when approaching foreignmar-kets (Cuervo-Cazurra, Maloney, and Manrakhan 2007). Effective publicpolicy must address sme weaknesses across numerous dimensions (e.g.attitudinal, experiential, informational and organizational) and providefirms with supplementary assets to compensate for them. Of course, pre-cautions should be in place to avoid such policies induce smes that arenot yet ‘international ready’ to move prematurely and consequently failin ems.Past research has abundantly evaluated the role of government pro-
grams in helping firms entering new markets (e.g. Diamantopoulos,Schlegelmilch, and Inglis 1991; Crick and Czinkota 1995). Most of thenoteworthy research on this topic dates to the early nineties, a periodin which the world was changing rapidly due to the consequences ofthe fall of the Berlin Wall and the sudden opening of new supply, pro-duction and (potential) consumption markets to Western firms’ in post-Communist economies (Arnold and Quelch 1998). However, world tradehas been changing significantly since then, both in terms of geography(new ‘emerging markets’ have ‘emerged’ in the global scenario) and inthe magnitude of firms’ internationalization processes (more smes to-day enter ems, some of them even escalate in their mode of presence).Yet, the debate over supporting policies has not kept pace (Gillespie andRiddle 2004; Francis and Collins-Dodd 2004; Cuervo-Cazurra,Maloney,and Manrakhan 2007). Common weaknesses in government policiessupporting the internationalization of smes include:
• Prioritizing the entry phase of the firm process of internationaliza-tion, instead of looking at their whole process of international ex-pansion;
• Providing support to the firms’ export activities, instead of lookingat further modes of entry and presence;
• Aggregating ‘foreign’ markets instead of distinguishing betweensupports needed to enter mature markets and those relevant forems.
Many policies equally fail to consider that the higher the internationalexperience of a firm in a market the higher its propensity to be involved
Managing Global Transitions

The Growth Challenge of Western smes in Emerging Markets 305
in more advanced stages of the internationalization process (from low tohigh-resource commitment modes of presence). Similarly, most policiesfail to take into consideration the nature of the obstacles such firms faceto achieve their international objectives (Kotabe andCzinkota 1992). Fur-thermore, additional research on the topic has noticed that excess govern-ment support to export activities could prevent firms to follow differentand more profitable internationalization strategies (Acs, Morck, and Ye-ung 2001). As envisaged byWright, Westhead, and Ukbasaran (2007), aneffective set of public policies for smes entering ems should:
• Facilitate the drive for an sme’s early internationalization in ems;• Frame the internationalization processes as a dynamic activity (i.e.an activity that goes beyond the initial market entry) and grade thelevel and type of support appropriately;
• Supplement and complement the relative lack or scarcity of re-sources available to smes;
• Foster and encourage entrepreneurial attitudes and orientation to-wards internationalization in ems;
• help smes leverage international resources through the develop-ment of networks and cooperative arrangements.
Whilst entering and escalating in a foreign market could be closely re-lated, the kind of support that is needed to facilitate the firms’ entry andescalation could differ significantly. First, companies that aim to escalateare already in the market and thus have already developed some form ofpresence and committed resources there. Second, escalating firms are not‘new to the market’. Hence, they have already developed some market-related knowledge and obtained some feedback from the market.In their attempts to support market escalation of smes in ems, policy
makers should intervene both at the level of firms’ resources and capabil-ities and at the level of Institutional Voids. Since foreign firms and insti-tutions cannot readily replace Institutional Voids, policy makers shouldfocus on ways to help smes deal with existing voids.Table 2 summarizes a set of proposals of supporting policies aimed at
helping Western smes in their escalation efforts in ems.The above set of policy proposals, which include educational pro-
grammes, information provision, mentoring and consulting services,can, in our view, effectively support the escalation processes of smes’in ems.
Volume 15 · Number 3 · Fall 2017

306 Mitja Ruzzier, Yusaf H. Akbar, Guido Bortoluzzi, and Andrea Tracogna
table 2 Supporting Policy Proposals Aimed at Helping smes in Their EscalationEfforts in ems
Target* Policy proposals
Internation-alizationknowledge
Different educational programs should be targeted to both start-ing and experienced entrepreneurs to promote periods of stay andmentorship programs in ems, such as Erasmus for entrepreneursin Europe. Often, firms undervalue the importance of training indealing with specific markets, institutions and cultures. Here, there isroom for policies aimed at providing specific training and prepara-tion for managers of smes, emphasizing the sharing and adoption ofbest practices that have succeeded in specific ems.
Social capital The promotion of networking is a way to accelerate the process ofknowledge sharing and transfer between firms. This could be fur-ther underpinned by inviting experts in the field (such as scholarsand consultants from ems) to accelerate the process of experienceacquisition, supporting smes in the absorption and integration ofknowledge from others. Policy makers should encourage network-ing between smes that operate in a certain market, irrespective oftheir industry, to foster knowledge and information exchange. Policymakers could also organize collective ‘market excursions’, where costswould be co-financed. This way, smes could develop/establish newnetworks and knowledge about functioning of ems.
Marketingcapabilities
Policy makers should strengthen and foster an sme’s understandingof ems through the financing of the collection of specific marketdata and the preparation of marketing research studies. Policy mak-ers should also find ways for supporting those firms’ communicationactivities in a market to promote a firm (or a country of origin) brandmore effectively. Marketing capabilities could be developed also byorganizing and co-financing presence in foreign trade fairs and exhi-bitions.
InstitutionalVoid: Startingand developinga business
Direct or indirect support should be offered by policy makers tosmes that want to escalate their form of presence, especially whenred tape is particularly difficult and/or when an institutional supportcould be important to speed-up the process. Direct support couldcome in the form of political pressure to encourage liberalization andharmonization of business legislation. Indirect support could comefrom providing and/or co-financing external consulting to smesfrom em experts. Visits to selected ems would also help smes cometo terms with the realities and challenges of foreign markets.
Continued on the next page
ConclusionsIn this paper, we have explored and framed our conceptual understand-ing of themain inhibiting factors associatedwith the process of escalation
Managing Global Transitions

The Growth Challenge of Western smes in Emerging Markets 307
table 2 Continued from the previous page
Target* Policy proposals
InstitutionalVoid: Protect-ing investors
Policy makers should educate smes about the best methods and ap-proaches to protect their investments. Seminars, mentoring, consult-ing services, sharing of best practices appear to be the most appropri-ate forms. Governments should also provide investors’ insurance inforeign markets.
InstitutionalVoid: Tradingacross borders
When trade barriers are too high, policy makers should help smesin finding alternative solutions. An example is leveraging on ‘trian-gulation’ which means reaching a targeted market indirectly, througha ‘parent’ market that can boast advantageous custom agreements.While current trade legislation and procedural knowledge may bestrong in larger firms, smes may not have the time or resources tolearn how to address all such specific challenges and therefore thereis a role of public policy in providing targeted training on trade rules.
InstitutionalVoid: Enforcingcontracts
Policy makers should help smes navigate foreign judicial systemsthrough specific training and even direct support when needed.
InstitutionalVoid: Availabil-ity of data andinformation onthe market
smes do not normally have sophisticated marketing informationsystems or databases. That is why policy makers should help themwith market studies, meetings with experts and consultants. Onlineplatforms could also help, supporting the collection and exchange ofinformation to enter and operate on foreign markets. Such platformscould be used also as networking media, as well as for creating acollaborative entry of groups of firms into ems, thus sharing thecosts of entry and the potential associated risks.
InstitutionalVoid: Intellec-tual Property(ip) laws andregulations
Policy makers should help smes better understand the risks con-nected with ip rights. Providing information on the theme and de-veloping connections with trustworthy foreign experts in the fieldcan help smes.
InstitutionalVoid: LabourMarket Law
smes are encouraged to hire workers in an em when they havethe support of trustworthy local experts. Policy makers should helpsmes identify those professionals and get firms in contact with them.This can be done through the development and maintenance of adatabase of em experts.
notes * Resource and institutional void.
of smes in international markets, with a special focus on ems. The in-creasing attractiveness of ems, compared with developed markets, hasencouraged aspiring and growth-oriented smes to consider them as im-portant targets. Yet, ems are associated with specific conditions relatedto institutional characteristics, particularly Institutional Voids, which af-
Volume 15 · Number 3 · Fall 2017

308 Mitja Ruzzier, Yusaf H. Akbar, Guido Bortoluzzi, and Andrea Tracogna
fect (moderate) market entry and market escalation strategies of smes.Based on well-established classifications of Institutional Voids and our
personal research, we have identified and proposed sevenmain categoriesof Institutional Voids relevant for smes.We have presented in detail theirpotential influence on entry and escalation of smes in ems. Further, ourpaper has identified three main types of resources and capabilities thatcritically determine a firm’s performance on ems, namely, internation-alization knowledge, social capital resources and marketing capabilities.We have brought together resources and Institutional Voids into a con-ceptual framework of smes escalation in ems. The model suggests thatresource-scarce smes will hold back in their attempts to commit furtherto ems and will be further dissuaded the higher the Institutional Voidsare present in the market.Finally, we considered a set of policy proposals for governments in
their efforts to promote smes entry and escalation in ems, which rep-resent a good basis for enhanced policy development and support, espe-cially with the proper understanding of smes escalation in ems.
ReferencesAcs, Z. J., R. K. Morck, and B. Yeung. 2001. ‘Entrepreneurship, Globaliza-
tion, and Public Policy’. Journal of InternationalManagement 7 (3): 235–51.
Akbar Y., G. Bortoluzzi, and A. Tracogna. 2014. ‘Beyond Entry Mode –sme Escalation in EmergingMarkets: A Conceptual Framework’. Jour-nal for International Business and Entrepreneurship Development 7 (4):326–40.
Arnold, D. J., and J. A. Quelch. 1998. ‘New Strategies in EmergingMarkets’.Sloan Management Journal 40 (1): 7–20.
Autio, E., H. J. Sapienza, and J. G. Almeida. 2000 ‘Effects of Age at En-try, Knowledge Intensity, and Imitability on International Growth.’Academy of Management Journal 43 (5): 909–24.
Axinn, C.N., 1989. ‘Export Performance:DoManagerial PerceptionsMakea Difference?’ International Marketing Review 5 (2): 61–71.
Balboni, B., G. Bortoluzzi, and G. Grandinetti R. 2013. ‘On the Relation-ship between Size, Capabilities and Internationalization: An Explo-rative Analysis of Italian Subcontracting smes’. International Journalof Globalisation and Small Business 5 (1–2): 114–32.
Barney, J. B. 1991. ‘Firm Resources and Sustainable Competitive Advan-tage.’ Journal of Management 17:99–120.
Birley, S. 1985. ‘The Role of Networks in the Entrepreneurial Process.’ Jour-nal of Business Venturing 1 (1): 107–17.
Managing Global Transitions

The Growth Challenge of Western smes in Emerging Markets 309
Blomstermo A, K. Eriksson, and D. D. Sharma 2004. ‘Domestic Activityand Knowledge Development in the Internationalization Process ofFirms.’ Journal of International Entrepreneurship 2 (3): 239–58.
Bortoluzzi, G., M. Chiarvesio, E. Di Maria, and R. Tabacco, R. 2014. ‘Ex-porters Moving toward Emerging Markets: A Resource-Based Ap-proach.’ International Marketing Review 31 (5): 506–25.
Broadman, H. G., J. Anderson, C. A. Claessens, R. Ryterman, S. Slavova,andM. Vagliasindi. 2004. Building Market Institutions in South EasternEurope: Comparative Prospects for Investment and Private Sector Devel-opment. Washington, dc: World Bank.
Brouthers, K. 2002. ‘Institutional, Cultural and Transaction Cost Influ-ences on EntryModeChoice and Performance’. Journal of InternationalBusiness Studies 33 (2): 203–21.
Brouthers, K., and J.-F. Hennart. 2007. ‘Boundaries of the Firm: Insightsfrom International Entry Mode Research.’ Journal of Management 33(3): 395–425.
Cavusgil, S. T., G. Knight, and J. Riesenberger. 2012. International Business:The New Realities. Upper Saddle River, nj: Pearson Education.
Cavusgil, S. T., and J. R. Nevin. 1981. ‘InternalDeterminants of ExportMar-keting Behavior: An Empirical Investigation’. Journal of Marketing Re-search 18 (1): 114–9.
Chetty, S., andB.D.Holm. 2000. ‘Internationalization of Small toMedium-SizedManufacturing Firms: A Network Approach.’ International Busi-ness Review 9 (1): 77–93.
Crick, D., M. R. Czinkota. 1995. ‘Export Assistance: Another Look atWhether We Are Supporting the Best Programs.’ International Mar-keting Review 12 (3): 61–72.
Cuervo-Cazurra A., M. Maloney, and S. Manrakhan. 2007. ‘Causes of theDifficulties in Internationalization’. Journal of International BusinessStudies 38 (5): 709–25.
Dean, D. L., B.Mengüç, and C. P.Myers. 2000. ‘Revisiting FirmCharacter-istics, Strategy, and Export Performance Relationship: A Survey of theLiterature and an Investigation of New Zealand Small ManufacturingFirms.’ Industrial Marketing Management 29 (5): 461–77.
Diamantopoulos, A., B. B. Schlegelmilch, and K. Inglis. 1991. ‘Evaluationof Export Promotion Measures: A Survey of Scottish Food and DrinkExporters.’ In Export Development and Promotion: The Role of PublicOrganizations, edited by F. H. R. Seringhaus and P. Rosson, 189–216.Norwall, ma: Kluwer.
Eriksson, K., J. Johanson, A. Majkgård, and D. Sharma, D. 1997. ‘Experien-tial Knowledge and Cost in the Internationalization Process.’ Journalof International Business Studies 28 (2): 337–60.
Volume 15 · Number 3 · Fall 2017

310 Mitja Ruzzier, Yusaf H. Akbar, Guido Bortoluzzi, and Andrea Tracogna
Erramilli, M. K., S. Agarwal, and C. S. Dev. 2002. ‘Choice Between Non-Equity Entry Modes: An Organizational Capability Perspective.’ Jour-nal of International Business Studies. 33 (2): 223–42.
European Commission. 2011. Opportunities for the Internationalisation ofEuropean smes: Final Report. Brussels: European Commission.
Ferreira, M. P., D. Li., and J. Yong Suk. 2009, ‘Foreign Entry Strategies,Strategic Adaptation to Various Facets of the Institutional Environ-ments.’ Development and Society 38 (1): 27–55.
Francis, J., and C. Collins-Dodd. 2004. ‘Impact of Export Promotion Pro-grams on Firm Competencies, Strategies and Performance.’ Interna-tional Marketing Review 21 (4): 474–95.
Gankema, H., H. Snuif, and P. Zwart. 2000. ‘The Internationalization Pro-cess of Small and Medium Sized Enterprises: An Evaluation of StageTheory.’ Journal of Small Business Management 38 (4): 15–27.
Gao, H., D. Ballantyne, and J. G. Knight. 2010, ‘Paradoxes and GuanxiDilemmas in Emerging Chinese-Western Intercultural Relationships.’Industrial Marketing Management 39 (2): 264–72.
Gillespie, K., and L. Riddle. 2004. ‘Export Promotion Organization Emer-gence and Development: A Call to Research.’ International MarketingReview 21 (4): 462–73.
Grant, R.M. 1991. ‘The Resource-Based Theory of Competitive Advantage,Implications for Strategy Formulation.’California Management Review33 (3): 114–35.
Haar, J., and M. Ortiz-Buonafina. 1995. ‘The Internationalization ProcessandMarketing Activities: The Case of Brazilian Export Firms.’ Journalof Business Research 32 (2): 175–81.
Henisz, W. J. 2004. ‘The Institutional Environment for International Busi-ness.’ InWhat is International Business? Edited by P. J. Buckley, 85–109.London: Palgrave.
Hill, C., P. Hwang, andW. C. Kim. 1990. ‘An Eclectic Theory of the Choiceof International Entry Mode.’ Strategic Management Journal 11:117–28.
Hilmersson, M., and H. Jansson. 2012. ‘International Network ExtensionProcesses to Institutionally Different Markets, Entry Nodes and Pro-cesses of Exporting smes.’ International Business Review 21 (4): 682–93.
Hitt, M. A., M. T. Dacin, E. Levitas, J. L. Arregle, and A. Borza. 2000. ‘Part-ner Selection in Emerging and DevelopedMarket Contexts: Resource-Based andOrganizational Learning Perspectives.’Academy ofManage-ment Journal 43 (3): 449–67.
Honig, B. 1998. ‘What Determines Success? Examining the Human, Fi-nancial, and Social Capital of Jamaican Microentrepreneurs.’ Journalof Business Venturing 13 (5): 371–94.
Managing Global Transitions

The Growth Challenge of Western smes in Emerging Markets 311
Hood, N., and S. Young. 1979. The Economics of Multinational Enterprise.London: Longman.
Hsu, C., and A. Pereira. 2008. ‘Internationalization and Performance: TheModeratingEffects ofOrganizational Learning.’Omega 36 (2): 188–205.
Hymer, S. 1976.The International Operation of National Firms.Cambridge,ma: mit Press.
Ingram, P. L., and B. S. Silverman. 2002.The New Institutionalism in Strate-gic Management. Greenwich, ct: jai Press.
Isobe, T., S. Makino, and D. B. Montgomery. 2000. ‘Resource Commit-ment, Entry Timing and Market Performance of Foreign Direct In-vestments in Emerging Economies: The Case of Japanese InternationalJoint Ventures in China.’ Academy of Management Journal 43 (3): 468–84.
Jansson, H. 2007. International Business Marketing in Emerging CountryMarkets: The ThirdWave of Internationalization of Firms.Cheltenham:Edward Elgar.
Jansson, H., and S. Sandberg. 2008. ‘Internationalization of Small andMedium Sized Enterprises in the Baltic Sea Region.’ Journal of Interna-tional Management 14 (1): 65–77.
Johanson, J., and J. E. Vahlne. 1977. ‘The Internationalization Process ofthe Firm: AModel of KnowledgeDevelopment and Increasing ForeignMarket Commitments.’ Journal of International Business Studies 8 (1):23–32.
———. 2009. ‘The Uppsala Internationalization Process Model Revisited:From Liability of Foreignness to Liability of Outsidership’. Journal ofInternational Business Studies 40 (9): 1411–31.
Khanna, T., and K. Palepu. 2010. Winning in the Emerging Economies: ARoad Map for Strategy and Execution. Cambridge, ma: Harvard Busi-ness Press.
Khanna, T., K. Palepu, and J. Sinha. 2005. ‘Strategies That Fit EmergingMarkets.’Harvard Business Review 83 (6): 63–76.
Kostova, T., and S. Zaheer. 1999, ‘Organizational Legitimacy under Con-ditions of Complexity: The Case of The Multinational Enterprise.’Academy of Management Review 24 (1): 64–81.
Kotabe, M., and M. R. Czinkota. 1992. ‘State Government Promotion ofManufacturing Exports: AGapAnalysis.’ Journal of International Busi-ness Studies 23 (4): 637–58.
Liao, J., and H. Welsch. 2003. ‘Social Capital and Entrepreneurial GrowthAspiration:AComparison ofTechnology- andNon-Technology-BasedNascent Entrepreneurs.’ Journal of High Technology Management Re-search 14:149–70.
Lu, Y., L. Zhou,G. Bruton, andW. Li 2009. ‘Capabilities as aMediator Link-
Volume 15 · Number 3 · Fall 2017
312 Mitja Ruzzier, Yusaf H. Akbar, Guido Bortoluzzi, and Andrea Tracogna
ing Resources and the International Performance of EntrepreneurialFirms in an Emerging Economy.’ Journal of International Business Stud-ies 41 (3): 419–36.
Merrilees, B., S. Rundle-Thiele, and A. Lye 2011. ‘Marketing Capabilities,Antecedents and Implications for b2b sme Performance’. IndustrialMarketing Management 40 (3): 368–75.
Meyer, K. E., S. Estrin, S. K. Bhaumik, and M. W. Peng. 2009. ‘Institu-tions, Resources, and Entry Strategies in Emerging Economies.’ Strate-gic Management Journal 30 (1): 61–80.
Minbaeva, D., T. Pederson, I. Bjorkman, C. Fey, and H. Park. 2003. ‘mncKnowledge Transfer, Subsidiary Absorptive Capacity and hrm.’ Jour-nal of International Business Studies 34 (6): 586–99.
Morgan, N. A., C. S. Katsikeas, and D.W. Vorhies 2012. ‘Export MarketingStrategy Implementation, Export Marketing Capabilities, and ExportVenture Performance.’ Journal of the Academy of Marketing Science 40(2): 271–89.
Nahapiet, J., and S. Ghoshal. 1998. ‘Social Capital, Intellectual Capital, andtheOrganizational Advantage.’Academy ofManagement Review 23 (2):242–66.
O’Cass, A., and C. Julian 2003. ‘Examining Firms and Environmental In-fluences on ExportMarketingMix Strategy and Export Performance ofAustralian Exporters.’ European Journal of Marketing 37 (3–4): 366–84.
Oliver, C. 1997, ‘Sustainable Competitive Advantage: Combining Institu-tional andResource-BasedViews.’ StrategicManagement Journal 18 (9):697–713.
Ostgaard, T., and S. Birley. 1994. ‘Personal Networks and Firm Competi-tive Strategy: A Strategic or Coincidental Match?’ Journal of BusinessVenturing 9 (4): 281–305.
Peng, M. W., and Y. Luo. 2000. ‘Managerial Ties and Firm Performance ina Transition Economy: The Nature of a Micro-Macro Link.’ Academyof Management Journal 43 (3): 486–501.
Peng, M. W., D. Y. Wang, and Y. Jiang. 2008. ‘An Institution-Based Viewof International Business Strategy: A Focus on Emerging Economies.’Journal of International Business Studies 39 (5): 920–36.
Petersen, B., and T. Pedersen. 1997. ‘Twenty Years after: Support and Cri-tique of the Uppsala Internationalisation Model.’ In The Nature of theInternational Firm, edited by I. Björkman and M. Forsgren, 117–34.Copenhagen: Munksgaard.
Pfeffer, J., and G. Salancik. 1978. The External Control of Organizations.New York: Harper and Row.
Prasad, V. K., K. Ramamurthy, and G. M. Naidu. 2001. ‘The Influence ofInternet-Marketing Integration on Marketing Competencies and Ex-
Managing Global Transitions

The Growth Challenge of Western smes in Emerging Markets 313
port Performance.’ Journal of International Marketing 9 (4): 82–110.Puck, J. F., D. Holtbrugge, and A. T. Mohr. 2009. ‘Beyond Entry Mode
Choice: Explaining the Conversion of Joint Ventures into WhollyOwned Subsidiaries in the People’s Republic of China.’ Journal of In-ternational Business Studies 40:388–404.
Ruzzier, M., and B. Antoncic. 2007. ‘Social Capital and sme Internation-alization: An Empirical Examination.’ Transformations in Business andEconomics 6 (1): 122–38.
Ruzzier, M., R. D. Hisrich, and B. Antoncic. 2006. ‘sme Internationaliza-tion Research: Past, Present, and Future.’ Journal of Small Business andEnterprise Development 13 (4): 476–97.
Sandberg, S. 2014, ‘Experiential Knowledge Antecedents of the sme Net-workNode Configuration in EmergingMarket BusinessNetworks.’ In-ternational Business Review 23 (1): 20–9.
Shepherd, D. A., E. J. Douglas, andM. Shanley. (2000). ‘New Venture Sur-vival: Ignorance, External Shocks, and Risk Reduction Strategies.’ Jour-nal of Business Venturing 15 (5): 393–410.
Sousa, C. M., and F. Bradley. 2008. ‘Antecedents of International PricingAdaptation and Export Performance.’ Journal of World Business 43 (3):307–20.
Steenkamp, J. B. E.M. 2005. ‘Moving out of theU.S. Silo: ACall to Arms forConducting International Marketing Research.’ Journal of Marketing69 (4): 6–8.
Stinchcombe, A. L. 1965. ‘Social Structure andOrganizations.’ InHandbookof Organizations, edited by J. March, 142–93. Chicago: Rand McNally.
Swoboda, B., E. Olejnik, and D. Morschett. 2011. ‘Changes in Foreign Op-eration Modes: Stimuli for Increases Versus Reductions.’ InternationalBusiness Review 20 (5): 578–90.
Teece, D., G. Pisano, and A. Shuen. 1997. ‘Dynamic Capabilities and Strate-gic Management.’ Strategic Management Journal 18 (7): 509–33.
Vianelli, D., P. De Luca, and G. Bortoluzzi. 2012. ‘Distribution ChannelGovernance andValue of “Made in Italy” Products in theChineseMar-ket.’ In International Marketing and the Country of Origin Effect, editedby G. Bertoli, and R. Resciniti, 133–53. Cheltenham: Edward Elgar.
Vorhies, D., and N. Morgan. 2005. ‘Benchmarking Marketing Capabilitiesfor Sustainable Competitive Advantage.’ Journal of Marketing 69 (1):80–94.
Weerawardena, J. 2003. ‘The Role of Marketing Capability in Innovation-Based Competitive Strategy.’ Journal of Strategic Marketing 11 (1): 15–35.
Welter, F., and D. Smallbone. 2011, ‘Institutional Perspectives on En-trepreneurial Behavior in Challenging Environments.’ Journal of SmallBusiness Management 49 (1): 107–25.
Volume 15 · Number 3 · Fall 2017

314 Mitja Ruzzier, Yusaf H. Akbar, Guido Bortoluzzi, and Andrea Tracogna
Wernerfelt, B. 1984. ‘A Resource-Based View of the Firm.’ Strategic Man-agement Journal 5:171–80
White, D. S., D. A. Griffith, and J. K. Ryans 1998. ‘Measuring Export Per-formance in Service Industries.’ International Marketing Review 15 (3):188–204.
Wright M., P. Westhead, and D. Ucbasaran. 2007. ‘Internationalization ofSmall and Medium-Sized Enterprises (smes) and International En-trepreneurship: A Critique and Policy Implications.’ Regional Studies41 (7): 1013–29.
Xu, D., andO. Shenkar. 2002. ‘Institutional Distance and theMultinationalEnterprise.’ Academy of Management Review 27 (4): 608–18.
Zaheer, S. 1995. ‘Overcoming the Liability of Foreignness.’ Academy ofManagement Journal 38 (2): 341–63.
Zhou, L., A. Wu, and B. R. Barnes. 2012. ‘The Effects of Early Internation-alization on Performance Outcomes in Young International Ventures:TheMediating Role ofMarketing Capabilities.’ Journal of InternationalMarketing 20 (4): 25–45
Zou, S., and S. Stan. 1998. ‘TheDeterminants of Export Performance: ARe-view of the Empirical Literature between 1987 and 1997’. InternationalMarketing Review 15 (5): 333–56.
This paper is published under the terms of the Attribution-NonCommercial-NoDerivatives 4.0 International (cc by-nc-nd 4.0)License (http://creativecommons.org/licenses/by-nc-nd/4.0/).
Managing Global Transitions

Abstracts in Slovene
Povečanje učinka oblikovanja odločitev in učinkovitosti upravljanja:razumevanje, kako maksimiranje in lokus nadzora vplivatana učinkovitost managerjev na delovnemmestuBrandon William Soltwisch in Keiko Krahnke
Študija preučuje vpliv maksimiranja stila odločanja na učinkovitostupravljanja s skupino 319 delovnih vodij v zda. Ugotovitve kažejo, daso bili menedžerji, ki uporabljajo oblikomaksimiranega stila odločanja,učinkovitejši od tistih, ki ga ne uporabljajo. Ugotovljeno je bilo tudi, dalokus kontrole v tem odnosu igra posredniško vlogo. Maksimizatorji,ki imajo notranji lokus nadzora, so bili znatno učinkovitejši na svojihpoložajih. Rezultati kažejo, da kombinacija maksimiranja in celovitostikontrole zagotavlja močan recept za uspeh vodstva. V zvezi s sedanjimiugotovitvami se razpravlja o rezultatih, posledicah in prihodnjih razi-skovalnih usmeritvah.Ključne besede: maksimizacija, zadovoljstvo, odločanje, učinkovitostvodenjaKlasifikacija jel: l2, m12Managing Global Transitions 15 (3): 215–230
Razmerje med trgom brezposelnosti in borznimi trgi v Južni Afriki:dokazi iz simetričnih in asimetričnih modelov kointegracijeAndrew Phiri
V študiji preučujemo linearno in nelinearno kointegracijo in vzročnezveze med brezposelnostjo ter donosi borznih trgov v Južni Afriki s po-močjo četrtletnih podatko,v zbranih med prvim četrtletjem 1994 in pr-vim četrtletjem 2016. Empirični rezultati kažejo na pomembne učinkekointegracije med časovnima nizoma v linearnih in nelinearnih mode-lih, čeprav oba okvira v končni fazi zavrneta pojem kakršnih koli vzroč-nih razmerij med spremenljivkami. Generalno je naša študije zavrnila,da bi bil pojem brezposelnost dober napovedovalez za donos na bor-znem trgu in da razvoj na borznem trgu ne vpliva na stopnjo brezposel-nosti. Takšni dokazi se zavzemajo za šibko obliko učinkovitosti v cenahlastniških vrednostnih papirjih jse, pri čemer podatki o brezposelnostiinvestitorjem ne morejo pomagati napovedati gibanja prihodnjih cendelnic in nadalje nakazujejo, da se oblikovalci politike ne morejo za-nesti na razvoj borznega trga kot sredstva za zniževanje prevladujočih
Managing Global Transitions 15 (3): 315–317

316 Abstracts in Slovene
visokih stopenj brezposelnosti, kot je določeno v trenutnih ciljih ma-kroekonomske politike.Ključne besede: donos na borzi, brezposelnost, kointegracija, vzročniučinki, model mtar, Južna AfrikaKlasifikacija jel: c13, c22, c52, e24, e44Managing Global Transitions 15 (3): 231–254
Koncept poslovnega modela: predlog integriranega okviraMarko Perić, Vanja Vitezić in Jelena Ðurkin
Vsako podjetje zaposluje glede na nek določen model, ki išče konku-renčne prednosti. Vendar je to prizadevanje težavno in včasih neuspe-šno. Razloge za neuspeh bi morali iskati pri pomanjkanju razumevanjaposlovnih modelov njihovih organizacij, njihovih edinstvenih gradni-kov in potenciala, ki ga imajo. Da bi lahko pomagali upraviteljem boljerazumeti poslovnemodele, se članek ukvarja s pregledomobstoječe lite-rature in identificira elemente poslovnih modelov, ki so navedeni v njej.V nadaljevanju, ob upoštevanju novih potreb na spreminjajočih se trgihin prevladujočega iskanja trajnosti, ki presega dobiček, predstavljamobistvene elemente poslovnega modela v integriranem okviru. Posodo-bljen splošni okvir poslovnega modela sestavljajo štiri primarne kate-gorije, in sicer vrednostna, zajemanje vrednosti, ustvarjanje vrednostiin vrednostno omrežje, kar bi lahko koristilo različnim organizacijam,profitnim ali neprofitnim, z različnimi usmeritvami glede namena invizij ter interakcij z okoljem.Ključne besede: poslovni model, vrednostni predlog, ustvarjanjevrednosti, zajemanje vrednosti, omrežje vrednostiKlasifikacija jel: m10, l26Managing Global Transitions 15 (3): 255–274
Grozdi v sektorju obnovljivih virov energije na PoljskemMichał Staszków, Michał Borychowski in Filip Nowacki
Prispevek je pregled del, ki predstavljajo probleme obnovljive energijena Poljskem, in je dopolnjen s študijo primera. Da bi zmanjšale emisijoplinov in izboljšale energetsko učinkovitost, morajo države Evropskeunije pridobiti več energije iz obnovljivih virov. Naš cilj je preizkusiti,kako lahko grozd pomaga pri doseganju določb paketa 3× 20. Študijaprimera baltskega ekološkega grozda je predstavljena kot uspešen pri-mer največjega energetskega grozda v državi, kar se lahko obravnava kotmerilo za druge sektorske grozde, ki so pripravljeni pozitivno prispevatik spremembam poljskega energetskega sektorja.
Managing Global Transitions

Abstracts in Slovene 317
Ključne besede: grozdi, obnovljiva energija, paket 3 × 20Klasifikacija jel: e00, o13, p28, q20, q4Managing Global Transitions 15 (3): 275–290
Izziv rasti zahodnega msp na nastajajočih trgih: raziskovalni okvirin politične implikacijeMitja Ruzzier, Yusaf H. Akbar, Guido Bortoluzzi in Andrea Tracogna
V članku raziskujemo glavne dejavnike, ki so povezani s procesomvstopa in stopnjevanjamalih in srednjih podjetij namednarodnih trgih,s poudarkom na nastajajočih trgih. Identificiramo in predlagamo se-dem glavnih kategorij institucionalnih praznin in tri glavne vrste virov,ki lahko kritično določajo predstavemalih in srednje velikih podjetij napodročju em, in sicer internacionalizacijsko znanje, socialni kapitalskiviri in tržne zmogljivosti. Institucionalne praznine in viri se združu-jejo v okviru konceptualnega okvira, ki kaže, da bodo mala in srednjevelika podjetja z omenjenimi viri zadržala svoja prizadevanja, da bi seše naprej zavzemala za nastajajoče trge in bodo še bolj zadrževala to,da bodo institucionalne praznine na trgu višje. Članek prispeva k po-litični literaturi o internacionalizaciji malih in srednje velikih podjetijz osredotočanjem na dve področji ukrepov javnega reda, ki bi lahkoimeli jasen in očiten vpliv na ravnanje msp na nastajajočih trgih, karje bilo prvič povezano z viri, ki jih msp ponujajo in lahko izkoristijo zinsitucionalnimi prazninami.Ključne besede: msp, nastajajoči trgi, institucionalne praznine, viri,politika internacionalizacijeKlasifikacija jel: f23, m16, o31Managing Global Transitions 15 (3): 291–314
Volume 15 · Number 3 · Fall 2017