Shock Excitation and Cooling Stage in the Laser Plasma Induced by a Q-Switched Nd:YAG Laser at Low...
12
Volume 53, Number 6, 1999 APPLIED SPECTROSCOPY 719 0003-7028 / 99 / 5306-0719$2.00 / 0 q 1999 Society for Applied Spectroscopy Shock Excitation and Cooling Stage in the Laser Plasma Induced by a Q-Switched Nd:YAG Laser at Low Pressures WAHYU SETIA BUDI, HERY SUYANTO, HENDRIK KURNIAWAN, MAY ON TJIA, and KIICHIRO KAGAWA * Applied Spectroscopy Laboratory, Graduate Program in Optoelectrotechniques and Laser Applications, The University of Indonesia, 4 Salemba Raya, Jakarta 10430, Indonesia, (W.S.B., H.S., H.K.); Department of Physics, Faculty of Science and Mathematics, Bandung Institute of Technology, 10 Ganesha, Bandung, Indonesia (M.O.T.); and Department of Physics, Faculty of Education, Fukui University, 9-1 bunkyo, 3 chome, Fukui 910, Japan (K.K.) An experimental study has been carried out on the dynamical pro- cess taking place in the secondary plasma generated by a Q- switched Nd:YAG laser (80 mJ, 8 ns) on a copper target at reduced pressure. Accurate dynamical characterization of the cross-sectional view of the plasma has been made possible by the unique combi- nation of a plasma con® nement con® guration and the time-resolved measurement technique. In addition to reaf® rming the role of the blast-wave mechanism in the generation of secondary plasma, an analysis of the time-resolved spatial distributions of emission inten- sities and the time-resolved spatial distributions of temperature was made. As a result, the occurrence of two-stage emission processes, the ``shock excitation stage’’ and ``cooling stage,’’ has been proved. For instance, at 2 Torr it is shown that the emission process is initiated by a brief shock excitation process (; 1 m s) and followed by a longer cooling process ( ; 3 m s). The experimental results con- cerning the characteristics of the plasma can be well understood by considering the two-stage processes. Index Headings: Laser-induced plasmas; Shock-wave plasma; Shock excitation; Cooling stage; Spectrochemical application. INTRODUCTION The plasma generated by a laser pulse focused on a solid target in air under reduced pressures is a very in- teresting phenomenon, for both scienti® c and practical reasons. For instance, some years ago, Basov et al. 1,2 re- ported that a laser-induced shock wave is produced along with the plasma when a high-power Q-switched solid state laser, such as a ruby and Nd-glass laser, is sharply focused on a solid target. The physical mechanism of this shock wave has since become a subject of continued re- search interest from the viewpoint of high-temperature hydrodynamics. 3±6 Nowadays, from a different point of view, laser-induced shock wave research has attracted considerable attention since Geoheagen 7 and Kumuduni et al. 8 showed that a laser-induced shock wave plays an important role in the production of the thin ® lm of high- temperature superconductors by mean of the excimer la- ser ablation method. On the other hand, the present au- thors have also pointed out the great potential promised by laser-induced shock wave plasma for practical appli- cations to spectrochemical analysis. The technique of laser ablation emission spectrometric analysis (LAESA) is well known as one of the typical applications of lasers. 9±11 In this technique, a Q-switched laser is focused on the sample in air at 1 atm. As a con- sequence, high-temperature and high-density plasma is Received 20 August 1998; accepted 18 January 1999. * Author to whom correspondence should be sent. generated, giving rise to a high-intensity continuous emission spectrum, accompanied by undesirable self-ab- sorption processes. This limitation is the major obstacle in yielding the linearity and sensitivity required for an accurate spectroscopic calibration. More recently, how- ever, some of the disadvantages faced by the conventional LAESA techniques have been overcome, to some extent, by the use of new spectral detection systems. Presently, two general strategies are being pursued in LAESA de- velopment. One, employing atmospheric pressure, usu- ally called laser-induced breakdown spectroscopy (LIBS), has been developed by Cremers and colleagues. 12±14 In this method a pulsed laser with high peak power and short duration, such as the Nd:YAG laser, is focused onto the sample at atmospheric pressure. In order to remove the interfering background from the high-intensity con- tinuous emission due to the high-density plasma, a gated optical multichannel analyser (OMA) is incorporated into the detection system. Another LAESA method involves the use of low surrounding gas pressures. Namely, the laser plasma is produced under reduced pressure with the objective of suppressing the background emission inten- sity of the spectrum. During the study of the plasma generation under re- duced pressure, Kagawa and co-workers 15±21 showed that a plasma having characteristics favorable to spectrochem- ical analysis can actually be generated by using a pulsed gas laser with short duration, such as the nitrogen laser, 15 carbon dioxide laser, 17,18 and excimer laser, 21 when the pressure of the surrounding gas is reduced to around 1 Torr. In these cases, the plasma invariably consists of two distinct parts. The ® rst part, which is called the primary plasma, occupies a small area and gives off intense con- tinuous emission spectra for a short time just above the surface of the target. The other part, called the secondary plasma, expands with time around the primary plasma with near-hemispherical shape, emitting sharp atomic spectral lines with negligibly low background. The sec- ondary plasma displays favorable characteristics for ele- mental and analytical analysis because of the linear re- lationships between the emission line intensities and the contents of associated elements in the target. By means of time-resolved experiments using a car- bon-dioxide laser 17,18 and excimer laser, 21 our groups demonstrated that this secondary plasma was excited by the shock wave, while the primary plasma acted as an initial explosion energy source. We have offered a theory with respect to the excitation mechanism of the second-
-
Upload
independent -
Category
Documents
-
view
0 -
download
0
Transcript of Shock Excitation and Cooling Stage in the Laser Plasma Induced by a Q-Switched Nd:YAG Laser at Low...
Volume 53, Number 6, 1999 APPLIED SPECTROSCOPY 7190003-7028 / 99 / 5306-0719$2.00 / 0
q 1999 Society for Applied Spectroscopy
Shock Excitation and Cooling Stage in the Laser PlasmaInduced by a Q-Switched Nd:YAG Laser at Low Pressures
WAHYU SETIA BUDI, HERY SUYANTO, HENDRIK KURNIAWAN,MAY ON TJIA, and KIICHIRO KAGAWA *Applied Spectroscopy Laboratory, Graduate Program in Optoelectrotechniques and Laser Applications, The University of
Indonesia, 4 Salemba Raya, Jakarta 10430, Indonesia, (W.S.B., H.S., H.K.); Department of Physics, Faculty of Science and
Mathematics, Bandung Institute of Technology, 10 Ganesha, Bandung, Indonesia (M.O.T.); and Department of Physics, Faculty
of Education, Fukui University, 9-1 bunkyo, 3 chome, Fukui 910, Japan (K.K.)
An experimental study has been carried out on the dynamical pro-cess taking place in the secondary plasma generated by a Q-
switched Nd:YAG laser (80 mJ, 8 ns) on a copper target at reduced
pressure. Accurate dynamical characterization of the cross-sectionalview of the plasma has been made possible by the unique combi-
nation of a plasma con® nement con® guration and the time-resolved
measurement technique. In addition to reaf® rming the role of theblast-wave mechanism in the generation of secondary plasma, an
analysis of the time-resolved spatial distributions of emission inten-
sities and the time-resolved spatial distributions of temperature wasmade. As a result, the occurrence of two-stage emission processes,
the ``shock excitation stage’’ and ``cooling stage,’’ has been proved.
For instance, at 2 Torr it is shown that the emission process isinitiated by a brief shock excitation process ( ; 1 m s) and followed
by a longer cooling process ( ; 3 m s). The experimental results con-
cerning the characteristics of the plasma can be well understood byconsidering the two-stage processes.
Index Headings: Laser-induced plasmas; Shock-wave plasma; Shock
excitation; Cooling stage; Spectrochemical application.
INTRODUCTION
The plasma generated by a laser pulse focused on asolid target in air under reduced pressures is a very in-teresting phenomenon, for both scienti® c and practicalreasons. For instance, some years ago, Basov et al. 1,2 re-ported that a laser-induced shock wave is produced alongwith the plasma when a high-power Q-switched solidstate laser, such as a ruby and Nd-glass laser, is sharplyfocused on a solid target. The physical mechanism of thisshock wave has since become a subject of continued re-search interest from the viewpoint of high-temperaturehydrodynamics.3±6 Nowadays, from a different point ofview, laser-induced shock wave research has attractedconsiderable attention since Geoheagen 7 and Kumuduniet al.8 showed that a laser-induced shock wave plays animportant role in the production of the thin ® lm of high-temperature superconductors by mean of the excimer la-ser ablation method. On the other hand, the present au-thors have also pointed out the great potential promisedby laser-induced shock wave plasma for practical appli-cations to spectrochemical analysis.
The technique of laser ablation emission spectrometricanalysis (LAESA) is well known as one of the typicalapplications of lasers.9±11 In this technique, a Q-switchedlaser is focused on the sample in air at 1 atm. As a con-sequence, high-temperature and high-density plasma is
Received 20 August 1998; accepted 18 January 1999.* Author to whom correspondence should be sent.
generated, giving rise to a high-intensity continuousemission spectrum, accompanied by undesirable self-ab-sorption processes. This limitation is the major obstaclein yielding the linearity and sensitivity required for anaccurate spectroscopic calibration. More recently, how-ever, some of the disadvantages faced by the conventionalLAESA techniques have been overcome, to some extent,by the use of new spectral detection systems. Presently,two general strategies are being pursued in LAESA de-velopment. One, employing atmospheric pressure, usu-ally called laser-induced breakdown spectroscopy (LIBS),has been developed by Cremers and colleagues. 12±14 Inthis method a pulsed laser with high peak power andshort duration, such as the Nd:YAG laser, is focused ontothe sample at atmospheric pressure. In order to removethe interfering background from the high-intensity con-tinuous emission due to the high-density plasma, a gatedoptical multichannel analyser (OMA) is incorporated intothe detection system. Another LAESA method involvesthe use of low surrounding gas pressures. Namely, thelaser plasma is produced under reduced pressure with theobjective of suppressing the background emission inten-sity of the spectrum.
During the study of the plasma generation under re-duced pressure, Kagawa and co-workers15±21 showed thata plasma having characteristics favorable to spectrochem-ical analysis can actually be generated by using a pulsedgas laser with short duration, such as the nitrogen laser,15
carbon dioxide laser,17,18 and excimer laser,21 when thepressure of the surrounding gas is reduced to around 1Torr. In these cases, the plasma invariably consists of twodistinct parts. The ® rst part, which is called the primaryplasma, occupies a small area and gives off intense con-tinuous emission spectra for a short time just above thesurface of the target. The other part, called the secondaryplasma, expands with time around the primary plasmawith near-hemispherical shape, emitting sharp atomicspectral lines with negligibly low background. The sec-ondary plasma displays favorable characteristics for ele-mental and analytical analysis because of the linear re-lationships between the emission line intensities and thecontents of associated elements in the target.
By means of time-resolved experiments using a car-bon-dioxide laser17,18 and excimer laser,21 our groupsdemonstrated that this secondary plasma was excited bythe shock wave, while the primary plasma acted as aninitial explosion energy source. We have offered a theorywith respect to the excitation mechanism of the second-

720 Volume 53, Number 6, 1999
FIG. 1. The experimental setup.
ary plasma as follows. Right after the cessation of theprimary plasma, atoms gush out from the primary plasmaat supersonic speed. It is assumed that the surroundinggas plays the role of damping material, impeding the freeexpansion of the propelling atoms, by forming somethinglike a wall against which compression is taking place. Asa result of this compression, a blast wave is generated inthe surrounding gas. The most important point of theshock wave model is that the energy required to producethe secondary plasma is supplied in the form of kineticenergy from the propelling atoms. By means of this com-pression, the kinetic energy of the propelling atoms isconverted into thermal energy in the plasma, by whichatoms are excited.
Despite much evidence to support the shock wavemodel, a very dif® cult problem to be overcome in theuse of the secondary plasma with the shock wave modelis the interpretation of the temperature distribution on thebasis of spectroscopic data. Namely, the temperature cal-culated by the Rankine±Hugoniot equation is much lowerthan that estimated spectroscopically in terms of the two-emission-lines method under the assumption that thefront of the shock wave coincides with that of the sec-ondary plasma. The study of dynamical behavior of thetemperature of the secondary plasma has been obstructedby experimental limitations in separating the detected in-tensities emitted at different stages of the plasma expan-sion. One way of solving this problem is to employ theAbel conversion method.22,23 However, in using Abelconversion, considerable error will be introduced unlessthe plasma has a near-perfect hemispherical shape.
In a previous experiment using a normal-oscillation
Nd:YAG laser,24 we developed a new technique that al-lows the emission intensities of the initial stage to bedetected separately from that of the later stage as a func-tion of the distance from the primary plasma. This pro-cedure was accomplished by con® ning the plasma ex-pansion region with two parallel glass plates. In that ex-periment, the dynamical plasma expansion process wasto a good extent successfully analyzed. Nevertheless,there was unavoidable restriction on the results due to theeffect of multiple laser spikes coming from the normal-oscillation Nd:YAG laser.
The main purpose of this study is to provide a detailedexplanation of the dynamical process of plasma expan-sion by employing the plasma-con® ning technique in-duced by a Q-switched Nd:YAG laser. In order to obtaina more complete picture of the plasma characteristics,additional measurements were also performed on the timepro® le of emission spectra of the plasma to provide adescription of the plasma temperature variation with timeby employing the time-resolved technique. The study isfurther substantiated by measurement of the spatial dis-tributions of emission intensities. These results will beanalyzed in terms of the hypothetical model in which thedynamical process of plasma formation and expansion isdivided into two stages, namely, the initial ``shock exci-tation stage’ ’ and a later ``cooling stage’ ’ .
EXPERIMENTAL
The diagram of the experimental arrangement is shownin Fig. 1. In this experiment, the laser radiation from a1064 nm Nd:YAG (Quanta Ray, GCR, 400 mJ, pulse
APPLIED SPECTROSCOPY 721
duration 8 ns) was operated in a Q-switched mode, andthe laser output energy was ® xed at 80 mJ (power density5 25 GW/cm 2). The laser beam was focused by a mul-tilayer lens ( f 5 100 mm) through a quartz window ontothe surface of the sample. The laser operation was con-ducted shot-by-shot manually. The shot-to-shot ¯ uctua-tion of the laser was estimated to be approximately 3%.
In all the experiments, a copper plate (Rare MetallicCo., 99.99%, 0.2 mm thickness) was used as a sample,except for the experiment verifying the validity of theBoltzmann distribution, where an iron plate (Rare Me-tallic Co., 99.5%, 0.2 mm thickness) was used as thesample. In each experiment, the sample was placed in asmall, vacuum-tight metal chamber (11 cm 3 11 cm 312.5 cm), which could be evacuated with a vacuum pumpand ® lled with air at desired pressure. The air ¯ owthrough the chamber was regulated by a needle valve inthe air line and another valve in the pumping line. Thechamber pressure was measured and monitored with theuse of a digital Pirani gauge (Diavac, PT-1DA). The sam-ple, together with the whole chamber and multilayer lens,could be moved in two dimensions, with the use of a stepmotor for movement in the laser beam direction and amicrometer for movement perpendicular to the laserbeam direction. The sample was rotated at 1 rpm duringirradiation to secure uniformity of the emission intensity.
The plasma radiation (reduced by using an aperture of7 mm 3 7 mm) was imaged 1:1 by a quartz lens ( f 5150 mm) onto the entrance slit of the monochromator(Spex M-270, Czerny±Turner con® guration, f 5 270 mmwith 1200 grooves/mm). The slit was set at 1 mm inheight and 100 m m in width so that the observation couldbe restricted to the shaded area depicted in Fig. 1. Inorder to examine the homogeneity of the emission inten-sity of the plasma, an optical ® ber was scanned along anaxis on the plasma imaging plane by varying the axialangle, u , between the direction of the ® ber displacementand that of the laser beam. The electric signal output fromthe photomultiplier (Hamamatsu IP-28) was fed througha fast preampli® er (SR 240) to a digital storage scope(HP 54600B). A part of the laser beam was detected bya positive-intrinsic-negative (PIN) photodiode, and theoutput was used as a trigger signal for the digital storagescope. Data collection was carried out by using a printer.
In order to remove the problem of overlapping plasmaemission intensities from different stages of its formationas described previously, 24 the plasma was con® ned ver-tically by using two parallel glass plates with 6 mm sep-aration (glass size 25 mm 3 75 mm), so that the plasmaexpansion was limited within that region shown in theinset of Fig. 1. By using this technique, we were able toobserve the cross-sectional view of the plasma radiationat a certain stage of growth of the plasma.
For measuring the time-integrated signals, a 1 M V re-sistor [its resistance-capacitance (RC) time constant wasabout 600 m s] was attached to the photomultiplier insteadof the 50 V (RC time constant about 30 ns) resistor nor-mally used for time-resolved measurement. The spectrumof the plasma radiation was obtained by the OMA systemwithout the use of the gating function (Princeton Instru-ments, IRY 700).
Time evolution of the spatially integrated emission in-tensity was measured by means of an oscilloscopic tech-
nique with a time resolution of 0.05 m s. In this measure-ment, the monochromator was ® xed for the wavelengthsof Cu(I) 521.8 nm and Cu(I) 510.5 nm separately, whilethe position of the entrance slit was ® xed at the center ofthe secondary plasma without the use of the lens so thatthe entire image of the plasma was collected directly intothe monochromator. The slit height and slit width of themonochromator were set in this case at 15 mm and 100
m m, respectively. From the results of these measure-ments, one can derive the time pro® les of the spatiallyintegrated emission intensities.
In the previous experiments18,21 we employed a uniquesampling technique to obtain time-resolved spatial distri-bution for free-expansion plasma under the repeated ir-radiation of the laser light at a repetition rate of around5 Hz. However, the same method could not be applied tothe present experiment because of the occurrence ofcloudiness on the glass plates that were used for the wallof plasma con® nement. Therefore, point-by-point mea-surements must be conducted with special attention givento the condition of the glass plates, and with interruptionfor cleaning of the glass as deemed necessary. In orderto obtain the time-resolved spatial distributions of theemission intensities, the oscilloscopic measurements wererepeated at various slit positions. Synthesis of the curvewas made after completion of data acquisition by plottingthe signal intensities with respect to time ( t), for whicheach datum was read from the corresponding oscillo-scopic signal. In this case, the plasma was also imagedon the plane of the entrance slit by using the imaginglens.
RESULTS
As we reported in previous studies, 25,26 the secondaryplasma displays a characteristic symmetrical shape withbrilliant color associated with the emission from the con-stituent atoms. In this case a visual inspection of the plas-ma also reveals a uniform distribution of green color witha nearly hemispherical shape for freely expanding plas-ma, and with a semicircular shape for con® ned plasma.It is worth noting that the con® ned plasma was markedby the perceptible absence of layered structure inducedby multi-spike primary plasma, as observed in a previousexperiment employing a normal-oscillation laser.24 Thisobservation is con® rmed by the spatial distributions ofemission intensities as a function of the distance from theprimary plasma. It was also proved in this measurementthat the intensity distribution does not depend so muchon u , which means that the plasma is nearly semicircularin shape, as observed visually.
Figure 2 shows the time-integrated emission spectra ofthe secondary plasma measured at 2 Torr for con® nedplasmas. The main emission lines are Cu(I) 510.5 nm(excitation energy 3.8 eV), Cu(I) 515.3 nm (excitationenergy 6.2 eV), and Cu(I) 521.8 nm (excitation energy6.2 eV), which are responsible for the green color. Al-most the same emission spectrum was observed for free-expansion plasma under the same pressure. The averagetemperature of the secondary plasma at each position canbe estimated by comparing the emission lines betweenCu(I) 521.8 nm and Cu(I) 510.5 nm in a manner de-

722 Volume 53, Number 6, 1999
FIG. 2. Time-integrated emission spectra of the secondary plasmas measured at 2 Torr for the con® ned plasmas.
FIG. 3. Temporally and spatially integrated emission intensity of Cu(I) 521.8 nm for free-expansion and con® ned plasmas as a function ofsurrounding gas pressure.
scribed in a previous paper 27 under the assumption thatthe Boltzmann distribution is ful® lled.
In Fig. 3 the total emission intensities obtained by tem-porally and spatially integrated emission intensity ofCu(I) at 521.8 nm for free-expansion and con® ned plas-mas are plotted, respectively, as functions of the sur-rounding gas pressure. Both of them show almost thesame pattern in the low-pressure region with a slight dif-ference between them in terms of the magnitude of theintegrated intensities. The intensity rises rapidly withpressure up to 2 Torr for con® ned plasma and to 5 Torrfor the freely expanding plasma. The trend continues ata lower pace for gas pressure up to 15 Torr for both cases.In the case of con® ned plasma, the intensity suddenly
drops above 15 Torr and reaches the minimum at about20 Torr before starting to rise again, whereas the freelyexpanding plasma exhibits a milder variation in the sameregion.
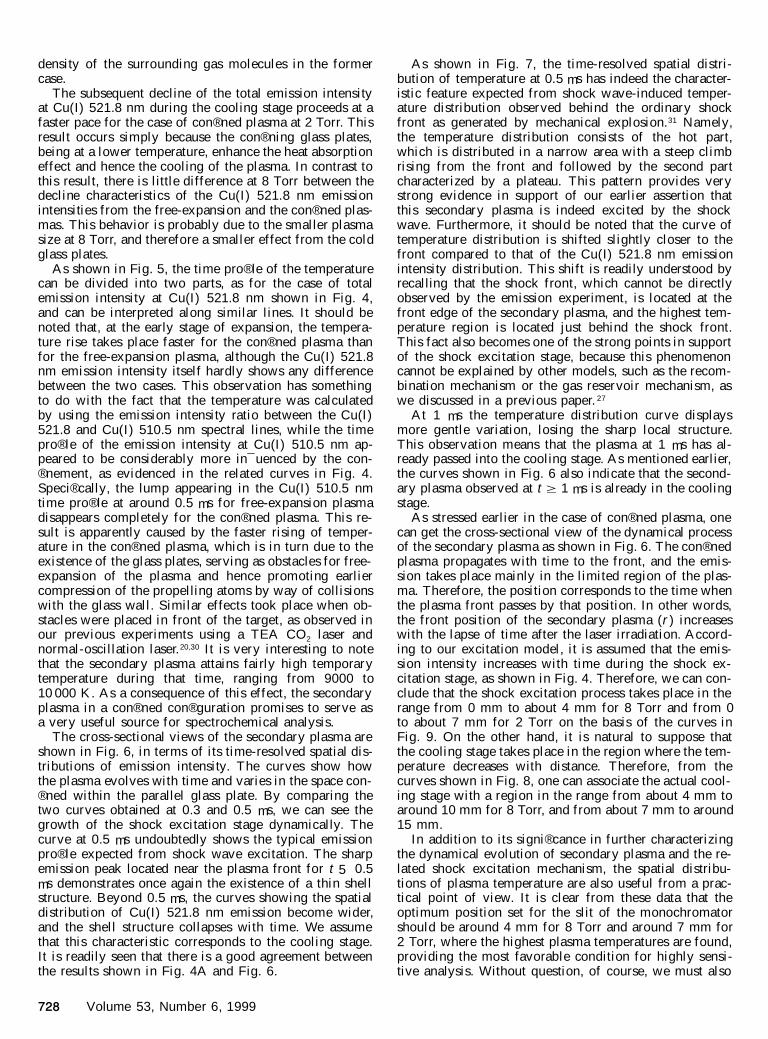
In order to elucidate the transient gas dynamic processoccurring near the primary plasma, it is useful to ® nd outhow the spatially integrated total emission intensity of anatomic line changes with time. To that end, the time pro-® les of spatially integrated emission intensities of Cu(I)521.8 nm and Cu(I) 510.5 nm lines were obtained for thecase with gas pressure of 2 Torr; results are presented inFig. 4A for both free-expansion and con® ned plasmas.These data were taken by subtracting background emis-sion intensities, which come mainly from the primary

APPLIED SPECTROSCOPY 723
FIG. 4. Time pro® les of spatially integrated emission intensities of Cu(I) 521.8 nm and Cu(I) 510.5 nm for both free-expansion plasma and con® nedplasma at (A) surrounding air pressure of 2 Torr, and (B) surrounding air pressure of 8 Torr.
plasma. For this purpose, the signal intensity at 500 nmwas employed as the background because no emissionlines due to Cu are observed at this wavelength. It is seenthat in each case the emission intensity experiences asteep climb with time up to a maximum and then declinesat a lower pace marked by a long tail.
Similar behaviors are exhibited in Fig. 4B for the timepro ® les of intensities from the free-expansion and con-® ned plasmas at a surrounding air pressure of 8 Torr. Theintensity from each of the two modes of plasmas reachesa maximum, with the latter reaching its maximum inten-sity earlier than the former. It is observed, however, thatthe differences between the two pro ® les are less pro-nounced than in the low-pressure case.
We add in passing that the time pro® les of emissionintensities of Cu(I) 510.5 nm are also presented in Fig.4A and 4B for comparison, which are also needed forthe determination of plasma temperatures. It is seen that
these pro ® les share the basic behaviors with those foundfor the Cu(I) 521.8 nm spectral line, showing, however,much more subdued features.
In order to make clear the excitation mechanism of thesecondary plasma, it is also very useful to know how thetemperature of the secondary plasma changes with timeafter the initiation of the laser bombardment. The plasmatemperatures were measured by the Boltzmann two-linemethod, assuming validity of the Boltzmann distributionin the plasma as described elsewhere. 28,29 To examine thevalidity of the Boltzmann distribution, we measured theemission intensities of the neutral iron lines at 367.9,373.5, 373.7, 374.8, 375.8, 376.4, 381.6, and 382.5 nmusing an iron plate sample. These intensities were ex-pressed as relative emissivities and plotted as a functionof E1 at a ® xed time t both for free-expansion and con-® ned plasmas at 2 and 8 Torr, respectively, on the basisof data measured separately at 5, 10, and 15 mm above
724 Volume 53, Number 6, 1999
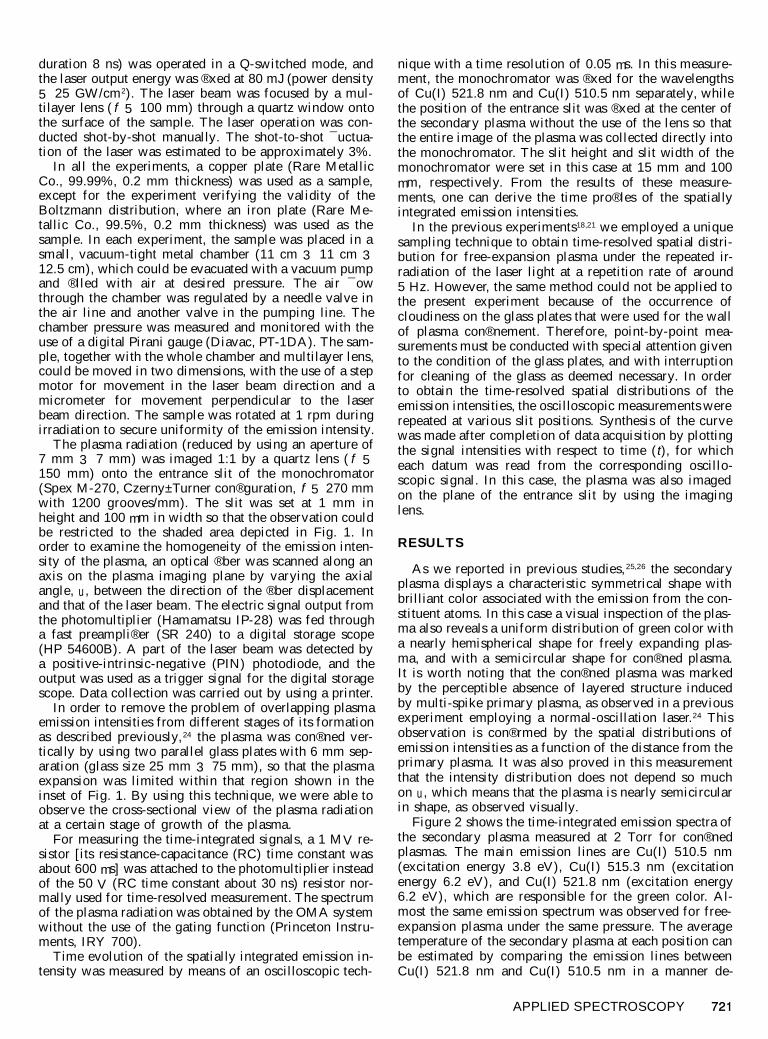
FIG . 5. Time development of the spatially averaged temperature for both the free-expansion and the con® ned plasmas at 2 and 8 Torr.
the target surface. The resulting relation con® rms theBoltzmann distribution except for deviations found at thelow-energy ends, which are probably due to the loweratom density in the plasma at a reduced air pressure. Wehave thus demonstrated that the plasma at reduced airpressure did satisfy to a good extent the Boltzmann dis-tribution assumption, both for free-expansion and con-® ned plasma. This conclusion can be viewed as an ex-tension of the observation made previously by Sabsabiand Ceilo 29 for the case with the same target in air atatmospheric pressure. In this experiment, the emissionintensities employed for that purpose are those of theCu(I) 521.8 nm and Cu(I) 510.5 nm spectral lines.
Figure 5 shows the time development of the spatiallyaveraged temperature for both the free-expansion andcon® ned plasmas at 2 and 8 Torr, respectively. These datawere obtained by using the ratio between the emissionintensity of Cu(I) 521.8 nm and that of Cu(I) 510.5 nm,which are shown in Fig. 4A and 4B. At 2 Torr, the max-imum temperature of free-expansion plasma (9100 K) isslightly higher than that of con® ned plasma (8800 K),with the latter being attained in a shorter time (0.8 m s)than the former (1.2 m s). This characteristic is closelyrelated to a similar feature found in the time pro® les ofintensity, as discussed above. The same pattern is re-peated at 8 Torr, again closely following similar behaviorin the associated time pro ® les of intensity described inthe same preceding subsection. Speci® cally, the maxi-mum temperature of free-expansion plasma is found tobe 9800 K at t 5 1 m s and that of con® ned plasma is9350 K at t 5 0.6 m s. Figure 5 also shows that the tem-perature-sustaining time is longer for the free-expansionplasma than for the con® ned plasma.
It is to be expected that time-resolved spatial distri-bution of the emission intensity will offer very valuableinformation for understanding the excitation mechanism,because the result of such a measurement directly pro-vides a cross-sectional view of the con® ned plasma attime t after the bombardment of the laser light. The spa-
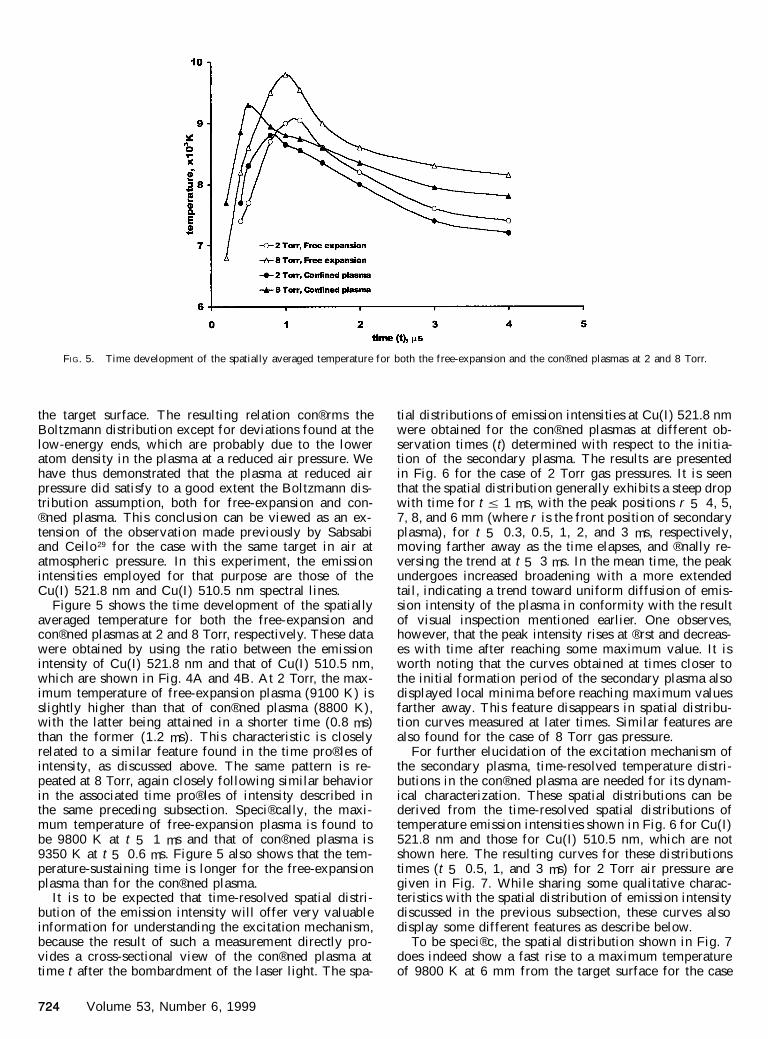
tial distributions of emission intensities at Cu(I) 521.8 nmwere obtained for the con® ned plasmas at different ob-servation times (t) determined with respect to the initia-tion of the secondary plasma. The results are presentedin Fig. 6 for the case of 2 Torr gas pressures. It is seenthat the spatial distribution generally exhibits a steep dropwith time for t # 1 m s, with the peak positions r 5 4, 5,7, 8, and 6 mm (where r is the front position of secondaryplasma), for t 5 0.3, 0.5, 1, 2, and 3 m s, respectively,moving farther away as the time elapses, and ® nally re-versing the trend at t 5 3 m s. In the mean time, the peakundergoes increased broadening with a more extendedtail, indicating a trend toward uniform diffusion of emis-sion intensity of the plasma in conformity with the resultof visual inspection mentioned earlier. One observes,however, that the peak intensity rises at ® rst and decreas-es with time after reaching some maximum value. It isworth noting that the curves obtained at times closer tothe initial formation period of the secondary plasma alsodisplayed local minima before reaching maximum valuesfarther away. This feature disappears in spatial distribu-tion curves measured at later times. Similar features arealso found for the case of 8 Torr gas pressure.
For further elucidation of the excitation mechanism ofthe secondary plasma, time-resolved temperature distri-butions in the con® ned plasma are needed for its dynam-ical characterization. These spatial distributions can bederived from the time-resolved spatial distributions oftemperature emission intensities shown in Fig. 6 for Cu(I)521.8 nm and those for Cu(I) 510.5 nm, which are notshown here. The resulting curves for these distributionstimes (t 5 0.5, 1, and 3 m s) for 2 Torr air pressure aregiven in Fig. 7. While sharing some qualitative charac-teristics with the spatial distribution of emission intensitydiscussed in the previous subsection, these curves alsodisplay some different features as describe below.
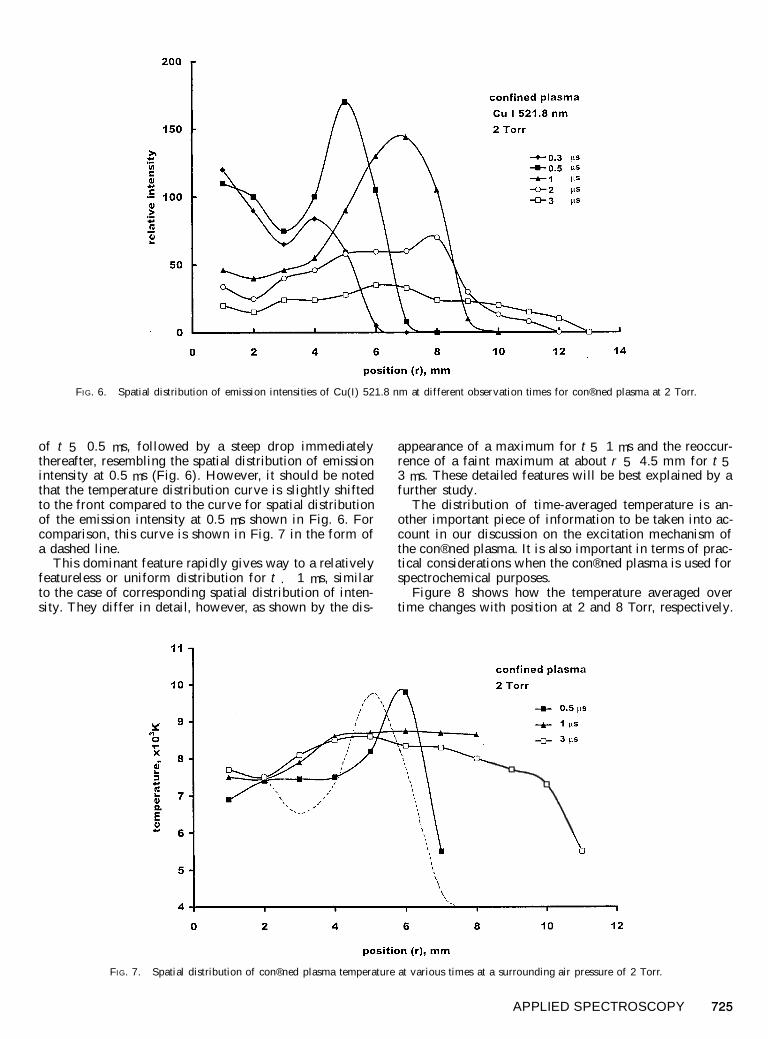
To be speci® c, the spatial distribution shown in Fig. 7does indeed show a fast rise to a maximum temperatureof 9800 K at 6 mm from the target surface for the case
APPLIED SPECTROSCOPY 725
FIG. 6. Spatial distribution of emission intensities of Cu(I) 521.8 nm at different observation times for con® ned plasma at 2 Torr.
FIG. 7. Spatial distribution of con® ned plasma temperature at various times at a surrounding air pressure of 2 Torr.
of t 5 0.5 m s, followed by a steep drop immediatelythereafter, resembling the spatial distribution of emissionintensity at 0.5 m s (Fig. 6). However, it should be notedthat the temperature distribution curve is slightly shiftedto the front compared to the curve for spatial distributionof the emission intensity at 0.5 m s shown in Fig. 6. Forcomparison, this curve is shown in Fig. 7 in the form ofa dashed line.
This dominant feature rapidly gives way to a relativelyfeatureless or uniform distribution for t . 1 m s, similarto the case of corresponding spatial distribution of inten-sity. They differ in detail, however, as shown by the dis-
appearance of a maximum for t 5 1 m s and the reoccur-rence of a faint maximum at about r 5 4.5 mm for t 53 m s. These detailed features will be best explained by afurther study.
The distribution of time-averaged temperature is an-other important piece of information to be taken into ac-count in our discussion on the excitation mechanism ofthe con® ned plasma. It is also important in terms of prac-tical considerations when the con® ned plasma is used forspectrochemical purposes.
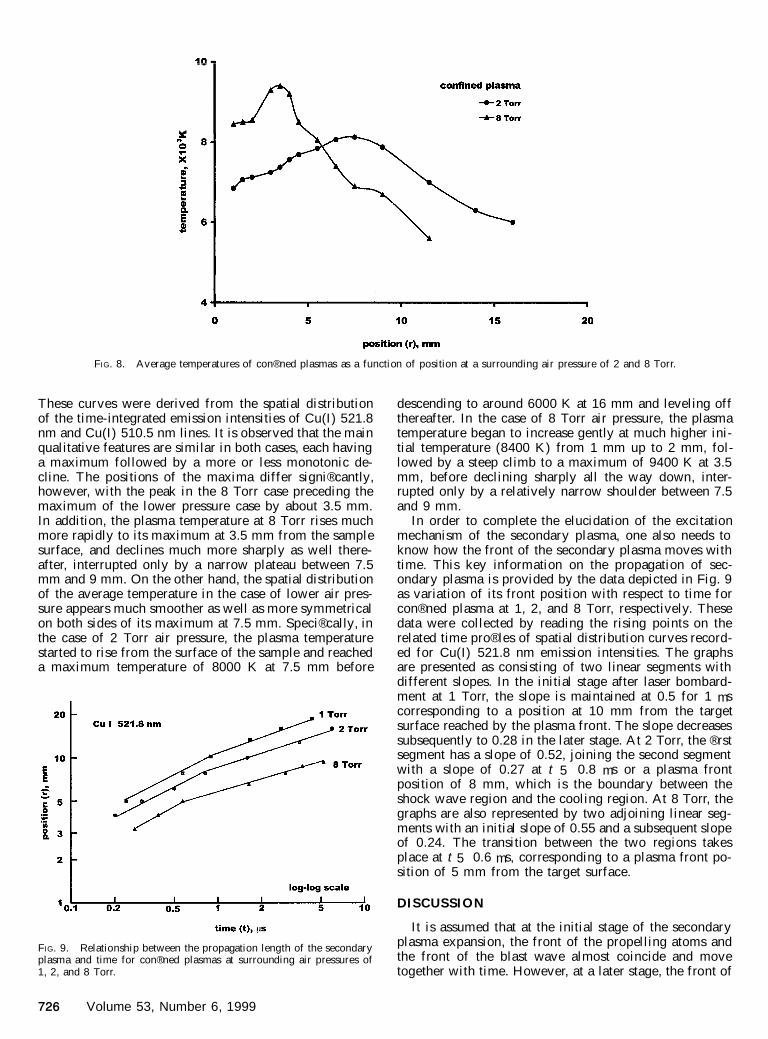
Figure 8 shows how the temperature averaged overtime changes with position at 2 and 8 Torr, respectively.
726 Volume 53, Number 6, 1999
FIG. 8. Average temperatures of con® ned plasmas as a function of position at a surrounding air pressure of 2 and 8 Torr.
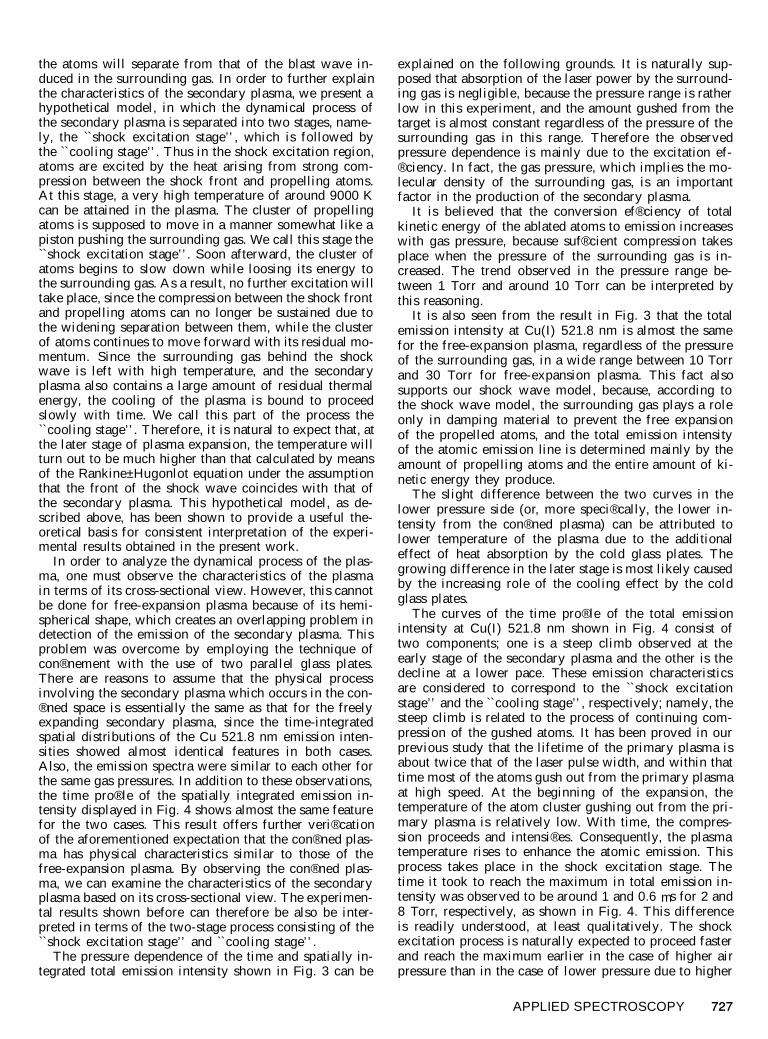
FIG. 9. Relationship between the propagation length of the secondaryplasma and time for con® ned plasmas at surrounding air pressures of1, 2, and 8 Torr.
These curves were derived from the spatial distributionof the time-integrated emission intensities of Cu(I) 521.8nm and Cu(I) 510.5 nm lines. It is observed that the mainqualitative features are similar in both cases, each havinga maximum followed by a more or less monotonic de-cline. The positions of the maxima differ signi® cantly,however, with the peak in the 8 Torr case preceding themaximum of the lower pressure case by about 3.5 mm.In addition, the plasma temperature at 8 Torr rises muchmore rapidly to its maximum at 3.5 mm from the samplesurface, and declines much more sharply as well there-after, interrupted only by a narrow plateau between 7.5mm and 9 mm. On the other hand, the spatial distributionof the average temperature in the case of lower air pres-sure appears much smoother as well as more symmetricalon both sides of its maximum at 7.5 mm. Speci® cally, inthe case of 2 Torr air pressure, the plasma temperaturestarted to rise from the surface of the sample and reacheda maximum temperature of 8000 K at 7.5 mm before
descending to around 6000 K at 16 mm and leveling offthereafter. In the case of 8 Torr air pressure, the plasmatemperature began to increase gently at much higher ini-tial temperature (8400 K) from 1 mm up to 2 mm, fol-lowed by a steep climb to a maximum of 9400 K at 3.5mm, before declining sharply all the way down, inter-rupted only by a relatively narrow shoulder between 7.5and 9 mm.
In order to complete the elucidation of the excitationmechanism of the secondary plasma, one also needs toknow how the front of the secondary plasma moves withtime. This key information on the propagation of sec-ondary plasma is provided by the data depicted in Fig. 9as variation of its front position with respect to time forcon® ned plasma at 1, 2, and 8 Torr, respectively. Thesedata were collected by reading the rising points on therelated time pro® les of spatial distribution curves record-ed for Cu(I) 521.8 nm emission intensities. The graphsare presented as consisting of two linear segments withdifferent slopes. In the initial stage after laser bombard-ment at 1 Torr, the slope is maintained at 0.5 for 1 m scorresponding to a position at 10 mm from the targetsurface reached by the plasma front. The slope decreasessubsequently to 0.28 in the later stage. At 2 Torr, the ® rstsegment has a slope of 0.52, joining the second segmentwith a slope of 0.27 at t 5 0.8 m s or a plasma frontposition of 8 mm, which is the boundary between theshock wave region and the cooling region. At 8 Torr, thegraphs are also represented by two adjoining linear seg-ments with an initial slope of 0.55 and a subsequent slopeof 0.24. The transition between the two regions takesplace at t 5 0.6 m s, corresponding to a plasma front po-sition of 5 mm from the target surface.
DISCUSSION
It is assumed that at the initial stage of the secondaryplasma expansion, the front of the propelling atoms andthe front of the blast wave almost coincide and movetogether with time. However, at a later stage, the front of
APPLIED SPECTROSCOPY 727
the atoms will separate from that of the blast wave in-duced in the surrounding gas. In order to further explainthe characteristics of the secondary plasma, we present ahypothetical model, in which the dynamical process ofthe secondary plasma is separated into two stages, name-ly, the ``shock excitation stage’ ’ , which is followed bythe ``cooling stage’ ’ . Thus in the shock excitation region,atoms are excited by the heat arising from strong com-pression between the shock front and propelling atoms.At this stage, a very high temperature of around 9000 Kcan be attained in the plasma. The cluster of propellingatoms is supposed to move in a manner somewhat like apiston pushing the surrounding gas. We call this stage the``shock excitation stage’ ’ . Soon afterward, the cluster ofatoms begins to slow down while loosing its energy tothe surrounding gas. As a result, no further excitation willtake place, since the compression between the shock frontand propelling atoms can no longer be sustained due tothe widening separation between them, while the clusterof atoms continues to move forward with its residual mo-mentum. Since the surrounding gas behind the shockwave is left with high temperature, and the secondaryplasma also contains a large amount of residual thermalenergy, the cooling of the plasma is bound to proceedslowly with time. We call this part of the process the``cooling stage’ ’ . Therefore, it is natural to expect that, atthe later stage of plasma expansion, the temperature willturn out to be much higher than that calculated by meansof the Rankine±Hugonlot equation under the assumptionthat the front of the shock wave coincides with that ofthe secondary plasma. This hypothetical model, as de-scribed above, has been shown to provide a useful the-oretical basis for consistent interpretation of the experi-mental results obtained in the present work.
In order to analyze the dynamical process of the plas-ma, one must observe the characteristics of the plasmain terms of its cross-sectional view. However, this cannotbe done for free-expansion plasma because of its hemi-spherical shape, which creates an overlapping problem indetection of the emission of the secondary plasma. Thisproblem was overcome by employing the technique ofcon® nement with the use of two parallel glass plates.There are reasons to assume that the physical processinvolving the secondary plasma which occurs in the con-® ned space is essentially the same as that for the freelyexpanding secondary plasma, since the time-integratedspatial distributions of the Cu 521.8 nm emission inten-sities showed almost identical features in both cases.Also, the emission spectra were similar to each other forthe same gas pressures. In addition to these observations,the time pro® le of the spatially integrated emission in-tensity displayed in Fig. 4 shows almost the same featurefor the two cases. This result offers further veri® cationof the aforementioned expectation that the con® ned plas-ma has physical characteristics similar to those of thefree-expansion plasma. By observing the con® ned plas-ma, we can examine the characteristics of the secondaryplasma based on its cross-sectional view. The experimen-tal results shown before can therefore be also be inter-preted in terms of the two-stage process consisting of the``shock excitation stage’ ’ and ``cooling stage’ ’ .
The pressure dependence of the time and spatially in-tegrated total emission intensity shown in Fig. 3 can be
explained on the following grounds. It is naturally sup-posed that absorption of the laser power by the surround-ing gas is negligible, because the pressure range is ratherlow in this experiment, and the amount gushed from thetarget is almost constant regardless of the pressure of thesurrounding gas in this range. Therefore the observedpressure dependence is mainly due to the excitation ef-® ciency. In fact, the gas pressure, which implies the mo-lecular density of the surrounding gas, is an importantfactor in the production of the secondary plasma.
It is believed that the conversion ef® ciency of totalkinetic energy of the ablated atoms to emission increaseswith gas pressure, because suf® cient compression takesplace when the pressure of the surrounding gas is in-creased. The trend observed in the pressure range be-tween 1 Torr and around 10 Torr can be interpreted bythis reasoning.
It is also seen from the result in Fig. 3 that the totalemission intensity at Cu(I) 521.8 nm is almost the samefor the free-expansion plasma, regardless of the pressureof the surrounding gas, in a wide range between 10 Torrand 30 Torr for free-expansion plasma. This fact alsosupports our shock wave model, because, according tothe shock wave model, the surrounding gas plays a roleonly in damping material to prevent the free expansionof the propelled atoms, and the total emission intensityof the atomic emission line is determined mainly by theamount of propelling atoms and the entire amount of ki-netic energy they produce.
The slight difference between the two curves in thelower pressure side (or, more speci® cally, the lower in-tensity from the con® ned plasma) can be attributed tolower temperature of the plasma due to the additionaleffect of heat absorption by the cold glass plates. Thegrowing difference in the later stage is most likely causedby the increasing role of the cooling effect by the coldglass plates.
The curves of the time pro® le of the total emissionintensity at Cu(I) 521.8 nm shown in Fig. 4 consist oftwo components; one is a steep climb observed at theearly stage of the secondary plasma and the other is thedecline at a lower pace. These emission characteristicsare considered to correspond to the ``shock excitationstage’ ’ and the ``cooling stage’ ’ , respectively; namely, thesteep climb is related to the process of continuing com-pression of the gushed atoms. It has been proved in ourprevious study that the lifetime of the primary plasma isabout twice that of the laser pulse width, and within thattime most of the atoms gush out from the primary plasmaat high speed. At the beginning of the expansion, thetemperature of the atom cluster gushing out from the pri-mary plasma is relatively low. With time, the compres-sion proceeds and intensi® es. Consequently, the plasmatemperature rises to enhance the atomic emission. Thisprocess takes place in the shock excitation stage. Thetime it took to reach the maximum in total emission in-tensity was observed to be around 1 and 0.6 m s for 2 and8 Torr, respectively, as shown in Fig. 4. This differenceis readily understood, at least qualitatively. The shockexcitation process is naturally expected to proceed fasterand reach the maximum earlier in the case of higher airpressure than in the case of lower pressure due to higher
728 Volume 53, Number 6, 1999
density of the surrounding gas molecules in the formercase.
The subsequent decline of the total emission intensityat Cu(I) 521.8 nm during the cooling stage proceeds at afaster pace for the case of con® ned plasma at 2 Torr. Thisresult occurs simply because the con® ning glass plates,being at a lower temperature, enhance the heat absorptioneffect and hence the cooling of the plasma. In contrast tothis result, there is little difference at 8 Torr between thedecline characteristics of the Cu(I) 521.8 nm emissionintensities from the free-expansion and the con® ned plas-mas. This behavior is probably due to the smaller plasmasize at 8 Torr, and therefore a smaller effect from the coldglass plates.
As shown in Fig. 5, the time pro ® le of the temperaturecan be divided into two parts, as for the case of totalemission intensity at Cu(I) 521.8 nm shown in Fig. 4,and can be interpreted along similar lines. It should benoted that, at the early stage of expansion, the tempera-ture rise takes place faster for the con® ned plasma thanfor the free-expansion plasma, although the Cu(I) 521.8nm emission intensity itself hardly shows any differencebetween the two cases. This observation has somethingto do with the fact that the temperature was calculatedby using the emission intensity ratio between the Cu(I)521.8 and Cu(I) 510.5 nm spectral lines, while the timepro® le of the emission intensity at Cu(I) 510.5 nm ap-peared to be considerably more in¯ uenced by the con-® nement, as evidenced in the related curves in Fig. 4.Speci® cally, the lump appearing in the Cu(I) 510.5 nmtime pro ® le at around 0.5 m s for free-expansion plasmadisappears completely for the con® ned plasma. This re-sult is apparently caused by the faster rising of temper-ature in the con® ned plasma, which is in turn due to theexistence of the glass plates, serving as obstacles for free-expansion of the plasma and hence promoting earliercompression of the propelling atoms by way of collisionswith the glass wall. Similar effects took place when ob-stacles were placed in front of the target, as observed inour previous experiments using a TEA CO2 laser andnormal-oscillation laser. 20,30 It is very interesting to notethat the secondary plasma attains fairly high temporarytemperature during that time, ranging from 9000 to10 000 K. As a consequence of this effect, the secondaryplasma in a con® ned con® guration promises to serve asa very useful source for spectrochemical analysis.
The cross-sectional views of the secondary plasma areshown in Fig. 6, in terms of its time-resolved spatial dis-tributions of emission intensity. The curves show howthe plasma evolves with time and varies in the space con-® ned within the parallel glass plate. By comparing thetwo curves obtained at 0.3 and 0.5 m s, we can see thegrowth of the shock excitation stage dynamically. Thecurve at 0.5 m s undoubtedly shows the typical emissionpro® le expected from shock wave excitation. The sharpemission peak located near the plasma front for t 5 0.5m s demonstrates once again the existence of a thin shellstructure. Beyond 0.5 m s, the curves showing the spatialdistribution of Cu(I) 521.8 nm emission become wider,and the shell structure collapses with time. We assumethat this characteristic corresponds to the cooling stage.It is readily seen that there is a good agreement betweenthe results shown in Fig. 4A and Fig. 6.
As shown in Fig. 7, the time-resolved spatial distri-bution of temperature at 0.5 m s has indeed the character-istic feature expected from shock wave-induced temper-ature distribution observed behind the ordinary shockfront as generated by mechanical explosion.31 Namely,the temperature distribution consists of the hot part,which is distributed in a narrow area with a steep climbrising from the front and followed by the second partcharacterized by a plateau. This pattern provides verystrong evidence in support of our earlier assertion thatthis secondary plasma is indeed excited by the shockwave. Furthermore, it should be noted that the curve oftemperature distribution is shifted slightly closer to thefront compared to that of the Cu(I) 521.8 nm emissionintensity distribution. This shift is readily understood byrecalling that the shock front, which cannot be directlyobserved by the emission experiment, is located at thefront edge of the secondary plasma, and the highest tem-perature region is located just behind the shock front.This fact also becomes one of the strong points in supportof the shock excitation stage, because this phenomenoncannot be explained by other models, such as the recom-bination mechanism or the gas reservoir mechanism, aswe discussed in a previous paper. 27
At 1 m s the temperature distribution curve displaysmore gentle variation, losing the sharp local structure.This observation means that the plasma at 1 m s has al-ready passed into the cooling stage. As mentioned earlier,the curves shown in Fig. 6 also indicate that the second-ary plasma observed at t $ 1 m s is already in the coolingstage.
As stressed earlier in the case of con® ned plasma, onecan get the cross-sectional view of the dynamical processof the secondary plasma as shown in Fig. 6. The con® nedplasma propagates with time to the front, and the emis-sion takes place mainly in the limited region of the plas-ma. Therefore, the position corresponds to the time whenthe plasma front passes by that position. In other words,the front position of the secondary plasma (r ) increaseswith the lapse of time after the laser irradiation. Accord-ing to our excitation model, it is assumed that the emis-sion intensity increases with time during the shock ex-citation stage, as shown in Fig. 4. Therefore, we can con-clude that the shock excitation process takes place in therange from 0 mm to about 4 mm for 8 Torr and from 0to about 7 mm for 2 Torr on the basis of the curves inFig. 9. On the other hand, it is natural to suppose thatthe cooling stage takes place in the region where the tem-perature decreases with distance. Therefore, from thecurves shown in Fig. 8, one can associate the actual cool-ing stage with a region in the range from about 4 mm toaround 10 mm for 8 Torr, and from about 7 mm to around15 mm.
In addition to its signi® cance in further characterizingthe dynamical evolution of secondary plasma and the re-lated shock excitation mechanism, the spatial distribu-tions of plasma temperature are also useful from a prac-tical point of view. It is clear from these data that theoptimum position set for the slit of the monochromatorshould be around 4 mm for 8 Torr and around 7 mm for2 Torr, where the highest plasma temperatures are found,providing the most favorable condition for highly sensi-tive analysis. Without question, of course, we must also
APPLIED SPECTROSCOPY 729
take into account the signal-to-background ratio (S/B)(namely, emission line intensity vs. background emissionintensity) for the application for highly sensitive analysis.A research on this aspect is now in progress in our lab-oratory.
We recall for the purpose of comparison that Lee etal.32 have estimated the copper plasma temperature pro-duced by using a Q-switched Nd:YAG laser (20 mJ) inhelium atmosphere with pressure varying from 760 to 10Torr. At 10 Torr, the temperature started to rise gentlyfrom 10 000 K near the surface of the sample, to a max-imum of 12 500 K at 4 mm, which was followed by asharp drop. These temperatures are generally higher thanthose measured in our case. The difference is due mainlyto the cooling effect introduced by the cold glass platesin addition to some in¯ uence from the different ambientgases used in the two cases.
The relationship between the propagation time (t) ofthe two-dimensional shock wave induced by an explosionand the propagation length (r) from the source of theexplosion was derived on the basis of dimensional anal-ysis33 with the following result:
r 5 (Eo / a r )¼ t½ (1)
where Eo is the initial explosion energy per unit area, ris the density of the surrounding gas, and a is the constantinvolving g (the ratio of the speci® c heat of gases). Thesquare root dependency of r on t as shown in Eq. 1 ismore or less satis® ed by the slopes of all the curves pre-sented in Fig. 9, which are around 0.5 at the initial stageof the secondary plasma expansion. Therefore this ex-perimental result clearly con® rms the role of the shockwave mechanism in the generation of the secondary plas-ma.
It should also be noted that the time corresponding tothe bending points of the straight lines in Fig. 9 practi-cally coincide with those discussed above. Namely, theinitial slope corresponds to conditions in the shock ex-citation stage and the second slope corresponds to thosein the cooling stage. These coincidences lend further sup-port to our excitation model described above.
CONCLUSION
By applying a unique technique to the study of thedynamical process of the Q-switched laser-induced plas-ma, we have succeeded in revealing the cross-sectionalview of the plasma. As a result, more accurate data havebeen obtained for the time-resolved spatial distribution ofCu(I) 521.8 nm emission intensity and also the time-re-solved temperature distribution derived from the ratio be-tween the emission intensities of Cu(I) 521.8 nm andCu(I) 510.5 nm spectral lines. In addition to con® rmingthe blast wave mechanism for the generation of the sec-ondary plasma, spectral line analysis of these data furtherleads to a conclusion in clear support of our model inwhich the emission process of the secondary plasma isdivided into two different processes, associated, respec-tively, with the ``shock excitation stage’ ’ and the ``cool-ing stage’ ’ . During the shock excitation stage, the atomsgushing out from the target are adiabatically compressedagainst the surrounding gas, resulting in an increase ofthe plasma temperature up to around 9000 K. The shock
excitation stage lasts for a certain period that is deter-mined mainly by the pressure of the surrounding gas. Forinstance, in the case of 2 Torr gas pressure, the shockexcitation stage lasts for about 1 m s, which is followedimmediately by the cooling stage. During the coolingstage the temperature of the secondary plasma decreasesgradually to around 7500 K in about 3 m s. In ordinaryatomic emission spectrometry, atoms are excited bymeans of an electric discharge. Instead, we have shownin this study that atoms in the secondary plasma are ex-cited by quite a different mechanism, involving a tran-sient and thermally nonequilibrium plasma. This excita-tion mechanism is expected to offer more favorable con-ditions for highly sensitive spectrochemical analysis dueto the possibility of suppressing the production of ionswhich are responsible for the strong continuous emissionbackground. Further studies are being undertaken on thisaspect for the realization of a highly sensitive LAESAsystem for rapid and direct spectrochemical analysis ofsolid samples.
ACKNOWLEDGMENTS
Part of this work was supported by the Indonesia government throughthe RUT project under Contract No. 215/SPK/RUT/BPPT/IV/97 andthe University Research for Graduate Education project.
1. N. G. Basov, O. N. Krokhin, and G. V. Skilzkov, JETP Lett. 6, 168(1967).
2. N. G. Basov, V. A. Gribkov, O. N. Krokhin, and G. V. Skilzkov,Sov. JETP Lett. 27, 575 (1968).
3. J. L. Bobin, Y. A. Durand, Ph. P. Langer, and G. Tonon, J. Appl.Phys. 39, 4184 (1968).
4. D. C. Emmony and J. Irving, Brit. J. Appl. Phys. 2, 1186 (1969).5. R. B. Hall, Appl. Phys. 40, 1941 (1969).6. T. P. Hughes, in Plasma and Laser Light (Adam Hilger, England,
1975), p. 435.7. D. B. Geoheagen, Appl. Phys. Lett. 60, 2732 (1992).8. W. K. A. Kumuduni, Y. Nakayama, Y. Nakata, T. Okada, and M.
Maeda, Jpn. J. Appl. Phys. 32, L271 (1993).9. K. Laqua, in Analytical Laser Spectroscopy , N. Omenetto, Ed. (Wi-
ley, New York, 1979), p. 47.10. E. H. Piepmeier, in Analytical Applications of Lasers (Wiley, New
York, 1986), p. 627.11. D. A. Cremers and L. J. Radziemki, in Laser Spectroscopy and its
Applications, R. W. Solarz and J. A. Paisner, Eds. (Marcel Dekker,New York, 1987), p. 351.
12. T. R. Loree and L. J. Radziemski, Plasma Chem. and Plasma Proc.1, 271 (1981).
13. L. J. Radziemski and T. R. Loree, Plasma Chem. and Plasma Proc.1, 281, (1981).
14. D. A. Cremers, Appl. Spectrosc. 41, 572 (1987).15. K. Kagawa, M. Ohtani, S. Yokoi, and S. Nakajima, Spectrochim.
Acta B39, 525 (1984).16. K. Kagawa and H. Kurniawan, in Proceeding of International
Workshop on Shock Waves , H. Honna, Ed. (Chiba University, Ja-pan, 1992), p. 97.
17. H. Kurniawan, T. Kobayashi, and K. Kagawa, Appl. Spectrosc. 46,581, (1992).
18. H. Kurniawan, M. O. Tjia, M. Barmawi, S, Yokoi, Y. Kimura, andK. Kagawa, J. Phys D: Appl. Phys. 28, 879 (1995).
19. H. Kurniawan, T. Kobayashi, S. Nakajima, and K. Kagawa, Jpn. J.Appl. Phys. 31, 1213 (1992).
20. M. Tani, H. Kurniawan, H. Ueda, K. Mizukami, K. Kawai, and K.Kagawa, Jpn. J. Appl. Phys. 32, 3838 (1993).
21. K. Kagawa, K. Kawai, M. Tani, and T. Kobayashi, Appl. Spectrosc.48, 198 (1994).
22. K. Bockasten, J. Opt. Soc. Am. 54, 944 (1960).23. P. W. J. M. Boumans, in Theory of Spectrochemical Excitation (Ple-
num Press, New York, 1966), p. 135.24. H. Kurniawan, W. Setia Budi, M. M. Suliyanti, A. M. Marpaung,
and K. Kagawa, J. Phys. D: Appl. Phys. 30, 3335 (1997).

730 Volume 53, Number 6, 1999
25. H. Kurniawan, S. Nakajima, J. E. Batubara, M. Marpaung, M. Oka-moto, and K. Kagawa, Appl. Spectrosc. 49, 1067 (1995).
26. H. Kurniawan, K. Kagawa, M. Okamoto, M. Ueda, T. Kobayashi,and S. Nakajima, Appl. Spectrosc. 50, 299 (1996).
27. H. Kurniawan, Y. Ishikawa, S. Nakajima, and K. Kagawa, Appl.Spectrosc. 51, 1769 (1997).
28. X. L. Mao, M. A. Shannon, A. J. Fernandez, and R. E. Russo,Appl. Spectrosc. 49, 1054 (1995).
29. M. Sabsabi and P. Cielo, Appl. Spectrosc. 49, 499 (1995).30. H. Kurniawan and K. Kagawa, Appl. Spectrosc. 51, 304 (1997).31. I. I. Glass, Shock Waves and Man (Maruzen Company Ltd., Tokyo,
Japan, 1987).32. Y. I. Lee, K. Song, H. K. Cha, J. M. Lee, M. C. Park, G. H. Lee,
and J. Sneddon, Appl. Spectrosc. 51, 959 (1997).33. L. I. Sedov, Similarity and Dimensional Methods in Mechanics
(Academic Press, New York, 1959), p. 213.