Endurecimiento superficial de aceros y fundiciones mediante lase de Nd:YAG
Upload
independentCategory
view
0download
0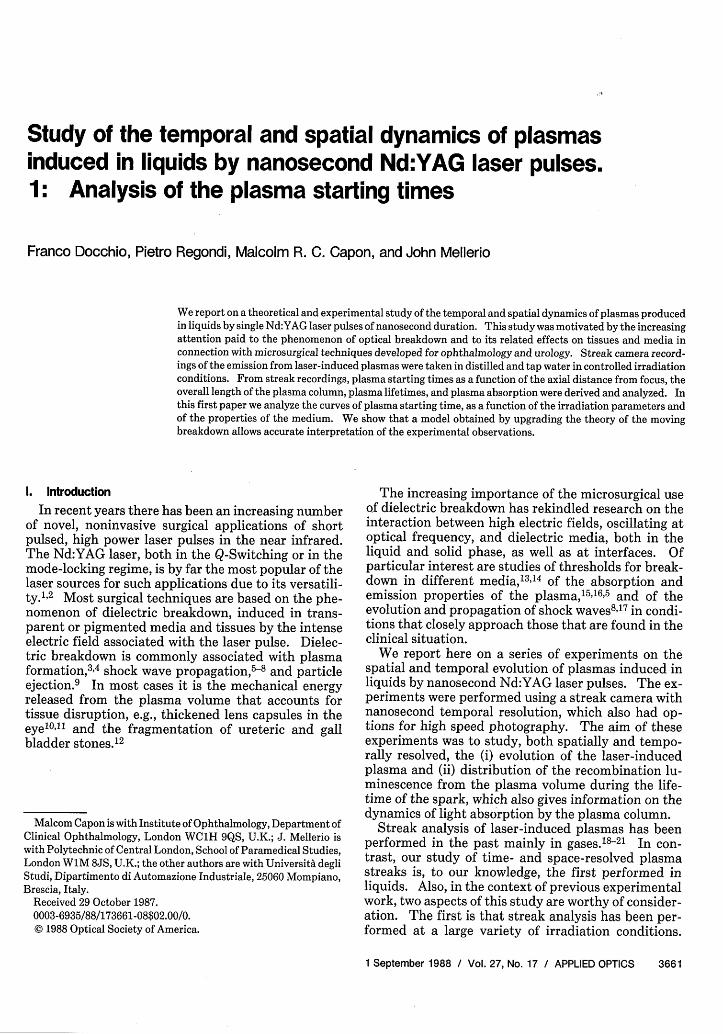
Study of the temporal and spatial dynamics of plasmasinduced in liquids by nanosecond Nd:YAG laser pulses.1: Analysis of the plasma starting times
Franco Docchio, Pietro Regondi, Malcolm R. C. Capon, and John Mellerio
We report on a theoretical and experimental study of the temporal and spatial dynamics of plasmas producedin liquids by single Nd:YAG laser pulses of nanosecond duration. This study was motivated by the increasingattention paid to the phenomenon of optical breakdown and to its related effects on tissues and media inconnection with microsurgical techniques developed for ophthalmology and urology. Streak camera record-ings of the emission from laser-induced plasmas were taken in distilled and tap water in controlled irradiationconditions. From streak recordings, plasma starting times as a function of the axial distance from focus, theoverall length of the plasma column, plasma lifetimes, and plasma absorption were derived and analyzed. Inthis first paper we analyze the curves of plasma starting time, as a function of the irradiation parameters andof the properties of the medium. We show that a model obtained by upgrading the theory of the movingbreakdown allows accurate interpretation of the experimental observations.
1L Introduction
In recent years there has been an increasing numberof novel, noninvasive surgical applications of shortpulsed, high power laser pulses in the near infrared.The Nd:YAG laser, both in the Q-Switching or in themode-locking regime, is by far the most popular of thelaser sources for such applications due to its versatili-ty.1"2 Most surgical techniques are based on the phe-nomenon of dielectric breakdown, induced in trans-parent or pigmented media and tissues by the intenseelectric field associated with the laser pulse. Dielec-tric breakdown is commonly associated with plasmaformation, 3 ' 4 shock wave propagation, 5 -8 and particleejection.9 In most cases it is the mechanical energyreleased from the plasma volume that accounts fortissue disruption, e.g., thickened lens capsules in theeye 0 'll and the fragmentation of ureteric and gallbladder stones.12
Malcom Capon is with Institute of Ophthalmology, Department ofClinical Ophthalmology, London WC1H 9QS, U.K.; J. Mellerio iswith Polytechnic of Central London, School of Paramedical Studies,London W1M 8JS, U.K.; the other authors are with UniversitA degliStudi, Dipartimento di Automazione Industriale, 25060 Mompiano,Brescia, Italy.
Received 29 October 1987.0003-6935/88/173661-08$02.00/0.© 1988 Optical Society of America.
The increasing importance of the microsurgical useof dielectric breakdown has rekindled research on theinteraction between high electric fields, oscillating atoptical frequency, and dielectric media, both in theliquid and solid phase, as well as at interfaces. Ofparticular interest are studies of thresholds for break-down in different media,1314 of the absorption andemission properties of the plasma,15165 and of theevolution and propagation of shock waves8"17 in condi-tions that closely approach those that are found in theclinical situation.
We report here on a series of experiments on thespatial and temporal evolution of plasmas induced inliquids by nanosecond Nd:YAG laser pulses. The ex-periments were performed using a streak camera withnanosecond temporal resolution, which also had op-tions for high speed photography. The aim of theseexperiments was to study, both spatially and tempo-rally resolved, the (i) evolution of the laser-inducedplasma and (ii) distribution of the recombination lu-minescence from the plasma volume during the life-time of the spark, which also gives information on thedynamics of light absorption by the plasma column.
Streak analysis of laser-induced plasmas has beenperformed in the past mainly in gases.'8-12 In con-trast, our study of time- and space-resolved plasmastreaks is, to our knowledge, the first performed inliquids. Also, in the context of previous experimentalwork, two aspects of this study are worthy of consider-ation. The first is that streak analysis has been per-formed at a large variety of irradiation conditions.
1 September 1988 / Vol. 27, No. 17 / APPLIED OPTICS 3661
Second, the use of a relatively short pulse durationallowed us to make use of a simple theoretical model toexplain the results.
In this first of two papers we present the results ofstreak measurements with liquids accepted as modelsfor ocular media, such as distilled water (a rather im-purity-free, high breakdown threshold medium), andtap water (an impurity-rich, low breakdown thresholdmedium). We discuss the relation between the start-ing time of the plasma and its position along the beampropagation axis by proposing a theoretical model,which is essentially an upgrading of the moving break-down model.2 2
The use of this model allowed precise interpretationof the experimental results: in particular, it allowedus to draw a simple relation between the overall lengthof the plasma column with respect to the irradiationconditions and the beam geometry, in good agreementwith the observations.
In the companion paper23 we analyze, with the aid ofthe moving breakdown model, the time- and space-resolved light emission characteristics of the plasma.
11. Experimental Apparatus
The experimental apparatus used in the experi-ments is shown in Fig. 1. The laser system used toperform the experiments was a LASAG Topaz photo-disruptor, an actively Q-switched Nd:YAG laser ableto deliver 12-ns (FWHM) long pulses in a TEMoo modeconfiguration. Built into the system were enlargingoptics and the focusing optics which produced a spot of-13-tm diameter at l/e2 in the liquid (standard focus-ing). An additional lens of 50-mm focal length wassometimes added to further reduce the focal diameterto -11-Am (tight focusing). Breakdown was producedat the center of a quartz cuvette filled with eitherdoubly distilled water or with tap water.
The spark produced was magnified by a factor of 14and imaged onto the photocathode of the streak cam-era. The streak camera/high speed photography sys-tem was an HE-700 Imacon image converter system(Hadland Photonics, Hemel Hempstead, U.K.). Thephotocathode was of the Si type, insensitive to anylaser light scattered from the breakdown region. Thestreak camera was triggered from the driving pulse ofthe laser Pockels cell via a suitable high performancedelay generator (TD3, Hadland Photonics). Streakrates of 1 or 2 ns/mm at the plane of the Polaroid filmwere used. The exposure parameters of the film werecarefully chosen to obtain good linearity at each streakrate.
High speed photography measurements, prelimi-narily performed to determine the propagation speedof the shock wave front, were made using the sameapparatus, as shown with the additional light sourceshown in Fig. 1, configured for high speed framing (20X 106 frames/s). Illumination of the sample was pro-vided by a flashlamp with proper pretriggering withrespect to the laser shot. Also preliminary to makingstreak records, the threshold parameters for opticalbreakdown in the two media and with the two focusing
I ~~~~~~~~~~Streakr-- - l Ob. RamIng
L_ P .e~ P.C
O uartz CellI
Fig. 1. Experimental setup for streak measurements of plasmasinduced in liquids by Nd:YAG laser pulses of 12-ns FWHM dura-tion. The additional setup used for high speed framing is shownwith dotted lines. Legends are S.O., schematics of the slit optics;
Obj, expansion objective; P.C., photographic camera.
conditions were determined. Breakdown probabilitycurves'4 were derived by plotting the number of break-down events occurring over a large number of shots,against the energy input. From these curves, thethreshold irradiance values could be estimated: wedefined threshold as that irradiance which producedbreakdown with a probability of 100%. The calibra-tion of the energy meter in the laser instrument waschecked against an EG&G series 581 radiometer. Dis-tilled water and tap water showed markedly differentthreshold energies (2.4 and 0.9 mJ, respectively, corre-sponding to irradiances at the focus of 166 and 61 GW/cm2 in the standard focusing conditions, and 2.2 and0.8 mJ, corresponding to 195 and 70.2 GW/cm2 , in thetight focusing conditions) due to the different impuri-ty content.
The pulse energy was increased from just belowthreshold up to the maximum of 15 mJ. At eachenergy value a set of streak pictures were recorded andanalyzed.
Ill. Results
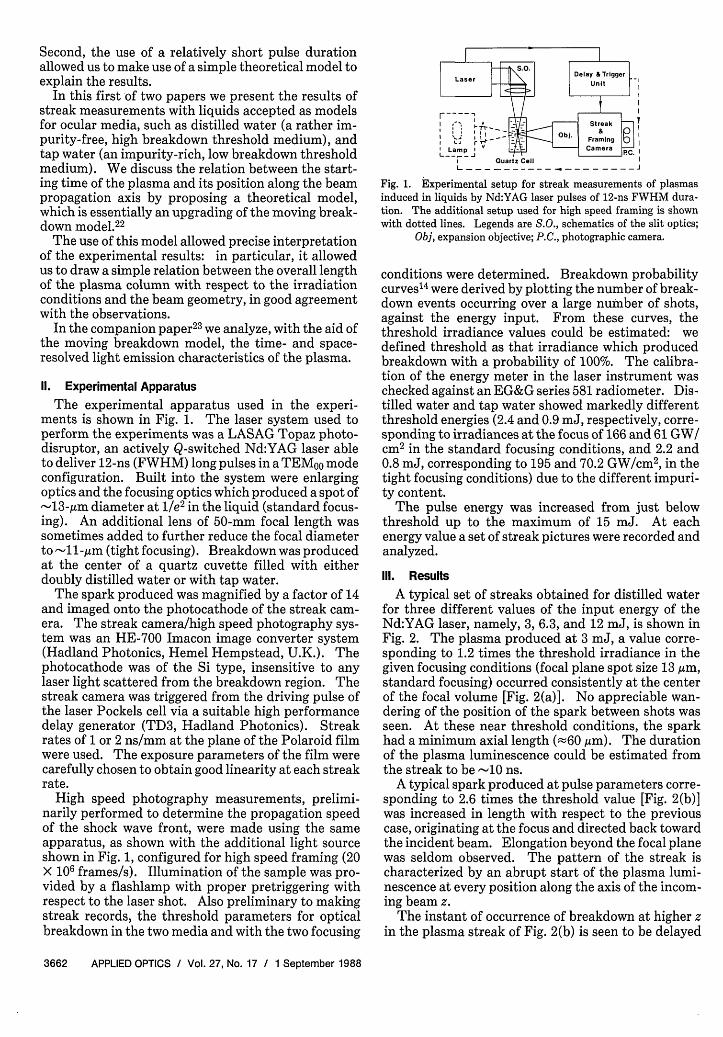
A typical set of streaks obtained for distilled waterfor three different values of the input energy of theNd:YAG laser, namely, 3, 6.3, and 12 mJ, is shown inFig. 2. The plasma produced at 3 mJ, a value corre-sponding to 1.2 times the threshold irradiance in thegiven focusing conditions (focal plane spot size 13 ,im,standard focusing) occurred consistently at the centerof the focal volume [Fig. 2(a)]. No appreciable wan-dering of the position of the spark between shots wasseen. At these near threshold conditions, the sparkhad a minimum axial length (-60 im). The durationof the plasma luminescence could be estimated fromthe streak to be -10 ns.
A typical spark produced at pulse parameters corre-sponding to 2.6 times the threshold value [Fig. 2(b)]was increased in length with respect to the previouscase, originating at the focus and directed back towardthe incident beam. Elongation beyond the focal planewas seldom observed. The pattern of the streak ischaracterized by an abrupt start of the plasma lumi-nescence at every position along the axis of the incom-ing beam z.
The instant of occurrence of breakdown at higher zin the plasma streak of Fig. 2(b) is seen to be delayed
3662 APPLIED OPTICS / Vol. 27, No. 17 / 1 September 1988
300_200
o: _
ri
0
00
E0
0
00
0
xa'
04
0 5 10
300 F200 _
100: L:0
300 -
200
100 10 -
E
00
a)
b)
C)
b)
I , I - I 0 5 10 15
I I I I I I0 8 10 185 20
TIme (11)
Fig. 2. Streak photographs of plasmas produced in distilled waterby a 12-ns TEMoo mode Nd:YAG laser for different values of theparameter A which is defined as the ratio of the peak power, Pma tothe peak power at threshold Pth (see text for the definition of Pth).The spot size at the focus is 13 ,um. Laser light enters the plasmaregion from the top of the picture. (a) = 1.2, (b) 3 = 2.6, (c) =5.0.
with respect to the instant of breakdown occurrence atlower z. The figure clearly shows a regular shape ofthe locus of the instants of breakdown occurrence vsthe axial coordinate. This curve can be defined as theplasma starting time curve. The top of the plasmastreak of Fig. 2(b) is almost flat, showing that theexpansion of the spark toward the laser source, afterthe end of the pulse, is limited. Due to the flatness ofthe top of the spark, the maximum length of the plas-ma column, Zmax, could be easily measured.
By contrast with the stepwise luminescence onset, ata given z the decrease of the luminescence tails offmore or less smoothly. An interesting feature, whichis also observed in gases,2 3 is that the duration of theplasma emission is shorter near the focal point andlonger upstream. Moreover, comparing Fig. 2(a) withFig. 2(b) it is easy to observe that the luminescence ofthe streak at the focus is longer when no plasma existsin the upstream position.
As the energy is further increased up to five timesthe threshold value [Fig. 2(c)], a still increased elonga-tion of the plasma column toward the incoming beam isobserved. All the other features observed in the caseof the plasma of Fig. 2(b), i.e., a regular plasma starting
15 ns
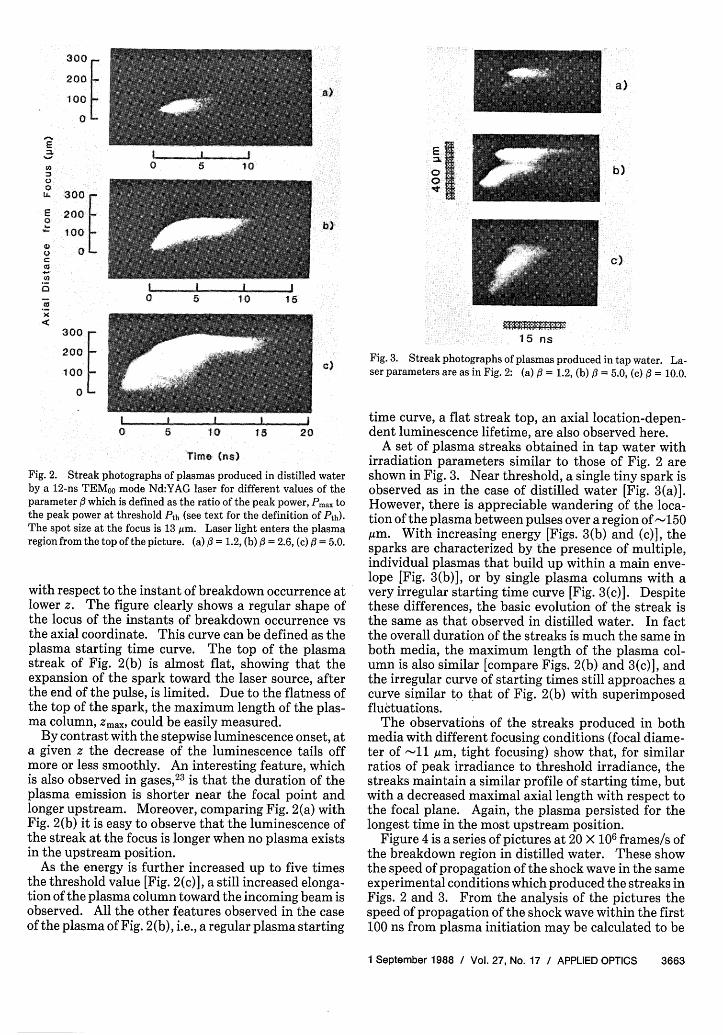
Fig. 3. Streak photographs of plasmas produced in tap water. La-ser parameters are as in Fig. 2: (a) = 1.2, (b) = 5.0, (c) = 10.0.
time curve, a flat streak top, an axial location-depen-dent luminescence lifetime, are also observed here.
A set of plasma streaks obtained in tap water withirradiation parameters similar to those of Fig. 2 areshown in Fig. 3. Near threshold, a single tiny spark isobserved as in the case of distilled water [Fig. 3(a)].However, there is appreciable wandering of the loca-tion of the plasma between pulses over a region of 150gim. With increasing energy [Figs. 3(b) and (c)], thesparks are characterized by the presence of multiple,individual plasmas that build up within a main enve-lope [Fig. 3(b)], or by single plasma columns with avery irregular starting time curve [Fig. 3(c)]. Despitethese differences, the basic evolution of the streak isthe same as that observed in distilled water. In factthe overall duration of the streaks is much the same inboth media, the maximum length of the plasma col-umn is also similar [compare Figs. 2(b) and 3(c)], andthe irregular curve of starting times still approaches acurve similar to that of Fig. 2(b) with superimposedfluctuations.
The observations of the streaks produced in bothmedia with different focusing conditions (focal diame-ter of -11 gm, tight focusing) show that, for similarratios of peak irradiance to threshold irradiance, thestreaks maintain a similar profile of starting time, butwith a decreased maximal axial length with respect tothe focal plane. Again, the plasma persisted for thelongest time in the most upstream position.
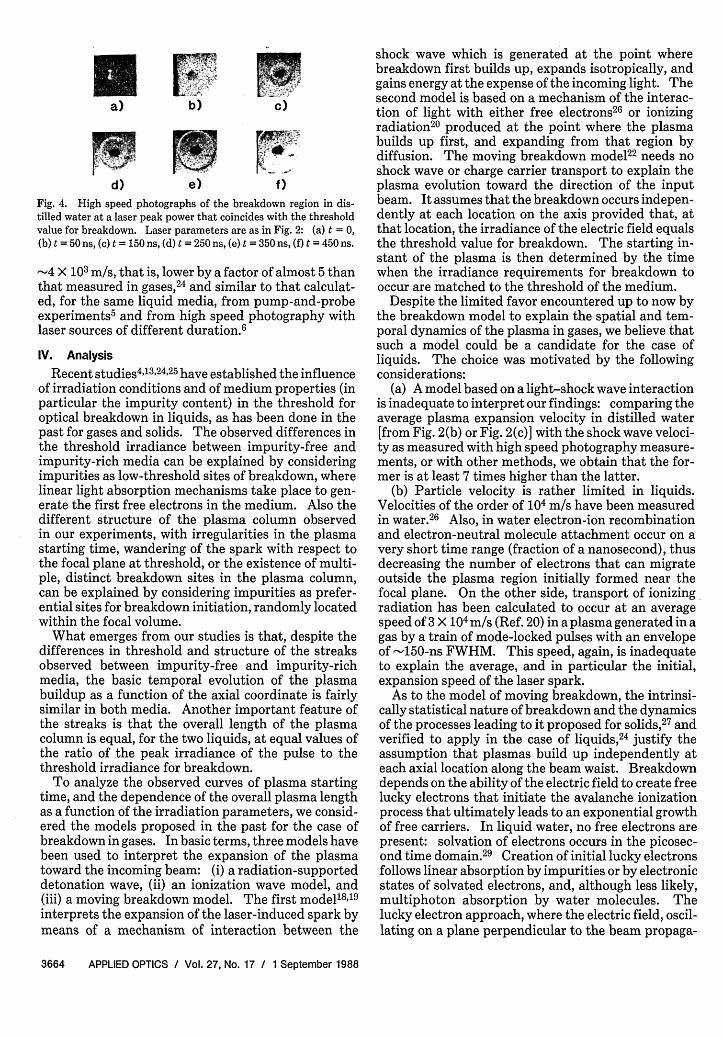
Figure 4 is a series of pictures at 20 X 106 frames/s ofthe breakdown region in distilled water. These showthe speed of propagation of the shock wave in the sameexperimental conditions which produced the streaks inFigs. 2 and 3. From the analysis of the pictures thespeed of propagation of the shock wave within the first100 ns from plasma initiation may be calculated to be
1 September 1988 / Vol. 27, No. 17 / APPLIED OPTICS 3663
a)
d)
b)
e)
I
C)
0E
Fig. 4. High speed photographs of the breakdown region in dis-tilled water at a laser peak power that coincides with the thresholdvalue for breakdown. Laser parameters are as in Fig. 2: (a) t = 0,(b) t = 50 ns, (c) t = 150 ns, (d) t = 250 ns, (e) t = 350 ns, (f) t = 450 ns.
-4 X 10³ m/s, that is, lower by a factor of almost 5 thanthat measured in gases,24 and similar to that calculat-ed, for the same liquid media, from pump-and-probeexperiments5 and from high speed photography withlaser sources of different duration.6
IV. Analysis
Recent studies4 3, 24 25have established the influenceof irradiation conditions and of medium properties (inparticular the impurity content) in the threshold foroptical breakdown in liquids, as has been done in thepast for gases and solids. The observed differences inthe threshold irradiance between impurity-free andimpurity-rich media can be explained by consideringimpurities as low-threshold sites of breakdown, wherelinear light absorption mechanisms take place to gen-erate the first free electrons in the medium. Also thedifferent structure of the plasma column observedin our experiments, with irregularities in the plasmastarting time, wandering of the spark with respect tothe focal plane at threshold, or the existence of multi-ple, distinct breakdown sites in the plasma column,can be explained by considering impurities as prefer-ential sites for breakdown initiation, randomly locatedwithin the focal volume.
What emerges from our studies is that, despite thedifferences in threshold and structure of the streaksobserved between impurity-free and impurity-richmedia, the basic temporal evolution of the plasmabuildup as a function of the axial coordinate is fairlysimilar in both media. Another important feature ofthe streaks is that the overall length of the plasmacolumn is equal, for the two liquids, at equal values ofthe ratio of the peak irradiance of the pulse to thethreshold irradiance for breakdown.
To analyze the observed curves of plasma startingtime, and the dependence of the overall plasma lengthas a function of the irradiation parameters, we consid-ered the models proposed in the past for the case ofbreakdown in gases. In basic terms, three models havebeen used to interpret the expansion of the plasmatoward the incoming beam: (i) a radiation-supporteddetonation wave, (ii) an ionization wave model, and(iii) a moving breakdown model. The first model 8"19
interprets the expansion of the laser-induced spark bymeans of a mechanism of interaction between the
shock wave which is generated at the point wherebreakdown first builds up, expands isotropically, andgains energy at the expense of the incoming light. Thesecond model is based on a mechanism of the interac-tion of light with either free electrons26 or ionizingradiation2 0 produced at the point where the plasmabuilds up first, and expanding from that region bydiffusion. The moving breakdown model22 needs noshock wave or charge carrier transport to explain theplasma evolution toward the direction of the inputbeam. It assumes that the breakdown occurs indepen-dently at each location on the axis provided that, atthat location, the irradiance of the electric field equalsthe threshold value for breakdown. The starting in-stant of the plasma is then determined by the timewhen the irradiance requirements for breakdown tooccur are matched to the threshold of the medium.
Despite the limited favor encountered up to now bythe breakdown model to explain the spatial and tem-poral dynamics of the plasma in gases, we believe thatsuch a model could be a candidate for the case ofliquids. The choice was motivated by the followingconsiderations:
(a) A model based on a light-shock wave interactionis inadequate to interpret our findings: comparing theaverage plasma expansion velocity in distilled water[from Fig. 2(b) or Fig. 2(c)] with the shock wave veloci-ty as measured with high speed photography measure-ments, or with other methods, we obtain that the for-mer is at least 7 times higher than the latter.
(b) Particle velocity is rather limited in liquids.Velocities of the order of 104 m/s have been measuredin water. 2 6 Also, in water electron-ion recombinationand electron-neutral molecule attachment occur on avery short time range (fraction of a nanosecond), thusdecreasing the number of electrons that can migrateoutside the plasma region initially formed near thefocal plane. On the other side, transport of ionizingradiation has been calculated to occur at an averagespeed of 3 X 10⁴ M/s (Ref. 20) in a plasma generated in agas by a train of mode-locked pulses with an envelopeof -150-ns FWHM. This speed, again, is inadequateto explain the average, and in particular the initial,expansion speed of the laser spark.
As to the model of moving breakdown, the intrinsi-cally statistical nature of breakdown and the dynamicsof the processes leading to it proposed for solids,27 andverified to apply in the case of liquids,24 justify theassumption that plasmas build up independently ateach axial location along the beam waist. Breakdowndepends on the ability of the electric field to create freelucky electrons that initiate the avalanche ionizationprocess that ultimately leads to an exponential growthof free carriers. In liquid water, no free electrons arepresent: solvation of electrons occurs in the picosec-ond time domain.29 Creation of initial lucky electronsfollows linear absorption by impurities or by electronicstates of solvated electrons, and, although less likely,multiphoton absorption by water molecules. Thelucky electron approach, where the electric field, oscil-lating on a plane perpendicular to the beam propaga-
3664 APPLIED OPTICS / Vol. 27, No. 17 / 1 September 1988
1I-'
I I IZMax z3 z2 Z1 °
1z 2))I U ) I (0)
IUzMax) I (z3 )
t4 = 0LJ' IN AK
t3 t2 tl to
Fig. 5. Diagram illustrating the model of the moving breakdoNliquids. (a) Geometrical structure of a (half) Gaussian beamfocus at z = 0. Shaded areas illustrate the spatial distribution cpower at two distinct locations along the beam axis. (b) In cspondence with some axial locations, gives the temporal shapelaser pulse whose peak power is assumed to exceed, at z = 0threshold power required for breakdown in the medium by a fof 2 ( = 2). The left edge of each shaded area in (b) is the instaoccurrence of breakdown t corresponding to the axial locaticAt z = Zmax, breakdown occurs only in correspondence with theof the pulse (t = 0). Beyond that point, no breakdown occurs.
curve of starting time is the locus of all points t(z).
ing beam and (ii) there must be a unique and explicitdependence of the maximum elongation Zmax on thebeam power and geometric characteristics.
It is important to note that plasma expansion onlyoccurs in one direction and not in both directions withrespect to the focal point (z = 0). This asymmetry is
a) expected because absorption of the pulse energy by thenewly formed plasma decreases the amount of poweravailable for producing breakdown at any point be-yond the focal plane.4" 6 This is the so-called shielding
b) effect: we postpone the discussion of shielding to thenext paper, where we show how this effect can accountfor the observed decay pattern of the streaks.
If the laser pulse has a Gaussian amplitude of theelectric field that corresponds to a power (or energy)
vn in distribution of the square Gaussian type, thenwitho theorre-e of a, thectornt ofon zi.peakThe
tion direction, is supposed to create free initial elec-trons, may well account for a layer-oriented evolutionof breakdown, where every layer of thickness dz estab-lishes its own plasma.
Starting from these assumptions, we now proceedwith the description of the modified moving break-down model for plasma expansion. The model hasbeen upgraded with respect to its original formulation,especially by taking into account the correct temporaland spatial characteristics of the laser beam. We firstrecall that the irradiance is defined as the power divid-ed by the irradiated area and assume that the peakpower of the laser beam, at the geometrical focus(z = 0), corresponds to the threshold irradiance. Inthis case, breakdown is produced only over a smallregion around the center of the beam waist. The in-stant at which breakdown begins coincides with thepeak of the pulse.
Referring to Fig. 5, where now the peak power is afactor of 2 higher than the threshold value, the irradi-ance at the focal site first reaches the threshold valuefor breakdown at time to, i.e., before the pulse reachesthe peak. At later times during this pulse, as the peakpower of the pulse increases, threshold irradiance re-quirements for breakdown are met at distances furtheraway from the focal point: for example, at location z1 ,breakdown is reached at an instant t, and so on up to avalue of Zmax corresponding to the point where theirradiance reaches the threshold value only at the peakof the pulse (t = 0).
From this it follows that (i) plasma formation occurslater in time as the value of z increases, i.e., the plasmainitiation site moves toward the direction of the incom-
P(t) = Pmax - exp[-2(t/2A) 2 ]}. (1)
If the beam distribution is also Gaussian, i.e., it isuniquely defined by the spot size w, the refractiveindex n and wavelength X, the irradiance I(z,t) at agiven axial distance z and time t is given by the expres-sion
I(zt) = P(t)/[7rw 2(z)j, (2)
that is,
I(z,t) = Pmax jexp[-2(t/2A) 2 ]j.rw
2(z)
(3)
Here, z is the axial distance from the center of thefocal volume and w(z) is the radius of the beam waist atthe location z [being w(z) = wo for z = 0]; t is the timewith zero value at the peak of the pulse; A = FWHM/2(2 ln2)1/2 where FWHM is the full width at half-maximum of the pulse power and zo, from the Gaussianbeam law, is given by zo = nrwo/X.
We now define the factor 3 as the ratio of the peakpower of the pulse to the threshold value: = Pmax/Pth, where Pth = Ith-7rW2. As defined earlier, the curveof plasma starting time is the locus t(z) of all thestarting instants t, when breakdown starts, as a func-tion of z and of the operating parameters of the laser.From Eq. (3), setting the condition I(z,t) = Ith, weobtain
t(z) = -A12 ln[f3(1 + Z2/zo)J 1 10 2(4)
The function t(z) is real in the range 0 < z < zo( -1)1/2. The corresponding values for t are -A(2 lnof1/2forz =0 and0forzo(- 1)1/2. Thequantityto = t(0) =-A(2 lnof1/2 is the instant at which the plasma is firstproduced at the focal site, as a function of parameter .On the other side, the quantity
Z... = Z0 (# - 1)1/2 (5)
is the previously defined Zmax, i.e., the maximum lengthof the plasma for a given irradiation condition (deter-mined by the value of O3).
The inverse function of t(z) is given by z(t) and hasthe form
z(t) = z0ffl exp[-2(t/2A) 2 ] - 11/2. (6)
1 September 1988 / Vol. 27, No. 17 / APPLIED OPTICS 3665
=
=
1Z3.
A_

16
14
E01
Ca,
c
E0
cotoLS
1 2
1 0
4
2
00 50 100 150 200 250 300 350
Axial Distance from Focus (pm)
Fig. 6. Plot of the theoretical curves for plasma starting times,expressed as the function t(z) - to, i.e., with origin corresponding tothe starting time at z = 0, obtained with the model of movingbreakdown for different values of the ratio a = Pmax/Pth. Laserparameters are as in Fig. 2. Superimposed on each curve is theexperimental curve of plasma starting time derived from the streak
photographs of Fig. 2, suitably scaled.
To test the validity of the model, in Fig. 6 we plotteda set of t(z) curves using the temporal, spatial, andirradiation parameters that correspond to the streaksof Fig. 2. In the figure the origin for the abscissacoincides with the time to breakdown to: therefore allthe curves have the same origin. Superimposed to thetheoretical curves of plasma starting time, we plottedthe experimental curves derived from the streaks.There is excellent agreement of the experimentalcurves with the theoretical predictions for the threevalues of A, with relation to the shape of the curves forplasma starting times and to the maximal elongationZmax. As shown in Fig. 6, curves of plasma startingtime t(z) are characterized by a nearly parabolic shape,the main difference being the way they approach thelimit point of abscissa Zmax, where the slope of the curvegrows to infinity. This is consistent with the assump-tion that no interaction with the plasma can occurwhen the pulse irradiance is below threshold. Figure 6also shows how the limiting parameter Zmax variesmonotonically as a function of A.
Of particular interest is the dependence of Zmax, i.e.,the maximum elongation of the plasma column, on theirradiation conditions. Zmax, given by the simple rela-tionship of Eq. (5), does not explicitly depend on thepulse duration. Therefore, with the geometrical beamcharacteristics being equal, the maximum length of theplasma should not vary with pulse width. An implicitdependence of Zmax on pulse width comes from the factthat Pth, which appears in A, depends on the pulseduration.' 3
Fig. 7. (a) Dependence of the maximum extension, Zmax, of theplasma column toward the laser source, on the ratio A for the twoexperimental focusing conditions. Solid lines are theoretical curvesof Zmax Vs A [Eq. (5)]. (): distilled water, standard focusing;(C): distilled water, tight focusing; (A): tap water, standard focus-ing; (A): tap water, tight focusing. (b) Comparison between maxi-mum extent of plasmas produced in distilled water (left) and tapwater (right) at equal a3 values of 5.0 (corresponding to the shaded
region in (a).
Another important aspect related to the characteris-tics of the curves of plasma starting time t(z) and to Eq.(5) for the maximum elongation of the plasma columnis the fact that equal curves of plasma starting timesand equal values for Zmax should be expected, whenmeasured at equal values of the j3 parameter, for mediawith different threshold breakdown irradiances. Infact, the expressions for both t(z) and Zmax do notcontain Pmax alone, but only its ratio a to the thresholdvalue. This aspect is discussed with the aid of Fig.7(a), where the maximum axial length of the plasmastreaks toward the source laser in distilled and in tapwater, in both standard and tight focusing conditions;it has been plotted as a function of the parameter A. Inthe same figure, solid curves are plots of Zmax as afunction of A for the two cases of wo = 6.5 and 5.5 gim,respectively. Again, there is good agreement betweenexperimental points and theoretical curves obtainedwith the use of the model of moving breakdown.Moreover, it is worth noting how, in both focusing
3666 APPLIED OPTICS / Vol. 27, No. 17 / 1 September 1988
E
N
F -
I I i ill
* 500
conditions, data for distilled water and tap water arealigned along a single theoretical curve. Taking intoaccount that tap water has a threshold for breakdownabout three times lower than distilled water, this con-firms the assumed independence of Zmax on the abso-lute threshold parameters. The independence of thephysical elongation of the plasma toward the lasersource on the absolute value of the peak irradiance hasfurther support from Fig. 7(b), where plasma streaksfor distilled and tap water are compared at the valueof 5. Despite the fact that the streak in distilled waterevolves in a continuous way, while the streak in tapwater is a group of two separate plasmas, the overallelongation is very much the same for the two media.
The above experimental evidence is important inconsidering the possible role of nonlinear effects in theexpansion of the breakdown toward the laser source.Some authors studying breakdown in gases have ex-plained the multiple spark pattern in the streak byself-focusing of the laser radiation in the medium.29
In our experimental conditions, self-focusing wouldnot explain the streak elongation in either medium.Self-focusing depends on the nonlinear dielectricproperties of the bulk of the medium, and to a lesserextent on those of randomly distributed impurities.Therefore, the extent to which the focus would moveupstream, if due to self-focusing, should be dependenton the absolute value of the irradiance of the laserpulse. This is not found to be so.
Before concluding, we wish to briefly discuss thelimitations of the present formulation of the movingbreakdown model, as well as possible improvements toovercome them. First, the calculation of the laserirradiance as the ratio of the power to the surface ofarea rw2 is based on the limiting assumption that thepower is uniformly distributed throughout the cross-sectional area of radius w0. This assumption, leadingto a drastic simplification in the calculations, somehowcontradicts the previous statement that the power hasa Gaussian distribution across any plane perpendicu-lar to the axis of propagation. Second, in the develop-ment of the formalism for the model of moving break-down, the implicit hypothesis was made that thethreshold irradiance Ith is the same for each layer ofthickness dz and area 7rw2(z), regardless of the axiallocation z. According to studies performed both ingases (see, for example, Ref. 30 and references therein)and in liquids,4 24"13the threshold irradiance for break-down depends on the geometry of the irradiated re-gion. Therefore, a more exact analysis should takeinto account that Ith is a function of the axial coordi-nate z.
Finally, the model of moving breakdown in thepresent formulation does not give accurate informa-tion on the behavior of the plasma column at thresh-old. In fact, for I = Ith, in Eq. (5) = 1 and Zmax = 0,which would be unreasonable. However, we note thatthe slope of the Zmax Vs curve [Fig. 7(a)] is very steep:this means that the uncertainty in the length of theplasma column for near threshold irradiance is veryhigh. An estimate of the dimension of the plasma
region at threshold can be made by combining typicalbreakdown probability curves, as in Ref. 13, whichreflect the intrinsically statistical nature of the break-down process, with the model of moving breakdown.If, for example, one considers a breakdown probabilitycurve obtained in similar focusing conditions (Fig. 5.10of Ref. 4), one realizes that, for a value of the irradiancesmaller by 20% than the 100% probability value, theprobability of breakdown occurrence is still very high(-85%). Given a Gaussian beam distribution with wo= 6.5 gim, such a value of irradiance would correspondto an axial distance from the focal plane of 0.5 zo, i.e.,-80 gim. In other words, there is an 85% probabilitythat the axial length of the plasma is 80gm long even ifthe peak irradiance is set at threshold. The uncertain-ty in the determination of the axial length of the plas-ma column decreases proportionally as the /3 valueincreases. We are, at present, experimentally investi-gating the statistical behavior of the laser-inducedsparks to come to an improved mathematical formula-tion of the model of moving breakdown that accountsfor this aspect.
V. Conclusions
The model of moving breakdown, in an upgradedversion that takes into account the correct temporaland spatial distribution of the laser pulse, has provedto effectively describe the observed curves of break-down starting time in the streak patterns of Nd:YAGlaser-induced plasma in the nanosecond region. Fur-ther work is required to characterize some aspects ofthe plasma evolution, in conditions where the possiblerole of shock waves or particles with light cannot beruled out as it was in this case. It might also beinteresting to check if, in the same irradiation condi-tions used in these experiments, gases exhibit similarstreak patterns. These experiments could give somenew insight in the still open question of which is thecorrect model for plasma evolution in both liquid andgaseous media.
Financial support was received by F.D. from theBritish Council-CNR agreement and by M.R.C.C.from the Wellcome Foundation. Our thanks are dueto both organizations. We would also like to thankSigmacon, Ltd. and especially S. Rondle and J.Smithers of that company for technical assistance.
References
1. S. Trokel, Ed., YAG Laser Ophthalmic Microsurgery (AppletonCentury Crofts, Norwalk, 1983).
2. M. A. Mainster, D. H. Sliney, C. D. Belcher III, and S. M.Buzney, "Laser Photodisruptors-Damage Mechanisms, In-strument Design and Safety," Ophthalmology 90, 973 (1983).
3. C. A. Puliafito and R. F. Steinert, "Short-Pulsed LaserMicrosurgery of the Eye: Biophysical Considerations," IEEE J.Quantum Electron. QE-20, 1442 (1984).
4. H. P. Lrtscher, "Laser-Induced Breakdown for OphthalmicMicrosurgery," in Ref. 1, Chap. 4, p. 39.
5. J. G. Fujimoto, W. Z. Lin, E. P. Ippen, C. A. Puliafito, and R. F.Steinert, "Time-Resolved Studies of Nd:YAG Laser-InducedBreakdown, Plasma Formation, Acoustic Wave Generation, andCavitation," Invest. Ophthalmol. Vis. Sci. 26, 1771 (1986).
1 September 1988 / Vol. 27, No. 17 / APPLIED OPTICS 3667

6. W. Lauterborn and K. J. Ebeling, "High-Speed Holography ofLaser-Induced Breakdown in Liquids," Appl. Phys. Lett. 31,663(1977).
7. C. E. Bell and J. A. Landt, "Laser-Induced High Pressure ShockWaves in Water," Appl. Phys. Lett. 10, 46 (1967).
8. A. Vogel, W. Hentschel, J. Holzfuss, and W. Lauterborn, "Cavi-tation Bubble Dynamics and Acoustic Transient Generation inOcular Surgery with Pulsed Nd:YAG Lasers," Ophthalmol. 93,1259 (1986).
9. E. S. Sherrard and M. G. Kerr Muir, "Damage to the CornealEndothelium by Q-Switched Nd:YAG Laser Posterior Capsul-otomy," Trans. Ophthalmol. Soc. U.K. 104, 524 (1985).
10. D. Aron-Rosa, J. Aron, J. Griesemann, and R. Thyzel, "Use ofthe Neodymium:YAG Laser to Open the Posterior Capsule Af-ter Lens Implant Surgery," J. Am. Intraoc. Implant Soc. 6, 352(1980).
11. F. Fankhauser, P. Roussel, and J. Steffen, "Clinical Studies onthe Efficiency of High Power Laser Radiation upon Some Struc-ture of the Anterior Segment of the Human Eye: First Experi-ments of the Treatment of Some Pathological Conditions of theAnterior Segment of the Eye by Means of a Q-Switched LaserSystem," Int. Ophthalmol. 3, 129 (1981).
12. A. Hochstetter, "Lasers in Urology," Lasers Med. Surg. 6, 412(1986).
13. F. Docchio, C. A. Sacchi, and J. Marshall, "Experimental Inves-tigation of Optical Breakdown Thresholds in Ocular Media Un-der Single Pulse Irradiation with Different Pulse Durations,"Lasers Ophthalmol. 1, 83 (1986).
14. S. K. Davi, D. E. Gaasterland, C. E. Cummings, and G. Liese-gang, "Pulsed Laser Damage Thresholds in vitro for IntraocularLenses and Membranes," IEEE J. Quantum Electron. QE-20,1458 (1984).
15. R. F. Steinert, C. A. Puliafito, and S. Trokel, "Plasma Formationand Shielding by Three Ophthalmic Neodymium-YAG Lasers,"Am. J. Ophthalmol. 96, 427 (1983).
16. F. Docchio, L. Dossi, and C. A. Sacchi, "Q-Switched Laser Irra-diation of the Eye and Related Phenomena: An ExperimentalStudy. II: Shielding Properties of Laser-Induced Plasmas inLiquids and Membranes," Lasers Life Sci. 1, 105 (1986).
17. P. Felix and A. T. Ellis, "Laser-Induced Liquid Breakdown: AStep-by-Step Account," Appl. Phys. Lett. 19, 484 (1971).
18. S. A. Ramsden and P. Savic, "A Radiative Detonation Model forthe Development of a Laser-Induced Spark in Air," NatureLondon 203, 217 (1964).
19. J. W. Daiber and H. M. Thompson, "Laser-Driven DetonationWaves in Gases," Phys. Fluids 10, 1162 (1967).
20. I. Meyer and P. Stritzke, "Expansion of Laser Sparks Producedby a Mode-Locked Nd:Glass Laser," Appl. Phys. 10, 125 (1976).
21. A. J. Alcock, C. De Michelis, K. Hamal, and B. A. Tozer, "Expan-sion Mechanism in a Laser-Produced Spark," Phys. Rev. Lett.20, 1095 (1968).
22. Yu. P. Raizer, "Breakdown and Heating of Gases Under theInfluence of a Laser Beam," Sov. Phys. Usp. 8, 650 (1966).
23. F. Docchio, P. Regondi, M. R. C. Capon, and J. Mellerio, "Studyof the Temporal and Spatial Dynamics of Plasmas Induced inLiquids by Nanosecond Nd:YAG Laser Pulses. 2: PlasmaLuminescence and Shielding," Appl. Opt. 27, 3669 (1988).
24. F. Docchio, L. Dossi, and C. A. Sacchi, "Q-Switched Laser Irra-diation of the Eye and Related Phenomena: An ExperimentalStudy. I: Optical Breakdown Threshold Determination inLiquids and Membranes," Lasers Life Sci. 1, 87 (1986).
25. M. R. C. Capon and J. Mellerio, "Nd:YAG Lasers: PlasmaCharacteristics and Damage Mechanisms," Lasers Ophthalmol.1, 95 (1986).
26. P. A. Barnes and K. E. Rieckhoff, "Laser-Induced UnderwaterSparks," Appl. Phys. Lett. 13, 282 (1968).
27. M. Bass and H. H. Barrett, "Avalanche Breakdown and theProbabilistic Nature of Laser-Induced Damage," IEEE J. Quan-tum Electron. QE-9, 338 (1972).
28. J. M. Wiesenfeld and E. P. Ippen, "Dynamics of Electron Solva-tion in Liquid Water," Chem. Phys. Lett. 73, 47 (1980).
29. A. J. Alcock, C. De Michelis, and M. C. Richardson, "Breakdownand Self Focusing Effects in Gases Produced by Means of aSingle-Mode Ruby Laser," IEEE J. Quantum Electron. QE-6,622 (1970).
30. C. De Michelis, "Laser-Induced Gas Breakdown: a Biblio-graphical Review," IEEE J. Quantum Electron. QE-5, 188(1969).
Of Optics continued from page 3629
with parental pride. Dr. Morrison is not concerned withwhat's new, or what's spectacular, but with the basis ofknowledge. He presents science as a process, not an event ora result. "The Ring of Truth" shows that sometimes all ittakes is a passionately involved teacher with an impish lookand a playful air to enthrall an audience with the thinkingbehind science. Without the extra touch of personality,network programmers have not done too badly in presentingsome of the big science-oriented news events. PresidentReagan's cancer, the plague of AIDS, the catastrophe ofChernobyl, the technology of Star Wars have all played onTV, occasionally exaggerated but on the whole presentedwith reasonable concern of scientific reality.
Many science shows are visually more striking than everbecause of TV's harnessing of new technology that takes thecamera into hitherto unseen worlds. "The Infinite Voyage"used the scanning electron microscope to invade the world ofthe very small and an array of radio telescopes to locatedistant stars and help translate patterns of noise into photo-graphs of far-off galaxies. Other programs have used fiberoptics to look into hidden corners inside the human body andcomputer graphics to open up ways of depicting and animat-
ing worlds that hitherto existed only in the imagination.But in the end, even compelling pictures will not settle in aviewer's mind and heart without the structural assist of agood story. It is interesting that TV's medical examiner,Quincy, played by Jack Klugman, has inspired numeroushigh school students to study forensic medicine, or at least tofind out more about this field. Nonfiction can be effective,too: The removal and opening of the safe of the sunkenTitanic after scientists had pinpointed the wreck drew anenormously attentive audience. Television accounts ofRobert Oppenheimer's leadership in developing the A-bomband his subsequent fall from grace, and of the discovery ofthe structure of DNA by James Watson and Francis Crickwere well received because of the narrative techniques used.
Audiences for science programs are still meager comparedwith those for shows on sports and religion. Most attemptsat substantially boosting audience size by putting science onnetwork TV have not met expectations. But there is agrowing constituency, which may influence the mediators ofour culture to consider moving good science programs out ofthe intellectual ghetto of public TV and into the commercialmainstream. Science is important enough to be trivialized.
3668 APPLIED OPTICS / Vol. 27, No. 17 / 1 September 1988
Copyright © 2022 FDOKUMEN