Opaque and transparent datives, and how they behave in passives
Upload
independentCategory
view
2download
0
PHYSIOLOGICAL ECOLOGY - ORIGINAL PAPER
Shifts in bryophyte carbon isotope ratio across an elevation 3 soilage matrix on Mauna Loa, Hawaii: do bryophytes behave likevascular plants?
Mashuri Waite • Lawren Sack
Received: 27 March 2010 / Accepted: 28 December 2010 / Published online: 29 January 2011
� The Author(s) 2011. This article is published with open access at Springerlink.com
Abstract The carbon isotope ratio (d13C) of vascular plant
leaf tissue is determined by isotope discrimination, pri-
marily mediated by stomatal and mesophyll diffusion
resistances and by photosynthetic rate. These effects lead to
predictable trends in leaf d13C across natural gradients of
elevation, irradiance and nutrient supply. Less is known
about shifts in d13C for bryophytes at landscape scale, as
bryophytes lack stomata in the dominant gametophyte
phase, and thus lack active control over CO2 diffusion.
Twelve bryophyte species were sampled across a matrix of
elevation and soil ages on Mauna Loa, Hawaii Island. We
tested hypotheses based on previous findings for vascular
plants, which tend to have less negative d13C at higher
elevations or irradiances, and for leaves with higher leaf
mass per area (LMA). Across the matrix, bryophytes span-
ned the range of d13C values typical of C3 vascular plants.
Bryophytes were remarkably similar to vascular plants in
exhibiting less negative d13C with increasing elevation, and
with lower overstory cover; additionally d13C was related to
bryophyte canopy projected mass per area, a trait analogous
to LMA in vascular plants, also correlated negatively with
overstory cover. The similarity of responses of d13C in
bryophytes and vascular plants to environmental factors,
despite differing morphologies and diffusion pathways,
points to a strong direct role of photosynthetic rate in
determining d13C variation at the landscape scale.
Keywords Altitudinal gradient � Elevation � Hawaii �Liverworts � Moss
Introduction
Foliar carbon isotope ratio (d13C) can reflect ecology and
physiology, especially because in vascular plants d13C reflects
changes in function along resource gradients. Less is known
about bryophyte d13C responses. We aimed to quantify the
degree to which bryophytes resemble vascular plants (tra-
cheophytes) in their landscape scale d13C using the bryophyte
flora distributed across Mauna Loa, Hawaii, a ‘‘natural
experiment’’ for ecological research (Vitousek 2004).
Differences in the relative abundance of 13C and 12C in
plant tissues relative to the atmosphere is caused by dis-
crimination against the heavier 13C during photosynthesis
by the carbon fixing enzyme RubisCO and during diffusion
through air and liquid water (Farquhar et al. 1989). The
d13C is negatively related to discrimination; d13C increases
as the chloroplast CO2 concentration (cc) declines and
carboxylation discriminates less against 13C (Farquhar and
Sharkey 1982). The cc can be affected by several factors
which influence CO2 drawdown by photosynthesis relative
to its rate of diffusion to the chloroplast. A high photo-
synthetic assimilation rate (A) draws down cc relative to the
CO2 concentration of source air (ca) (Farquhar et al. 1989).
Vascular plants control CO2 diffusion into the leaf with
their stomata, which respond to numerous factors,
Communicated by Robert Pearcy.
Electronic supplementary material The online version of thisarticle (doi:10.1007/s00442-010-1903-y) contains supplementarymaterial, which is available to authorized users.
M. Waite � L. Sack
Department of Botany, University of Hawaii,
3190 Maile Way, Honolulu, HI 96822, USA
L. Sack (&)
Department of Ecology and Evolutionary Biology,
University of California, Los Angeles, 621 Charles E.
Young Drive South, Los Angeles, CA 90095-1606, USA
e-mail: [email protected]
123
Oecologia (2011) 166:11–22
DOI 10.1007/s00442-010-1903-y
especially opening with irradiance and high leaf water
status, and closing under opposite conditions. A lower
stomatal conductance (gs) or a lower mesophyll conduc-
tance should reduce cc/ca and lead to higher d13C (Loreto
et al. 1992; DeLucia et al. 2003; Seibt et al. 2008; Niine-
mets et al. 2009). Bryophytes differ from vascular plants
fundamentally in lacking stomata in the dominant life stage
(Schofield 1985), but span a wide range of d13C from -21
to -40 % (but primarily -22 to -32 %; Rundel et al.
1979; Proctor et al. 1992; Fletcher et al. 2004), very similar
to C3 tracheophytes, which range from -24 to -32 %(O’Leary 1988).
In vascular plants, d13C tends to correlate with resource
gradients for given species and across species sets. Typi-
cally, d13C increases with elevation, associated with higher
leaf mass per area (LMA) at lower temperatures (see
below; Korner et al. 1988, 1991, 2003; Vitousek et al.
1990; Cordell et al. 1999). The d13C also tends to correlate
negatively with water availability, due to stomatal closure
at low water availability (Farquhar et al. 1989). Further,
vascular plant canopies exhibit increasing foliar d13C with
height (Medina and Minchin 1980; Garten and Taylor
1992; Ometto et al. 2006) due to effects linked with three
resource gradients. According to the ‘‘water stress-gs
effect’’, higher irradiance with increasing canopy height
(CH) may be associated with lower leaf water status, and
lower gs and cc (Niinemets et al. 2004). According to the
‘‘irradiance-A effect’’, high irradiance may drive higher
A relative to gs, decreasing cc (Brooks et al. 1997; Le Roux
et al. 2001; Duursma and Marshall 2006). Finally,
according to the ‘‘source air effect’’, d13C may vary across
natural irradiances due to a vertical gradient in air d13C
caused by soil respiration (Francey et al. 1985; Schleser
and Jayasekera 1985; Ehleringer et al. 1986; Farquhar et al.
1989; Medina et al. 1991; Buchmann et al. 1997b; Stern-
berg et al. 1989, 1997; Schedlbauer and Kavanagh 2008);
this effect is dampened by air mixing and typically
accounts for only ca. 10–30% of the difference in foliar
d13C from understory to top-of-canopy (Broadmeadow
et al. 1992; Brooks et al. 1997; Buchmann et al. 1997a,
2002; Sternberg et al. 1997).
Bryophytes may follow similar trends in d13C with
gradients as tracheophytes. The d13C may correlate posi-
tively with elevation, as reported for Sphagnum (Menot-
Combes et al. 2004; Skrzypek et al. 2007), potentially
arising because of a ‘‘temperature effect’’ if lower tem-
perature at high elevation reduces respiration relative to A,
leading to reduced loss of the heavier isotope (cf. Gillon
and Griffiths 1997; Barbour and Hanson 2009), thus
reducing discrimination (Hamerlynck et al. 2002; Skrzypek
et al. 2007), and/or because of lower atmospheric pressure
leading to lower cc (Menot and Burns 2001). A positive
correlation of bryophyte d13C with water availability has
also been shown due to ‘‘liquid film effect’’ that reduces
CO2 diffusion (Proctor et al. 1992; Rice and Giles 1996;
Williams and Flanagan 1996; Meyer et al. 2008). Bryo-
phytes may also show increased d13C with higher irradi-
ance as found for the moss Tortula ruralis (Hamerlynck
et al. 2002) and for three liverworts (Fletcher et al. 2006).
This pattern could arise from the ‘‘irradiance-A effect’’
and/or from the ‘‘source air effect’’, if forest floor bryo-
phytes experience elevated CO2 originating from soil res-
piration (DeLucia et al. 2003).
The d13C may also relate to leaf structure and compo-
sition. Across species of tracheophytes, d13C correlates
positively with LMA and nitrogen concentration per area
(Narea), themselves related (Hultine and Marshall 2000;
Takahashi and Miyajima 2008; Li et al. 2009). A similar
pattern was found for the Hawaiian tree Metrosideros
polymorpha across elevations: d13C positively correlated
with LMA, apparently due to higher carboxylation rate
related to the higher Narea (Vitousek et al. 1990; Cordell
et al. 1998, 1999). In bryophytes, canopy mass per ground
area (CMA) is analogous to tracheophyte LMA (Waite and
Sack 2010) and may be related to higher N per ground area,
and hence bryophyte d13C might be expected to correlate
with CMA.
Previous work has highlighted trends for a few bryo-
phyte species along specific gradients. In a previous study,
we found strong variation in bryophyte N and P stoichi-
ometry on Mauna Loa (Waite and Sack 2011). Here, we
conducted a landscape-scale analysis of variation in d13C
within and across species, and its correlation with climate
(temperature and precipitation), forest and soil develop-
ment, and overstory cover (OC). We also determined the
correlation of d13C with other functional traits and nutrient
composition. Based on patterns within and across tra-
cheophyte species, we hypothesized bryophyte d13C would
increase at (1) higher elevation, (2) higher irradiance, (3)
lower precipitation and (4) higher CMA.
Materials and methods
Study site, species and sampling
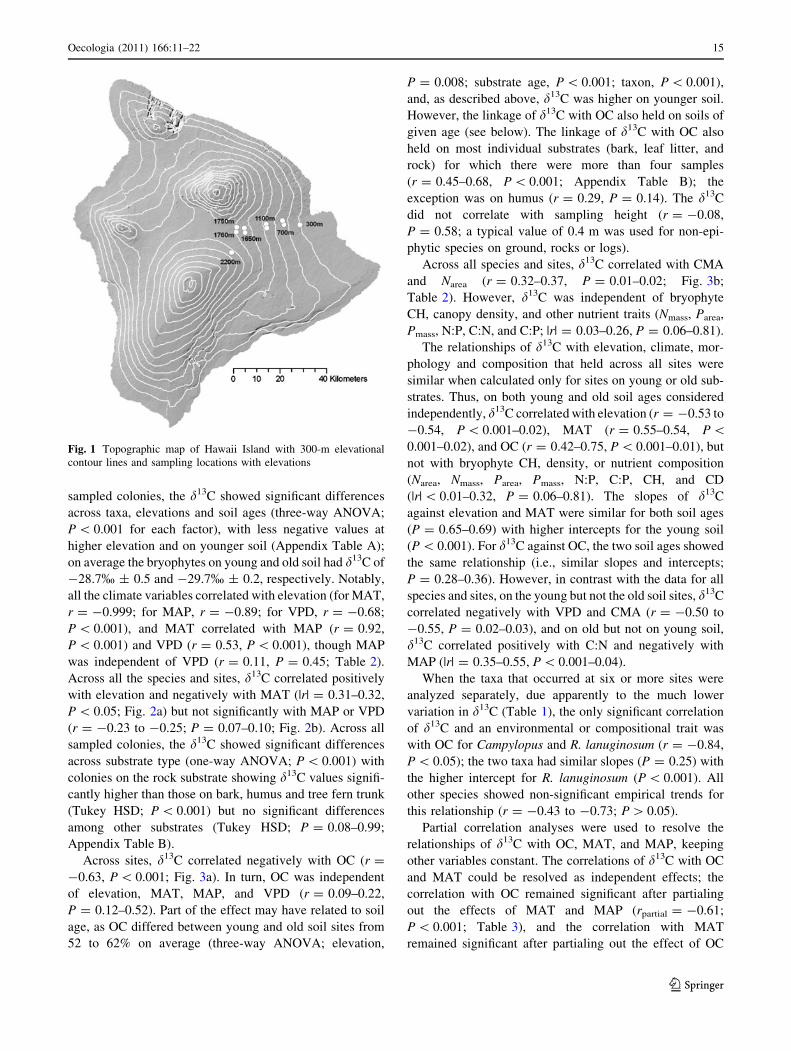
Sampling took place across an elevational gradient on the
windward slope of Mauna Loa, Hawaii Island, a model
system for studies of ecosystem development (Vitousek
et al. 1995; Raich et al. 1997). Mean annual temperature
(MAT) declines with elevation on this slope at a lapse rate
of 6.4�C/km (Juvik and Nullet 1994). Bryophytes were
sampled at six elevations (287–2,239 m) on young lava
flows (126–152 years old) and old lava flows
(C3,400 years old; Lockwood et al. 1988) at ten sites
(Table 1; Fig. 1). Bryophytes occupied seven primary
12 Oecologia (2011) 166:11–22
123
substrates (bark, humus, leaf litter, rock, soil, rotted wood,
and tree fern trunk), and accounted for 10–80% of surface
cover.
Eleven moss and one liverwort species were collected at
ten sites (Table 1). Species were chosen that were suffi-
ciently common to allow collection of replicates at given
sites. The species varied in elevational range; the extreme
cases were Campylopus incarvatus, found only at the
700 m old flow site, and Racomitrium lanuginosum, which,
like the dominant tree species M. polymorpha, occurred at
all sampled elevations. We collected samples of
40–150 cm2 in projected area from three colonies per
species, where possible, at each site (in 6 of 53 cases only a
single colony was found for a given species). The projected
area of each sample was traced on clear plastic and scanned
(300 dots per inch; Epson 3170 Photo Scanner; Seiko
Epson, Nagano, Japan) for area determination (using
ImageJ 1.42q software; US National Institutes of Health,
Bethesda, MD, USA). The substrate and the estimated
height above ground for epiphytic colonies were recorded
to the nearest 10 cm; non-epiphytic colonies were collected
from rocks, fallen logs, and the ground surface. Samples
were brought to the laboratory in plastic bags (Ziploc; SC
Johnson, Racine, WI, USA) on ice and refrigerated until
processing.
Climate data and overstory cover
We estimated the climate at each sampling site using a
Geographic Information System model based on climate
station data (Cao et al. 2007) and Geographic Positioning
System coordinates (GPSmap 60CSx; Garmin, Olathe, KS,
USA). We estimated mean annual temperature (MAT),
precipitation (MAP), relative humidity (MARH) and vapor
pressure deficit (VPD), calculated from MAT and MARH
(Campbell and Norman 1998). VPD is a measure of
atmospheric drought, i.e., the driving force for evaporation,
and can be calculated as an absolute pressure difference (in
kPa of vapor) or after normalizing by atmospheric pressure
(mole fraction; i.e., unitless); the mole fraction VPD
accounts for the effects of atmospheric pressure and tem-
perature on diffusibility and thus more clearly indicates
differences in driving force across elevations. Across sites
the mole fraction VPD correlated strongly with absolute
VPD (r = 0.92; P \ 0.001), and the two estimates corre-
lated similarly with other measured traits; only relation-
ships with absolute VPD are presented. Forest overstory
cover (OC, %), the proportion of the sky obscured from
view (equivalent to canopy closure in Jennings et al. 1999),
was visually assessed, to the nearest 10%. Visual canopy
cover estimates involve a level of uncertainty, but correlate
with measurements using a densiometer or hemispherical
photography (Schott and Pieper 1985; Vora 1988; Bellow
and Nair 2003; Korhonen et al. 2006), especially given
training as was undertaken previously to this study, to
achieve a correspondence of ±5% relative to hemispherical
photos (Teti and Pike 2005; Korhonen et al. 2006; Paletto
and Tosi 2009).
Measurements of structure, nutrient concentrations
and d13C
CH was determined with a ruler to the nearest mm of the
green portion of the canopy at three random positions in
each sample. The upper, green portions of the stems were
cut from the older brown tissue using a razor blade, dried at
80�C for at least 48 h before determination of dry mass
(AB204S/FACT Analytical Balance; Mettler Toledo,
Columbus, OH, USA). Canopy mass per area (CMA) was
determined by dividing dry mass by ground area. Dried
samples were analyzed for d13C, nitrogen per mass (Nmass)
and carbon per mass using high temperature combustion in
an elemental analyzer (Costech ECS 4010; Valencia, CA,
USA), with effluent passed into a continuous flow isotope
ratio mass spectrometer (ThermoFinnigan Delta V
Advantage with a Conflo III interface; ThermoFisher Sci-
entific, Waltham, MA, USA; Fry et al. 1996). Samples
were dry ashed in glass vials (Miller 1998), dissolved in
1 N HCL and analyzed for phosphorus per mass (Pmass)
using inductively coupled plasma-optical emission spec-
troscopy (Varian Vista MPX Instrument; Varian, Palo Alto,
CA, USA; Porder et al. 2005). Concentrations of nitrogen
and phosphorus per ground area (Narea and Parea) were
determined as, respectively, Nmass and Pmass multiplied by
CMA. N:P was determined by dividing Nmass by Pmass; C:N
and C:P by dividing carbon per mass by, respectively,
Nmass and Pmass.
Statistical analyses
Statistical procedures were applied using R 2.6.1 (R
Development Core Team 2007). We tested for differences
in d13C across elevations, soil ages and species using three-
way analysis of variance (ANOVA) and across substrate
types using one-way ANOVA after log-transformation to
improve normality and homoscedasticity (Zar 1999).
Multiple pairwise camparisons of d13C among substrate
types was calculated with the Tukey honestly significant
difference test (HSD; Zar 1999). Subsequent correlation
analyses used species mean values for each site. Pearson
correlations were determined for linear and power law
relationships (i.e., linear relationships after log-transfor-
mation) for d13C against environmental variables and
bryophyte composition and structure variables. Relation-
ships were tested for species mean values across all sites,
and separately across only young and old soil ages
Oecologia (2011) 166:11–22 13
123
independently, and for each of the six taxa that were
sampled at six or more sites (five species: A. fuscoflacum,
Bazzania cf. trilobata, D. speirophyllum, M. microstomum,
R. lanuginosum; and one genus, Campylopus). The d13C
relationship with OC was tested across substrate types
using raw data rather than species means because a single
species could be found on several substrates within a single
site.
For relationships that were significant for all species
across all sites and also for individual soil ages and/or for
more than one individual taxon, we tested for shifts in the
relationship. We tested for similarity of the slope and inter-
cept between the soil ages or among taxa, using untrans-
formed or log-transformed data according to which fitted best
the relationship for all species across all sites (using SMATR;
http://www.bio.mq.edu.au/ecology/SMATR; Warton et al.
2006). Ordinary least squares regression was used for testing
relationships between d13C and climate variables or OC, and
standard major axes were used in testing relationships
between d13C and structure and composition traits, as
appropriate given co-dependence of variables (Sokal and
Rohlf 1995).
When bryophyte traits were correlated with climate
variables that were themselves inter-correlated, we calcu-
lated partial correlations to resolve underlying relationships
(using the corpcor package in R; Schaefer et al. 2007).
Results
Species varied strongly in d13C; average values for species
collected from at least four sites ranged from -26.3% ± 0.4
for R. lanuginosum to -31.2% ± 0.4 for L. gracile. Addi-
tionally, individual taxa varied strongly in d13C across sites;
for R. lanuginosum, d13C differed by 4.2% from 300 to
1,650 m elevation on young soil, and within the genus
Campylopus, d13C differed by 5.5% from C. exasperatus at
700 m to C. hawaiicus at 1,100 m (Table 1). Across all
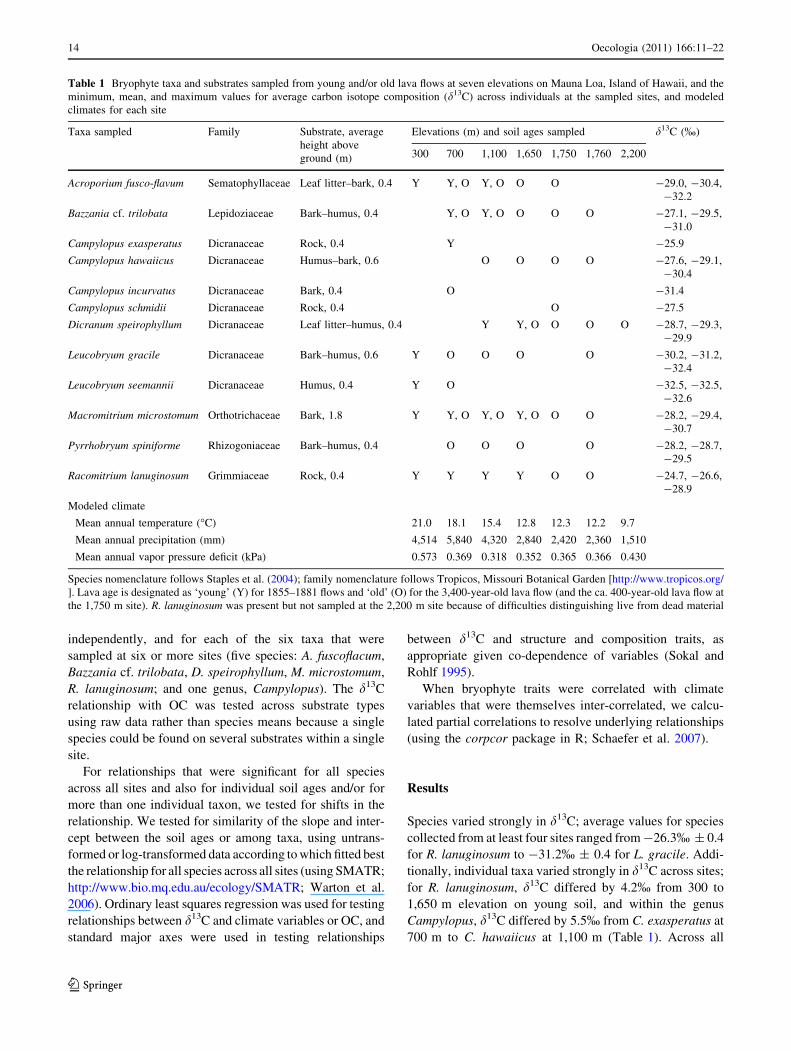
Table 1 Bryophyte taxa and substrates sampled from young and/or old lava flows at seven elevations on Mauna Loa, Island of Hawaii, and the
minimum, mean, and maximum values for average carbon isotope composition (d13C) across individuals at the sampled sites, and modeled
climates for each site
Taxa sampled Family Substrate, average
height above
ground (m)
Elevations (m) and soil ages sampled d13C (%)
300 700 1,100 1,650 1,750 1,760 2,200
Acroporium fusco-flavum Sematophyllaceae Leaf litter–bark, 0.4 Y Y, O Y, O O O -29.0, -30.4,
-32.2
Bazzania cf. trilobata Lepidoziaceae Bark–humus, 0.4 Y, O Y, O O O O -27.1, -29.5,
-31.0
Campylopus exasperatus Dicranaceae Rock, 0.4 Y -25.9
Campylopus hawaiicus Dicranaceae Humus–bark, 0.6 O O O O -27.6, -29.1,
-30.4
Campylopus incurvatus Dicranaceae Bark, 0.4 O -31.4
Campylopus schmidii Dicranaceae Rock, 0.4 O -27.5
Dicranum speirophyllum Dicranaceae Leaf litter–humus, 0.4 Y Y, O O O O -28.7, -29.3,
-29.9
Leucobryum gracile Dicranaceae Bark–humus, 0.6 Y O O O O -30.2, -31.2,
-32.4
Leucobryum seemannii Dicranaceae Humus, 0.4 Y O -32.5, -32.5,
-32.6
Macromitrium microstomum Orthotrichaceae Bark, 1.8 Y Y, O Y, O Y, O O O -28.2, -29.4,
-30.7
Pyrrhobryum spiniforme Rhizogoniaceae Bark–humus, 0.4 O O O O -28.2, -28.7,
-29.5
Racomitrium lanuginosum Grimmiaceae Rock, 0.4 Y Y Y Y O O -24.7, -26.6,
-28.9
Modeled climate
Mean annual temperature (�C) 21.0 18.1 15.4 12.8 12.3 12.2 9.7
Mean annual precipitation (mm) 4,514 5,840 4,320 2,840 2,420 2,360 1,510
Mean annual vapor pressure deficit (kPa) 0.573 0.369 0.318 0.352 0.365 0.366 0.430
Species nomenclature follows Staples et al. (2004); family nomenclature follows Tropicos, Missouri Botanical Garden [http://www.tropicos.org/
]. Lava age is designated as ‘young’ (Y) for 1855–1881 flows and ‘old’ (O) for the 3,400-year-old lava flow (and the ca. 400-year-old lava flow at
the 1,750 m site). R. lanuginosum was present but not sampled at the 2,200 m site because of difficulties distinguishing live from dead material
14 Oecologia (2011) 166:11–22
123
sampled colonies, the d13C showed significant differences
across taxa, elevations and soil ages (three-way ANOVA;
P \ 0.001 for each factor), with less negative values at
higher elevation and on younger soil (Appendix Table A);
on average the bryophytes on young and old soil had d13C of
-28.7% ± 0.5 and -29.7% ± 0.2, respectively. Notably,
all the climate variables correlated with elevation (for MAT,
r = -0.999; for MAP, r = -0.89; for VPD, r = -0.68;
P \ 0.001), and MAT correlated with MAP (r = 0.92,
P \ 0.001) and VPD (r = 0.53, P \ 0.001), though MAP
was independent of VPD (r = 0.11, P = 0.45; Table 2).
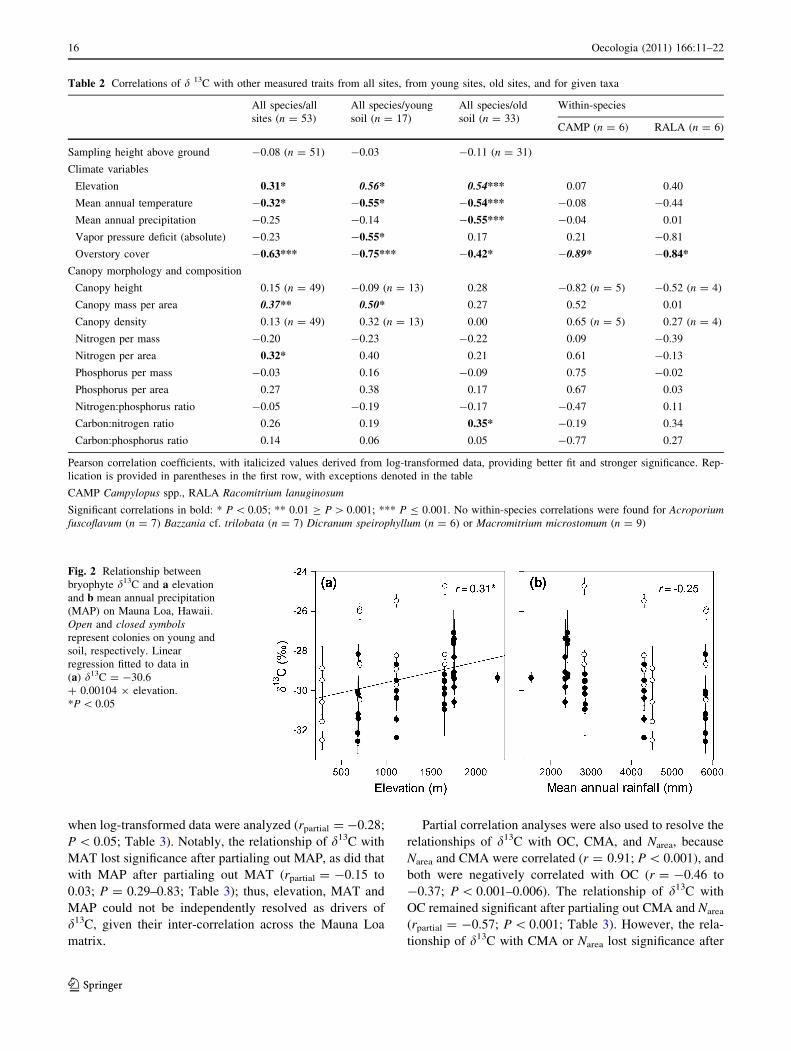
Across all the species and sites, d13C correlated positively
with elevation and negatively with MAT (|r| = 0.31–0.32,
P \ 0.05; Fig. 2a) but not significantly with MAP or VPD
(r = -0.23 to -0.25; P = 0.07–0.10; Fig. 2b). Across all
sampled colonies, the d13C showed significant differences
across substrate type (one-way ANOVA; P \ 0.001) with
colonies on the rock substrate showing d13C values signifi-
cantly higher than those on bark, humus and tree fern trunk
(Tukey HSD; P \ 0.001) but no significant differences
among other substrates (Tukey HSD; P = 0.08–0.99;
Appendix Table B).
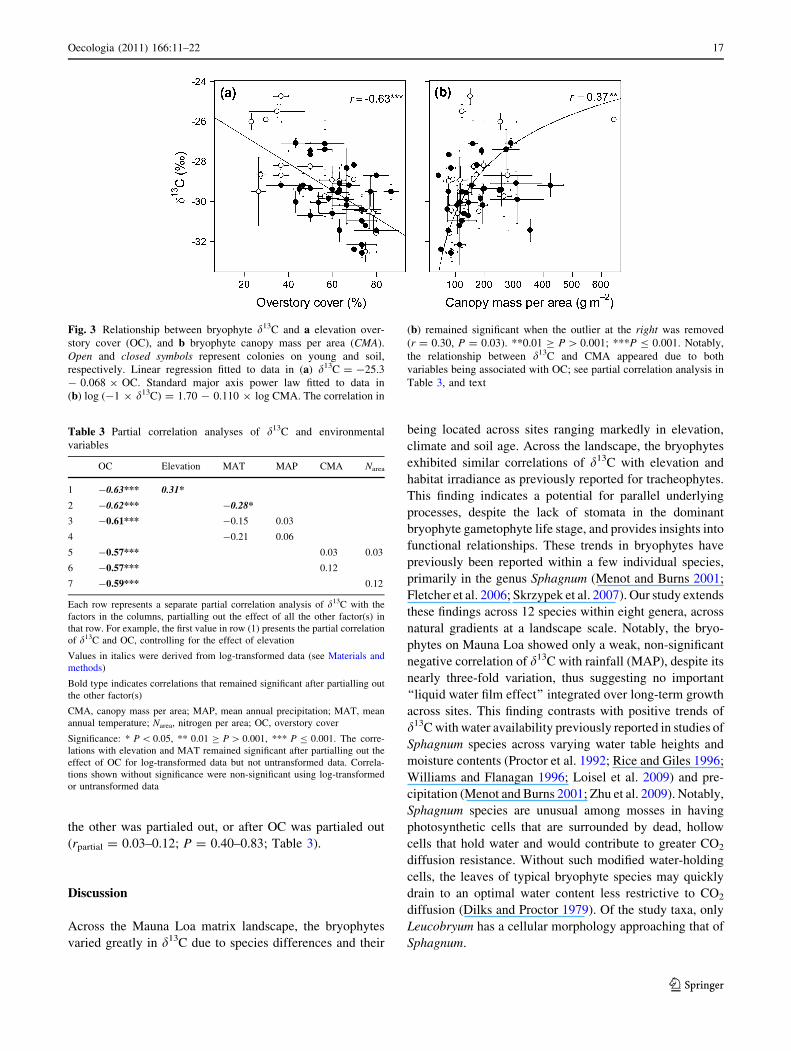
Across sites, d13C correlated negatively with OC (r =
-0.63, P \ 0.001; Fig. 3a). In turn, OC was independent
of elevation, MAT, MAP, and VPD (r = 0.09–0.22,
P = 0.12–0.52). Part of the effect may have related to soil
age, as OC differed between young and old soil sites from
52 to 62% on average (three-way ANOVA; elevation,
P = 0.008; substrate age, P \ 0.001; taxon, P \ 0.001),
and, as described above, d13C was higher on younger soil.
However, the linkage of d13C with OC also held on soils of
given age (see below). The linkage of d13C with OC also
held on most individual substrates (bark, leaf litter, and
rock) for which there were more than four samples
(r = 0.45–0.68, P \ 0.001; Appendix Table B); the
exception was on humus (r = 0.29, P = 0.14). The d13C
did not correlate with sampling height (r = -0.08,
P = 0.58; a typical value of 0.4 m was used for non-epi-
phytic species on ground, rocks or logs).
Across all species and sites, d13C correlated with CMA
and Narea (r = 0.32–0.37, P = 0.01–0.02; Fig. 3b;
Table 2). However, d13C was independent of bryophyte
CH, canopy density, and other nutrient traits (Nmass, Parea,
Pmass, N:P, C:N, and C:P; |r| = 0.03–0.26, P = 0.06–0.81).
The relationships of d13C with elevation, climate, mor-
phology and composition that held across all sites were
similar when calculated only for sites on young or old sub-
strates. Thus, on both young and old soil ages considered
independently, d13C correlated with elevation (r = -0.53 to
-0.54, P \ 0.001–0.02), MAT (r = 0.55–0.54, P \0.001–0.02), and OC (r = 0.42–0.75, P \ 0.001–0.01), but
not with bryophyte CH, density, or nutrient composition
(Narea, Nmass, Parea, Pmass, N:P, C:P, CH, and CD
(|r| \ 0.01–0.32, P = 0.06–0.81). The slopes of d13C
against elevation and MAT were similar for both soil ages
(P = 0.65–0.69) with higher intercepts for the young soil
(P \ 0.001). For d13C against OC, the two soil ages showed
the same relationship (i.e., similar slopes and intercepts;
P = 0.28–0.36). However, in contrast with the data for all
species and sites, on the young but not the old soil sites, d13C
correlated negatively with VPD and CMA (r = -0.50 to
-0.55, P = 0.02–0.03), and on old but not on young soil,
d13C correlated positively with C:N and negatively with
MAP (|r| = 0.35–0.55, P \ 0.001–0.04).
When the taxa that occurred at six or more sites were
analyzed separately, due apparently to the much lower
variation in d13C (Table 1), the only significant correlation
of d13C and an environmental or compositional trait was
with OC for Campylopus and R. lanuginosum (r = -0.84,
P \ 0.05); the two taxa had similar slopes (P = 0.25) with
the higher intercept for R. lanuginosum (P \ 0.001). All
other species showed non-significant empirical trends for
this relationship (r = -0.43 to -0.73; P [ 0.05).
Partial correlation analyses were used to resolve the
relationships of d13C with OC, MAT, and MAP, keeping
other variables constant. The correlations of d13C with OC
and MAT could be resolved as independent effects; the
correlation with OC remained significant after partialing
out the effects of MAT and MAP (rpartial = -0.61;
P \ 0.001; Table 3), and the correlation with MAT
remained significant after partialing out the effect of OC
Fig. 1 Topographic map of Hawaii Island with 300-m elevational
contour lines and sampling locations with elevations
Oecologia (2011) 166:11–22 15
123
when log-transformed data were analyzed (rpartial = -0.28;
P \ 0.05; Table 3). Notably, the relationship of d13C with
MAT lost significance after partialing out MAP, as did that
with MAP after partialing out MAT (rpartial = -0.15 to
0.03; P = 0.29–0.83; Table 3); thus, elevation, MAT and
MAP could not be independently resolved as drivers of
d13C, given their inter-correlation across the Mauna Loa
matrix.
Partial correlation analyses were also used to resolve the
relationships of d13C with OC, CMA, and Narea, because
Narea and CMA were correlated (r = 0.91; P \ 0.001), and
both were negatively correlated with OC (r = -0.46 to
-0.37; P \ 0.001–0.006). The relationship of d13C with
OC remained significant after partialing out CMA and Narea
(rpartial = -0.57; P \ 0.001; Table 3). However, the rela-
tionship of d13C with CMA or Narea lost significance after
Table 2 Correlations of d 13C with other measured traits from all sites, from young sites, old sites, and for given taxa
All species/all
sites (n = 53)
All species/young
soil (n = 17)
All species/old
soil (n = 33)
Within-species
CAMP (n = 6) RALA (n = 6)
Sampling height above ground -0.08 (n = 51) -0.03 -0.11 (n = 31)
Climate variables
Elevation 0.31* 0.56* 0.54*** 0.07 0.40
Mean annual temperature -0.32* -0.55* -0.54*** -0.08 -0.44
Mean annual precipitation -0.25 -0.14 -0.55*** -0.04 0.01
Vapor pressure deficit (absolute) -0.23 -0.55* 0.17 0.21 -0.81
Overstory cover -0.63*** -0.75*** -0.42* -0.89* -0.84*
Canopy morphology and composition
Canopy height 0.15 (n = 49) -0.09 (n = 13) 0.28 -0.82 (n = 5) -0.52 (n = 4)
Canopy mass per area 0.37** 0.50* 0.27 0.52 0.01
Canopy density 0.13 (n = 49) 0.32 (n = 13) 0.00 0.65 (n = 5) 0.27 (n = 4)
Nitrogen per mass -0.20 -0.23 -0.22 0.09 -0.39
Nitrogen per area 0.32* 0.40 0.21 0.61 -0.13
Phosphorus per mass -0.03 0.16 -0.09 0.75 -0.02
Phosphorus per area 0.27 0.38 0.17 0.67 0.03
Nitrogen:phosphorus ratio -0.05 -0.19 -0.17 -0.47 0.11
Carbon:nitrogen ratio 0.26 0.19 0.35* -0.19 0.34
Carbon:phosphorus ratio 0.14 0.06 0.05 -0.77 0.27
Pearson correlation coefficients, with italicized values derived from log-transformed data, providing better fit and stronger significance. Rep-
lication is provided in parentheses in the first row, with exceptions denoted in the table
CAMP Campylopus spp., RALA Racomitrium lanuginosum
Significant correlations in bold: * P \ 0.05; ** 0.01 C P [ 0.001; *** P B 0.001. No within-species correlations were found for Acroporiumfuscoflavum (n = 7) Bazzania cf. trilobata (n = 7) Dicranum speirophyllum (n = 6) or Macromitrium microstomum (n = 9)
Fig. 2 Relationship between
bryophyte d13C and a elevation
and b mean annual precipitation
(MAP) on Mauna Loa, Hawaii.
Open and closed symbolsrepresent colonies on young and
soil, respectively. Linear
regression fitted to data in
(a) d13C = -30.6
? 0.00104 9 elevation.
*P \ 0.05
16 Oecologia (2011) 166:11–22
123
the other was partialed out, or after OC was partialed out
(rpartial = 0.03–0.12; P = 0.40–0.83; Table 3).
Discussion
Across the Mauna Loa matrix landscape, the bryophytes
varied greatly in d13C due to species differences and their
being located across sites ranging markedly in elevation,
climate and soil age. Across the landscape, the bryophytes
exhibited similar correlations of d13C with elevation and
habitat irradiance as previously reported for tracheophytes.
This finding indicates a potential for parallel underlying
processes, despite the lack of stomata in the dominant
bryophyte gametophyte life stage, and provides insights into
functional relationships. These trends in bryophytes have
previously been reported within a few individual species,
primarily in the genus Sphagnum (Menot and Burns 2001;
Fletcher et al. 2006; Skrzypek et al. 2007). Our study extends
these findings across 12 species within eight genera, across
natural gradients at a landscape scale. Notably, the bryo-
phytes on Mauna Loa showed only a weak, non-significant
negative correlation of d13C with rainfall (MAP), despite its
nearly three-fold variation, thus suggesting no important
‘‘liquid water film effect’’ integrated over long-term growth
across sites. This finding contrasts with positive trends of
d13C with water availability previously reported in studies of
Sphagnum species across varying water table heights and
moisture contents (Proctor et al. 1992; Rice and Giles 1996;
Williams and Flanagan 1996; Loisel et al. 2009) and pre-
cipitation (Menot and Burns 2001; Zhu et al. 2009). Notably,
Sphagnum species are unusual among mosses in having
photosynthetic cells that are surrounded by dead, hollow
cells that hold water and would contribute to greater CO2
diffusion resistance. Without such modified water-holding
cells, the leaves of typical bryophyte species may quickly
drain to an optimal water content less restrictive to CO2
diffusion (Dilks and Proctor 1979). Of the study taxa, only
Leucobryum has a cellular morphology approaching that of
Sphagnum.
Fig. 3 Relationship between bryophyte d13C and a elevation over-
story cover (OC), and b bryophyte canopy mass per area (CMA).
Open and closed symbols represent colonies on young and soil,
respectively. Linear regression fitted to data in (a) d13C = -25.3
- 0.068 9 OC. Standard major axis power law fitted to data in
(b) log (-1 9 d13C) = 1.70 - 0.110 9 log CMA. The correlation in
(b) remained significant when the outlier at the right was removed
(r = 0.30, P = 0.03). **0.01 C P [ 0.001; ***P B 0.001. Notably,
the relationship between d13C and CMA appeared due to both
variables being associated with OC; see partial correlation analysis in
Table 3, and text
Table 3 Partial correlation analyses of d13C and environmental
variables
OC Elevation MAT MAP CMA Narea
1 -0.63*** 0.31*
2 -0.62*** -0.28*
3 -0.61*** -0.15 0.03
4 -0.21 0.06
5 -0.57*** 0.03 0.03
6 -0.57*** 0.12
7 -0.59*** 0.12
Each row represents a separate partial correlation analysis of d13C with the
factors in the columns, partialling out the effect of all the other factor(s) in
that row. For example, the first value in row (1) presents the partial correlation
of d13C and OC, controlling for the effect of elevation
Values in italics were derived from log-transformed data (see Materials and
methods)
Bold type indicates correlations that remained significant after partialling out
the other factor(s)
CMA, canopy mass per area; MAP, mean annual precipitation; MAT, mean
annual temperature; Narea, nitrogen per area; OC, overstory cover
Significance: * P \ 0.05, ** 0.01 C P [ 0.001, *** P B 0.001. The corre-
lations with elevation and MAT remained significant after partialling out the
effect of OC for log-transformed data but not untransformed data. Correla-
tions shown without significance were non-significant using log-transformed
or untransformed data
Oecologia (2011) 166:11–22 17
123
Potential sources of the d13C—elevation correlation
The landscape-scale increase of d13C with elevation in
bryophytes on Mauna Loa was similar to that of M.
polymorpha trees at these sites (Vitousek et al. 1990;
Cordell et al. 1998, 1999) and that observed generally
for vascular plants along elevational gradients worldwide
(Korner et al. 1988, 1991, 2003; Morecroft et al. 1992;
Hikosaka et al. 2002). This finding extends the eleva-
tional trends reported for Sphagnum (Menot and Burns
2001; Skrzypek et al. 2007) to a broader set of genera.
In vascular plants, the trend was attributed to reduced
CO2 partial pressure, associated with the lower atmo-
spheric pressure at higher elevations, which would
reduce cc and increase d13C (Korner et al. 1991), but
later work concluded that such an effect would be too
small to explain observed variation (Terashima et al.
1995; Korner 2003, 2007). The trend in vascular plants
has also been attributed to increased leaf mass per area
(LMA) with elevation (Korner 1989, 2003; Vitousek
et al. 1990; Cordell et al. 1998; Hikosaka et al. 2002;
Takahashi and Miyajima 2008; Li et al. 2009). A higher
LMA in vascular plants may lead to lower mesophyll
conductance, lower ratio of chloroplast to atmospheric
CO2 partial pressure (cc/ca) and higher d13C (Terashima
et al. 1995) because a greater leaf thickness increases the
diffusion path length from the stomata to the mesophyll
cell walls (Parkhurst 1994), and/or because thicker
mesophyll cell walls reduce CO2 diffusion from inter-
cellular air space to the chloroplasts (Niinemets 1999;
Niinemets et al. 2009). We found that the d13C
decreased with decreasing bryophyte canopy mass per
area (CMA), analogously to the decrease of d13C with
decreasing LMA in M. polymorpha (Vitousek et al.
1988), but whereas in M. polymorpha and in many other
vascular plants LMA increases with elevation (Vitousek
et al. 1988; Cordell et al. 1998; Hikosaka et al. 2002;
Korner 2003), bryophyte CMA did not correlate with
elevation but rather with OC (as discussed further
below). These results indicate that the altitudinal trend in
d13C was likely due to lower CO2 pressure and/or the
‘‘temperature effect’’ as shown for three Sphagnum spe-
cies (Menot and Burns 2001; Skrzypek et al. 2007). Such
an effect contrasts with tracheophytes, for which there is
no evidence for a general direct effect of temperature on
d13C (Troughton and Card 1975; Christeller et al. 1976).
There is also the possibility that the declining cloud
cover and thus increased irradiance, lower MAP and
higher VPD at higher elevation might have contributed
to the increase of d13C. However, we found no corre-
lation of d13C with MAP or VPD, and thus such an
effect was apparently not important at the landscape
scale.
Potential sources of the d13C-soil age and d13C–OC
correlations
We observed a tendency for lower bryophyte d13C on older
soils on Mauna Loa. This finding is similar to that reported
for leaves of M. polymorpha which have lower LMA and
lower d13C on the young flows (Vitousek et al. 1990).
However, for the bryophytes, the effect was weak and
apparently linked with the lower OC on young flows.
The strong correlation of bryophyte d13C with OC
across the landscape would likely have arisen from several
factors. A first candidate is the ‘‘source air effect’’ if
incomplete mixing resulted in air enriched in 12C due to
soil-respired CO2 at bryophyte-level at sites with higher
OC; such an effect would be stronger when canopies are
dense, hindering airflow (Schleser and Jayasekera 1985;
Broadmeadow et al. 1992). However, the bryophytes in this
study were typically collected \0.5 m above ground, and
up to only 5.5 m above soil, and tissue d13C did not cor-
relate with vertical height as expected if soil respiration
were a major driver of the d13C–OC relationship. The d13C
was significantly higher in colonies growing on rock than
on organic substrates, as would be expected if substrate
respiration had an important effect. However, colonies
growing on humus, where substrate decomposition pre-
sumably leads to high CO2 production, did not differ sig-
nificantly from those growing on bark substrates, and, most
importantly, the d13C–OC relationship held on individual
substrates, including on rock. Thus, a vertical gradient in
source air composition would likely contribute as a subtle
effect, rather than as key driver of the relationship. The
strong gradient in irradiance was likely the primary driver
of the relationship, as reported for leaves of tracheophytes
within forests (Buchmann et al. 1997b; Sternberg et al.
1997) and within the canopies of single trees (Le Roux
et al. 2001). The d13C–OC relationship may arise from the
‘‘irradiance-A effect’’ effect, i.e. a higher d13C due to
increased photosynthetic rate. The relationship might also
arise from an indirect effect of water stress in more
exposed, drier microhabitats leading to the development of
thicker cell walls with greater water storage capacity,
which during periods of high water availability would
reduce CO2 diffusion (Dilks and Proctor 1979; Waite and
Sack 2010). Such an effect may hold for individual species,
but the lack of a significant relationship of d13C with MAP
or with VPD despite their varying by two- to three-fold
across sites did not support the importance of such an effect
at the landscape scale. We note that variation across taxa in
cell size might also be expected to play a role; across three
species of microalgae, larger cell size was related to
reduced CO2 conductance and higher d13C (Popp et al.
1998). That scenario is unlikely to be important across
bryophyte species, in which larger cells tend to be
18 Oecologia (2011) 166:11–22
123
associated with deeper shade (Waite and Sack 2010) while
higher d13C was related to lower OC and hence greater
irradiance.
Thus, the results best support a direct effect of irradi-
ance on photosynthetic rate as a key driver of the bryo-
phyte d13C–OC relationship. Such an effect was found
experimentally for two liverwort species grown at four
irradiance levels; d13C correlated positively with growth
irradiance (Fletcher et al. 2006). Our findings extend this
pattern across multiple species and show its potential
importance at the landscape scale, across sites varying in
forest successional stages. The effect is quantitatively
strong; when the range of OC was divided into five bins,
the average d13C shifted from -27.1 to -30.6%. The
effect was also strong on bark, leaf litter and rock sub-
strates individually; the lack of the correlation on humus
may be due to the lower range of OC values compared to
the other substrate types. Notably, the correlation of OC
and d13C observed across all species and sites was also
found within two of the six tested taxa, i.e., for Cam-
pylopus and in R. lanuginosum, which had the greatest
range in OC values. Whereas these within-species rela-
tionships emerged from their wide distribution across OC
levels, the across-species relationship reflected the
assembly of diverse species along a light gradient (cf.
Ackerly and Cornwell 2007).
We found that bryophyte d13C correlated with the
morphological variable CMA, analogously to LMA for
tracheophyte leaves. This finding points to integrated
adjustment of canopy form and physiology with irradiance
for bryophytes across forest successional stages. However,
by contrast with tracheophytes, in which the correlation of
d13C and LMA may arise in part from their relationship
with mesophyll conductance, our partial correlation anal-
ysis indicated that in bryophytes, the relationship of d13C
with CMA arose indirectly due to relationships with OC.
The high scatter in the correlation of d13C with CMA, and
their joint relationship with OC indicates that additional
data would be needed to support a direct control of d13C by
CMA for any given species.
Implications and future work
The bryophytes of this study exhibited great similarities
with vascular plants in landscape-scale patterns, showing
independent and strong trends for lower carbon isotope
fractionation with younger soil age, greater canopy open-
ness and increasing elevation. The similarity with tra-
cheophytes is especially remarkable given the centrality of
stomata in explaining carbon isotope fractionation in tra-
cheophytes and the lack of these structures in bryophytes.
Our findings point to direct environmental impacts of light
and temperature on gas exchange rates as primary mech-
anisms for these landscape-level trends. We inferred the
importance of given potential effects from correlation
analyses at landscape scale; individual species may differ
in the factors that determine d13C. These findings highlight
a necessity for additional mechanistic studies to clarify the
underlying basis for these landscape-level trends. Indeed,
for bryophytes, we lack a physiological predictor of d13C
signals, in the way that stomatal water use efficiency can be
used for tracheophytes (reviewed in Seibt et al. 2008). This
study, showing strong d13C signals across the landscape
scale, points to the importance of elucidating the determi-
nants of carbon isotope discrimination in bryophyte struc-
ture and biochemistry (see Meyer et al. 2008). Such studies
will need to determine isotope fractionation in real time for
given species under ranges of controlled conditions to
deepen the understanding of the landscape scale patterns
demonstrated here.
We found the variation in d13C in bryophytes at the
landscape scale—including diverse taxa across diverse
systems—to be information-rich, reflecting the signal of
multiple environmental factors. This finding indicates the
possibility of extending the usefulness of preserved
bryophyte tissue to estimate past environmental condi-
tions. Previous work emphasized that the lack of stomata
can link bryophyte d13C more closely with atmospheric
CO2 concentration than for vascular plants (White et al.
1994; Fletcher et al. 2005, 2006, 2008), and pointed to the
d13C of fossilized Sphagnum as a proxy for moisture
conditions, given that the ‘‘liquid film effect’’ would lead
to higher d13C in wetter climates (Loisel et al. 2009; Zhu
et al. 2009). However, the lack of a relationship in our
study between d13C and MAP in the Mauna Loa bryo-
phytes suggests that not all species would be good proxies
for moisture conditions, though they may be proxies for
other environmental factors. An avenue for future work is
to determine how to model the combined effects of ele-
vation, irradiance, soil age and temperature on given
bryophyte floras. Alternatively, it may be possible to tease
apart specific environmental signals, perhaps by using
additional isotopes to carbon. Thus, bryophytes, by
occupying, and responding to, a very wide range of
environments could provide in their tissues recoverable
information not only of physiological responses across
gradients but also information of their climates and
microhabitats.
Acknowledgments Tom Giambelluca assisted with climate data,
Randi Schneider with nutrient analyses, and Posy Busby and Peter
Vitousek with logistics. We thank Don Drake, Travis Idol, Shelley
James, Ulli Seibt, Alison Sherwood and two anonymous reviewers
and editor Robert Pearcy for helpful comments on the manuscript.
This research was supported by NSF Grant #0546784.
Oecologia (2011) 166:11–22 19
123
Open Access This article is distributed under the terms of the
Creative Commons Attribution Noncommercial License which per-
mits any noncommercial use, distribution, and reproduction in any
medium, provided the original author(s) and source are credited.
References
Ackerly DD, Cornwell WK (2007) A trait-based approach to
community assembly: partitioning of species trait values into
within- and among-community components. Ecol Lett
10:135–145
Barbour MM, Hanson DT (2009) Stable carbon isotopes reveal
dynamics of respiratory metabolism. New Phytol 181:243–245
Bellow JG, Nair PKR (2003) Comparing common methods for
assessing understory light availability in shaded-perennial agro-
forestry systems. Agric For Meteorol 114:197–211
Broadmeadow MSJ, Griffiths H, Maxwell C, Borland AM (1992) The
carbon isotope ratio of plant organic material reflects temporal
and spatial variations in CO2 within tropical forest formations in
Trinidad. Oecologia 89:435–441
Brooks JR, Flanagan LB, Buchmann N, Ehleringer JR (1997) Carbon
isotope composition of boreal plants: functional grouping of life
forms. Oecologia 110:301–311
Buchmann N, Guehl JM, Barigah TS, Ehleringer JR (1997a)
Interseasonal comparison of CO2 concentrations, isotopic com-
position, and carbon dynamics in an Amazonian rainforest
(French Guiana). Oecologia 110:120–131
Buchmann N, Kao WY, Ehleringer J (1997b) Influence of stand
structure on carbon-13 of vegetation, soils, and canopy air within
deciduous and evergreen forests in Utah, United States. Oeco-
logia 110:109–119
Buchmann N, Brooks JR, Ehleringer JR (2002) Predicting daytime
carbon isotope ratios of atmospheric CO2 within forest canopies.
Funct Ecol 16:49–57
Campbell GS, Norman JM (1998) Introduction to environmental
biophysics. Springer, New York
Cao GX, Giambelluca TW, Stevens DE, Schroeder TA (2007)
Inversion variability in the Hawaiian trade wind regime. J Clim
20:1145–1160
Christeller JT, Laing WA, Troughton JH (1976) Isotope discrimina-
tion by ribulose 1, 5-diphosphate carboxylase: no effect of
temperature or HCO3-concentration. Plant Physiol 57:580–582
Cordell S, Goldstein G, Mueller-Dombois D, Webb D, Vitousek PM
(1998) Physiological and morphological variation in Metrosid-eros polymorpha, a dominant Hawaiian tree species, along an
altitudinal gradient: the role of phenotypic plasticity. Oecologia
113:188–196
Cordell S, Goldstein G, Meinzer FC, Handley LL (1999) Allocation
of nitrogen and carbon in leaves of Metrosideros polymorpharegulates carboxylation capacity and d13C along an altitudinal
gradient. Funct Ecol 13:811–818
DeLucia EH et al (2003) The contribution of bryophytes to the carbon
exchange for a temperate rainforest. Glob Change Biol
9:1158–1170
Dilks TJK, Proctor MCF (1979) Photosynthesis, respiration and water
content in bryophytes. New Phytol 82:97–114
Duursma RA, Marshall JD (2006) Vertical canopy gradients in d13C
correspond with leaf nitrogen content in a mixed-species conifer
forest. Trees-Struct Funct 20:496–506
Ehleringer JR, Field CB, Lin ZF, Kuo CY (1986) Leaf carbon isotope
and mineral composition in subtropical plants along an irradi-
ance cline. Oecologia 70:520–526
Farquhar GD, Sharkey TD (1982) Stomatal conductance and photo-
synthesis. Annu Rev Plant Physiol Plant Mol Biol 33:317–345
Farquhar GD, Ehleringer JR, Hubick KT (1989) Carbon isotope
discrimination and photosynthesis. Annu Rev Plant Physiol Plant
Mol Biol 40:503–537
Fletcher BJ, Beerling DJ, Chaloner WG (2004) Stable carbon isotopes
and the metabolism of the terrestrial Devonian organism
Spongiophyton. Geobiology 2:107–119
Fletcher BJ, Beerling DJ, Brentnall SJ, Royer DL (2005) Fossil
bryophytes as recorders of ancient CO2 levels: experimental
evidence and a Cretaceous case study. Glob Biogeochem Cycles
19:GB3012
Fletcher BJ, Brentnall SJ, Quick WP, Beerling DJ (2006) BRYO-
CARB: a process-based model of thallose liverwort carbon
isotope fractionation in response to CO2, O2, light and temper-
ature. Geochim Cosmochim Acta 70:5676–5691
Fletcher BJ, Brentnall SJ, Anderson CW, Berner RA, Beerling DJ
(2008) Atmospheric carbon dioxide linked with Mesozoic and
early Cenozoic climate change. Nature Geosci 1:43–48
Francey RJ, Gifford RM, Sharkey TD, Weir B (1985) Physiological
influences on carbon isotope discrimination in Huon pine
(Lagarostrobos franklinii). Oecologia 66:211–218
Fry B et al (1996) Cryoflow: cryofocusing nanomole amounts of CO2,
N2, and SO2 from an elemental analyzer for stable isotopic
analysis. Rapid Commun Mass Spectrom 10:953–958
Garten CT, Taylor GE (1992) Foliar d13C within a temperate
deciduous forest: spatial, temporal, and species sources of
variation. Oecologia 90:1–7
Gillon JS, Griffiths H (1997) The influence of (photo)respiration on
carbon isotope discrimination in plants. Plant Cell Environ
20:1217–1230
Hamerlynck EP, Csintalan Z, Nagy Z, Tuba Z, Goodin D, Henebry
GM (2002) Ecophysiological consequences of contrasting
microenvironments on the desiccation tolerant moss Tortularuralis. Oecologia 131:498–505
Hikosaka K, Nagamatsu D, Ishii HS, Hirose T (2002) Photosynthesis-
nitrogen relationships in species at different altitudes on Mount
Kinabalu, Malaysia. Ecol Res 17:305–313
Hultine KR, Marshall JD (2000) Altitude trends in conifer leaf
morphology and stable carbon isotope composition. Oecologia
123:32–40
Jennings SB, Brown ND, Sheil D (1999) Assessing forest canopies
and understorey illumination: canopy closure, canopy cover and
other measures. Forestry 72:59–73
Juvik JO, Nullet D (1994) A climate transect through tropical
montane rain-forest in Hawaii. J Appl Meteorol 33:1304–1312
Korhonen L, Korhonen KT, Rautiainen M, Stenberg P (2006)
Estimation of forest canopy cover: a comparison of field
measurement techniques. Silva Fenn 40:577–588
Korner C (1989) The nutritional status of plants from high altitudes: a
world comparison. Oecologia 81:379–391
Korner C (2003) Alpine plant life: functional plant ecology of high
mountain ecosystems, 2nd edn. Springer, Berlin
Korner C (2007) The use of ‘altitude’ in ecological research. Trends
Ecol Evol 22:569–574
Korner C, Farquhar GD, Roksandic Z (1988) A global survey of
carbon isotope discrimination in plants from high altitude.
Oecologia 74:623–632
Korner C, Farquhar GD, Wong SC (1991) Carbon isotope discrim-
ination by plants follows latitudinal and altitudinal trends.
Oecologia 88:30–40
Le Roux X et al (2001) Spatial distribution of leaf water-use
efficiency and carbon isotope discrimination within an isolated
tree crown. Plant Cell Environ 24:1021–1032
Li CY, Wu CC, Duan BL, Korpelainen H, Luukkanen O (2009) Age-
related nutrient content and carbon isotope composition in the
20 Oecologia (2011) 166:11–22
123
leaves and branches of Quercus aquifolioides along an altitudi-
nal gradient. Trees-Struct Funct 23:1109–1121
Lockwood JP, Lipman PW, Peterson LD, Warshauer FR (1988)
Generalized ages of surface flows of Mauna Loa Volcano,
Hawaii. US Government Printing Office, Washington, DC
Loisel J, Garneau M, Helie JF (2009) Modern Sphagnum d13C
signatures follow a surface moisture gradient in two boreal peat
bogs, James Bay lowlands, Quebec. J Quatern Sci 24:209–214
Loreto F, Harley PC, Dimarco G, Sharkey TD (1992) Estimation of
mesophyll conductance to CO2 flux by 3 different methods. Plant
Physiol 98:1437–1443
Medina E, Minchin P (1980) Stratification of d13C values of leaves in
Amazonian rain forests. Oecologia 45:377–378
Medina E, Sternberg L, Cuevas E (1991) Vertical stratification of
d13C values in closed natural and plantation forests in the
Luquillo Mountains, Puerto Rico. Oecologia 87:369–372
Menot G, Burns SJ (2001) Carbon isotopes in ombrogenic peat bog
plants as climatic indicators: calibration from an altitudinal
transect in Switzerland. Org Geochem 32:233–245
Menot-Combes G, Combes PP, Burns SJ (2004) Climatic information
from d13C in plants by combining statistical and mechanistic
approaches. Holocene 14:931–939
Meyer M, Seibt U, Griffiths H (2008) To concentrate or ventilate?
Carbon acquisition, isotope discrimination and physiological
ecology of early land plant life. Philos Trans R Soc Lond B
363:2767–2778
Miller RO (1998) High-temperature oxidation: dry ashing. In: Kalra
YP (ed) Handbook of reference methods for plant analysis. CRC
Press, Boca Raton, pp 53–56
Morecroft MD, Woodward FI, Marrs RH (1992) Altitudinal trends in
leaf nutrient contents, leaf size and d13C of Alchemilla alpina.
Funct Ecol 6:730–740
Niinemets U (1999) Components of leaf dry mass per area—thickness
and density—alter leaf photosynthetic capacity in reverse
directions in woody plants. New Phytol 144:35–47
Niinemets U, Sonninen E, Tobias M (2004) Canopy gradients in leaf
intercellular CO2 mole fractions revisited: interactions between
leaf irradiance and water stress need consideration. Plant Cell
Environ 27:569–583
Niinemets U, Wright IJ, Evans JR (2009) Leaf mesophyll diffusion
conductance in 35 Australian sclerophylls covering a broad
range of foliage structural and physiological variation. J Exp Bot
60:2433–2449
O’Leary MH (1988) Carbon isotopes in photosynthesis. Bioscience
38:328–336
Ometto J et al (2006) The stable carbon and nitrogen isotopic
composition of vegetation in tropical forests of the Amazon
Basin, Brazil. Biogeochemistry 79:251–274
Paletto A, Tosi V (2009) Forest canopy cover and canopy closure:
comparison of assessment techniques. Eur J For Res
128:265–272
Parkhurst DF (1994) Diffusion of CO2 and other gases inside leaves.
New Phytol 126:449–479
Popp BN, Laws EA, Bidigare RR, Dore JE, Hanson KL, Wakeham
SG (1998) Effect of phytoplankton cell geometry on carbon
isotopic fractionation. Geochim Cosmochim Acta 62:69–77
Porder S, Paytan A, Vitousek PM (2005) Erosion and landscape
development affect plant nutrient status in the Hawaiian Islands.
Oecologia 142:440–449
Proctor MCF, Raven JA, Rice SK (1992) Stable carbon isotope
discrimination measurements in Sphagnum and other bryo-
phytes: physiological and ecological implications. J Bryol
17:193–202
Raich JW, Russell AE, Vitousek PM (1997) Primary productivity and
ecosystem development along an elevational gradient on Mauna
Loa, Hawaii. Ecology 78:707–721
Rice SK, Giles L (1996) The influence of water content and leaf
anatomy on carbon isotope discrimination and photosynthesis in
Sphagnum. Plant Cell Environ 19:118–124
Rundel PW, Stichler W, Zander RH, Ziegler H (1979) Carbon and
hydrogen isotope ratios of bryophytes from arid and humid
regions. Oecologia 44:91–94
Schaefer J, Opgen-Rhein R, Strimmer K (2007) corpcor: Efficient
estimation of covariance and (partial) correlation. R package
version 1.4.7
Schedlbauer JL, Kavanagh KL (2008) d13C in Pentaclethra macro-loba trees growing at forest edges in north-eastern Costa Rica.
J Trop Ecol 24:49–56
Schleser GH, Jayasekera R (1985) d13C-variations of leaves in forests
as an indication of reassimilated CO2 from the soil. Oecologia
65:536–542
Schofield WB (1985) Introduction to bryology. Macmillan, New York
Schott MR, Pieper RD (1985) Influence of canopy characteristics of
one-seed juniper on understory grasses. J Range Manag
38:328–331
Seibt U, Rajabi A, Griffiths H, Berry JA (2008) Carbon isotopes and
water use efficiency: sense and sensitivity. Oecologia 155:441–454
Skrzypek G, Kaluzny A, Wojtun B, Jedrysek MO (2007) The carbon
stable isotopic composition of mosses: a record of temperature
variation. Org Geochem 38:1770–1781
Sokal RR, Rohlf FJ (1995) Biometry, 3rd edn. Freeman, New York
Staples GW, Imada CT, Hoe WT, Smith CW (2004) A revised
checklist of Hawaiian mosses. Trop Bryol 25:35–69
Sternberg LDL, Mulkey SS, Wright SJ (1989) Ecological interpre-
tation of leaf carbon isotope ratios: influence of respired carbon
dioxide. Ecology 70:1317–1324
Sternberg LDS et al (1997) Carbon dioxide recycling in two
Amazonian tropical forests. Agric For Meteorol 88:259–268
Takahashi K, Miyajima Y (2008) Relationships between leaf life
span, leaf mass per area, and leaf nitrogen cause different
altitudinal changes in leaf d13C between deciduous and ever-
green species. Botany 86:1233–1241
R Development Core Team (2007) R: a language and environment for
statistical computing. R Foundation for Statistical Computing,
Vienna, Austria
Terashima I, Masuzawa T, Ohba H, Yokoi Y (1995) Is photosynthesis
suppressed at higher elevations due to low CO2 pressure?
Ecology 76:2663–2668
Teti PA, Pike RG (2005) Selecting and testing an instrument for
surveying stream shade. BC J Ecosyst Manag 6:1–16
Troughton JH, Card KA (1975) Temperature effects on carbon-
isotope ratio of C3, C4 and Crassulacean-acid-metabolism
(CAM) plants. Planta 123:185–190
Vitousek PM (2004) Nutrient cycling and limitation: Hawaii as a
model system. Princeton University Press, Princeton
Vitousek PM, Matson PA, Turner DR (1988) Elevational and age
gradients in Hawaiian montane rainforest: foliar and soil
nutrients. Oecologia 77:565–570
Vitousek PM, Field CB, Matson PA (1990) Variation in foliar d13C in
Hawaiian Metrosideros plolymorpha: a case of internal resis-
tance. Oecologia 84:362–370
Vitousek PM, Aplet GH, Raich JW, Lockwood JP (1995) Biological
perspectives on Mauna Loa Volcano: a model system for
ecological research. In: Rhodes JM, Lockwood JP (eds) Mauna
Loa revealed: structure, composition, history, and hazards.
American Geophysical Union, Washington DC, pp 117–126
Vora RS (1988) A comparison of the spherical densiometer and
ocular methods of estimating canopy cover. Great Basin Natur
48:224–227
Waite M, Sack L (2010a) How does moss photosynthesis relate to leaf
and canopy structure? Trait relationships for 10 Hawaiian
species of contrasting light habitats. New Phytol 185:156–172
Oecologia (2011) 166:11–22 21
123

Waite M, Sack L (2011) Does global stoichiometric theory apply to
bryophytes? Tests across and elevation 9 soil age ecosystem
matrix on Mauna Loa, Hawaii. J Ecol 99:122–134
Warton DI, Wright IJ, Falster DS, Westoby M (2006) Bivariate line-
fitting methods for allometry. Biol Rev 81:259–291
White JWC, Ciais P, Figge RA, Kenny R, Markgraf V (1994) A high
resolution record of atmospheric CO2 content from carbon
isotopes in peat. Nature 367:153–156
Williams TG, Flanagan LB (1996) Effect of changes in water content
on photosynthesis, transpiration and discrimination against13CO2 and C18O16O in Pleurozium and Sphagnum. Oecologia
108:38–46
Zar JH (1999) Biometry. Prentice Hall, Upper Saddle River
Zhu Y et al (2009) Record of environmental change by alpha-
cellulose d13C of sphagnum peat at Shennongjia, 4,000–
1,000 aBP. Chin Sci Bull 54:3731–3738
22 Oecologia (2011) 166:11–22
123
Copyright © 2022 FDOKUMEN