All-sky imaging polarimeter measurements of visible and NIR skylight at Mauna Loa, Hawaii
9
All-Sky Imaging Polarimeter Measurements of Visible and NIR Skylight at Mauna Loa, Hawaii Andrew R. Dahlberg, Nathan J. Pust, Joseph A. Shaw* Dept. of Electrical and Computer Engineering, Montana State University, 610 Cobleigh Hall, Bozeman, MT, 59717 ABSTRACT An all-sky imaging polarimeter was deployed in summer 2008 to the Mauna Loa Observatory in Hawaii to study atmospheric skylight polarization. This paper describes the Mauna Loa deployment and presents an initial comparison of our data to those observed by Coulson with a zenith–slice polarimeter in the late 1970s and early 1980s. We show how the all-sky imaging technique yields additional insight to the nature of skylight polarization beyond what is observed in a single zenith scan. Keywords: Polarization, imaging, radiative transfer, Stokes parameters, aerosols, albedo 1. INTRODUCTION Skylight polarization in the visible and near-infrared (NIR) bands is an important physical quantity of interest to both civilian and military research. While existing single-scattering theories and radiative transfer codes can predict the phenomenon well to first-order under Rayleigh scattering conditions, the effects of variable aerosols, multiple scattering, and surface albedo further complicate the prediction of degree of skylight polarization beyond current capabilities. As such, we designed an all-sky imaging polarimeter [1 ] to measure skylight polarization of the entire sky dome and deployed the instrument to the Mauna Loa Observatory in Hawaii in May and June 2008. This location allows measurement of skylight polarization in an environment with historically lower aerosol concentrations than the continental mainland. These measurements, in conjunction with the wide availability of aerosol data available from the observatory and surface albedo data from satellite images, allow for a more complete characterization of measurements made in differing aerosol or cloud environments to be made. 1.1 Instrument overview The imaging polarimeter uses a 180° FOV (155° effective FOV during this deployment) equidistance projection fisheye lens to image the sky dome. It uses two liquid-crystal variable retarders (LCVRs) to obtain sequential images at different polarization states, which are then used to infer the Stokes vector parameters at each pixel. The Stokes parameters are then used to calculate the degree of linear skylight polarization in the image. Five 10 nm-wide channels centered through the visible and NIR at 450, 490, 530, 630, and 700 nm are rotated into place in a filter wheel configuration. The fast switching time of the LCVRs allows for a 4-image sequence at a single wavelength to be taken in less than 0.3 s. An entire five-wavelength sequence, including time for filter wheel rotation and focusing to the 1 Mpixel CCD array, takes roughly 10-15 seconds. Rapid imaging at a single wavelength was a driving requirement to accurately capture clouds in motion and the LCVR design accomplishes this goal. * [email protected] phone: 1-406-994-7261; fax: 1-406-994-5958 Polarization Science and Remote Sensing IV, edited by Joseph A. Shaw, J. Scott Tyo, Proc. of SPIE Vol. 7461, 746107 · © 2009 SPIE · CCC code: 0277-786X/09/$18 · doi: 10.1117/12.826537 Proc. of SPIE Vol. 7461 746107-1
-
Upload
independent -
Category
Documents
-
view
0 -
download
0
Transcript of All-sky imaging polarimeter measurements of visible and NIR skylight at Mauna Loa, Hawaii
All-Sky Imaging Polarimeter Measurements of Visible and NIR Skylight at Mauna Loa, Hawaii
Andrew R. Dahlberg, Nathan J. Pust, Joseph A. Shaw*
Dept. of Electrical and Computer Engineering, Montana State University, 610 Cobleigh Hall, Bozeman, MT, 59717
ABSTRACT
An all-sky imaging polarimeter was deployed in summer 2008 to the Mauna Loa Observatory in Hawaii to study atmospheric skylight polarization. This paper describes the Mauna Loa deployment and presents an initial comparison of our data to those observed by Coulson with a zenith–slice polarimeter in the late 1970s and early 1980s. We show how the all-sky imaging technique yields additional insight to the nature of skylight polarization beyond what is observed in a single zenith scan.
Keywords: Polarization, imaging, radiative transfer, Stokes parameters, aerosols, albedo
1. INTRODUCTION Skylight polarization in the visible and near-infrared (NIR) bands is an important physical quantity of interest to both civilian and military research. While existing single-scattering theories and radiative transfer codes can predict the phenomenon well to first-order under Rayleigh scattering conditions, the effects of variable aerosols, multiple scattering, and surface albedo further complicate the prediction of degree of skylight polarization beyond current capabilities. As such, we designed an all-sky imaging polarimeter [1] to measure skylight polarization of the entire sky dome and deployed the instrument to the Mauna Loa Observatory in Hawaii in May and June 2008. This location allows measurement of skylight polarization in an environment with historically lower aerosol concentrations than the continental mainland. These measurements, in conjunction with the wide availability of aerosol data available from the observatory and surface albedo data from satellite images, allow for a more complete characterization of measurements made in differing aerosol or cloud environments to be made. 1.1 Instrument overview
The imaging polarimeter uses a 180° FOV (155° effective FOV during this deployment) equidistance projection fisheye lens to image the sky dome. It uses two liquid-crystal variable retarders (LCVRs) to obtain sequential images at different polarization states, which are then used to infer the Stokes vector parameters at each pixel. The Stokes parameters are then used to calculate the degree of linear skylight polarization in the image. Five 10 nm-wide channels centered through the visible and NIR at 450, 490, 530, 630, and 700 nm are rotated into place in a filter wheel configuration. The fast switching time of the LCVRs allows for a 4-image sequence at a single wavelength to be taken in less than 0.3 s. An entire five-wavelength sequence, including time for filter wheel rotation and focusing to the 1 Mpixel CCD array, takes roughly 10-15 seconds. Rapid imaging at a single wavelength was a driving requirement to accurately capture clouds in motion and the LCVR design accomplishes this goal.
* [email protected] phone: 1-406-994-7261; fax: 1-406-994-5958
Polarization Science and Remote Sensing IV, edited by Joseph A. Shaw, J. Scott Tyo, Proc. of SPIE Vol. 7461, 746107 · © 2009 SPIE · CCC code: 0277-786X/09/$18 · doi: 10.1117/12.826537
Proc. of SPIE Vol. 7461 746107-1
1.2 Mauna Loa Observatory
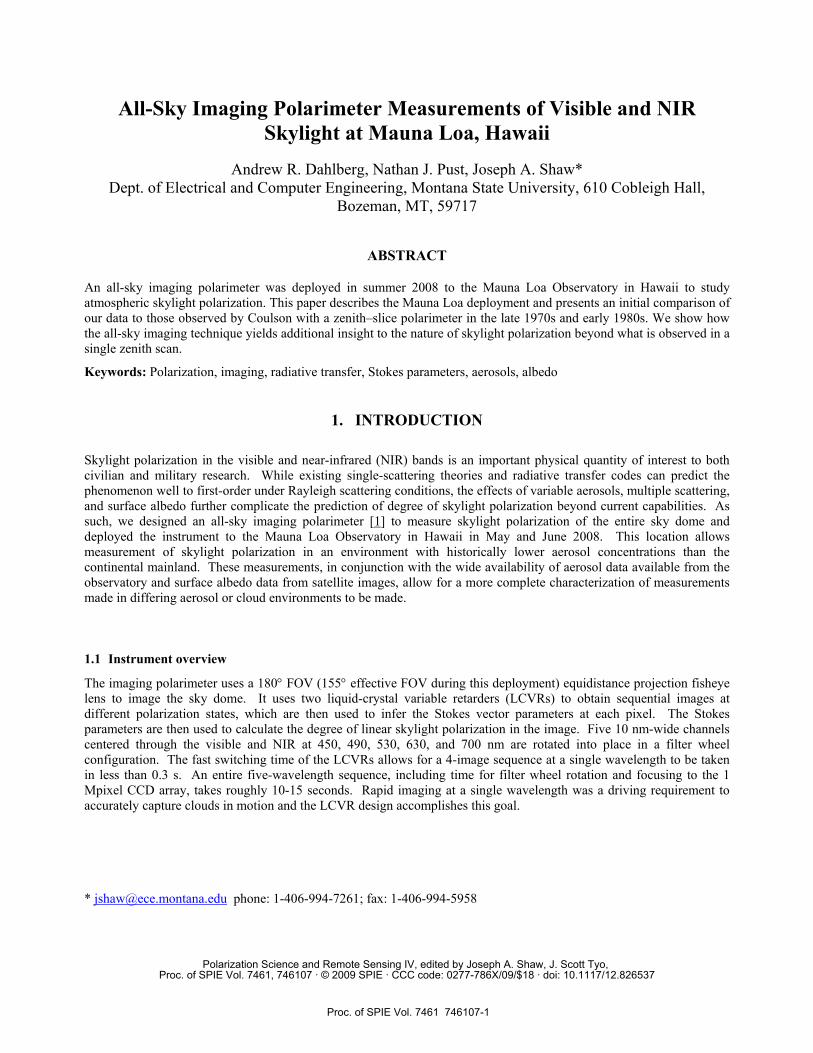
The Mauna Loa Observatory (MLO) has historically been a site in which cloud-free, low-aerosol sky measurements have been made [2]. In the late 1970s and early 1980s, K. Coulson initiated a measurement campaign with a scanning zenith slice polarimeter to obtain a cross section of the degree of polarization over a narrow sun-zenith-observer slice (principal plane) of the sky dome. MLO is a favored location due to its elevation of 3,394 m above sea level and frequent lack of overhead clouds. Clouds and aerosols tend to remain beneath the observatory until the late morning, only rising to the observatory level in early to mid-afternoon as the local heating of the surrounding volcanic landscape shifts the downslope winds upward, carrying clouds and aerosols with them. For this reason, and due to the in situ ability to quantify the aerosol changes throughout the day, MLO is an ideally suited location to observe a nearly pure Rayleigh scattered atmosphere as it changes to an aerosol-laden atmosphere. Figure 1 illustrates the MLO observatory and the relative location of the instrument while operational.
Fig. 1: (L) Mauna Loa Observatory as viewed from the CO2 monitoring tower facing east (photo by Forrest Mims III). (R)
Instrument deployed along a roughly East-West line with adjustable sun occulter to the left of the image.
2. POLARIZATION THEORY Atmospheric polarization signatures originate from two primary mechanisms. The first, single scattering by small particulates, is explained using Rayleigh and Mie scattering theories applied to collections of small scattering volumes of various size distributions. It is this theory that can be applied to scattering by cloud particles and hydrometeors to explain the predominant atmospheric phenomena such as rainbows, halos, and glories [3]. This scattering theory applied to atmospheric molecules and aerosols gives rise to the polarization characteristics of the atmosphere and will be the dominant phenomenon discussed here. The second theoretical process that affects polarization signatures is the multiple scattering of light in the atmosphere. Multiple scattering, to a first order for the purposes of this paper, contributes to the depolarization of the sky and in practice requires complex algorithms to solve the equations of transfer for the true polarization contribution.
Picture courtesy Forrest Mimms, www.forrestmimms.org
E
W
Proc. of SPIE Vol. 7461 746107-2
2.1 Single scattering formulation
The following discussion follows closely the derivation found in Hansen [3].
Arbitrary, incoherent light with irradiance I can be decomposed into four Stokes parameters, S0, S1, S2, and S3, that completely describe the possible polarization states. Whereas, I represents the total light irradiance, S1 and S2 describe the components of light that are linearly polarized vertically, horizontally, and at angles of 45° and 135°. Circular polarization is described by the S3 term which accounts for phase retardation. Mathematically, Eq. (1) illustrates the relationship of these parameters to incident electric field strengths E along the x and y directions and proportionally to irradiances I observed through a hypothetical polarizer oriented as indicated by the subscripts [4]
⎥⎥⎥⎥⎥
⎦
⎤
⎢⎢⎢⎢⎢
⎣
⎡
−−
−+
∝
⎥⎥⎥⎥⎥⎥⎥
⎦
⎤
⎢⎢⎢⎢⎢⎢⎢
⎣
⎡
−
−
+
=
⎥⎥⎥⎥
⎦
⎤
⎢⎢⎢⎢
⎣
⎡
=
RightLeft
yx
yx
yx
yx
IIII
IIII
EE
EE
EE
EE
SSSS
13545
900
900
*
*
22
22
3
2
1
0
0
Im2
Re2I
(1)
The incident radiation irradiance when polarization effects are included is then represented by I. For a differential volume of optically small particles in the path of an incident light beam, the intensity at a far-field distance R will then take the form of
24)(
RdvkRIπ0PI= (2)
where k is a scattering coefficient, assumed to be constant for many practical applications, and P is the phase matrix which depends intrinsically on the scattering angle (angle between the original light propagation direction and the scattered direction). If we restrict attention to clear-sky molecular scattering, Rayleigh theory is sufficient to describe the scattering phenomenology because molecular sizes are much less than the visible wavelengths of light. The Rayleigh scattering phase matrix for the molecular constituents of the atmosphere must account for the anisotropy of these molecules. This phase matrix, shown as Eq. (3), is solely a function of the scattering angle and the depolarization factor δ. This depolarization factor varies for different molecular species on the order of 0.02 to 0.09.
⎪⎪⎭
⎪⎪⎬
⎫
⎪⎪⎩
⎪⎪⎨
⎧
0001
)Δ−+
⎪⎪⎭
⎪⎪⎬
⎫
⎪⎪⎩
⎪⎪⎨
⎧
Δ′
+−−+
Δ=)
000000000000
1(
cos0000cos0000)cos1(sin00sin)cos1(
(
23
23
2432
43
2432
43
αα
αααα
αP , (3)
δδ
δδ
−−1
=Δ′+
−1=Δ
12 and
2/1 (4)
If we define the degree of linear polarization as the ratio of the square root of the sum of the squares of the linear-polarization Stokes components to the total incident light irradiance, and consider the above phase matrix, the expression for the degree of linear polarization for anisotropic Rayleigh scattering becomes
)−/(1++=
+=
δδαα2cos1
sin2
222
21
ISS
II pol (5)
This result indicates that as the depolarization factor decreases to zero, the maximum degree of linear polarization is 100% at an angle of 90° from the incident light direction. In field observations, it is a combination of this depolarization factor and multiple scattering that will drive the observed maximum degree of polarization down from the theoretical maximum [5]. The empirical magnitude of this effect, especially when viewing the atmosphere in a mostly aerosol-free (thereby ideally Rayleigh in nature) environment, is the primary focus of this paper.
Proc. of SPIE Vol. 7461 746107-3
2.2 Skylight scattering geometry
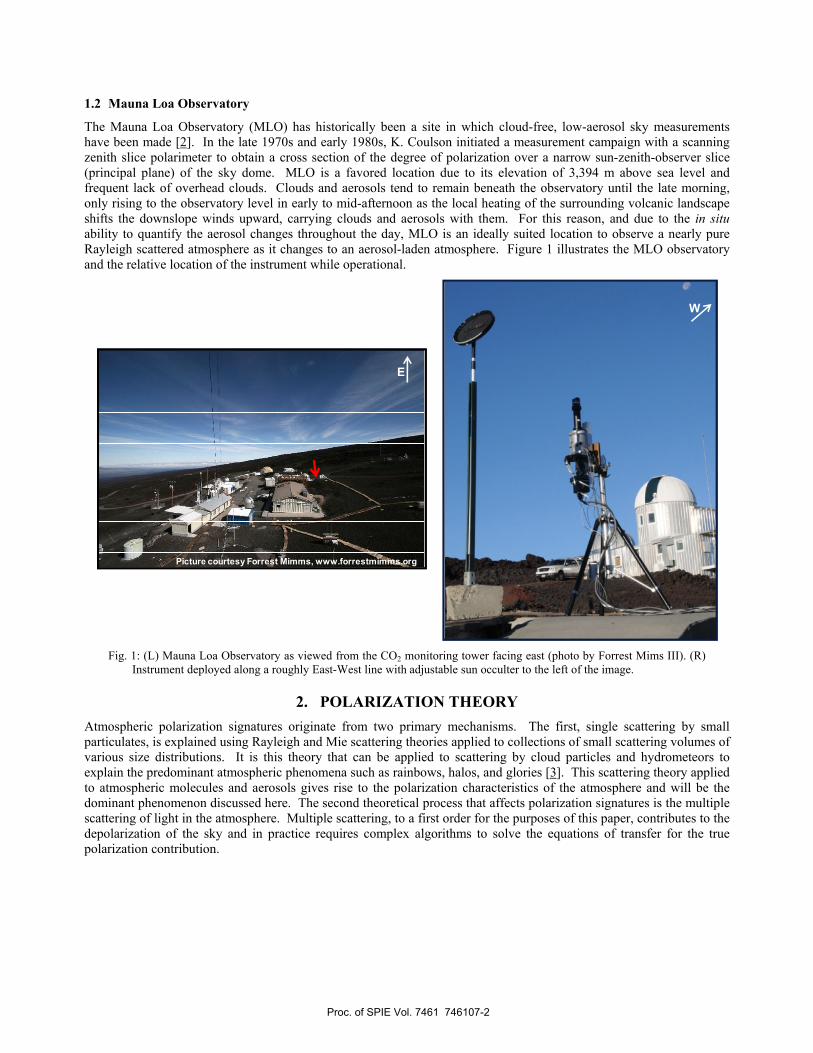
If we consider the sun to be a point source of natural, or randomly-polarized, light from infinity, then the maximum degree of polarization will occur at a scattering angle α of 90°. Because the sun is essentially at infinity, the unit vector direction sn̂ from the scattering volume P is identical to that of the unit vector from the observer location. Figure 2a
illustrates the scattering geometry convention used. Furthermore, if the unit vector to the scattering volume pn̂ is rotated
about solar vector pn̂ , an arc of the maximum degree of liner polarization (DoLP) is created that passes through both P, the scattering volume in the principal plane (containing the sun, zenith, scattering volume, and the observer) and the rotated point P′ that still lies at a 90° angle from the sun; however, is rotated by both azimuth and elevation angles θaz and φel angles about the solar vector. Figure 2b illustrates the red arc of maximum DoLP. For a ground-based, all-sky imager such as ours, it was expected to see arcs of this nature, projected into a 2-D plane with a fisheye lens, progress throughout the day as the sun moved through the sky.
Fig. 2: Derived from [6], (a) illustrates the scattering angle geometry used for the principal plane and (b) extrapolates this
geometry to a full three-dimensional degree of polarization arc at a constant 90˚ angle from the sun.
2.3 Albedo depolarization effects
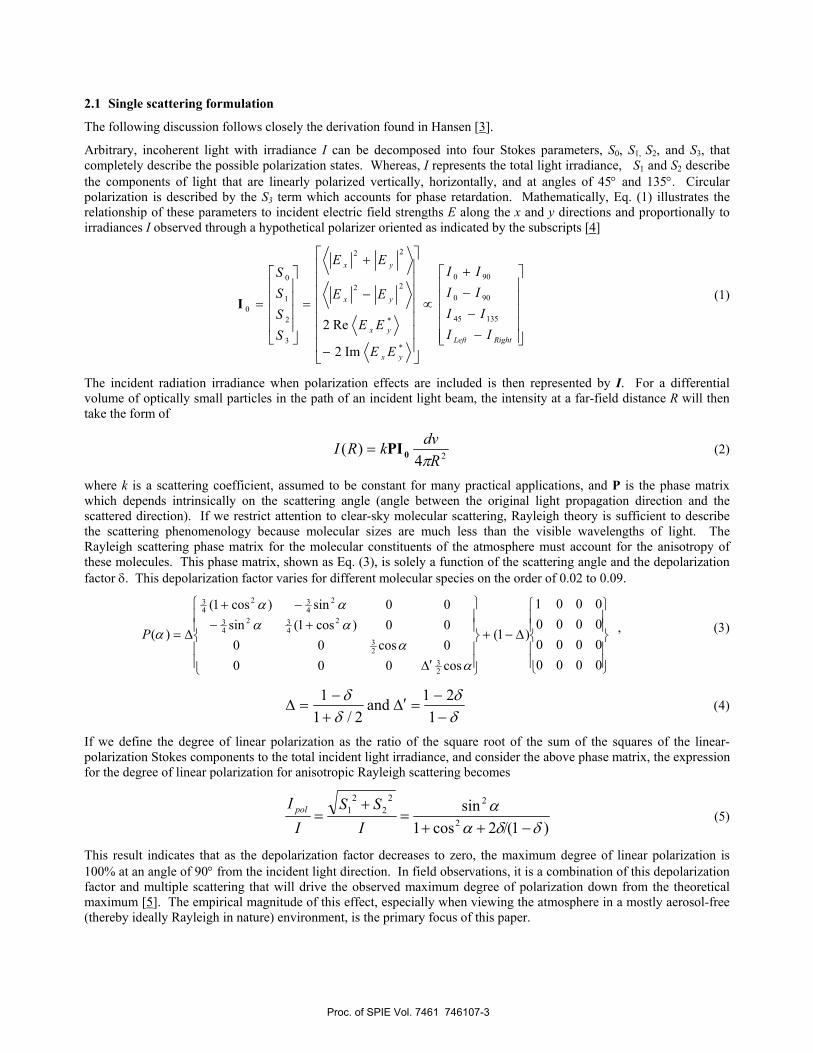
The MLO site is well suited for observing clear overhead skies; however, both trade winds and volcanic activity at nearby Kilauea results in extremely variable amounts of cloud cover beneath the observatory, leading to multiple scattering of sunlight back onto molecules in the FOV of the imager, which contributes to skylight depolarization (see Figure 3).
Fig. 3: Surface albedo—especially contributions from clouds and volcanic fog (VOG) surrounding the observatory—
enhance depolarization via multiple scattering.
Kilauea, a volcano that has been continuously active since 1983, has produced significant amounts of sulfur dioxide and other volcanic aerosols that combine with the trade winds to produce significant aerosol and volcanic cloud layers at altitudes predominantly below the MLO. The observatory usually has the significant advantage; however, in that
α
Observer
Earth
Scatterer
P
θaz
φel
P
P′
pn̂
sn̂pn ′ˆ
Principal Plane
pn̂sn̂ π-α
Incident Natural Light
Scattered Light
sn̂
a) b)
xSensorHawaii
Proc. of SPIE Vol. 7461 746107-4
contribution reflectance a[2]. Furthermit too can besurrounding scattering.
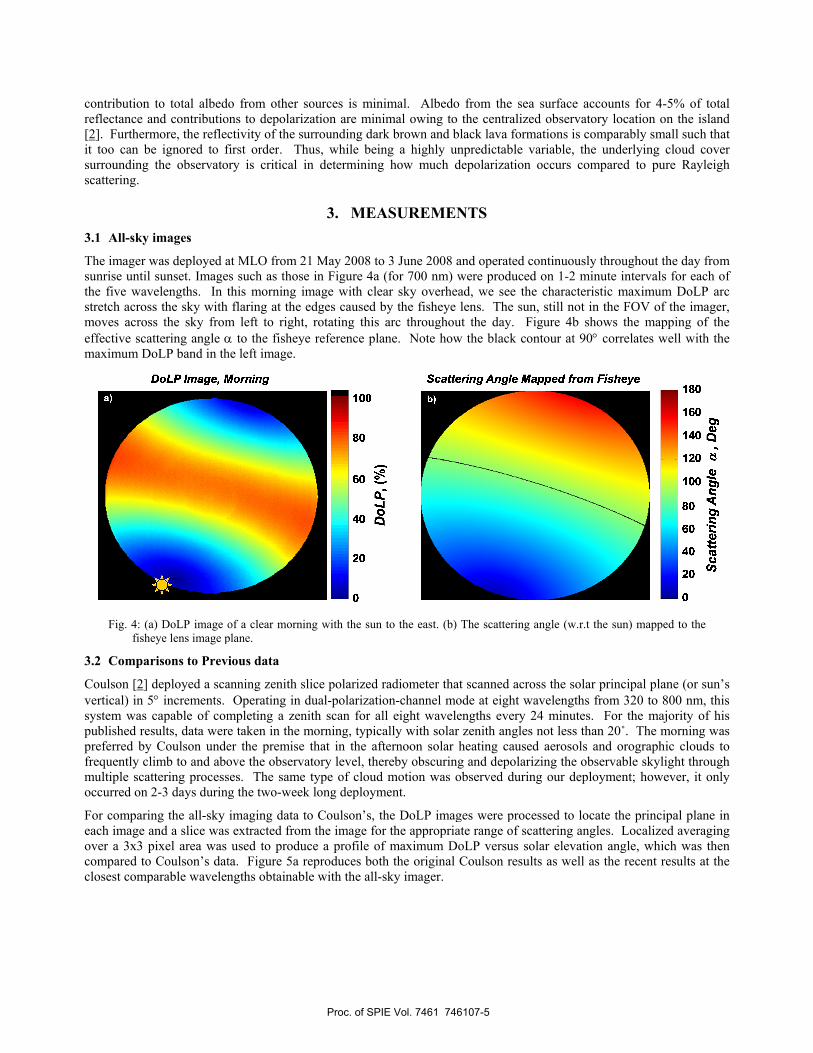
3.1 All-sky
The imager wsunrise until the five wavstretch acrosmoves acroseffective scamaximum Do
Fig. 4: (afishe
3.2 Compar
Coulson [2] dvertical) in 5system was published respreferred by frequently clmultiple scatoccurred on 2
For comparineach image aover a 3x3 pcompared to closest comp
to total albedand contributiomore, the reflece ignored to fthe observato
images
was deployed asunset. Image
velengths. In ts the sky with
ss the sky fromattering angle αoLP band in th
a) DoLP image oeye lens image p
risons to Prev
deployed a sca5° increments. capable of comsults, data wereCoulson unde
imb to and abottering process2-3 days during
ng the all-sky and a slice waspixel area was
Coulson’s datparable wavelen
o from other sons to depolarizctivity of the sufirst order. Thry is critical i
at MLO from 2s such as thosethis morning iflaring at the
m left to rightα to the fisheyhe left image.
of a clear morniplane.
ious data
anning zenith s Operating in mpleting a zene taken in the mer the premiseove the observses. The sameg the two-week
imaging data ts extracted from
used to produta. Figure 5a rngths obtainab
sources is minzation are minurrounding darhus, while beiin determining
3. MEA
21 May 2008 toe in Figure 4a image with cleedges caused b
t, rotating this ye reference pla
ing with the sun
slice polarizeddual-polarizati
nith scan for amorning, typic
e that in the afatory level, the
e type of cloudk long deploym
to Coulson’s, tm the image fouce a profile oreproduces bot
ble with the all-
nimal. Albedonimal owing tork brown and bing a highly ug how much d
ASUREME
o 3 June 2008 (for 700 nm)
ear sky overheby the fisheye arc throughou
ane. Note how
n to the east. (b)
radiometer thaion-channel mo
all eight wavelcally with solarfternoon solar ereby obscurind motion was oment.
the DoLP imagor the appropriaf maximum Dth the original -sky imager.
o from the seao the centralizeblack lava formunpredictable vdepolarization
NTS
and operated cwere produced
ead, we see thelens. The sun
ut the day. Fw the black co
) The scattering
at scanned acroode at eight wengths every 2r zenith anglesheating cause
ng and depolariobserved durin
ges were proceate range of sc
DoLP versus soCoulson resul
a surface accoued observatory mations is compvariable, the u
occurs compa
continuously thd on 1-2 minute characteristicn, still not in thigure 4b show
ontour at 90° c
angle (w.r.t the
oss the solar prwavelengths fro
24 minutes. Fs not less than 2d aerosols andizing the obserng our deploym
essed to locateattering angles
olar elevation alts as well as th
unts for 4-5%location on th
parably small sunderlying clouared to pure R
hroughout the dte intervals forc maximum Dhe FOV of the
ws the mappinorrelates well
sun) mapped to
rincipal plane (om 320 to 800 For the majorit20˚. The mornd orographic crvable skylightment; however
e the principal s. Localized avangle, which whe recent resul
of total he island such that ud cover Rayleigh
day from r each of
DoLP arc e imager, ng of the
with the
o the
(or sun’s nm, this ty of his ning was clouds to t through r, it only
plane in veraging was then lts at the
Proc. of SPIE Vol. 7461 746107-5
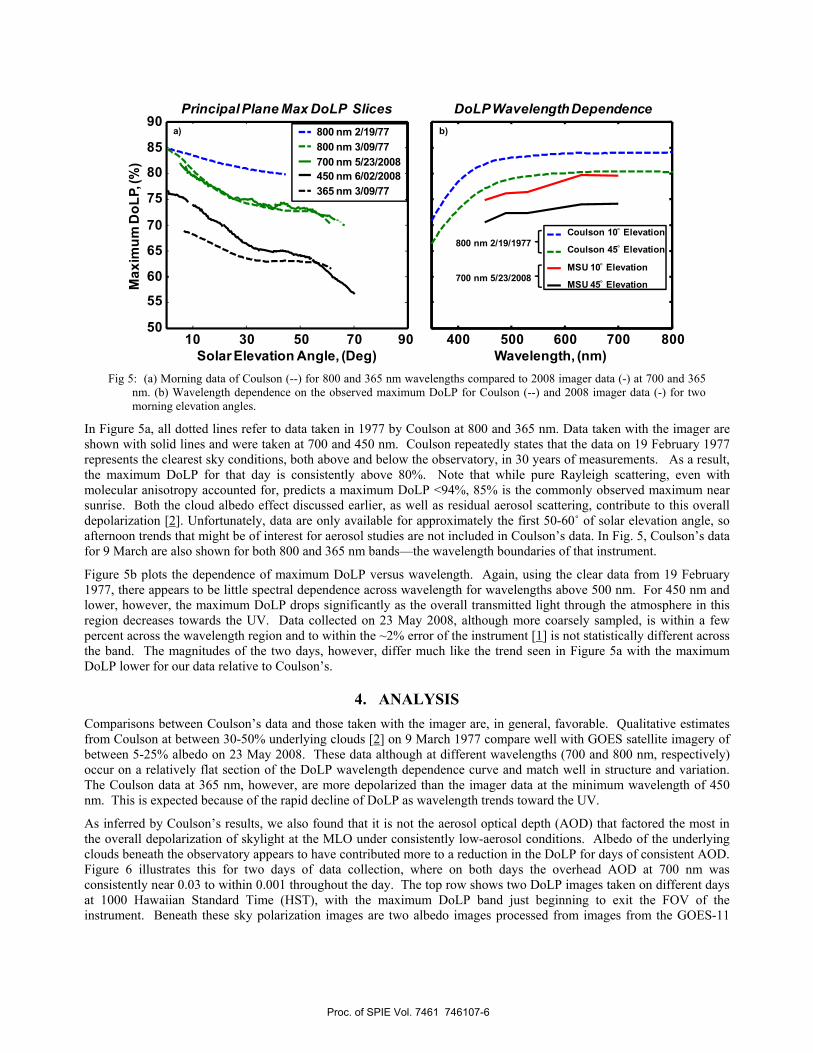
Fig 5: (a) Morning data of Coulson (--) for 800 and 365 nm wavelengths compared to 2008 imager data (-) at 700 and 365
nm. (b) Wavelength dependence on the observed maximum DoLP for Coulson (--) and 2008 imager data (-) for two morning elevation angles.
In Figure 5a, all dotted lines refer to data taken in 1977 by Coulson at 800 and 365 nm. Data taken with the imager are shown with solid lines and were taken at 700 and 450 nm. Coulson repeatedly states that the data on 19 February 1977 represents the clearest sky conditions, both above and below the observatory, in 30 years of measurements. As a result, the maximum DoLP for that day is consistently above 80%. Note that while pure Rayleigh scattering, even with molecular anisotropy accounted for, predicts a maximum DoLP <94%, 85% is the commonly observed maximum near sunrise. Both the cloud albedo effect discussed earlier, as well as residual aerosol scattering, contribute to this overall depolarization [2]. Unfortunately, data are only available for approximately the first 50-60˚ of solar elevation angle, so afternoon trends that might be of interest for aerosol studies are not included in Coulson’s data. In Fig. 5, Coulson’s data for 9 March are also shown for both 800 and 365 nm bands—the wavelength boundaries of that instrument.
Figure 5b plots the dependence of maximum DoLP versus wavelength. Again, using the clear data from 19 February 1977, there appears to be little spectral dependence across wavelength for wavelengths above 500 nm. For 450 nm and lower, however, the maximum DoLP drops significantly as the overall transmitted light through the atmosphere in this region decreases towards the UV. Data collected on 23 May 2008, although more coarsely sampled, is within a few percent across the wavelength region and to within the ~2% error of the instrument [1] is not statistically different across the band. The magnitudes of the two days, however, differ much like the trend seen in Figure 5a with the maximum DoLP lower for our data relative to Coulson’s.
4. ANALYSIS Comparisons between Coulson’s data and those taken with the imager are, in general, favorable. Qualitative estimates from Coulson at between 30-50% underlying clouds [2] on 9 March 1977 compare well with GOES satellite imagery of between 5-25% albedo on 23 May 2008. These data although at different wavelengths (700 and 800 nm, respectively) occur on a relatively flat section of the DoLP wavelength dependence curve and match well in structure and variation. The Coulson data at 365 nm, however, are more depolarized than the imager data at the minimum wavelength of 450 nm. This is expected because of the rapid decline of DoLP as wavelength trends toward the UV.
As inferred by Coulson’s results, we also found that it is not the aerosol optical depth (AOD) that factored the most in the overall depolarization of skylight at the MLO under consistently low-aerosol conditions. Albedo of the underlying clouds beneath the observatory appears to have contributed more to a reduction in the DoLP for days of consistent AOD. Figure 6 illustrates this for two days of data collection, where on both days the overhead AOD at 700 nm was consistently near 0.03 to within 0.001 throughout the day. The top row shows two DoLP images taken on different days at 1000 Hawaiian Standard Time (HST), with the maximum DoLP band just beginning to exit the FOV of the instrument. Beneath these sky polarization images are two albedo images processed from images from the GOES-11
10 30 50 70 9050
55
60
65
70
75
80
85
90
Solar Elevation Angle, (Deg)
Max
imum
DoL
P, (%
)
Principal Plane Max DoLP Slices800 nm 2/19/77800 nm 3/09/77700 nm 5/23/2008450 nm 6/02/2008365 nm 3/09/77
400 500 600 700 800Wavelength, (nm)
Coulson 10° Elevation
Coulson 45° Elevation
MSU 10° Elevation
MSU 45° Elevation
DoLPWavelength Dependence
800 nm 2/19/1977
700 nm 5/23/2008
a) b)
Proc. of SPIE Vol. 7461 746107-6
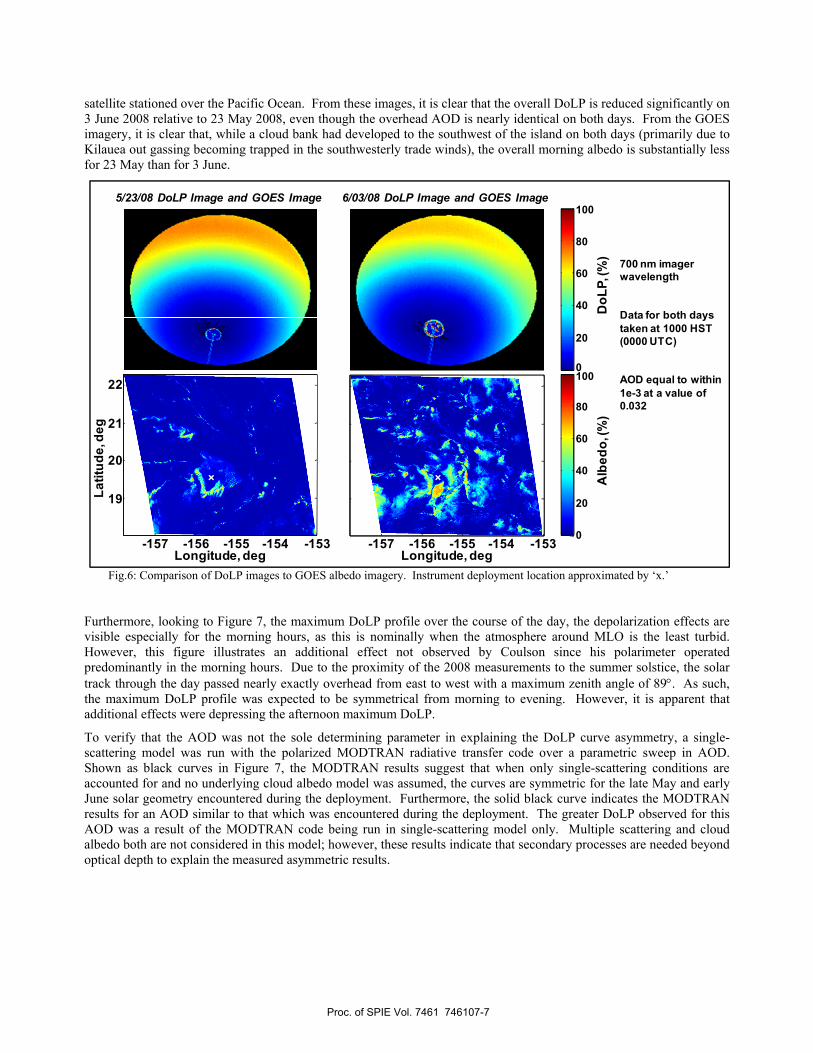
satellite stationed over the Pacific Ocean. From these images, it is clear that the overall DoLP is reduced significantly on 3 June 2008 relative to 23 May 2008, even though the overhead AOD is nearly identical on both days. From the GOES imagery, it is clear that, while a cloud bank had developed to the southwest of the island on both days (primarily due to Kilauea out gassing becoming trapped in the southwesterly trade winds), the overall morning albedo is substantially less for 23 May than for 3 June.
Fig.6: Comparison of DoLP images to GOES albedo imagery. Instrument deployment location approximated by ‘x.’
Furthermore, looking to Figure 7, the maximum DoLP profile over the course of the day, the depolarization effects are visible especially for the morning hours, as this is nominally when the atmosphere around MLO is the least turbid. However, this figure illustrates an additional effect not observed by Coulson since his polarimeter operated predominantly in the morning hours. Due to the proximity of the 2008 measurements to the summer solstice, the solar track through the day passed nearly exactly overhead from east to west with a maximum zenith angle of 89°. As such, the maximum DoLP profile was expected to be symmetrical from morning to evening. However, it is apparent that additional effects were depressing the afternoon maximum DoLP.
To verify that the AOD was not the sole determining parameter in explaining the DoLP curve asymmetry, a single-scattering model was run with the polarized MODTRAN radiative transfer code over a parametric sweep in AOD. Shown as black curves in Figure 7, the MODTRAN results suggest that when only single-scattering conditions are accounted for and no underlying cloud albedo model was assumed, the curves are symmetric for the late May and early June solar geometry encountered during the deployment. Furthermore, the solid black curve indicates the MODTRAN results for an AOD similar to that which was encountered during the deployment. The greater DoLP observed for this AOD was a result of the MODTRAN code being run in single-scattering model only. Multiple scattering and cloud albedo both are not considered in this model; however, these results indicate that secondary processes are needed beyond optical depth to explain the measured asymmetric results.
-157 -156 -155 -154 -153
19
20
21
Longitude, deg
Latit
ude,
deg
5/23/08 DoLP Image and GOES Image 6/03/08 DoLP Image and GOES Image
700 nm imager wavelength
Data for both days taken at 1000 HST (0000 UTC)
AOD equal to within 1e-3 at a value of 0.032
0
20
40
60
80
100
22
-157 -156 -155 -154 -153Longitude, deg
0
20
40
60
80
100
Alb
edo,
(%)
DoL
P, (%
)
Proc. of SPIE Vol. 7461 746107-7
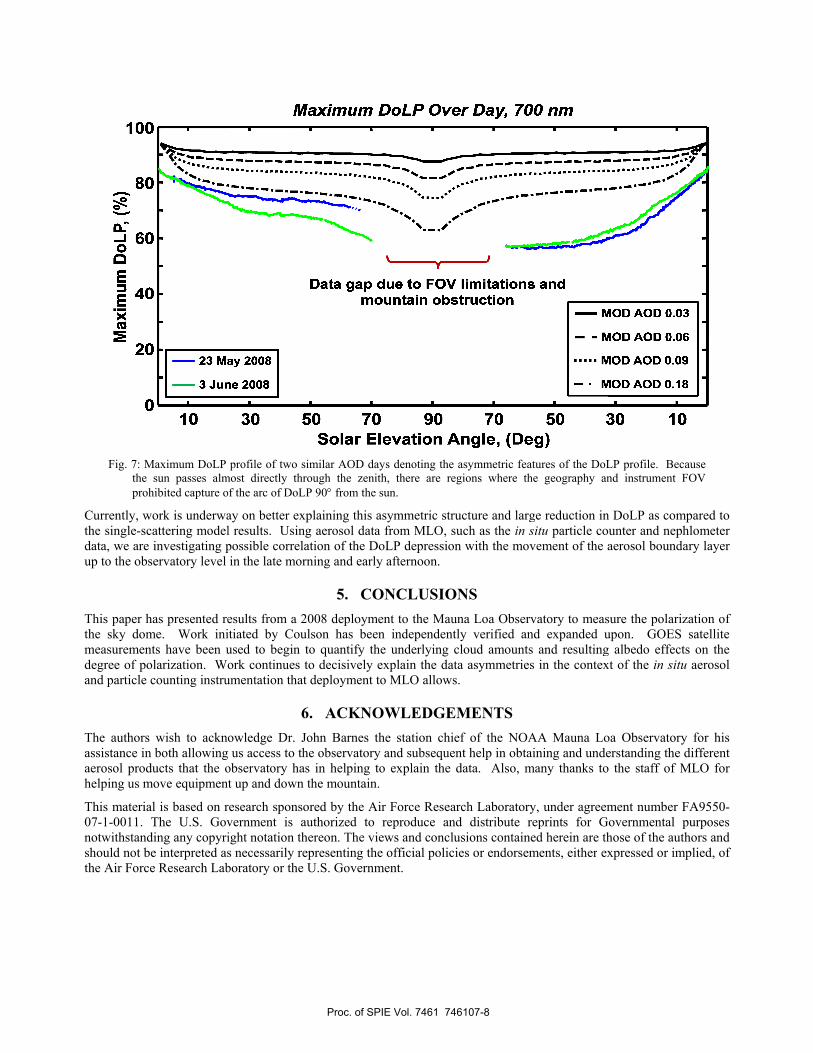
Fig. 7: Mthe proh
Currently, wthe single-scdata, we are up to the obs
This paper hthe sky dommeasurementdegree of poand particle c
The authors assistance in aerosol prodhelping us m
This materia07-1-0011. Tnotwithstandshould not bethe Air Force
Maximum DoLP sun passes alm
hibited capture o
ork is underwaattering modelinvestigating p
servatory level
has presented reme. Work inits have been u
olarization. Wocounting instru
wish to acknoboth allowing
ducts that the omove equipment
l is based on rThe U.S. Gov
ding any copyrie interpreted ase Research Lab
profile of two smost directly throf the arc of DoL
ay on better exl results. Usinpossible correlain the late mor
esults from a 2itiated by Couused to begin ork continues
umentation that
6owledge Dr. J us access to th
observatory hat up and down
research sponsovernment is aight notation ths necessarily reboratory or the
similar AOD dayrough the zenit
LP 90° from the s
xplaining this ang aerosol data ation of the Dorning and early
5. CO2008 deploymeulson has beento quantify thto decisively et deployment to
6. ACKNOJohn Barnes thhe observatoryas in helping to
the mountain.
ored by the Aiauthorized tohereon. The vieepresenting theU.S. Governm
ys denoting the th, there are resun.
asymmetric strufrom MLO, su
oLP depressiony afternoon.
ONCLUSIOent to the Maun independente underlying cexplain the dato MLO allows
OWLEDGEhe station chie
y and subsequeno explain the d
ir Force Researreproduce and
ews and conclue official policiment.
asymmetric featgions where th
ucture and larguch as the in sn with the mov
ONS una Loa Observtly verified ancloud amountsta asymmetriess.
MENTS ef of the NOAnt help in obtadata. Also, m
rch Laboratoryd distribute rusions containeies or endorsem
tures of the DoLhe geography an
ge reduction insitu particle covement of the a
vatory to measnd expanded us and resultings in the contex
AA Mauna Loining and unde
many thanks to
y, under agreemeprints for Ged herein are thments, either ex
LP profile. Becnd instrument F
n DoLP as comunter and nephaerosol bounda
sure the polarizupon. GOES g albedo effectxt of the in situ
oa Observatoryerstanding the do the staff of M
ment number Fovernmental phose of the authxpressed or im
ause FOV
mpared to hlometer ary layer
zation of satellite
ts on the u aerosol
y for his different
MLO for
FA9550-purposes hors and
mplied, of
Proc. of SPIE Vol. 7461 746107-8
7. REFERENCES [1] N. J. Pust and J. A. Shaw, "Dual-field imaging polarimeter using liquid crystal variable
retarders," Applied Optics, vol. 45, no. 22, pp. 5470-5478, 2006. [2] K. L. Coulson, Polarization and Intensity of Light in the Atmosphere. Hampton, VA: A. Deepak
Publishing, 1988. [3] J. E. Hansen and L. D. Travis, "Light scattering in planetary atmospheres," Space Science
Reviews, vol. 16, pp. 527-610, May 1974. [4] J. S. Tyo, D. L. Goldstein, D. B. Chenault, and J. A. Shaw, "Review of passive imaging
polarimetry for remote," Applied Optics, vol. 45, no. 22, Aug. 2006. [5] N. J. Pust and J. A. Shaw, "Digital all-sky polarization imaging of partly cloudy skies," Applied
Optics, pp. 190-198, Nov. 2008. [6] G. S. Smith, "The polarization of skylight: An example from nature," American Journal of
Physics, vol. 75, no. 1, pp. 25-35, Jan. 2007.
Proc. of SPIE Vol. 7461 746107-9