Bryophyte-Cyanobacteria Associations during Primary Succession in Recently Deglaciated Areas of...
14
Bryophyte-Cyanobacteria Associations during Primary Succession in Recently Deglaciated Areas of Tierra del Fuego (Chile) Marı ´a Arro ´ niz-Crespo 1,2 *, Sergio Pe ´ rez-Ortega 3 , Asuncio ´n De los Rı´os 3 , T. G. Allan Green 1,4 , Rau ´ l Ochoa- Hueso 5 , Miguel A ´ ngel Casermeiro 6 , Marı´a Teresa de la Cruz 6 , Ana Pintado 1 , David Palacios 7 , Ricardo Rozzi 8,9 , Niklas Tysklind 10 , Leopoldo G. Sancho 1 1 Dept. de Biologı ´a Vegetal II, Universidad Complutense de Madrid, Madrid, Spain, 2 School of Environment Natural Resources and Geography, Bangor University, Bangor, Wales, United Kingdom, 3 Dept. de Biologı ´a Ambiental, Museo Nacional de Ciencias Naturales, MNCN-CSIC, Madrid, Spain, 4 Biological Sciences, Waikato University, Hamilton, New Zealand, 5 Dept. de Biogeografı ´a y Cambio Global, Museo Nacional de Ciencias Naturales, Madrid, Spain, 6 Departamento Edafologı ´a, Universidad Complutense de Madrid, Madrid, Spain, 7 Departamento Geografı ´a Fı ´sica, Universidad Complutense de Madrid, Madrid, Spain, 8 Sub-Antarctic Biocultural Conservation Program, University of North Texas, Denton, Texas, United States of America, 9 Institute of Ecology and Biodiversity, Universidad de Magallanes, Puerto Williams, Chile, 10 School of Biological Sciences, Bangor University, Bangor, Wales, United Kingdom Abstract Bryophyte establishment represents a positive feedback process that enhances soil development in newly exposed terrain. Further, biological nitrogen (N) fixation by cyanobacteria in association with mosses can be an important supply of N to terrestrial ecosystems, however the role of these associations during post-glacial primary succession is not yet fully understood. Here, we analyzed chronosequences in front of two receding glaciers with contrasting climatic conditions (wetter vs drier) at Cordillera Darwin (Tierra del Fuego) and found that most mosses had the capacity to support an epiphytic flora of cyanobacteria and exhibited high rates of N 2 fixation. Pioneer moss-cyanobacteria associations showed the highest N 2 fixation rates (4.60 and 4.96 mgNg 21 bryo. d 21 ) very early after glacier retreat (4 and 7 years) which may help accelerate soil development under wetter conditions. In drier climate, N 2 fixation on bryophyte-cyanobacteria associations was also high (0.94 and 1.42 mgNg 21 bryo. d 21 ) but peaked at intermediate-aged sites (26 and 66 years). N 2 fixation capacity on bryophytes was primarily driven by epiphytic cyanobacteria abundance rather than community composition. Most liverworts showed low colonization and N 2 fixation rates, and mosses did not exhibit consistent differences across life forms and habitat (saxicolous vs terricolous). We also found a clear relationship between cyanobacteria genera and the stages of ecological succession, but no relationship was found with host species identity. Glacier forelands in Tierra del Fuego show fast rates of soil transformation which imply large quantities of N inputs. Our results highlight the potential contribution of bryophyte-cyanobacteria associations to N accumulation during post-glacial primary succession and further describe the factors that drive N 2 -fixation rates in post-glacial areas with very low N deposition. Citation: Arro ´niz-Crespo M, Perez-Ortega S, De los Rı ´ ´os A, Green TGA, Ochoa-Hueso R, etal. (2014) Bryophyte-Cyanobacteria Associations during Primary Succession in Recently Deglaciated Areas of Tierra del Fuego (Chile). PLoS ONE 9(5): e96081. doi:10.1371/journal.pone.0096081 Editor: Han Y.H. Chen, Lakehead University, Canada Received November 13, 2013; Accepted April 2, 2014; Published May 12, 2014 Copyright: ß 2014 Arro ´ niz-Crespo et al. This is an open-access article distributed under the terms of the Creative Commons Attribution License, which permits unrestricted use, distribution, and reproduction in any medium, provided the original author and source are credited. Funding: This work was funded by the Ministerio de Ciencia e Innovacio ´ n of Spain (Projects CTM2009-12838-C04-01 and CTM2009-12838-C04-03). SPO is supported by the grant CTM2012-38222-C02-02 from the Spanish Ministry of Economy and Competitiveness. The authors are grateful to the Universidad de Magallanes (UMAG) and the Institute of Ecology and Biodiversity (IEB-Chile, grants P05-002 ICM and CONICYT PFB-23) for logistic and scientific support. The funders had no role in study design, data collection and analysis, decision to publish, or preparation of the manuscript. Competing Interests: The authors have declared that no competing interests exist. * E-mail: [email protected] Introduction Cryptogamic covers account for nearly half of the biological nitrogen (N) fixation on land [1], representing an important supply of N to terrestrial ecosystems. In particular, dinitrogen (N 2 ) fixation by cyanobacteria-moss associations has been found to contribute significantly to the N economy in high-latitude ecosystems [2–6] where it can represent the main source of new N [7–10]. For example, moss-associated cyanobacteria can provide 2–58% of the N input to Arctic ecosystems and in Antarctica the percentage can reach up to 84% [11]. In boreal forests, up to 60% of N can come from N 2 -fixation in mosses [12]. In early primary succession, however, the role of cyanobacteria- moss associations on N inputs has received considerably less attention, despite bryophytes being often the first plants to colonize newly exposed terrain [13]. The lack of studies is particularly marked in temperate and subpolar regions of the Southern Hemisphere, where bryophytes account for more than 50% of the plant species [14]. Rates of N 2 fixation in moss associated with cyanobacteria can be highly variable. Previous studies in the 1980s and early 1990s have shown that N 2 fixation varies greatly among bryophyte species [8,15–17] which may be due to differences in the microhabitat characteristics where the mosses grow [2]. Moderate increases in temperature leads to a general increase in N 2 fixation [18] whereas shading [19] and N fertilization (e.g. atmospheric N PLOS ONE | www.plosone.org 1 May 2014 | Volume 9 | Issue 5 | e96081
Transcript of Bryophyte-Cyanobacteria Associations during Primary Succession in Recently Deglaciated Areas of...

Bryophyte-Cyanobacteria Associations during PrimarySuccession in Recently Deglaciated Areas of Tierra delFuego (Chile)Marıa Arroniz-Crespo1,2*, Sergio Perez-Ortega3, Asuncion De los Rıos3, T. G. Allan Green1,4, Raul Ochoa-
Hueso5, Miguel Angel Casermeiro6, Marıa Teresa de la Cruz6, Ana Pintado1, David Palacios7,
Ricardo Rozzi8,9, Niklas Tysklind10, Leopoldo G. Sancho1
1 Dept. de Biologıa Vegetal II, Universidad Complutense de Madrid, Madrid, Spain, 2 School of Environment Natural Resources and Geography, Bangor University, Bangor,
Wales, United Kingdom, 3 Dept. de Biologıa Ambiental, Museo Nacional de Ciencias Naturales, MNCN-CSIC, Madrid, Spain, 4 Biological Sciences, Waikato University,
Hamilton, New Zealand, 5 Dept. de Biogeografıa y Cambio Global, Museo Nacional de Ciencias Naturales, Madrid, Spain, 6 Departamento Edafologıa, Universidad
Complutense de Madrid, Madrid, Spain, 7 Departamento Geografıa Fısica, Universidad Complutense de Madrid, Madrid, Spain, 8 Sub-Antarctic Biocultural Conservation
Program, University of North Texas, Denton, Texas, United States of America, 9 Institute of Ecology and Biodiversity, Universidad de Magallanes, Puerto Williams, Chile,
10 School of Biological Sciences, Bangor University, Bangor, Wales, United Kingdom
Abstract
Bryophyte establishment represents a positive feedback process that enhances soil development in newly exposed terrain.Further, biological nitrogen (N) fixation by cyanobacteria in association with mosses can be an important supply of N toterrestrial ecosystems, however the role of these associations during post-glacial primary succession is not yet fullyunderstood. Here, we analyzed chronosequences in front of two receding glaciers with contrasting climatic conditions(wetter vs drier) at Cordillera Darwin (Tierra del Fuego) and found that most mosses had the capacity to support anepiphytic flora of cyanobacteria and exhibited high rates of N2 fixation. Pioneer moss-cyanobacteria associations showedthe highest N2 fixation rates (4.60 and 4.96 mg N g21 bryo. d21) very early after glacier retreat (4 and 7 years) which may helpaccelerate soil development under wetter conditions. In drier climate, N2 fixation on bryophyte-cyanobacteria associationswas also high (0.94 and 1.42 mg N g21 bryo. d21) but peaked at intermediate-aged sites (26 and 66 years). N2 fixationcapacity on bryophytes was primarily driven by epiphytic cyanobacteria abundance rather than community composition.Most liverworts showed low colonization and N2 fixation rates, and mosses did not exhibit consistent differences across lifeforms and habitat (saxicolous vs terricolous). We also found a clear relationship between cyanobacteria genera and thestages of ecological succession, but no relationship was found with host species identity. Glacier forelands in Tierra delFuego show fast rates of soil transformation which imply large quantities of N inputs. Our results highlight the potentialcontribution of bryophyte-cyanobacteria associations to N accumulation during post-glacial primary succession and furtherdescribe the factors that drive N2-fixation rates in post-glacial areas with very low N deposition.
Citation: Arroniz-Crespo M, Perez-Ortega S, De los Rı´ ´os A, Green TGA, Ochoa-Hueso R, etal. (2014) Bryophyte-Cyanobacteria Associations during Primary Succession in Recently Deglaciated Areas of Tierra del Fuego (Chile). PLoS ONE 9(5): e96081. doi:10.1371/journal.pone.0096081
Editor: Han Y.H. Chen, Lakehead University, Canada
Received November 13, 2013; Accepted April 2, 2014; Published May 12, 2014
Copyright: � 2014 Arroniz-Crespo et al. This is an open-access article distributed under the terms of the Creative Commons Attribution License, which permitsunrestricted use, distribution, and reproduction in any medium, provided the original author and source are credited.
Funding: This work was funded by the Ministerio de Ciencia e Innovacion of Spain (Projects CTM2009-12838-C04-01 and CTM2009-12838-C04-03). SPO issupported by the grant CTM2012-38222-C02-02 from the Spanish Ministry of Economy and Competitiveness. The authors are grateful to the Universidad deMagallanes (UMAG) and the Institute of Ecology and Biodiversity (IEB-Chile, grants P05-002 ICM and CONICYT PFB-23) for logistic and scientific support. Thefunders had no role in study design, data collection and analysis, decision to publish, or preparation of the manuscript.
Competing Interests: The authors have declared that no competing interests exist.
* E-mail: [email protected]
Introduction
Cryptogamic covers account for nearly half of the biological
nitrogen (N) fixation on land [1], representing an important supply
of N to terrestrial ecosystems. In particular, dinitrogen (N2)
fixation by cyanobacteria-moss associations has been found to
contribute significantly to the N economy in high-latitude
ecosystems [2–6] where it can represent the main source of new
N [7–10]. For example, moss-associated cyanobacteria can
provide 2–58% of the N input to Arctic ecosystems and in
Antarctica the percentage can reach up to 84% [11]. In boreal
forests, up to 60% of N can come from N2-fixation in mosses [12].
In early primary succession, however, the role of cyanobacteria-
moss associations on N inputs has received considerably less
attention, despite bryophytes being often the first plants to colonize
newly exposed terrain [13]. The lack of studies is particularly
marked in temperate and subpolar regions of the Southern
Hemisphere, where bryophytes account for more than 50% of the
plant species [14].
Rates of N2 fixation in moss associated with cyanobacteria can
be highly variable. Previous studies in the 1980s and early 1990s
have shown that N2 fixation varies greatly among bryophyte
species [8,15–17] which may be due to differences in the
microhabitat characteristics where the mosses grow [2]. Moderate
increases in temperature leads to a general increase in N2 fixation
[18] whereas shading [19] and N fertilization (e.g. atmospheric N
PLOS ONE | www.plosone.org 1 May 2014 | Volume 9 | Issue 5 | e96081

deposition or throughfall) results in reduced rates of N2 fixation in
these associations [4,12]. Moisture is also considered a major
environmental factor influencing N2-fixation on moss-cyanobac-
teria associations, with a positive relationship between water
availability and N-fixation rates [3,20]. The diversity and density
of cyanobacteria species associated with mosses have also been
described as important factors explaining the variability in N2
fixation rates [21,22]. However, little is still known about the
existence of species-specific association between bryophyte and
cyanobacteria species [23], although some studies have shown that
host species identity could be a stronger driver of epiphytic
cyanobacteria diversity and composition [22]. While these studies
have already started to elucidate the factors that drive N2-fixation
rates, the influence of bryophyte-cyanobacteria associations on the
biogeochemical cycling of N and, in particular, during early
primary succession still needs further assessment.
In Tierra del Fuego, glacial retreat has been occurring since the
end of the Little Ice Age (around 1750 to 1850) [24], exposing new
terrain for ecosystem development by the process of primary
succession. Glacier forelands are typically nutrient-poor [25].
However, our preliminary studies at the Cordillera Darwin (Tierra
del Fuego) found rapid rates of vegetation growth and quick
succession to stages dominated by Nothofagus tree species [26].
These tree-dominated stages were present on the southern side of
the mountain range after 34 years of soil surface exposure [26],
compared to 80 years on the northern side of the mountain range
(Palacios et al., unpublished). As inputs of N through atmospheric
deposition are very low in such high latitude region, possibly ,
0.7 kg N ha21 yr21 [27], biological fixation can greatly exceed
bulk precipitation. For example, biological N fixation inputs from
bryophytes during early succession, e.g. [28] reached 22 kg N ha21
yr21 in a New Zealand glacier foreland. Therefore, we considered
that N2 fixation and its interaction with other biotic and abiotic
factors could be a key driver of early plant succession in recently
deglaciated areas of Tierra del Fuego. The combination of three
attributes: 1) the difference in the speed of ecological succession
found between the two glaciers on southern and northern slopes; 2)
the strong climatic gradients characteristic of this area: with high
rates of precipitation on the southwestern side and dry conditions on
the northern side of the mountain range [29]; and 3) the low rates of
anthropogenic N deposition, make the Cordillera Darwin an unique
site to further elucidate the potential drivers of N2 fixation rates on
bryophyte-cyanobacteria associations and its impact on C and N
accumulation during post-glacial primary succession.
Specifically, we aimed to evaluate the role of bryophyte-
cyanobacteria associations during post-glacial primary succession
because (i) moss establishment is a positive feedback process that
enhance N inputs in newly exposed terrain [13] and (ii) moss-
associated cyanobacteria can be an important contributor to N inputs
through the process of N2 fixation [28,30]. Our aims were (1) to
describe how soil properties and N2 fixation related parameters
change along two pro-glacial chronosequences at the Cordillera
Darwin (Tierra del Fuego), (2) how species identity (both bryophytes
and cyanobacteria), climatic conditions (wetter sv. drier), and the stage
of ecological succession, influence N2 fixation rates of bryophyte-
cyanobacteria associations, and thereby ecosystem N accumulation,
and (3) whether any of these associations are species specific.
Materials and Methods
Ethics StatementThe Chilean National Forestry Corporation (CONAF) issued
the scientific collecting permit for each location considered in this
study. This study did not involve endangered or protected species.
Site description and chronosequence establishmentThe study area is located at the Cordillera Darwin in the
southwestern part of Tierra del Fuego (Chile) (Fig. 1a). Around
80% of the mountain range is glaciated. One glacier was selected
on each side of the mountain range for the present study; both
glaciers have been receding steadily for several decades and
present a well-defined sequence of moraine bands. The south-side
glacier, SG (Pia Glacier, 54u469S 69u409W) flows into the east arm
of Bahia Pia; plant succession goes from bare ground to full forest
(stage of succession dominated by Nothofagus spp. .10 m high) in
34 years [26]. At the north-side glacier, NG (Parry Glacier,
54u419S 69u239W) the succession is slower and the equivalent
stage of succession dominated by Nothofagus appears after 80 years
of soil exposure (Palacios et al., unpublished data). A characteristic
feature of the area is the steep meteorological gradients across the
Cordillera Darwin with heavy precipitation and solid cloud cover
being typical over the southern and western fjords, whilst to the
north and east conditions are much drier [29]. This results in a
stark contrast in annual precipitation between both glaciers.
Precipitation rates where SG flows, Bahia Pia (1600 mm) are twice
as high as at where NG flows, Seno Almirantazgo fjord (800 mm)
[29]. Mean annual air temperature, however, is relatively constant
over the entire region, with only a slight drop from 5.9uC at Punta
Arenas to 4.5uC at Bahia Pia [31].
The chronosequence in each glacier has been established by
using several independent techniques to date surfaces: aerial
photographs, dendrochronology, (sampling tree rings), and
lichenometry (dating of rock surface from lichens growth) utilizing
the growth rate and thallus size of the lichen Rhizocarpon
geographicum (L.) DC [26].
Forest vegetation in the area consists of Nothofagus antarctica (G.
Forst.) Oerst., and N. betuloides (Mirb.) as dominant tree species.
After glacier retreat, the successional sequence at NG is
characterized by pioneer lichens (Placopsis perrugosa (Nyl.) Nyl.,
Rhizocarpon geographicum (L.) DC., Xanthoria candelaria (L.) Th. Fr.)
and mosses (Dendroligotrichum squamosum (Hook. f. & Wilson) Cardot
and Andreaea spp.), followed by dwarf shrubs (Empetrum rubrum
Wahl. Ex Willd., Gaultheria mucronata (L. f.) Hook. & Arn.),
perennial herbs (Gunnera magellanica Lam) and moss (Racomitrium
spp.) vegetation assemblage. At SG the successional sequence goes
from pioneer lichen (same species as in NG plus Placopsis stenophylla
(Hue) I.M. Lamb and Placopsis pycnotheca I.M. Lamb) and the moss
Ditrichum cylindricarpum (Mull. Hal.) F. Muell, followed by perennial
herbs vegetation assemblage (Gunnera magellanica Lam and Uncinia
tenuis Poepp. ex Kunth) and the development of Nothofagus spp.
forest (Fig. 1b).
Sample collection and transportField work took place in 2009 during the summer season which
corresponds to the active period for N2 fixation at high southern
latitudes [32]. Sampling sites were established at increasing surface
ages in front of both glaciers. There were six sites at SG with
surface ages of 1, 4, 7, 10, 19 and 34 yrs and six sites at NG with
surface ages of 5, 18, 20, 26, 66 and 80 yrs. At both glaciers, the
younger site corresponds to bare ground close to the glacier front
whereas the older site was covered within Nothofagus forests. Three
transects were randomly established along the chronosequence in
each glacier foreland and one independent sample was collected in
each transect per site (surface age) so that there were three
replicates per surface age for soil, each bryophyte species and
cyanobacteria measurements.
Soil sampling. 200 g of soil samples were collected using the
core method, samples were collected from the upper 0–4 cm of the
soil. Samples were placed into, and sealed in, suitably sized plastic
N2-Fixation in Bryophytes from Deglaciated Areas
PLOS ONE | www.plosone.org 2 May 2014 | Volume 9 | Issue 5 | e96081

bags. Collected samples were immediately frozen at 220uC and
returned frozen to the Universidad Complutense de Madrid for
soil characterization.
Bryophyte sampling. The dominant bryophyte species at
each site (surface age) along the chronosequence were collected. In
total 16 bryophyte species (including both mosses and liverworts)
with varying morphologies, life forms and habitats (saxicolous and
terricolous species) were selected. These included 10 mosses
Dendroligotrichum squamosum (Hook. f. & Wilson) Cardot, Andreaea
laxifolia (Hook. f. & Wilson), A. alpina (Hedw.), Acroschisma wilsonii
(Hook. f.) A. Jaeger, Racomitrium didymum (Mont.) Lorentz, R.
laevigatum (A. Jaeger), R. lanuginosum (Schimp. ex R.S. Williams), R.
Figure 1. Study area and chronosequence description. (a) Map of the study area at the Cordillera Darwin in the southwestern part of Tierra delFuego (Chile) showing the location of the south-side (SG) and north-side (NG) glaciers on each side of the mountain range. (b) Four representativesites along north-side glacier and south-side glacier chronosequences at Cordillera Darwin. At both glaciers, the younger site corresponds to bareground close to the glacier front whereas the older site was covered within Nothofagus forests. Years since deglaciation per site are included in thepicture.doi:10.1371/journal.pone.0096081.g001
N2-Fixation in Bryophytes from Deglaciated Areas
PLOS ONE | www.plosone.org 3 May 2014 | Volume 9 | Issue 5 | e96081

subcrispipilum (Mull.Hal.) A. Jaeger, Dicranoloma chilense (De Not.)
Ochyra & Matteri and Ditrichum cylindricarpum (Mull. Hal.) F.
Muell; and 6 leafy liverworts Cryptochila grandiflora (Lindenb. &
Gott.) Grolle, Heteroscyphus magellanicus (Steph.) Engel & Schust.,
Blepharidophyllum densifolium (Hook.) Angstrom ex C. Massal.,
Anastrophyllum involutifolium, Clasmatocolea humilis (Hook. f. & Tayl.)
Grolle and Chiloscyphus leptanthus (Hook. f. & Tayl.) Engel & Schust.
Eight species were sampled at more than one site and the other
eight were sampled at a single site on the chronosequence. A full
description of bryophyte species sampled by site are shown in
(Table S1). Monospecific patches of fresh bryophytes species were
collected, air dried and sent to the Universidad Complutense de
Madrid in paper bags for analysis that included: (1) rates of N2
fixation, (2) quantification of the abundance of epiphytic
cyanobacteria, and (3) abundance of stable isotopes (14N and15N) and shoot N and C contents.
Cyanobacteria sampling. The diversity and distribution of
cyanobacteria associated with bryophytes at each site (surface age)
was determined by molecular analysis. A second set of bryophyte
samples (around 10 shoots per species) were collected in the same
bryophyte patches described above. Collectors used disposable
laboratory latex gloves when taking samples. Samples were placed
into, and sealed in suitably sized plastic bags. Collected samples
were immediately frozen at 220uC and returned frozen to the
Museo Nacional de Ciencias Naturales in Madrid (CSIC) where
DNA from epiphytic cyanobacteria was extracted and analysed.
Soil chemical propertiesSamples were stored at 220uC. Soils were air-dried, sieved (,
2 mm) homogenized before conducting the following analysis:
Soil pH. Soil pH was measured in water suspension (soil:-
water, 1:2.5) [33].
Total soil N (TN) and total soil carbon (TC) were
analysed in an autoanalyser system LECO CNS 2000I.
Soil extractable nitrogen. Soil nitrate (NO3-N) and nitrite
(NO2-N) were extracted by shaking soil aliquots (30 g DW) in (1:5)
water [33], filtered and analysed by ionic chromatography
Metrohm 761 compact IC. Ammonium (NH4-N) was extracted
by shaking 10 g of soil in 50 ml of 0.5 M K2SO4 for 30 min,
filtered and colorimetrically assessed [34].
Nitrogen-fixation measurementsPrior to N2-fixation measurements, all bryophyte samples were
reactivated for 48 h in a growth chamber, photosynthetic photon
flux density (PPFD) of 100 mmol m22 s21 over the waveband 400–
700 nm, 10uC, with a 18 : 6 h phototoperiod (light : dark) and
maintained hydrated to ensure recovery (confirmed by chlorophyll
fluorescence, data not shown). N2-fixation rates of bryophyte-
cyanobacteria associations were estimated under controlled
conditions using the acetylene reduction assay (ARA) [35].
Revitalized shoot apices (around 10–15 shoots or 0.07–0.20 dry
weight basis) were placed into 10 ml glass incubation vessels and
sealed with a rubber septum. 1 ml of headspace was removed and
replaced by 1 ml of acetylene (generated from CaC2 and water),
resulting in headspace enrichments of 10–20% (enrichment was
determined individually for each species allowing for the different
vial headspaces, see in (Appendix S1). Four samples were
randomly chosen as control samples and were treated in the same
manner except for the headspace substitution; another set of four
samples with deionized water and acetylene was used as blank
samples to assess the concentration of ethylene in the acetylene
used. All incubation vessels were placed in a growth chamber
(200 mmol m22 s21 PAR, 10uC) and incubation took 18 h. Before
incubation, acetylene reduction was demonstrated to be linear
over an 18-h period in 10 samples with known different
cyanobacteria abundance (data not shown). Ethylene resulting
from the reducing activity was measured by gas chromatography.
N2-fixation rates were calculated as nanomoles of acetylene
reduced per gram bryophyte dry weight per hour (nmol C2H2
g21 dw h21). Theoretical stoichiometric ratio of acetylene to
nitrogen (3:1) is recommended to be corrected by parallel uptake
of labelled 15N2 for each organism and also, possibly, for location
[36,37]. Thus, to estimate N2 fixation rates (15N2 uptake),
consecutive incubations of the same samples with 15N2 after
ARA was performed following [9]. 2 ml of headspace were
replaced by 2 ml 15N2 gas (98 atom % 15N enriched), resulting in
headspace enrichments of 20–30% and, after 18 h incubation at
the same conditions as ARA, samples, were immediately oven
dried (60uC for 48 h), ground in a ball mill and sent for 15N
enrichment and total N analysis (UCDavis Stable Isotope Facility,
University of California, Davis, USA). Three control samples for
each bryophyte-cyanobacteria association were used to determine
the natural abundance 15N. The amount of N fixed was calculated
according to [6,38]. N2-fixation rates were calculated as micro-
grams of 15N incorporated per hour per gram of bryophyte on a
dry weight basis and expressed as micrograms of fixed N per day
(mg N g21 dw bryophyte d21).
ARA was highly correlated with 15N2 uptake (N = 89, R2 = 0.689
P,0.001). ARA measurements were used to compare N2 fixation
rates between taxa and rates reported by other authors. 15N2
uptake was used to evaluate the potential impact of N2 fixation on
ecosystem nitrogen (N) accumulation.
Stable isotope analysis and shoot N and C contentAll isotopic analyses were conducted at the UCDavis Stable
Isotope Facility, Department of Plant Sciences, University of
California, Davis, USA. d15N analyses were performed by
elemental analyser/continuous flow isotope ratio mass spectrom-
etry using a ANCA-GSL elemental analyser interfaced coupled
with a PDZ Europa 20-20 isotope ratio mass spectrometer.
Atom% was calculated from d15N values. Total tissue C and N
was also analysed.
Cyanobacteria abundance, composition andphylogenetic analysis
Cyanobacteria abundance by HPLC analysis of
echinenone. Bryophyte samples (,3–10 cm2 of fresh tissue
per sample depending on the species) were deep-frozen until
pigment analyses. Pigments were extracted in 95% cool acetone in
the presence of sodium ascorbate. Echinenone (a cyanobacterial
pigment used as a proxy of cyanobacteria abundance) was
separated by HPLC according to the method of [39] slightly
modified. After passing through a 0.45 mm nylon filter, 25 mL of
the extract was injected into a C18 column. The mobile phase rate
was 1.2 mL min21 and the elution time lasted 30 min. Solvents for
HPLC analysis were degassed before use by bubbling helium. The
HPLC system was equipped with a photodiode array detector. For
peak identification and quantification, a pure commercial standard
was used. The relative abundance of cyanobacteria was expressed
as the amount of echinenone on a bryophyte surface area basis
(nmol echinenone/cm2 bryophyte). Digital pictures of each sample
were taken before freezing and the surface area of each sample was
calculated using a image analysis program.
DNA extraction and polymerase chain reaction (PCR),
denaturing gradient gel electrophoresis (DGGE). For
cyanobacteria DNA extraction, bryophyte samples (around
200 mg dry weight) were introduced into 15 ml falcon tubes with
distilled water and vigorously shaken (maximum speed) for 10
N2-Fixation in Bryophytes from Deglaciated Areas
PLOS ONE | www.plosone.org 4 May 2014 | Volume 9 | Issue 5 | e96081
minutes in a vortex using a falcon tube adapter to release the
epiphytic cyanobacteria from bryophytes. The extracted cyano-
bacteria contained in the water were removed with a 5 ml pipette
and cells were concentrated by centrifugation in an ultracentrifuge
at 3000 rpm for 5 min. The concentrated cyanobacteria cells were
used for DNA extraction.
Denaturing gradient gel electrophoresis (DGGE) of cyanobac-
terial PCR-amplified 16S rRNA gene fragments was used to
survey the genetic diversity of isolated epiphytic cyanobacteria.
Total genomic DNA for DGGE analysis was extracted in three
replicates from the cyanobacteria isolates samples using CTAB
extraction method described in [40]. A fragment of the
cyanobacterial 16S rRNA gene suitable for DGGE analysis was
amplified in each sample from total genomic DNA using the
following primer pair: CYA359fGC and CY781r [41]. Each 25 ml
volume of PCR mix [75 mM Tris pH 9.0/50 mM KCl/20 mM
(NH4)2SO4] contained 1 unit of Taq polymerase, 0.2 mM of each
of the four dNTPs, 0.4 mM of each primer, 100 mg of bovine
serum albumin, 1.5 mM of MgCl2, 5 ml de 5xTaq Master PCR
enhancer (Prime) and ca 10–50 ng genomic DNA. Annealing
conditions were 60uC. The DGGE system was used for the
analysis of cyanobacterial fragments of 16S rRNA gene according
to the manufacturer’s instructions). Acrylamide gels (6%) with a 30
to 60% urea-formamide denaturing gradient were prepared.
Lanes were loaded with 22 ml of PCR product, run at a constant
200 V for 7 h at 60uC, and EtBr stained to visualize and
photograph the resultant bands according to [42]. The most
predominant bands were excised and incubated 1 h at 60uC in
water before PCR amplification. The eluted DNA was reamplified
as described above but using primers devoiding the GC clamp.
The PCR products were cleaned on Quick Spin columns. Both
complementary strands were sequenced separately at the
MACROGEN sequencing company.
For sequence analysis, we obtained closely related sequences
with known taxonomy using Blast searches in Gen Bank. Later,
sequences obtained from DGGE bands were reduced to OTUs in
mothur v.1.28 [43] using a cutoff of 0.01% [44]. A reference
sequence for each OTU was chosen for subsequent analysis by
means of the command get.outrep in mothur v.1.28. 20 sequences
corresponding to each of the 0.01% cut-off OTUs were aligned
with a total of 29 sequences retrieved from the GenBank (Table
S2). Alignment of all sequences were carried out in Muscle 3.8.31
[45] and visually checked in Bioedit 7.0.5.2 [46]. Nucleotide
substitution model was statistically selected with the help of
jModelTest [47], program available at http://darwin.uvigo.es).
Model selection was made according to the Akaike9s information
criterion (AIC, [48]; the General Time Reversible substitution
model [49], with estimation assuming a gamma distribution
(GTR+G) had the lowest –lnL value. Phylogenetic relationships
among OTUs and sequences with known taxonomy were studied
by means of Maximum Likelihood (ML) and Bayesian phyloge-
netic inference. ML analysis were carried out in PHYML 3.0 [50]
through the webserver http://www.atgc-montpellier.fr/phyml/
using 1,000 bootstrap repetitions in order to assess node support.
Bayesian analyses were carried out in Mr. Bayes 3.1.2 [51]
running eight different chains and 5,000K generations. 50%
majority rule consensus tree is shown in (Fig. 2).
Sequences generated in this study were deposited in GenBank
under accession numbers KJ576732-KJ576783.
Statistical and data analysesWe calculated the Shannon index (H9 = -S (ni/N) ln (ni/N) [52],
where ni is the number of times we found each ith OTU and N is
the total number of unique OTUs (N = 20) found in the study area,
in order to evaluate changes in diversity of epiphytic cyanobacteria
along the chronosequence (H9site) and between bryophytes species
(H9species).
To be able to compare parameters between glacier chronose-
quences with different sampling site ages we first tested if the
different stages of ecological succession, identified by the soil
development transformation trends observed along the chronose-
quence, were comparable between the two glacier chronose-
quences; we used TC, TN and soil pH as descriptors of soil
development status at each site and extracted one general factor
component of soil development using principal component
analysis [53]. The resulting scores were tested with two-way
ANOVA to detect differences on the stage of ecological succession
along the chronosequence and between glaciers, with sampling
sites (0 to 5) and glacier location (north sv. south) as fixed factors.
These analyses indicated that the two chronosequences were
comparable despite the different absolute soil ages where the
samples were collected (Fig. S1). Differences between glaciers on
soil chemical properties, N2-fixation rates (15N2 uptake), abun-
dance of epiphytic cyanobacteria, and C : N ratio in bryophyte
tissue were then tested with two-way ANOVAs. All data were
tested for homoscedasticity (Levene’s test for equal variances) and
normality (IBM SPSS statistics, Armonk NY, USA). When data
did not meet these assumptions, they were rank or Log10 +1
transformed prior to statistical analyses. Analyses were carried out
with IBM SPSS Statistics 19 (IBM SPSS statistics, Armonk NY,
USA).
A fundamental assumption about chronosequences is that the
communities and ecosystems of the younger sites are developing in
the same temporal sequence as the older sites developed (termed a
space-for-time substitution). At any location on the chronose-
quence the vegetation present represents what will eventually form
on younger sites and which will, itself, change to that found on the
older sites present. As such, the assumption of independence is
violated. We used non-parametric Krukall-Wallis test to evaluate
changes of parameters measured at the different stages of
ecological succession (mean values per site) along each glacier
chronosequence separately, using stage of ecological succession
(sampling site) as the grouping factor. When significant differences
were found, Mann–Whitney U-test post hoc tests were run to
detect differences between sites. Bonferroni’s correction was used
to determine the level of significance of the post hoc tests.
At species level, we used conditional inference trees (CTREE)
[54] to assess and visualise the relative importance of bryophyte
species identity (species effect), climatic conditions (glacier location:
north sv. south), and stage of ecological succession (sampling site
effect) in determining N2 fixation capacity and cyanobacteria
abundance on bryophytes. CTREE work by first testing the null
hypothesis of independence between the predictors (here bryo-
phyte species, glacier and site) and response variable (here N2
fixation and cyanobacteria abundance); if dependence is found,
then determining the best split value for the predictor with the
strongest effect on the response; and third, repeating the first two
steps with each branch until independence cannot be rejected.
Relationships are represented as dichotomous trees with nodes
indicating split points for significant predictor variables, and
terminal nodes for the final groups of responses. Being nonpara-
metric, CTREE make no assumptions about the data, and are
appropriate where nonlinear relationships between predictive and
response variables and complex interactions between variables,
such as covariance, may be expected [54]. CTREE were
constructed in R 3.0.1 (R Development Core Team, 2013) with
the package PARTY [55], with 10,000 resamples of Bonferroni-
adjusted a= 0.05 significance levels and with at least one
N2-Fixation in Bryophytes from Deglaciated Areas
PLOS ONE | www.plosone.org 5 May 2014 | Volume 9 | Issue 5 | e96081

observation into each daughter node. N2 fixation and cyanobac-
teria abundance data were log +1 transformed and site included as
an ordered categorical variable.
Linear regression analysis was used to evaluate whether
abundance of epiphytic cyanobacteria or its diversity on host
bryophyte (H9species) had a larger influence on the rate of N2
fixation.
Correspondence analysis in each glacier separately were used to
graphically examine the relationships between OTUs of cyano-
bacteria and the different stages of ecological succession and also
to detect selectivity associations between cyanobacteria OTUs and
bryophyte species (6 species with cyanobacteria colonies sampled
at more than one site were used in this analyses). Analysis were
carried out in R 3.0.1 (R Development Core Team, 2013) using
the package ca [56].
Results
Genetic diversity of isolated epiphytic cyanobacteriaA total of 52 bands (18 from NG and 34 from SG) were
recovered from DGGE analyses and subsequently sequenced,
producing 28 unique sequences. After their collapse into OTUs
(0.01% cutoff), 20 cyanobacteria putative taxa were obtained. The
phylogenetic analysis of the relationships between these OTUs and
sequences with known taxonomy obtained from the GenBank is
depicted in Fig. 2. Seven 0.01% cutoff OTUs could be assigned to
the species aggregate Nostoc commune. Six OTUs (5, 7, 9, 12, 15, 17)
were assigned to unidentified Nostocaeae because no clear
relationship was found in the phylogenetic tree with any certain
genus. A similar case is presented for OTUs 10, 13, 14, 16, and 18,
which did not show a clear and well supported clade with
sequences of Stigonema included in the phylogenetic analysis.
Nevertheless, BLAST searches of these OTUs recovered sequenc-
es identified as Stigonema. In both cases, the most likely explanation
for such lack of phylogenetic support in our tree for these two
OTU groups is the shortness of fragment of the 16S gene used in
the analyses. Finally, OTU 20 is clearly and statistically supported
related to Leptolymbya and OTU 19 is likewise related to Microcoleus
(Fig. 2).
Soil properties of glacier forelandsOverall comparisons between both glaciers (two-way ANOVAs)
showed no differences on pH, TC and TN between glaciers (NG vs
SG) and higher concentration of inorganic N at SG (ANOVA
P = 0.037). At NG, the concentration of inorganic N in young soils
(younger than 26 years) was lower (from 0.16 to 8.23 mg kg21)
Figure 2. Maximum-likelihood phylogenetic tree. Maximum-likelihood phylogenetic tree (50% majority rule consensus tree) from alignmentsof 16S rRNA genes showing the phylogenetic relationships among all OTUs of epiphytic cyanobacteria found on bryophytes collected along thechronosequence in both glacier and sequences with known taxonomy, for Accession numbers (Table S1).doi:10.1371/journal.pone.0096081.g002
N2-Fixation in Bryophytes from Deglaciated Areas
PLOS ONE | www.plosone.org 6 May 2014 | Volume 9 | Issue 5 | e96081

compared to concentrations observed in soils at SG very early after
glacier retreated (13.42 mg kg21 after 4 years soil exposure and
34.83 mg kg21 after 10 years, Fig. 3d). Within the Nothofagus
forests inorganic N concentration in the soil was nearly 3-fold
higher at SG (135.08 mg kg21) compared to NG (45.28 mg kg21).
All soil parameters showed a significant overall site effect (ANOVA
P,0.001) and no interaction between glacier location (north sv.
south) and site (0 to 5). Within each chronosequence (non-
parametric tests), soil pH decreases from 6.4 to 4.4 in NG (P,
0.01) and from 6.81 to 4.55 in SG (P,0.05), with the higher values
always found in the younger soils (Fig. 3a). TC increased from very
low values (0.33% at NG and 0.24% at SG) to over 35% at NG
(P,0.05) and 39% at SG (P,0.05) in the oldest soils (80 and 34
years of soil exposure respectively) inside the Nothofagus spp. forest
(Nothofagus-dominated state, Fig. 3b); TN also increased along the
chronosequence from 0.02% in NG and undetectable levels in SG
to 0.99% in NG (P,0.05) and 1.51% in SG (P,0.05) inside the
forest site (Fig. 3c). Soil extractable inorganic N (NO32+NO2
2+NH4
+) followed a similar trend increasing with time since
deglaciation at both glaciers (P,0.05 for NG and P,0.01 for
SG, Fig. 3d).
Nitrogen-fixation, cyanobacteria abundance and shoot C: N contents
N2 fixation rates (15N2 uptake) and epiphytic cyanobacteria
relative abundance, when averaged across all bryophyte species
per site, were higher at SG compare to NG (ANOVA P,0.001
and P,0.01 respectively). A significant overall interaction
(ANOVA P,0.001) between glacier locations (north sv. south)
and the stage of ecological succession (sampling site:1 to 5)
suggested that variation of N2 fixation rates and cyanobacteria
abundance along each chronosequence differed between glaciers.
At NG, N2 fixation rate (Fig. 3e) showed an optimum increasing
from the lowest rates at 18 and 20 year old sites (0.52 and 0.5 mg N
g21 DW bryo. d21, respectively) to rates that were 2-fold higher in
intermediate-aged sites (0.94 and 1.42 mg N g21 DW bryo. d21, 26
and 66 years old site respectively) and then declined in the 80 years
old forest site (0.80 mg N g21 DW bryo. d21). Epiphytic
cyanobacteria abundance (Fig. 3f) followed a similar trend with
the highest concentration at 66 years old site (42.09 nmol echin.
cm22) and lowest concentration at 80 and 20 years old soil (4.5
and 7.94 nmol echin. cm22). In contrast, at SG the highest N2
fixation rate and cyanobacteria abundance was found in young
soils (4.60 and 4.96 mg N g21 DW bryo. d21 and 51.50 and
53.33 nmol echin. cm22, at 4 and 7 year old sites respectively)
compared to older sites (ranging from 0.64 to 1.34 mg N g21 DW
bryo. d21 and 6.46 to 23.96 nmol echin. cm22, at soil age 10 to 34
years old; Fig. 3e,f).
Shoot C : N ratios of bryophyte tissue, when averaged across all
bryophyte species per site, did not differed between glacier
(ANOVA P = 0.165) but change with soil age (ANOVA P,0.001).
Shoot C : N increased with time since deglaciation at NG (P,
0.001) with the lower values always found in the younger soil
(Fig. 3g). At SG shoot C : N ratios showed the same pattern but the
effect of soil age was not significant (Fig. 3g).
Differences on bryophyte N2 fixation capacity andcyanobacteria abundance
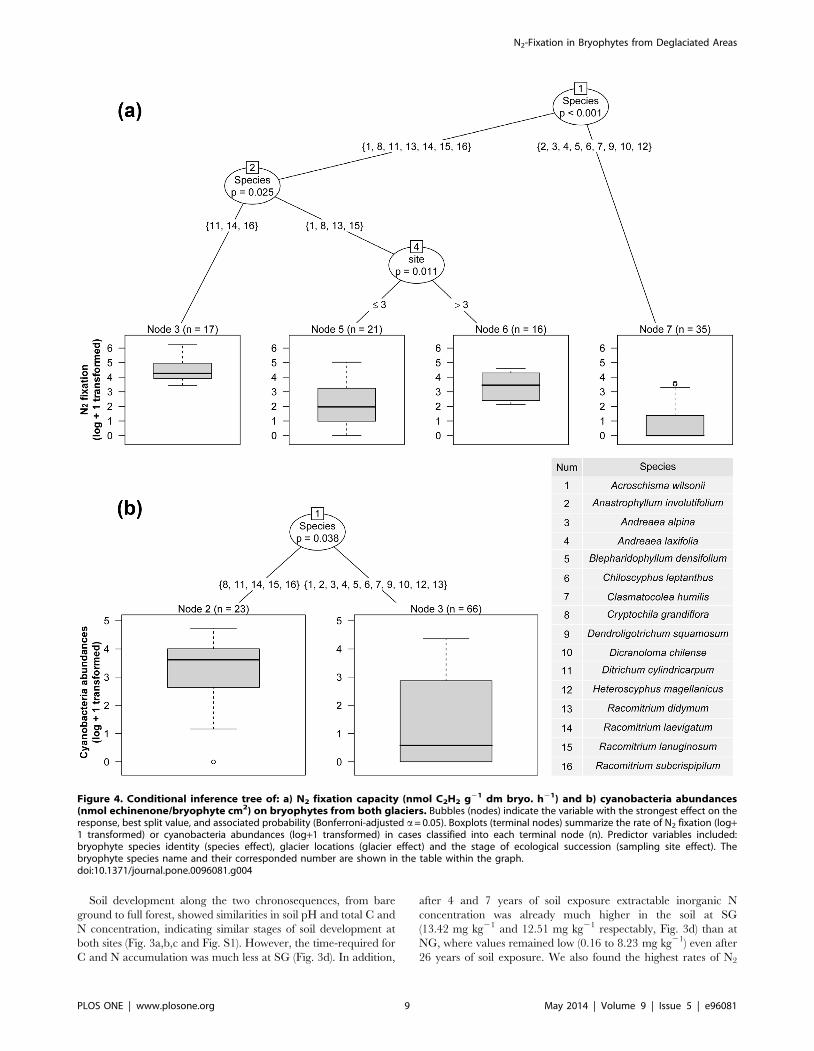
The conditional inference tree (Fig. 4a) revealed that both
species identity and the stage of ecological succession (sampling
site), were important variables in the N2 fixation rates at species
level (ARA, nmol C2H2 g21 dm bryo. h21) Three species of
mosses (Ditrichum cylindricarpum, Racomitrium subcrispipilum and R.
laevigatum) showed the highest rates of N2 fixation (Table 1 and
node 3 in Fig. 4a); Intermediate N2 fixation rates were found for a
second group of species (node 4), namely Racomitrium didymium, R.
lanuginosum, Acroschisma wilsonii and the liverwort Cryptochila
grandiflora. An increment of N2 fixation rates was detected between
younger sites (node 5: sites 1–3) and older sites (node 6: sites 4 and
5) for node 4. However, a more detailed analysis by individual
species, revealed that there was an effect of the stage of ecological
succession on N2 fixation rates only on the two most common
species sampled in this study, R. didymium and A. wilsonii (statistical
data not shown). The remainder of the species (node 7) had either
low N2 fixation rates as detected in Dicranoloma chilense, Andreaea
laxifolia, Andreaea alpina and Anastrophyllum involutifolium, or zero N2
fixation rates, as in the liverworts Clasmatocolea humilis, Blephar-
idophyllum densifolium, Chiloscyphus leptanthus, Heteroscyphus magellanicus
and the endohydric moss Dendroligotrichum squamosum (Table 1 and
Fig. 4a). With our dataset, no effect was detected for glacier
location (north sv. south) at species level.
The conditional inference tree (Fig. 4b) also showed a significant
effect of bryophytes species identity on cyanobacteria relative
abundance (nmol echinenone/cm2 bryophyte) with the highest
colonization found in the mosses Ditrichum cylindricarpum, Racomi-
trium subcrispipilum, R. laevigatum, R. lanuginosum and the liverwort
Cryptochila grandiflora (Table 1 and node 2 in Fig 4b). Variability of
N2 fixation rates between bryophyte species was best explained by
changes in epiphytic cyanobacteria abundance (positive linear
regression: R2 = 0.44, P,0.001, Fig. 5a) rather than the Shannon
diversity index of cyanobacteria on host bryophytes (positive linear
regression: R2 = 0.19, P = 0.012, Fig. 5b).
Community structure of epiphytic cyanobacteriaThe Shannon index of epiphytic cyanobacteria OTUs per site
(H9site) at NG rose from 0.29 to a maximum of 0.96 at 26 years
followed by a steady decline to original level at the oldest site. At
SG, H9site increased sharply from 0.38 and 0.32 at the two
youngest sites to 1.37 at the oldest site within Nothofagus forest
(Fig. 3h). Correspondence analysis showed a clear relationship
between cyanobacteria genera and the stage of ecological
succession at both glaciers. At NG (Fig. 6a), sites 2 and 3 share
similar cyanobacteria communities; Nostoc commune was present at
site 2 (OTU 1 & 3) and site 3 (OTU 6) whereas unidentified
Nostocaceae was confined to site 3 (OTU 5, 7 & 15) and site 4
(OTU 17); Stigonema spp was found just at site 4 (OTU 16) and
Microcoleus spp. (OTU 19) at site 5. At SG (Fig. 6b), all sites differed
in their cyanobacteria communities, Nostoc commune was present at
sites 1 (OTU 2), site 2 (OTU 1), site 3 (OTU 4 & 8) and site 5
(OTU 11); unidentified Nostocaceae at site 4 (OTU 9) and site 5
(OTU 15 & 12) and Stigonema spp. at site 4 (OTU 18) and site 5
(OTU 16, 13, 10 & 14). Leptolyngbya spp. (OTU20) was found at site
1. No relationship was observed between the genus of cyanobac-
teria and bryophyte species (Table 1 and Fig. S2).
Discussion
Patterns of soil properties and N2 fixation relatedparameters along chronosequences
The trend observed in soil development followed the classic
sequence reported for glacier foreland chronosequences [57,58].
Soil pH fell and total C and N contents increased with surface age
along both chronosequences. However, the time required differs
significantly to rates reported in other proglacial areas. Soils
developed from barren rocks to Histosol, an organic soil, with 39%
C in SG and 35% C in NG after 34 and 80 years of soil exposure,
respectively (Fig. 3b). This contrasts with 2% C reported in other
N2-Fixation in Bryophytes from Deglaciated Areas
PLOS ONE | www.plosone.org 7 May 2014 | Volume 9 | Issue 5 | e96081

studies reached 80 years after deglaciation [57]. Total soil N
increased from very low or undetectable values at the youngest
sites to 1.5% in SG and 0.99% in NG in the forest soil over this
short period, again contrasting with concentration of 0.2% TN
after 80 years exposure observed in the Central Alps [57]. These
results suggest that conditions for vegetation succession are more
favourable under the oceanic climatic conditions of Southern
Hemisphere high latitude regions, such as Tierra del Fuego.
Figure 3. Patterns of soil properties and N2 fixation related parameters along chronosequences. Site characteristics along thechronosequence in the north-side glacier (NG: black circles) with site soil (surface) age of 5, 18, 20, 26, 66 and 80 yrs and south-side glacier (SG: whitecircles) with site soil (surface) age of 1, 4, 7, 10, 19 and 34 yrs. At both glaciers, the younger site corresponds to bare ground close to the glacier frontwhereas the older site was covered within Nothofagus forests. Significant changes of parameters along each glacier chronosequence is indicated by *,p,0.05*, p,0.01**, p,0.001*** (Krukall-Wallis test). Different letters indicate significant differences between site ages after Mann–Whitney U-testpost-hoc (Bonferroni corrected), bold letters are used for NG. Statistical differences on soil properties and N2 fixation related parameters between thetwo glacier chronosequences are indicated in the result section.doi:10.1371/journal.pone.0096081.g003
N2-Fixation in Bryophytes from Deglaciated Areas
PLOS ONE | www.plosone.org 8 May 2014 | Volume 9 | Issue 5 | e96081
Soil development along the two chronosequences, from bare
ground to full forest, showed similarities in soil pH and total C and
N concentration, indicating similar stages of soil development at
both sites (Fig. 3a,b,c and Fig. S1). However, the time-required for
C and N accumulation was much less at SG (Fig. 3d). In addition,
after 4 and 7 years of soil exposure extractable inorganic N
concentration was already much higher in the soil at SG
(13.42 mg kg21 and 12.51 mg kg21 respectably, Fig. 3d) than at
NG, where values remained low (0.16 to 8.23 mg kg21) even after
26 years of soil exposure. We also found the highest rates of N2
Figure 4. Conditional inference tree of: a) N2 fixation capacity (nmol C2H2 g21 dm bryo. h21) and b) cyanobacteria abundances(nmol echinenone/bryophyte cm2) on bryophytes from both glaciers. Bubbles (nodes) indicate the variable with the strongest effect on theresponse, best split value, and associated probability (Bonferroni-adjusted a= 0.05). Boxplots (terminal nodes) summarize the rate of N2 fixation (log+1 transformed) or cyanobacteria abundances (log+1 transformed) in cases classified into each terminal node (n). Predictor variables included:bryophyte species identity (species effect), glacier locations (glacier effect) and the stage of ecological succession (sampling site effect). Thebryophyte species name and their corresponded number are shown in the table within the graph.doi:10.1371/journal.pone.0096081.g004
N2-Fixation in Bryophytes from Deglaciated Areas
PLOS ONE | www.plosone.org 9 May 2014 | Volume 9 | Issue 5 | e96081

fixation and cyanobacteria abundance in the pioneer terricolous
moss Ditrichum cylindricarpum at 4 and 7 years soil exposure in SG
(Fig 3e,f Table 1), where it forms a dense carpet in the soil (Fig. 1b).
By contrast, in NG biological N2 fixation and epiphytic
cyanobacteria abundance on bryophytes was very low during
the early stages of succession (Fig. 3e,f). It is likely that higher
annual rainfall on SG is associated with higher rates of N2 fixation
on bryophyte-cyanobacteria associations in young soils, since
fixation of N is strongly controlled by moisture availability [30].
Earlier studies have shown the importance of free living colonies of
diazotrophs for C and N inputs during early stages of succession in
glacial forelands [59–62] which could contribute to nutrient
accumulation at our sites. Fixation of N by cyanobacteria
associated with bryophytes that colonize soil surfaces very early
after glacier retreat, as shown by our results, could also help
accelerate soil development in recently deglaciated areas under
wetter conditions.
As succession proceeds in SG, terricolous mosses are replaced
by perennial herbs like Gunnera magellanica, which forms symbiotic
associations with the cyanobacterial genus Nostoc [63], and
becomes the dominant species together with Uncinia tenuis, which
are likely to be a major factor promoting C and N accumulation
on soil. In intermediate-aged sites, mosses are confined to rock
outcrops (Fig. 1b) where, together with lichen species like Placopsis
Table 1. Mean (N = 3) N2 fixation rates (nmol C2H2 g21 dm bryo. h21) cyanobacteria abundance (nmol echinenone/bryophyte cm2)and cyanobacteria genera associated with each individual bryophyte species along both glacier chronosequences.
Mean reduction rate(nmol C2H2 g21 dm bryo.h21)
Cyanobacteria abundance(nmol echin. cm22) Cyanobacteria identification
Glacier Site Bryophyte species Mean Range
SG 1 Ditrichum cylindricarpum 283.4 55–520 51.5 (3.2) N. commune. Leptolymbia sp
SG 2 Ditrichum cylindricarpum 270.1 70–455 53.3 (8.2) N. commune
SG 4 Racomitrium subcrispipilum 86.7 43–144 30.7 (12.1) N. commune
SG 5 Racomitrium subcrispipilum 81.6 49–142 40.3 (36.2) N. commune. UnidentifiedNostocaceae Stigonema
NG 3 Racomitrium laevigatum 63.5 33–125 8.5 (6.9) N. commune
NG 4 Racomitrium laevigatum 59.9 30–101 37.2 (9.4) Unidentified Nostocaceae
NG 2 Racomitrium didymum 7.7 3–16 14.5 (14.5) N. commune
NG 3 Racomitrium didymum 30.7 12–56 8.5 (5.3) Unidentified Nostocaceae
NG 4 Racomitrium didymum 51.6 22–80 12.4 (7.1) Stigonema
SG 3 Racomitrium didymum 0.0 0 0.3 (0.3) N. commune
SG 4 Racomitrium didymum 20.7 7–34 21.5 (10.7) Unidentified Nostocaceae
SG 5 Racomitrium didymum 66.6 53–75 39.4 (19.6) N. commune. Stigonema
NG 1 Andreaea laxifolia 8.7 0–26 15.8 (15.5) Non found
NG 3 Andreaea laxifolia 62.8 2–151 18.8 (9.6) Unidentified Nostocaceae
NG 3 Cryptochila grandiflora 52.6 3–124 17.1 (4.5) N. commune
NG 2 Acroschisma wilsonii 1.4 0–3 11.8 (6.0) Non found
NG 3 Acroschisma wilsonii 6.1 1–14 0.0 Unidentified Nostocaceae
SG 3 Acroschisma wilsonii 25.7 25–40 12.5 (12.5) N. commune
SG 4 Acroschisma wilsonii 18.4 9–28 19.5 (6.3) Unidentified Nostocaceae
SG 5 Acroschisma wilsonii 39.8 8–72 9.9 (4.9) Unidentified Nostocaceae
NG 4 Racomitrium lanuginosum 39.2 10–98 76.5 (22.0) Stigonema
NG 3 Dicranoloma chilense 19.2 9–33 2.7 (2.7) Unidentified Nostocaceae
NG 5 Dicranoloma chilense 2.9 0–9 5.9 (5.9) Non found
NG 5 Anastrophyllum involutifolium 3.5 0–11 5.7 (5.1) Non found
SG 4 Clasmatocolea humilis 1.5 0–3 15.2 (4.5) Stigonema
NG 2 Andreaea alpina 0.9 0–3 2.7 (2.7) Non found
NG 5 Blepharidophyllum densifolium 0.0 0 6.1 (6.1) Microcoleus
SG 5 Chiloscyphus leptanthus 0.0 0 4.8 (4.8) Non found
NG 1 Dendroligotrichum squamosum 0.0 0 3.2 (3.2) Non found
NG 2 Dendroligotrichum squamosum 0.0 0 2.5 (2.5) Non found
NG 5 Heteroscyphus magellanicus 0.0 0 0.1 (0.1) Non found
In both glaciers the younger site (site 1) correspond to early succession site close to the glacier front whereas the older site (site 5) was settled within Nothofagus forests.Sites 3–4 represent intermediate stages of ecological succession. No species were sampled at site 0. SE for cyanobacteria abundances is shown in brackets. NG: north-side glacier; SG: south-side glacier of the mountain range.doi:10.1371/journal.pone.0096081.t001
N2-Fixation in Bryophytes from Deglaciated Areas
PLOS ONE | www.plosone.org 10 May 2014 | Volume 9 | Issue 5 | e96081

perrugosa [64], form a thick layer of organic material on rock
surfaces (Fig. 1b). Despite rock outcrops possibly being a less
favourable surface for N2 fixation, we found high rates of fixation,
abundance and diversity of epiphytic cyanobacteria on species like
Racomitrium subcrispipilum, Racomitrium didymium and Acroschisma
wilsonii which formed moss mats on rock surfaces at intermedi-
ate-aged sites (19 years old sites in SG) and even within Nothofagus
forest (Table 1 and Fig. 3h). However, at the drier side of the
mountain range where NG flows, intermediate-aged sites are
dominated by the dwarf shrub Empetrum rubrum which allows the
development of dense mats of terricolous bryophyte species such as
Racomitrium lanuginosum, R. laevigatum and Cryptochila grandiflora
(Fig. 1b). It is at this stage of succession that we found the highest
rate of N2 fixation and cyanobacteria colonization on bryophytes
at NG (Fig. 3e,f and Table 1). In this drier area dominated by
dwarf shrub vegetation, cyanobacteria in association with bryo-
phytes are possibly one of the main sources of fixed N, since
cyanobacteria in the soil decrease with increasing vegetation
development, and the occurrence of N-fixing Nostoc host, Gunnera
magellanica, is reduced under drier conditions.
It remains unclear, however, how the newly fixed N in the
bryophyte-cyanobacteria system becomes available to vascular
plants. We consider two pathways, described by [30], which may
occur during primary succession in our study area. First, direct
transfer of N from the moss system to vascular plants by
mycorrhizal linkages: most vascular plant species in the study
area form mycorrhizal association (e.g. ectomycorrhizal associa-
tion with Nothofagus species or ericoid mycorrhizal with Empetrum
spp.). Second, release of the newly fixed N retained in the
bryophyte-cyanobacteria system after disturbance events, for
example after membrane damage from desiccation following
wet/dry cycles [65,66].
Overall, glacier forelands in Tierra del Fuego show fast rates of
soil transformation, implying large quantities of N inputs to allow
fast vegetation succession. Our results highlight that bryophyte-
cyanobacteria associations have the potential to contribute to N
accumulation and cycling in these areas with very low inputs of N
from atmospheric deposition.
Differences on bryophyte N2 fixation capacity andcyanobacteria abundance
Few studies have investigated interspecific or intraspecific
variation in N2 fixation capacity on bryophytes, particularly in
the context of post-glacial primary succession. In our study, most
bryophyte species have the ability to support an epiphytic flora of
cyanobacteria. However, N2 fixation rates varied between and
within bryophyte species (Table 1). In line with results reported in
previous studies [5], we detected differences in N2 fixation rates
between mosses and liverworts. Five of the six studied liverworts
showed no or very low rate of N2 fixation and cyanobacteria
abundance (Table 1), and only one species, the terricolous
liverwort Cryptochila grandiflora, showed high fixation rates
(52.6 nmol C2H2 g21 dm bryo. h21) and cyanobacteria coloniza-
tion. Among moss species, Dendroligotrichum squamosum also showed
no N2 fixation or cyanobacteria colonization, possibly due to their
rigid, water repellent leaves which may confer less favorable
moisture conditions. However, morphology or habitat could not
explain variations found among other moss species. Both
terricolous (Ditrichum cylindricarpum, Racomitrium laevigatum, R.
lanuginosum) and saxicolous species (Racomitrium subcrispipilum, R.
didymum, Acroschisma wilsonii) showed high N2 fixation rates (over
40 nmol C2H2 g21 dm bryo. h21) compared to rates reported in
Arctic [8] and sub-Antarctic [16] ecosystems. Regarding intraspe-
cific variations, we observed that the rates of N2 fixation of the
saxicolous mosses Racomitrium didymium and Acroschisma wilsonii (the
most frequently sampled species in the study area) were affected by
the stages of ecological succession. The rate of N2 fixation
significantly increases on R. didymium and Acroschisma wilsonii
populations that grow at sites that have been longer deglaciated,
reflecting growth of the cyanobacterial population as vegetation
develops when growing epiphytically on these mosses.
Community structure of epiphytic cyanobacteriaIn the present study, we also aimed to evaluate the influence of
cyanobacteria community structure on bryophyte N2 fixation
rates. We found that abundance of epiphytic cyanobacteria
appears to be a better factor explaining differences in N2 fixation
rates (Fig. 5) than epiphytic cyanobacteria diversity on host
bryophyte species (Fig. 5). It is also noteworthy that Nostoc commune-
associated bryophyte species, both mosses and liverworts, showed
the highest rate of N2 fixation (Table 1), which is in agreement
Figure 5. Relationship between N2 fixation and the abundance and diversity of epiphytic cyanobacteria. Relationship between N2
fixation (mg N g21 DW bryo. d21) on each individual bryophyte species and the abundance (nmol echine. cm-2) and diversity (Shannon Index) of theirhost cyanobacteria. Bryophyte species from both glaciers are included. The results of the linear regression analysis are shown in the upper left side ofthe figure.doi:10.1371/journal.pone.0096081.g005
N2-Fixation in Bryophytes from Deglaciated Areas
PLOS ONE | www.plosone.org 11 May 2014 | Volume 9 | Issue 5 | e96081
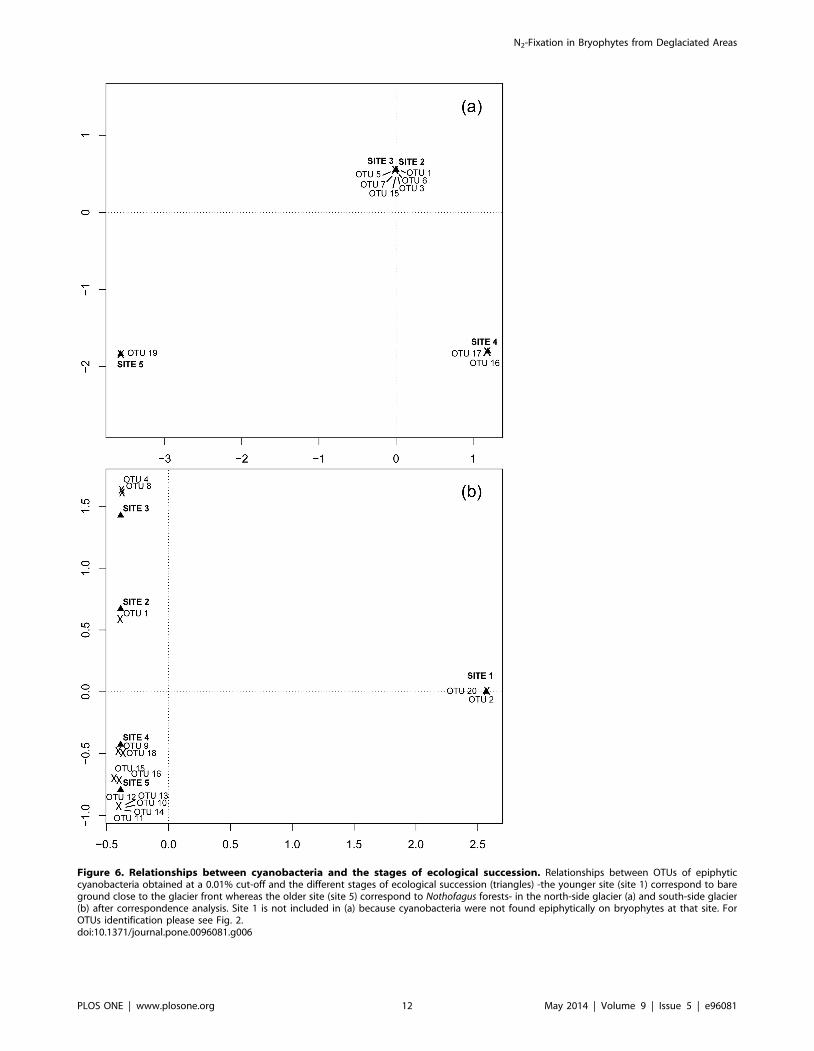
Figure 6. Relationships between cyanobacteria and the stages of ecological succession. Relationships between OTUs of epiphyticcyanobacteria obtained at a 0.01% cut-off and the different stages of ecological succession (triangles) -the younger site (site 1) correspond to bareground close to the glacier front whereas the older site (site 5) correspond to Nothofagus forests- in the north-side glacier (a) and south-side glacier(b) after correspondence analysis. Site 1 is not included in (a) because cyanobacteria were not found epiphytically on bryophytes at that site. ForOTUs identification please see Fig. 2.doi:10.1371/journal.pone.0096081.g006
N2-Fixation in Bryophytes from Deglaciated Areas
PLOS ONE | www.plosone.org 12 May 2014 | Volume 9 | Issue 5 | e96081

with the suggestion that Nostoc commune, in particular, is an
important contributor of soil N in both polar regions [32].
Specific affinities of individual cyanobacteria genera with
particular bryophyte species were not apparent, as the same
bryophyte species can support the three main cyanobacteria
genera found here (Nostoc, unidentified Nostocaceae group and
Stigonema) (Table 1 and Fig. S2). However, a relationship between
cyanobacteria genera and the different stages of succession was
apparent in both glaciers. With increasing age along the
chronosequences, cyanobacteria shifted from: Nostoc commune-
dominated communities at young sites; to unidentified Nostoca-
ceae-dominated communities at intermediate sites; and finally to
Stigonema spp-dominated communities at older sites (Fig. 6). Such
procession correlated with the soil development trends found here
and contrasts with results observed in mature boreal forests where
moss species identity serves as an important determinant of
cyanobacterial communities that inhabit mosses [22]. With our
data set, our results suggest that the stage of succession acts as a
strong driver in determining the composition of epiphytic
cyanobacteria on bryophytes during primary succession. Despite
this similarity between the two glaciers, diversity of epiphytic
cyanobacteria at SG was higher than at NG and increased with
time since deglaciation (Fig. 3h), reflecting more favourable
conditions for cyanobacteria growth on the wetter southern side
of Cordillera Darwin.
ConclusionsWe have compared, from a multidisciplinary perspective,
chronosequences in front of two receding glaciers with contrasting
climatic conditions (wetter vs drier) and differing rates of ecological
succession in Tierra del Fuego (Chile). In doing so, we have shown
that bryophyte-cyanobacteria associations have the potential to
contribute to N accumulation very early after glacier retreat, a
process that could help promote soil development. At intermedi-
ate-aged sites, and under drier conditions, bryophytes can grow
among dwarf shrub plants, forming dense mats that host
cyanobacteria species and exhibit high N2 fixation rates, contrib-
uting to N accumulation and cycling. We also found that
differences in N2 fixation capacity between bryophyte species
were primarily driven by the abundance of epiphytic cyanobac-
teria rather than cyanobacterial community composition. Most
liverworts showed low colonization, whilst in mosses rates of N2
fixation did not exhibit consistent differences across life forms and
habitat (saxicolous vs terricolous). Finally, we identified that the
main factor structuring community composition of epiphytic
cyanobacteria was the stage of ecological succession, with no
relationship to host species identity.
Supporting Information
Figure S1 Scores variation of the general factor compo-nent of soil development along the glacier chronose-
quence in the north-side (black bars) and south-side(white bars) of Cordillera Darwin. Sites with higher loadings
reflect a more developed soil. The general factor component of soil
development was obtained by reduction of soil pH and total soil
carbon and nitrogen by principal component analysis. Mean
values (6 SE) of three replicate transect are shown.
(DOC)
Figure S2 Correspondence analysis between OTUs ofcyanobacteria obtained at a 0.01% cut-off and eachindividual bryophyte species, just the six most abun-dance bryophyte species with cyanbacteria colonieswere used in this analysis, identification of OUTs canbe see in Fig.2.
(DOC)
Table S1 Changes in bryophyte species along twoproglacial chronosequence at the Cordillera Darwin(Tierra del Fuego, Chile).
(DOC)
Table S2 Gen Bank accession numbers correspondingto species and specimens used for tree inference.
(DOC)
Appendix S1 Calculation of different vial headspacesfor ARA and 15N2 uptake essays.
(DOC)
Acknowledgments
MA-C benefited from a postdoctoral Juan de la Cierva grant of the
Ministerio de Ciencia e Innovacion of Spain and a position as Associate
Member at the University of Sheffield (UK). We are indebted to Gisela
Olivan, Carolina Leon, William R. Buck, Juan Larraın, John J. Engel,
Barbara Murray and Esther Fuertes for their inestimable help with the
identification of the bryophyte specimens and Ma Jose Malo, Victoria
Santonaya (CSIC) and Jose M. Blanquer, Carlos M Castilla and M. Pilar
Villar Gil (UCM) for their technical assistant. We thank Dolores Saco for
their support in the lab work and Vıctor Arroyo-Rodrıguez and Jesus Aboal
for helping on statistical analysis. We are grateful to the Universidad de
Magallanes (UMAG) and the Institute of Ecology and Biodiversity for
logistic and scientific support. Francisca Massardo (UMAG and Fundacion
Omora) are particularly thanked for their excellent organization of the
fieldwork in the complex area of the Darwin Mountains.
Author Contributions
Conceived and designed the experiments: MA-C SPO TGAG LGS.
Performed the experiments: MA-C SPO. Analyzed the data: MA-C SPO
ADLR NT MC MTDLC. Contributed reagents/materials/analysis tools:
ROH DP. Wrote the paper: MA-C SPO. Carried out sampling field work:
AP. Organised field logistics: AP RR LGS. Selected field sites: DP RR.
Arranged required permissions and permits: RR. Discussed the results and
commented on the manuscript: MA-C SPO TGAG LGS ADLR ROH
RR NT MC MTDLC AP.
References
1. Elbert W, Weber B, Burrows S, Steinkamp J, Budel B, et al. (2012) Contribution
of cryptogamic covers to the global cycles of carbon and nitrogen. Nature Geosci
5: 459–462.
2. Solheim B, Zielke M (2002) Associations Between Cyanobacteria and Mosses.
In: Rai ANB, B.; Rasmussen, Ulla (Eds.), editor. Cyanobacteria in Symbiosis:
Springer. pp. 137–152.
3. Zielke M, Solheim B, Spjelkavik S, Olsen RA (2005) Nitrogen fixation in the
high arctic: Role of vegetation and environmental conditions. Arctic Antarctic
and Alpine Research 37: 372–378.
4. Zackrisson O, DeLuca TH, Gentili F, Sellstedt A, Jaderlund A (2009) Nitrogen
fixation in mixed Hylocomium splendens moss communities. Oecologia 160:
309–319.
5. Gavazov KS, Soudzilovskaia NA, van Logtestijn RSP, Braster M, CornelissenJHC (2010) Isotopic analysis of cyanobacterial nitrogen fixation associated with
subarctic lichen and bryophyte species. Plant and Soil 333: 507–517.
6. Stewart KJ, Coxson D, Grogan P (2011) Nitrogen Inputs by AssociativeCyanobacteria across a Low Arctic Tundra Landscape. Arctic Antarctic and
Alpine Research 43: 267–278.
7. Chapin DM, Bliss LC, Bledsoe LJ (1991) Environmental-regulation of nitrogen-fixation in a high arctic lowland ecosystem. Canadian Journal of Botany-Revue
Canadienne De Botanique 69: 2744–2755.
8. Solheim B, Endal A, Vigstad H (1996) Nitrogen fixation in Arctic vegetation andsoils from Svalbard, Norway. Polar Biology 16: 35–40.
9. DeLuca TH, Zackrisson O, Nilsson MC, Sellstedt A (2002) Quantifying
nitrogen-fixation in feather moss carpets of boreal forests. Nature 419: 917–920.
N2-Fixation in Bryophytes from Deglaciated Areas
PLOS ONE | www.plosone.org 13 May 2014 | Volume 9 | Issue 5 | e96081
10. Sorensen PL, Jonasson S, Michelsen A (2006) Nitrogen fixation, denitrification,
and ecosystem nitrogen pools in relation to vegetation development in thesubarctic. Arctic Antarctic and Alpine Research 38: 263–272.
11. Dodds WK, Gudder DA, Mollenhauer D (1995) The ecology of nostoc. Journal
of Phycology 31: 2–18.12. DeLuca TH, Zackrisson O, Gundale MJ, Nilsson MC (2008) Ecosystem
feedbacks and nitrogen fixation in boreal forests. Science 320: 1181–1181.13. Bowden RD (1991) Inputs, outputs, and accumulation of nitrogen in an early
successional moss (polytrichum) ecosystem. Ecological Monographs 61: 207–
223.14. Rozzi R, Armesto JJ, Goffinet B, Buck W, Massardo F, et al. (2008) Changing
lenses to assess biodiversity: patterns of species richness in sub-Antarctic plantsand implications for global conservation. Frontiers in Ecology and the
Environment 6: 131–137.15. Basilier K (1979) Moss-associated nitrogen-fixation in some mire and coniferous
forest environments around uppsala, sweden. Lindbergia 5: 84–88.
16. Smith VR, Russell S (1982) Acetylene-reduction by bryophyte-cyanobacteriaassociations on a sub-antarctic island. Polar Biology 1: 153–157.
17. Line MA (1992) Nitrogen-fixation in the sub-antarctic macquarie island. PolarBiology 11: 601–606.
18. Gundale MJ, Nilsson M, Bansal S, Jaderlund A (2012) The interactive effects of
temperature and light on biological nitrogen fixation in boreal forests. NewPhytologist 194: 453–463.
19. Sorensen PL, Lett S, Michelsen A (2012) Moss-specific changes in nitrogenfixation following two decades of warming, shading, and fertilizer addition. Plant
Ecology 213: 695–706.20. Gundale MJ, Gustafsson H, Nilsson MC (2009) The sensitivity of nitrogen
fixation by a feathermoss-cyanobacteria association to litter and moisture
variability in young and old boreal forests. Canadian Journal of Forest Research-Revue Canadienne De Recherche Forestiere 39: 2542–2549.
21. Pandey KD, Kashyap AK, Gupta RK (1992) Nitrogen fixation by cyanobacteriaassociated with moss communities in Schirmacher Oasis, Antarctica. Israel
Journal of Botany 41: 187–198.
22. Ininbergs K, Bay G, Rasmussen U, Wardle DA, Nilsson MC (2011)Composition and diversity of nifH genes of nitrogen-fixing cyanobacteria
associated with boreal forest feather mosses. New Phytologist 192: 507–517.23. Bates JW (2009) Mineral nutrition, substratum ecology, and pollution. In: Shaw
AJ, Goffinet B, editors. Bryophyte Biology, Cambridge: Cambridge UniversityPress. pp. 2990–0356.
24. Masiokas MH, Villalba R, Luckman BH, Lascano ME, Delgado S, et al. (2008)
20th-century glacier recession and regional hydroclimatic changes in northwest-ern Patagonia. Global and Planetary Change 60: 85–100.
25. Kohls SJ, Baker DD, van Kessel C, Dawson JO (2003) An assessment of soilenrichment by actinorhizal N-2 fixation using delta N-15 values in a
chronosequence of deglaciation at Glacier Bay, Alaska. Plant and Soil 254:
11–17.26. Sancho LG, Palacios D, Green TGA, Vivas M, Pintado A (2011) Extreme high
lichen growth rates detected in recently deglaciated areas in Tierra del Fuego.Polar Biology 34: 813–822.
27. Dentener F, Stevenson D, Ellingsen K, van Noije T, Schultz M, et al. (2006) Theglobal atmospheric environment for the next generation. Environmental Science
& Technology 40: 3586–3594.
28. Menge DNL, Hedin LO (2009) Nitrogen fixation in different biogeochemicalniches along a 120 000-year chronosequence in New Zealand. Ecology 90:
2190–2201.29. Koppes M, Hallet B, Anderson J (2009) Synchronous acceleration of ice loss and
glacial erosion, Glaciar Marinelli, Chilean Tierra del Fuego. Journal of
Glaciology 55: 207–220.30. Lindo Z, Nilsson MC, Gundale MJ (2013) Bryophyte-cyanobacteria associations
as regulators of the northern latitude carbon balance in response to globalchange. Global Change Biology 19: 2022–2035.
31. Santana A, Porter C, Butorovic N, Olave C (2006) First climatologic antecedents
of automatic weather stations (AWS) in the Beagle Channel, Magallanes, Chile.An Inst Patagonia 34: 5–20.
32. Vincent WF (2000) Cyanobacterial dominance in the polar regions. In: WhittonBA, Potts M, editors. The ecology of cyanobacteria, Dordrecht: Kluwe. pp. 321–
340.33. ISRIC (2002) Procedures for soil analysis; Centre ISRal, editor.
34. America SSSo (1982) Methods of soil analysis. Part 2. Chemical and
Microbiological Properties; Page AL, Miller RH, Keeny DR, editors.Winsconsin, USA: Madison.
35. Weber MG, Vancleve K (1984) Nitrogen transformations in feather moss andforest floor layers of interior alaska black spruce ecosystems. Canadian Journal of
Forest Research-Revue Canadienne De Recherche Forestiere 14: 278–290.
36. Millbank JW (1981) The assessment of nitrogen-fixation and throughput bylichens. 1. the use of a controlled environment chamber to relate acetylene-
reduction estimates to nitrogen-fixation. New Phytologist 89: 647–655.37. Basilier K (1980) Fixation and uptake of nitrogen in sphagnum blue-green-algal
associations. Oikos 34: 239–242.
38. Liengen T (1999) Conversion factor between acetylene reduction and nitrogen
fixation in free-living cyanobacteria from high arctic habitats. Canadian Journalof Microbiology 45: 223–229.
39. Val J, Monge E, Baker NR (1994) An improved hplc method for rapid analysis
of the xanthophyll cycle pigments. Journal of Chromatographic Science 32:286–289.
40. Cubero OF, Crespo A, Fatehi J, Bridge PD (1999) DNA extraction and PCRamplification method suitable for fresh, herbarium-stored, lichenized, and other
fungi. Plant Systematics and Evolution 216: 243–249.
41. Nubel U, GarciaPichel F, Muyzer G (1997) PCR primers to amplify 16S rRNAgenes from cyanobacteria. Applied and Environmental Microbiology 63: 3327–
3332.42. de los Rios A, Valea S, Ascaso C, Davila A, Kastovsky J, et al. (2010)
Comparative analysis of the microbial communities inhabiting halite evaporitesof the Atacama Desert. International Microbiology 13: 79–89.
43. Schloss PD, Westcott SL, Ryabin T, Hall JR, Hartmann M, et al. (2009)
Introducing mothur: Open-Source, Platform-Independent, Community-Sup-ported Software for Describing and Comparing Microbial Communities.
Applied and Environmental Microbiology 75: 7537–7541.44. Stackebrand E, Ebers J (2006) Taxonomic parameters revisited: tarnished gold
standards. Microbiology Today 33: 152–155.
45. Edgar RC (2004) MUSCLE: multiple sequence alignment with high accuracyand high throughput. Nucleic Acids Research 32: 1792–1797.
46. Hall TA (1999) BioEdit: a user-friendly biological sequence alignment editor andanalysis. http://www.mbio.ncsu.edu/BioEdit/bioedit.html.
47. Posada D (2008) jModelTest: Phylogenetic model averaging. Molecular Biologyand Evolution 25: 1253–1256.
48. Akaike H (1974) New look at statistical-model identification. Ieee Transactions
on Automatic Control AC19: 716–723.49. Tavare S (1986) Some probabilistic and statistical problems in the analysis of dna
sequences. Miura, R M. pp. 57–86.50. Guindon S, Dufayard JF, Lefort V, Anisimova M, Hordijk W, et al. (2010) New
Algorithms and Methods to Estimate Maximum-Likelihood Phylogenies:
Assessing the Performance of PhyML 3.0. Systematic Biology 59: 307–321.51. Ronquist F, Huelsenbeck JP (2003) MrBayes 3: Bayesian phylogenetic inference
under mixed models. Bioinformatics 19: 1572–1574.52. Hill TCJ, Walsh KA, Harris JA, Moffett BF (2003) Using ecological diversity
measures with bacterial communities. Fems Microbiology Ecology 43: 1–11.53. Filzmoser P (1999) Robust principal component and factor analysis in the
geostatistical treatment of environmental data. Environmetrics 10: 363–375.
54. Hothorn T, Hornik K, Strobl C, Zeileis A (2010) Party: A laboratory forrecursive partytioning. Citeseer.
55. Hothorn T, Hornik K, Zeileis A (2006) Unbiased recursive partitioning: Aconditional inference framework. Journal of Computational and Graphical
Statistics 15: 651–674.
56. Nenadic O, Greenacre M (2007) Correspondence analysis in R, with two- andthree-dimensional graphics: The ca package. Journal of Statistical Software 20.
57. Bernasconi SM, Bauder A, Bourdon B, Brunner I, Bunemann E, et al. (2011)Chemical and Biological Gradients along the Damma Glacier Soil Chronose-
quence, Switzerland. Vadose Zone Journal 10: 867–883.58. Chapin FS, Walker LR, Fastie CL, Sharman LC (1994) Mechanisms of primary
succession following deglaciation at glacier bay, alaska. Ecological Monographs
64: 149–175.59. Schmidt SK, Reed SC, Nemergut DR, Grandy AS, Cleveland CC, et al. (2008)
The earliest stages of ecosystem succession in high-elevation (5000 metres abovesea level), recently deglaciated soils. Proceedings of the Royal Society B-
Biological Sciences 275: 2793–2802.
60. Knelman JE, Legg TM, O’Neill SP, Washenberger CL, Gonzalez A, et al.(2012) Bacterial community structure and function change in association with
colonizer plants during early primary succession in a glacier forefield. SoilBiology & Biochemistry 46: 172–180.
61. Zumsteg A, Luster J, Goransson H, Smittenberg RH, Brunner I, et al. (2012)
Bacterial, archaeal and fungal succession in the forefield of a receding glacier.Microbial Ecology 63: 552–564.
62. Brankatschk R, Towe S, Kleineidam K, Schloter M, Zeyer J (2011) Abundancesand potential activities of nitrogen cycling microbial communities along a
chronosequence of a glacier forefield. Isme Journal 5: 1025–1037.63. Fernandez-Martinez MA, de los Rios A, Sancho LG, Perez-Ortega S (2013)
Diversity of Endosymbiotic Nostoc in Gunnera magellanica (L) from Tierra del
Fuego, Chile. Microbial Ecology 66: 335–350.64. Raggio J, Green TGA, Crittenden PD, Pintado A, Vivas M, et al. (2012)
Comparative ecophysiology of three Placopsis species, pioneer lichens in recentlyexposed Chilean glacial forelands. Symbiosis 56: 55–66.
65. Wilson JA, Coxson DS (1999) Carbon flux in a subalpine spruce-fir forest: pulse
release from Hylocomium splendens feather-moss mats. Canadian Journal ofBotany-Revue Canadienne De Botanique 77: 564–569.
66. Wickland KP, Neff JC, Aiken GR (2007) Dissolved organic carbon in Alaskanboreal forest: Sources, chemical characteristics, and biodegradability. Ecosys-
tems 10: 1323–1340.
N2-Fixation in Bryophytes from Deglaciated Areas
PLOS ONE | www.plosone.org 14 May 2014 | Volume 9 | Issue 5 | e96081