
Turnover of recently assimilated carbon in arctic bryophytes
13
PHYSIOLOGICAL ECOLOGY - ORIGINAL PAPER Turnover of recently assimilated carbon in arctic bryophytes L. E. Street • J. A. Subke • M. Sommerkorn • A. Heinemeyer • M. Williams Received: 12 October 2010 / Accepted: 25 March 2011 / Published online: 17 April 2011 Ó Springer-Verlag 2011 Abstract Carbon (C) allocation and turnover in arctic bryophytes is largely unknown, but their response to cli- matic change has potentially significant impacts on arctic ecosystem C budgets. Using a combination of pulse-chase experiments and a newly developed model of C turnover in bryophytes, we show significant differences in C turnover between two contrasting arctic moss species (Polytrichum piliferum and Sphagnum fuscum). 13 C abundance in moss tissues (measured up to 1 year) and respired CO 2 (traced over 5 days) were used to parameterise the bryophyte C model with four pools representing labile and structural C in photosynthetic and stem tissue. The model was optimised using an Ensemble Kalman Filter to ensure a focus on estimating the confidence intervals (CI) on model parame- ters and outputs. The ratio of aboveground NPP:GPP in Polytrichum piliferum was 23% (CI 9–35%), with an average turnover time of 1.7 days (CI 1.1–2.5 days). The aboveground NPP:GPP ratio in Sphagnum fuscum was 43% (CI 19–65%) with an average turnover time of 3.1 days (CI 1.6–6.1 days). These results are the first to show differences in C partitioning between arctic bryophyte species in situ and highlight the importance of modelling C dynamics of this group separately from vascular plants for a realistic representation of vegetation in arctic C models. Keywords Mosses NPP:GPP ratio 13 C pulse-labelling Carbon model Carbon allocation Photosynthesis Autotrophic respiration Introduction High latitude terrestrial ecosystems are of global impor- tance, because they currently store an estimated 50% of the total global belowground organic C pool (Tarnocai et al. 2009). The arctic climate has warmed by about 0.4°C per decade since the 1960s (McBean et al. 2005), and is forecast to warm by [ 5°C by 2100 (Christensen et al. 2007). If this warming results in a release of CO 2 or CH 4 to the atmosphere, this could represent an amplifying feed- back on global climate change. The C balance of arctic ecosystems has therefore become the focus of global con- cern. Bryophytes (the mosses, liverworts and hornworts) are a major component of arctic vegetation (Walker 2000). However, in contrast to many vascular plants, we lack detailed data on bryophyte C allocation and turnover which is needed to assess their overall contribution to the C bal- ance of tundra ecosystems, and the likely changes to this contribution following climatic change. Understanding the C balance of ecosystems requires quantification of the net C uptake and storage by vegetation Communicated by Allan Green. Electronic supplementary material The online version of this article (doi:10.1007/s00442-011-1988-y) contains supplementary material, which is available to authorized users. L. E. Street (&) M. Williams School of Geosciences, Crew Building, University of Edinburgh, Edinburgh EH9 3JN, UK e-mail: [email protected] J. A. Subke A. Heinemeyer Stockholm Environment Institute York, Environment Department, University of York, York YO10 5DD, UK J. A. Subke School of Biological and Environmental Sciences, University of Stirling, Stirlingm FK9 4LA, UK M. Sommerkorn Macaulay Land Use Research Institute, Craigiebuckler, Aberdeen AB15 8QH, UK 123 Oecologia (2011) 167:325–337 DOI 10.1007/s00442-011-1988-y
-
Upload
independent -
Category
Documents
-
view
1 -
download
0
Transcript of Turnover of recently assimilated carbon in arctic bryophytes

PHYSIOLOGICAL ECOLOGY - ORIGINAL PAPER
Turnover of recently assimilated carbon in arctic bryophytes
L. E. Street • J. A. Subke • M. Sommerkorn •
A. Heinemeyer • M. Williams
Received: 12 October 2010 / Accepted: 25 March 2011 / Published online: 17 April 2011
� Springer-Verlag 2011
Abstract Carbon (C) allocation and turnover in arctic
bryophytes is largely unknown, but their response to cli-
matic change has potentially significant impacts on arctic
ecosystem C budgets. Using a combination of pulse-chase
experiments and a newly developed model of C turnover in
bryophytes, we show significant differences in C turnover
between two contrasting arctic moss species (Polytrichum
piliferum and Sphagnum fuscum). 13C abundance in moss
tissues (measured up to 1 year) and respired CO2 (traced
over 5 days) were used to parameterise the bryophyte C
model with four pools representing labile and structural C in
photosynthetic and stem tissue. The model was optimised
using an Ensemble Kalman Filter to ensure a focus on
estimating the confidence intervals (CI) on model parame-
ters and outputs. The ratio of aboveground NPP:GPP in
Polytrichum piliferum was 23% (CI 9–35%), with an
average turnover time of 1.7 days (CI 1.1–2.5 days). The
aboveground NPP:GPP ratio in Sphagnum fuscum was 43%
(CI 19–65%) with an average turnover time of 3.1 days (CI
1.6–6.1 days). These results are the first to show differences
in C partitioning between arctic bryophyte species in situ
and highlight the importance of modelling C dynamics of
this group separately from vascular plants for a realistic
representation of vegetation in arctic C models.
Keywords Mosses � NPP:GPP ratio �13C pulse-labelling � Carbon model � Carbon allocation �Photosynthesis � Autotrophic respiration
Introduction
High latitude terrestrial ecosystems are of global impor-
tance, because they currently store an estimated 50% of the
total global belowground organic C pool (Tarnocai et al.
2009). The arctic climate has warmed by about 0.4�C per
decade since the 1960s (McBean et al. 2005), and is
forecast to warm by [5�C by 2100 (Christensen et al.
2007). If this warming results in a release of CO2 or CH4 to
the atmosphere, this could represent an amplifying feed-
back on global climate change. The C balance of arctic
ecosystems has therefore become the focus of global con-
cern. Bryophytes (the mosses, liverworts and hornworts)
are a major component of arctic vegetation (Walker 2000).
However, in contrast to many vascular plants, we lack
detailed data on bryophyte C allocation and turnover which
is needed to assess their overall contribution to the C bal-
ance of tundra ecosystems, and the likely changes to this
contribution following climatic change.
Understanding the C balance of ecosystems requires
quantification of the net C uptake and storage by vegetation
Communicated by Allan Green.
Electronic supplementary material The online version of thisarticle (doi:10.1007/s00442-011-1988-y) contains supplementarymaterial, which is available to authorized users.
L. E. Street (&) � M. Williams
School of Geosciences, Crew Building,
University of Edinburgh, Edinburgh EH9 3JN, UK
e-mail: [email protected]
J. A. Subke � A. Heinemeyer
Stockholm Environment Institute York, Environment
Department, University of York, York YO10 5DD, UK
J. A. Subke
School of Biological and Environmental Sciences,
University of Stirling, Stirlingm FK9 4LA, UK
M. Sommerkorn
Macaulay Land Use Research Institute,
Craigiebuckler, Aberdeen AB15 8QH, UK
123
Oecologia (2011) 167:325–337
DOI 10.1007/s00442-011-1988-y

(net primary productivity, NPP). NPP is the difference
between the fixation of CO2 as sugars in plant leaves
through photosynthesis (gross primary productivity, GPP),
and the return of a proportion of those sugars as CO2
through autotrophic respiration (Ra). The ratio of NPP:GPP
for whole ecosystems is often assumed to be constrained at
or close to 50% (Trumbore 2006; Waring et al. 1998),
though empirical data indicate substantial variation for
different ecosystems (Gifford 2003). There is also large
uncertainty over the length of time C resides in different
plant pools once incorporated, i.e. how quickly assimilated
C is turned over and returned to the atmosphere as CO2.
Mechanistic representation of GPP in vascular plants at
the ecosystem scale is well developed (Shaver et al. 2007;
Street et al. 2007; Williams et al. 2006), but allocation of
recent photosynthate among plant tissues, and the simula-
tion of Ra and its dependence on temperature, phenology,
and plant functional type, are not (Cannell and Thornley
2000). The limited theoretical underpinning of GPP parti-
tioning in models is based exclusively on work on higher
plants (Amthor 2000). However, estimates suggest that
bryophyte NPP is a significant fraction of total aboveground
NPP in the arctic; for example, 0.2 g m-2 day-1 or about
30% of aboveground NPP in Alaskan tussock tundra
(Chapin et al. 1995), 0.3 g m-2 day-1 or about 30% in
coastal tundra at Barrow (Miller et al. 1980), and 0.5 g m-2
day-1 or 25% of aboveground NPP in late summer in
Scandinavian tundra heath (Campioli et al. 2009). Under-
standing the NPP:GPP ratio, and the storage of C in arctic
vegetation, therefore requires an understanding of C allo-
cation and turnover processes in bryophytes.
Bryophyte ecophysiology differs markedly from vascu-
lar plants, though photosynthesis follows a C3 pathway
(Proctor et al. 1992). Bryophytes are smaller and slower
growing, with little or no supportive tissue, storage organs
or true roots. The genus Polytrichum has some internal
conducting tissues (Ayres et al. 2006), which allow upward
movement of water from the substrate, and some active
transport of assimilate to belowground parts including
emerging shoots (Thomas et al. 1988). Sphagnum grows
from the shoot apex, and maintains tissue water content by
retaining water within metabolically inactive hyaline leaf
cells (Vitt and Wieder 2009). With these different growth
strategies, we expect the respiratory costs of tissue growth
and maintenance, and therefore the allocation of recently
fixed carbon, to differ between bryophyte species and that
of vascular plants.
C isotope pulse-labelling has been widely used to track
the fate of photosynthesised C through the soil–plant sys-
tem (Dawson et al. 2002; Bowling et al. 2008). In order to
address the gap in our knowledge regarding the role of
bryophytes in arctic C dynamics, we followed a 13C pulse
label in arctic bryophyte communities, dominated by
Polytrichum piliferum (Hedw.) and Sphagnum fuscum
((Schimp.) H. Klinggr.) in situ. For the first time, we
continuously measured the respiratory return of 13CO2 for
5 days using a field-deployed mass spectrometer. We built
a simple model of bryophyte photosynthesis and C turnover
to address the following questions: (1) what is the ratio of
NPP:GPP, (2) what is the turnover time (TT) of recently
photosynthesised carbon, and (3) how do differences in C
allocation and turnover relate to morphological
complexity?
Materials and methods
Site description
We located our field site near Abisko in northern Sweden,
on a hillside approximately 6 km south of Lake Tornetrask
(68�180N, 18�510E). Mean annual air temperature in the
Abisko valley is -1�C, mean July temperature 11�C, and
annual precipitation around 300 mm. The sun does not set
between the beginning of June and mid-July, but photo-
synthetic photon flux density (PPFD) is low (*25 lmol
m-2 s-1) at midnight even during mid-summer (Abisko
Research Station, ANS, website, http://www.linnea.
com/*ans/ans.htm). The vegetation at the site is mainly
comprised of ericaceous tundra heath, with deciduous
shrubs in sheltered snowbeds, and barren cryptogam-
dominated vegetation on exposed ridges. Where drainage is
impeded, there are sedge and Sphagnum-dominated com-
munities. Sphagnum fuscum grows in hummocks in the wet
sedge areas, and Polytrichum piliferum is locally abundant
in more freely drained rocky areas with thinner soils.
Experimental methods
Overview of experimental set-up
We pulse-labelled four replicate plots of Sphagnum (Sp1–
Sp4) and Polytrichum (Po1–Po4) on 8 July 2007. We
monitored the return of 13C in respired CO2 from these
plots over 5 days, and sampled moss tissues for 13C content
daily for 5 days, then at 2 and 6 weeks and 1 year after
labelling. The time-series of 13C content in tissues allowed
us to parameterise a model of C turnover.
Pulse labelling
We applied CO2 of 98% atom enrichment in 13C at a con-
centration of 375 ll l-1 from 1600 to 1815 hours local time
on 8 July 2007 using 0.55 9 0.55 9 0.2 m clear acrylic
labelling hoods. Before labelling, all vascular plants were
removed from the plots by clipping stems at the level of the
326 Oecologia (2011) 167:325–337
123

bryophyte surface, and manual watering ensured sufficient
moisture for photosynthesis (see Online Resource 1 for
details on plot preparation). In order to quantify the physical
uptake of pulse-derived (PD) 13CO2 (through dissolution in
surface moisture, or diffusion into surface air spaces) versus
biological uptake through photosynthesis, we darkened one
half of the labelling hood to prevent photosynthetic uptake
by attaching a cardboard partition down the middle and
covering one half with black plastic film (see Online
Resource 1). PPFD varied between 440 and 870 lmol m-2
s-1 during labelling on the ‘light’ side of the plots. We cut
around the plots and between the light and dark sides with a
knife to a depth of approximately 15 cm to prevent potential
lateral translocation of the label. Sampling of bryophyte
material, as well as 13CO2 flux measurements, were carried
out at the centre of plots to avoid edge effects from dis-
turbance to the moss carpet from the Perspex hood and
possible light ingression on the ‘dark’ side. We took gas
samples of 13CO2 concentration inside hoods once every
hour during the labelling period for later analysis.
13C in ecosystem respired CO2
We began monitoring the return of 13CO2 at 1824 hours on
the day of labelling. We monitored 13CO2 from labelled
and non-labelled control (natural abundance, NA) plots
using 0.2-m-diameter opaque collars placed onto the moss
surface. Any gaps between the collar and the ground were
filled with bubble plastic. The CO2 concentration and13C/12C isotopic ratio in sample lines from soil chambers
were measured directly in the field using isotope ratio mass
spectrometry (IRMS), in the ‘‘York Mobile Lab’’. For
technical details of the mass spectrometry, see Online
Resource 1 and Subke et al. (2009). The York Mobile Lab
was set up to sample CO2 from the labelled and NA collars
in sequence (Sp1, Po1, Sp2, Po2,…,SpNA1, PoNA1), with
a full sampling cycle taking 1 h, and composed of the ten
collar lines as well as one reference gas and one ambient
air line. After two sampling cycles, all the collars were
switched over to the opposite side of the plot (‘light’ side to
‘dark’ side or vice-versa). Overnight, the number of sam-
pling cycles between switching collars was increased to
four. The result was at least one sample of ecosystem
respired 13CO2 every 2–4 h from all the ‘light’ sides of the
labelled plots measured consecutively, followed by 13CO2
samples from the ‘dark’ sides every hour for 2–4 h. We
continued sampling for 5 days until 1200 hours on 12 July,
with a gap in sampling from 1200–2000 hours on 11 July.
Gas samples from the labelling hoods collected in Exe-
tainers (12-ml gas tight glass vials; Labco, High Wycombe,
UK) during labelling were also analysed by the York
Mobile Lab after the end of the field deployment (see
Online Resource 1).
13C in moss tissues
Samples of moss material were collected daily from the
labelled plots during late afternoon from 8 to 12 July, on
27 July, and 19 August 2007. We sampled tissues from
the dark side of the plots on 8, 10 and 12 July, and took
NA samples on 8, 10 and 12 July and on 19 August 2007.
The green leaves of several Polytrichum shoots (‘photo-
synthetic’ tissue) were sampled, together with the next
1 cm of stem from each shoot (‘stem’ tissue). For
Sphagnum, we separated the capitulum tissue (approxi-
mately the top 0.5 cm of the shoot, hereafter referred to
as ‘photosynthetic’ tissue) from the next 1 cm (the sub-
capitulum, for convenience hereafter referred to as ‘stem’
tissue) of several shoots. Samples were transported from
the field and frozen at -20�C within 3 h of sampling,
except for 8–10 July, when logistical constraints pre-
vented us from transporting the samples immediately back
to the laboratory at ANS. In this case, samples were kept
in cool storage (below 10�C) in the field and were frozen
the following day. On 27 July 2007 and 28 June 2008, we
also sampled moss tissues deeper in the profile, in
4 cm 9 4 cm cores separated into 1-cm horizontal sec-
tions below the Polytrichum stem tissue and Sphagnum
sub-capitulum tissue. In August 2009, we destructively
sampled mosses from within the area measured by the
collars, and separated into 1-cm horizontal sections to
measure total moss biomass in each layer. All samples
were stored at -20�C for about 3 weeks and then dried
for 3 days at 70�C and milled (Mixer Mill MM200;
Retsch, Haan, Germany). The 2007 samples were ana-
lysed for 13C/12C ratios, and %C content on an IRMS at
the Macaulay Land Use Research Institute, while 2008
tissue samples were analysed at York University (see
Online Resource 1 for technical details).
GPP measurements
To corroborate the GPP component of our bryophyte car-
bon turnover model, we compared modelled GPP based on
laboratory measurements (see Online Resource 1) to 26
GPP light response curves measured in the field on the
same species nearby the experimental area. We measured
net ecosystem exchange (NEE) of CO2 per unit ground
area of three replicate plots of Polytrichum and Sphagnum,
on 21 and 29 June and 4 and 20 July using a 20 cm 9
20 cm Plexiglas chamber connected to a LI-COR 6400
photosynthesis system in closed system mode. To measure
a light response curve, we successively darkened the
chamber using sheets of optically neutral netting. We cal-
culated GPP by adding ecosystem respiration (ER), mea-
sured under fully darkened conditions, to the net CO2 flux.
Closed chamber flux methods follow Douma et al. (2007).
Oecologia (2011) 167:325–337 327
123

Modelling
Bryophyte turnover (BT) model structure
Following isotopic labelling, the concentration of 13C in
bulk photosynthetic tissues decreases over time. While the
tissue is alive, the decrease is a result of 13C loss through
Ra, any translocation out of the tissue, and potential dilu-
tion by new unlabelled photosynthate. To take account of
these processes, including the dilution effect of new growth
following labelling, we built a simple four-pool model of
bryophyte productivity and photosynthate turnover.
The bryophyte turnover (BT) model operates on a
10-min time step, and consists of four C pools (Fig. 1): (1)
a labile (fast turnover) carbon pool in photosynthetic tissue
(2) a structural (slow turnover) pool in photosynthetic tis-
sue, and (3) labile pool in non-photosynthetically active
‘stem’ tissue, and (4) a structural C pool in ‘stem’ tissue
(stem in Polytrichum, sub-capitulum tissue in Sphagnum;
Table 1). We assume there is no photosynthesis in the
‘stem’ tissue in Polytrichum, and Sphagnum. Carbon influx
is to the labile C pool in photosynthetic tissue as GPP.
There is a translocation flux of labile C from photosyn-
thetic to ‘stem’ tissue in both species (At), and labile C is
incorporated into structural C in both photosynthetic and
stem components via an allocation flux (Ag and As). C loss
from the photosynthetic labile pool is via respiration (Rg),
from the stem labile pool via respiration and translocation
to deeper belowground tissues (Rs and Ad), and from the
structural pool via litter loss (Lg and Ls) (Table 1).
There are 11 parameters in the model (Table 1). Three
are photosynthesis parameters (pt, pc, and pk) describing the
response of GPP to light and temperature (Eqs. 1 and 2).
These parameters are based on laboratory measurements
described in Online Resource 1. Three fitted parameters
describe the exponential temperature response of respira-
tion; a basal rate for photosynthetic and stem tissue (rg and
rs) and the exponent (rc). We assume that only the basal
respiration rate differs between tissue types, and that in stem
tissue, the basal rate of respiration implicitly includes dee-
per translocation Ad. A further three fitted parameters are
linear coefficients controlling allocation fluxes in photo-
synthetic (ag) and stem tissue (as), and the translocation of
labile C from photosynthetic to stem tissue (at). lg and ls are
fitted litter loss parameters. The model is run in a paired
mode. One model version describes ambient natural abun-
dance conditions (the NA model). The other model version
simulates the pulse labelling and the fate of that pulse (the
PD model). The two models are combined to provide esti-
mates of isotopic fractions over time. Pools, fluxes and
parameters for the PD model are given a subscript l. For
model equations, see Table 2.
We modelled the photosynthesis of each moss species
using data from the laboratory-based CO2 flux measure-
ments. We modelled GPP with Pmax as a linear response of
temperature:
Pmax ¼ ptT þ pc ð1Þ
GPP ¼ PmaxI
I þ pk
ð2Þ
where T is moss temperature (�C), I is incident photosyn-
thetically active radiation (lmol m-2 s-1), pk is the half-
saturation constant of photosynthesis (lmol m-2 s-1), and
pc and pt are parameters fitted using linear regression in
Matlab 7.1. We were then able to model GPP over the
course of the growing season using 10-min incident radi-
ation data provided by ANS, and local moss temperature
data from the field GPP measurement plots, recorded using
HOBO Micro Station dataloggers and temperature probes
(Onset, MA, USA). During the labelling period, we used
light and temperature data measured within the hoods using
the LICOR 6400.
BT model initial conditions
Initial bryophyte biomass in the model was set at a nominal
1 mol C m-2, and the initial fraction of labile carbon was
set at 5% (approximated from published values of 6% for
non-structural carbohydrate in Polytrichum alpinum
(Sveinbjornsson and Oechel 1981) and 3% water-soluble
carbohydrates in Sphagnum fuscum (Turetsky et al. 2008).
The ratio of stem to photosynthetic tissue was set at 1:1 in
Polytrichum and 1:0.81 in Sphagnum, based on the relative
mass of samples collected in the field. We ran the model
for a 2-week ‘spin-up’ period, before simulating labelling.
G
S
Cg_slow
GPP
Ag
s
L g
S (Rs + Ad)
At
lab
lab
GslowAg
Aslow
G
S
Cg_slowAg
s
S
At
lab
lab
GstrAg
A
Rg
str
Photosynthetic tissue
Stem tissue
Labile C losses
Structural C losses
L s
Fig. 1 The bryophyte turnover (BT) model. Dashed boxes indicate
pools or fluxes for which the bulk carbon isotope ratio was
determined following pulse labelling. Gstr and Glab are structural
and labile C pools in photosynthetic tissue. Sstr and Slab are structural
and labile C in non- photosynthetic ‘stem’ tissue. Rg and Rs are
respiration fluxes from the labile C pools. GPP is the input of C to the
model via photosynthesis. Ag is the allocation flux from labile to
structural C in photosynthetic tissues, As is the allocation flux from
labile to structural C in stem tissues, At is the translocation flux of
labile C from photosynthetic tissue to stem tissues, Ad is belowground
translocation, Lg and Ls are litter loss fluxes from the structural pools
328 Oecologia (2011) 167:325–337
123

By the beginning of the labelling period, the modelled
labile fraction in Polytrichum had stabilised to 7–9% and in
Sphagnum to 4–6%.
Model: data comparison
In order to simulate the turnover of 13C label, two identical
versions of the BT model were run side by side using the
same driving data. The NA version represented the pools
and fluxes of C at NA 13C atom%. The second version, the
‘pulse-derived’ (PD) model represented the flux and turn-
over of excess 13C supplied during the labelling period.
The PD 13C input flux was calculated by multiplying
modelled GPP by an enrichment (E) in the labelling hoods
of 7% (atom% 13C above the NA of 13C in air). In reality,
the enrichment in the labelling hoods varied between
individual hoods. In order to compare the model to a single
field dataset for each species, we normalised the PD 13C
content in gases and tissues (to a labelling hood head space
concentration of 7 atom%) then averaged across replicates.
E was set to zero after 130 min, the duration of the
labelling period. During the labelling period, the NA GPP
flux was multiplied by 1 - E. For the 5 days following
labelling, we set E to the 13CO2 atom% measured in the
CO2 sampling collars, to allow for re-fixation of respired13CO2. The PD model then operated identically to the NA
model using the same parameter values but with no further13C input.
The atom% of PD 13C in photosynthetic (Gap) and stem
(Sap) tissue was calculated at each time step from the output
of the two models:
Gap ¼ Glab l þ Gstr lð Þ= Glab l þ Gstr l þ Glab þ Gstrð Þ� 100 ð3Þ
Table 1 Description of carbon
pools, fluxes, parameters and
model drivers for the BT model
with units; Pmax is the
theoretical light saturated rate of
GPP (Eq. 2)
a Above natural abundance
(NA) in air
Description Units
Pools
Glab Labile C in photosynthetic tissue mol C
Gstr Structural C in photosynthetic tissue mol C
Slab Labile C in stem tissue mol C
Sstr Structural C in stem tissue mol C
Fluxes
GPP Gross photosynthesis mol C h-1
Rg Respiration from photosynthetic tissue mol C h-1
Rs Respiration from stem tissue mol C h-1
At Translocation photosynthetic tissue to stem tissue mol C h-1
Ad Translocation to below ground stems and rhizome mol C h-1
Ag Allocation to structural C in photosynthetic tissue mol C h-1
As Allocation to structural C in stem tissue mol C h-1
Lg Litter loss photosynthetic tissue mol C h-1
Ls Litter loss stem tissue mol C h-1
Drivers
T Moss temperature �C
I Photosynthetic photon flux density lmol m-2 s-1
E 13C enrichment inside labelling hooda Atom%
Parameters
pt Slope of Pmax versus temperature mol C mol C-1 h-1 �C-1
pc Intercept of Pmax versus temperature mol C mol C-1 h-1
pk GPP light response half-saturation constant umol m-2 s-1
rg Basal respiration rate photosynthetic tissue mol C mol C-1 h-1
rs Basal respiration rate stem tissue mol C mol C-1 h-1
rc Exponent respiration temperature response
at Translocation rate mol C mol C-1 h-1
ag Allocation rate photosynthetic tissue mol C mol C-1 h-1
as Allocation rate stem tissue mol C mol C-1 h-1
lg Litter loss rate photosynthetic tissue mol C mol C-1 h-1
ls Litter loss rate stem tissue mol C mol C-1 h-1
Oecologia (2011) 167:325–337 329
123

Sap ¼ Slab l þ Sstr lð Þ= Slab l þ Sstr l þ Slab þ Sstrð Þ � 100
ð4Þ
where G is photosynthetic tissue, S is stem tissue, lab is
labile, str is structural, ap is atom%. The subscript l indi-
cates fluxes from the PD model, all other fluxes are from
the NA model. See Table 1 for full variable descriptions
and units. We calculated the PD 13C content of sampled
moss tissues by subtracting NA atom% 13C in each tissue
type from measured atom% 13C.
The total PD loss of 13C from labile pools (Clossl) (mol13C m-2 h-1) in the model was the sum of respiration from
the photosynthetic and stem components of the PD model
(with deeper translocation implicit in the stem respiration
term):
Clossl ¼ ðRgl þ RslÞ: ð5Þ
We compared modelled Clossl with the biological
respiratory return of 13C (Rgl ? Rsl) measured in the field
over 5 days following labelling, which we calculated by
subtracting the diffusive 13C flux (from the ‘dark’ side of
the plot) from the total biological and diffusive 13C flux
from the ‘light’ side. The 13C flux from the darkened side
of the plot also included biological 13C flux at NA, so we
assumed that ‘light’ minus ‘dark’ 13C flux is entirely
biological PD 13C. We linearly interpolated measured13CO2 fluxes to calculate total 13C loss in respiration over
5 days. Gaps in the measured 13CO2 flux data were filled
by assuming a consistent offset between modelled and
measured fluxes. Because occasional gusts of wind caused
some leakage of air from the collars, the absolute amount
of CO2 recorded in the sample lines could not be regarded
as an accurate estimate of respiration from the area
enclosed by the collars. As we could not correct for this
loss, respiration fluxes were instead based on temperature
regressions for independent closed chamber measurements
made with a LI-COR 8100 Soil CO2 Flux System (LI-
COR, Lincoln, NE, USA) attached to a 20-cm-diameter
survey chamber. These respiration measurements were
carried out daily for 5 days after pulse-labeling. Isotope
ratio estimates obtained by the mass spectrometer were
valid, however, as ambient air concentrations of 12C and13C were subtracted from the respective concentrations of
the sample gas. Any enrichment in either CO2 isotope with
regard to ambient CO2 concentrations therefore originated
from respiratory processes within the chamber, and any
possible leakage would not affect the isotopic ratio. Since
small levels of CO2 enrichment in the sample gas are prone
to larger errors, isotope ratio estimates were only
considered if the respiration-derived CO2 in the sample
gas amounted to more than 50 lmol mol-1.
Model optimisation
The BT model (PD and NA versions running simulta-
neously) was optimised using an Ensemble Kalman Filter
(EnKF; Fox et al. 2009; Williams et al. 2005). The EnKF
was chosen because it can determine the uncertainty on
resulting parameter estimates and model predictions (see
Online Resource 1 for more details on the EnKF analysis).
In order to avoid potential bias due to suspected inadequate
sample storage over the first 3 days, all optimisations were
initially carried out using only data from 11 July onwards
(4 time points), for which we had full confidence in the
sample storage. We also excluded a Sphagnum plot which
Table 2 Bryophyte turnover
model equationsNatural abundance model Pulse derived model
Pools
Glab ¼ GPP� Rg � Ag � At Glab l ¼ GPPl � Rgl � Agl � Atl
Gstr ¼ Ag � Lg Gstr l ¼ Agl � Lgl
Slab ¼ At � Rs � As Slab l ¼ Atl � Rsl � Asl
Sstr ¼ As � Ls Sstr l ¼ Asl � Lsl
Fluxes
GPP ¼ ðptTþpcÞIIþpk
ðGlab þ GslowÞ� �
ð1� EÞ GPPl ¼ ðptTþpcÞIIþpk
ðGlab þ GslowÞ� �
ðEÞ
Closs ¼ Rg þ Rs þ Ad Clossl ¼ Rgl þ Rsl þ Adl
Rg ¼ rgeðrcTÞGlab Rgl ¼ rgeðrcTÞGlab l
Rs ¼ rseðrcTÞSlab Rsl ¼ rs þ adeðrcTÞSlab l
Ag ¼ agGlab Agl ¼ agGlab l
At ¼ atGlab Atl ¼ atGlab l
As ¼ asSlab Asl ¼ asSlab l
Lg ¼ lgGstr Lgl ¼ lgGstr l
Ls ¼ lsSstr Lsl ¼ lsSstr l
330 Oecologia (2011) 167:325–337
123

had very low 13CO2 enrichment during labelling (\2%),
due to large errors relative to signal in the tissue data. After
initial optimization, we identified data which fell below the
modelled 95% confidence interval (8 July for Polytrichum,
8 and 9 July for Sphagnum) and repeated the analysis with
all the data except for these points. Final optimisation was
therefore on tissue data from 9 July onwards for Polytri-
chum (i.e. 6 sampling time points) and 10 July onwards for
Sphagnum (5 sampling time points). The outcome of the
EnKF process was an ensemble of parameter sets statisti-
cally consistent with the model, the observations, and their
relative errors.
We used modelled GPP and the sum of the allocation
fluxes (Ag and As) in the natural abundance model to cal-
culate the ratio of NPP to GPP over 5 days following
labelling. We define TT to be the time taken for 50% of the
recently fixed labile C pool to be either allocated to slow
turnover (structural) pools or respired as CO2. To quantify
TT, we calculated the time taken for 50% of the PD 13C to
be turned over in the model (respired or allocated to
structural components). We expressed the measured and
predicted amount of PD 13C remaining in the tissue as a
percentage of the modelled 13C assimilated during the
labelling period.
Model and observation uncertainty
We used the error variance in observed tissue PD atom%13C across plots for each species to inform the EnKF. The
minimum SD was 0.001 atom% 13C and maximum SD was
0.005 atom% 13C for Sphagnum and 0.002 atom% 13C and
0.007 atom% 13C for Polytrichum. We assessed the model
fit for forward runs of each ensemble member by calcu-
lating the chi-squared value, with n-p-1 degrees of
freedom:
v2 ¼Xn
1
1
r2yi
yi;measðxiÞ � yi;modðxi : p� �� �2
ð6Þ
where n is the total number of measurements (of photo-
synthetic and stem atom% PD 13C), p is the number of
model parameters (8), yi,meas(xi) is the measured value of
output variable y (either Gap or Sap) at the value xi of the
driving variable x, yi,mod(xi:p) is the modelled value of
the output variable (either Gap or Sap) at the value xi of the
driving variable x given the parameters p, and ryi2 is the
maximum measurement error variance for each species.
The degrees of freedom for Sphagnum were 21 (n = 30,
stem and photosynthetic tissue for 5 times points and 3
replicate plots), for Polytrichum 39 (n = 48, with stem and
photosynthetic tissue for 6 times points and 4 replicate
plots). We then retained only those ensemble forward runs
with chi-squared values less than the critical value at the
5% level (Williams et al. 2006). We calculated a 90%
confidence interval (CI) on NPP:GPP and TT by excluding
the most extreme upper 5% and lower 5% of NPP:GPP and
TT values which result from forward runs of the ensemble
members which pass the chi-square test.
All model parameters and initial conditions were tested
for sensitivity by varying each parameter individually by
?100 or -50% and assessing the effect on the RMSE and
r2 of modelled versus predicted PD atom% 13C, the
NPP:GPP ratio, and the labile C TT.
Results
Pulse-labelling
The average enrichment (atom% above NA) of 13CO2
inside the hoods during pulse-labelling varied between 1.5
and 15.5 atom%, and there was a positive linear correlation
with the initial 13C enrichment in the photosynthetic tissues
immediately after labelling for both species (R2 = 0.98 for
Polytrichum, R2 = 0.89 for Sphagnum). Darkening the
hoods was effective in preventing 13CO2 uptake into the
tissues via photosynthesis (Fig. 2) in all but one plot (Po4).
Excluding Po4, the average tissue enrichment of Polytri-
chum photosynthetic tissue on the dark side of the plot was
0.0008 ± 0.0008 atom%, and for Sphagnum capitula
0.0001 ± 0.0002 atom%. The enrichment of photosyn-
thetic tissue in the dark side of plot Po4 was \20% of the
enrichment in the light side, and this plot was included in
subsequent analysis. We detected pulse-derived 13C in
ecosystem-respired CO2 from both the dark and light sides
of the labelling plots immediately after labelling (see Fig. 3
for example data for each species). 13CO2 enrichment
Fig. 2 Atom% 13C content of a Polytrichum and b Sphagnumphotosynthetic tissues from ‘light’ and ‘dark’ treatments. Grey barNA ± 1SE
Oecologia (2011) 167:325–337 331
123

decreased rapidly over the first day, in both ‘light’ and
‘dark sides of the plot, though 13C enrichment of CO2 was
apparent in the ‘light’ side of some plots 5 days after
labelling.
Light response of GPP
The photosynthetic rate in Polytrichum was almost 3
times that of Sphagnum; fitted Pmax for Polytrichum was
0.027, and 0.010 lmol C g-1 s-1 for Sphagnum at 20�C
(Fig. 4a). Photosynthesis also saturated at lower light levels
in Sphagnum (the average half-saturation constant, k, for
Sphagnum was 75 lmol m-2 s-1, for Polytrichum
130 lmol m-2 s-1). Pmax for both species increased with
temperature between 5 and 20�C (Fig. 4a). Modelling GPP
using laboratory-based light and temperature response
curves (on a per unit area basis) produced reasonable
results when compared to field data (for Polytrichum
r2 = 0.74, for Sphagnum r2 = 0.66; Fig. 4b).
C dynamics in tissues
Using the EnKF, we found BT model parameterisations
which were consistent with observations of PD atom% 13C
in photosynthetic and stem tissue 2–42 days after labelling
(Fig. 5; and Online Resource 2, top row, Tables 1 and 2).
For Polytrichum, 29 ensemble members had acceptable
chi-square values at the 5% level, while for Sphagnum, 107
ensemble members had acceptable chi-squared values. For
Polytrichum, the forward run of the average acceptable
parameters from the EnKF produced a linear regression of
predicted versus measured PD 13C in photosynthetic tissue
with an r2 of 0.96 for a slope of 1.3; for stem tissue, the r2
was 0.83 and the slope was 1.3. The BT model was also
successful in predicting Sphagnum tissue 13C content;
predicted versus measured PD 13C in capitulum tissue had
an r2 0.94, and a slope of 0.76. In stem tissue, the r2 was
0.02 for a slope of 0.27. The low r2 for Sphagnum sub-
capitulum tissue can be explained by the small relative
magnitude of changes in tissue 13C content relative to
measurement error. The first Polytrichum tissue sample
contained \100% of the modelled 13C uptake. For
Sphagnum, samples over the first 2 days had significantly
less 13C than that predicted by the model (Fig. 5)
A much lower proportion of recently assimilated C was
incorporated into structural tissue in Polytrichum; using all
acceptable ensemble forward runs, the model predicted an
average of 23% of GPP allocated to tissue growth over
5 days following labelling, with a 90% CI of 9–35%. The
average allocation in Sphagnum was 43% of GPP with a
90% CI of 19–65%. Turnover times of assimilated C were
also faster in Polytrichum; it took on average 1.7 days for
50% of the initial 13C uptake to be incorporated into
structure or respired with a 90% CI of 1.1–2.5 days, while
for Sphagnum, turnover times were slightly slower at
3.1 days, 90% CI 1.6–6.1 days. Approximately 21% in
Polytrichum and 51% in Sphagnum of PD 13C remained in
the photosynthetic tissue plus the top 2 cm of stem tissue
2 weeks after labelling, and 20% in Polytrichum and 25%
in Sphagnum of PD 13C remained after 1 year (Table 3).
Differences in 13C enrichment between NA and labelled
plots after 1 year were significant only in photosynthetic
tissue (data not shown).
13C in respiration flux
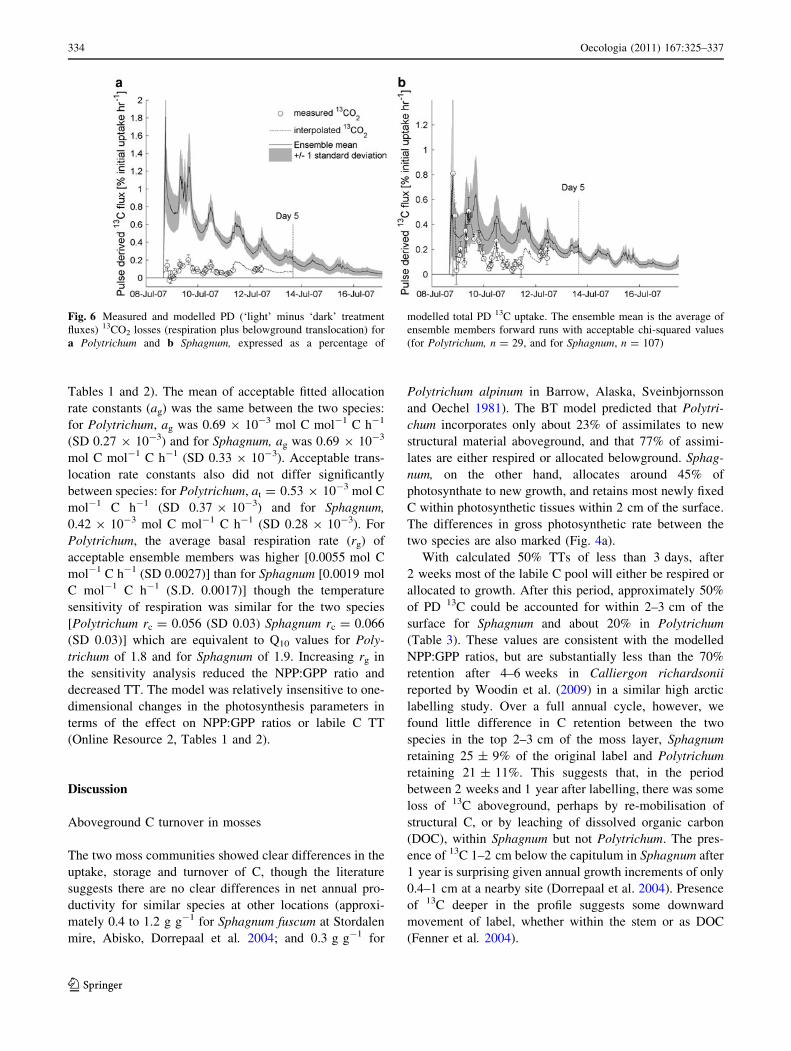
For Sphagnum, the BT model predicted that 37% (CI
24–51%) of the initial label uptake had been lost from
tissues, from the labile pool, after 5 days (Fig. 6b). Total13C in respired CO2 calculated from interpolation of
measured fluxes was 22%, suggesting that over 5 days our
measurements of the isotopic composition of tissues and
respiration left approximately 15% of the initial 13C uptake
unaccounted for. The diurnal temperature signal in the
measured fluxes was replicated by the model, though the
overall ability of the BT model to predict 13CO2 flux over
the entire 5-day measurement period was low (r2 = 0.13;
Online Resource Table 2). C losses predicted by the model
are greater than measured 13CO2 fluxes especially 2–3 days
after labelling (10–11 July).
The discrepancy between modelled C losses and bio-
logical PD 13C flux was greater for Polytrichum than for
Sphagnum, as modelled losses exceeded measured respi-
ratory 13CO2 flux over the entire 5-day period following
labelling (Fig. 6a). The BT model predicted that 63% (CI
50–77%) of the initial label uptake had been lost from
tissues (Fig. 6b). Total 13C in respired CO2 calculated from
the interpolation of measured fluxes was only 11%,Fig. 3 Atom% 13C of ecosystem CO2 flux from a Polytrichum (Po2)
and b Sphagnum (Sp3) light and dark treatments
332 Oecologia (2011) 167:325–337
123

suggesting 52% of the initial 13C uptake was unaccounted
for. Discrepancies between modelled and measured 13CO2
fluxes for either species do not have any effect on the
partitioning or turnover of labile C in the model nor on our
estimates of NPP:GPP ratio or TT, as only tissue data were
used during model optimisation.
Model parameters and sensitivity
Modelled aboveground NPP:GPP ratios and TTs were most
sensitive to basal respiration rate (rg), respiration temper-
ature response (rc) and allocation (ag) and translocation (at)
rate constants in photosynthetic tissue (Online Resource 2,
Fig. 4 a Fitted light saturated photosynthesis (Pmax) from laboratory-
based GPP light response curves for Polytrichum and Sphagnum.
b Modelled versus measured GPP for nearby patches of Sphagnum
and Polytrichum between 20 June and 20 July 2007, using the BT
GPP model with parameters pt, pc, and pk
Fig. 5 Measured and modelled PD 13C remaining in moss tissues for
a Polytrichum and b Sphagnum, expressed as a percentage of
modelled PD 13C uptake. The ensemble mean is the average of
ensemble members forward runs with acceptable chi-squared values
(for Polytrichum, n = 29, and for Sphagnum, n = 107)
Table 3 Pulse-derived 13C
remaining in photosynthetic and
stem tissues 2 weeks and 1 year
after pulse-labelling
Species Tissue % 13C remaining
2 weeks
% 13C remaining
1 year
Polytrichum Leaves 19.4 ± 8.3 15.5 ± 8.1
0–1 cm stem 2.4 ± 2.4 3.8 ± 1.7
1–2 cm stem -0.5 ± 1.4 1.1 ± 1.3
Total 21.3 ± 11.7 20.5 ± 11.0
Sphagnum Capitulum 31.6 ± 10.1 13.5 ± 4.4
0–1 cm stem 12.2 ± 2.9 9.4 ± 4.8
1–2 cm stem 6.9 ± 3.5 2.4 ± 4.4
Total 50.7 ± 7.6 25.3 ± 8.8
Oecologia (2011) 167:325–337 333
123
Tables 1 and 2). The mean of acceptable fitted allocation
rate constants (ag) was the same between the two species:
for Polytrichum, ag was 0.69 9 10-3 mol C mol-1 C h-1
(SD 0.27 9 10-3) and for Sphagnum, ag was 0.69 9 10-3
mol C mol-1 C h-1 (SD 0.33 9 10-3). Acceptable trans-
location rate constants also did not differ significantly
between species: for Polytrichum, at = 0.53 9 10-3 mol C
mol-1 C h-1 (SD 0.37 9 10-3) and for Sphagnum,
0.42 9 10-3 mol C mol-1 C h-1 (SD 0.28 9 10-3). For
Polytrichum, the average basal respiration rate (rg) of
acceptable ensemble members was higher [0.0055 mol C
mol-1 C h-1 (SD 0.0027)] than for Sphagnum [0.0019 mol
C mol-1 C h-1 (S.D. 0.0017)] though the temperature
sensitivity of respiration was similar for the two species
[Polytrichum rc = 0.056 (SD 0.03) Sphagnum rc = 0.066
(SD 0.03)] which are equivalent to Q10 values for Poly-
trichum of 1.8 and for Sphagnum of 1.9. Increasing rg in
the sensitivity analysis reduced the NPP:GPP ratio and
decreased TT. The model was relatively insensitive to one-
dimensional changes in the photosynthesis parameters in
terms of the effect on NPP:GPP ratios or labile C TT
(Online Resource 2, Tables 1 and 2).
Discussion
Aboveground C turnover in mosses
The two moss communities showed clear differences in the
uptake, storage and turnover of C, though the literature
suggests there are no clear differences in net annual pro-
ductivity for similar species at other locations (approxi-
mately 0.4 to 1.2 g g-1 for Sphagnum fuscum at Stordalen
mire, Abisko, Dorrepaal et al. 2004; and 0.3 g g-1 for
Polytrichum alpinum in Barrow, Alaska, Sveinbjornsson
and Oechel 1981). The BT model predicted that Polytri-
chum incorporates only about 23% of assimilates to new
structural material aboveground, and that 77% of assimi-
lates are either respired or allocated belowground. Sphag-
num, on the other hand, allocates around 45% of
photosynthate to new growth, and retains most newly fixed
C within photosynthetic tissues within 2 cm of the surface.
The differences in gross photosynthetic rate between the
two species are also marked (Fig. 4a).
With calculated 50% TTs of less than 3 days, after
2 weeks most of the labile C pool will either be respired or
allocated to growth. After this period, approximately 50%
of PD 13C could be accounted for within 2–3 cm of the
surface for Sphagnum and about 20% in Polytrichum
(Table 3). These values are consistent with the modelled
NPP:GPP ratios, but are substantially less than the 70%
retention after 4–6 weeks in Calliergon richardsonii
reported by Woodin et al. (2009) in a similar high arctic
labelling study. Over a full annual cycle, however, we
found little difference in C retention between the two
species in the top 2–3 cm of the moss layer, Sphagnum
retaining 25 ± 9% of the original label and Polytrichum
retaining 21 ± 11%. This suggests that, in the period
between 2 weeks and 1 year after labelling, there was some
loss of 13C aboveground, perhaps by re-mobilisation of
structural C, or by leaching of dissolved organic carbon
(DOC), within Sphagnum but not Polytrichum. The pres-
ence of 13C 1–2 cm below the capitulum in Sphagnum after
1 year is surprising given annual growth increments of only
0.4–1 cm at a nearby site (Dorrepaal et al. 2004). Presence
of 13C deeper in the profile suggests some downward
movement of label, whether within the stem or as DOC
(Fenner et al. 2004).
Fig. 6 Measured and modelled PD (‘light’ minus ‘dark’ treatment
fluxes) 13CO2 losses (respiration plus belowground translocation) for
a Polytrichum and b Sphagnum, expressed as a percentage of
modelled total PD 13C uptake. The ensemble mean is the average of
ensemble members forward runs with acceptable chi-squared values
(for Polytrichum, n = 29, and for Sphagnum, n = 107)
334 Oecologia (2011) 167:325–337
123

Translocation fluxes
The model predicts much greater loss of 13CO2 from
aboveground tissues for Polytrichum than was measured as
respiration (Fig. 6a), suggesting that we were unable to
account for 52% of the assimilated label during the 5 days
after labelling. Previous work on other Polytrichum species
has shown that significant amounts of assimilate can be
transported to belowground tissues, especially to the apices
of underground shoots (Collins and Oechel 1974).
Sveinbjornsson and Oechel (1981) show that belowground
respiration in Polytrichum alpinum can account for 30% of
net CO2 uptake (though any belowground incorporation, if
it occurred, would be significantly less than 30% of gross
CO2 uptake). In a 14C tracer study, Thomas et al. (1990)
showed that incorporation of photo-assimilates below-
ground in Polytrichum commune 1 week after labelling can
be between 13 and 21% of that incorporated aboveground.
This would equate to roughly 3–5% of gross photosyn-
thesis, if aboveground incorporation was *20% of GPP,
as in this case. A 14C labelling study in P. commune by
Skre et al. (1983) found similar results; after 5 days,
80–85% of the label remaining in tissues was in the apical
3 mm of current year’s growth. While we therefore cannot
quantify incorporation of label in deep tissues below-
ground, we argue that it is unlikely to be more than 10% of
GPP though likely to be strongly dependant on growth
stage and variable across months/seasons.
The discrepancy between modelled C loss and measured
respiratory flux for Polytrichum could also be explained by
the following. Firstly, the comparison between predicted
and modelled respiratory 13CO2 return requires a conver-
sion from the measured 13CO2 flux per unit ground area, to13CO2 return per unit photosynthetic biomass in the collar.
This conversion requires an accurate measurement of the
total photosynthetic biomass in the collars at the time of13CO2 sampling. We could only destructively harvest the
moss from the collars at the end of the experiment (August
2009) so probably over-estimated total photosynthetic
biomass in July 2007, due to growth during the interim
period. An overestimate of photosynthetic biomass in the
collar would result in an underestimate of measured 13C
return on a per unit biomass basis. Secondly, we also
detected small amounts of PD 13C in the ‘dark’ side of the
plots, so the ‘light’ minus ‘dark’ subtraction may have
resulted in a slight underestimate of biological 13C flux.
Morphological complexity in Polytrichum
and Sphagnum
Observed differences in C turnover and allocation can be
related to differences in morphological complexity
between the two species. The Polytrichaceae have highly
differentiated leaves with dense chlorophyll-rich lamellae
cells on adaxial surfaces (Thomas et al. 1996). The pres-
ence of wax on the leaf surface also facilitates rapid con-
ductance of CO2 into the leaf by repelling water (Proctor
2009). Highly complex and metabolically active tissues
may thus explain greater respiratory energy demand in
Polytrichum, together with the costs associated with
downward translocation of assimilate (similar to phloem
loading), or upward movement of nutrients from the soil
(Chapin et al. 1987). Sphagnum by contrast absorbs water
and nutrients directly from precipitation. The presence of
liquid water on the leaf surface increases diffusive resis-
tance to CO2 and can limit photosynthesis even at rela-
tively low bulk water content (Williams and Flanagan
1996, 1998), perhaps in part explaining the lower photo-
synthetic capacity of this species. Demand for large
amounts of structural carbohydrate in Sphagnum for the
construction of water-storing hyaline cells, which are then
metabolically inactive, in turn may reduce the demand for
tissue maintenance respiration.
Model assumptions
The BT model successfully replicated the quantity of PD13C label remaining in stem and photosynthetic tissues,
but relies on the following assumptions. Firstly, we
assume that no photosynthesis occurs in the sub-capitu-
lum region of the Sphagnum stem. Although the canopy of
Sphagnum fuscum is dense, preventing much light pene-
tration to this part of the plant, photosynthetic activity in
the sub-capitulum has been documented in other species of
Sphagnum (Robroek et al. 2009). Therefore, the presence
of 13C label may indicate a small amount of photosynthetic
uptake of the 13C label. Secondly, we assume that the
parameters controlling the response of photosynthesis to
light and temperature (pt, pc and pk) remain constant
(optimal) throughout the modelled period. This is unlikely
to be the case in reality, as sub-optimal water content or the
presence of excess water on the leaves following precipi-
tation, may periodically reduce the photosynthetic capacity
of tissues (Lloyd 2001). We believe that any periods of
photosynthetic inhibition over the modelled period were
not prolonged enough to affect the turnover of C signifi-
cantly for two reasons. Firstly, we show that the parameters
used in the model provide unbiased predictions of GPP
over the growing season (Fig. 6b). Secondly, both species
are known to be able to regulate tissue water content to
some extent, and we would not expect either species to
become metabolically inactive for long periods of time
unless subject to unusually dry conditions (the maximum
time with zero rainfall during the study was one 4-day
period). Finally, the sensitivity analyses indicate that the
model predictions of the NPP:GPP ratio and TT are
Oecologia (2011) 167:325–337 335
123

relatively insensitive to changes in the photosynthesis
parameters.
The lack of adequate sample storage meant our confi-
dence in the initial tissue samples as an accurate measure
of total label uptake was low. To avoid resulting bias, we
ignored the first 1–2 days of sampling for the purpose of
model fitting. Because our confidence in the differences in
photosynthetic rate between species is high (there was
good correspondence between independent laboratory and
field flux data; Fig. 4b), and our confidence in later solid
tissue data is also high, the lack of cold sample storage
does not affect the conclusions of the study. Samples from
the first day for Polytrichum and the first 2 days for
Sphagnum do fall below the modelled values (Fig. 5),
which is what would be expected if some 13C in labile
components had been lost between sampling in the field
and freezing.
Conclusions
We detected significant differences in aboveground C
allocation and turnover between two common arctic moss
species. Greater photosynthetic rates in Polytrichum were
associated with higher demands on the labile C pool for
respiration or translocation, which we link to greater
structural complexity within this species. Our estimate of
23% allocation of recently fixed C to NPP in Polytrichum is
lower than the 50% often assumed for vascular plants. In
Sphagnum, we found 45% of GPP was allocated to NPP
exclusively within the top 2 cm of the moss surface. Con-
sequently, C cycle models which aim to quantify regional
NPP based only on vascular plant C allocation may sig-
nificantly overestimate belowground allocation where
Sphagnum is present, or overestimate aboveground incor-
poration where Polytrichum species dominate. The Sphag-
num genus is abundant in northern regions, contributing
around 30% to land surface cover based on estimates of
peatland cover. Sphagnum species such as S. fuscum can
also be important components of shrub and wet-sedge
tundra vegetation which may not be classified as peatland in
land-cover classification schemes (personal observation).
Polytrichum, while common in dry tundra vegetation, will
contribute only a small fraction of the total sub-arctic land
surface, as it is just one of many moss species that con-
tribute to the moss layer in these vegetation types. Further
research is required into other common arctic moss species,
and their proportional representation on the land surface,
before the implications of C turnover in arctic bryophytes
can be fully understood. However, our modelling results
provide the first crucial insights into bryophyte C allocation
and turnover and are an important step towards a more
complete understanding of the arctic C cycle.
Acknowledgments This work was funded by a NERC CASE PhD
studentship in partnership with the Macaulay Land Use Research
Institute (MLURI), Aberdeen. We thank Barry Thornton (MLURI)
for 13C isotope analysis, Sally Eaton for species identification and
Veronica Lussier for sample preparation. We thank Harry Vallack for
his assistance in setting up the ‘York mobile lab’ and all the staff at
ANS. We particularly thank Roslyn MacDonald for her contribution
to the fieldwork. The work was part of the NERC ABACUS Arctic-
IPY consortium.
References
Amthor JS (2000) The McCree-de Wit-Penning de Vries-Thornley
respiration paradigms: 30 years later. Ann Bot 86:1–20
Ayres E, van der Wal R, Sommerkorn M, Bardgett RD (2006) Direct
uptake of soil nitrogen by mosses. Biol Lett 2:286–288
Bowling DR, Pataki DE, Randerson JT (2008) Carbon isotopes in
terrestrial ecosystem pools and CO2 fluxes. New Phytol
178:24–40
Campioli M, Samson R, Michelsen A, Jonasson S, Baxter R, Lemeur
R (2009) Nonvascular contribution to ecosystem NPP in a
subarctic heath during early and late growing season. Plant Ecol
202:41–53
Cannell MGR, Thornley JHM (2000) Modelling the components of
plant respiration: some guiding principles. Ann Bot 85:45–54
Chapin FS, Oechel WC, Vancleve K, Lawrence W (1987) The role of
mosses in the phosphorus cycling of an Alaskan black spruce
forest. Oecologia 74:310–315
Chapin FS, Shaver GR, Giblin AE, Nadelhoffer KJ, Laundre JA
(1995) Responses of arctic Tundra to experimental and observed
changes in climate. Ecology 76:694–711
Christensen JH et al (2007) Regional climate projections. In: Solomon
S et al (eds) Climate change 2007: the physical science basis.
Contribution of working group I to the fourth assessment report
of the intergovernmental panel on climate change. Cambridge
University Press, Cambridge
Collins NJ, Oechel WC (1974) Pattern of growth and translocation of
photosynthate in a tundra moss, Polytrichum alpinum. Can J Bot
52:355–363
Dawson TE, Mambelli S, Plamboeck AH, Templer PH, Tu KP (2002)
Stable isotopes in plant ecology. Annu Rev Ecol Syst
33:507–559
Dorrepaal E, Aerts R, Cornelissen JHC, Callaghan TV, van Logtestijn
RSP (2004) Summer warming and increased winter snow cover
affect Sphagnum fuscum growth, structure and production in a
sub-arctic bog. Glob Change Biol 10:93–104
Douma J, van Wijk MT, Lang SI, Shaver GR (2007) The contribution
of mosses to the carbon and water exchange of arctic ecosys-
tems: quantification and relationships with system properties.
Plant Cell Environ 30:1205–1215
Fenner N, Ostle N, Freeman C, Sleep D, Reynolds B (2004) Peatland
carbon afflux partitioning reveals that Sphagnum photosynthate
contributes to the DOC pool. Plant Soil 259:345–354
Fox A et al (2009) The REFLEX project: Comparing different
algorithms and implementations for the inversion of a terrestrial
ecosystem model against eddy covariance data. Agric For
Meteorol 149:1597–1615
Gifford RM (2003) Plant respiration in productivity models: concep-
tualisation, representation and issues for global terrestrial
carbon-cycle research. Funct Plant Biol 30:171–186
Lloyd CR (2001) The measurement and modelling of the carbon
dioxide exchange at a high arctic site in Svalbard. Glob Change
Biol 7:405–426
336 Oecologia (2011) 167:325–337
123

McBean G et al (2005) Arctic climate: past and present. In: Arctic
Climate Impact Assessment: Scientific Report. Cambridge
University Press, Cambridge, pp 21–60
Miller PC, Webber PJ, Oechel WC, Tieszen LL (1980) Biophysical
processes and primary production. In: Brown JM, Miller PC,
Tieszen LL, Bunnell FL (eds) An arctic ecosystem: the Coastal
Tundra at Barrow, Alaska. Dowden, Hutchinson & Ross,
Stroudsburg, pp 66–101
Proctor MCF (2009) Physiological ecology. In: Goffinet B, Shaw AJ
(eds) Bryophyte biology, 2nd edn. Cambridge University Press,
Cambridge, pp 269–273
Proctor MCF, Raven JA, Rice SK (1992) Stable carbon isotope
discrimination measurements in Sphagnum and other bryophytes
- physiological and ecological implications. J Bryol 17:193–202
Robroek BJM, Schouten MGC, Limpens J, Berendse F, Poorter H
(2009) Interactive effects of water table and precipitation on net
CO2 assimilation of three co-occurring Sphagnum mosses
differing in distribution above the water table. Glob Change
Biol 15:680–691
Shaver GR, Street LE, Rastetter EB, Van Wijk MT, Williams M
(2007) Functional convergence in regulation of net CO2 flux in
heterogeneous tundra landscapes in Alaska and Sweden. J Ecol
95:802–817
Skre O, Oechel WC, Miller PM (1983) Patterns of translocation of
carbon in 4 common moss species in a black spruce (Piceamariana) dominated forest in interior Alaska. Can J For Res
13:869–878
Street LE, Shaver GR, Williams M, Van Wijk MT (2007) What is the
relationship between changes in canopy leaf area and changes in
photosynthetic CO2 flux in arctic ecosystems? J Ecol
95:139–150
Subke J-A, Vallack HW, Magnusson T, Keel SG, Metcalfe DB,
Hogberg P, Ineson P (2009) Short-term dynamics of abiotic and
biotic soil 13CO2 effluxes after in situ 13CO2 pulse labelling of
a boreal pine forest. New Phytol 183:349–357
Sveinbjornsson B, Oechel WC (1981) Controls on CO2 exchange in
two Polytrichum moss species. 2. The implications of below-
ground plant-parts on the whole-plant carbon balance. Oikos
36:348–354
Tarnocai C, Canadell JG, Schuur EAG, Kuhry P, Mazhitova G,
Zimov S (2009) Soil organic carbon pools in the northern
circumpolar permafrost region. Glob Biogeochem Cycles 23
Thomas RJ, Ryder SH, Gardner MI, Sheetz JP, Nichipor SD (1996)
Photosynthetic function of leaf lamellae in Polytrichum com-mune. Bryologist 99:6–11
Thomas RJ, Schiele EM, Damberg DT (1990) Translocation in
Polytrichum-Commune (Bryophyta). 2. Clonal Integration. Am J
Bot 77:1569–1573
Thomas RJ, Schiele EM, Scheirer DC (1988) Translocation in
Polytrichum commune (Bryophyta).1. Conduction and allocation
of photoassimilates. Am J Bot 75:275–281
Trumbore S (2006) Carbon respired by terrestrial ecosystems—recent
progress and challenges. Glob Change Biol 12:141–153
Turetsky MR, Crow SE, Evans RJ, Vitt DH, Wieder RK (2008)
Trade-offs in resource allocation among moss species control
decomposition in boreal peatlands. J Ecol 96:1297–1305
Vitt DH, Wieder RK (2009) Bryophyte-dominated peatlands. In:
Goffinet B, Shaw AJ (eds) Bryophyte biology, 2nd edn.
Cambridge University Press, Cambridge, pp 357–392
Walker DA (2000) Hierarchical subdivision of arctic tundra based on
vegetation response to climate, parent material and topography.
Glob Change Biol 6:19–34
Waring RH, Landsberg JJ, Williams M (1998) Net primary produc-
tion of forests: a constant fraction of gross primary production?
Tree Physiol 18:129–134
Williams M, Schwarz PA, Law BE, Irvine J, Kurpius MR (2005) An
improved analysis of forest carbon dynamics using data assim-
ilation. Glob Change Biol 11:89–105
Williams M, Street LE, van Wijk MT, Shaver GR (2006) Identifying
differences in carbon exchange among arctic ecosystem types.
Ecosystems 9:288–304
Williams TG, Flanagan LB (1996) Effect of changes in water content
on photosynthesis, transpiration and discrimination against13CO2 and C18O16O in Pleurozium and Sphagnum. Oecologia
108:38–46
Williams TG, Flanagan LB (1998) Measuring and modelling
environmental influences on photosynthetic gas exchange in
Sphagnum and Pleurozium. Plant Cell Environ 21:555–564
Woodin SJ, van der Wal R, Sommerkorn M, Gornall JL (2009)
Differential allocation of carbon in mosses and grasses governs
ecosystem sequestration: a 13C tracer study in the high arctic.
New Phytol 184:944–949
Oecologia (2011) 167:325–337 337
123