SHEEMA DISTRICT LOCAL GOVERNMENT
123
BUSHENYI DISTRICT LOCAL GOVERNMENT- Statistical Abstract for FY 2020/2021 BUSHENYI DISTRICT LOCAL GOVERNMENT P.O. Box 1, Bushenyi E-mail: [email protected] Website: http://www.bushenyi.go.ug/ 4 th August 2020
-
Upload
khangminh22 -
Category
Documents
-
view
1 -
download
0
Transcript of SHEEMA DISTRICT LOCAL GOVERNMENT

i
0Educ
FOREWORD
The importance of statistics in informing planning and monitoring of government programmes cannot be over emphasized.
We need to know where we are, determine where we want to reach and also know whether we have reached there. The
monitoring of socio-economic progress is not possible without measuring how we progress and establishing whether
human, financial and other resources are being used efficiently. However, these statistics have in many occasions been
national in outlook and less district specific. The development of a district-based Statistical Abstract shall go a long way to
solve this gap and provide district tailored statistics and will reflect the peculiar nature of the district by looking at specific
statistics which would not be possible to provide at a higher level.
Data and statistics are required for designing, planning, implementing, monitoring and evaluating development
programmes. For instance, statistics on school enrolment, completion rates and dropout rates among others are vital in
the monitoring of Universal Primary Education (UPE) and Universal Secondary Education (USE) programmes. Statistics are
also needed for establishing grant aid to community schools, staff levels and other investments in the education
programmes. The collection and use of statistics and performance indicators is critical for both the successful management
and operation of the sectors, including Lower Local Governments. For data to inform planning and service delivery it
should be effectively disseminated to the various users and stakeholders. The initiative to compile this District Statistical
Abstract is therefore an effort to support the Planning function of the Local Governments and other users interested in the
Higher Local Government (HLG) statistics.
This District Statistical Abstract will go a long way in guiding District Policy makers, Planners, Researchers and other
stakeholders to identify the indicators that are relevant for planning, monitoring and evaluation of Government
programmes in their jurisdiction. The Statistical Abstract will also act as an aggregation of statistics from all sectors and
also information originating from NGOs and other organizations. This Statistical Abstract, therefore, is an annual snapshot
documentation of the Sheema District situation, providing a continuous update of the district status. It is my sincere hope
that the document will provide all interested users with adequate information and I also feel that where more information
is required, appropriate departments should be contacted for details. Lastly, I wish to thank Uganda Bureau of Statistics
(UBOS) for the continued Technical support to Sheema District. I wish to thank all my Technical staff p
icularly, Mr. Mwesigye Silver Katabarwa [District Planner], Ms. Tuhairwe Doreen [Senior Planner] and Ms. Nimusiima
Sandrah [Planner] who were coordinating the compilation process of this Statistical Abstract.
....................................... Canon David Kabigumira District Chairperson
SHEEMA DISTRICT LOCAL GOVERNMENT
Budget Conference Presentation for
FY 2017/2018
Held at
The District Headquarters
on
7th November 2016
Compiled by:
Mwesigye Silver Katabarwa, District Planner
District Planning Unit,
7/11/2017
SHEEMA DISTRICT LOCAL GOVERNMENT
Budget Conference Presentation for
FY 2017/2018
Held at
The District Headquarters
on
7th November 2016
Compiled by:
Mwesigye Silver Katabarwa, District Planner
District Planning Unit,
7/11/2017
BUSHENYI DISTRICT LOCAL GOVERNMENT-
Statistical Abstract for FY 2020/2021
BUSHENYI DISTRICT LOCAL GOVERNMENT P.O. Box 1, Bushenyi
E-mail: [email protected] Website: http://www.bushenyi.go.ug/
4th August 2020
ii
ACKNOWLEDGEMENT
Bushenyi District gratefully acknowledges the efforts of all the Stakeholders that contributed to the information and data
collection for production of the District Statistical Abstract. It may not be possible to enumerate all those who gave their
time but a few groups and individuals deserve special mention.
Special thanks go to Uganda Bureau of Statistics (UBOS) for their effort in Capacity Building and continued Technical
Support to district staff to see to it that Bushenyi district gets specific data and statistics required for designing, planning,
implementing, monitoring and evaluating development programmes. There are many documents that have been received
by Bushenyi district from UBOS, such as reports of the Population and Housing Censuses, Uganda Demographic and Health
Surveys and the National Service Delivery Surveys.
I wish to extend my appreciation to the District Technical Staff who were deeply involved in providing information for
preparation of the Statistical Abstract and especially the District Planning department Team that coordinated the whole
processes of preparing the District Statistical Abstract notably Mr. Bamusiime Dickson [Senior Planner], Ms.
Tushemereirwe Oginia [Planner].
…………………………………… Mahabba Malik Chief Administrative Officer

iii
TABLE OF CONTENTS
FOREWORD ............................................................................................................................................................................ I ACKNOWLEDGEMENT ............................................................................................................................................................ II TABLE OF CONTENTS ............................................................................................................................................................. III LIST OF TABLES ...................................................................................................................................................................... VI LIST OF ACRONYMS ............................................................................................................................................................. VIII GLOSSARY .............................................................................................................................................................................. IX EXECUTIVE SUMMARY......................................................................................................................................................... XIV GENERAL INFORMATION ABOUT THE DISTRICT ............................................................................................................................... XVII DEMOGRAPHIC AND SOCIO-ECONOMIC INDICATORS ...................................................................................................................... XVII CHAPTER 1: BACKGROUND INFORMATION ........................................................................................................................... 1 1.0 INTRODUCTION .................................................................................................................................................................... 1 1.1 LOCATION AND SIZE ........................................................................................................................................................... 1 1.2. HISTORICAL BACKGROUND .................................................................................................................................................... 1 1.3 TOURISM ............................................................................................................................................................................ 2 1.4. GEOGRAPHICAL FEATURES..................................................................................................................................................... 2 1.4.1 TOPOGRAPHY ................................................................................................................................................................... 2 1.4.2 CLIMATE, RAINFALL, TEMPERATURE, HUMIDITY AND WINDS ..................................................................................................... 2 1.4.3 SOILS .............................................................................................................................................................................. 2 1.4.4 HYDROLOGY ..................................................................................................................................................................... 2 1.4.5 MINERAL RESOURCES ......................................................................................................................................................... 2 CHAPTER 2: MANAGEMENT SUPPORT SERVICES ................................................................................................................... 3 2.0 INTRODUCTION .................................................................................................................................................................... 3 2.1 ADMINISTRATIVE STRUCTURE.................................................................................................................................................. 3 2.3: COUNCIL, COMMITTEE, BOARDS, AND COMMISSION ................................................................................................................ 13 2.3.1: DISTRICT COUNCIL .......................................................................................................................................................... 13 2.3.2: DISTRICT EXECUTIVE COMMITTEE MEMBERS ....................................................................................................................... 13 2.3.3: COMMITTEES OF COUNCIL ............................................................................................................................................... 13 2.4: BOARDS AND COMMISSIONS ............................................................................................................................................... 13 2.4.1: DISTRICT LAND BOARD COMMITTEE: .................................................................................................................................. 13 2.4.2: DISTRICT SERVICE COMMISSION ........................................................................................................................................ 13 2.4.3: PUBLIC ACCOUNTS COMMITTEE (PAC)............................................................................................................................... 14 2.4.4: CONCLUSION ................................................................................................................................................................. 14 CHAPTER 3: DEMOGRAPHIC AND SOCIO-ECONOMIC CHARACTERISTICS ............................................................................ 14 3.0 INTRODUCTION .................................................................................................................................................................. 14 3.1 POPULATION CHARACTERISTICS ............................................................................................................................................. 14 3.2 POPULATION SIZE AND GROWTH RATE.................................................................................................................................... 14 3.1.2 POPULATION DISTRIBUTION............................................................................................................................................... 15 3.1.3 POPULATION DENSITY ...................................................................................................................................................... 16 3.1.4 URBANISATION RATES AND LEVELS ...................................................................................................................................... 16 3.1.5 AVERAGE HOUSEHOLD SIZE ............................................................................................................................................... 16 3.2 SOCIO-ECONOMIC CHARACTERISTICS ..................................................................................................................................... 17 3.2.1 HOUSING CONDITIONS BY TYPE OF HOUSE ............................................................................................................................ 17 3.2.2 POVERTY DISTRIBUTION .................................................................................................................................................... 17 3.2.3 EMPLOYMENT AND OCCUPATION BY TYPE AND AGE GROUP ..................................................................................................... 18 3.3: PLANNING AND BUDGETING PROCESS ................................................................................................................................... 19 3.3.1 BUDGETARY ALLOCATIONS TO DEPARTMENTS AND REVENUE SOURCES TO THE DISTRICT................................................................ 19 3.3.2: REVENUE SOURCES BY AMOUNT ........................................................................................................................................ 19 3.3.3 SECTORAL EXPENDITURE AGAINST THE BUDGET ...................................................................................................................... 20 CHAPTER 4: HEALTH SERVICES............................................................................................................................................. 21 4.0 INTRODUCTION .................................................................................................................................................................. 21 4.1: HEALTH INFRASTRUCTURE ................................................................................................................................................... 21 4.2: ACCESSIBILITY TO HEALTH SERVICES ....................................................................................................................................... 21 4.2.1 HEALTH SERVICES ACCESSIBILITY INDICATORS ........................................................................................................................ 21 4.3 DISEASE BURDEN ................................................................................................................................................................ 22 4.4 HEALTH MANPOWER .......................................................................................................................................................... 22 4.7 IMMUNIZATION COVERAGE DURING 2018/19 ......................................................................................................................... 24 4.8 DRUG INSPECTION .............................................................................................................................................................. 25 4.10 MATERNAL AND CHILD HEALTH (MCH) ............................................................................................................................... 25

iv
4.11 AIDS CONTROL (PREVALENCE, CONTROL AND TREATMENT) ..................................................................................................... 26 4.11.0 INTRODUCTION ............................................................................................................................................................. 26 4.11.1 HIV/AIDS PREVALENCE RATES ........................................................................................................................................ 26 4.11.2 NUMBER OF HIV COUNSELLING CENTRES .......................................................................................................................... 26 4.11.3 HIV/AIDS COUNSELLING AND TESTING (HCT) SITES ........................................................................................................... 26 4.11.4 ANTI-RETROVIRAL THERAPY INCLUDING TREATMENT FOR CHILDREN ART (ANTIRETROVIRAL THERAPY) .......................................... 27 4.12 PREVENTION OF MOTHER TO CHILD TRANSMISSION OF HIV/AIDS IN FY 2018/2019 .................................................................. 28 4.12.1 HIV COUNSELLING AND TESTING IN FY 2019/2020 ........................................................................................................... 28 4.12.3 LABOUR AND DELIVERY CARE ........................................................................................................................................... 28 4.2: ACCESSIBILITY TO HEALTH SERVICES ....................................................................................................................................... 29 4.2.1 HEALTH SERVICES ACCESSIBILITY INDICATORS ........................................................................................................................ 29 4.3 DISEASE BURDEN ................................................................................................................................................................ 29 4.4 HEALTH MANPOWER .......................................................................................................................................................... 29 4.7 IMMUNIZATION COVERAGE DURING 2018/19 ......................................................................................................................... 32 4.8 DRUG INSPECTION .............................................................................................................................................................. 33 4.10 MATERNAL AND CHILD HEALTH (MCH) ............................................................................................................................... 33 4.11 AIDS CONTROL (PREVALENCE, CONTROL AND TREATMENT) ..................................................................................................... 33 4.11.0 INTRODUCTION ............................................................................................................................................................. 33 4.11.1 HIV/AIDS PREVALENCE RATES ........................................................................................................................................ 34 4.11.2 NUMBER OF HIV COUNSELLING CENTRES .......................................................................................................................... 34 4.11.3 HIV/AIDS COUNSELLING AND TESTING (HCT) SITES ........................................................................................................... 34 4.11.4 ANTI-RETROVIRAL THERAPY INCLUDING TREATMENT FOR CHILDREN ART (ANTIRETROVIRAL THERAPY) .......................................... 35 4.12 PREVENTION OF MOTHER TO CHILD TRANSMISSION OF HIV/AIDS IN FY 2019/2020 .................................................................. 35 4.12.1 HIV COUNSELLING AND TESTING IN FY 2019/2020 ........................................................................................................... 35 4.12.3 LABOUR AND DELIVERY CARE ........................................................................................................................................... 36 CHAPTER 5: EDUCATION AND SPORTS ................................................................................................................................ 37 5.0 INTRODUCTION .................................................................................................................................................................. 37 `5.1 EDUCATIONAL INSTITUTIONS ............................................................................................................................................... 37 5.1.2: NUMBER OF SCHOOL GOING AGE CHILDREN ......................................................................................................................... 37 5.1.5 OTHER EDUCATIONAL INSTITUTIONS ................................................................................................................................... 39 5.2 INFRASTRUCTURE ............................................................................................................................................................... 41 5.4 ENROLMENT AND ENROLMENT RATIOS – PRIMARY AND SECONDARY ............................................................................................. 42 5.5 EFFICIENCY RATIOS (PRIMARY) .............................................................................................................................................. 42 5.7 PERFORMANCE IN NATIONAL EXAMINATIONS BY YEAR IN PERCENTAGES ........................................................................................ 43 5.8 INSPECTORATE ................................................................................................................................................................... 44 CHAPTER 6: WORKS AND TECHNICAL SERVICES .................................................................................................................. 44 6.0 INTRODUCTION .................................................................................................................................................................. 44 6.1 ROADS ............................................................................................................................................................................. 44 6.1.1 ROADS BY GRADE, LENGTH AND CONDITION .......................................................................................................................... 44 6.2 HOUSING ..................................................................................................................................................................... 58 CHAPTER 7: NATURAL RESOURCES ..................................................................................................................................... 59 7.0 INTRODUCTION .................................................................................................................................................................. 59 7.1 ENVIRONMENTAL SANITATION RELATED STATISTICS: .................................................................................................................. 59 1 ENVIRONMENTAL SANITATION RELATED STATISTICS: ..................................................................................................................... 59 7.3 TREE PLANTING AND CHARCOAL BURNING ............................................................................................................................... 59 7.2 STATE OF WETLANDS .......................................................................................................................................................... 60 7.3. LAND MANAGEMENT .......................................................................................................................................................... 60 7.4 FORESTRY ......................................................................................................................................................................... 61 7.4.1. TYPES OF FORESTS .......................................................................................................................................................... 61 CHAPTER 8: GENDER & COMMUNITY BASED SERVICES ....................................................................................................... 62 8.0 INTRODUCTION .................................................................................................................................................................. 62 8.1 GENERAL COMMUNITY DEVELOPMENT ISSUES ......................................................................................................................... 62 8.2 COMMUNITY PROJECTS ....................................................................................................................................................... 63 8.4 PROBATION, OVCS AND CHILD PROTECTION ISSUES .................................................................................................................. 65 CHAPTER 9: PRODUCTION AND MARKETING ...................................................................................................................... 67 9.0 INTRODUCTION .................................................................................................................................................................. 67 9.1 AGRICULTURE .................................................................................................................................................................... 67 9.1.1 CROP PRODUCTION ......................................................................................................................................................... 67 9.1.2 LIVESTOCK AND VETERINARY SERVICES ............................................................................................................................... 69 2.2 FISHERIES ...................................................................................................................................................................... 71 9.3 COMMERCIAL SERVICES ................................................................................................................................................ 74

v
9.3.1 INDUSTRY ...................................................................................................................................................................... 74 9.3.2 TRADE ........................................................................................................................................................................... 75 9.3.3 SAVINGS AND CREDIT COOPERATIVES SOCIETIES .................................................................................................................... 75 INDUSTRIAL AND MARKET ESTABLISHMENTS IN BUSHENYI DISTRICT ................................................................................ 78 APPENDIX 1: NUMBER OF VILLAGES PER PARISH AND SUB COUNTY AS AT 03/9/2020 .......................................................................... 82 APPENDIX 1: NUMBER OF VILLAGES PER S/COUNTY & PARISH IN BUSHENYI DISTRICT ............................................................................ 82 SUMMARY OF BUSHENYI DISTRICT AND MUNICIPAL COUNCIL BY DIVISION, TOWN COUNCIL AND SUB COUNTY .......................................... 82 APPENDIX 2: NO. OF SUB COUNTIES/TCS, NO. OF PARISHES AND VILLAGES BY CONSTITUENCY AS OF 31/08/2020 .................................... 85 APPENDIX 3: TOTAL POPULATION BY SEX, AND BY YEAR .................................................................................................................. 85
Further information about the population structure: ....................................................................................... 85 APPENDIX 4: THE POOR, INSECURE NON-POOR AND MIDDLE CLASS IN EACH REGION OF UGANDA, 1992-2012 .......................................... 86 APPENDIX 6: BUSHENYI DISTRICT POPULATION VARIABLES BY CONSTITUENCY AS PER 2014 NPHC ......................................................... 88 APPENDIX 7: DISTRICT PERFORMANCEIN HEALTH RELATED ISSUES ..................................................................................................... 79

vi
LIST OF TABLES
TABLE 2.1: NUMBER OF ADMINISTRATIVE UNITS BY CONSTITUENCY ......................................................................................................... 3 TABLE 2.1: NUMBER OF ADMINISTRATIVE UNITS BY CONSTITUENCY ......................................................................................................... 3 TABLE 3.1: TOTAL POPN & GROWTH RATES FOR BUSHENYI, GREATER BUSHENYI, WESTERN REGION & NATIONAL FROM 1980-2019 .............. 14 TABLE 3.2:POPULATION FOR GREATER BUSHENYI DISTRICTS FROM 1991 – 2014 & PROJECTIONS FROM 2016-2019 .................................... 15 TABLE 3.4: POPULATION BY SUB COUNTY 2015 TO 2020 ................................................................................................................... 16 TABLE 3.6: POPULATION DISTRIBUTION BY RURAL – URBAN AND SEX AS OF 2020 .................................................................................... 16 TABLE 3.9: TYPE OF DWELLING UNITS BY LOCATION AND PERCENT ......................................................................................................... 17 TABLE 3.10: POVERTY DISTRIBUTION BY SUB-COUNTY ......................................................................................................................... 18 TABLE 3.11: ACTIVITY STATUS ......................................................................................................................................................... 18 TABLE 3.12: SOURCE OF ENERGY FOR COOKING ................................................................................................................................. 19 TABLE 3.13: DISTRICT REVENUE PERFORMANCE FOR FINANCIAL YEAR 2019/2020 .................................................................................. 19 TABLE 3.14. BUSHENYI DISTRICT DEPARTMENT EXPENDITURE PERFORMANCE AGAINST THE BUDGET & RELEASES IN FY 2019/2020 ................ 20 TABLE 4.1: HEALTH INFRASTRUCTURE (CATEGORIES) ........................................................................................................................... 21 TABLE 4.1: HEALTH INFRASTRUCTURE (CATEGORIES) ........................................................................................................................... 21 TABLE 4.3: DISEASE BURDEN TOP TEN DISEASES .................................................................................................................................. 22 TABLE 4.4: STAFFING IN DISTRICT HEALTH OFFICE .............................................................................................................................. 22 TABLE 4.7: HEALTH CENTRE III – [KABUSHAHO, KAKANJU, KASHAMBYA, KIBAZI, KYAMUHUNGA, KYEIZOOBA, NYABUBARE, RUHUMURO, RYEISHE]
........................................................................................................................................................................................ 23 TABLE 4.9: LATRINE COVERAGE FOR 3 FINANCIAL YEARS ....................................................................................................................... 24 TABLE 4.10: HAND WASHING COVERAGE AFTER VISITING THE TOILET ...................................................................................................... 24 TABLE 4.13: PERCENTAGE COVERAGE OF ANTIGEN FOR 3 FINANCIAL YEARS ............................................................................................. 25 TABLE 4.14: NUMBER OF LICENCED DRUG SHOPS IN THE DISTRICT .......................................................................................................... 25 TABLE 4.15: COVERAGE OF HIV/AIDS COUNSELLING AND TESTING (HCT) SERVICES- 2018/19 ................................................................. 26 TABLE 4.16: DISTRIBUTION OF HCT SERVICES BY FACILITY BY LOCATION .................................................................................................. 26 TABLE 4.17: ART SERVICES AS OF 2019/20 ..................................................................................................................................... 27 NUMBER OF INFANTS WHO RECEIVED ARV PROPHYLAXIS : 365 ........................................................................................................ 28 TABLE 4.2: NUMBER OF HEALTH UNITS ............................................................................................................................................ 28 TABLE 4.3: DISEASE BURDEN TOP TEN DISEASES .................................................................................................................................. 29 TABLE 4.4: STAFFING IN DISTRICT HEALTH OFFICE .............................................................................................................................. 30 TABLE 4.7: HEALTH CENTRE III – [KABUSHAHO, KAKANJU, KASHAMBYA, KIBAZI, KYAMUHUNGA, KYEIZOOBA, NYABUBARE, RUHUMURO, RYEISHE]
........................................................................................................................................................................................ 31 TABLE 4.9: LATRINE COVERAGE FOR 3 FINANCIAL YEARS ....................................................................................................................... 32 TABLE 4.10: HAND WASHING COVERAGE AFTER VISITING THE TOILET ...................................................................................................... 32 TABLE 4.11: NUMBER OF HOUSEHOLDS AND TOILET FACILITY BY SUB COUNTY .......................................................................................... 32 TABLE 4.13: PERCENTAGE COVERAGE OF ANTIGEN FOR 3 FINANCIAL YEARS ............................................................................................. 32 TABLE 4.14: NUMBER OF LICENCED DRUG SHOPS IN THE DISTRICT .......................................................................................................... 33 TABLE 4.15: COVERAGE OF HIV/AIDS COUNSELLING AND TESTING (HCT) SERVICES- 2018/19 ................................................................. 34 TABLE 4.16: DISTRIBUTION OF HCT SERVICES BY FACILITY BY LOCATION .................................................................................................. 34 TABLE 4.17: ART SERVICES AS OF 2019/20 ..................................................................................................................................... 35 TABLE 5.2: SCHOOL GOING AGE BY GENDER ...................................................................................................................................... 37 TABLE 5.3: PRIMARY SCHOOL BY OWNERSHIP .................................................................................................................................... 37 TABLE 5.4: NAME OF SENIOR SECONDARY SCHOOL BY OWNERSHIP BY SUB-COUNTY BY COUNTY .................................................................. 38 TABLE 5.5: OTHER EDUCATIONAL INSTITUTIONS BY OWNERSHIP ............................................................................................................ 39 TABLE 5.6 OTHER EDUCATION INSTITUTIONS BY LOCATION ................................................................................................................... 39 TABLE 5.7: AVAILABLE INFRASTRUCTURE IN SCHOOLS........................................................................................................................... 41 TABLE 5.8: NO. OF TEACHERS AND PUPILS BY GENDER IN GOVERNMENT AIDED PRIMARY SCHOOLS (2018) .................................................. 42 TABLE 5.10: NUMBER OF GOVERNMENT SECONDARY SCHOOL TEACHERS AND STUDENTS BY SCHOOL ........................................................... 42 TABLE 5.11: TRENDS IN P.L.E RESULT ANALYSIS BY YEAR AND PERCENTAGE FROM 2010 - 2017................................................................. 43 TABLE 5.12: PLE PERFORMANCE BY GENDER AND DIVISION - 2019 ....................................................................................................... 43 NUMBER OF SCHOOL INSPECTORS : 02 ......................................................................................... 44 TABLE 6.1: ROADS BY TYPE, LENGTH AND CONDITION AS OF JUNE 2020 ................................................................................................. 45 TABLE 7.1: WASTE MANAGEMENT (PARTICULARLY FOR URBAN) AS OF 2019............................................................................................ 59 TABLE 7.2: LOCATION OF WILD GAME AND VERMIN ........................................................................................................................... 60 TABLE 7.3: TYPE OF FORESTS BY ACREAGE ....................................................................................................................................... 61 TABLE 7.4: LOCAL FOREST RESERVES ................................................................................................................................................ 61 TABLE 7.5: GAZETTED FOREST RESERVES .......................................................................................................................................... 61 TABLE 7.6: DISTRIBUTION OF FOREST RESERVES BY CATEGORY .............................................................................................................. 61

vii
TABLE 8.2: YOUTH LIVELIHOOD PROJECTS IMPLEMENTED BY SUB-COUNTY, 2019/2020 FY ....................................................................... 64 TABLE 9.8: FISH PONDS IN BUSHENYI AS OF JUNE 2020 ....................................................................................................................... 71

viii
LIST OF ACRONYMS AIDS : Acquired Immune Deficiency Virus
ART : Anti-Retroviral Therapy
Av. HH Size : Average Household Size
BCG : Bacillus Calmette- Guérin vaccine
CBOs : Community Based Organizations
CDA : Community Development Assistants
CDO : Community Development Officers
CSOs : Civil Society Organizations
DATIC : District Agricultural Training & Information Centre
DDP : District Development Plan
DEO : District Education Officer
DHO : District Health Officer
DPT3 : Diphtheria Pertussis Tetanus Vaccine
DSC : District Service Commission
FAL : Functional Adult Literacy
FRI : Fisheries Research Institute
FY : Financial Year
GER : Gross Enrolment Ratio
HAART : Highly Active Antiretroviral Therapy
HC : Health Centre
HCT : Counselling and Testing
HCT : HIV Counselling & Testing
HIV : Human Immuno-deficiency Virus
HMIS : Health Management Information System
HRH : Human Resources for Health
HSSP III : Health Sector Strategic Plan III
IMR : Infant Mortality Rate
MCH : Maternal & Child Health
NARO : National Research Organization
NDP II : National Development Plan II
NER : Net Enrolment Ratio
NPHC : National Population and Housing Census
OVC : Orphans and Vulnerable Children
PMTCT : Prevention of Mother To Child Transmission
PNFP : Private Not For Profit
PWDs : People With Disabilities
S/C : Sub County
SACCO : Savings and Credit Cooperative organization
SDGs : Sustainable Development Goals
BMC :Bushenyi Municipal Council
TC : Town Council
TT : Tetanus Toxoid
U5MR : Under -Five Mortality Rate
UBOS : Uganda Bureau of Statistics
UDHS : Uganda Demographic Health Survey
UNHS : Uganda National Household Survey
UWEP : Uganda Women Entrepreneurship Program
VHT : Village Health Team
VRS : Vital Registration System
YLP : Youth Livelihood Programme

ix
GLOSSARY Contraceptive Prevalence Rate - The percentage of women, or women whose sexual partners use any form of contraception. The Contraceptive Prevalence Rate is recorded for women aged 15-49 years Access to Safe Water - Access to adequate amounts (20 litres per person per day minimum) of safe drinking water (treated surface water or uncontaminated borehole / protected well water) within a convenient distance from the user’s dwelling (within a walking distance of not more than half a kilometre). Access to the Minimum Health Care Package - The number of people residing within five kilometres of a health facility that provides the National Minimum Health Care Package (NMHCP) divided by the total population. Accessibility Rate- The proportion of children with access to education to the total population in the official school admission age. Adolescent - A person between puberty and below 18 years of age. Adult - A person aged 18 years and above, as per the Constitution of the Republic of Uganda. Adult Literacy- Persons above 18 years who can read and write meaningfully with understanding in any language. Age Dependency Ratio- The ratio of the population aged 0-14 and 65 years and above to the population aged 15-64 years. Age Specific Fertility Rate- The number of live births in a given year per 1000 women or per woman in each child bearing age group from 15-19 up to 45 – 49. Age- The length of time or duration of one’s of life. It is the difference between the date of birth and any other date of reference commonly expressed in complete years. For example, a person who is 22 years and 11 months is recorded as having an age of 22 and not 23. Annual Population Growth rate- This refers to the change in the population over a unit time period, often expressed as a percentage of the number of individuals in the population at the beginning of that period. Antenatal Attendance Coverage - The number of new clients attending antenatal clinics as a proportion of the total number of estimated pregnancies in the service population. Average Household size- The ratio of the total population to the total number of households in the country. BCG Immunisation Coverage- The number of children below one year who receive BCG immunisation expressed as a percentage of the total number of children below one year or expected births in the absence of true census of children aged one year and below. Birth Attended by Skilled Health Staff -The percentage of deliveries attended by personnel trained to give the necessary supervision, care and advice to women during pregnancy, labour, and the post-partum period, to conduct deliveries on their own, and to care for the new-borns. Birth Rate- The number of live births observed in a population to the size of the population during the reference period. The rate is usually stated per 1000 and the most usual period is one year. Child Biologically, a child is a human being between the stages of birth and puberty. Legally, a child is a person younger than the majority (a minor). In the case of Uganda, a child is a person below 18 years of age (as per the Children’s Statute 1997). Child Dependency Ratio- The proportion of children less than 15 years relative to the population of “working ages”. Community Health Workers - These are personnel who are chosen by community members or organizations to provide basic health and medical care to their communities. Community health care providers include: village health workers, community health aides, community health promoters and lay health advisors. Crude Birth Rate- This refers to the total number of live births per 1000 population in a given year.

x
Crude Enrolment Ratio- The percentage of the total Enrolment at all levels to the total population. It is obtained by total Enrolment at all levels (Crude Enrolment) divided by the total population (where Enrolment includes all those attending primary, secondary and tertiary institutions). Compendium of Statistical Concepts and Definitions [Edition IV] Delivery in Health Facility - Delivery that occurs in a health facility. Health facilities include government and NGO health centres, clinics and hospitals. Dropout Rate -The percentage of pupils or students enrolled in a given grade, cycle or level of education in a given school year that have left school either voluntarily or otherwise. Educational Level- The highest rank of formal training attained by an individual or group of people following a prescribed curriculum. Enrolment Ratio- The proportion of the population in a specified age group attending primary school to the total population in that age group. Enrolment- Those pupils who were admitted or re-admitted and fully recorded in the school’s register at the beginning of the first term. It includes all those pupils whose names appear on the school register (including repeaters and those temporarily absent). Foetal Mortality - Death of foetus prior to the complete expulsion or extraction from its mother, for example: still-births. Full-time Teacher - A person engaged in teaching for a specified number of hours per week on a permanent basis in accordance with the official working regulations of the country. Grade Specific Enrolment Ratio- The ratio of the Enrolment in a specific class to the total Enrolment at all levels. Gross Enrolment Ratio- This is the total enrolment in a specific level of education (Pre-primary, Primary, Secondary and Tertiary), regardless of age, expressed as a percentage of the eligible official school-age population corresponding to the same level of education in a given school-year. Handicap- The condition of being unable to perform as a result of physical or mental unfitness, impairment or a disability. Health Centre II - Out-patient clinics treating common diseases and offering antenatal care. According to the Uganda government’s heath policy, every parish is supposed to have a Health centre II. Health Centre III - Health centre with facilities which include an operation room and a section for minor surgery headed by a clinical officer. Health Centre IV - A mini hospital with the kind of services found at Health Centre III. Health centre IV is classified as a small hospital. In addition to having an operation room, it has beds for in-patients. Health Facility - A structure that has a roof and walls, and stands more or less permanently in one place with in-patient services. Health facilities include; hospitals and health centres II, III &IV. HIV Prevalence - The percentage of a given population whose blood samples tested positive for HIV. Impairment- Any loss or abnormality of psychological or anatomical structure of a function. Infant- A new-born baby who has not attained his/her first birthday as per the reference period. Infant Mortality rate- The probability of a child born in a specific year or period, dying before reaching the age of one if subjected to age-specific mortality rates of that period, per 1000 live births. Intake Rate - the proportion of children that are joining school for the first time to the total number of children in the official admission age. Late Starters Rate- The proportion of new entrants in Grade One (at primary level) that are above the official admission age (over 6 years) to the total population of official admission age (6 years).

xi
Life Expectancy - An estimate of the average number of additional years a person is expected to live, if the age specific death rates for a given year prevailed for the rest of his or her life. Literacy rate - This is the proportion of pupils/students aged 10 years and above who are able to read and write with understanding in any language expressed as a percentage of the total population in the country. Literacy-The ability to write meaningfully and read with understanding in any language. A person who cannot write meaningfully and read with understanding in any language is considered illiterate. Livelihood Analysis- A comprehensive assessment and interpretation of the way an individual, household or given community lives and survives. Effectiveness: The extent to which planned activities are realised and planned results achieved. Maternal Mortality Rate- The proportion of deaths of women that occur during pregnancy, child birth, within two months after the birth, or termination of the pregnancy for a specified period per 100,000 live births. Measles Immunisation Coverage- The number of children below one year that receive the 1st dose of measles vaccines divided by the number of children below one year or expected births in the absence of true census of children below one year of age. Morbidity - The frequency of disease, illness, injuries, and disabilities in a population. Morbidity Incidence rate - Number of persons contracting a disease per 1,000 population at risk, for a given period of time. Morbidity Prevalence Rate - Number of persons having a particular disease at a given point in time per 1,000 population at risk. National Immunisation Rate - The percentage of children that have received a given vaccine. Immunisation covers children under one year and those between 12 to 23 months. Neonatal Mortality rate- The probability of dying within the first month of life Net Enrolment Ratio- This is the enrolment of the official age-group for a given level of education (Pre-primary, Primary, Secondary and Tertiary) expressed as a percentage of the corresponding population. Older Person- A person aged 60 years and above. Previously, older persons were commonly referred to as “the Elderly”. Orphan- A child whose biological parent or both parents are dead. Single orphans are children who have lost one biological parent, while double orphans are those who have lost both biological parents. Out-Patient Department Utilisation Rate- The number of total OPD attendance (i.e. new attendance and re-attendance) per catchment population for the year in question expressed as a percentage. Part-time Teacher - A person engaged in teaching for a limited number of hours per week in addition to other official responsibilities or engagements they may have. Patient Bed Occupancy Rate- The number of patient bed days in a given period (e.g. quarter or year) divided by the product of number of beds in an institution and number of days in time period under review. It measures the extent to which in-patient facilities are being utilised. Pedagogical Staff- These are non-teaching personnel, for example head teachers and school administrators, supervisors, school health personnel and librarians working in education institutions. Pit latrine coverage - The percentage of households that have a functional pit latrine. Population Density- Total population per square unit of area (sq Km). Population Growth -The change in a given population or in one of its structural units within a given time interval. The components of change in total population are births, deaths and migration.

xii
Post Neonatal Mortality rate- The arithmetic difference between infant and neonatal mortality In Uganda the four levels of formal education include: pre-primary, primary, secondary, and tertiary. Entry years at each level: i Pre-primary - 3 years; ii Primary- 6 years; iii Secondary – 13 years; iv Tertiary – 19 years Pre-Primary Education Programmes at the initial stage of organised instruction designed to introduce young children, aged three years and above, to a school environment. Such programmes include; infant education, nursery education, pre-school education, or early childhood education. Primary Education - The first stage of compulsory education which provides pupils with basic literacy and numeracy principles, and a foundation in science, mathematics, geography, history and other social sciences.. It is preceded by pre-school or nursery education. The entry age for primary education usually varies between five and seven years. In Uganda this level covers seven years of elementary education. Pupil-Classroom Ratio- The average number of pupils/students per class at a specific level of education in a given school-year. Pupil-Stance Ratio- The number of pupils in the school divided by the total number of latrine stances in the school. Pupil-Teacher Ratio- The average number of pupils (students) per teacher at a specific level of education in a given school-year. Pupil-Textbook Ratio -The number of pupils using a single textbook. Repetition Rate - This is the proportion of pupils/students from a cohort enrolled in a given grade at a given school-year who study in the same grade in the following school-year. Reproductive Health- A complete physical, mental and social well-being in all matters relating to reproductive system and its functions and processes. WHO includes the term not limited to absence of disease at all stages of life. Retention Rate-the proportion of learners that completed to the total number of learners who started the qualification, excluding transfers to other institutions. For programmes of study of two years or more, retention is calculated across the whole programme i.e. from the start to the end of the qualification. Rural population - Total number of persons residing in rural areas or countryside areas that are not urbanised. Usually, most land in rural areas is utilised for agriculture. Secondary Education- Educational level following primary school education. In Uganda, secondary level education (ordinary level) covers four years of general instruction at the initial stage, and two extra years of specialised instruction (advanced level). Sex - The biological and physiological characteristics that define men and women. It is the differentiation of individuals, groups or an entire population of a country with reference to their reproductive functions. Sex Ratio - The relative number of total males to females, usually expressed as a percentage. Teacher - A person who provides education for pupils (children) and students (adults). In their respective professional capacities, teachers guide and direct learners in gaining knowledge, attitudes and skills whilst following a definite curriculum programme. Tertiary Education- Educational level following the completion of secondary school education. Tertiary education also refers to third stage, third level, and post-secondary education. Tetanus Toxoid (TT) Coverage - Number of TT1, TT2, TT3, TT4, and TT5 doses given to pregnant women expressed as a percentage of the number of expected pregnancies in the same period. The coverage of pregnant women attending Antenatal clinic with TT vaccine is an indicator of quality of care. Total Fertility Rate- The average number of children who would be born to each woman in her reproductive age (15-49) following a particular Age Specific Fertility Rate (ASFR) at a particular period.

xiii
Transition Rate -The proportion of pupils or students admitted into first grade of a higher education level in a given year to the total number of candidates who successfully completed the final grade of the lower level of education in the previous year. Under-five Mortality rate - The probability of a child born in a specific year or period dying before reaching the age of five, if subjected to age-specific mortality rates of that period, per 1000 live births. Universal Primary Education (UPE) - One of the Government of Uganda’s main policy tools for achieving poverty reduction and human development by providing the facilities and resources to enable every child to enter and remain in school until the primary cycle of education is complete. Urban population -Total number of persons residing in gazetted urban areas (such as City, Town and Municipal councils) User Satisfaction with Health Services - The number of people surveyed expressing satisfaction with health services divided by the total population surveyed. Vulnerability - A measure of the extent to which a community, individual, structure, service or geographic area is likely to be damaged, disrupted or impoverished, on account of its nature or location, by the impact of a particular disaster or hazard. Youth - Any person aged between 18 and 30 years (As per the National Youth Council Statute 1993 of Uganda).

xiv
EXECUTIVE SUMMARY
Introduction: This Statistical abstract for FY 2020/2021 provides information majorly for Bushenyi District which covers Constituencies
for Igara East, Igara West and Bushenyi - Ishaka Municipality. Igara East has 7 Lower Local Governments [LLGs], 26 Parishes
& Wards and 493 Cells /villages; Igara West has 7 LLGs, 31 Parishes & Ward and 244 Cells /villages while Bushenyi-Ishaka
Municipality has 3 Divisions, 16 Wards and 78 Cells. In total Bushenyi District has 17 LLGs including Bushenyi Municipal
Council, 73 Parishes & Wards and 571 Villages & Cells. Bushenyi District has a total of population of 248,300 of which
females are 126,100 and males are 122,200 accounting for 50.8% and 49.2 % respectively [July 2020, Projections].
According to 2014, National Population and Housing Census, Bushenyi District had a population of 235,617 and density of
274.3 persons per sq. km and Area of 905 km²
The abstract is divided into 9 Chapters as highlighted here under.
Chapter 1: covers the background information, location of the district, land Size, Population density, tourism potentials,
geographical features, topography and climatic conditions, Soils, hydrology and mineral resource endowment.
Chapter 2: highlights Bushenyi District administrative Structure with 3 Constituencies, 17 Lower Local Governments, 72
Parishes / Wards and 567 villages /Cells. It also covers Human Resource Management for all the departments and health
centres including the HCIV, Council Committees, Board and Commissions.
Chapter 3: covers Population characteristics, Population Census and Projections, Population distribution, Population
density, urbanisation rates, Average household sizes, Socio-economic Characteristics, housing conditions, poverty
distribution, Employment and occupation status, household main source of livelihoods, household assets, source of energy
for cooking and lighting; Revenue performance for the district from FY 2019/2020, Revenue Expenditure against budget in
FY 2019/2020 and Budget Analysis by revenue category namely; wage recurrent, non- wage recurrent, domestic
development and donor development.
Chapter 4: highlights health infrastructure, accessibility to health services, disease burden, health manpower, safe water
coverage from 2002-2020, household distance to the nearest social services, larine coverage was 99.3 % according to the
2014 National Population and Housing Census, the latrine coverage in Bushenyi district from 96% in FY 2018/19 to 98% in
FY 2019/2020 [Source: DHO’s office], hand washing coverage from 39.1% in FY 2018/2019 to 65 % in FY 2019/2020;
Immunization coverage, drug inspection, Maternal and Child health, HIV /AIDS prevalence Rates, HIV/AIDS Counselling
Sites, Distribution of ART Services by Health Facility & Lower Local Government. Prevention of Mother to Child
Transmission initiatives in FY 2016/2017.
Chapter 5: highlights Education and Sports Sector related information. Distance of households to the nearest school by
ownership, Number of School going age children by gender, number of Education Institution by ownership; Availability of
infrastructure in schools, Enrolment of Pupils by sex, by Lower Local Government and Teachers’ distribution by sex and
Lower Local Government. Efficiency ratios, Service delivery and accessibility Indicators; Trends in PLE and O’level Academic
Performance and Inspection indicator performance.

xv
Chapter 6: highlights Works and Technical Services Sector related data. It captures Roads by type, length and condition;
Major activities implemented by Sub County in Financial Year 2017/2018; Capacity and Condition of district offices.
Chapter 7: highlights Natural Resources Sector related data. Environmental and sanitation related Statistics; Waste
management, tree planting and charcoal burning; state of wetlands by location, land management and forestry related
information.
Chapter 8: highlights Gender and Community Based Services Sector related information. It highlights the sector and Sub
Sectors, community development groups, FAL instructors and Learners, Youth Livelihood Projects and Uganda Women
Entrepreneurship Programme Projects implemented by Sub County in FY 2018/2019 to 2020/2021; Gender and Culture
related Statistics, Probation and OVC related data; Distribution of the elderly sub county as at 2014 NPHC; Disability
Statistics in the district; orphan hood and disability status of children [< 18 years].
Chapter 9: highlights Production and Marketing Sector related information. It highlights distribution of households by
major crops grown by Sub County; Common diseases, Pests for Selected Crops; Staffing levels for Production Sub Sectors;
households with livestock by Sub County, Livestock disease Prevalence, Farmers with Stocked Fish Ponds by sex, village,
parish, Sub County by number & size of fish ponds and year established; distribution of SACCO and dairy cooperative
Societies.
Annexes: Captures information on Administrative Units, Population distribution by Sub County/Town Council by sex;
trends for the Poor, Insecure Non-Poor and Middle Class by region from 1992 – 2012; District Population Variables by
Constituency as per 2014 NPHC; Summary of district and Sub County Councillors; Population Projections by Age group and
functional age groups.

xvi
Figure 1: Map of Bushenyi District Showing Lower Local Governments

xvii
General information about the District
Total Surface Area : 708 km
Land Area : 698.6 Sq km
Area under open water : 9.4 Sq km
Temperature ranges from : 12.5oC to 30oC.
Mean Annual Rainfall : 1500 – 2000 mm
Demographic and Socio-economic Indicators
Sn Indicator : Number / [%]
1. Total Population [2020 Census] : 248,300
2. o/w Total Males [2020 Census] : 122,200
3. o/w Total Females [2020 Census] : 126,100
4. Percentage of total population that is Male : 49.2
5. Percentage of total population that is Female : 50.8
6. Total Number of Households 2020 : 52,300
7. Average Household Size : 4.747
8. Total population that is Rural : 183,100
9. Total population that is Urban : 65,200
10. Total Households – Rural : 38,545
11. Total Households – Urban : 13,755
12. Percentage of total Population that is Urban : 26.3
13. Percentage of total population that is Rural : 73.7
14. Estimated Land Area for Bushenyi District [Sq km] : 905.
15. Population Density for Bushenyi District [2014 Census –Persons /Sq km] : 274.3
16. Land that open to open water : 8.6%
17. Wet Land : 2.2%
18. Total Ugandan Population : 34,634,650
19. Percentage share of Uganda’s total Population : 0.6
20. Total Population growth rate for Bushenyi from 2002 -2014 [%] : 1.2
21. Projected Population for 2015 : 236,100
22. o/w Total Male population for 2015 : 115,200
23. o/w Total Female Population for 2015 : 120,900
24. Total Projected Population in 2016 : 238,700
25. o/w Total Male Population for 2016 : 116,700
26. o/w Total Female Population for 2016 : 122,000
27. Total Projected Population for 2017 : 241,200
28. o/w Total Male Population for 2017 : 118,100
29. o/w Total Female Population for 2017 : 123,100
30. Total Projected Population for 2018 : 243,700
31. o/w Total Male Population for 2018 : 119,500
32. o/w Total Female Population for 2018 : 124,200
33. Total Projected Population for 2019 : 246,100
34. o/w Total Male Population for 2019 : 120,900
35. o/w Total Female Population for 2019 : 125,200
36. Total Projected Population for 2020 : 248,300
37. o/w Total Male Population for 2020 : 122,200
38
39
40
41
o/w Total Female Population for 2020
Total Projected Population for 2021
o/w Total Male Population for 2021
o/w Total Female Population for 2021
:
:
:
:
126,100
250,400
123,400
127,000

1
CHAPTER 1: BACKGROUND INFORMATION
1.0 Introduction
This chapter gives background information, location, size, climate, vegetation, geographical and other features about Bushenyi
district.
1.1 Location and size
Bushenyi is one of the districts in the South Western Region of Uganda The district lies between 0o N and 0o 46’ S of the equator
and 29o 41’ East and 30o30’ East of Greenwich Temperature 12.50c-300 and Rainfall range 1500-2000mm. It is surrounded by the
districts of Buhweju and Bunyaruguru in the North, Sheema in the East, Mitooma in the West and Sheema and Mitooma in the
South. The largest town in the district, Ishaka, is located 75 kilometres (47 mi), by road, northwest of Mbarara. The
coordinates of the district are:00 32S, 30 11E.Bushenyi has a total area of 942 sq. km and is 910-2500 meters above sea level.
Bushenyi district gets its name from the major town in the area, which is Bushenyi. Agriculture employs about 87% of
the whole district's population.
1.2. Historical Background
Bushenyi District was created in 1974 out of Mbarara District, Bushenyi was the cradle of the UPC party in the western region. In
2009, it was split into five districts (four new districts of Buhweju, Mitooma, Sheema and Rubirizi districts) with one new municipal
council of Bushenyi-Ishaka. Bushenyi has a total area of 942 sq. km and is 910-2500 meters above sea level and a population of
248,300 as of 2020 Population projections.
Economic activities
Bushenyi District is fairly endowed with natural resources. The district has relatively low poverty levels among its residents. The
economy of the district depends mainly on agriculture. Agriculture is a source of food for the population, subsistence income
for most families and provides direct employment to 86.7% of the district population, as well as supplying raw materials to
industries. The majority of the people are involved in subsistence agriculture with some engaged in commercial production of
crops including: Coffee, Tea, Sweet Bananas and Matooke. The major Economic activities include; semi intensive agriculture,
fishing, trade and commerce, transport, stone quarrying, sand mining, mineral mining, construction industry, tourism and
lumbering.
Ranching for beef and dairy farming for milk production are widely practiced on both subsistence and commercial scales in Bushenyi District. Hybrid cattle are widely raised on farms in the district. The hybrids produce more milk per animal and yield more beef per carcass and therefore are more profitable than the local breeds.
Soil degradation, poor marketing and processing systems, and frequent outbreak of crop and livestock diseases are some of the challenges that the farmers in the district face

2
1.3 Tourism
Bushenyi District has a big potential for the tourism industry that includes among others the following: Queen Elizabeth
National Park. About 5 percent of Queen Elizabeth National Park lies in Bushenyi district. Kalinzu Forest Reserve/Ecotourism
center. Bunyaruguru Crater Lakes. Kyambura Wildlife Reserve. Crafts and Souvenirs Industry. Hotel and Catering.
Social services: Bushenyi has 36 private and government health centres and three privately owned hospitals. There are 127
government-aided primary schools and 56 private owned ones. The district has seven government-aided secondary schools
and 31 private secondary schools.
1.4. Geographical Features
1.4.1 Topography
The eastern and central part of the district is a low-lying plateau with undulating hills. The rest of the district is hilly with sharp
valleys and craters mainly in Kakanju, Kyabugimbi and Ruhumuro sub counties. This provides opportunity for tourism, tea
growing and source of gravity water, it however possesses challenges in terms of road infrastructure and development thus
making it hard for accessibility by vulnerable service providers
1.4.2 Climate, Rainfall, Temperature, Humidity and Winds
The district receives 1500-2000mm of rainfall annually and the mean annual temperature ranges from 12.5o C to 30o C. This climate
is conducive and suitable for agricultural activities carried out in the district.
1.4.3 Soils
The district is endowed with loamy fertile soils with varying proportions of sand and clay. It has tropical rain forest vegetation
of Kalinzu, Katsyoha-Kitomi and Imaramagambo; and savannah woodlands as well as semi- arid vegetation in the north and
wetland vegetation.
.
1.4.4 Hydrology
Bushenyi District is endowed with rivers, streams & wetlands most of which flow in to river Rwizi, Edward and George. The
wetlands are spread in all the Lower Local Governments. Major swamps in Bushenyi include: Nyamirembe, Nyaruzinga,
Kandekye, Kyamugambira, Warugo and Katarimwa. The following hills in Bushenyi District act as the main sources of
water/rivers and streams and they serve as water catchment areas. And they include: Ruhumuro Hills, Rutooma escapments,
Kanyaruhara in Kyabugimbi , Buramba in Ishaka and Mpama in Nyabubare
1.4.5 Mineral Resources
Bushenyi District is endowed with minerals like; gold plus other base minerals. A number of companies intending to carry out
mineral exploration have already expressed their interest through the Ministry responsible and the District. Other minerals
available include; clay for brick making in various places in the District. Many more minerals are reported to exist including
stone mining and sand quarrying.

3
CHAPTER 2: MANAGEMENT SUPPORT SERVICES
2.0 Introduction
This chapter presents statistics on management and support services. It presents details on district administrative structure.
Human Resources Management, the Councils, Boards and Commissions, Public Accounts Committee and land board.
Table 2.1: Number of Administrative Units by Constituency Table 2.1: Number of Administrative Units by Constituency
Sn Constituency sn Sub County /TC Name No. of Parishes No. of Villages
1 Igara West 1. Bitooma TC 6 36
2. Kyamuhunga S/C 7 56
3. Kyamuhunga TC 3 23
4. Kakanju S/C 5 49
5. Nyabubare S/C 3 38
6. Kizinda T/C 3 25
7. Nkanga S/C 4 17
Sub Total 7 31 244
2 Igara East 1. Ibaare Sub County 4 32
2. Bumbaire Sub County 4 51
3. Kyeizooba Sub County 6 54
4. Rwentuha Town Council 3 27
5. Kyabugimbi Sub County 3 26
6. Kyabugimbi Town Council 2 27
7. Ruhumuro Sub County 4 32
Sub Total 7 26 249
Total [1+2] above 14 57 493
3 Bushenyi Municipal Council
[BMC]
1. Central Division 6 31
2. Ishaka Division 5 20
3. Nyakabirizi Division 5 27
Sub Total 3 16 78
Total Bushenyi District
[1+2+3]
17 73 571
Source: District Planning Department
2.1 Administrative Structure
The District is divided into 2 counties, 3 Constituencies of Igara West, Igara East and Bushenyi Municipal Council. Igara West
has 3 Town Councils, 4 Sub Counties, 12 wards, 19 Parishes, 84 Cells and 160 villages. Igara East has 2 Town Councils, 5 Sub
Counties 5 Wards, 21 parishes, 54 Cells and 195 Villages. Bushenyi Municipality has 3 divisions, 16 Wards and 78 Cells. In Total,
Bushenyi District has 17 LLGs, 73 Parishes & Wards, 571 Villages & Cells.
The District Council is the highest political authority, with 32 members under the headship of the District Chairperson. It has a
technical team headed by the Chief Administrative Officer, distributed in 12 departments. Each of the department has a head
and under each department, there are a number of sections.

4
BUSHENYI DISTRICT STAFFING LEVELS 2019/2020 FY
JOB TITLE
SCA
LE
app
rove
d
fille
d
vaca
nt
HEALTH
01 Accounts Assistant U7 2 0 2
02 Anaethetic Assistant U7 2 1 1
03 Anaethetic Officer U5 1 1 0
04 Askari U8 45 23 22
05 Assistant District Health Officer (Environmental Health) U2 1 1 0
06 Assistant District Health Officer (Maternal, Child Health/Nursing U2 1 1 0
07 Assistant Entomological Officer (Medical) U5 1 1 0
08 Assistant Health Educator U5 1 1 0
09 Biostatistician U4 1 1 0
10 Clinical officer U5 11 9 2
11 Cold Chain Assistant U7 1 1 0
12 Cold Chain Technician U6 1 0 1
13 Dispenser U5 1 0 1
14 District Health Officer U1E 1 1 0
15 Driver U8 2 2 0
16 Enrolled Midwife U7 31 31 0
17 Enrolled Nurse U7 92 70 22
18 Enrolled Pychiatric Nurse U7 1 1 0
19 Health Assistant U7 9 8 1
20 Health Information Assistant U7 8 8 0
21 Health Inspector U5 2 2 0
22 Laboratory Assistant U7 8 9 -1
23 Laboratory Technician U5 8 5 3
24 Medical officer U4 2 2 0
25 Nursing Assistant U8 0 14 -14
26 Nursing officer /Midwifery U5 1 5 -4
27 Nursing officer /Nursing U5 8 8 0
28 Nursing Officer /Pyschaitry U5 1 1 0
29 Office Attendant U8 1 1 0
30 Office Typist U7 1 1 0
31 Opthalmic Clinical Officer U5 1 0 1
32 Porter U8 45 38 7
33 Public Health Dental Officer U5 2 2 0
34 Public Health Nurse U5 1 1 0
35 Senior Clinical Officer U4 7 7 0
36 Senior Environmental Health Officer U3 1 1 0
37 Senior Health Educator U3 1 0 1

5
BUSHENYI DISTRICT STAFFING LEVELS 2019/2020 FY
JOB TITLE
SCA
LE
app
rove
d
fille
d
vaca
nt
38 Senior Medical officer U3 1 1 0
39 Senior Nursing Officer U4 1 1 0
40 Stenographer Secretary U5 1 1 0
41 Stores Assistant U7 2 2 0
42 Theatre Assistant U7 2 1 1
Sub Total 310 264 46
Office of Chief Administrative Officer
1 Chief administrative Officer U1SE 1 1 0
2 Personal Secretary U4 1 1 0
3 Driver U8 1 1 0
Total 3 3 0
Administration
1 Deputy Chief Administrative Officer U1SE 1 1 0
2 Principal Assistant Secretary U2 1 1 0
3 SeniorAssistant Secretary U3 1 0 1
4 Assistant Secretary U4 1 1 0
5 Senior IT Officer U3 1 1 0
9 Senior Records Officer U3 1 1 0
7 Communication Officer U4 1 0 1
5 IT Officer U4 1 0 1
9 Records Officer U4 1 1 0
10 Personal Secretary U4 1 1 0
12 Stenographer Secretary U5 3 4 -1
13 Pool Stenographer U6 2 0 2
14 Assistant Records Officer U5 1 0 1
5 Senior Office Office supervisor U5 1 0 1
15 Records Assistant U7 0 1 -1
16 Office typist U7 2 5 -3
17 Office Attendant U8 7 9 -2
18 Driver U8 11 3 8
19 Information Assistant U7 0 1 -1
37 30 7
Human Resource Management Unit
1 Principal Human Resource Officer U2 1 1 0
2 Senior Human Resource Officer U3 1 0 1
3 Human Resource Officer U4 1 1 0

6
BUSHENYI DISTRICT STAFFING LEVELS 2019/2020 FY
JOB TITLE
SCA
LE
app
rove
d
fille
d
vaca
nt
3 2 1
Statutory Bodies
1 Principal Human Resource Officer U2 1 1 0
2 SeniorAssistant Secretary(Sec land Board) U3 1 0 1
3 Secretary Stenographer U5 1 1 0
4 Pool Stenographer U6 1 0 1
5 Assistant Records Officer U5 1 0 1
5 2 3
Finance Department
1 Chief Finance Officer U1E 1 1 0
2 Senior Finance Officer U3 1 1 0
3 Senior Accountant U3 1 1 0
4 Finance Officer U4 1 1 0
5 Accountant U4 1 1 0
6 Senior Accounts Assistant U5 5 5 0
7 Assistant Inventory management Officer U5 1 0 1
9 Accounts Assistant U7 3 1 2
11 Stores Assistant U7 0 1 -1
14 12 2
Planning Department
1 District Planner U1E 1 0 1
2 Senior Planner/Senior Statistician U3 1 1 0
3 Planner U4 1 1 0
3 2 1
Works department 0
1 District Engineer U1E 1 1 0
2 Senior Water Engineer U3 1 1 0
3 Senior Assistant Engineer Officer (Sup of Works U4 1 1 0
4 Assistant Engineering Officer (water) U5 0 1 -1
6 Civil Engineer U4 1 0 1
7 Assistant Engineering Officer (Mechanical) U5 1 1 0
8 Road Inspector U6 1 1 0
9 Driver U8 3 3 0
10 Plant Operator U8 3 2 1
11 Wheel Loader Operator U8 1 0 1
12 Machine Attendant U8 1 2 -1
14 13 1
Education Department 0

7
BUSHENYI DISTRICT STAFFING LEVELS 2019/2020 FY
JOB TITLE
SCA
LE
app
rove
d
fille
d
vaca
nt
1 District Education Officer U1E 1 1 0
2 Principal Inspector of School( Inspection) U2 1 1 0
3 Senior Inspector of Schools U3 1 1 0
4 Education Officer (special needs) U4 1 1 0
5 Education Officer (Guidance and counselling) U4 1 1 0
6 Sports Officer U4 1 1 0
6 6 0
Primary teachers
1 Headteachers U4 126 108 18
2 Deputy Headteachers U5 126 109 17
3 Senior Education Assistant U6 126 132 -6
4 Education Assistant II U7 786 747 39
Total 1164 1096 68
Community Based Services 0
1 District Community Dev. Officer U1E 1 1 0
2 Senior Probation and Welfare Officer U3 1 0 1
3 Principal Community Development Officer U2 1 1 1
4 Labour Officer U4 1 1 0
5 Probation and Welfare Officer U4 1 1 0
5 4 1
Natural Resources 0
1 District Natural Resource Officer U1E 1 1 0
2 Senior Environment Officer U3 1 1 0
3 Forestry Officer U4 1 1 0
4 Senior Land Management Officer U3 1 0 1
5 Forestry Officer U4 1 1 0
6 Environment Officer U4 1 1 0
7 Staff Surveyor U4 1 1 0
8 Physical Planner U4 1 1 0
9 Records Assistant U7 0 1 -1
10 Forest Ranger U7 3 1 2
11 Forest Guard U8 1 1 0
12 10 2
Internal Audit Unit 0
1 District Internal Auditor U2 1 0 1
2 Internal Auditor U4 1 1 0
2 1 1
Procurement Unit 0
1 Senior Procurement Officer U3 1 1 0

8
BUSHENYI DISTRICT STAFFING LEVELS 2019/2020 FY
JOB TITLE
SCA
LE
app
rove
d
fille
d
vaca
nt
2 Procurement Officer U4 1 1 0
3 Office Attendant U7 0 1 -1
2 3 -1
Production department
1 District Production Officer U1E 1 1 0
2 Principal Agricultural Officer U2 1 1 0
3 Principal Veterinary Officer U2 1 0 1
4 Principal Fisheries Officer U2 1 1 0
5 Principal Entomologist U2 1 1 0
6 Senior Agricultural Officer U3 1 1 0
7 Senior Agricultural Officer Engineer (water for production U3 1 1 0
8 Senior Veterinary Officer U3 1 1 0
9 Senior Fisheries Officer U3 1 1 0
10 Senior Entomologist U3 1 1 0
11 Animal Husbandry Officer U4 1 1 0
12 Fisheries Officer (Aqual Culture) U4 1 0 1
13 Entomologist U4 1 1 0
14 Laboratory Technician U5 1 0 1
15 Assistant Inventory Officer U7 1 0 1
16 Laboratory Attendant U8 1 0 1
Sub Total 16 11 5
Trade and Industry L E D
1 District Commercial Officer U1E 1 1 0
2 Principal Commercial Officer U2 1 1 0
3 Senior Commercial Officer U3 1 0 1
4 Commercial Officer U4 1 1 0
5 Tourism Officer U4 1 1 0
6 Wildlife Officer U4 1 0 1
7 Conservation Officer U4 1 0 1
8 Assistant Commercial Officer U5 1 1 0
Sub Total 8 5 3
Sub county staff
1 Sub County Chief/Senior Assistant Secretary U3 10 10 0
2 Veterinary Officer U4 10 4 7
3 Fisheries Officer U4 10 0 10
4 Community Development Officer U4 10 10 0
5 Agriculture Officer U4 10 9 1
6 Assistant Animal Husbandry Officer U5 10 6 4

9
BUSHENYI DISTRICT STAFFING LEVELS 2019/2020 FY
JOB TITLE
SCA
LE
app
rove
d
fille
d
vaca
nt
7 Senior Accounts Assistant U7 10 9 1
8 Assistant Fisheries Officer U5 10 2 8
9 Assistant Agriculture Officer U5 10 2 8
10 Accounts Assistant U7 10 0 10
11 Parish Chief U7 49 47 2
12 Office Typist U7 10 7 3
13 Office Attendant U8 10 8 2
169 114 56
Town Council-Kyamuhunga TC
Office of the Town Clerk
1 Town Clerk U2 1 1 0
2 Driver U8 1 1 0
Sub total 2 2 0
Administration
1 Senior Assistant Town Clerk U3 1 0 1
2 Assistant Town Clerk U4 1 0 1
3 Human Resource Officer U4 1 1 0
4 IT Officer U4 1 0 1
5 Stenographer Secretary U5 1 1 0
6 Assistant Records Officer U5 1 1 0
7 Pool stenographer U6 1 0 1
8 Law Enforcement Officer U5 1 1 0
9 Principal Town Agent U5 3 3 0
10 Law Enforcement Assistant U8 3 0 3
11 Office Typist U7 1 0 1
12 Askar U8 2 0 1
13 Office Attendant U8 2 0 2
Driver U8 1 1 1
Sub total 20 8 12
FINANCE AND PLANNING
1 Senior Town Treasurer U3 1 1 0
2 Statistician/Economist U4 1 0 1
3 Senior Assistant Accountant U5 1 0 1
4 Assistant Inventory Management Officer U5 1 0 1
5 Assistant Accountant U6 1 0 1
Sub total 5 1 4

10
BUSHENYI DISTRICT STAFFING LEVELS 2019/2020 FY
JOB TITLE
SCA
LE
app
rove
d
fille
d
vaca
nt
WORKS
1 Town Engineer( Senior Engineer) U3 1 0 1
2 Physical Planner U4 1 0 1
3 Environment Officer U4 1 0 1
4 Assistant Engineering Officer(Civil) U5 1 0 1
5 Assistant Engineering Officer(water) U5 1 0 1
6 Engineering Assistants U7 1 0 1
7 porter U8 2 0 2
8 Machine Operator U8 1 0 1
9 Machine Attendant U8 1 0 1
Sub total 10 0 10
Trade Industry and Local Econ. Development
1 Senior Commercial officer U3 1 1 0
2 Assistant Commercial officer U5 1 0 1
Sub Total 2 1 1
PRODUCTION
1 Agriculture Officer U4 1 0 1
2 Assistant Fisheries Officer U5 1 0 1
3 Assistant Veterinary Officer U5 1 0 1
Sub Total 3 0 3
COMMUNITY BASED SERVICES
1 Senior Community Development Officer U3 1 1 0
2 Assistant Community Development Officer U4 1 0 1
3 Assistant Labour Officer U5 1 0 1
Sub Total 3 1 2
INTERNAL AUDIT UNIT
1 Senior Internal Auditor U3 1 0 1
Sub Total 1 0 1
PUBLIC HEALTH
1 Principal Health Inspector U3 1 0 1
2 Health Inspector U5 1 1 0
3 Assistant Health Inspector U7 1 0 1
Sub total 3 1 2
TOTAL WITH OUT HEALTH CENTRES 49 13 35

11
BUSHENYI DISTRICT STAFFING LEVELS 2019/2020 FY
JOB TITLE
SCA
LE
app
rove
d
fille
d
vaca
nt
Town Council-Rwentuha TC 0
Office of the Town Clerk
1 Town Clerk U2 1 1 0
2 Driver U8 1 0 1
Sub total 2 1 1
ADMNISTRATION
1 Senior Assistant Town Clerk U3 1 0 1
2 Assistant Town Clerk U4 1 0 1
3 Human Resource Officer U4 1 1 0
4 IT Officer U4 1 0 1
5 Stenographer Secretary U5 1 1 0
6 Assistant Records Officer U5 1 1 0
7 Pool stenographer U6 1 0 1
8 Law Enforcement Officer U5 1 0 1
9 Principal Town Agent U5 3 3 0
10 Law Enforcement Assistant U8 3 0 3
11 Office Typist U7 1 0 1
12 Askari U8 2 0 1
13 Office Attendant U8 2 1 1
14 Driver U8 1 0 2
Sub total 20 7 12
FINANCE AND PLANNING
1 Senior Town Treasurer U3 1 1 0
2 Statistician/Economist U4 1 0 1
3 Senior Assistant Accountant U5 1 0 1
4 Assistant Inventory Management Officer U5 1 0 1
5 Assistant Accountant U6 1 0 1
Sub total 5 1 4
WORKS
1 Town Engineer( Senior Engineer) U3 1 0 1
2 Physical Planner U4 1 0 1
3 Environment Officer U4 1 0 1
4 Assistant Engineering Officer(Civil) U5 1 0 1
5 Assistant Engineering Officer(water) U5 1 0 1
6 Engineering Assistants U7 1 0 1

12
BUSHENYI DISTRICT STAFFING LEVELS 2019/2020 FY
JOB TITLE
SCA
LE
app
rove
d
fille
d
vaca
nt
7 porter U8 2 0 2
8 Machine Operator U8 1 0 1
9 Machine Attendant U8 1 0 1
Sub total 10 10
Trade Industry and Local Econ. Development
1 Senior Commercial officer U3 1 1 0
2 Assistant Commercial officer U5 1 0 1
Sub Total 2 1 1
PRODUCTION
1 Agriculture Officer U4 1 1 0
2 Assistant Fisheries Officer U5 1 0 1
3 Assistant Veterinary Officer U5 1 1 0
Sub Total 3 2 1
COMMUNITY BASED SERVICES
1 Senior Community Development Officer U3 1 1 0
2 Assistant Community Development Officer U4 1 0 1
3 Assistant Labour Officer U5 1 0 1
Sub Total 3 1 2
INTERNAL AUDIT UNIT
1 Senior Internal Auditor U3 1 0 1
Sub Total 1 1
PUBLIC HEALTH
1 Principal Health Inspector U3 1 0 1
2 Health Inspector U5 1 1 0
3 Assistant Health Inspector U7 1 0 1
Sub total 3 1 2
TOTAL WITH OUT HEALTH CENTRES
49 13 34
1561 1342 219
86%
GRAND TOTAL 1880 1576 298
PERCENTAGE 84

13
2.3: Council, Committee, Boards, and Commission
2.3.1: District Council
Bushenyi District Council is composed of 20 males and 13 females making a total of 32 members currently. The District Council
is chaired by the speaker who is Female and his Deputy who is female to. The district council is the planning authority and
whose major role is to discuss and approve development plans, work plans, budget and formulate ordinances and approve by-
laws from Lower Local Government.
2.3.2: District Executive Committee Members
The District Executive Committee (DEC) is currently composed of 5 members of which 4 are males and 1 female. The district
Executive Committee is chaired by the District Chairman [Hon Basajabalaba Jafari ] who is a male. Each member of DEC serves
as a secretary of a sector where; Hon Bashemerirairwe Peace Tibakuna serves as the secretary for Health and Education and
CBS (social services), Hon. Mugume Nyahoza serves as secretary for works, water and Roads, Hon . Mwebesa Patrick Kizito
(RIP) serves as the Secretary for Finance, Planning, Administration and Investment. Hon Bomukama John serves as secretary
for production and marketing and Natural Resources sector. The sectorial Committee Chairpersons include: Hon. Muyambi
Julius Boona- Works, Roads and water. Hon. Barinyenka Boniface- Chairperson Education, Health and CBS. Hon. Kyomugisha
Grace- Chairperson Production, Marketing, Natural Resources. Hon. Kyakuwa Adam- Chairperson Finance, Planning and
Administration
2.3.3: Committees of Council
The district council performs its duties through the following standing committees; The Finance, planning, Administration and
investment committee; the community based services and production committee; works, water and natural resources
committee and education and health committee.
2.4: Boards and Commissions
Bushenyi district local government has 3 committees of council which include the following; District Land Board, District
Service Commission and Public Accounts Committee.
2.4.1: District Land Board Committee:
This committee has 5 members of which 3 are Males and 2 are Females. The chairperson of the committee is Mr. Paul Tusubira
who is a Male.
The major role of the committee is to handle land related matters in the district.
2.4.2: District Service Commission
The District Service Commission has 5 members of which 3 are Males and 2 are Females. The chairperson of the committee is
Mrs. Lydia Rwakishaya. who is a Female. This committee among other responsibilities performs the roles of; staff
confirmations, promotions, disciplinary, dismissal and recruitment of new staff.

14
2.4.3: Public Accounts Committee (PAC)
The public accounts committee has 5 members of which 3 are Males and 2 are Female. The chairperson of the committee is
Mr. Karasi Emmanuel. who is a Male. The committee performs its mandate of ensuring value for money in the utilization of the
District resources among other things.
2.4.4: Conclusion
The district council has functional boards and commissions and standing committees as earlier on highlighted above. All the
above are legally constituted and have to be fulfilled as per the constitution of Uganda.
CHAPTER 3: DEMOGRAPHIC AND SOCIO-ECONOMIC CHARACTERISTICS
3.0 Introduction
This chapter presents information from the department of finance and planning. It focuses on the population and social-
economic characteristics of the district, the planning & budgeting process, the available revenue sources, and the expenditures
in the previous financial year.
The Finance department is one of the biggest departments in the District whose objectives are to;
Identify and expand the revenue base:
build Finance and Management Capacity at district level; and
Strengthen Data Management systems, Revenue VRS and to influence demographic trends & patterns in a desirable
direction.
3.1 Population Characteristics
To formulate present and future development programmes, the district needs to know the size, quality, distribution and
growth of its population. Population censuses are the main sources of demographic data in general and information on
population size, distribution and growth rate in particular. Other sources may include various surveys, Birth and Death
Registration and Administrative Records.
3.2 Population size and Growth Rate Table 3.1: Total Popn & Growth rates for Bushenyi, Greater Bushenyi, Western Region & National from 1980-2019
Indic
ators Total Population
Projection
1980 1991 2002 2014 2016 2018 2019
Bushenyi District 235,617 238,700
243,700
246,100
Regional Population [Bushenyi
Greater]
408,663 579,137 731,392 875,096 905,361 936,672 952,732
Popn Growth rates for Greater
Bushenyi
3.2 3.2 2.0 1.7 1.7 1.7 1.7
Growth rate for Western Region 2.7 2.7 2.8 2.8 2.8 2.8 2.8
National Population Growth rate 2.7 2.5 3.2 3.0 3.0 3.0 3.0

15
Source: NPHC 2014 & Projections
Table 3.3: Population Projections for greater Bushenyi Districts from 2014 – 2018
Greater 2014 2016 2018
Bushenyi Male Female Total Male Female Total Male Female Total
Buhweju 59,059 61,661 120,720 62,400 64,800 127,200 66,300 68,600 134,900
Bushenyi 114,207 120,236 234,443 116,400 121,700 238,100 118,800 123,400 242,200
Mitooma 86,484 96,960 183,444 88,100 98,200 186,300 90,000 99,600 189,600
Rubirizi 61,765 67,384 129,149 63,800 69,400 133,200 66,200 71,900 138,100
Sheema 99,225 108,118 207,343 101,200 109,800 211,000 104,201 113,337 217,538
Total 420,740 454,359 875,099 431,900 463,900 895,800 445,501 476,837 922,338
Source: NPHC 2014 & Planning Unit office
3.1.2 Population Distribution
The distribution of a population by age and sex is among the basic types of information needed for planning. Sex and age
composition of a population has significant implications for the reproductive potential, human resource, school attendance,
family formation, health care and other service delivery in general.
The National Population and Housing Census was conducted in 2014 by UBOS and the provisional results were released.
Accordingly, the table below provides population projections by T/C and sub-county for all the districts from 2015 to 2021. The
projection results for this district are indicated in Table 3.2.
Further data processing and analysis is on-going to generate a more detailed report that will provide information on other
indicators up-to the lowest level. Analysis of educational requirements, labour force projections, household composition and
migration for example, would not be complete without considering information on age and sex.
Table 3.2:Population for greater Bushenyi Districts from 1991 – 2014 & Projections from 2016-2019 Distri
ct
Population Censuses Population Projections
1991 2002 2014 2016 2018 2019
Buhw
eju
55,534 82,881 120,720 128,442 136,657 142,732
Bushe
nyi
160,982 205,671 234,440 239,655 244,986 246,100
Mitoo
ma
134,251 160,802 183,444 187,524 191696 193,816
Rubiri
zi
75,361 101,804 129,149 134,420 136672 144,100
Shee
ma
153,009 180,234 207,343 212,379 217,538 220,164
Total 579,137 731,392 875,096 905,361 929,567 948,931

16
Table 3.4: Population by Sub County 2015 to 2020
Sub county 2015 2016 2017 2018 2019 2020 2021
Bushenyi Municipality
Central Divison 16,700 16,900 17,100 17,300 17,400 17,600 17,700
Ishaka Divison 16,600 16,800 16,900 17,100 17,300 17,500 17,500
Nyakabirizi Division 8,200 8,300 8,400 8,400 8,600 8,600 8,700
Bitooma 13,500 13,600 13,800 14,000 14,100 14,200 14,300
Bumbaire 14,400 14,500 14,600 14,800 14,900 15,100 15,100
Ibaare 11,700 11,800 11,900 12,000 12,200 12,200 12,400
Kakanju 23,000 23,200 23,500 23,700 23,900 24,200 24,400
Kyabugimbi 19,400 19,600 19,900 20,100 20,200 20,400 20,600
Kyamuhunga 21,100 21,400 21,600 21,800 22,000 22,300 22,400
Kyeizooba 21,400 21,700 21,900 22,100 22,300 22,600 22,800
Nyabubare 36,200 36,500 36,900 37,400 37,800 37,800 38,600
Ruhumuro 13,600 13,800 13,900 14,100 14,100 14,300 14,400
Kyamuhunga Town Council 14,900 15,100 15,300 15,400 15,600 15,800 15,800
Rwentuha Town Council 5,400 5,500 5,500 5,500 5,700 5,700 5,700
Total 236,100
238,700
241,200
243,700
246,100
248,300
250,400
3.1.3 Population Density
Population density refers to the number of people per square kilometre. Bushenyi district has an area of 905 sq.km. Therefore,
the population density was 297 persons per sq.km of land in 2014. The population density increased from 258 persons per
sq.km in the year 2002 to 297 persons per sq.km in the year 2014
3.1.4 Urbanisation rates and levels
Urbanisation is defined as the increase in the proportion of the population living in the urban area. However, the definition of
urban areas has been changing over time. The 2002 and 2014 censuses defined urban areas as only the gazetted one while the
earlier censuses included un gazetted urban centres with more than 1000 people as part of the urban population.
Table 3.6: Population Distribution by Rural – Urban and Sex as of 2020 Area Total
Rural 73.7 122,200
Urban 26.3 126,100
Total 100 248,300
Source: NPHC 2020, UBOS
3.1.5 Average Household size
A Household is defined as a group of people who normally eat and leave together. Household composition is a key variable for
determining demographic characteristics of a population. Household size refers to the number of occupants of a household.

17
Table 3.8: Bushenyi Municipal Council Average household size by Division
Divisions No. Households Total Av. HH size
1. Nyakabirizi Division 5,632 25,778 4.6
2. Ishaka Division 2,942 13,866 4.7
3. Central Division 4,817 21,310 4.4
Total 18,311 80,735 4.4
Source: NPHC 2014, UBOS
3.2 Socio-Economic Characteristics
The socio-economic characteristic entails the well-being of the community. It includes the housing conditions, household
assets, incomes and outstanding loans, household expenditure, welfare indicator and cultural participation of household
members.
3.2.1 Housing conditions by type of house
Housing is one of the basic human needs that have a profound impact on the health, welfare, social attitude and economic
productivity of the individual. It is also one of the best indications of the person’s standard of living and his/her place in society.
This section provides information on the housing conditions of the population, household sanitation, assets and amenities
available to the household and general household welfare.
Table 3.9: Type of dwelling Units by location and Percent
Status of Dwelling Unit Urban Percent Rural Percent Total Percent
Permanent 7,635 23.1 4,962 23.1 10,597 23.1
Semi-Permanent 20,254 74.9 16,074 74.9 34,328 74.9
Temporary 472 2.0 415 2.0 887 2.0
Total 28,361 100.0 21,451 100.0 45,812 100.0
Source: NPHC 2014
3.2.2 Poverty distribution
Poverty has many different dimensions, ranging from material well-being (basic needs like nutrition, good health, shelter,
education etc.) to lack of human rights, citizenship or social networks. Economic factors such as low income, lack of assets,
access to markets or public services can lead into poverty.

18
Table 3.10: Poverty distribution by Sub-county
Bushenyi District
Sub-County/Town Council Per capita poverty 2012/13 (%) Children Poverty (%)
Bitooma TC 6.3 7.3
Kyamuhunga S/C 5.7 6.7
Kyamuhunga TC 6.7 7.7
Kakanju S/C 6.4 7.4
Nyabubare S/C 5.3 6.2
Kizinda T/C 6.2 7
Nkanga S/C 5.6 6.5
Ibaare Sub County 8.3 9.5
Bumbaire Sub County 6.7 7.65
Kyeizooba Sub County 6.3 7.3
Rwentuha Town Council 4.2 5.5
Kyabugimbi Sub County 5.6 6.1
Kyabugimbi Town Council 5.3 6.5
Ruhumuro Sub County 5.4 7.1
Bushenyi- Ishaka Municipality
Division Per capita poverty 2012/13 (%) Children Poverty (%)
Central Division 4.7 4.3
Ishaka Division 4.5 5.3
Nyakabairizi Division 4.3 5.1
Bushenyi – Ishaka Municipality 4.5 4.9
Source: (Planning Unit)
3.2.3 Employment and Occupation by type and age group
The indicator of status of employment distinguishes between two categories of working and not working.
Table 3.11: Activity status
Age group Working %ge Not working %ge
10-15 8,727 25.8 25,073 74.2
10-17 12,430 28.4 31,387 71.6
18-30 33,121 74.8 11,137 25.2
16-64 81,043 80.2 20,036 19.8
18yrs and above 83,323 83.6 16,353 16.4
60yrs and above 9,004 75.5 2,925 24.5
Source: NPHC 2014

19
Table 3.12: Source of energy for Cooking
Type of Household Utility Total Percent [%]
Electricity 732 1.5
Gas 201 0.4
Paraffin - stove 512 1.0
Charcoal 5,914 12.3
Fire wood 39,583 82.3
Other 793 1.6
Total 48,050 100.0
Source: NPHC 2014
According to the 2002 National Population and Housing Census, 732 out of 48,050 households were using electricity for
cooking which accounts for 1.5 percent. This also means that out of the 8,396 households in Bushenyi district that had access
to electricity only 732 households could afford to use electricity for cooking which accounts for 1.5 percent. This therefore,
requires government to reduce the cost of electricity so that many more people could afford electricity for cooking which
provides clean energy. There is dire need for government, its development partners and the private sector to promote the use
of electricity, Solar and gas for cooking. The proportion of the households using charcoal and firewood for cooking accounts for
94.6 percent which possess serious pressure on the wood biomass thus contributing to environmental degradation and other
associated consequences including silting rivers, increased erosion, desertification and climate change in general.
3.3: Planning and Budgeting Process
The Finance department is one of the biggest departments in the District. Its objectives are to;
Identify and expand the revenue base:
Build Finance and Management Capacity at district level; and
Strengthen Data Management systems, Revenue VRS and to influence demographic trends & patterns in a desirable
direction.
3.3.1 Budgetary Allocations to Departments and Revenue Sources to the district
This section highlights the district revenue sources from FY 2016/17– FY 2018/2019 as indicated here under;
3.3.2: Revenue sources by Amount
Revenue sources for four financial year 2019/2020
Table 3.13: District Revenue Performance for Financial Year 2019/2020
Reven
ue
Source
Total
planned
revenue
s
Allocation to sectors Total
expendit
ure
Expenditure by sectors 2020 Remark
s
Primary Growth Sectors
Complementary Sectors
Social services Sector
Enabling Sector
Primary Growth Sectors
Complementary Sectors
Social services Sector
Enabling Sector

20
Local
Reven
ue
440,265
,000
1,750,0
00
42,014,
319
1,100,0
00
74,242,
037
95,653,4
01
500,00
0
36,372,
801
1,100,0
00
57,680,
600
Low revenue base
Centra
l gov’t
transf
ers
30,561,
124,000
824,84
9,289
989,954
,414
635,54
6,807
7,987,4
04,385
11,554,9
93,940
665,54
9,875
530,62
3,625
7,793,8
47,986
2,564,9
72,454
Sector
grants
still low
Donor
funds
176,001
,000
0 0 172,38
5,500 0
172,385,
500
0 0 172,385
,500 0 0
Note: Primary growth sectors include; Production, Forestry. Complementary sectors include; Works,
Physical planning, Land management and Finance, Enabling sectors include; Administration, Audit,
Planning, Statutory bodies, Environment and Wetlands, Social services include; Education and Sports,
Health, Water and Community Based Services
3.3.3 Sectoral expenditure against the budget Table 3.14. Bushenyi District Department Expenditure Performance against the Budget & Releases in FY 2019/2020
Sector Budget FY
2019/20
Actual Release
by June 2020
Actual
Expenditure by
June 2020
% of Budget
Released
% Budget
Spent
% Releases
Spent
Administration 6,363,479 6,683,346 6,123,526 105% 96% 92%
Finance 367,431 463,598 318,551 126% 87% 69%
Statutory Bodies 748,550 723,381 604,028 97% 81% 84%
Production and
Marketing
3,939,172 1,969,479 1,409,806 50% 36% 72%
Health 3,416,540 3,292,074 3,213,106 96% 94% 98%
Education and
Sports 14,614,092 14,447,518 14,447,518 99% 99% 100%
Works 927,775 769,348 744,099 83% 80% 97%
Water 256,527 259,058 252,338 101% 98% 97%
Natural Resources 178,658 176,971 137,194 99% 77% 78%
Community Based
services
183,304 182,973 176,680 100% 96% 97%
Planning
Department
105,489 102,293 91,030 97% 86% 89%
Internal Audit 53,241 48,280 28,166 91% 53% 58%
Trade & Industry 23,132 23,193 23,191 100% 100% 100%
Total 31,177,391 29,141,512 27,569,233 93% 88% 95%
Quarter Four PBS Progress Report 2019/2020

21
CHAPTER 4: HEALTH SERVICES
4.0 Introduction
The Department of Health is headed by the District Health Officer whose mandate is guided by the District 5
Year Strategic Plan that focuses on the achievement of equity through increased access to Minimum Health
Care Package (MHCP), Quality care, efficiency accountability and transparency. The overall goal of the sector
is to provide good quality services to the people of this district so as to make them attain good standards of
health in order to live a healthy and reproductive life. The sector objective is to reduce morbidity and
mortality from the major causes of ill health and premature health and disparities therein”. This district has 35
Health Units of different categories. Some of them are Government hospitals while others are owned by Non -
Government Organizations. The distribution is fair, but some of them lack the basic equipment to offer
reasonable services. Many rural units require rehabilitation and equipping. Besides diseases, poor nutrition has
contributed to worrying situation. Because of cross cutting nature of health issues, there is need for an
integrated approach to health.
There are various NGOs both Local and International that are involved in AIDS prevention and control in the
district. Such activities include blood screening and counselling, medical treatment, home care, pastoral
education, health education, AIDS research and orphan support.
4.1: Health Infrastructure
This section classifies the distribution of health facilities within the district.
Table 4.1: Health infrastructure (categories)
Table 4.1: Health infrastructure (categories)
Category Ownership
Government PNFP Total
Hospital 0 3 3
HC IV 2 0 2
HC III 11 3 14
HC II 16 7 23
Total 29 13 42
Source: DHO’s Office
Note: The Municipality Health facilities are inclusive
4.2: Accessibility to health Services
This section looks at the distance to access health facilities within a community by the household.
4.2.1 Health Services Accessibility indicators
Sn Health Indicator Number /Ratio
1. Average Population served by each health unit: 1:5,912

22
2. Percentage of population within 5km radius of health unit 97.5
3. Number of licensed private clinics on DHIS2: 03
4. Practicing Doctor: population ratio: 1:82,767
5. Nurse: Population ratio 1:3,267
6. Clinical Officer: Population ratio 1:16,553
7. OPD Utilization 1.3
8. Deliveries in health facility 9,535
9. Midwives: pregnant women (15-49) ratio 1:1,731
10. Number of mothers receiving complete antenatal services 7,532
4.3 Disease burden
This section details the frequency of disease, illness, injuries, and disabilities in a population within the district
Table 4.3: Disease burden top ten diseases
Position Disease Percentage (%)
1 No pneumonia-Cough or cold 29.3%
2 Gastro Intestinal Disorders 7.8%
3 Malaria (Confirmed) 6.5%
4 Intestinal worms 4.8%
5 Urinary Tract Infections 3.8%
6 Skin diseases 3.0%
7 Pelvic Inflammatory Disease (PID) 2.0%
8 Diarrhoea-Acute 1.7%
9 Other ENT Conditions 1.6%
10 Other Eye Conditions 1.6%
Total
Source: DHO’s Office
4.4 Health Manpower
This section categorises the staffing in the district within a health sector with intentions of determining the
manpower gaps within the health sector.
Table 4.4: Staffing in District Health Office
Cadre Approved Filled Not
Filled
% gap
1. District Health Officer 1 1 0 100
2. Assistant District Health Officer (Environment) 1 1 0 100
3. Assistant District Health Officer (Maternal Child Health/Nursing) 1 1 0 100
4. Principal Health Inspector 1 0 1 0
5. Senior Health Educator 1 0 1 0
6. Bio-statistician/Health Information Scientist 1 1 0 100
7. Cold Chain Technician 1 1 0 100
8. Stenographer Secretary 1 1 0 100

23
9. Stores Assistant 1 1 0 100
10. Office Attendant 1 1 0 100
11. Driver 1 1 0 100
Total 11 9 2 18.2%
Source: DHO’s Office
Table 4.6: Staffing in Government Health Unit HC IV (KYABUGIMBI IV)
Position Approved Filled Not filled % Staffing Gap
Senior Medical Officer 1 1
Medical Officer 1 1
Senior Nursing Officer 1 1
Public Health Nurse 1 0 1 100%
Clinical Officer 2 3
Ophthalmic Officer 1 0 1 100%
Health Inspector 2 1 1 50%
Dispenser 1 0 1 100%
Public Health Dental Officer 1 1
Laboratory Technician 1 2
Assistant Entomological Officer(Med) 1 1 0
Nursing Officer (Nursing) 1 0 1 100%
Nursing Officer (Midwifery) 1 1
Nursing Officer(Psychiatry) 1 1 Assistant Health Educator 1 1 Anaesthetic Officer 1 1
Theatre Assistant 2 1
Anaesthetic Assistant 2 1
Enrolled Psychiatric Nurse 1 1
Enrolled Nurse 6 6
Enrolled Midwife 5 5
Cold Chain Assistant 1 0 1 100%
Office Typist 1 1
Laboratory Assistant 1 1
Stores Assistant 1 1
Accounts Assistant 1 0 1 100%
Health Assistant 1 0 1 100%
Health Information Assistant 1 1
Nursing Assistant 0
Driver 1 1
Askari 3 2 1
33.3
Porters 3 3
Senior Clinical Officer 1 2
Total 49 40 9 18%
Table 4.7: Health Centre III – [Kabushaho, Kakanju, Kashambya, Kibazi, Kyamuhunga, Kyeizooba,
Nyabubare, Ruhumuro, Ryeishe] Position Approved/Facility Filled Not filled % Staffing Gap
Senior Clinical Officer 1 3 6 67%

24
Clinical Officer 1 6 3 33%
Nursing Officer (Nursing) 1 4 5 56%
Laboratory Technician 1 5 4 44%
Enrolled Midwife 3 20 7 26%
Enrolled Nurse 5 33 12 27%
Laboratory Assistant 1 8 1 11%
Health Assistant 1 8 1 11%
Health Information Assistant 1 7 2 22%
Nursing Assistant .. 1
Askari 2 9 9 50%
Porter 2 18 0 0
Nursing Officer (Midwifery) 0 3
Health Inspector (Town Council) 0 1
Public Health Dental Officer 1
Total 19 127 50 39.4%
Source: DHO’s Office
Table 4.8: Health Centre II - 13
Service Provider category Approved Filled Not Filled % Staffing Gap
Enrolled Nurse 2 28
Enrolled Midwife 2 4 22 85%
Health Assistant 1 13 100%
Nursing Assistants .. 8
Askari 2 13 13 50%
Porter 2 13 13 50%
Senior clinical officer 0
Health Inspector (Town Council) 0 1
Nursing officer 0 2
Total 9 69 52%
Source: DHO’s Office
Table 4.9: Latrine coverage for 3 financial years
Years
2017/2018
Financial Years 2018/2019
2019/2020
Percentage 94.8% 96% 98.4%
Source: DHO’s Office (LQAS Survey)
Table 4.10: Hand washing coverage after visiting the toilet
Years
2017/2018
Financial Years 2018/2019
2019/2020
Percentage 40% 39.1% 65%
Source: DHO’s Office (LQAS Survey)
4.7 Immunization coverage during 2018/19
Immunization coverage indicator Percent
Percentage coverage of BCG: 89.1
Percentage coverage of Polio3: 100

25
Percentage coverage of DPT3: 101
Percentage coverage of Measles: 94.4
Percentage coverage of TT Pregnant: 35.2
Percentage coverage of TT Non-pregnant: 7.9
Table 4.13: Percentage Coverage of Antigen for 3 financial years
Antigen 2017/2018 (%) 2018/2019 (%) 2019/2020 (%)
BCG 82.8% 94.7% 89.1%
Polio3 77.9% 82.7% 100%
DPT 3 91.1% 96.1% 101%
Measles 78.4% 88.7% 93%
Source: DHIS2
4.8 Drug Inspection
Drug Inspection is important during the provision of health services in order to;
Provide safe, good quality, efficacious medicines and medical supplies to the general public in both public
and private sectors.
Promote proper and rational use of drugs, records management among health workers through support
supervision, on job training and sensitisation on compliance with National Drug Policy and Authority Act
and National Standard Clinical Guidelines.
Table 4.14: Number of Licenced drug shops in the district
Type Number
Private Pharmacies 3
Drug Shops
Dental Clinics 1
Allied Clinics 17
Domiciliary 2
Source: DHO’s Office
During 2019/20, the following number of patients ware registered in the district;
Patients suffering from TB (New + Relapse) : 259
Patients suffering from Leprosy : 0
Patients suffering from Onchocerciasis : 0
4.10 Maternal and Child Health (MCH)
The section gives information relating to maternal and child health indicators for 2018/2019. The following are
highlighted:
Number of mothers receiving antenatal 1 : 10,499
Number of mothers receiving post-natal services (6 Days) : 3,674
Number of supervised deliveries by skilled personnel : 9,536
Number of mothers practicing family planning(1st visit) : 12,564

26
Still birth : 15.6/1,000 live births
Number of Mothers who died : 160/100,000 live
births
Total Fertility rate : 4.2
Teenage Pregnancy [%] : require survey
Contraceptive prevalence Rate (CPR) [ %] : require survey
Unmet need for Family Planning [%] : 3.2% (LQAS 2020)
4.11 AIDS control (Prevalence, Control and Treatment)
4.11.0 Introduction
According to the Health Sector Strategic Plan (HSSP III), HIV/AIDS is one of the communicable disease that
account for over half of the total burden of disease are leading cause of ill health and mortality in Uganda. The
overall objective for the communicable diseases cluster is to reduce the prevalence and incidence of
communicable diseases by at least 50 Percent as per the SDGs and NDP target.
4.11.1 HIV/AIDS Prevalence Rates
Financial Year 2017/18 2018/19 2019/20
HIV Prevalence Rate 3.1% 4.1% 3.9
Source: DHIS2
4.11.2 Number of HIV Counselling Centres
Table 4.15: Coverage of HIV/AIDS Counselling and Testing (HCT) services- 2018/19
Indicator Coverage
No and % of Health units up to HCII that have integrated HCT
Stock out days of HIV test kits
25 out of 45
0 days - HMIS
Source: DHO’s Office
4.11.3 HIV/AIDS Counselling and Testing (HCT) Sites
The distribution of HIV/AIDS counselling and testing sites is important in ascertaining the level of accessibility
of this health service within the district. Table 4.17 below indicates the distribution of HCT services by facility
by location.
Table 4.16: Distribution of HCT Services by facility by location
HSD SUB COUNTY Health unit name Owner Level
IGARA EAST BUMBAIRE KABUSHAHO GOV HC III
IGARA EAST IBAARE RYEISHE GOV HC III
IGARA EAST KYABUGIMBI SC KYABUGIMBI GOV HC IV
IGARA EAST KYEIZOOBA BUYANJA GOV HC II
IGARA EAST KYEIZOOBA KYEIZOOBA GOV HC III
IGARA EAST RUHUMURO RUHUMURO GOV HC III
IGARA WEST BITOOMA BITOOMA NGO HC III
IGARA WEST KAKANJU KAKANJU GOV HC III

27
HSD SUB COUNTY Health unit name Owner Level
IGARA WEST KAKANJU KAKANJU UMSC NGO HC II
IGARA WEST KYAMUHUNGA S/C KIBAZI GOV HC II
IGARA WEST KYAMUHUNGA TC ANKOLE TEA FACTORY NGO HC II
IGARA WEST KYAMUHUNGA TC COMBONI HOSP. KYAMUHUNGA NGO HOSP
IGARA WEST KYAMUHUNGA TC KYAMUHUNGA GOV HC III
IGARA WEST KYAMUHUNGA TC SWAZI GOV HC II
IGARA WEST NYABUBARE NYABUBARE GOV HC III
IGARA WEST NYABUBARE NYARUGOTE GOV HC II
Municipality CENTRAL DIVISION BUSHENYI GOV HC IV
Municipality CENTRAL DIVISION BUSHENYI MEDICAL CENTRE NGO HC III
Municipality CENTRAL DIVISION KYEIZOOBA FARMERS CLINIC PRV HC II
Municipality CENTRAL DIVISION RH UGANDA (FPAU) NGO HC II
Municipality CENTRAL DIVISION UGANDA PRISONS-NYAMUSHEKYERA GOV HC III
Municipality ISHAKA DIVISION ISHAKA ADVENTIST NGO HOSP
Municipality ISHAKA DIVISION KIU TEACHING HOSP NGO HOSP
Municipality KIZINDA KIGOMA TC NN HEALTH CLINIC PRV HC II
Municipality NYAKABIRIZI DIVISION KATUNGU MISSION NGO HC III
Source: DHO’s Office
4.11.4 Anti-Retroviral Therapy including treatment for children ART (Antiretroviral Therapy)
In this section, the agencies providing ART, their location, numbers of people (adults and children) accessing
the ART are covered as in the table 4.17 below.
Table 4.17: ART Services as of 2019/20
Agency Subcounty
Total Adults active
on ART
Total Children active on
ART (<15yrs) Total Overall Ownership
Bitooma HC III Bitooma 146 4 150 Private not for Profit
Kabushaho HC III Bumbaire 281 15 296 Government
Bushenyi HC IV Central Division 1,118 47 1,165 Government
Bushenyi Medical Center HC III Central Division 3,159 117 3,276 Private not for Profit
Bushenyi Uganda Prisons HC III Central Division 418 0 418 Government
Ryeishe HC III Ibaare 131 6 137 Government
Ishaka Adventist Hospital Ishaka Division 5,048 179 5,227 Private not for Profit
Kiu Teaching Hospital Ishaka Division 756 37 793 Private not for Profit
Kakanju HC III Kakanju 233 7 240 Government
Kyabugimbi HC IV Kyabugimbi TC 782 45 827 Government
Ankole Tea Factory HC II Kyamuhunga TC 201 1 202 Private not for Profit
Comboni Hospital Kyamuhunga TC 2,719 110 2,829 Private not for Profit
Kyamuhunga HC III Kyamuhunga TC 504 22 526 Government
Swazi HC II Kyamuhunga TC 2 0 2 Government
Kyeizooba HC III Kyeizooba 532 42 574 Government
Nyabubare HC III Nyabubare 257 20 277 Government
Nyarugote HC II Nyabubare 9 0 9 Government
Ruhumuro HC III Ruhumuro 75 1 76 Government

28
Source: DHIS2
4.12 Prevention of Mother to Child Transmission of HIV/AIDS in FY 2018/2019
4.12.1 HIV Counselling and Testing in FY 2019/2020
Expected number of pregnancies (5%) : 12,305
Number of new ANC clients at PMTCT sites : 10,499
Number of pregnant mothers tested for HIV : 9,541
Number of pregnant women tested HIV positive : 162
Number of partners tested for HIV : 2302
Number of partners tested HIV positive : 27
4.12.3 Labour and Delivery care
Number of HIV positive mothers : 922
Total number of deliveries : 9536
Number of HIV Positive deliveries : 644
Number of HIV Positive mothers newly initiated on ART : 167
Number of infants who received ARV prophylaxis : 365
Category Ownership
Government PNFP Total
Hospital 0 3 3
HC IV 2 0 2
HC III 11 3 14
HC II 16 7 23
Total 29 13 42
Source: DHO’s Office
Note: The Municipality Health facilities are inclusive
Table 4.2: Number of Health Units
Type Number
Private pharmacies 12
Drug shops 78
Allied clinics 21
Domiciliary 0
Uganda Medical & Dental Clinics 3
Traditional healers
Unlicensed clinics and drug shops 36

29
Source: DHO’s Office
4.2: Accessibility to health Services
This section looks at the distance to access health facilities within a community by the household.
4.2.1 Health Services Accessibility indicators
Sn Health Indicator Number /Ratio
11. Average Population served by each health unit: 1:5,912
12. Percentage of population within 5km radius of health unit 97.5
13. Number of licensed private clinics on DHIS2: 03
14. Practicing Doctor: population ratio: 1:82,767
15. Nurse: Population ratio 1:3,267
16. Clinical Officer: Population ratio 1:16,553
17. OPD Utilization 1.3
18. Deliveries in health facility 9,535
19. Midwives: pregnant women (15-49) ratio 1:1,731
20. Number of mothers receiving complete antenatal services 7,532
4.3 Disease burden
This section details the frequency of disease, illness, injuries, and disabilities in a population within the district
Table 4.3: Disease burden top ten diseases
Position Disease Percentage (%)
1 No pneumonia-Cough or cold 29.3%
2 Gastro Intestinal Disorders 7.8%
3 Malaria (Confirmed) 6.5%
4 Intestinal worms 4.8%
5 Urinary Tract Infections 3.8%
6 Skin diseases 3.0%
7 Pelvic Inflammatory Disease (PID) 2.0%
8 Diarrhoea-Acute 1.7%
9 Other ENT Conditions 1.6%
10 Other Eye Conditions 1.6%
Total
Source: DHO’s Office
4.4 Health Manpower
This section categorises the staffing in the district within a health sector with intentions of determining the
manpower gaps within the health sector.

30
Table 4.4: Staffing in District Health Office
Cadre Approved Filled Not
Filled
% gap
12. District Health Officer 1 1 0 100
13. Assistant District Health Officer (Environment) 1 1 0 100
14. Assistant District Health Officer (Maternal Child Health/Nursing) 1 1 0 100
15. Principal Health Inspector 1 0 1 0
16. Senior Health Educator 1 0 1 0
17. Bio-statistician/Health Information Scientist 1 1 0 100
18. Cold Chain Technician 1 1 0 100
19. Stenographer Secretary 1 1 0 100
20. Stores Assistant 1 1 0 100
21. Office Attendant 1 1 0 100
22. Driver 1 1 0 100
Total 11 9 2 18.2%
Source: DHO’s Office
Table 4.6: Staffing in Government Health Unit HC IV (KYABUGIMBI IV)
Position Approved Filled Not filled % Staffing Gap
Senior Medical Officer 1 1
Medical Officer 1 1
Senior Nursing Officer 1 1
Public Health Nurse 1 0 1 100%
Clinical Officer 2 3
Ophthalmic Officer 1 0 1 100%
Health Inspector 2 1 1 50%
Dispenser 1 0 1 100%
Public Health Dental Officer 1 1
Laboratory Technician 1 2
Assistant Entomological Officer(Med) 1 1 0
Nursing Officer (Nursing) 1 0 1 100%
Nursing Officer (Midwifery) 1 1
Nursing Officer(Psychiatry) 1 1 Assistant Health Educator 1 1 Anaesthetic Officer 1 1
Theatre Assistant 2 1
Anaesthetic Assistant 2 1
Enrolled Psychiatric Nurse 1 1
Enrolled Nurse 6 6
Enrolled Midwife 5 5
Cold Chain Assistant 1 0 1 100%
Office Typist 1 1
Laboratory Assistant 1 1
Stores Assistant 1 1
Accounts Assistant 1 0 1 100%

31
Position Approved Filled Not filled % Staffing Gap
Health Assistant 1 0 1 100%
Health Information Assistant 1 1
Nursing Assistant 0
Driver 1 1
Askari 3 2 1
33.3
Porters 3 3
Senior Clinical Officer 1 2
Total 49 40 9 18%
Table 4.7: Health Centre III – [Kabushaho, Kakanju, Kashambya, Kibazi, Kyamuhunga, Kyeizooba,
Nyabubare, Ruhumuro, Ryeishe] Position Approved/Facility Filled Not filled % Staffing Gap
Senior Clinical Officer 1 3 6 67%
Clinical Officer 1 6 3 33%
Nursing Officer (Nursing) 1 4 5 56%
Laboratory Technician 1 5 4 44%
Enrolled Midwife 3 20 7 26%
Enrolled Nurse 5 33 12 27%
Laboratory Assistant 1 8 1 11%
Health Assistant 1 8 1 11%
Health Information Assistant 1 7 2 22%
Nursing Assistant .. 1
Askari 2 9 9 50%
Porter 2 18 0 0
Nursing Officer (Midwifery) 0 3
Health Inspector (Town Council) 0 1
Public Health Dental Officer 1
Total 19 127 50 39.4%
Source: DHO’s Office
Table 4.8: Health Centre II - 13
Service Provider category Approved Filled Not Filled % Staffing Gap
Enrolled Nurse 2 28
Enrolled Midwife 2 4 22 85%
Health Assistant 1 13 100%
Nursing Assistants .. 8
Askari 2 13 13 50%
Porter 2 13 13 50%
Senior clinical officer 0
Health Inspector (Town Council) 0 1
Nursing officer 0 2
Total 9 69 52%
Source: DHO’s Office
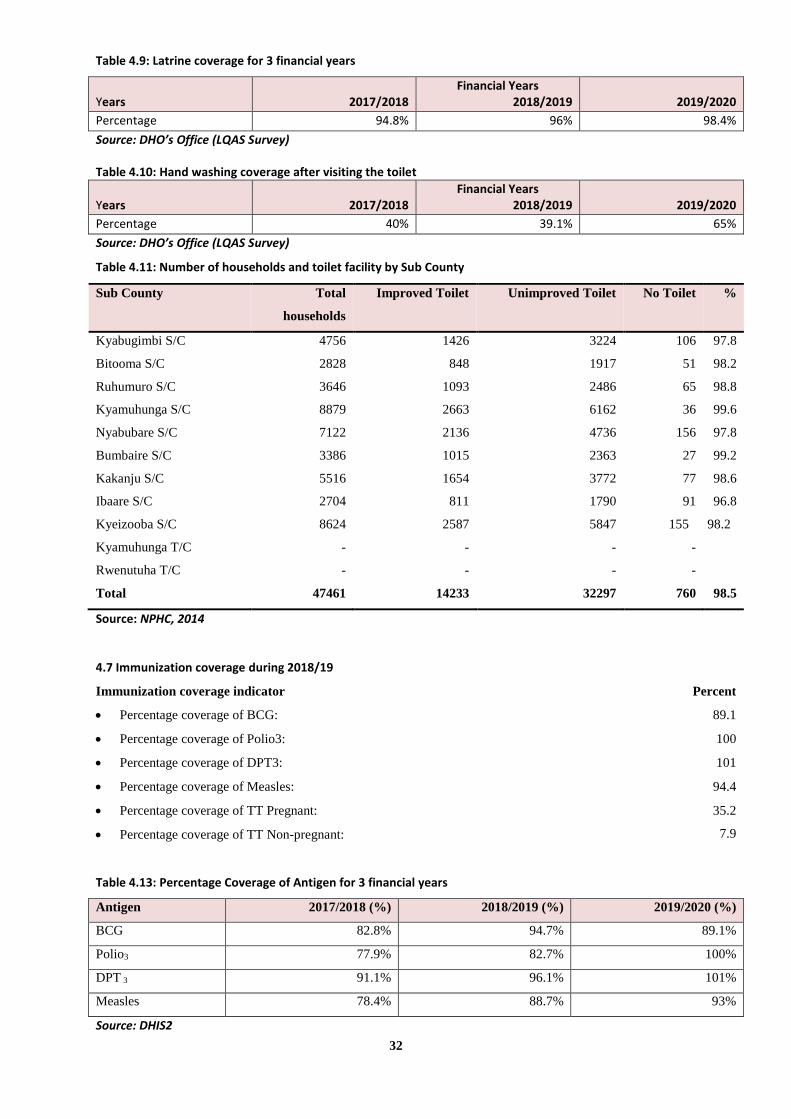
32
Table 4.9: Latrine coverage for 3 financial years
Years
2017/2018
Financial Years 2018/2019
2019/2020
Percentage 94.8% 96% 98.4%
Source: DHO’s Office (LQAS Survey)
Table 4.10: Hand washing coverage after visiting the toilet
Years
2017/2018
Financial Years 2018/2019
2019/2020
Percentage 40% 39.1% 65%
Source: DHO’s Office (LQAS Survey)
Table 4.11: Number of households and toilet facility by Sub County
Sub County Total
households
Improved Toilet Unimproved Toilet No Toilet %
Kyabugimbi S/C 4756 1426 3224 106 97.8
Bitooma S/C 2828 848 1917 51 98.2
Ruhumuro S/C 3646 1093 2486 65 98.8
Kyamuhunga S/C 8879 2663 6162 36 99.6
Nyabubare S/C 7122 2136 4736 156 97.8
Bumbaire S/C 3386 1015 2363 27 99.2
Kakanju S/C 5516 1654 3772 77 98.6
Ibaare S/C 2704 811 1790 91 96.8
Kyeizooba S/C 8624 2587 5847 155 98.2
Kyamuhunga T/C - - - -
Rwenutuha T/C - - - -
Total 47461 14233 32297 760 98.5
Source: NPHC, 2014
4.7 Immunization coverage during 2018/19
Immunization coverage indicator Percent
Percentage coverage of BCG: 89.1
Percentage coverage of Polio3: 100
Percentage coverage of DPT3: 101
Percentage coverage of Measles: 94.4
Percentage coverage of TT Pregnant: 35.2
Percentage coverage of TT Non-pregnant: 7.9
Table 4.13: Percentage Coverage of Antigen for 3 financial years
Antigen 2017/2018 (%) 2018/2019 (%) 2019/2020 (%)
BCG 82.8% 94.7% 89.1%
Polio3 77.9% 82.7% 100%
DPT 3 91.1% 96.1% 101%
Measles 78.4% 88.7% 93%
Source: DHIS2

33
4.8 Drug Inspection
Drug Inspection is important during the provision of health services in order to;
Provide safe, good quality, efficacious medicines and medical supplies to the general public in both public
and private sectors.
Promote proper and rational use of drugs, records management among health workers through support
supervision, on job training and sensitisation on compliance with National Drug Policy and Authority Act
and National Standard Clinical Guidelines.
Table 4.14: Number of Licenced drug shops in the district
Type Number
Private Pharmacies 12
Drug Shops 78
Uganda Medical & Dental Clinics 3
Allied Clinics 21
Domiciliary 0
Source: DHO’s Office
During 2019/20, the following number of patients ware registered in the district;
Patients suffering from TB (New + Relapse) : 259
Patients suffering from Leprosy : 0
Patients suffering from Onchocerciasis : 0
4.10 Maternal and Child Health (MCH)
The section gives information relating to maternal and child health indicators for 2018/2019. The following are
highlighted:
Number of mothers receiving antenatal 1 : 10,499
Number of mothers receiving post-natal services (6 Days) : 3,674
Number of supervised deliveries by skilled personnel : 9,536
Number of mothers practicing family planning(1st visit) : 12,564
Still birth : 15.6/1,000 live births
Number of Mothers who died : 160/100,000 live
births
Total Fertility rate : 4.2
Teenage Pregnancy [%] : require survey
Contraceptive prevalence Rate (CPR) [ %] : require survey
Unmet need for Family Planning [%] : 3.2% (LQAS 2020)
4.11 AIDS control (Prevalence, Control and Treatment)
4.11.0 Introduction
According to the Health Sector Strategic Plan (HSSP III), HIV/AIDS is one of the communicable disease that
account for over half of the total burden of disease are leading cause of ill health and mortality in Uganda. The

34
overall objective for the communicable diseases cluster is to reduce the prevalence and incidence of
communicable diseases by at least 50 Percent as per the SDGs and NDP target.
4.11.1 HIV/AIDS Prevalence Rates
Financial Year 2017/18 2018/19 2019/20
HIV Prevalence Rate 3.1% 4.1% 3.9
Source: DHIS2
4.11.2 Number of HIV Counselling Centres
Table 4.15: Coverage of HIV/AIDS Counselling and Testing (HCT) services- 2018/19
Indicator Coverage
No and % of Health units up to HCII that have integrated HCT
Stock out days of HIV test kits
25 out of 45
0 days - HMIS
Source: DHO’s Office
4.11.3 HIV/AIDS Counselling and Testing (HCT) Sites
The distribution of HIV/AIDS counselling and testing sites is important in ascertaining the level of accessibility
of this health service within the district. Table 4.17 below indicates the distribution of HCT services by facility
by location.
Table 4.16: Distribution of HCT Services by facility by location
SUB COUNTY Health unit name Owner Level
IGARA EAST BUMBAIRE KABUSHAHO GOV HC III
IGARA EAST IBAARE RYEISHE GOV HC III
IGARA EAST KYABUGIMBI SC KYABUGIMBI GOV HC IV
IGARA EAST KYEIZOOBA BUYANJA GOV HC II
IGARA EAST KYEIZOOBA KYEIZOOBA GOV HC III
IGARA EAST RUHUMURO RUHUMURO GOV HC III
IGARA WEST BITOOMA BITOOMA NGO HC III
IGARA WEST KAKANJU KAKANJU GOV HC III
IGARA WEST KAKANJU KAKANJU UMSC NGO HC II
IGARA WEST KYAMUHUNGA S/C KIBAZI GOV HC II
IGARA WEST KYAMUHUNGA TC ANKOLE TEA FACTORY NGO HC II
IGARA WEST KYAMUHUNGA TC COMBONI HOSP. KYAMUHUNGA NGO HOSP
IGARA WEST KYAMUHUNGA TC KYAMUHUNGA GOV HC III
IGARA WEST KYAMUHUNGA TC SWAZI GOV HC II
IGARA WEST NYABUBARE NYABUBARE GOV HC III
IGARA WEST NYABUBARE NYARUGOTE GOV HC II
Municipality CENTRAL DIVISION BUSHENYI GOV HC IV
Municipality CENTRAL DIVISION BUSHENYI MEDICAL CENTRE NGO HC III
Municipality CENTRAL DIVISION KYEIZOOBA FARMERS CLINIC PRV HC II

35
SUB COUNTY Health unit name Owner Level
Municipality CENTRAL DIVISION RH UGANDA (FPAU) NGO HC II
Municipality CENTRAL DIVISION UGANDA PRISONS-NYAMUSHEKYERA GOV HC III
Municipality ISHAKA DIVISION ISHAKA ADVENTIST NGO HOSP
Municipality ISHAKA DIVISION KIU TEACHING HOSP NGO HOSP
Municipality KIZINDA KIGOMA TC NN HEALTH CLINIC PRV HC II
Municipality NYAKABIRIZI DIVISION KATUNGU MISSION NGO HC III
Source: DHO’s Office
4.11.4 Anti-Retroviral Therapy including treatment for children ART (Antiretroviral Therapy)
In this section, the agencies providing ART, their location, numbers of people (adults and children) accessing
the ART are covered as in the table 4.17 below.
Table 4.17: ART Services as of 2019/20
In this section, the agencies providing ART, their location, numbers of people (adults and children) accessing
the ART are covered as in the table 4.17 below.
Agency Subcounty
Total Adults active
on ART
Total Children active on
ART (<15yrs) Total Overall Ownership
Bitooma HC III Bitooma 146 4 150 Private not for Profit
Kabushaho HC III Bumbaire 281 15 296 Government
Bushenyi HC IV Central Division 1,118 47 1,165 Government
Bushenyi Medical Center HC III Central Division 3,159 117 3,276 Private not for Profit
Bushenyi Uganda Prisons HC III Central Division 418 0 418 Government
Ryeishe HC III Ibaare 131 6 137 Government
Ishaka Adventist Hospital Ishaka Division 5,048 179 5,227 Private not for Profit
Kiu Teaching Hospital Ishaka Division 756 37 793 Private not for Profit
Kakanju HC III Kakanju 233 7 240 Government
Kyabugimbi HC IV Kyabugimbi TC 782 45 827 Government
Ankole Tea Factory HC II Kyamuhunga TC 201 1 202 Private not for Profit
Comboni Hospital Kyamuhunga TC 2,719 110 2,829 Private not for Profit
Kyamuhunga HC III Kyamuhunga TC 504 22 526 Government
Swazi HC II Kyamuhunga TC 2 0 2 Government
Kyeizooba HC III Kyeizooba 532 42 574 Government
Nyabubare HC III Nyabubare 257 20 277 Government
Nyarugote HC II Nyabubare 9 0 9 Government
Ruhumuro HC III Ruhumuro 75 1 76 Government
Source: DHIS2
4.12 Prevention of Mother to Child Transmission of HIV/AIDS in FY 2019/2020
4.12.1 HIV Counselling and Testing in FY 2019/2020
Expected number of pregnancies (5%) : 12,305
Number of new ANC clients at PMTCT sites : 10,499
Number of pregnant mothers tested for HIV : 9,541

36
Number of pregnant women tested HIV positive : 162
Number of partners tested for HIV : 2302
Number of partners tested HIV positive : 27
4.12.3 Labour and Delivery care
Number of HIV positive mothers : 922
Total number of deliveries : 9536
Number of HIV Positive deliveries : 644
Number of HIV Positive mothers newly initiated on ART : 167
Number of infants who received ARV prophylaxis : 365

37
CHAPTER 5: EDUCATION AND SPORTS
5.0 Introduction
The Department of Education is charged with overseeing the implementation of the district and National
education policies and plans. It also monitors and evaluates the performance of the education system and
school operations to keep required standards within the district. The areas of focus include teachers, pupils,
school facilities and parents.
The Department also seeks to strengthen the institutional frame work for the management of schools and
assurance of accountability of public resources in education programmes. The department is one of the best
funded sectors in the district. The District Council equally joins the Government to promote education for all
its citizens in partnership with parents and others members of the community. As such, the Government's
Education policy is to promote quality basic education by improving access by girls and boys, equity and
retention in all Primary schools and other levels of learning.
`5.1 Educational Institutions
Educational institution is any institution whose sole or main purpose is the provision of education and such
institution must be normally accredited or sanctioned by some public authority.
5.1.2: Number of school going age children
Table 5.2: School Going Age by gender
Age Group 2018 Projection for 2019
Male Female Total Male Female Total
Primary (6-12 Years) 20124 21,010 41,134 21,481 21,774 43,255
Secondary (13-18 Years) 3,679 3,362 7,041 3,790 4,785 8,575
Source: Education Department
Note: The data provided is only for government aided Primary and Secondary schools.
Table 5.3: Primary School by Ownership
Sub County GVT PR T G% P% TOTAL
Bitooma T/C 8 9 17 52% 47 100
Kyamuhunga S/C 12 7 19 63 37 100
Kyamuhunga T/C 6 4 10 60 40 100
Kakanju S/C 11 10 21 52 48 100
Nyabubare S/C 8 10 19 42 53 100
Kizinda T/C 7 4 11 64 36 100
Nkanga S/C 5 1 5 83 20 100
Ibaare S/C 8 6 14 57 43 100
Bumbaire S/C 10 6 16 63 38 100
Kyeizooba S/C 13 12 25 52 48 100
Rwentuha T/C 9 4 13 69 31 100
Kyabugimbi S/C 9 6 15 60 40 100
Kyabugimbi T/C 5 3 8 63 36 100
Ruhumuro S/C 12 4 16 75 25 100

38
123 86 209 59 41 100
Table 5.4: Name of Senior Secondary School by ownership by Sub-county by county
S/n Name of School Sub County Ownership Bushenyi
St. Francis S.S.S
Igara High
Rwakatende S.S.S
Bumbaire S.S
Kabushaho S.S
Numba Pride S S
Kitabi Seminary
Kainamo S.S
Crane High Sch Kashenyi
St.Cecilia Girls Voc S.S
St Charles Lwanga
Kakanju Voc Sec Sch
Katunga Voc S.S
Nyamishundo Voc S. S
Kakanju Voc Sec Sch
Bishop Ogez High Sch
Uphill College Kigoma
Kizinda Parents Voc. H.S
Paramount Sec Sch
St. Jude S. S
Bishop Ogez High Sch
Timbitwire Girls Sch
Kibona Voc S.S
Nyakabanga S.S
Kajunju Blessed S.S
Mujuni Foundation High Sch
Kyabugimbi Sec Sch
Kyabugimbi Sec Sch
Bushenyi Progressive H.S
J.J Nshumi
Kyamuhunga Sec Sch
Igara Sec School
St.Mary's Voc S.S Kyamuhunga
Kyamuhunga Sec Sch
Mwengura Sec Sch
Kyeizooba Girls.S
Mwengura Sec Sch
Light S S
Kana Sec Sch
Bushenyi Secondary
Nyabubare Sec .Sch
Nyabubare Sec .Sch
Comboni S.S Burungira
Ruhumuro S.S
St. Gonzaga School
Bitooma
Bumbaire
Bumbaire
Bumbaire
Bumbaire
Bumbaire
Ibaare
Ibaare
Ibaare
Ibaare
Ibaare
Kakanju
Kakanju
Kakanju
Kakanju
Kizinda T/C
Kizinda T/C
Kizinda T/C
Kizinda T/C
Kizinda T/C
Kizinda T/C
Kizinda Tc
Kyabugimbi
Kyabugimbi
Kyabugimbi
Kyabugimbi
Kyabugimbi T/C
Kyabugimbi T/C
Kyamuhunga
Kyamuhunga
Kyamuhunga T/C
Kyamuhunga T/C
Kyamuhunga T/C
Kyamuhunga T/C
Kyeizooba
Kyeizooba
Kyeizooba
Nyabubare
Nyabubare
Nyabubare
Nyabubare
Nyabubare
Ruhumuro
Ruhumuro
Rwentuha T/C
Government
Private
Private
Private
Private
Private
Private
Private
Private
Private
Private
Private
Private
Private
Government
Private
Private
Private
Private
Private
Government
Private
Private
Private
Private
Private
Private
Government
Private
Private
Private
Private
Private
Government
Private
Private
Government
Private
Private
Private
Private
Government
Government
Private
Private
Busheny
i
Busheny
i
Busheny
i
Busheny
i
Busheny
i
Busheny
i
Busheny
i
Busheny
i
Busheny
i
Busheny
i
Busheny
i
Busheny
i
Busheny
i
Busheny
i
Busheny
i
Busheny
i
Busheny
i
Busheny
i
Busheny
i
Busheny
i
Busheny
i
Busheny
i
Busheny
i
Busheny
i
Busheny
i
Busheny
i
Busheny
i
Busheny
i
Busheny
i

39
Vine H.S
Kabushaho Seed School
Rwentuha T/C
Bumbaire
Private
Government
Busheny
i
Busheny
i
Source: Education Department
5.1.5 Other Educational Institutions
A part from primary schools and secondary schools, the district has other educational institutions (for example
pre-primary, Teachers training colleges, Technical colleges and Vocational schools)
Table 5.5: Other Educational Institutions by ownership
Source: Education Department
Table 5.6 Other Education Institutions by Location
School Category Sn Name Sub County/ Town Council Ownership
Pre primary and
Primary schools
1 Libo Light School Ibaare Private
2 Crane Preparatory School Ibaare Private
3 Frandent Divine Ibaare Private
4 Jireh Junior Sch Ibaare Private
5 Ibaare Junior Sch Ibaare Private
6 God Is Good Junior Sch Ibaare Private
7 Desire Junior Bumbaire Private
8 Nyaruzinga Parents Bumbaire Private
9 Bright Stars Bumbaire Private
10 Gahweire Memorial Bumbaire Private
11 Kantunda Parents Bumbaire Private
12 Nsimbi Junior School Bumbaire Private
13 Blessed Bugarama Kyabugimbi T/C Private
14 Blessing Junior Sch Kyabugimbi Private
15 Christine Modern School Kyabugimbi Private
16 Little Angels Kyabugimbi Private
17 Kyabugimbi Mother Care Kyabugimbi T/C Private
19 Kitwe Junior Nursery School Kyabugimbi Private
20 Rugarama Junior Nursery School Kyabugimbi Private
Institution
Ownership
Government Private
Pre Primary NIL 86
Teacher Training Colleges NIL NIL
Technical Schools NIL 02
Technical college 02 NIL
Farm Institutes NIL NIL
Universities NIL NIL

40
School Category Sn Name Sub County/ Town Council Ownership
21 Yonahwine Junior Sch Kyabugimbi Private
22 St.Kizito Preparatory Sch (Ecd) Kyabugimbi T/C Private
23 Jesus Cares Kizinda T/C Private
24 Wisdom Junior School Kizinda T/C Private
25 Kigoma Progressive P/S Nyabubaare Private
26 Little Stars Kizinda T/C
Private
27 Nyabubare Boarding School Nyabubaare Private
28 Lugogo Academy Nyabubaare Private
29 Karama Preparatory Nyabubaare Private
30 Nyakahandagazi Nyabubaare Private
31 Bright Star Sch Nyabubaare Private
32 St. Josephs Junior Nyabubaare Private
33 Bda Junior Sch Kizinda T/C Private
34 Green Field Junior Nyabubaare Private
35 Kabatuula Memorial Nyabubaare Private
36 St. Jude Nursery Sch (Ecd) Nyabubaare Private
37 Sr. Bonita Nursery Sch (Ecd) Nyabubaare Private
38 Aunt Jane Model Sch Rwentuha T/C Private
39 Rwentuha Parents Rwentuha T/C Private
40 Good Daddy Kyeizooba Private
41 St. Peter's Kakamba Kyeizooba Private
42 King Of Kings Nursery Sch (Ecd) Kyeizooba Private
43 Yellow Stars Nursery Sch Kyeizooba Private
44 Green Valley P/S Kyeizooba Private
45 Gagla City Junior Sch (Ecd) Kyeizooba Private
46 Misingano Kindergaten (Ecd) Kyeizooba Private
47 His Glory Nursery Sch (Ecd) Kyeizooba Private
48 Likes Progressive Nurser Sch (Ecd) Kyeizooba Private
49 Streams Of Hope Pre-Sch (Ecd) Rwentuha T/C Private
50 St.James Nursery School (Ecd) Kyeizooba Private
51 Bright Angels Prep Sch (Ecd) Kyeizooba Private
52 Hossanah Nursery School (Ecd) Kyeizooba Private
53 Bushenyi Unique Preparatory Kyamuhunga T/C Private
54 St. James Preparatory Kyamuhunga T/C Private
55 Kibazi Preparatory School Kyamuhunga Private
56 J J Nshumi Community Kyamuhunga Private
57 Alpha Primary Sch Kyamabaare Kyamuhunga Private
58 St. John Baptist Ntungamo Kyamuhunga Private
59 Rubuzagye Church School Kyamuhunga Private
60 Nshumi Nursery Sch Kyamuhunga Private
61 Butare Integrated P/S Kyamuhunga Private
62 Mashonga Madrasat P/S Kyamuhunga T/C Private

41
School Category Sn Name Sub County/ Town Council Ownership
63 Butare Town School (Ecd) Kyamuhunga T/C Private
64 Mbyemeire Memorial Junior Kakanju Private
65 Kijumo Model Kakanju Private
66 Akashanda Modern Kakanju Private
67 Ndaragi Preparatory Kakanju Private
68 St. Augustine Preparatory Kakanju Private
69 Little Angels Junior Kakanju Private
70 Freedom P/S Kakanju Private
71 Good Hope Nursery Kakanju Private
72 Rwamugasha Kakanju Private
73 Trusted Care Junior School Kakanju Private
74 Burungira Modern Ruhumuro Private
75 Nyeibingo Parents School Ruhumuro Private
76 Nyakatooma Junior School Ruhumuro Private
77 Rwandaro Church School Ruhumuro Private
78 Corn Hill N&P Bitooma T/C Private
79 St. Cleria N&P Bitooma T/C Private
80 Ngorora Public School Bitooma Private
81 St. Joseph's Rwanziro Bitooma Private
82 Kashambya P/S Bitooma Private
83 Muhame Church School Bitooma Private
84 Kashororo Model Bitooma T/C Private
85 Yehunde Preparatory N&P Bitooma Private
86 Rwanziro Church Bitooma Private
Source: Education Department
5.2 Infrastructure
Table 5.7: Available infrastructure in schools
Indicator Name Number
Number of permanent classrooms 470
Number of temporary classrooms 663
Total 1,133
Number of desks 13,086
Number of staff houses 270
Source: Education Department
Note: The above information about infrastructure is only for primary schools.

42
5.4 Enrolment and enrolment ratios – primary and Secondary
Table 5.8: No. of Teachers and Pupils by Gender in Government Aided Primary Schools (2018)
PPLS TRS
M F T M F T
1 Bitooma T/C 1649 1673 3322 37 26 65
2 Kyamuhunga S/C 1752 1718 3470 37 46 83
3 Kyamuhunga T/C 1777 1763 3540 40 25 65
4 Kakanju S/C 2008 2275 4283 33 49 82
5 Nyabubare S/C 1978 2008 3986 32 28 84
6 Kizinda S/C 1247 1275 2522 24 32 58
7 Nkanga S/C 958 998 1956 14 28 52
8 Kyeizooba 1824 1800 3624 55 40 95
9 Rwentuha T/C 1126 1138 2264 41 30 71
10 Kyabugimbi S/C 1288 1286 2574 32 40 72
11 Ibaare S/C 1269 1284 2553 23 45 68
12 Ruhumuro S/C 1971 2044 4015 45 28 73
13 Kyabugimbi T/C 1160 1130 2290 30 27 53
14 Bumbaire T/C 1474 1382 2856 42 35 77
TOTAL 21481 21774 43255 485 479 998
Source: Education Department
Table 5.10: Number of Government Secondary School Teachers and students by School
Name of school Number of
students
Number of Teachers Average Student to teacher Ratio
Comboni S .S Burungira 371 20 19:1
Kyamuhunga S. S 1078 26 42:1
Nyabubare S .S 749 30 25:1
Bishop Ogez H S 1140 41 31:1
Kakanju Voc S .S 319 18 28:1
Mwengura S .S 387 23 19:1
Kyabugimbi S .S 457 20 23:1
St. Francis Voc S S Bitooma 532 21 25:1
Total 5033 199 25.2
Source: Education Department
5.5 Efficiency Ratios (Primary)
Pupil: Latrine stance ratio : 40:1
Pupil: Desk ratio : 4:1 Twin seater
Pupil: Textbook ratio : 6:1
Pupil to classroom ratio : 40:1
Teacher to Pupil ratio : 55:1
Teachers’ staff houses : 270

43
Service Delivery Indicators
Details Standard District achieved level
Number of Class rooms Classroom : Pupil Ratio 1:38
No of Text Books Text book : Pupil Ratio 1:3
Number of Teachers Teacher : Pupil Ratio 1:55
Stance latrines Pupil : latrine Ratio 35:1
Number of desks Desk : Pupil Ratio
4:1
Inspections Inspections per term 1
Education accessibility indicators, 2018/19-primary schools
Source: Secondary schools Source:
5.7 Performance in National Examinations by year in percentages
Table 5.11: Trends in P.L.E Result Analysis by year and percentage from 2010 - 2017
Source: DEO’s office
Table 5.12: PLE Performance by gender and division - 2019
Grade/Division Boys Girls Total
Number Percentage Number Percentage Number Percentage Division I 394 54.6 327 45.3 721 15.4 Division II 1271 44.7 1572 55.2 2843 60.6 Division III 228 37.5 379 62.4 607 12.9 Division IV 122 39.2 189 60.7 311 6.6 Ungraded 54 47.3 60 52.6 114 2.5 X 44 46.8 50 53.1 94 2.0 Total 2113 2577 4690 100
Source: DEO’s office
District NER GER
Male Female Total Male Female Total
Bushenyi 71.1 79.2 75.1 103.0 114.0 108.5
District NER GER
Male Female Total Male Female Total
Bushenyi 31.6 36.5 34.3 49.0 49.2 49.1
YEA
R
GRADE 1 GRADE 2 GRADE 3 GRADE 4 UNGRADED X TOTAL
Nu
mb
er
%
Nu
mb
er
%
Nu
mb
er
%
Nu
mb
er
%
Nu
mb
er
%
(Ab
sen
tee
s)
%
2013 568 14.0 2193 54.3 794 19.6 238 5.8 117 2.8 128 3.1 4,038
2014 773 18.7 2164 52.6 670 16.2 248 6.0 144 3.5 115 2.7 4114
2015 474 10.7 2403 54.7 841 19.1 357 8.1 216 4.9 100 2.2 4391
2016 750 17.5 2314 54.0 644 15.0 333 7.7 158 3.6 82 1.9 4281
2017 617 13.6 2617 57.9 710 15.7 348 7.7 122 2.6 105 2.3 4,519
2018 970 21.2 2388 52.3 660 14.4 342 7.4 149 3.2 59 1.2 4,563
2019 721 15.3 2843 60.6 607 12.9 311 6.6 114 2.4 94 2.0 4,690

44
5.8 Inspectorate
Indicators under Inspectorate
Inspector: Primary School ratio : 2:69
Number of Primary Schools Inspected in 2017/18 financial year : 137
Number of school inspectors : 02
CHAPTER 6: WORKS AND TECHNICAL SERVICES
6.0 Introduction
The Works Sector comprises of two Departments (Roads and Technical Services and that of
Rural Water and Sanitation). The sector further has to ensure proper quality in design,
construction, inspection and maintenance of all Local Administration building structures. The
national roads are developed and maintained by the Ministry of Works and Transport. The
District Local Government maintains District Roads while Community access roads are the
responsibility of the Lower Local Governments. This section presents selected statistics on
work services delivery.
6.1 Roads
The District has a total of approximately 58.2 Km of trunk roads(Tarmac) and 15km of Trunk
Roads(Murram), 392.3 km of District Feeder Roads,84.6km of Urban Roads (2-Town
Councils) and 406.73 km of Community Access Roads. The District is in charge of
maintaining the condition of District Feeder Roads whereas Sub-Counties maintain
Community Access Roads.
6.1.1 Roads by grade, Length and condition
There are several categories of road networks including Trunk roads managed by the Central
Government, Feeder roads managed by the District and Town councils, and community roads
are maintained by community members.

45
Table 6.1: Roads by Type, length and condition as of June 2020
Sub-county Road code Road
length(kms)
Road
type
Road Name Road
Class
Community Access Roads Bitooma 402S010002 4.04 Earth Nyamishundo Ps – Kashasha TC –
Ngorora 3
Bitooma 402S010012 1.72 Earth Rushobe P/S – Mirambi Village 3
Bitooma 402S010015A 1.22 Earth Banushungire – Akayenje - Kemitaaha
3
Bitooma 402S010015B 0.60 Earth Banushungire – Akayenje - Kemitaaha
3
Bitooma 402S010021 2.48 Earth Kakanju – Kemitaaha 3
Bitooma 402S010023 1.46 Earth Kyanyamugira – Akashojwa TC 3
Bitooma 402S010027 1.41 Earth Ahakapyaka – Kimuri Tea collection Centre
3
Bumbaire 402S020002 1.55 Earth Bushanje – Kitakuuka – Kabushaho 3
Bumbaire 402S020004 4.25 Earth Kantunda – Kateramo – Nyamizi 3
Bumbaire 402S020006 1.26 Earth Kirama – Rwenyonyi – Rwentaka 3
Bumbaire 402S020008 1.70 Earth Kateramo – Nyamiko(Kigurusi) 3
Bumbaire 402S020009 1.12 Earth Kirundo – Kigurusi 3
Bumbaire 402S020010 0.30 Earth Nyamiko – Kiyaga PS 3
Bumbaire 402S020011 4.88 Earth Nyamizi – Kirama – Numba 3
Bumbaire 402S020012 2.29 Earth Katonya TC – Nyabiziri – Nyaruzinga 3
Bumbaire 402S020013 4.19 Earth Nyamirima – Keitambogo – Rutooma 3
Bumbaire 402S020014 2.12 Earth Bumbaire – Kihunda – Nyamirima 3
Bumbaire 402S020015 0.63 Earth Nyamirima – Bumbaire 3
Bumbaire 402S020016A 0.49 Earth Bumbaire PS – Ikarabiro 3
Bumbaire 402S020016B 0.53 Earth Bumbaire PS – Ikarabiro 3
Bumbaire 402S020017 2.06 Earth Rwekyekye – Kamityaza 3
Bumbaire 402S020019A 2.99 Earth Bweranyangi – Katokye – Kamira Bridge
3
Bumbaire 402S020019B 1.23 Earth Bweranyangi – Katokye – Kamira Bridge
3
Bumbaire 402S020020 0.99 Earth Kibare – Irashaniro 3
Bumbaire 402S020021 1.57 Earth Nyabubare – Nyandozo 3
Bumbaire 402S020022 1.02 Earth Bushanje – Kentoma bridge 3
Bumbaire 402S020024 0.63 Earth Nyakabungo - Kigoma 3
Kyabugimbi 402S030001 1.73 Earth Rwembirizi – Nyamitanga 3
Kyabugimbi 402S030002 2.21 Earth Rwembirizi – Rutooma ‘B’ 3
Kyabugimbi 402S030003 1.02 Earth Rwembirizi – Kafunda – Rutooma ‘A’ 3
Kyabugimbi 402S030005 1.23 Earth Kyakayanga – Kayembe 3
Kyabugimbi 402S030006 1.33 Earth Kitwe Central – Miringyenzo 3
Kyabugimbi 402S030007 0.85 Earth Omukashanyo – Ruborogota 3
Kyabugimbi 402S030008 1.66 Earth Katunguru – Nyantagwa 3
Kyabugimbi 402S030009 2.50 Earth Kitwe – Kajunju HQ 3
Kyabugimbi 402S030010 2.22 Earth Kajunju Central – Kitwe ‘B’ 3
Kyabugimbi 402S030011 2.48 Earth Buhimba ‘B’ – Mukora PS 3
Kyabugimbi 402S030012 2.77 Earth Mukora – Kyamiko 3
Kyabugimbi 402S030014 0.92 Earth Rugarama - Kyamiko 3
Kyabugimbi 402S030015 1.41 Earth Mukora TC – Kigimbi 3

46
Sub-county Road code Road length(km
s)
Road type
Road Name Road Class
Kyabugimbi 402S030016 2.65 Earth Kyamutiganzi ‘A’ – Bukorijo 3
Kyabugimbi 402S030017A 1.34 Earth Katikamwe ‘B’ - Kareera 3
Kyabugimbi 402S030017B 1.17 Earth Katikamwe ‘B’ - Kareera 3
Kyabugimbi 402S030018 1.97 Earth Katikamwe ‘B’ – Rubingo 3
Kyabugimbi 402S030019 1.53 Earth Kihumuro TC – Nyamabare ‘D’ 3
Kyabugimbi 402S030020 1.40 Earth Kihumuro – Nyakawawa 3
Kyabugimbi 402S030021 1.39 Earth Nyamabare – Bijengye ‘A’ 3
Kyabugimbi 402S030022 2.74 Earth Bijengye ‘A’ – Bujaga – Kambamba 3
Kyabugimbi 402S030023 3.25 Earth Bahesi - Kyeigombe 3
Kyabugimbi 402S030024 1.49 Earth Kibona COU – Kankwerere – Nyakiborera
3
Kyabugimbi 402S030025 1.38 Earth Kibona TC – Kibona PS 3
Kyabugimbi 402S030026 2.43 Earth Bujaga – Nyakabanga – Kihire 3
Kyabugimbi 402S030027 0.90 Earth Kihire – Nyakabanga 3
Kyabugimbi 402S030028 1.14 Earth Kihire play ground – Nyakabanga ‘A’ 3
Kyabugimbi 402S030029 2.13 Earth Nyamabare ‘A’ – Kabura – Omurugari
3
Kyabugimbi 402S030030 1.67 Earth Buhimba TC – Nyanga 3
Kyabugimbi 402S030031 1.29 Earth Kyabugimbi Central Sch – Bubare 3
Kyabugimbi 402S030032 0.48 Earth Kyabugimbi TC - Kachenche 3
Kyabugimbi 402S030033 0.63 Earth Kyabugimbi TC – Kyabugimbi play ground
3
Ruhumuro 402S040004 1.90 Earth Karama – Kasa ‘1’ 3
Ruhumuro 402S040006 2.54 Earth Kyarukaari – Rwemihoko – Nyakateete – Orubingo ‘A’
3
Ruhumuro 402S040010 1.25 Earth Nyeibingo Central – Nyeibingo PS 3
Ruhumuro 402S040013 1.86 Earth Kasingyesa – Rwandaro PS – Kayanga ‘A’
3
Ruhumuro 402S040015 1.92 Earth Nyeibingo ‘A’ – Ekikorijo 3
Ruhumuro 402S040016 3.63 Earth Karama – Ihanda 3
Ruhumuro 402S040018 2.53 Earth Comboni SSS – Kasa ‘1’ – Burungira HC2
3
Ruhumuro 402S040019 1.34 Earth Kasa ‘2’ – Mugoma – Nyakateete ‘B’ 3
Ruhumuro 402S040020 2.92 Earth Nyakateete ‘B’ – Nyakateete ‘A’ – Karama
3
Ruhumuro 402S040022 2.01 Earth Kemitaaha – Rwekitooma 3
Ruhumuro 402S040023A 1.87 Earth Ihanda – Rukoyooyo – Nyamyerande ‘2’ - Rwengoma
3
Ruhumuro 402S040023B 1.86 Earth Ihanda – Rukoyooyo – Nyamyerande ‘2’ - Rwengoma
3
Ruhumuro 402S040024 1.84 Earth Nyamyerande ‘3’ – Nyamyerande ‘1’ – Bugaara parish HQ
3
Kakanju 402S050001 4.83 Earth Akayenje – Kemitaha – Orutindo Rwomujungu
3
Kakanju 402S050002 2.89 Earth Nombe – Kitojo parish HQ – Magambo – Akakorogoto TC
3
Kakanju 402S050003A 0.72 Earth Ndaragi - Rwengoma 3
Kakanju 402S050003B 2.45 Earth Ndaragi - Rwengoma 3
Kakanju 402S050004 2.63 Earth Rushinya – Nyarwanya – Kakanju 3

47
Sub-county Road code Road length(km
s)
Road type
Road Name Road Class
Kakanju 402S050005 2.04 Earth Karambi – Warugo 3
Kakanju 402S050006 1.62 Earth Kibingo – Kyentobo 3
Kakanju 402S050007 1.88 Earth Obwogo – Katimba – Bunanura 3
Kakanju 402S050008 1.84 Earth Bunanura - Ryamabengwa 3
Kakanju 402S050009 1.57 Earth Tenga – Rwakawa – Bwegyeme ‘A’ 3
Kakanju 402S050010 1.73 Earth Kigondo – Kagati – Bitsigaire 3
Kakanju 402S050011 1.15 Earth Nombe – Kigondo 3
Kakanju 402S050012 0.78 Earth Lake Katunga – Akasusano - Kigondo 3
Kakanju 402S050013 1.16 Earth Kananga – Nyakabingo TC 3
Kakanju 402S050014 0.65 Earth Kyobuyorwa – Kaburo 3
Kakanju 402S050015 1.79 Earth Hajji Bwekwaso – Bugarama –Kamushana
3
Kakanju 402S050016A 1.16 Earth Obwogo – Bugarama TC 3
Kakanju 402S050016B 0.56 Earth Obwogo – Bugarama TC 3
Kakanju 402S050018 2.92 Earth Kyentobo – Nyabitekyere –Irembezi 3
Kakanju 402S050019 2.21 Earth Akasusano TC – Katerera – Kasyayo 3
Kakanju 402S050020 1.28 Earth Mingane – Kiyagara PS 3
Kakanju 402S050021 1.85 Earth Tenga – Nyarutuntu – Akashanda 3
Kakanju 402S050022 2.13 Earth Bunanura TC – Bunanura PS – Ryamizingo TC
3
Kakanju 402S050023 0.52 Earth Omukarere TC – Obwogo 3
Kakanju 402S050024 1.19 Earth Akasusano TC – Kabaare PS – Nyakatoma
3
Kakanju 402S050025 1.83 Earth St. Augustine PS – Kagundu – Katerera TC
3
Kakanju 402S050026 1.40 Earth Kakanju SubCtyHQ – Kibingo TC 3
Kakanju 402S050027A 0.46 Earth Ndaragi – Kyentobo – Bizibibi bridge 3
Kakanju 402S050027B 2.06 Earth Ndaragi – Kyentobo – Bizibibi bridge 3
Kakanju 402S050028 1.71 Earth Kweronda – Kyamaya –Rwemishwa TC
3
Kakanju 402S050029 3.67 Earth Ahakigombe – Omukayembe – Keijengye bridge
3
Kakanju 402S050036 1.74 Earth Nyakabingo TC – Kicwangisa river – Kyamamari - Bitooma
3
Kakanju 402S050037 0.88 Earth Kemitaha PS – Orutindo Rwomujungu RD
3
Kakanju 402S050038 1.27 Earth AkakorogotoTC-Akayenje-Kemitaaha 3
Kakanju 402S050039 1.44 Earth Kigondo – Nyamishundo PS 3
Kyeizooba 402S070001 0.56 Earth Kyeizooba SubCTYHQ – Kyeizooba PS 3
Kyeizooba 402S070002 0.98 Earth Nyamiyaga - Kabakobokye 3
Kyeizooba 402S070003 1.69 Earth Nyakashozi – Kitwe 3
Kyeizooba 402S070006 1.40 Earth Mbatamo – Katooma 3
Kyeizooba 402S070007 1.24 Earth Kantojo – Katooma Cell 3
Kyeizooba 402S070015 1.10 Earth Kasheshe – Pentecostal Church 3
Kyeizooba 402S070019 0.85 Earth Kibaniga ‘2’ - Kibaniga ‘1’ 3
Kyeizooba 402S070020 2.42 Earth Kabuba COU – Kafunjo – Rwenyena TC
3
Kyeizooba 402S070023 1.80 Earth Kitagata – Mwengura – Rwenyena 3
Kyeizooba 402S070024A 2.00 Earth Kitagata – Rwakanyonyi – Kakamba 3

48
Sub-county Road code Road length(km
s)
Road type
Road Name Road Class
Kyeizooba 402S070024B 0.71 Earth Kitagata – Rwakanyonyi – Kakamba 3
Kyeizooba 402S070026 5.32 Earth Kakamba – Kibingo – Kamira bridge 3
Kyeizooba 402S070027 1.89 Earth Kailo – Buyanja Mosque 3
Kyeizooba 402S070028 1.74 Earth Katerero coffee store – Buyanja parish
3
Kyeizooba 402S070029 1.19 Earth Muraro – Katerero TC 3
Kyeizooba 402S070033 1.18 Earth Nkoni ‘1’ – Kanyamuhita 3
Kyeizooba 402S070042A 1.58 Earth Nyakizinga – MainSwamp 3
Kyeizooba 402S070042B 0.44 Earth Nyakizinga – MainSwamp 3
Kyeizooba 402S070043 1.18 Earth Katokye – Councillor RD 3
Kyeizooba 402S070046 1.41 Gravel/Murram
Ntungamo – Rwamukoto 3
Kyeizooba 402S070049 1.71 Earth Rwenyena TC – Mwengura - Ikombesa
3
Kyeizooba 402S070050 1.64 Earth Nkoni ‘2’ – Kararo – Mpambiro 3
Kyeizooba 402S070052 1.52 Gravel/Murram
Nshenga –Kyabugimbi border 3
Kyeizooba 402S070054 0.56 Earth Rwenyana TC – Kitagata RD 3
Kyeizooba 402S070055 0.41 Earth Kafunjo – Sheema Border 3
Kyeizooba 402S070058A 0.63 Earth Rukukuru – Nyamitooma PS 3
Kyeizooba 402S070058B 0.22 Earth Rukukuru – Nyamitooma PS 3
Kyeizooba 402S070060 1.16 Earth Nkoni – Sheema District 3
Kyeizooba 402S070066 1.47 Earth Rwengyeya – Sheema Border 3
Nyabubare 402S080001 1.73 Earth Kizinda TC – Masya - Rushoroza 3
Nyabubare 402S080002 1.34 Earth KizindaParishHQ – Rwakaringura 3
Nyabubare 402S080003 0.77 Earth KizindaParishHQ – Kakoma 3
Nyabubare 402S080004 1.07 Earth Nyakinengo Rd 3
Nyabubare 402S080005A 1.42 Earth Omububare – Nyakinengo - Kibingo 3
Nyabubare 402S080005B 1.17 Earth Omububare – Nyakinengo - Kibingo 3
Nyabubare 402S080007 1.32 Earth Kanyantama – Bukumbya 3
Nyabubare 402S080008 0.96 Earth Omutubiri – Ntaza 3
Nyabubare 402S080009 1.78 Earth Ntaza – Nyamitozo – Nyamirembe 3
Nyabubare 402S080010 2.96 Earth Nyamirembe – Kanyegyero 3
Nyabubare 402S080011 2.05 Earth Kanyegyero – Nyakatete 3
Nyabubare 402S080012A 2.54 Earth Kanyegyero – Oruku - Nyamitozo 3
Nyabubare 402S080012B 1.41 Earth Kanyegyero – Oruku - Nyamitozo 3
Nyabubare 402S080013 0.61 Earth Ntaza – Omukataba 3
Nyabubare 402S080014 1.21 Earth Nkanga Parish HQ 3
Nyabubare 402S080015 0.58 Earth NkangaParishHQ – Bwera 3
Nyabubare 402S080016 8.67 Earth Akajani – Nyakibingo – Karama 3
Nyabubare 402S080017 1.09 Earth Kabande – Rwihwa 3
Nyabubare 402S080018A 2.74 Earth Rutundu(Bubare) – Kahungye - Rwihwa
3
Nyabubare 402S080018B 1.43 Earth Rutundu(Bubare) – Kahungye - Rwihwa
3
Nyabubare 402S080019 1.90 Earth Rwebitoregye – Oruhita – Rwiha 3
Nyabubare 402S080020 3.16 Earth Kahungye TC - Kitojo 3

49
Sub-county Road code Road length(km
s)
Road type
Road Name Road Class
Nyabubare 402S080021 1.10 Earth Kahungye – Rutundu 3
Nyabubare 402S080022 1.12 Earth Kitojo - Nyakanoni 3
Nyabubare 402S080023 1.00 Earth Kitojo – Entebbe 3
Nyabubare 402S080024 3.14 Earth Nyakatuntu – Bukuba 3
Nyabubare 402S080025 0.90 Earth Bukuba – Rwihwa 3
Nyabubare 402S080026 2.72 Earth Kanyinya – Nyabubare HCIII – Kabundizi
3
Nyabubare 402S080027 3.07 Earth Nyarugote – Biryarugari 3
Nyabubare 402S080028A 0.25 Earth NyarugoteParishHQ – Kahija - Rwekitooma
3
Nyabubare 402S080028B 0.97 Earth NyarugoteParishHQ – Kahija - Rwekitooma
3
Nyabubare 402S080028C 1.74 Earth NyarugoteParishHQ – Kahija - Rwekitooma
3
Nyabubare 402S080029 1.00 Earth Rwekitooma – Mwebesa 3
Nyabubare 402S080030A 0.45 Earth Rwekitooma – Matigi TC 3
Nyabubare 402S080030B 1.42 Earth Rwekitooma – Matigi TC 3
Nyabubare 402S080031 1.69 Earth Omupoloti – Kabatura 3
Nyabubare 402S080032 0.56 Earth Omupoloti – Orubingo 3
Nyabubare 402S080033 4.46 Earth Kakombe Tea Estate – Nyakahandagazi
3
Nyabubare 402S080034 2.99 Earth Kashozi – Kyabitara 3
Nyabubare 402S080035 3.09 Earth Karama – Nyabubare SS 3
Nyabubare 402S080036 2.15 Earth Kayojo Mosque – Kankinga 3
Nyabubare 402S080037 0.92 Earth Kankinga – Kashozi 3
Nyabubare 402S080038 2.40 Earth Kashozi – Kankinga - Omukasusano 3
Nyabubare 402S080039A 4.07 Earth NyabubareSCHQ - Aharina 3
Nyabubare 402S080039B 0.49 Earth NyabubareSCHQ - Aharina 3
Nyabubare 402S080040 4.26 Earth Kibingo – Katoma – Kashozi 3
Nyabubare 402S080041 2.08 Earth Nyamiko – Kirera 3
Nyabubare 402S080042 1.74 Earth Ryabugahi – Mpama 3
Nyabubare 402S080043 1.51 Earth KigomaParishHQ - Ryabugahi 3
Nyabubare 402S080044 1.04 Earth Kigoma TC – Nshumi Border 3
Nyabubare 402S080046 1.87 Earth Kakoma – Murisi 3
Nyabubare 402S080047 4.69 Earth Omububare – Nyabitote 3
Nyabubare 402S080048 1.26 Earth Omukatojo – Nyakashojwa 3
Nyabubare 402S080049 4.28 Earth Nyabubare TC – Birimbi 3
Nyabubare 402S080050 1.23 Earth Matimba – Kankinga 3
Nyabubare 402S080051 2.64 Earth Katakondwa – Kyandago – Akatensani – MainRD
3
Nyabubare 402S080053 0.26 Earth Kyandago – Akatensani – Kashenyi – kanyantama
3
Nyabubare 402S080054 0.52 Earth Katakondwa - kanyantama 3
Ibaare 402S090002 0.77 Earth Karubunga ‘B’ – Nyabibari 3
Ibaare 402S090005 0.92 Earth Mutukura – Njeru 3
Ibaare 402S090015 2.95 Earth Bwoma – Migina 3
Ibaare 402S090018 1.54 Earth Katoma – Nyakahita 3
Ibaare 402S090021 0.84 Earth Kitabi – KwataEkintu 001 3
Ibaare 402S090023 0.74 Earth Isunga – Njeru – Ibaare – Nyamahwa 3

50
Sub-county Road code Road length(km
s)
Road type
Road Name Road Class
bridge RD
Ibaare 402S090026 0.93 Earth Katagu – Kagari Farm 3
Ibaare 402S090027 2.5 Earth Keinamo Parish – Ibaare TC – Nyamahwa bridge RD
3
Kyamuhunga 402S060001 2.26 Earth Rwenjojo – Ryamarembo 3
Kyamuhunga 402S060003 1.20 Earth Kabingo – Karama 3
Kyamuhunga 402S060005A 1.89 Earth Kyabajojo - Tekateka 3
Kyamuhunga 402S060005B 3.98 Earth Kyabajojo - Tekateka 3
Kyamuhunga 402S060006 5.88 Earth Kigoma TC – Nyakahanga 3
Kyamuhunga 402S060007 1.08 Earth Kibingo – Nyamiko 3
Kyamuhunga 402S060009 2.79 Earth Kisingo – Ryanyamihondo 3
Kyamuhunga 402S060012 0.99 Earth Bugongo – Kanyabiko 3
Kyamuhunga 402S060014 0.98 Earth Katima - Ryanyamihondo 3
Kyamuhunga 402S060015 6.48 Earth Swazi – Mashonga 3
Kyamuhunga 402S060018 1.90 Earth Busyoro – Nyamashobe 3
Kyamuhunga 402S060021 2.15 Earth Kyamabare 1 – Manengo 3
Kyamuhunga 402S060022 2.73 Earth Manengo – Muhumuza 3
Kyamuhunga 402S060023 1.65 Earth Katuura – Ryabagaju (Maari Estates) 3
Kyamuhunga 402S060024 1.98 Earth Ryeru – Katuura 3
Kyamuhunga 402S060025 1.39 Earth Yusuf (Kashenyi Stream) – Katuura 3
Kyamuhunga 402S060026 1.91 Earth Mashonga – Kyamabare 2 3
Kyamuhunga 402S060029 7.58 Earth Kayanga – Warugo 3
Kyamuhunga 402S060030 2.22 Earth Kyamukubwa – Nyakazinga 3
Kyamuhunga 402S060031 1.22 Earth Kyamukubwa – St. Ambrose P/S 3
Kyamuhunga 402S060032 3.43 Earth Warugo - Kyakayonga 3
Kyamuhunga 402S060033 2.53 Earth Kibazi - Nyakazinga 3
Kyamuhunga 402S060034 1.73 Earth Kibona – Kibazi 3
Kyamuhunga 402S060035 3.22 Earth Ryampanga – Kanyabiko 3
Kyamuhunga 402S060040A 2.79 Earth Kigoma TC - Kyamamari 3
Kyamuhunga 402S060040B 1.89 Earth Kigoma TC - Kyamamari 3
Kyamuhunga 402S060041 2.08 Earth Rwenjojo – Kyamamari – Kihangire RD -Bitooma
3
Total 406.73
Urban Roads
Rwentuuha Town Council
40206B 1 Earth Rwentuuha T/C – Kyeizooba 2
Rwentuuha Town Council
402S070016 3.43 Earth Rwentuuha- Kyanyamutungu 2
Rwentuuha Town Council
2 Earth Rwentuuha- Rwagasha crossing 2
Rwentuuha Town Council
402S070004 1.6 Earth Omukacence – Kitwe 2
Rwentuuha Town Council
402S070003 2.09 Earth Kitwe-Nyakashozi 2
Rwentuuha Town Council
402S070053 1.68 Earth Bushenyi UTC – Kitwe Main Road 2
Rwentuuha Town Council
402S070037 1.05 Earth Bushenyi UTC – Ncucumo P/S 2

51
Sub-county Road code Road length(km
s)
Road type
Road Name Road Class
Rwentuuha Town Council
1.8 Earth Kyabasenene – Kahaya 2
Rwentuuha Town Council
1 Earth Kyabasenene- Ncucumo P/s 2
Rwentuuha Town Council
40218B 3.1 Earth Kahaya – Rubingo T/C 2
Rwentuuha Town Council
0.2 Earth Kahaya Stage- Nduhuura Hostels 2
Rwentuuha Town Council
1.4 Earth Rubingo-Nyamabare-Kashogashoga 2
Rwentuuha Town Council
0.6 Earth Kitwe-Kashogashoga HCII 2
Rwentuuha Town Council
40218C 3.6 Earth Kitwe-Rubingo-Kyabugimbi Boarder
2
Rwentuuha Town Council
1.5 Earth Rubingo-Kabishaka 2
Rwentuuha Town Council
0.7 Earth Rushoga-Rubirizi 2
Rwentuuha Town Council
3.1 Earth Kitwe-Kyamuzoora-Nyamirima 2
Rwentuuha Town Council
1.6 Earth Rwentuuha-Rubirizi 2
Rwentuuha Town Council
402S070012 3.88 Earth Kakiremba – Nyamirima – Rubirizi 2
Rwentuuha Town Council
402S070011 2.32 Earth Rubirizi – Mukama 2
Rwentuuha Town Council
0.5 Earth Rwentuuha – Vine S.S.S – Kitwe 2
Rwentuuha Town Council
0.1 Earth Rwentuuha – Nkomaho 2
Rwentuuha Town Council
0.6 Earth Tiberondwa Road 2
Rwentuuha Town Council
402S070006 1.49 Earth Rwentuuha – Mbatamo – Kantojo 2
Rwentuuha Town Council
2.2 Earth Kantojo – Kihunda 2
Rwentuuha Town Council
1.2 Earth Omukahanga T/C – Nyarurambi 2
Rwentuuha Town Council
1.2 Earth Omukahanga T/C – Rugunga 2
Rwentuuha Town Council
2.3 Earth Nyabutobo-Misingano 2
Rwentuuha Town Council
402S070008 1.85 Earth Kandekye - Nyabutobo 2
Rwentuuha Town Council
402S070009 1.53 Earth Omukibare – Bujaga Border 2
Rwentuuha Town Council
40208B 3.5 Earth Kaziho - Nyamirima 2
Rwentuuha 402S070070 1.52 Earth Omukibare - Nyabutobo 2

52
Sub-county Road code Road length(km
s)
Road type
Road Name Road Class
Town Council
Kyamuhunga Town Council
402S060002 2.32 Earth Kyabugimbi-Ryamarembo 2
Kyamuhunga Town Council
402S060015 5.5 Earth Butare-Swazi – Keitabashaki 2
Kyamuhunga Town Council
402S060011 0.6 Earth Butare T/C-Guest House 2
Kyamuhunga Town Council
402S060010 5 Earth Butare- T/C – Kyeikamba – Kajugangoma-Swazi
2
Kyamuhunga Town Council
2.3 Earth Kyamuhunga C.O.U- Rwenjojo 2
Kyamuhunga Town Council
40203B 3 Earth Omukayembe- Tea Estate 2
Kyamuhunga Town Council
402S06004 1.5 Earth Nyamiyaga- Ndurumo 2
Kyamuhunga Town Council
3 Earth Karyanshure-Mashonga 2
Kyamuhunga Town Council
402S060027 2.67 Earth Ryantende- Kyamabare 2
Kyamuhunga Town Council
402S060028 1.98 Earth Ryantende- Kitatera 2
Kyamuhunga Town Council
402S060008 0.86 Earth Butare-Kabingo 2
Kyamuhunga Town Council
40201B 2.5 Earth Kyamuhunga S.S.S- Comboni – Rwenjojo
2
Kyamuhunga Town Council
402S060020 1.56 Earth Comboni- Karyanshure Mast 2
Kyamuhunga Town Council
0.3 Earth Muhebwa’s Fuel Station-Butare Round About
2
Kyamuhunga Town Council
402S060016 0.89 Earth Kaitabashaki - Gongo 2
Kyamuhunga Town Council
402S060017 2.07 Earth Katembe - Nyakitsyama 2
Total 84.6
District Feeder Roads
Kyamuhunga/Bitooma
40201 4.2 Earth Rwenjojo – Kyamamari 2
Nyabubare 40202 10.5 Earth Kizinda – Nyabubare – Ncwera 1 Bridge
1
Kyamuhunga/Bitooma
40203 20 Earth Kabingo – Bitooma – Kibazi 1
Bumbaire 40204 10 Earth Nyaruzinga – Bumbaire - Kitabi 1
Bumbaire/ Kyeizooba
40205 11 Earth Kabushaho - Kabuba 2
Kyeizooba 40206 8 Earth Kyeizooba play ground - Kabuba 1
Kakanju/ Kyabugimbi
40207 5 Earth Ryamabengwa – Kakanju - Katikamwe
2
Kyabugimbi/ Ruhumuro
40208 33 Earth Nyamirima – Kyabugimbi – Ruhumuro – Burungira – Ekikorijo –
2

53
Sub-county Road code Road length(km
s)
Road type
Road Name Road Class
Nyeibingo – Buhimba - Kyarwamukara
Kakanju 40209 6 Earth Kakanju – Kashanda - Nombe 2
Bumbaire 40210 4.3 Earth Bumbaire – Bweranyangi – Kacuncu - Rwemiyonga
3
Nyabubare 40211 11 Earth Nyabubare – Kashozi - Nyarugote 2
Kyamuhunga / Nyabubare
40212 10 Earth Kalinzu – Nyarugote – Kakombe - Nyakatsiro
2
Kakanju 40213 7.6 Earth Kijumo – Nyakabingo - Kashasha 2
Kyamuhunga/Bitooma/ Kakanju
40214 15.5 Earth Manengo – Ngorora - Kaijengye 2
Kakanju/Kyamuhunga
40215 8 Earth Kijumo – Warugo - Kabingo 2
Kyamuhunga 40216 6.5 Earth Rwenjojo – Kyamabare – Kitatera 2
Kyeizooba 40217 5.3 Earth Runyinya – Kyeizooba 2
Kyabugimbi 40218 8 Earth Rubingo – Kihumuro – Katikamwe – Kyabugimbi
2
Kyeizooba 40219 8.5 Earth Ntungamo – Kyamugambira – Rwemitozo – Nyariyanga
2
Kyeizooba 40220 7.8 Earth Kihunda – Nyariyanga – Rwamuganga
2
Nyabubare 40221 12 Earth Kizinda – Nkanga – Igambiro 1
Bitooma/ Ruhumuro
40222 8.5 Earth Bitooma – Burungira 2
Kyabugimbi 40223 9 Earth Kafunjo – Karyango – Mukora 3
Kyabugimbi/ Ruhumuro
40224 7 Earth Kyabugimbi – Rutooma – Kacwamba 3
Ruhumuro 40225 7 Earth Kyarukari – Kacwamba – Kafunjo 3
Bumbaire 40226 9.5 Earth Ihaama Bridge – Kantunda – Bumbaire-Kitakuka
2
Bumbaire/ Ibaare
40227 7.5 Gravel/Murram
Kigurusti – Keinamo – Ndurumo 2
Bumbaire / Kyeizooba
40228 6.4 Earth Bumbaire – Bwera 3
Kakanju 40229 4.5 Earth Nombe – Bwegyeme – Katimba 3
Nyabubare 40230 3.7 Earth Nyamirembe – Omukatensani 2
Ibaare 40231 8.5 Gravel/Murram
Kitabi Demo – Ryeishe HCIII – Bwooma – Ibaare T/C – Nyamahwa Bridge – Kiyaga – Ahabutunda – Keinamo HCII – Karubuga ‘A’ village
2
Ruhumuro 40232 14.4 Gravel/Murram
Obwooma – Omukati – Kyeijongo – Burungira – Rwengoma – Ihanda – Nyamyerande
2
Bitooma 40233 17.5 Gravel/Murram
Nyanga – Bubaare – Kabumburi Dip Tank – Rwanziro – Katiba Village – Warugo Bridge – Bitooma Bridge –
2
Bitooma 40234 21.8 Gravel/ Kicwangisa – Kyamamari – 2

54
Sub-county Road code Road length(km
s)
Road type
Road Name Road Class
Murram
Ekihangire T/C – Warugo Bridge – Bitooma S/C HQs – Nyanura – Yehunde P/S – Kashasha – Kayengo – Mushakira – Kemitaha P/S – Kimuri Tea collection centre.
Ruhumuro 40235 30.4 Gravel/Murram
Nyambare – Karyango – Kayanga – Kansingyesa – Nyeibingo ‘A’ – Ekikorijo – Ihanda – Bwenkingo – Nyakishojwa – Ngando – Akagoro – Bugaara Central – Ruhumuro S/C junction – Rwekitooma – Rwomuyaga
2
Ibaare 40236 24.4 Gravel/Murram
Ibaare T/C – Njeru – Bihasha Bridge – Rugyeya bridge – Nyakatuntu circuit- Nyaruka – Nyakashojwa – Bwoma – Kiruhura – Mutanoga –Kashenyi – Ntaruka – Bwooma – Kitabi Parish – Kayoora River – Rurengye – Omukataagu – Mutukura – Nyarurambi – Kagari – Ahakikoona – Keinamo HCII – Nyamirama – Jeniffer’s residence – Kagari - Ndurumo
2
Total 392.3
Trunk Roads(Tarmac)-UNRA
44.2 Tarmac Kandekye-Enkombe 1
14 Tarmac Ishaka-Katagu 1
Total 58.2
Trunk Roads(Murram)-UNRA
15 Murram/Gravel
Nyakabirizi-Mukora 2
Total 15
Source: Works and Technical services
Major activities implemented by S/County in Financial Year
2019/2020
Item Number
1. Number of kms of roads Rehabilitated by Sub County : 41.7
2. Number of Kms of roads periodically maintained by Sub
County
: 0
3. Number of Kms of roads routinely Maintained by sub county : 392.3
4. Number of road bottlenecks improved by Sub County : 4

55
Item Number
5. Number of bridges constructed by Sub County : 0
6. Number of bridges rehabilitated by Sub County : 0
7. Number of kms of urban roads rehabilitated : 0
8. Number of Kms of urban roads periodically maintained : 0
9. Number of Kms of urban roads with Street lights installed : 0
10. No of kms of community access roads maintained : 41.7 km
11. No. of Kms of community access roads rehabilitated : 0
Table 6.2: Projects of 2019/20.
No. Project description Km Location FY Status
District Feeder Roads
1
Grading of Bitooma –Nyakabonde – Burungira Road
8.5 Bitooma/Ruhumuro 2019/2020 Good
2 Grading of Ngorora – Kitojo – Kaijengye Road
8 Bitooma/Kakanju 2019/2020 Good
3
Grading of Bumbaire – Bweranyangi – Kacuncu -
Rwemiyonga
4 Bumbaire 2019/2020 Good
4 Grading of Runyinya – Kyeizooba Road
5.3 Kyeizooba 2019/2020 Good
5 Grading of Bumbaire – Bwera Road
6.4 Bumbaire/Kyeizooba 2019/2020 Good
6
Grading of Kalinzu – Nyarugote – Nyakatsiro
Road
10 Kyamuhunga / Nyabubare
2019/2020 Good
7
Grading of Ruhumuro
HCIII – Burungira – Ekikorijo – Nyeibingo – Kafunjo Road
12 Ruhumuro 2019/2020 Good
8
Grading of Kyarukari – Kacwamba – Kafunjo
Road
7 Ruhumuro 2019/2020 Good
9
Spot murraming of
Ngorora – Kaijengye Road
1 Bitooma/Kakanju 2019/2020 Good
10
Spot murraming of
Kashanda – Kitojo Road
1 Kakanju 2019/2020 Good
11
Spot murraming of
Bumbaire – Bweranyangi – Kacuncu - Rwemiyonga Road
1 Bumbaire 2019/2020 Good
12
Spot Murraming of Kizinda – Nyabubare –
Ncwera 1 Bridge
1.2 Nyabubare 2019/2020 Good
13
Spot murraming of
Kalinzu – Nyarugote –
1 Nyabubare 2019/2020 Good

56
No. Project description Km Location FY Status
Nyakatsiro Road
Total 66.4
Community Access
Roads
14
Grading of Kabingo –
Mutojo Road
1.1 Bitooma 2019/2020 Good
15
Grading of Oruberera –
Buyanja Road
0.4 Bumbaire 2019/2020 Good
16 Swamp filling of Nyamitooma Swamp
40metres Bumbaire 2019/2020 Good
17
Grading of Bwooma – Kiruhura – Mutanonga
Road
2 Ibaare
2019/2020 Good
18
Grading of Migina –
Kamunyongozi Road
0.8 Ibaare 2019/2020 Good
19
Grading of Kabanswere –
Ishunga – Njeru Road
0.5 Ibaare 2019/2020 Good
20
Grading of Ryakahwa –
Nyarutuntu Road
2 Kakanju 2019/2020 Good
21
Grading of Ryamizingo –
Bunanura P/S
2 Kakanju 2019/2020 Good
22 Grading of Kemondo – Rwemiswa Road
1.5 Kakanju 2019/2020 Good
23
Grading of Akacwampare – Kakorogoto – Boarder
Road
0.9 Kakanju 2019/2020 Good
24
Grading of Bukorijo –
Omukarere Road
4 Kyabugimbi 2019/2020 Good
25
Grading of Mabanga
Trading Centre – Hokukirire Road
1.5 Kyabugimbi 2019/2020 Good
26 Grading of Kabingo – Boarder Road
2.5 Kyamuhunga 2019/2020 Good
27 Grading Of Bihande – Swazi Road
2 Kyamuhunga 2019/2020 Good
28
Grading of Bwera
Trading Centre – Katookye – Nyakizinga
Road
2.5 Kyeizooba 2019/2020 Good
29
Grading of Kanyindo –
Rwatukwire Road
1.5 Kyeizooba 2019/2020 Good
30 Grading Of Nyakashozi – Busia – Nyampikye Road
1.5 Kyeizooba 2019/2020 Good
31 Grading of Kironde – Rwatukwire Road
1.5 Kyeizooba 2019/2020 Good
32
Grading of Kyeizooba Trading Centre –
Kyeizooba S/C HQtrs – Kyeizooba PS Road
0.8 Kyeizooba 2019/2020 Good
33 Grading of Rwankubaate 3 Nyabubare 2019/2020 Good

57
No. Project description Km Location FY Status
– Nyamitoozo –
Nyamirembe Road
34
Grading of Kahija –
Kanyazungu – Katyabiri Road
4 Nyabubare 2019/2020 Good
35
Grading of Omupoloti –
Kabatuura – Ncwera and Kabegambire Road
3.1 Nyabubare 2019/2020 Good
36 Grading of Kyeijongo – Comboni S.S.S Road
1.5 Ruhumuro 2019/2020 Good
37 Grading of Kafunjo – Nyeibingo Central Road
1.1 Ruhumuro 2019/2020 Good
Total 41.7
Other Projects.
38
Rehabilitation of Ntungamo-Rwamukoto
Road;Ekinanansi-Nhsenga-Rwenjeru Road
4 Ntungamo Ward 2019/2020 Good
39
Emergency Works on
Kabingo-Warugo Road
2 Kyamuhunga 2019/2020 Good
40
Installation of Reinforced
Concrete Culverts of 600mm diameter on
Kitojo-Kashanda Road
1 Line Kakanju 2019/2020 Good
41
Installation of ARMCO Steel Metallic Culverts of
900mm diameter on Kibingo-Kashozi Road
1 Line Nyabubare 2019/2020 Good
42
Repair of 2 Culverts Crossings at Nyakabingo
and Karambi
2 Areas Kakanju 2019/2020 Good
43 Rwentuuha Town Council
Grading of Rwenkuba-Omukibare-Bujaga Road
3 2019/2020 Good
Grading Rushoga-Rutooma Road
0.7 2019/2020 Good
Grading Rwanyankara-Ndyabahinduka Road
1.7 2019/2020 Good
Grading Kyabasenene-Ncucumo Road
1 2019/2020 Good
Grading Rwentuuha-Kantojo-Rugunga Road
4.1 2019/2020 Good
Total 10.5
44
Kyamuhunga Town
Council
Grading of Butare-
Kalinzu Road
1.5 2019/2020 Good
Grading of Kyamabare-Ryantende Road
3.1 2019/2020 Good

58
No. Project description Km Location FY Status
Grading of Butare C.O.U-
Kabingo Road
1 2019/2020 Good
Grading of Nyamiyaga-
Ryamarembo Road
2 2019/2020 Good
Total 7.6
Source: Works and Roads Department
6.2 Housing
The housing in this category basically includes buildings/rooms being used
for Office accommodation for the various departments within the district.
Table 6.4: Capacity and Condition of District Office Blocks
Dept/Sector No. Of offices
Ownership (district/re
nted)
Location (district
Hqrts)
Adequacy
(yes/no)
Condition (good/fair/ba
d)
District Hqtrs
76 District District Hqtrs
Yes Fair
RDC’s Office 05 District District Hqtrs
Yes Bad
Water Offices
04 District District Hqtrs
Yes Bad
DSC Offices 05 District District Hqtrs
Yes Good
District Staff
Houses
24 District District
Hqtrs
No Bad
Source: Works and Technical services

59
CHAPTER 7: NATURAL RESOURCES
7.0 Introduction
The Department of Natural Resources comprises of the Natural Resources Office, the Lands and Physical
Planning Office as well as the Forestry, Environment & Wetlands Office. It is charged with the responsibility of
ensuring sustainable and productive utilisation of natural resources for poverty reduction, enhanced economic
growth and improved livelihoods. The major causes of the deterioration the quality and the quantity of the
natural resource base is associated with human activity. There is massive deforestation particularly on
privately owned land where most of the districts tree resources are. This is closely followed by wetland
degradation as a result of cultivation of crops. Other threats are soil erosion whose magnitude and impact has
never been quantified.
7.1 Environmental Sanitation related Statistics:
1 Environmental Sanitation related Statistics:
Number of solid waste collection points : 14
Number of landfills : 01
Number of solid waste disposal points in LG : 01
Number of abattoirs : 014
Number of abattoirs that meet specifications : 02
Number of abattoirs with disposable lagoons : 00
7.2 Waste Management
Table 7.1: Waste management (particularly for urban) as of 2019
Waste management type Number
Bunkers 0
Garbage trucks 1
Refuse skips 0
Land fills 1
Dumping sites 2
Placenta pits 3
Incinerators 2
Rubbish pits 4
Source: District Natural Resources Office
7.3 Tree Planting and Charcoal burning 7.3.1 Tree planting
Number of nursery beds established and maintained : 8
Number of trees planted ( in calendar year 2018) : 90,000
Number of commercial tree growers : 215

60
7.3.2 Charcoal burning
Number of licensed charcoal dealers : 54
Number of licensed timber dealers 59
Table 7.2: Location of Wild Game and Vermin
Sub-county Available categories of vermin Available categories of game
Nyakabirizi Division Monkeys Monkeys
Kyeizooba Monkeys Monkeys
Nyabuaare Monkeys Monkeys
Kyamuhunga, Nyabubaare Chimpanzes, Monkeys Chimpanzes, Monkeys
Source: Natural Resources Office
7.2 State of Wetlands
Sn Name River Location Sn Name of River Location
1. Kandekye Kyabugimbi, Rwentuha Town
Council, Kyeizooba Sub County
14 Kifamutima Bitooma Town
Council
2. Kyamugambira Nyakabirizi Division, Kyeizooba
Sub County
15 Tenga Kakanju S/C
3. Nyaruzinga Nyakabirizi Division, Bumbaire
S/C, Ibaare S/C, Central Division
16 Nyaruhorera Nyakabirizi Division,
Kakanju S/C
4. Kajurugo Nyakabirizi Division, Central
Division
17 Nyabikurungu Nyakabirizi Division,
Kakanju S/C
5. Katarimwa Kakanju S/C, Ishaka Division 18 Kiyagaara Ruhumuro S/C,
Kakanju S/C
6. Nyamirembe Ishaka Division, Kizinda Town
Council, Nyabubaare S/C,
Nkanga S/C, Ibaare S/C
19 Kafunjo Kyabugimbi S/C,
Ruhumuro S/C
7. Ncwera Kyamuhunga Town Council,
Nyabubaare S/C, Kyamuhunga
S/c
20 Kihiringitwa Kyamuhunga Town
Council, Kyamuhunga
S/C
8. Kitatera Kyamuhunga Town Council,
Kyamuhunga S/C, Bitooma T/C
21 Rwenjojo Kyamuhunga Town
Council
9. Kyambura Kyabugibi S/C, Ruhumuro S/C,
Bitooma Town Council
23 Kisharara Kyabugimbi S/C
10. Wafunda Kyamuhunga Twn Council,
Kyamuhunga S/C
24 Kakiremba Kyeizooba S/C
11. Warugo Ishaka Division, Kakanju S/C,
Kyamuhunga S/C
25 Kagarirambe Ibaare S/C
12. Katunga Lake Shore Kakanju 26 Kiyagaara
Kakanju
13. Kashanda Kakanju 27 Ryariyondo Ishaka Division
Number of rivers and lakes : 27 rivers and lakes
Percentage of wetlands used for papyrus harvesting: (grass) : 75%
7.3. Land management
Land use
Percentage of land under agriculture :65%
Percentage of land under commercial farming : 35%
Percentage of land occupied by forest reserves : 0.01%

61
7.4 Forestry
7.4.1. Types of Forests
Table 7.3: Type of forests by Acreage
Type of Forest Size
Natural Forests 49514 acres
Plantations 10 hectares
Central Forest Reserves 49514 Hectares
District/Local Forest reserves 10 Hectares
Private forest reserves 258 Hectares
Source: District Natural Resources Office
Table 7.4: Local Forest Reserves
Name of Forest Location Area(Ha) Condition
Kyamuhunga Forest Reserve Kyamuhunga Town
Council
10 Hectare Intact
Source: District Natural Resources Office
Table 7.5: Gazetted Forest Reserves
Name of forest Area Date gazetted
Karinju 14126 Ha
Katsyoha-Kitomi 35388 Ha
Source: District State of Environment Report
Table 7.6: Distribution of Forest Reserves by category
Category of forest reserve Area (ha)
Central Forest Reserves 49514
Local Forest Reserves 23
Source: Natural Resources Department

62
CHAPTER 8: GENDER & COMMUNITY BASED SERVICES
8.0 Introduction
This chapter shows statistics on marginalized groups or communities. The mandate of the department is to
promote social protection and promotion of human right as well as empowering these groups.
8.1 General Community Development Issues
The Community Based services sector is one of the major sectors in the district and is composed of;
Community Based Services coordination office
Community Development
Probation, Youth, Children and Social welfare
Disability and Elderly/Social Rehabilitation
Gender and Culture
Labour and Industrial Relations
Women, Youth, Disability and Older Persons Councils
Programmes and projects implemented under Community Based Services Sector
Social Assistance Grants for Empowerment
Uganda Women Entrepreneurship Programme
Orphans and other vulnerable children
Integrated Community Learning for wealth creation
Youth Livelihood Programme
Community Based Rehabilitation
Special Grant for PWDs
The District has several community development groups. These include youth groups, women groups, civil
society organisations,
Number of Community Development Groups : 3540
Number of women Groups :85
Men Groups : 56
Mixed (Men, women, PWDs) groups :2560
Community Development Centres (dilapidated) : 1
Number of NGOs : 11
No of NGOs support programs for disadvantaged groups : 5
Number of CBOs : 2626
Ratio of CDOs to the community : 1.: 17143 persons
Ratio of /CDOs to the Households in Bushenyi : 1 : 4272 households
Youth Groups :254
PWD groups : 75

63
8.2 Community Projects
8.2.2 UWEP-WOMEN GROUPS SUPPORTED IN 2019/2020 FY
Name of LLG Project Name Amount received Total Number of Members
1. Ibaare Ahaibare women produce buying and selling
5,300,000 13
2. Ibaare Kibingo women pig fattening 5,100,000 10
10
3. Kakanju Nyarutuntu Bakyara Twetungure-Buying and selling produce.
10,110,000 15
4. Kakanju Bunenwa Bakazi Tukore-Buying and selling produce.
10,120,000 10
5. Kakanju Katimba Bakyara Twetungure-Buying and selling produce.
8,050,000 12
6. Kyabugimbi Beijengye Bakyara Tukore-Piggery 9,800,000 10
7. Kyabugimbi Kyeigombe C All in All Group-Piggery
7,100,000 10
8. Kyabugimbi Kyabugimbi Kiosks Group-Whole trade and storage
8,300,000 10
9. Kyabugimbi Child Development Post Test Group-Tents and chair hiring.
8,000,000 10
10. Kyamuhunga Ryampanga women pineapple growing
5,900,000 11
11. Kyamuhunga Rwenjojo Bakyara Kweyamba-Piggery
8,100,000 13
12. Kyamuhunga T/C
Gongo Quality Tea Sellers 7,400,000 12
13. Kyamuhunga T/C
Gongo Bakazi Twetungure-Brick making
6,000,000 10
14. Kyamuhunga T/C
Butare Women in Development-Brick making
5,000,000 10
15. Kyamuhunga T/C
Kyamuhunga VHTs Group-Piggery
7,350,000 10
16. Kyeizooba Nyariyanga Women Extreem Group-Bull fattening.
7,950,000 10
17. Kyeizooba Kyeizooba Women Bull Fattening Project
9,376,000 10
18. Rwentuha T/C Kitwe Women Wine Making 11,320,000 10
19. Ruhumuro Kafunjo Bakyara Twetungure-Tents and chair hiring
8,000,000 10
20. Ruhumuro Nyeibingo Tukwatanise Catering services
6,400,000 10

64
Table 8.2: Youth Livelihood Projects implemented by Sub-county, 2019/2020 FY
YLP SUPPORTED GROUPS 2019
NAME OF LLG
NAME OF GROUP AMOUNT M F T
1 Rwentuha T/Council
Rwentuha Abamwe Youth Boda Boda 12,500,000 8 4 12
2 Bitooma Murambi Tukore Youth Coffee Trading 8,000,000 4 6 10
3 Bitooma Kyasha Twimukye Youth Goat Trading 9,000,000 6 6 12
4 Bitooma Kanyamuteera Youth Bull Fattening 12,000,000 7 5 12
5 Bumbaire Nyamwirima II Handcraft Making B 7,500,000 5 3 8
6 Bumbaire Rwenkuba Youth Boda Boda 12,500,000 7 5 12
7 Bumbaire Katenga Youth Boda Boda 12,500,000 8 4 12
8 Ibaare Karubuga B Youth Fish Farming 8,000,000 5 5 10
9 Ibaare Ahaibare Youth Motorcycle Riding 12,500,000 8 4 12
10 Kakanju Bwegyeme Youth Bull Fattening 9,000,000 5 4 9
11 Kakanju Rwengoma Youth Goat Rearing 9,000,000 5 3 8
12 Kakanju Nyakatooma Youth Goat Trading 10,240,000 7 5 12
13 Kakanju Obwogo Youth Goat Trading 10,240,000 6 5 11
14 Kakanju Kacence Youth Goat Rearing 7,000,000 5 3 8
15 Kakanju Muziira II Youth Goat Rearing 7,000,000 4 5 9
16 Kyamuhunga Bugongo Youth Brick Making II 6,800,000 4 3 7
17 Kyamuhunga Swazi II Youth Wine Making 9,880,000 5 5 10
18 Kyamuhunga T/Council
Gongo Youth Boda Boda 12,500,000 7 5 12
19 Kyamuhunga T/Council
ButareYouth Tea Shamba Hiring & Selling 12,000,000 6 6 12
20 Kyamuhunga T/Council
Ryakatakanya Youth Poultry 12,000,000 8 4 12
21 Kyeizooba Kyamacumu Youth Goat Rearing 5,460,000 4 3 7
22 Kyeizooba Rwemihingo Youth Piggery 9,700,000 6 3 9
23 Kyeizooba Rwengyeya Youth Piggery 9,780,000 5 4 9
24 Kyeizooba Kafunjo Youth Bar & Liquind Soap Making 12,100,000 6 6 12
25 Kyeizooba Ntungamo Youth Boda Boda 12,500,000 7 5 12
26 Nyabubaare Kibitsya Youth Poultry Keeping 12,000,000 7 5 12
27 Nyabubaare Kiyagara II Youth Poultry B 12,000,000 6 6 12
28 Nyabubaare Kiyagara I Youth Coffee Traders 8,000,000 5 3 8
29 Ruhumuro Kashozi Youth Boda Boda 12,500,000 7 5 12
30 Ruhumuro Ihanda Youth Boda Boda 12,500,000 8 4 12
31 Ruhumuro Orubingo B Youth Green Tea Buying & Selling
9,960,000 5 5 10
32 Ruhumuro Kanywero Youth Tea Buying & Selling 11,550,000 7 5 12
33 Rwentuha T/Council
Rubingo Youth Goat Rearing 6,700,000 4 3 7
TOTAL 334,910,000 197 147 344

65
Source: Community Development and Gender Department
8.4 Probation, OVCs and Child Protection Issues
Orphan hood status
In Uganda, an Orphan is defined as a child less than 18 years who has lost one or both
parents. Parent’s survival has a strong bearing on welfare of the children because children are
dependent on their parent and other adult to support them.
Table 8.4: Distribution of parent’s survival for children aged below 18 years
Children 0-8 years
Number
Percentage
Children 0-8 years who have lost one parent 2,069 3.4
Children 0-8 years who have lost both parents 187 0.3
Children 0-8 years who have lost at least a parent (total number of orphans)
2,256 3.7
Children 0-8 years who have both parents 59,050 96.3
Children 0-17 years who have lost one parent 8,989 7.7
Children 0-17 years who have lost both parents 1,294 1.1
Children 0-17 years who have lost at least a parent (total number of orphans)
10,283 8.8
Children 0-17 years who have both parents 107,175 91.2
Table 8.5: Parental Survival and Orphanhood
5.1: Children 0-8 years Number Percent
Children 0-8 years who have lost one parent 809 3.6
Children 0-8 years who have lost both parents 67 0.3
Children 0-8 years who have lost at least a parent
(total number of orphans)
876 3.9
Children 0-8 years who have both parents 21,478 96.1
5.2: All children (0-17 years) Number Percent
Children 0-17 years who have lost one parent 3,507 8.0
Children 0-17 years who have lost both parents 467 1.1
Children 0-17 years who have lost at least a parent
(total number of orphans)
3,974 9.1
Children 0-17 years who have both parents 39,676 90.9
Table 8.7 Distribution Of use of ICT As Of 2014 NPHC
USE OF ICT 9.1: Mobile phone ownership (10and above
years)
Number Percent
Persons aged 10 years and above that own at least one
mobile phone
25,677 43.0
Males aged 10 years and above that own at least one mobile
phone
12,821 45.8
Females aged 10 years and above that own at least one
mobile phone
12,856 40.4
9.2: Mobile phone ownership (18-30 years) Number Percent

66
Persons aged 18-30 years and above that own at least one
mobile phone
9,883 55.9
Males aged 18-30 years and above that own at least one
mobile phone
5,078 61.9
Females aged 18-30 years and above that own at least one
mobile phone
4,805 50.7
9.3: Internet Usage (10and above years) Number Percent
Persons aged 10 years and above that use internet 3,930 6.6
Males aged 10 years and above that use internet 2,329 8.3
Females aged 10 years and above that use internet 1,601 5.0
9.4: Internet Usage (18-30 years) Number Percent
Persons aged 18-30 years and above that use internet 2,292 13.0
Males aged 18-30 years and above that use internet 1,318 16.1
Females aged 18-30 years and above that use internet 974 10.3
8.6 Situation of OVC
No. Name of Lower Local Government Total No. of OVC
1. BitoomaTown Council 2124
2. Kyamuhunga Town Council 1856
3. Kyamuhunga Sub County 2981
4. Kizinda Town Council 1715
5. Nyabubare Sub County 2030
6. Nkanga Sub County 1511
7. Ibaare Sub County 1237
8. Bumbaire Sub county 1845
9. Kyeizooba SubCounty 1707
10. Rwentuuha Town Council 1200
11. Kyabugimbi Town Council 1235
12. Kyabugimbi Sub County 1236
13. Ruhumuro Sub County 1646
14. Kakanju Sub County 2043
Table 8.8 Persons with disability as of 2014 National Population Census
DISABILITY 6.1: Persons with a Disability Number Percent
Persons aged 2 years and above with a disability 11,059 13.8
Persons 2 years and above with a seeing disability 6,062 7.6
Persons 2 years and above with a hearing disability 2,694 3.4
Persons 2 years and above with a walking disability 4,089 5.1
Persons 2 years and above with a remembering disability 5,798 7.2
Persons 2 years and above with multiple disabilities 3,691 35.7
Children 2-17 years with a disability 1,965 5.0
Youth 18-30 years with a disability 1,424 8.1
Older persons 60 years and above with a disability 3,554 64.5

67
CHAPTER 9: PRODUCTION AND MARKETING
9.0 Introduction
The sector is comprised of five sectors namely: Agriculture, Veterinary Services, Fisheries, Entomology as well
as Trade and Industry. The department also ensures that appropriate institutional linkages are maintained with
all relevant sector agencies; comprising mostly crop, livestock, fisheries, forestry and industrial research,
marketing organisations, NGOs and CBOs engaged in agricultural activities
9.1 Agriculture
The term agriculture is used in a very broad sense to cover all the agricultural activities namely; crops,
livestock, poultry, and fish farming.
Agriculture is the most common economic activity in the district. The majority of farmers are small holders
who grow both perennial and annual crops. The perennial crops include Banana, Coffee, and Tea, while the
annuals include maize, sweet potatoes, beans, cassava and groundnuts.
Number of Households involved in Agriculture : 48200
Ratio of Agriculture Extension workers to farmers : 1: 15900
9.1.1 Crop production
Both perennial and annual crops are grown in the district. The annual crops are mostly grown for home
consumption.
Table 9.1: Distribution of crops to farmers by OWC
S/No Sub County /Town
Council
Number of
beneficiaries
Cassava
(bags)
Irish
Potatoes
Coffee
seedlings
Tea
seedlings
1 BitoomaTown Council 3650 298 82 861,305 13,558,190
2 Kyamuhunga Sub County
4250 285 80 516,783 11,658,190
3 Kakanju Sub County 3820 322 89 1,033,566 6,823,276
4 Kyamuhunga Town Council
0 0
5 Nkanga Sub County 0 0
6 Kizinda Town Council 0 0
7 Bumbaire Sub county 4160 436 89 1,291,957 0
8 Ibaare Sub County 293 80 689,044 933,491
9 Kyeizooba SubCounty 5125 423 87 1,636,479 0
10 Kyabugimbi Sub County
5189 432 89 1,722,610 0
11 Rwentuha Town Council
0 0
12 Kyabugimbi Town Council
0 0
13 Ruhumuro Sub County 4162 412 85 1,808,740 9,746,552

68
S/No Sub County /Town
Council
Number of
beneficiaries
Cassava
(bags)
Irish
Potatoes
Coffee
seedlings
Tea
seedlings
14 Nyabubare Sub County 5250 345 90 1,550,340 6,678,621
15 Bushenyi Ishaka Municipality
4245 631 255 775,177 923,232
Total 74,425 3877 1039 8,613,050 50,321,552
Source: Wealth Creation office
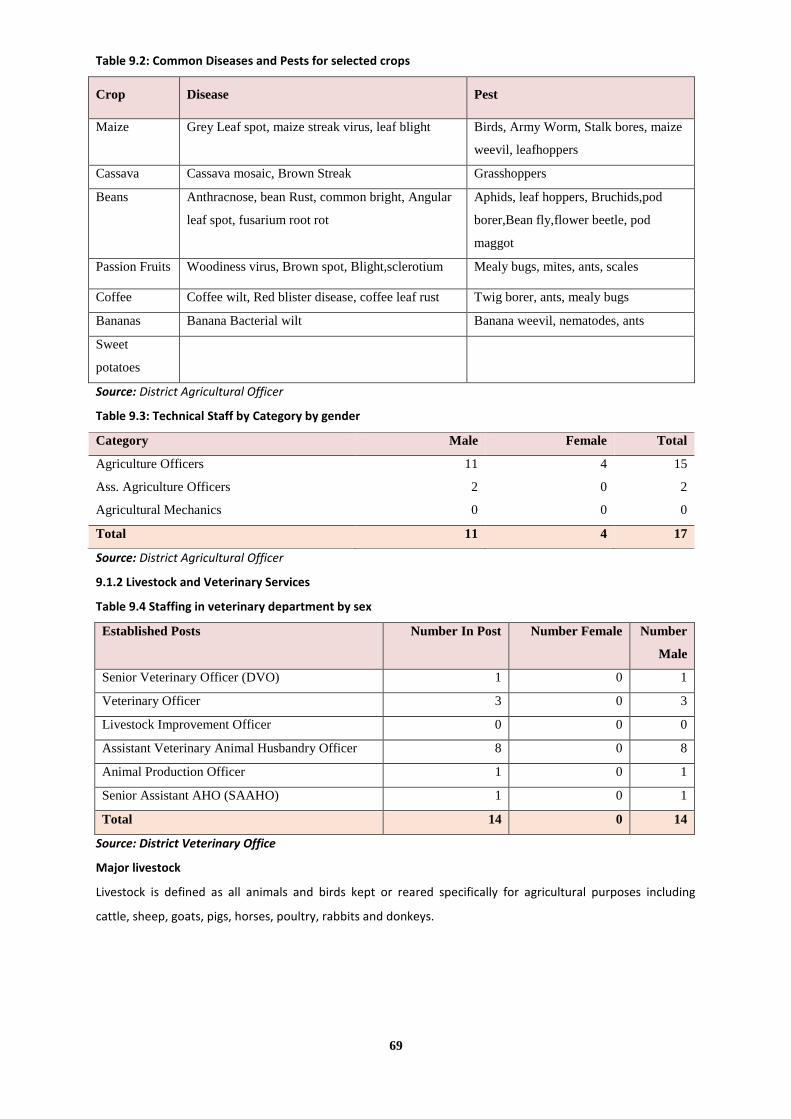
69
Table 9.2: Common Diseases and Pests for selected crops
Crop Disease Pest
Maize Grey Leaf spot, maize streak virus, leaf blight Birds, Army Worm, Stalk bores, maize
weevil, leafhoppers
Cassava Cassava mosaic, Brown Streak Grasshoppers
Beans Anthracnose, bean Rust, common bright, Angular
leaf spot, fusarium root rot
Aphids, leaf hoppers, Bruchids,pod
borer,Bean fly,flower beetle, pod
maggot
Passion Fruits Woodiness virus, Brown spot, Blight,sclerotium Mealy bugs, mites, ants, scales
Coffee Coffee wilt, Red blister disease, coffee leaf rust Twig borer, ants, mealy bugs
Bananas Banana Bacterial wilt Banana weevil, nematodes, ants
Sweet
potatoes
Source: District Agricultural Officer
Table 9.3: Technical Staff by Category by gender
Source: District Agricultural Officer
9.1.2 Livestock and Veterinary Services
Table 9.4 Staffing in veterinary department by sex
Established Posts Number In Post Number Female Number
Male
Senior Veterinary Officer (DVO) 1 0 1
Veterinary Officer 3 0 3
Livestock Improvement Officer 0 0 0
Assistant Veterinary Animal Husbandry Officer 8 0 8
Animal Production Officer 1 0 1
Senior Assistant AHO (SAAHO) 1 0 1
Total 14 0 14
Source: District Veterinary Office
Major livestock
Livestock is defined as all animals and birds kept or reared specifically for agricultural purposes including
cattle, sheep, goats, pigs, horses, poultry, rabbits and donkeys.
Category Male Female Total
Agriculture Officers 11 4 15
Ass. Agriculture Officers 2 0 2
Agricultural Mechanics 0 0 0
Total 11 4 17

70
Table: 9.5: Percentage distribution of livestock owned
Sub-county/ Town Council Number of HH that own Livestock (%)
Cattle Goats Pigs Chicken
BitoomaTown Council 7.5 12.8 4 17.3
Kyamuhunga Sub County 8.6 15 6 10
Kakanju Sub County 15 20 8 12
Kyamuhunga Town Council 12 15 3 25
Nkanga Sub County 14 18 12 21.5
Kizinda Town Council 20 12 10 25
Bumbaire Sub county 10 14 18 10.5
Ibaare Sub County 10 14.2 20.5 23.7
Kyeizooba SubCounty 24 24 8 18.8
Kyabugimbi Sub County 17.5 18 16 17
Rwentuha Town Council 22 20 20 23.7
Kyabugimbi Town Council 15 24 8 18.8
Ruhumuro Sub County 12.5 27 7 15.5
Nyabubare Sub County 10.6 20 11.5 19
Total 14.05 18.14 11.54 17.1
Source: District Veterinary Office
Table 9.6: Major livestock in the district (cattle, goats, sheep, pigs, chicken, ducks and turkeys).
Source: District Veterinary Office
Major Livestock Diseases
Table: 9.7 Livestock Diseases
Sn Diseases Prevalence (%)
1 Tick Borne Infections <20
2 CBPP <2
3 FMD 0
4 Anthrax 1<
5 Intestinal worms 50
6 Eye Infections 1
7 Brucellosis 2
8 Lumpy Skin Disease 2
9 Foot Rot 0.5
10 Reproductive Infections 0.1
11 New Castle Disease 10
Source: District Veterinary Office
Sn Type of Livestock Estimated
Numbers 1 Cattle (Exotic and High Grade crosses) 25,000
2 Cattle (Local Breeds low Grade Crosses) 12,500
3 Goats (All Breeds) 75,000
4 Sheep 15,000
5 Rabbits 4000
6 Pigs 10,000
7 Donkeys 16
8 Dogs 8,000
9 Chicken, Ducks & turkeys 150,000

71
2.2 Fisheries
Introduction Fish farming is an activity in which farmers construct fish ponds usually on their holdings and introduce fish
fries (young fish). Fish fries are commonly obtained from fish breeders like the Fisheries Research Institute
(FRI) of the National Research Organization (NARO).
Table 9.8: Fish ponds in Bushenyi as of June 2020
SN Name of the farmer/group
Village Parish Sub-county No. of ponds
Total size (m2)
1 Kabeihura Farm Ryantende Mashonga Kyamuhunga 34 10,500 2 Musinguzi Bruno Kibingo Mashonga Kyamuhunga 13 5,600 3 Tirikwendera Apullinali Ryantende Mashonga Kyamuhunga 4 1,142 4 Mugisha Ausi Kibingo Mashonga Kyamuhunga 2 300 5 Ntegerize Bernard Kibingo Mashonga Kyamuhunga 2 200 6 Banyomwa Sula Katura Mashonga Kyamuhunga 5 1,920 7 Iga Januario Nyakatebe Kibazi Kyamuhunga 2 400 8 Mutyaba Queen Mashonga Mashonga Kyamuhunga 2 900 9 Hon. Rahael Magezi Gongo Kyamuhunga Kyamuhunga 6 3,000 10 Ndyanabangi Mashonga Mashonga Kyamuhunga 3 700 11 St. Mary,s SS Gongo Kyamuhunga Kyamuhunga 1 300 12 Nyinomugisha Obed Kibazi Kibazi Kyamuhunga 2 843 13 Karemera John Mashonga Mashonga Kyamuhunga 1 200 14 Baryahebwa Bruno Butare Butare Kyamuhunga 4 1,800 15 Ahabwe Dan Kajugagoma Butare Kyamuhunga 2 600 16 Karokora Zedekia Katura Mashonga Kyamuhunga 3 1,200 17 Agaba Nyampangare Butare Butare Kyamuhunga 5 1,800 18 Capt. Aron Twinedembe Kyamukubwa Kibazi Kyamuhunga 2 1,277 19 Betubiza Mark Kibingo Mashonga Kyamuhunga 2 1,420
20 Muhumuza Benard Kyampembwe Swazi Kyamuhunga 2 152
21 Tumusiime Michael Ryamugunguru
Kyamuhunga ward
Kyamuhunga 1 95
22 Mugume Markwills Kibingo Mashonga Kyamuhunga 2 811
23 Akambikira Nazarius Kibona Kibazi Kyamuhunga 3 2,310
24 Mugerwa Ryantende Mashonga Kyamuhunga 1 200 25 Mbebembeire Matiya Kakoni Mashonga Kyamuhunga 3 1,000 26 Ryakatakanya Youth Ryakatakanya Butare Kyamuhunga 3 400 27 Nyakazinga Primary SCH Nyakazinga Kibazi Kyamuhunga 2 480
28 Tumushabe Abel
Ryamugunguru Kyamuhunga ward Kyamuhunga 1 180
29 Dr. Mugisha Silver Kigoma Kabushaho Bumbaire 6 3,106
30 Tigakiriyo Jona Kisibo Bumbaire Bumbaire 2 832
31 Stella Muhumuza Nyakikorongo Bumbaire Bumbaire 2 780
32 Emelda Nathan Nyamiyaga Bumbaire Bumbaire 2 784
33 Mutiba Eltas Nyamiyaga Bumbaire Bumbaire 3 852
34 Kahakira Naboth Kagati Bumbaire Bumbaire 1 448

72
SN Name of the farmer/group
Village Parish Sub-county No. of ponds
Total size (m2)
35 Mwebesa Patrick Kiyaga Rwentaka Bumbaire 1 480
36 Mugisha Rbert Bugarama Kiyaga Bumbaire 1 150
37 Mr. Rushabure Kiyaga Rwentaka Bumbaire 2 896
38 Katambira Yosam Nyamiyaga Bumbaire Bumbaire 2 555
39 Muhumuza Sellian Nyandozo Bumbaire Bumbaire 5 851
40 Mwesigye JB Nyakatugunda Kibaare Bumbaire 2 675
41 Naijuka Ephraim M Katonya Numba Bumbaire 3 1,436
42 Katungi Alex Bumbaire Bumbaire Bumbaire 3 1,213
43 Barugahare Nicholus Nyandozo Bumbaire Bumbaire 1 384
44 Kamugisha Pultaz Bushanje Bumbaire Bumbaire 1 540
45 Ntungwa Jane Nyabubare Kibaare Bumbaire 2 512
46 Zirimani Joab Kagati Bumbeire Bumbaire 2 500 47 Rwita Barnard Nyakatugunda Kibaare Bumbaire 1 100 48 Tibihikire Betty Nyabubare Kibaare Bumbaire 1 504
49 Begumanya Innocent Kacuncu Kibaare Bumbaire 3 1,124
50 Kabigumira Eldard Nyabubare Kibaare Bumbaire 1 549
51 Mpeeka Nyeishe Nyeishe Ibaare 2 1,792
52 Ibra Kinyonyi (Tanks) Kainamo Ibaare Ibaare 4 100
53 Musiime Robert Ryeishe Ryeishe Ibaare 2 1,300 54 Ryeishe Farmers grp Migina Ryeishe Ibaara 3 200 55 Dr Aine Byabashaija Rurengye Ibaare Ibaare 2 972 56 Kitabi Seminary Kitabi Ibaare Ibaare 3 1,500 57 Twinomugisha Daniel Ibaare ward Ibaare Ibaare 1 250 58 Andrew Martial Kagarambi Ryeishe Ibaare 4 1,200 59 Bazaana Robert Nyabihiri Kinamo Ibaare 2 456 60 Barugahare Alousius Kagarambi Ryeishe Ibaare 4 900 61 Kinyonyi Karugara Keinamo Ibaare Ibaare 3 1,526
62 Turinawe Hannington Mazinga Mazinga
Nyakabirizi Div.
2 167
63 Mugisha Elly Kamugasha Rwenjeru
Nyakabirizi Word
Nyakabirizi Div
7 2,750
64 Eng. Bagarukayo Kibaare Nyakabirizi
Nyakabirizi Div
2 606
65 Nitusiima Andrew Irembezi Nyakahita
Nyakabirizi Div
10 2,200
66 Kagumire Yusuf Kibaare Nyakabirizi
Nyakabirizi Div
3 1,134
67 Mugasha Christopher Rwakanyonyi Nyakabirizi div Nyakabirizi Div 3 1,350
68 Amanya Mushega Ryemigobora Nyamiko Nyakabirirzi Div 4 1,600
69 Bekunda Jonan Nyakahita Mazinga Nyakabirizi Div 2 140
70 Natwijuka Stuart Muhire A Rwenjeru Nyakabirizi Div 4 500
71 Emmy Kifaru Kweyunga
Ryemigobora Nyamiko
Nyakabirizi Div
7 2,631

73
SN Name of the farmer/group
Village Parish Sub-county No. of ponds
Total size (m2)
72 J. Bitarabeho Bwatogo Central Ward
Central Division
7 3,617
73 Mugizi Jackson (JAMUGI) Bwatogo Central Ward
Central Division
10 5,252
74 Azirwe Bony Ruharo Ruharo Central Division 2 700
75 Ahereza Onesmus Nyarwanya Central Ward Central Division 1 200
76 Joseline Nyarwanya Central Ward Central Division 1 220
77 Nshemerirwe Joseph Ruharo Ruharo
Central Division 1 400
78 Uganda Prisons Nyamushekyera
Nyamushekyera Central Ward Central Division
2 1,344
79 Hakizamfura Moses Kanyamabona Ward III Ishaka Division 3 1,800
80 Barira David Kanyamabona Ishaka Div Ishaka Division 2 750
81 Prof. Kabwegyere T Kanyamabona Kanyamabona
Ishaka Division
20 23,552
82 Kahonaho Joshua Kyandago Kashenyi
Ishaka Division
2 490
83 Muhangi Justus Kyandago Kashenyi
Ishaka Division
9 8,350
84 Natwebembera Amon Ryanshana 2 Kashenyi
Ishaka Division
1 590
85 Kahangire Amon Mushakira Ngorora Bitooma 2 382
86 Bwambizo Richard Bitooma C Bitooma Bitooma 1 480
87 Banyomoza Bitooma C Bitooma Bitooma 1 216
88 Kareju Abel Ngorora Bitooma Bitooma 2 1,400
89 St. Francis SS Bitooma Bitooma Bitooma 2 276 90 Bitakwise Crenerio Bitooma Bitooma Bitooma TC 1 104 91 Musigire Aggrey Bitooma Central Bitooma Bitooma TC 1 96 92 Kwekanya Hannington Kimuri Kimuri Bitooma 1 300
93 Monday Muzamiru Rwengwe Nyanda Bitooma TC 2 342
94 Nganwa Borora Bitooma B Bitooma Bitooma 1 400
95 Kasapuri Leonidus Bugarama Katikamwe Kyabugimbi 1 832
96 Major. John Baguma Karama Nyibingo Ruhumuro 2 331 97 Ruhumuro youth Nyibingo A Nyibingo Ruhumuro 1 120 98 Turyahebwa Amon Kikorijo Nyibingo Ruhumuro 1 154
99 Mabanja Venansio Kashanda Kakanju Kakanju 2 600 100 Tumwijukye Pison Kakanju Kakanju Kakanju 1 80 101 Tumwine Abu Kijumo II Kabare Kakanju 1 50 102 Byekwaso Janet Kijumo II Kabare Kakanju 9 3,475 103 Twinomujuni Didas Bwera Birimbi Nkanga 5 281 104 Nelson Kamagara Birimbi Birimbi Nyabubare 2 249 105 Nuwarinda Benja Birimbi Birimbi Nyabubare 1 143

74
SN Name of the farmer/group
Village Parish Sub-county No. of ponds
Total size (m2)
106 Ntamare Jovline Birimbi Birimbi Nyabubare 1 117 107 Mushabe Issa Birimbi Birimbi Nyabubare 4 2,060 108 Nantende Haawa Birimbi Birimbi Nyabubare 1 312 109 Owoyesiga Julius Birimbi Birimbi Nyabubare 2 517 110 Kibuka Francis Birimbi Birimbi Nyabubare 2 209 111 Mugarura Florence Nyakinengo Kizinda Nyabubare 3 309
112 Nkwisana Regan Kigoma Kizinda Nyabubare 3 3,437
113 Mama Africa (Keihura Nkuba)
Kilera Kigoma Nyabubare 2 734
114 Jaberi Kigoma Kigoma Nyabubare 2 910
115 Dr. Musinguz Levi Bukumbya Kizinda Nyabubare 5 1,150
116 Eng. Kakama Kanyantama Kizinda Nyabubare 5 6,600
117 Nkunda Enock Kiyagara Kahungye Nyabubare 7 2,380
118 Ruhamire Sulait Nyamirembe Kizinda Nyabubare 1 1,875
119 Musinguzi Dono Nyamirembe Birimbi Nyabubare 1 496 120 Mugabe Naziru Nyamirembe Birimbi Nyabubare 3 739 121 Kamukama Nicholus Nyamirembe Birimbi Nyabubare 2 290 122 Ruhamire Akramu Nyamirembe Birimbi Nyabubare 1 130 123 Bakundana Happy Nyamirembe Birimbi Nyabubare 1 152 124 Tumuhimbise Naboth Nyamirembe Birimbi Nyabubare 1 223
125 Nshabaruhanga Emmanuel
Nyamirembe Birimbi Nyabubare 1 64
126 Mawanda Sarapio Kigoma Kigoma Nyabubare 1 18 127 Tibanyendera Rozio Birimbi Birimbi Nyabubare 5 405 128 Dembe Jonathan Katokye Kizinda TC Nyabubare 9 3,699 129 Ahimbisibwe Barbara Kibingo Kizinda TC Nyabubare 2 115 130 Dr. Kansiime Michael Nyampikye Kitwe Kyeizoba 23 21,300 131 Ronald Nuwamanya Nshenga Ntungamo Kyeizooba 2 600 132 John Bosco Marichori Rwakahuka Ntungamo Kyeizoba 10 13,500
133 Dan Mwerinde-Matembe
Rubirizi Kitwe Kyeizooba 3 2,879
134 Zihweire George Nyabihiri Kararo Kyeizooba 2 1,299
135 Dr. Nduhuura Kyabasenene Kitwe Kyeizooba 3 1,800
136 Kwatampora Sezi Kifunjo Kararo Kyeizooba 4 2,192
137 Ahimbisibwe Francis Nyakinengo Nyamiyago Kyezoba 1 625
Total 448 208,986
9.3 COMMERCIAL SERVICES
9.3.1 Industry
There is little industrial works in the district and even those operating have not fully registered and conformed to all the statutory requirements.

75
9.3.2 Trade
The district has very many trade ventures which are growing at a steady rate, however, most businesses are
collapsing before celebrating their fifth birthday and this is majorly due to poor management practices like not
keeping records, over trading, debtors and doing business as a leisure activity.
9.3.3 Savings and Credit Cooperatives Societies
Bushenyi has 87 Savings and credit cooperative Societies with clients ranging from 265 to 25,102 as at June
2020.
Names of SACCO operating in Bushenyi District Local Government
SACCO NAME NUMBER OF CLIENTS SHARE CAPITAL
SACCO NAME NO. OF CLIENTS SHARECAPITAL
Kyamuhunga Peoples (KYAPS) 25,102 5,297,729,961
Jubilee 4,624 1,210,732,812
Ruhumuro SACCO 379 28,834,900
Ruhumuro Tukore 760 38,226,129
Kyamuhunga Abamwe 1,244 102,720,000
Kajunju Abahambani 869 135,797,607
Bushenyi Development Finance Trust 978 150,339,000
Bumbaire Peoples 2,431 232,052,660
Tukore Peoples Kigoma 788 74,880,000
Nyabubare Sub County SACCO 2,157 211,778,187
Kateramo 706 65,040,000
Butuuro Peoples 7,192 1,210,312,000
Bethel 1,095 155,520,000
Ruharo Heifer Project 1,366 137,123,933
Kyeizooba Peoples 2,439 399,970,900
BAMPS 662 66,033,947
Nyanga 1,613 55,220,000
Kambuzi Farmers 3,077 333,071,500
Abamwe Entrepreneurs Financial Services 1,346 78,440,000
Kyamuhunga Jubilee 3,281 447,695,227
Mwije Tweyombekye Nkanga 265 40,800,003
Greater Bushenyi Teachers 2,203 708,935,511
Ishaka Farmers 17,575 1,510,826,383
Igara Buhweju Tea Farmers SACCO 2,482 261,896,000
Bushenyi Karibu SACCO 1,218 79,736,571
Greater Bushenyi Pastors SACCO
Beijengye SACCO
Bushenyi Bamugisha Beneficiaries SACCO
Bushenyi Distrct Older Persons SACCO
Kitabi SACCO
Buhimba SACCO

76
SACCO NAME NUMBER OF CLIENTS SHARE CAPITAL
Kyabugimbi Peoples
Kyeizooba Peoples
Greater Bushenyi Teachers
Bumbaire Peoples
Kyamuhunga Peoples
Jubilee SACCO
Bitooma SACCO
Bushenyi Development
Bushenyi Development Finance Trust
Nyabubare
Kajunju Abahambani
Igara SACCO (Nyaru)
Kateramo
Kakanju Sub County
Kabaare
Bwera Development
Butuuro
Ruharo Heifer Project
Nyanga
Asasurude
Kizinda Universal
Ishaka Farmers
Kambuzi
Ruhumuro Tukore
Bushenyi United SACCO
Bitooma Abamwe SACCO
Bushenyi Taxi Owners & Drivers SACCO
Kyamuhunga Jubilee SACCO
Bushenyi Development Ishaka SACCO
Nyakabirizi Peoples SACCO
Kyamuhunga Abamwe SACCO
BAMPS SACCO
Nyabwera SACCO
Tukore Peoples Kigoma SACCO
Kyakabizi Twimukye SACCO
Kyeigombe Farmers SACCO
Bucetta SACCO
Bethel SACCO
Mwije Tweyombekye Nkanga SACCO
Ruhumuro SACCO
Nyabwera SACCO
Abamwe Entrepreneurs Financial Services SACCO
Mashonga Traders & Farmers SACCO
Abeheireyo SACCO

77
SACCO NAME NUMBER OF CLIENTS SHARE CAPITAL
Ishaka General Traders SACCO
Bushenyi Karibu SACCO
Kyabugimbi Development SACCO
Ankole Young Farmers SACCO
Rushinya SACCO
Kyeitembe Development SACCO
Bushenyi Local Government Staff SACCO
Igara - Buhweju Tea Farmers SACCO
Bushenyi - Ishaka Traders SACCO
Aba - Nyabubare Farmers SACCO
Greater Bushenyi Farmers SACCO
Rwenjeru Nyekundiire SACCO
Source: District Commercial office
Dairy Farmers’ Cooperative Societies/Unions operating in Bushenyi District Local Government
Bumbaire Dairy Coop S.Ltd
Kashozi Dairy Coop S.Ltd
Kyabugimbi Dairy Coop S. Ltd
Numba Dairy Coop S. Ltd
Rwentuha Dairy Coop S. Ltd
Bushenyi Dairy Industry Coop Union Ltd
Source: District Commercial office
Service Cooperative Societies
S/No Name Sub County Total Membership
1. Bumbaire Banana Farmers Coop Bumbaire 420
2 Kyeizooba Banana Farmers Coop Kyeizooba
3 Kakanju Banana Farmers Coop Kakanju
4 Kyamuhunga Tooke Farmers Coop Kyamuhunga
6 Nyabubare Banana Farmers Coop Nyabubare
Transporters Cooperative Societies
S/No Name Sub County Total Membership
1 Bushenyi Taxi Owners and Drivers Coop Soc Ltd
Ishaka Division 125
2 Bushenyi United Taxi Drivers Coop Soc Ltd Ishaka Division 86
3 Bushenyi Taxi Operators Cooperative Union Ishaka Division 3
Bushenyi Friends Taxi Owners, Drivers and Conductors
Ishaka Division 41

78
Coffee Farmers’ Cooperative Societies/Unions operating in Bushenyi District
Cooperative Socienty/Union Cooperative Socienty/Union
1. Bitooma Coffee Growers
2. Bugarama G. Coop Soc Ltd
3. Bumbaire Abategaya G.C.S Ltd
4. Buyanja Teeraho G.C.S.Ltd
5. Buyanja Tukore Growers
6. Bwera G. C. S Ltd
7. Ishaka Western Coffee C. S Ltd
8. Kabaare Kwekundira G. C. S Ltd
9. Kabura Kwekuza Coop S. Ltd
10. Kacwamba Tukore
11. Kainamo Abataremwa G.C Ltd
12. Kajunju Abahambani G.C. S.Ltd
13. Kakanju Cooperative Society Ltd
14. Karaaro Ensya G.C.S.Ltd
15. Kashenyi Cooperative Society Ltd
16. Kibaare G. C. S Ltd
17. Kibingo G.C.Ltd
18. Kitagata Kweterana G.C.Soc
1. Kitojo Tumanyane Coffee Growers Coop
2. Kitwe Kwerondera G.C
3. Kyandago Farmers Multipurpose Coop Soc Ltd
4. Kyentobo Ogwine Kinegyeza G. C.S Ltd
5. Nkanga G.C.S. Ltd
6. Nombe Kwekundira Cooperative Society Ltd
7. Numba Mirembe Cooperative Society Ltd
8. Nyabubare ACE
9. Nyabubare G.C
10. Nyakasharara Cooperative S. Ltd
11. Nyanga Tweterane Coop
12. Nyibingo G.C.S Ltd
13. Ruhandagazi Growers Cooperative Society Ltd
14. Ruharo Bahingi Cooperative Society Ltd
15. Ruhumuro G.C.S Ltd
16. Runyinya Growers Cooperative Soc
17. Rutooma Kerinda G.C.S.Ltd
18. Rwebijunjure G.C.S.Ltd
Source: District Commercial office
Industrial and Market Establishments in Bushenyi District
Sno Industrial Establishment Location
Grain Mills
1. Susie Millers Central Division - Bushenyi /Ishaka M.C
2. Bumbaire Combined Central Division - Bushenyi /Ishaka M.C
3. Kyeitembe Mill Central Division - Bushenyi /Ishaka M.C
4. Bangirana Grain Millers Ishaka Division - Bushenyi /Ishaka M.C
5. Nuwamanya Edson Grain Millers Ishaka Division - Bushenyi /Ishaka M.C
6. Kiyaga Maize Millers Ishaka Division - Bushenyi /Ishaka M.C
7. Margharita Millers Ishaka Division - Bushenyi /Ishaka M.C

79
Sno Industrial Establishment Location
8. Katungu Milling Machine Ishaka Division - Bushenyi /Ishaka M.C
9. Kizinda Millers Kizinda T.C - Nyabubaare Sub County
10. St Kagwa Parish Mill Central Division - Bushenyi /Ishaka M.C
11. Rwentuha Millers Rwentuha – Kyeizooba Sub county
12. Bugarama Coop Grain Mill Kyabugimbi T.C – Kyabugimbi Sub County
13. St Mary’s Kyamuhunga Parish
Mill
Kyamuhunga T.C – Kyamuhunga Sub County
14. Bibi Maize Butare T.C – Kyamuhunga Sub County
15. Karemera Maize Mill Mashonga T.C ,Kyamuhunga Sub County
16. Bishoni Maize Mill Nyakabirizi ,Nyakabirizi Div- Bushenyi /Ishaka
MC
17. Nyabiyanga Mil3l Kyeizooba Sub County
18. Mwengura Mill Kyeizooba Sub County
19. Ruhumuro Mill Ruhumuro Sub County
20. Ruhumuro 2 Mill Ruhumuro Sub County
21. Kabushaho Mill Bumbaire Sub County
22. Katonya Mill Bumbaire Sub County
23. Nyandozo Mill Bumbaire Sub County
24. Kainamo Mill Bumbaire Sub County
25. Kitabi Mill Ibaare Sub County
26. Kakanju 4Mills Kakanju Sub County
COFFE Factories
1 Nuwabaine Coffee factory Ishaka Division- Bushenyi /Ishaka M.C
2 Karobwa Coffee factory Ishaka Division- Bushenyi /Ishaka M.C
3 Rwangoga C.F Ishaka Division- Bushenyi /Ishaka M.C
4 Bushenyi C.F Ishaka Division- Bushenyi /Ishaka M.C
5 New Ishaka C.F Ishaka Division- Bushenyi /Ishaka M.C
6 Ankole C.F Ishaka Division- Bushenyi /Ishaka M.C
7 Igara Coffee Factory Ishaka Division- Bushenyi /Ishaka M.C
8 Gomba Coffee factory Ishaka Division- Bushenyi /Ishaka M.C
9 Ankole COffee Factory Ishaka Division- Bushenyi /Ishaka M.C
10 Abamwe Coffee Factory Ishaka Division- Bushenyi /Ishaka M.C
11 Modern Coffee Factory Ishaka Division- Bushenyi /Ishaka M.C
12 Nizikokoroma Coffee Factory Ishaka Division- Bushenyi /Ishaka M.C
13 Igara Coffee Factory 11 Ishaka Division- Bushenyi /Ishaka M.C
14 Bahame Coffee Factory Ishaka Division- Bushenyi /Ishaka M.C

80
Sno Industrial Establishment Location
15 Banyankole COffee Factory Ishaka Division- Bushenyi /Ishaka M.C
16 Ishaka Western Coffee Factory Ishaka Division- Bushenyi /Ishaka M.C
17 Bushenyi Coffee F (ACPCU Central Division
18 Bushenyi Coffee F(BKCU) Central Division
19 Yorokamu Twinomugisha CF Kyabugimbi T.C – Kyabugimbi Sub County
20 Abel Coffee Factory Kyabugimbi T.C – Kyabugimbi Sub County
21 Kajunju Abahambani C Factory Kyabugimbi Sub County
22 Ngarama Coffee Factory Kyabugimbi Sub County
23 Mbaine C Factory Kyabugimbi Sub County
24 Bumbaire Combined C. Factory Central Division
25 Timbasa Coffee Factory Bitooma Sub County
26 Bitooma CF Patrick Bitooma Sub County
27 Leuben Twinamatsiko Factory Bitooma Sub County
28 Mujungu Alex County C.F Bitooma Sub County
29 Esau Coffee Factory Bitooma Sub County
30 Amon Coffee Factory Bitooma Sub County
31 Nyakiborera Coffee Factory Kyeigombe – Kyabugimbi Sub County
32 CAAIP Bitooma Coffee Factory Bitooma Sub County
33 CAIIP Ibaare Coffee Factory Ibaare Sub County
34 CAIIP Ruhumuro Coffee F Ruhumuro Sub County
35 Ishaka Western 11 Ruhumuro Ruhumuro Sub County
36 Bumbaire Coffee Factory Bumbaire Sub County
37 Numba Coffee F (Mugisha) Bumbaire Sub County
Wine Processing
1 Valley Wines Central Division - Bushenyi /Ishaka M.C
2 Tida Wines Nkanga - Nyabubaare Sub County
3 Gala Wines Kashenyi -Ishaka Division - Bushenyi /Ishaka
M.C
4 Bishoni Wines Nyakabirizi - Nyakabirizi Division
5 Nyabubare ACE Wines Nyabubare Sub County
6 Kkans Wines Devpt Assoc Nyabubare Sub County
7 Casian Wines Ishaka Division
8 Zambulsco Wines Nyabubare Sub County
9 Canid Wines Nyabubare Sub County
10 Perfect Wine Bumbaire Sub County
11 Other 42 groups
Honey Processing
1 Bushenyi Connoisseur Coop Nyakabirizi - Nyakabirizi Division
2 Bushenyi Farmer & Bee Keep Butare T.C - Kyamuhunga Sub county
3 Nyabubaare ACE Kizinda – Nyabubaare Sub county
4 Kyabugimbi ACE Kyabugimbi T.C – Kyabugimbi Sub County
5 Bena Central Division
6 Patrick Honey Packers Bitooma Sub County
7 Swazi Beekeepers Coop Mashonga
8 Nyarugote Coop Nyabubare Sub County
Tea Processing & Packing
1 Igara Growers Tea Factory Butare T.C - Kyamuhunga Town Council
2 Mc Leod Russel ‘U’ Ltd Mashonga T.C - Kyamuhunga Town Council
3 Kyamuhunga Tea Company Kyamuhunga - Kyamuhunga Town Council
4 Swazi Highland Tea Co Butare – Kyamuhunga Town Council

81
Sno Industrial Establishment Location
5 Global Village Tea Factory
Butare – Kyamuhunga Town Council
Dairy Processing
1 Buhangwa Adam
Dairies(Yoghurt)
Kizinda – Ishaka Division
2 Kazi Fresh Yoghurt Kyamuhunga Sub County
Juice Processing & Packing
1 Tropical Fruits Ltd (Kanu) Rweibare, Central Division - Bushenyi /Ishaka
M.C
Health Supplements
1 Jumol Industries Nyakabirizi, Nyakabirizi Division, B/I MC
Bakeries / Pastries
1 Glorina Bakery Central Division - Bushenyi /Ishaka M.C
2 JB Bakery Ishaka Division - Bushenyi /Ishaka M.C
3 Rwenzori Bakery Kyamuhunga Sub County
4 Bena Bakery Central Division - Bushenyi /Ishaka M.C
5 Kamukama Bakery Central Division - Bushenyi /Ishaka M.C
6 P & N Company Central Division - Bushenyi /Ishaka M.C
Matooke Products
1 PIBID Central Division – Bushenyi – Ishaka MC
Processed Porridge
1 Yestec (U) Ltd Central Division – Bushenyi – Ishaka MC
MARKETS IN BUSHENYI DISTRICT
SN
O Market Location
1 Bitooma weekly Market Bitooma Sub county
2 Bumbaire monthly market Bumbaire Subcounty
3 Bumbaire weekly market Bumbaire Subcounty
4 Kashenyi monthly market Ibaare Sub county
5 Rushinya weekly market Kakanju Subcounty
6 Akashanda monthly and weekly market
Kakanju Subcounty
7 Kyabugimbi monthly market Kyabugimbi Subcounty
8 Kitagata weekly market Kyeizooba Subcounty
9 Kizinda Monthly market Kizinda TC
10 Kizinda matooke market Kizinda TC
11 Rwentuha Daily Market Rwentuha TC
12 Rwentuha weekily Market Rwentuha TC
13 Ekikoreijo weekily market Ruhumuro Subcounty
14 Butare Daily Market Kyamuhunga TC
15 Kitojo Weekily Kakanju Subcounty
16 Kyamatsira weekily Market Kakanju
17
Kyanyakatura Weekily matooke Market
Kizinda TC

82
Appendix 1: Number of villages per Parish and Sub County as at 03/9/2020
Appendix 1: Number of villages per S/County & parish in Bushenyi District
Sn Constituency sn Sub County /TC Name No. of Parishes No. of Villages
1 Igara West 5. Bitooma TC 6 36
6. Kyamuhunga S/C 7 53
7. Kyamuhunga TC 3 23
8. Kakanju S/C 5 49
8. Nyabubare S/C 3 38
9. Kizinda T/C 3 25
10. Nkanga S/C 4 17
Sub Total 7 31 241
2 Igara East 8. Ibaare Sub County 4 32
9. Bumbaire Sub County 4 51
10. Kyeizooba Sub County 5 53
11. Rwentuha Town Council 3 27
12. Kyabugimbi Sub County 3 26
13. Kyabugimbi Town Council 2 27
14. Ruhumuro Sub County 4 32
Sub Total 7 25 248
Total [1+2] above 14 56 489
3 Bushenyi Municipal Council
[BMC]
4. Central Division 6 31
5. Ishaka Division 5 20
6. Nyakabirizi Division 5 27
Sub Total 3 16 78
Total Bushenyi District
[1+2+3]
17 72 567
Source: District Planning Department
Summary of Bushenyi District and Municipal Council by Division, Town Council and Sub County
BUSHENYI DISTRICT ADMINISTRATIVE UNITS AS OF 13/08/2020
County Sub county/ Division Parish
Bushenyi-Ishaka Municipal
Council
Central Division Bunyarigi Ward
Central Ward
Kyeitembe
Ruharo
Ryamabengwa Ward
Ward II
Ishaka Division Buramba
Kashenyi
Town Ward
Ward III
Ward IV
Nyakabirizi Division Kibaare
Mazinga
Rwenjeru Ward
Ward I
Ntungamo
Igara west Bitooma TC Bitooma

83
BUSHENYI DISTRICT ADMINISTRATIVE UNITS AS OF 13/08/2020
County Sub county/ Division Parish
Kakiira
Kashambya
Kimuri
Ngorora
Nyanga
Kyamuhunga S/C Kabingo
Kakoni
Kibazi
Kyamuhunga
Mashonga
Nshumi
Swazi
Kyamuhunga TC Butare
Kyamuhunga Ward
Mashonga
Kakanju Kakanju
Kabaare
Katunga
Kitojo
Rushinya
Nyabubare s/c Kahungye
Nyabubare
Nyarugoote
Kizinda TC Kigoma Ward
Central Ward
Kizinda Ward
Nkanga Birimbi
Kanyegyero
Kabande
Nyamirembe
Igara East Ibaare Ibaare
Kainamo
Kyamugabo
Ryeishe
Bumbaire Bumbaire
Kibaare
Kiyaga
Numba
Kyeizooba
Buyanja
Bwera
Kararo
Kitagata
Nyamiyaga
Kitwe
Rwentuha TC Kitwe
Rutooma
Rwentuha Ward
Kyabugimbi Bijengye

84
BUSHENYI DISTRICT ADMINISTRATIVE UNITS AS OF 13/08/2020
County Sub county/ Division Parish
Kajunju
Kyeigombe
Kyeigombe
Kyabugimbi TC Katikamwe
Kitwe
Ruhumuro Bugaara
Burungira
Nyeibingo
Ruhumuro
3 17 73
Bushenyi-Ishaka Municipal Council
Municipality Sub County Parish/Ward No. of villages
Bushenyi-
Ishaka
Municipal
Council
Central Division Bunyarigi Ward 6
Central Ward 2
Kyeitembe 3
Ruharo 10
Ryamabengwa Ward 6
Ward II 4
Sub Total 31
Ishaka Division Buramba 5
Kashenyi 8
Town Ward 2
Ward III 2
Ward IV 3
Sub Total 20
Nyakabirizi Division Kibaare 4
Mazinga 8
Rwenjeru Ward 8
Ward I 3
Ntungamo 4
Sub Total 27
Grand Total 23 78

85
Appendix 2: No. of Sub Counties/TCs, No. of parishes and villages by constituency as of 31/08/2020
Appendix 3: Total Population by Sex, and by Year
The population development of Bushenyi as well as related information and services
Name Status
Population
Census
1991-01-12
Population
Census
2002-09-13
Population
Census
2014-08-27
Population
Projection
2020-07-01
Bushenyi District 160,982 205,671 234,443 248,300
Area: 905 km² – Density: 274.3/km² [2020] – Change: +0.99%/year [2014 → 2020]
Bushenyi District:
Source: District planning department
Explanation: Districts as operational in mid-2019. Area figures of districts are derived from spatial data. The urban figures refer
to municipalities and towns as defined in 2019. The 2020 projection does not consider the population increase by refugees from
neighboring districts.
Further information about the population structure:
Males Females 49.2% 50.8%
Gender Persons
Males 122,200
Females 126,100
Gender (P 2020)
Males 122,200
Females 126,100
Urbanization (P 2020) Rural183,100 Urban 65,200
Gender (P 2020)
Males 122,200
Females 126,100
Rural 73.7% Urban 26.3%
Rural 183,100
Urban 65,200
Sn County /Constituency No of S/Counties / TCs/ Divisions
No. of parishes No. of villages
1. Igara East Constituency [Less SMC] 7 26 249
2. Igara West Constituency [Less SMC] 7 31 244
3. Bushenyi Municipal Council [Constituency] 3 16 78
Grand Total 17 72 571

86
Urbanization (P 2020)
Rural 183,100
Urban 65,200
Urban 26.3%
Rural 73.7%
Appendix 4: The poor, insecure non-poor and middle class in each region of Uganda, 1992-2012
[A] Central Region [B] Eastern Region
FY Poor Insecure Non
Poor
Middle
Class
FY Poor Insecure
Non Poor
Middle
Class
1992/93 45.6 37.0 17.4 1992/93 58.8 33.9 7.3
1999/00 19.8 45.1 35.2 1999/00 34.9 47.9 17.8
2002/03 22.3 42.0 35.7 2002/03 46.0 39.8 14.2
2005/06 16.4 37 46.7 2005/06 35.9 45.5 18.6
2009/10 10.7 34.7 54.6 2009/10 24.7 50.0 25.7
2012/13 4.7 35.2 60.1 2012/13 24.5 54.3 21.2
[C] Northern Region [D] Western Region
FY Poor Insecure Non
Poor
Middle
Class
FY Poor Insecure Non
Poor
Middle
Class
1992/93 73.5 21.6 4.9 1992/93 52.7 38.2 9.1
1999/00 63.7 29.9 6.5 1999/00 26.2 49.3 24.4
2002/03 63.0 30.2 6.9 2002/03 32.9 44.8 22.3
2005/06 60.7 31.1 8.3 2005/06 20.5 45.7 33.8
2009/10 46.2 38.2 15.7 2009/10 21.8 47.5 30.7
2012/13 43.7 37.1 19.3 2012/13 8.7 43.8 47.5
Performance across regions
The results for Uganda's four regions – central, eastern, northern, and western – are presented in the table above. Since
2009/10, poverty has fallen in all regions except the eastern region. The western and central regions have made remarkable
progress and their poverty levels are below the national average.
The western region has experienced the largest decline in poverty over the last 20 years (44 percentage points) from 52.7
percent in 1992/93 to 8.7 percent in 2012/13. In the central, the proportion of people unable to meet their basic needs
declined from 45.6 percent to 4.7 percent over the same period.
The eastern and northern regions continue to lag behind with poverty levels above the national average. Between 1992/93
and 2012/13, absolute poverty in the eastern region declined from 58.8 percent to 24.1 percent, but there was a slight
increase of 0.2 percentage points in this region between 2009/10 and 2012/13, mainly due to an increase in rural poverty.
Although the northern region has significantly reduced its poverty level from 73.5 percent in 1992/93 to 43.7 percent in
2012/13, it remains more than twice the national average. The rapid reduction in poverty in the northern region is reflected
particularly in rural areas.

87
Appendix 5: Percent [%] Population that was Poor, Insecure Non-Poor & Middle class by Region in Uganda in FY 2012/2013
Sub Region Percent [%] Total
Poor Insecure Non- Poor Middle Class
Kampala 0.7 10.1 89.2 100.0
central 1 3.7 32.0 64.4 100.1
Central 2 7.3 47.2 45.5 100.0
South West 7.6 42.8 49.7 100.1
Midwest 9.8 44.9 45.3 100.0
East Central 24.3 50.5 25.2 100.0
Eastern 24.7 56.9 18.4 100.0
Mid North 35.2 41.4 23.2 99.8
West Nile 42.3 40.4 17.3 100.0
North East 74.2 16.4 9.4 100.0 Source: Poverty Status Report 2014, Structural Change and Poverty Reduction in Uganda.
Percent [%] Population that was Poor, Insecure Non-Poor & Middle class by Sub Region in Uganda in FY 2012/2013
Source: Poverty Status Report 2014, Structural Change and Poverty Reduction in Uganda.
0.7
3.7
7.3
7.6
9.8
24.3
24.7
35.2
42.3
74.2
10.1
32.0
47.2
42.8
44.9
50.5
56.9
41.4
40.4
16.4
89.2
64.4
45.5
49.7
45.3
25.2
18.4
23.2
17.3
9.4
0.0 20.0 40.0 60.0 80.0 100.0
Kampala
central 1
Central 2
South West
Mid West
East Central
Eastern
Mid North
West Nile
North East
Percent [%]
Sub
Reg
ion
Percent [%] Middle Class
Percent [%] Insecure Non- Poor
Percent [%] Poor

88
Appendix 6: Bushenyi District Population Variables by Constituency as per 2014 NPHC Bushenyi District, Bushenyi Municipality, Igaara & igaara Constituency Population Census Indicators for 2014 [NPHC] 1: POPULATION
1.1: Population Size Number Percent
Total population 234,443
Total male population 114,207 48.7
Total female population 120,236 51.3
Sex ratio (males per 100 females) 95.0
1.2: Households
Number Percent
Total households 51,370
Households headed by males 39,628 77.1
Households headed by females 11,742 22.9
Households headed by children (aged 10-17) 162 0.3
Households headed by youth (aged 18-30) 11,954 23.3
Households headed by older persons (aged 60 and above ) 9,451 18.4
1.3: Population by Age groups
Number
Percent
Population aged 0-17 years 117,458 51.3
Population aged 18-30 years 52,481 22.9
Population aged 31-59 years 46,673 20.4
Population aged 60 years and over 12,359 5.4
1.4: Population by Special Age groups Number Percent
Population aged Less than one Year 5,962 2.6
Population aged 0-4 Years 34,175 14.9
Population aged 0-8 Years 61,306 26.8
Population aged 2-8 Years 48,889 21.4
Population aged 2-17 Years 105,041 45.9
Population aged 6-12 Years 46,002 20.1
Population aged 6-15 Years 64,480 28.2
Population aged 10-15 Years 38,030 16.6
Population aged 10-17 Years 49,812 21.8
Population aged 15-24 Years 49,722 21.7
Population aged 16-64 Years 114,321 49.9
Population aged 15-29 Years 66,287 28.9
Population aged 2 Years and Over 216,554 94.6
Population aged 10 Years and Over 161,325 70.5
Population aged 15 Years and Over 128,983 56.3
Population aged 18 Years and Over 111,513 48.7
Population aged 20 Years and Over 100,427 43.9
Population aged 65 Years and over 8,974 3.9
National Population and Housing Census 2014 Area Specific Profiles – Bushenyi District

89
2: EDUCATION 2.1: Non School attendance Of Number Percent
Persons aged 6-15 not attending school 4,616 7.2
Males aged 6-15 not attending school 2,613 8.0
Females aged 6-15 not attending school 2,003 6.3
2.2: Persons Attending Primary School Number Percent
Persons aged 6-12 attending primary school 40,536 88.1
Males aged 6-12 attending primary school 20,575 87.4
Females aged 6-12 attending primary school 19,961 88.8
2.3: Persons Attending Secondary school Number Percent
Persons aged 13-18 attending secondary school 14,957 41.1
Males aged 13-18 attending secondary school 6,660 37.3
Females aged 13-18 attending secondary school 8,297 44.7
2.4: Persons Not in School and Highest Level Completed is below S.4 Number Percent
Persons aged 15 and above whose highest level of education completed is below S.4
67,800 78.0
Males aged 15 and above whose highest level of education completed is below S.4
32,322 76.9
Females aged 15 and above whose highest level of education completed is below S.4
35,478 79.1
2.5: Persons Not in School and Highest Level Completed is “O” Level Number Percent
Persons aged 18 and above whose highest level of education completed is "O" level (S.4)
7,996 7.2
Males aged 18 and above whose highest level of education completed is "O" level (S.4)
3,831 7.5
Females aged 18 and above whose highest level of education completed is "O" level (S.4)
4,165 6.9
2.6: Persons Not in School and Highest Level Completed is “A” Level Number Percent
Persons aged 20 and above whose highest level of education completed is "A" level (S.6)
1,770 1.8
Males aged 20 and above whose highest level of education completed is "A" level (S.6)
1,184 2.6
Females aged 20 and above whose highest level of education completed is "A" level (S.6)
586 1.1
LLITERACY STATUS
3.1: Persons aged 18 years and above Number Percent
Persons aged 18 years and above who are illiterate 21,997 19.7
Males aged 18 years and above who are illiterate 7,585 14.8
Females aged 18 years and above who are illiterate 14,412 23.9
3.2: Other age groups Number Percent
Persons aged 10-17 years who are illiterate 6,023 12.1
Persons aged 18-30 years who are illiterate 4,315 8.2
Persons aged 60 years and above who are illiterate 7,315 59.2
OWNERSHIP OF A BIRTH CERTIFICATE
4.1: Children with Birth Certificates Number Percent
Children less than 1 year who have a Birth Certificate 1,634 27.4
Children less than 5 years who have a Birth Certificate 9,446 27.6
Children 0-8 years who have a Birth Certificate 16,525 27.0
Children 0-17 years who have a Birth Certificate 29,327 26.2

79
Appendix 7: District Performancein Health related issues
District Performance in Health related issues
Survey Year: 2020 Region: South Western
Indicator
% Regiona
l District
Performance
Buhwej
u Bushenyi
Ibanda
Isingiro
Kabale
Kanungu
Kazo
Kisoro
Mbarara
Mitoma
Ntungamo
Rubanda
Rubirizi
Rukiga
Rukungi
ri
Rwampar
a
Sheema
HIV COUNSELING AND TESTING (HCT)
Percentage of individuals who know two or more benefits of HCT
80.33 82.3
2 82.46 84.8
78.47
67.6 92.44 79.3
72.93
77.94
82.63 75.6 84.1 85 83 83.8 72.1 82.12
Percentage of individuals who were counseled and received an HIV test in last 12 months and know their results.
52.48 55.3
2 53.42
42.32
49.91
51.18
57.52 45.7
51.53
57.71
47.63 50.1 52.4 63 52 54 59.9 50.55
Percentage of mothers of children 0-11 months who were counseled and received an HIV test during the last pregnancy and know their results.
93.48 91.6
7 92.63
93.86
96.24
92.63
97.89 84.2
94.74
97.74
94.74 86.8 94 95 93 89.5 95.8 96.52

80
Percentage of mothers of children 0-11 months who were tested for HIV and received their results as couple
48.9 75 46.32 44.7
4 62.4
1 52.6
3 60 39
63.16
33.08
29.47 40.4 52.6 58 52 40 52.1 32.17
Percentage of individuals who were tested for HIV and received their results and disclosed to their spouse/partner in the last 12 months
30.55 37.4 32.37 24.7
8 29.2
7 28.8
7 34.3
29.2
31.22
28.76
27.11 28 30.5 39 25 30.8 37.8 28.88
Percentage of individuals testing more than once for HIV in the last 12 months
47.89 48.3
6 46.34
43.15
46.84
51.02
54.34 49.4
45.34
56.96
46.45 41.7 40.6 51 52 50.5 43.7 46.22
Percentage of women and men aged 15-49 who report discriminatory attitudes towards people living with HIV
1.63 2.34 3.68 0.88 0 0.52 0.79 0.78
2.62 3.2 1.05 2.63 0.94 0.8 2.6 2.63 1.56 0.88
Pecentage testing only once for HIV in the last 12 months
52.11 51.6
4 53.66
56.85
53.16
48.98
45.66 50.6
54.66
43.04
53.55 58.3 59.4 49 48 49.5 56.3 53.78
PREVENTION OF MOTHER TO CHILD TRANSMISSION OF HIV (PMTCT)
Percentage of individuals who know how HIV transmission occur from an infected mother to the child
19.84 20.8 35.09 15.5 15.2
7 7.18 30.05
17.8
18.05
16.29
18.6 19 21.3 34 19 20.2 17.5 16.86

81
Percentage of individuals who know at least 2 key actions that reduce MTCT of HIV
58.09 55.9
8 68.07
58.19
51.06
48.51
70.65 53.3
53.57
55.01
62.98 47.9 61.2 66 62 64.3 58.5 56.4
Percentage of mothers of children 0-11 months who were counseled for PMTCT services during last pregnancy
74.7 75 75.79 66.6
7 75.1
9 63.1
6 80 59
71.05
86.47
69.47 72.8 79.7 81 84 74.7 77.1 73.91
HIV KNOWLEDGE AND SEXUAL BEHAVIOR
Percentage of individuals who both correctly identify at least two ways of preventing the sexual transmission of HIV and reject major misconceptions about HIV transmission
43.48 52.1
8 52 40
43.09
29.41
45.99 38.5
36.54
47.37
41.05 41.5 42.1 41 53 49.9 45.2 42.31
Percentage that knows at least two benefits of viral load testing
13.68 14.1
2 19.85 9.4
16.42
4.65 17.59 13.9
7.12 14.1
8 13.53 10 16.4 24 14 12.3 10.3 14.98
Percentage of individuals who had sex with more than one sexual partner in the last 12 months
18.46 14.9
2 23.16
20.42
20.36
6.32 21.27 18.6
8.37 16.8
4 14.49 19.5 9.82 29 19 17.6 28.2 23.13
Percentage of individuals who had sexual intercourse with a non marital or non cohabiting sexual
33.08 40.3
2 37.37
32.08
33.21
17.89
35.75 39.7
27.91
36.84
23.83 33.5 22.9 42 38 29.7 35.7 32.46

82
partner in the last 12 months
Percentage of individuals who had sexual intercourse with a non marital or non cohabiting sexual partner in last 12 months and used a condom at last higher risk sex
63.21 49 74.65 62.3
4 73.1
2 58.8
2 58.23
54.3
50 58.1 64.71 70.3 57.1 74 57 61 72.2 73.56
Percentage of youth 15-24 years who perceive low or no risk of getting HIV/AIDS infection
52.94 35.7
5 52.11
56.58
39.85
68.59
50.26 74.9
70.61
43.23
59.47 49.3 48.7 53 56 56.3 51.6 42.98
Percentage of Youth 15-24 years who have had sexual intercourse before the age of 15
2.76 0.52 3.16 1.75 1.88 3.14 2.65 2.62
1.32 3.38 4.21 3.06 4.12 2.6 1.6 5.26 2.08 3.51
Percentage of male youths 15-24 yrs who are circumcised
46.06 21.0
5 52.69 38.6
57.14
34.02
55.79 27.7
53.1 54.1
4 35.79 42 36.8 85 48 50.5 40.9 46.09
Percentage of adults aged 15-49 who had more than one sexual partner in the past 12 months who report the use of a condom during their last intercourse
48.7 32 59.15 54.5
5 60.2
2 38.2
4 46.84
41.5
30 40.9
5 50.98 59.5 41.3 61 30 52.5 58.9 59.77

83
SEXUALLY TRANSMITTED INFECTIONS
Percentage of individuals who correctly identify at least two common signs/symptoms of STIs in Men
51.3 57.5
9 59.58
52.63
45.35
26.89
59.28 50.8
37.06
57.44
55.58 42.9 61.2 57 48 58.5 52.1 50.17
Percentage of individuals who correctly identify at least two common signs/symptoms of STIs in Women
62.12 74.8
4 74.74
58.42
52.85
40.97
71.94 52.5
47.55
68.87
67.16 54.6 70.1 69 67 64.2 62.3 62.24
Percentage of individuals who know two or more actions to take when she/he has a sexually transmitted infection.
44.5 47.8
2 48.42
39.82
38.44
19.75
61.6 35.8
36.71
53.38
50.32 39.6 52.3 55 48 48.8 37.1 43.53
Percentage of adults 15-54 years who had a urethral discharge in the past 12 months
8.56 8.83 6.58 8.55 13.3
2 6.56 9.23
8.36
2.84 12.0
3 9.21 4.16 6.39 15 7.6 7.11 5.99 12.69
Percentage of adults 15-54 years who had a genital ulcer in the past 12 months
9.15 9.87 6.05 9.87 13.3
2 5.77 6.07
9.4
5.02 12.9
7 15.26 6.35 5.45 17 7.1 6.58 6.77 11.6

84
TUBERCULOSIS
Percentage of individuals who know that TB is a curable disease
77.71 74.5
5 81.05
77.19
80.3 74.0
2 74.41
73.9
77.95
79.51
79.21 72.2 79.7 79 85 76.3 76.6 78.56
Percentage of individuals who know at least two signs or symptoms of TB
63.72 72.4
7 73.42
59.43
57.6 42.7
8 72.56
52.2
53.06
70.3 64.47 58.4 68.8 78 68 70 60.7 63.02
Percentage of individuals who know how TB is transmitted
90.13 97.9
2 95.79
88.82
90.06
78.22
86.28 92.2
88.86
92.29
90.79 86.7 91.4 95 92 88.4 87 90.59
Percentage of individuals who know the risk of not completing TB treatment.
94.76 97.9
2 97.89
94.08
92.68
95.28
95.78 94.8
94.1 96.9
9 97.11 86 96.6 97 93 94.2 91.9 96.06
Percentage of households with at least one member who has heard persistent dry cough lasting more than two weeks
9.51 9.35 10 8.77 13.8
8 8.92 8.18
6.01
4.37 12.7
8 7.11 6.35 15.4 14 8.9 6.58 5.21 11.82
MALARIA
Percentage of children 0-23 months who had fever in the two weeks preceding the survey and received treatment with ACTs within 24 hours of onset of fever
47.46 60 58.82 41.9
4 26.4
2 40 43.33 50 56
67.86
51.85 68 23.5 45 50 59.3 58.3 50

85
Percentage of mothers of children 0-23 months who received two or more doses of IPTp during their last pregnancy
75.92 80.8
5 85.28 74
71.05
64.43
83.33 75 65.8 87.8
4 87.35 71.8 69.6 80 72 78.4 67.9 77.23
Percentage of children 0-59 months who slept under an ITN the night preceding the survey
77.08 73.9
6 72.63
67.54
71.68
88.07
76.57 66.6
78.43
85.96
85.26 76 83.7 72 77 74.7 72.6 84.3
Percentage of mothers of children 0-59 months who always slept under an ITN during last pregnancy
83 80.5
6 74.39
81.87
78.2 92.2
8 84.27
81.2
81.05
89.47
90.53 80.7 87.7 76 79 82.5 77.8 90.99
Percentage of Mothers of children 0-59 months who know 2 or more ways to prevent Malaria
47.54 49.6
5 53.33
44.74
38.1 30.8
8 58.74
28.2
49.56
47.12
51.58 42.7 59.9 44 55 53.3 41 58.43
Percentage of Mothers of Children 0-59 months who know 2 or more signs or symptoms of Malaria
65.55 71.1
8 76.84
51.46
71.93
43.86
82.17 50.2
60.35
59.4 78.95 61.7 68.9 73 72 68.4 56.3 70.06
Percentage of Mothers of Children 0-59 months who know how malaria is
95.78 96.8
8 97.19
97.37
97.99
90.88
96.5 96.2
89.5 96.2
4 98.95 94.2 93.2 98 96 94.7 97.6 97.67

86
transmitted
Percentage of Households with at least 1 LLIN
90.19 82.6
4 93.68
86.84
81.45
94.74
88.46 80.5
91.84
94.24
92.28 89.2 95.5 93 95 89.5 91 93.6
Percentage of pregnant women who slept in a dwelling in which the interior walls have been sprayed against mosquitoes (IRS) in the past 12 months
14.62 19.4
4 22.11 5.26
15.04
10.53
10.84 4.88
18.66
14.29
13.33 13.2 16 18 23 19.3 10.1 15.41
Percentage of pregnant women who slept in the ITN the previous night
85.11 81.5
8 91.67 80
86.05
96.3 75.76 67.5
83.72
94.59
89.66 86.1 97.1 84 94 82.9 76.9 85.37
REPRODUCTIVE HEALTH
Percentage of currently married women aged 15-49 years who are using any family planning method.
46.37 49.4 49 48.6 40.2
9 47.0
8 48.31 38
23.05
52.5 43.08 47.2 46.6 52 56 49 49 54.58
Percentage of sexually active women age 15-49 years who are using any modern method of family planning.
39.5 42.0
1 40.7
42.98
33.83
40.35
42.31 32.4
20.35
40.6 36.49 40.6 43 43 46 43 44.1 42.49

87
Percentage of mothers of children 0-11 months who attended ANC at least 4 times during last pregnancy
75.36 69.7
9 80
75.44
82.71
70.53
85.26 72.6
60.53
75.19
80 66.7 69.9 82 77 87.4 70.8 78.26
Percentage of mothers of children 0-11 months who delivered their last baby in a health facility
88.62 88.5
4 94.74
89.47
88.72
87.37
93.68 82.1
87.72
87.97
90.53 87.7 86.5 84 94 91.6 83.3 89.57
Percentage of mothers of children 0-11 months who were assisted by a skilled health worker during last delivery
88.84 88.5
4 93.68
91.23
87.97
86.32
93.68 81.1
91.23
88.72
90.53 87.7 86.5 85 95 91.6 82.3 89.57
Percentage of women 15-49 years who desire to use a family planning method in the last 12 months but cannot access it.
6.46 5.71 3.2 9.09 4.91 6.02 5.59 8.42
4.6 7.78 5.08 2.1 7.8 4.6 4.4 5.04 12.4 10.22
Percentage of pregnant women attending first ANC within the first trimester
54.03 58.3
3 63.16
59.65
60.15
51.58
53.68 54.7
49.12
57.89
51.58 39.5 48.9 50 61 52.6 46.9 59.13

88
Percentage of women who heard about family planning information on mass media in the past three months
44.19 43.7
8 41.36
38.38
35.9 50.6
6 51.84 43
45.53
42.86
44.47 40.5 45.7 44 37 41.4 53 54.25
Percentage satisfied with FP services provided at the health facility
73.43 80.9 76.49 76.0
2 60.4 79.3 83.57
65.9
70.26
66.92
75.79 74.6 75.4 81 69 75.1 70.1 74.42
Percentage who know atleast 3 methods of Family Planning
77.89 84.3
8 86.32
89.18
77.69
77.54
85.66 81.9
49.27
70.43
82.81 75.4 82 73 73 79 80.9 80.23
CHILD SURVIVAL
Percentage of children 12-23 months who are fully vaccinated before the first birthday
52.51 37.9
3 55.32
45.45
46.97
60.42
58 38.1
53.33
60.24
52.73 59.6 45.5 59 73 50.9 17.9 53.97
Percentage of children 0-11 months with diarrhea in the last two weeks receiving ORT within 24 hours of on onset of symptoms
20.09 25 20 28.5
7 16
13.04
7.14 8.33
41.67
15.38
41.67 14.3 11.8 14 22 41.7 0 30.77

89
Percentage of children 0-23 months with any of fever, diarrhea or pneumonia seeking care from health workers within 24 hours of illness
30.3 34.4
8 37.5
27.42
36.59
19.61
29.41 35 31.8
2 35.7
1 34.78 41.9 14.9 36 24 34 26.5 24.53
ORPHANS AND OTHER VULNERABLE CHILDREN (OVC)
Percentage of OVC 5-17 years who are currently in school
38.91 31.2
5 30.53
45.61
31.58
45.26
40 46.9
24.56
34.59
54.74 34.8 36.1 42 32 57.9 42.7 39.13
Percentage of OVC 5-17 years who have their basic material needs met
18.1 14.5
8 15.79
16.67
10.53
34.74
14.74 16.7
14.04
11.28
27.37 15.7 21.1 20 18 24.2 13.5 24.35
Percentage of OVC 5-17 years living in a household that receive external support in the past12 months
2.54 2.08 1.05 0.88 3.76 3.16 4.21 0 0 3.01 3.16 1.74 1.5 0 3.1 9.47 1.04 5.22
Percentage of OVC 5-17 years experiencing cases of abuse
13.36 5.21 4.21 11.4 21.0
5 8.42 28.42
9.38
8.77 16.5
4 4.21 11.3 14.3 23 23 11.6 8.33 14.78
Percentage of individuals who know where to report cases of child abuse
51.16 53.1
3 50.53
57.02
42.11
27.37
49.47 43.8
63.16
41.35
70.53 47.8 49.6 59 60 65.3 39.6 53.91

90
Percentage of OVC 5-17 years who have consumed the 3 major food groups the night before the survey or last evening.
20.97 15.6
3 36.84
25.44
21.8 12.6
3 32.63
19.8
20.18
9.77 28.42 22.6 18.1 5.2 21 34.7 8.33 26.96
EDUCATION
Percentage of children 6-12 years who are currently in school
78.4 90.9
1 84.82
80.56
60 79.6
6 80.99 81 80
70.59
84.89 80.5 84.8 66 74 73.8 83.6 80
Percentage of parents/guardians who talked to their children age 6-12 years about HIV/AIDs in the last 12 months
32.3 13.6
4 33.93
39.58
39.43
30.51
37.19 20 26.1
5 30.0
7 33.81 30.5 46.2 29 31 31.8 30.7 32.14
Percentage of parents/guardians who had talked to their children aged 6-12 years in the last 12 months about delaying sex
32.8 14.5
5 32.14
36.11
37.71
32.2 40.5 25.7
27.69
27.45
33.81 33.6 49.1 32 35 33.6 25.7 31.43
NUTRITION
Percentage of children aged 6- 23 months receiving a minimum of acceptable diet.
15.46 11.4
6 26.32
14.04
10.53
3.16 25.26 11.5
13.91
12.03
15.79 14 27.8 5.2 13 24.5 6.25 25.86

91
Percentage of children under 6 months of age who are exclusively breastfed
57.73 47.7
3 50
46.55
51.72
62.79
47.73 61.9
70.77
55.56
48.94 69.4 58.9 65 51 71.1 60.5 58.06
Percentage of children 12-23 months receiving vitamin A supplementation in the last six months
65.88 59.3
8 71.58 61.4
75.19
74.74
60 47.9
46.09
73.68
71.58 51.8 69.2 80 68 67 67.7 72.41
Percentage of households using Iodized salt
92.66 100 91.58 100 97.7
4 89.4
7 95.79
92.7
57.39
99.25
92.63 95.6 85 98 98 98.9 88.5 97.41
Percentage of mothers with children 12-23 months who consumed the 3 major food groups in the last 24 hours
29.43 23.9
6 41.05
27.19
20.3 33.6
8 46.32
28.1
30.43
17.29
38.95 36.8 34.6 11 24 35.1 9.38 43.97
Percentage of mothers of children age 0-11 months who took iron supplementary tablets for at least 90 days during the last pregnancy.
91.82 79.1
7 90.53
91.23
86.47
91.58
98.95 87.4
92.11
95.49
92.63 85.1 95.5 97 94 97.9 93.8 93.04

92
Percentage of mothers of children 0-11 months who received Vitamin A supplementation within 2 months after delivery
43.87 38.5
4 22.11
22.81
54.89
46.32
27.37 42.1
45.61
42.11
57.89 44.7 62.4 45 64 59 36.5 30.43
WATER AND SANITATION
Percentage of individuals who wash their hands with soap after visiting the toilet
72.95 70.0
5 82.89 68.2
76.92
65.26
71.58 65 76.6
4 70.6
8 82.63 59.5 74 75 73 69.7 72.4 85.19
Percentage of households with safe water supply
67.55 70.3
1 57.89
64.91
49.16
93.16
69.47 21.4
78.82
72.93
61.58 68.7 74.2 83 81 79.7 57 65.58
Percentage of households with latrine or toilet
97.68 98.9
6 100
95.91
99 96.1
4 97.54
98.6
98.26
99.75
99.3 96.5 99.5 87 97 99.3 97.6 99.13
Percentage of households with soap and water at a hand washing station commonly used by family members
37.87 48.9
6 49.82
29.82
38.5 23.1
6 43.86
21.6
32.56
47.62
42.81 31 41.7 38 31 34.4 35.8 49.13
Percent of households practicing correct use of ecommended household water treatment technologies
84.19 78.3
9 95.26
75.22
85.55
71.84
81.05 95 72.7
1 85.9 96.32 82.5 82.7 81 87 89.5 78.4 94.99

93
Percent of the population/households using an improved sanitation facility
30.19 31.2
5 51.23
20.47
39.5 15.7
9 23.51
20.9
24.71
56.89
20.7 29 19.1 39 21 14.4 31.9 44.19
GENDER BASED VIOLENCE
Percentage of ever-married or partnered women aged 15-49 who experienced physical or sexual violence from a male intimate partner in the past 12 months
22.44 27.2
7 11.69 12.9
33.66
14.47
27.85 21.1
12.9 22.7
7 16.67 22.5 23 26 27 19.5 28.6 31.87
COMMUNITY GROUPS
Percentage of Individuals who are memebrs of a community saving / farmers group
44.7 39.6
6 46.71
39.69
40.56
42.18
52.76 44.7
37.38
31.48
41.97 42.1 57.3 50 46 48 59.2 44.76
Percentage of mothers who are members of a mother care group / MIYCAN group
13.86 6.25 10.88 11.9
9 13.0
3 5.96 18.53
8.01
15.74
8.27 13.68 18.1 12.8 21 15 19 25 14.53
Source: Health Department

94
Appendix 8: Understanding the Implications for Demographic Developments. (Population Trends: selected indicators)
Indicator Year 1991-01-12 Year 2002-09-13 Year 2014-08--27 Projection 2020
Total population 160,982 205,671 234,443 248,300
0
50,000
100,000
150,000
200,000
250,000
300,000
Year 1991 Year 2002 Year 2014 Projection2020
Total population
160,982
205,671
234,443248,300
Year 1991 Year 2002 Year 2014 Projection 2020
TOTAL POPULATION

95
Contraceptive use in Bushenyi
2016/17 2017/18 2018/19 2019/2020
Women 15-49 who use modern contraception 47.40 33.20
31.20 40.70
Women who desire to use a family planning method but can't access 5.40 9.10
14.00 3.20
52.80
42.30
45.20 43.90
-
5.00
10.00
15.00
20.00
25.00
30.00
35.00
40.00
45.00
50.00
2016/17 2017/18 2018/19 2019/2020
Trends in Contraceptive use in Bushenyi
Women 15-49 who use modern contraception Women who desire to use a family planning method but can't access