Sex-Specific Head Impact Exposure in Rugby - VTechWorks
147
Sex-Specific Head Impact Exposure in Rugby: Measurement Considerations and Relationships to Clinical Outcomes Emily E. Kieffer Dissertation submitted to the faculty of the Virginia Polytechnic Institute and State University in partial fulfillment of the requirements for the degree of Doctor of Philosophy In Biomedical Engineering Steven Rowson, Chair Per Gunnar Brolinson Stefan Duma Joel Stitzel Jillian Urban March 18, 2021 Blacksburg, Virginia Keywords: Concussion, Biomechanics, Kinematics, Female, Symptoms, Gait
-
Upload
khangminh22 -
Category
Documents
-
view
3 -
download
0
Transcript of Sex-Specific Head Impact Exposure in Rugby - VTechWorks

Sex-Specific Head Impact Exposure in Rugby: Measurement Considerations and Relationships to Clinical Outcomes
Emily E. Kieffer
Dissertation submitted to the faculty of the Virginia Polytechnic Institute and State University in
partial fulfillment of the requirements for the degree of
Doctor of Philosophy In
Biomedical Engineering
Steven Rowson, Chair Per Gunnar Brolinson
Stefan Duma Joel Stitzel
Jillian Urban
March 18, 2021 Blacksburg, Virginia
Keywords: Concussion, Biomechanics, Kinematics, Female, Symptoms, Gait
Sex-Specific Head Impact Exposure in Rugby: Measurement Considerations and Relationships to Clinical Outcomes
Emily E. Kieffer
Abstract
Concussions are diffuse injuries that affect areas of the brain responsible for a person’s physical, cognitive,
and emotional health. Although concussions were once thought only to present transient symptoms,
mounting evidence suggests potential for long-term neurological impairments. The deleterious effects of
concussion can be from a single, high severity impact event or the accumulation of lower severity impacts.
Clinical changes that can result from concussion include an elevated symptom presentation and changes in
gait, or an individual’s walking pattern. It is not well understood if similar deficits result after an
accumulation of subconcussive impacts. The majority of research on human tolerance to head injury has
been based on American football, using helmet-mounted sensors in male athletes. Limited studies have
attempted to quantify biomechanical tolerance in women, despite the sex-specific nature of presentation
and outcome of concussion. Biomechanical, physiologic, and psychosocial factors differ between males
and females, likely contributing to this difference.
The research presented in this dissertation was aimed at describing sex-specific outcomes of subconcussion
in a matched cohort of male and female athletes to gain a better sense of unhelmeted, sex-specific tolerance
to head impacts. On-field data were collected from collegiate rugby players using instrumented
mouthguards. Rugby involves high energy, frequent head impacts, does not require protective headgear,
and is played the same for both men and women. The females in our study sustained fewer impacts per
session than the males, but their impacts had similar linear acceleration magnitudes. The kinematics of the
concussive male impacts were higher than the kinematics of the concussive female impacts. Both sexes
reported concussion-like symptoms in the absence of diagnosed concussion during a season. Females
reported more symptoms with a higher severity in-season compared to males after subconcussive and
concussive impacts. Female athletes saw deficits in cadence, double support time, gait speed, and stride
length post-concussion. The majority of athletes improved in their dual-task gait assessment by the end of
the season, suggesting there may not be a negative effect on gait after an accumulation of subconcussive
impacts. This work assessed the biomechanics of head impacts and concussions of this population, and
evaluated changes in symptom presentation through weekly graded symptom surveys and dual-task gait
assessments both after a concussion and as an effect of subconcussive impacts. Understanding the sex-
specific clinical effects of head impacts is critical, and can provide insight into concussion diagnostic,
management, and prevention tools that are appropriate and effective.
Sex-Specific Head Impact Exposure in Rugby: Measurement Considerations and Relationships to Clinical Outcomes
Emily E. Kieffer
General Audience Abstract
Concussions are injuries that affect many areas of the brain, including those responsible for a person’s
physical and emotional health. Although concussions were once thought only to result in short-lived
symptoms, new evidence suggests potential for long-term impairments as well. The harmful effects of
concussion can be from a single, high intensity impact event or the build-up of lower intensity impacts.
Changes that can result from concussion include an elevated symptom presence and changes in gait, or an
individual’s walking pattern. It is not well understood if similar side effects result after an accumulation of
subconcussive impacts, those that are not severe enough to be diagnosed as injuries. The majority of
research on human response to head injury has been based on American football, using helmet-mounted
sensors in male athletes. Limited studies have attempted to quantify concussion tolerance in women, despite
the differences in men and women’s symptoms and recovery time after a concussion. Female’s neck
strength, hormones, and increased honesty in reporting concussion differ from males, likely contributing to
this difference.
The research presented in this dissertation was aimed at describing how sex affects the outcome of
subconcussion in a group of male and female athletes to gain a better sense of unhelmeted, sex-specific
tolerance to head impacts. On-field data were collected from collegiate rugby players using sensor-
embedded mouthguards. Rugby involves high energy, frequent head impacts, does not require protective
headgear, and is played the same by both men and women. The females in our study sustained fewer impacts
per session than the males, but their impacts were similar in magnitude. The males sustained concussions
at higher impact energies than the females did. Both sexes reported concussion-like symptoms in the
absence of diagnosed concussion during a season. Females reported more symptoms with a higher severity
compared to males in general and after a concussion. Female athletes walked more conservatively post-
concussion compared to their initial assessment. The majority of athletes improved their gait by the end of
the season, suggesting there may not be a negative effect on gait after a season of subconcussive impacts.
This work assessed the biomechanics of head impacts and concussions of this population, and evaluated
changes in symptom presentation through weekly symptom surveys and gait assessments both after a
concussion and as an effect of subconcussive impacts. Understanding the sex-specific effects of head
impacts is critical, and can provide insight into concussion diagnostic, management, and prevention tools
that are appropriate and effective.
iv
ACKNOWLEDGEMENTS
First and foremost, I would like to thank my advisor, Dr. Steve Rowson. Thank you for being a positive
role model through your mentorship. I sincerely appreciate your support and encouragement, especially on
the days where nothing seemed to be working. Your reminder of “if it was easy, someone else would have
already done it,” although not always what I wanted to hear, was always right. Thank you for all the
resources and opportunities that you provided to me over the past four years. Without your guidance, this
work would not have been possible and I would not be where I am today. Graduate school has been an
incredibly enriching experience for me and I am so grateful to have had the chance to work with you. How
many students get to say they took a road trip with their advisor to Illinois to collect data at a Monster Truck
rally practice?
Thank you to my committee members, Dr. Stefan Duma, Dr. Per Gunnar Brolinson, Dr. Joel Stitzel, and
Dr. Jill Urban for your time, enthusiasm, and expertise to enhance the scope of this dissertation. To all the
faculty and staff of the School of Biomedical Engineering and Sciences and at The University of Pittsburgh
– I am so honored to have had the opportunity to work with so many talented and passionate individuals.
Thank you to all the labmates, interns, and lab staff that I have overlapped with; the positive environment
we had in the Helmet Lab and the friendships we built made work never feel like work. And when it did,
thank you for your help troubleshooting and laughing at my problems with me. Especially Eamon
Campolettano, for reading mostly everything I wrote, even though I never really made it an option. To my
Virginia Tech friends – thank you for making these some of the best years of my life. Your support along
the way, willingness for adventures, and patience with my countless data collection stories are something I
so appreciate. Thank you for filling these years with so many wonderful memories – I look forward to the
future for many more. Amanda Hashimoto – I could not imagine how different these years would have been
without you as my roommate, thank you for sharing this incredible experience with me. Sabah Rezvani –
thank you for stretching me beyond what I knew and providing comic relief when I needed it. To my Pitt
friends – thank you for your continued friendship throughout the years; I would not have been able to
embark on this journey without the foundation that you helped me build.
And lastly, to my family: I could not have asked to be part of a more loving and supportive family. Mom
and Dad – thank you for teaching me the value of hard work and the pursuit of your passions and fostering
an environment that allowed me to grow into the best version of myself. Ryan and MacKenzie – thank you
for listening to me and letting me teach you, and letting me learn from you along the way. Thank you for
being my biggest fans always. And to Finley, thank you for keeping the last month full of outside breaks
and filling my heart in the process.
v
TABLE OF CONTENTS
LIST OF FIGURES ............................................................................................................................... viii LIST OF TABLES ................................................................................................................................... ix ATTRIBUTION ........................................................................................................................................ x CHAPTER 1: INTRODUCTION ................................................................................................................. 1
Concussions and Clinical Effects .............................................................................................................. 1 Wearable Head Impact Sensors ................................................................................................................ 2 Sex-Specific Differnces in Concussion ..................................................................................................... 3 Epidemiology of Head Injuries in Rugby ................................................................................................. 3 Research Objectives .................................................................................................................................. 4 References ................................................................................................................................................. 5
CHAPTER 2: ON THE USE OF WEARABLE SENSORS TO MEASURE HEAD IMPACTS IN SPORTS ...................................................................................................................................................... 11
Abstract ................................................................................................................................................... 11 Introduction ............................................................................................................................................. 11 Head Impact Sensor User Experiences ................................................................................................... 15 Recommended Best Practices ................................................................................................................. 19 Current Head Impact Sensor Space ........................................................................................................ 21 Discussion ............................................................................................................................................... 27 References ............................................................................................................................................... 27
CHAPTER 3: A TWO-PHASED APPROACH TO QUANTIFYING HEAD IMPACT SENSOR ACCURACY: IN-LABORATORY AND ON-FIELD ASSESSMENTS .................................................. 34
Abstract ................................................................................................................................................... 34 Introduction ............................................................................................................................................. 34 Methods .................................................................................................................................................. 36 Results ..................................................................................................................................................... 43 Discussion ............................................................................................................................................... 49 References ............................................................................................................................................... 54
CHAPTER 4: USING IN-MOUTH SENSORS TO MEASURE HEAD KINEMATICS IN RUGBY ..... 57 Abstract ................................................................................................................................................... 57 Introduction ............................................................................................................................................. 57 Methods .................................................................................................................................................. 59 Results ..................................................................................................................................................... 61 Discussion ............................................................................................................................................... 69 References ............................................................................................................................................... 72
CHAPTER 5: CONCUSSION RELATED SYMPTOM PRESENTATION IN MEN’S AND WOMEN’S RUGBY ...................................................................................................................................................... 75
Abstract ................................................................................................................................................... 75 Introduction ............................................................................................................................................. 75 Methods .................................................................................................................................................. 76 Results ..................................................................................................................................................... 77 Discussion ............................................................................................................................................... 79
vi
References ............................................................................................................................................... 80 CHAPTER 6: IN-SEASON CONCUSSION SYMPTOM REPORTING IN MALE AND FEMALE COLLEGIATE RUGBY ............................................................................................................................. 83
Abstract ................................................................................................................................................... 83 Introduction ............................................................................................................................................. 83 Methods .................................................................................................................................................. 85 Results ..................................................................................................................................................... 87 Discussion ............................................................................................................................................... 92 References ............................................................................................................................................... 94
CHAPTER 7: DUAL-TASK GAIT PERFORMANCE FOLLOWING HEAD IMPACT EXPOSURE IN MALE AND FEMALE COLLEGIATE RUGBY PLAYERS ................................................................... 99
Abstract ................................................................................................................................................... 99 Introduction ............................................................................................................................................. 99 Methods ................................................................................................................................................ 101 Results ................................................................................................................................................... 103 Discussion ............................................................................................................................................. 109 References ............................................................................................................................................. 111 Appendix ............................................................................................................................................... 114
CHAPTER 8: CONCUSSION CASE REPORTS IN COLLEGIATE MEN’S AND WOMEN’S RUGBY: CONSIDERATIONS FOR FUTURE DATA COLLECTION ................................................................. 115
Abstract ................................................................................................................................................. 115 Introduction ........................................................................................................................................... 115 Methods ................................................................................................................................................ 116 Results ................................................................................................................................................... 120 Discussion ............................................................................................................................................. 130 References ............................................................................................................................................. 132
CHAPTER 9: CLOSING REMARKS ...................................................................................................... 136 Summary of Research ........................................................................................................................... 136 Publication Plan .................................................................................................................................... 137
vii
LIST OF FIGURES
Figure 2.1. (A) Wake Forest University Mouthguard with instrumentation along the upper palate and (B) Prevent Biometrics mouthguard with instrumentation along the teeth. ...................................................... 15 Figure 2.2. Outline of best practices for on-field sensor data collection. ................................................... 19 Figure 3.1. The eight sensors evaluated in the current study ...................................................................... 37 Figure 3.2. Impact locations (left to right) included the front, front boss, rear boss, and rear. Tests included a rigid impactor to a helmeted head (top), a padded impactor to a bare head (middle), and a rigid impactor to a bare head (bottom). ............................................................................................................... 40 Figure 3.3. Placement of non-helmeted sensors, including the (A-B) xPatch and SIM-G. Comparison between (C) smooth aluminum dentition for boil-and-bite mouthguard sensors and (D) ABS plastic dentition for custom mouthguard sensors. .................................................................................................. 40 Figure 3.4. Comparison of reference versus sensor measurements by sensor model, impact condition, and kinematic measure. ..................................................................................................................................... 48 Figure 3.5. PPV was calculated for each sensor that was tested on-field. .................................................. 49 Figure 4.1. (A) Wake Forest University Mouthguard with instrumentation along the upper palate and (B) Prevent Biometrics IMM with instrumentation along the teeth. ................................................................. 59 Figure 4.2. (Left) A direct head impact during a men’s practice and (Right) An inertially-induced head acceleration from a body impact during a men’s game. ............................................................................. 60 Figure 4.3. Three examples of calculated impact duration. ........................................................................ 61 Figure 4.4. (Left) Probability density function (PDF) for PLA, with HI in dark gray and BI in light gray. (Right) PDF for ∆RV, with HI in dark gray and BI in light gray. .............................................................. 62 Figure 4.5. Exemplar linear acceleration and rotational velocity traces for a head impact. ....................... 63 Figure 4.6. Exemplar linear acceleration and rotational velocity traces for a body impact. ....................... 63 Figure 4.7. (Left) Linear acceleration for impact type compared within sex. (Right) Rotational velocity for impact type compared within sex. Head impacts had a higher PLA than body impacts for both men and women. There was no difference in PRV between impact type within sex. ............................................... 64 Figure 4.8. (Left) Linear acceleration for impact type compared between sex. (Right) Rotational velocity for impact type compared between sex. ...................................................................................................... 65 Figure 4.9. Two exemplar linear acceleration traces for impacts removed from the duration analysis due to their lack of consistency to acceleration traces for an impact. ................................................................ 65 Figure 4.10. (Left) Impact duration for impact type compared within sex. (Right) Impact duration for impact type compared between sex. ........................................................................................................... 66 Figure 4.11. Linear acceleration and rotational velocity traces for a concussion on the men’s team. ........ 68 Figure 4.12. Linear acceleration and rotational velocity traces for a concussion on the men’s team. ........ 68 Figure 4.13. Linear acceleration and rotational velocity traces for a concussion on the women’s team. ... 69 Figure 5.1. Box plots of Symptom Severity Score (SSS) for the female and male athletes each over the course of six weeks in-season. .................................................................................................................... 78 Figure 6.1. Boxplots and points for mean and max SSS and number of symptoms for males and females for paired baseline and in-season surveys. .................................................................................................. 89 Figure 6.2. Boxplots with data points for SSS and number of symptoms for elevated surveys. ................ 90 Figure 6.3. Plot of differences in the percentage of elevated surveys that report the given symptom with moderate or greater severity (> 2) between sexes. ...................................................................................... 91
viii
Figure 7.1. Opal Sensors attached to elastic straps around the athlete’s waist and feet to measure gait characteristics. ........................................................................................................................................... 102 Figure 7.2. The mean difference of the female gait characteristic at the specified task from the males’. 105 Figure 7.3. The mean difference of the post-season (and post-concussion, for the females) gait characteristics at the specified task from the baseline timepoint. ............................................................. 106 Figure 7.4. The mean difference of the female dual-task cost at the specified gait variable from the male. .................................................................................................................................................................. 108 Figure 7.5. The mean difference of the post-season (and post-concussion, for the females) dual-task cost at each gait characteristic from the baseline timepoint. ............................................................................ 109 Figure 8.1. (A) Wake Forest University Mouthguard with instrumentation along the upper palate and (B) Prevent Biometrics mouthguard with instrumentation along the teeth. .................................................... 117 Figure 8.2. Opal Sensors attached to elastic straps around the athlete’s waist and feet to measure gait characteristics. ........................................................................................................................................... 119 Figure 8.3. Linear acceleration and rotational velocity traces for a concussion M-1 on the men’s team. 123 Figure 8.4. Linear acceleration and rotational velocity traces for a concussion M-3 on the men’s team. 124 Figure 8.5. Linear acceleration and rotational velocity traces for concussion F-5 on the women’s team. 126 Figure 8.6. Linear acceleration and rotational velocity traces for concussion F-12 on the women’s team. .................................................................................................................................................................. 128 Figure 8.7. Linear acceleration and rotational velocity traces for concussion F-14 on the women’s team. .................................................................................................................................................................. 129
ix
LIST OF TABLES
Table 2.1. Head impact sensor types and their advantages and disadvantages. .......................................... 12 Table 3.1. Summary of key features for each sensor. CFC: channel frequency class ................................ 38 Table 3.2. Summary of CCC values from in-lab testing and PPV values from on-field testing of wearable head impact sensors. ................................................................................................................................... 47 Table 4.1. Impact counts, median, and 95th percentile head kinematics for peak linear acceleration and change in rotational velocity experienced by men and women for both impact types. .............................. 62 Table 4.2. Concussive events sustained over the course of the study for both teams. ................................ 67 Table 5.1. List of 27 concussion symptoms in the Graded Symptom Checklist that subjects grade on a scale of 0 (None) to 6 (Most Severe). ......................................................................................................... 77 Table 5.2. Summary table for athletes that reported elevated symptoms (SSS ≥ 10) and their corresponding head impacts for the week leading up to the symptom survey. ........................................... 79 Table 6.1. List of 27 concussion symptoms in the Graded Symptom Checklist that subjects grade on a scale of 0 (none) to 6 (most severe). ........................................................................................................... 85 Table 6.2. Summary of symptom presentation reported from paired baseline and in-season time points for male and female athletes. ............................................................................................................................ 88 Table 6.3. Number of in-season surveys collected in total and those that reported elevated SSS per sex. 90 Table 6.4. Summary of symptom presentation in athletes who were diagnosed with a concussion by clinical staff and those that reported elevated SSS. .................................................................................... 92 Table 7.1. Summary table for the mean values ± the standard deviation for the four primary gait metrics from all athletes from baseline, post-concussion (CX), post-season, and at both single and dual task conditions. ................................................................................................................................................. 104 Table 7.2. Summary table for changes in the four primary gait metrics and the 95% confidence interval from athletes who completed both baseline and post-season gait tests..................................................... 106 Table 7.3. Summary table for changes in the four primary gait metrics and the 95% confidence interval from athletes who completed both baseline and post-concussion gait tests. ............................................ 107 Table 7.4. Summary table for mean dual task-cost (%) of four gait metrics in athletes at each time point. .................................................................................................................................................................. 107 Table A1. Summary table for the mean values for the four primary gait metrics at both task conditions from athletes who completed both a baseline and post-season, and baseline and post-concussion, tests in the same season ......................................................................................................................................... 114 Table A2. Summary table for the mean dual task-cost (%) of four gait metrics from athletes who completed both a baseline and post-season test in the same season. ........................................................ 114 Table 8.1. List of 27 concussion symptoms in the Graded Symptom Checklist that subjects grade on a scale of 0 to 6. ........................................................................................................................................... 118 Table 8.2. Biomechanical summary of concussions for male and females. .............................................. 121 Table 8.3. Clinical summary, including symptom scores and changes in four gait metrics, associated with the concussions. ........................................................................................................................................ 122 Table 9.1. Publication plan for research ................................................................................................... 137
x
ATTRIBUTION
Chapter Title Co-authors
2 On the Use of Wearable Sensors to Measure Head Impacts in Sports
Steven Rowson
3 A Two-Phased Approach to Quantifying Head Impact Sensor Accuracy: In-Laboratory and On-Field Assessments
Mark T. Begonia, Abigail M. Tyson, and Steven Rowson
4 Using In-Mouth Sensors to Measure Head Kinematics in Rugby
Chase Vaillancourt, P. Gunnar Brolinson, and Steven Rowson
5 In-Season Concussion Symptom Presentation in Men’s and Women’s Collegiate Rugby
Grace Pierce, Chase Vaillancourt, and Steven Rowson
6 In-Season Concussion Symptom Reporting in Male and Female Collegiate Rugby
Per Gunnar Brolinson, Arthur E. Maerlender, Eric P. Smith, and Steven Rowson
7 Dual-Task Gait Performance in Collegiate Rugby Athletes
Steven Rowson
8 Concussion Biomechanics and Clinical Outcomes in Rugby
Steven Rowson
1
CHAPTER 1: INTRODUCTION
CONCUSSIONS AND CLINICAL EFFECTS
Concussions are diffuse injuries,1 affecting areas of the brain responsible for a person’s physical, cognitive,
and emotional health. They are a type of mild traumatic brain injury that result from biomechanical forces
imparted directly to the head or to elsewhere in the body transmitting an inertial load to the head.2 Although
concussions were once thought only to present transient symptoms, mounting evidence has shown the
potential for long-term neurological impairments. In fact, a history of repetitive head impact exposure might
also result in long-term neurodegenerative complications.3 This exposure may be only subconcussive
impacts, or those below the diagnostic threshold of injury. The clinical effects of concussion have been well
studied, but short-and long-term effects of cumulative head impact exposure have been less explored until
recently. Later-life neurodegenerative processes including depression,4,5 cognitive impairment,5,6 and
structural and functional brain alterations7,8 have been associated with a history of repetitive head impact
exposure in former athletes.9,10 Repetitive head impact exposure, in the absence of a diagnosed concussion,
has also been linked to short-term acute cognitive changes.11-16 This cumulative subconcussive load has
also been shown to reduce future concussion tolerance in collegiate football players.17-20 The deleterious
effects of concussion can be from a single, high severity impact event or the accumulation of lower severity
impacts.
Concussion diagnostics use a multipronged approach, usually including sideline evaluation, symptom
assessment, neurologic evaluation, neuropsychological testing, and a consideration of clinical concussion
history.21 Often, athlete’s self-reported symptoms are the basis of diagnosis and return-to-play timeline, but
athletes’ tendency to hide or underreport symptoms to decrease return-to-play time complicates reliance on
symptom scores.22 Studies have indicated that 30-50% of concussions go unreported.22,23 This is a concern
because athletes who do not immediately report concussion symptoms and continue to participate in
activities may be at higher risk for longer recoveries and sustain post-concussion symptoms longer.24 A
more regular monitoring system may help identify unreported concussions in-season and provide
management strategies resulting in earlier interventions in a more effective timeline.
In addition to somatic symptoms, decreased postural control and altered gait patterns have been seen in
concussed athletes.25-28 Concussed individuals tend to have a more conservative pattern in gait,29 and gait
assessment tools can be implemented on the sideline and help clinicians differentiate between concussed
and non-concussed athletes. Assessing gait is advantageous because it is a non-novel task and can be
objectively measured with portable inertial measurement units.26,27,30-33 It also provides a more holistic
perspective on recovery; some studies have seen athletes take months to years for a full recovery in gait
2
performance, especially when the participant’s attention is divided.26,31,32,34 More traditional markers of
recovery, like symptom surveys or neurocognitive test performance, typically recover on a shorter
timeline.35,36 Dividing the athlete’s attention comes in the form of a concurrent cognitive task during a
walking trial is called a dual-task gait evaluation. Because concussions affect both motor and cognitive
domains, the divided attention required in dual-tasks may be more sensitive to post-concussion impairments
than single-tasks, or walking without a cognitive load.37 The additional load while walking allows for more
subtle motor impairments to become apparent because as the processing demands for the task increase, the
available attention decreases, leaving less for the athlete to consciously maintain a normal walking
pattern.38,39
Concussive injuries are inertially driven from an external force causing brain movement within the skull.
During an impact, the brain’s motion lags as the skull is rapidly accelerated and decelerated, creating
pressures and strains in the brain tissue.40,41 The linear kinematics of the brain upon impact induce a transient
intracranial pressure gradient, while rotational kinematics are associated with the brain’s strain response
upon loading.40,42-46 However, measuring the brain’s inertial response to impact is not an easy task.
WEARABLE HEAD IMPACT SENSORS
An effective way to study human tolerance to head injury is to instrument contact sport athletes, a
population who are regularly exposed to head impacts, with wearable sensors to quantify the magnitude
and frequency of kinematics sustained.47,48 This non-invasive method of measuring skull acceleration and
velocity allows researchers to correlate the brain response to impact. The basis of on-field data collection
comes from mounted accelerometer arrays in the helmets of male football players.17,49-52 These helmet-
mounted sensors helped researchers understand the head impact tolerance of elite male athletes, and build
concussion risk functions to predict injury.47 The two main limitations with helmet-based sensors are the
movement of the helmet relative to the skull-which can result in erroneous recordings or artificially inflate
acceleration events, and the specific populations that could be studied. As concern for the accurate
assessment of the impact biomechanics of concussion extended beyond football, sensors that could be worn
independent of helmets started being developed. These systems include sensors embedded into headbands,
skin-mounted patches, earpieces, and mouthguards. The accuracy and usability of these devices varies, and
headbands and skin patches are both still susceptible to movement independent of the skull. Instrumented
mouthguards provide near-perfect coupling of the sensor to the skull, as they are rigidly mounted to the
teeth. Any device implemented on-field should have a high sensitivity, or proportion of head impacts
correctly identified, and a high positive predictive value (PPV), or probability that there is an acceleration
event when the device records one. These sensors should be validated in-lab, where testing configurations
3
are representative of the specific on-field use, as well as on-field, where they are subjected to sports specific
human wear.
SEX-SPECIFIC DIFFERNCES IN CONCUSSION
Concussions can affect males, females, adults, and children alike and there are population-based differences
in tolerance to head impact, which can vary by sex and age. Differences in tolerance between youth and
adult football players have been previously established.47,53-55 Data collected from female collegiate hockey
players suggested that the magnitude of a concussive head impact is substantially lower for females
compared to males.56 Females sustain more concussions than their male counterparts in every matched
sport.57-62 Despite this prevalence, females have been underrepresented in concussion research. Limited
studies have quantified biomechanical tolerance in women.56,63-66 Currently, female injury tolerance in
limited to inertial scaling equations in the automotive industry.67,68
The presentation and outcome of concussion is sex-specific,57,59,69-72 which is attributed to a combination of
biomechanical, physiologic, and psychosocial factors that differ between males and females.
Biomechanically, females’ neck musculature is weaker than males, making it more difficult to decelerate
their head under loading, and increasing their risk of concussion.55,61,73,74 Physiologically, the presence of
the hormones estrogen and progesterone in females may contribute to the sex-specific differences by acting
as neuro-protectants in brain injury.71,75,76 Additionally, there are structural differences in axons between
sexes that make females’ axons more susceptible to injury under dynamic stretch loading, and the
pathophysiology of the injury worse when injury occurs.77 Psychosocially, studies have shown females are
more honest in reporting concussions because they are more concerned about their future health, compared
to males who are less likely to report because cultural tendencies encourage males to play though
injuries.59,61,78,79 Females generally report more symptoms post-concussion80 and take a longer time to fully
recover81 than males.
This lack of female biomechanics data is partially due to the overwhelming research on American football,
and the ability to instrument helmets with sensors capable of measuring head acceleration. It was not until
recently that similar technology translated was into smaller sensors that can be worn independent of
helmets, enabling unhelmeted athletes to also be studied, widening the population to finally include women
involved in contact and collision sports.
EPIDEMIOLOGY OF HEAD INJURIES IN RUGBY
Rugby is a globally popular full-contact team sport, played similarly to American football. The main
differences are that offensive and defensive teams are on the field at the same time, the ball cannot be
4
thrown forward, and it is illegal to block a player who does not have possession of the ball. Players
predominately use their arms and shoulders to tackle an opponent, with a tackle higher than the shoulder a
penalty. These collisions are forceful, generally with the ball carrier running in the opposite direction as the
tackler. The physicality and competitiveness of the sport lends to rapid acceleration-deceleration and
rotational forces leading to a high risk of a collision-associated injury82 and concussion rate.83 The only
protective equipment worn by rugby players are mouthguards, which do not reduce the risk of concussion.84
Some players choose to wear soft-shelled headgear, but their effectiveness in concussion risk reduction is
highly debated.85-92 Reduced performance with attention and memory tasks in collegiate rugby players have
been seen post-season, with only 3% of those subjects reporting a clinically diagnosed concussion in-
season.93 The acute effects of a simulated match load of rugby impacts suggested transient change in cortical
function following subconcussive impacts.94 This suggests a potential neurocognitive vulnerability in
contact-sport athletes, who are regularly subjected to impacts below a diagnostic threshold for concussion.
World Rugby and Rugby Football Union have recently come under fire from former rugby players with
early onset dementia.95 It has been estimated that up to 22% of rugby injuries are concussions,96
corresponding to about 13–17% of rugby players sustaining a concussion during a season. These numbers
vary by the play style and player position.97 Rugby was a game traditionally played by men, but it has grown
in popularity among women in recent years.96 Both men’s and women’s teams play at various levels of
competition, under the same rules.84 This presents the opportunity to study a matched cohort of unhelmeted
male and female athletes and the head kinematics they sustain on-field during practice and competition.
RESEARCH OBJECTIVES
The presented research is multi-faceted, and includes the collection and analysis of biomechanical and
clinical data. The overall aim is to describe sex-specific outcomes of subconcussion in a matched cohort of
male and female athletes and gain a better sense of unhelmeted, sex-specific tolerance to head impacts.
Understanding the sex-specific clinical effects of head impacts in rugby is critical, and can provide insight
into concussion diagnostic, management, and prevention tools that are appropriate and effective. On-field
data were collected from collegiate rugby players using instrumented mouthguards. This work sought to
assess the biomechanics of head impacts and concussions of this population, and evaluate changes in
symptom presentation and gait both after a concussion and as an effect of subconcussive impacts.
The overall objectives of this research are:
1. To assess the usability and accuracy of wearable sensors to provide on-field head kinematic data
2. To quantify the head kinematics experienced by collegiate rugby players and compare the
kinematics between sexes

5
3. To quantify the sex-specific clinical effect of cumulative head impact exposure for symptom
presentation and dual-task gait
4. To pair concussive biomechanics to clinical outcomes to quantify the clinical effect of concussion
REFERENCES
1. Bazarian, J. J., B. Blyth and L. Cimpello. Bench to bedside: Evidence for brain injury after concussion—looking beyond the computed tomography scan. Academic Emergency Medicine. 13(2):199-214, 2006.
2. McCrory, P., W. Meeuwisse, J. Dvorak, M. Aubry, J. Bailes, S. Broglio, R. C. Cantu, D. Cassidy, R. J. Echemendia, R. J. Castellani, G. A. Davis, R. Ellenbogen, C. Emery, L. Engebretsen, N. Feddermann-Demont, C. C. Giza, K. M. Guskiewicz, S. Herring, G. L. Iverson, K. M. Johnston, J. Kissick, J. Kutcher, J. J. Leddy, D. Maddocks, M. Makdissi, G. T. Manley, M. McCrea, W. P. Meehan, S. Nagahiro, J. Patricios, M. Putukian, K. J. Schneider, A. Sills, C. H. Tator, M. Turner and P. E. Vos. Consensus statement on concussion in sport—the 5th international conference on concussion in sport held in berlin, october 2016. British Journal of Sports Medicine. 51(11):838, 2017.
3. McAllister, T. and M. McCrea. Long-term cognitive and neuropsychiatric consequences of repetitive concussion and head-impact exposure. Journal of Athletic Training. 52(3):309-17, 2017.
4. Didehbani, N., C. Munro Cullum, S. Mansinghani, H. Conover and J. Hart. Depressive symptoms and concussions in aging retired nfl players. Archives of Clinical Neuropsychology. 28(5):418-24, 2013.
5. Montenigro, P. H., M. L. Alosco, B. M. Martin, D. H. Daneshvar, J. Mez, C. E. Chaisson, C. J. Nowinski, R. Au, A. C. McKee, R. C. Cantu, M. D. McClean, R. A. Stern and Y. Tripodis. Cumulative head impact exposure predicts later-life depression, apathy, executive dysfunction, and cognitive impairment in former high school and college football players. Journal of Neurotrauma. 34(2):328-40, 2017.
6. Montenigro, P. H., M. L. Alosco, B. M. Martin, D. H. Daneshvar, J. Mez, C. E. Chaisson, C. J. Nowinski, R. Au, A. C. McKee and R. C. Cantu. Cumulative head impact exposure predicts later-life depression, apathy, executive dysfunction, and cognitive impairment in former high school and college football players. Journal of Neurotrauma. 34(2):328-40, 2017.
7. Alosco, M. L., I. K. Koerte, Y. Tripodis, M. Mariani, A. S. Chua, J. Jarnagin, Y. Rahimpour, C. Puzo, R. C. Healy and B. Martin. White matter signal abnormalities in former national football league players. Alzheimer's & Dementia: Diagnosis, Assessment & Disease Monitoring. 10(56-65, 2018.
8. Strain, J. F., K. B. Womack, N. Didehbani, J. S. Spence, H. Conover, J. Hart, M. A. Kraut and C. M. Cullum. Imaging correlates of memory and concussion history in retired national football league athletes. Journal of the American Medical Association Neurology. 72(7):773-80, 2015.
9. Alosco, M. L. and R. A. Stern. Youth exposure to repetitive head impacts from tackle football and long-term neurologic outcomes: A review of the literature, knowledge gaps and future directions, and societal and clinical implications. Seminars Pediatric Neurology 30(107-16, 2019.
10. Mackay, D. F., E. R. Russell, K. Stewart, J. A. MacLean, J. P. Pell and W. Stewart. Neurodegenerative disease mortality among former professional soccer players. New England Journal of Medicine. 381(19):1801-8, 2019.
11. McAllister, T. W., L. A. Flashman, A. Maerlender, R. M. Greenwald, J. G. Beckwith, T. D. Tosteson, J. J. Crisco, P. G. Brolinson, S. M. Duma, A. C. Duhaime, M. R. Grove and J. H. Turco. Cognitive effects of one season of head impacts in a cohort of collegiate contact sport athletes. Neurology. 78(22):1777-84, 2012.
6
12. Seichepine, D. R., J. M. Stamm, D. H. Daneshvar, D. O. Riley, C. M. Baugh, B. E. Gavett, Y. Tripodis, B. Martin, C. Chaisson and A. C. McKee. Profile of self-reported problems with executive functioning in college and professional football players. Journal of Neurotrauma. 30(14):1299-304, 2013.
13. Singh, R., T. B. Meier, R. Kuplicki, J. Savitz, I. Mukai, L. Cavanagh, T. Allen, T. K. Teague, C. Nerio and D. Polanski. Relationship of collegiate football experience and concussion with hippocampal volume and cognitive outcomes. Journal of the American Medical Association. 311(18):1883-8, 2014.
14. Breedlove, E. L., M. Robinson, T. M. Talavage, K. E. Morigaki, U. Yoruk, K. O'Keefe, J. King, L. J. Leverenz, J. W. Gilger and E. A. Nauman. Biomechanical correlates of symptomatic and asymptomatic neurophysiological impairment in high school football. Journal of Biomechanics. 45(7):1265-72, 2012.
15. Koerte, I. K., E. Nichols, Y. Tripodis, V. Schultz, S. Lehner, R. Igbinoba, A. Z. Chuang, M. Mayinger, E. M. Klier and M. Muehlmann. Impaired cognitive performance in youth athletes exposed to repetitive head impacts. Journal of Neurotrauma. 34(16):2389-95, 2017.
16. Levitch, C. F., M. E. Zimmerman, N. Lubin, N. Kim, R. B. Lipton, W. F. Stewart, M. Kim and M. L. Lipton. Recent and long-term soccer heading exposure is differentially associated with neuropsychological function in amateur players. Journal of the International Neuropsychological Society : JINS. 24(2):147-55, 2018.
17. Rowson, S., E. T. Campolettano, S. M. Duma, B. Stemper, A. Shah, J. Harezlak, L. Riggen, J. P. Mihalik, K. M. Guskiewicz, C. Giza, A. Brooks, K. Cameron, T. McAllister, S. P. Broglio and M. McCrea. Accounting for variance in concussion tolerance between individuals: Comparing head accelerations between concussed and physically matched control subjects. Annals of Biomedical Engineering. 47(10):2048-56, 2019.
18. Beckwith, J. G., R. M. Greenwald, J. J. Chu, J. J. Crisco, S. Rowson, S. M. Duma, S. P. Broglio, T. W. McAllister, K. M. Guskiewicz, J. P. Mihalik, S. Anderson, B. Schnebel, P. G. Brolinson and M. W. Collins. Timing of concussion diagnosis is related to head impact exposure prior to injury. Medicine & Science in Sports & Exercise. 45(4):747-54, 2013.
19. Beckwith, J. G., R. M. Greenwald, J. J. Chu, J. J. Crisco, S. Rowson, S. M. Duma, S. P. Broglio, T. W. McAllister, K. M. Guskiewicz, J. P. Mihalik, S. Anderson, B. Schnebel, P. G. Brolinson and M. W. Collins. Head impact exposure sustained by football players on days of diagnosed concussion. Medicine & Science in Sports & Exercise. 45(4):737-46, 2013.
20. Stemper, B. D., A. S. Shah, J. Harezlak, S. Rowson, J. P. Mihalik, S. M. Duma, L. D. Riggen, A. Brooks, K. L. Cameron, D. Campbell, J. P. DiFiori, C. C. Giza, K. M. Guskiewicz, J. Jackson, G. T. McGinty, S. J. Svoboda, T. W. McAllister, S. P. Broglio, M. McCrea and C. C. I. the. Comparison of head impact exposure between concussed football athletes and matched controls: Evidence for a possible second mechanism of sport-related concussion. Annals of Biomedical Engineering. 47(10):2057-72, 2019.
21. Lovell, M. R., G. L. Iverson, M. W. Collins, K. Podell, K. M. Johnston, D. Pardini, J. Pardini, J. Norwig and J. C. Maroon. Measurement of symptoms following sports-related concussion: Reliability and normative data for the post-concussion scale. Applied Neuropsychology. 13(3):166-74, 2006.
22. McCrea, M., T. Hammeke, G. Olsen, P. Leo and K. Guskiewicz. Unreported concussion in high school football players: Implications for prevention. Clinical Journal of Sport Medicine. 14(1):13-7, 2004.
23. Meehan III, W. P., R. C. Mannix, M. J. O'Brien and M. W. Collins. The prevalence of undiagnosed concussions in athletes. Clinical Journal of Sport Medicine: Official Journal of the Canadian Academy of Sport Medicine. 23(5):339, 2013.
24. Asken, B. M., M. A. McCrea, J. R. Clugston, A. R. Snyder, Z. M. Houck and R. M. Bauer. “Playing through it”: Delayed reporting and removal from athletic activity after concussion predicts prolonged recovery. Journal of Athletic Training. 51(4):329-35, 2016.
7
25. Howell, D. R., A. Brilliant, B. Berkstresser, F. Wang, J. Fraser and W. P. Meehan III. The association between dual-task gait after concussion and prolonged symptom duration. Journal of Neurotrauma. 34(23):3288-94, 2017.
26. Howell, D. R., L. R. Osternig and L.-S. Chou. Dual-task effect on gait balance control in adolescents with concussion. Archives of Physical Medicine and Rehabilitation. 94(8):1513-20, 2013.
27. Howell, D., L. Osternig and L.-S. Chou. Monitoring recovery of gait balance control following concussion using an accelerometer. Journal of Biomechanics. 48(12):3364-8, 2015.
28. Howell, D. R., T. A. Buckley, R. C. Lynall and W. P. Meehan III. Worsening dual-task gait costs after concussion and their association with subsequent sport-related injury. Journal of Neurotrauma. 35(14):1630-6, 2018.
29. Buckley, T. A., S. Vallabhajosula, J. R. Oldham, B. A. Munkasy, K. M. Evans, D. A. Krazeise, C. J. Ketcham and E. E. Hall. Evidence of a conservative gait strategy in athletes with a history of concussions. Journal of Sport and Health Science. 5(4):417-23, 2016.
30. Mancini, M., L. King, A. Salarian, L. Holmstrom, J. McNames and F. B. Horak. Mobility lab to assess balance and gait with synchronized body-worn sensors. Journal of Bioengineering and Biomedical Science. Suppl 1(007, 2011.
31. Fait, P., B. Swaine, J.-F. Cantin, J. Leblond and B. J. McFadyen. Altered integrated locomotor and cognitive function in elite athletes 30 days postconcussion: A preliminary study. The Journal of Head Trauma Rehabilitation. 28(4):293-301, 2013.
32. Martini, D. N., M. J. Sabin, S. A. DePesa, E. W. Leal, T. N. Negrete, J. J. Sosnoff and S. P. Broglio. The chronic effects of concussion on gait. Archives of Physical Medicine and Rehabilitation. 92(4):585-9, 2011.
33. Parker, T. M., L. R. Osternig, V. A. N. D. P and L. S. Chou. Gait stability following concussion. Medicine & Science in Sports & Exercise. 38(6):1032-40, 2006.
34. Parker, T. M., L. R. Osternig, P. Van Donkelaar and L.-S. Chou. Gait stability following concussion. Medicine & Science in Sports & Exercise. 38(6):1032-40, 2006.
35. Belanger, H. G. and R. D. Vanderploeg. The neuropsychological impact of sports-related concussion: A meta-analysis. Journal of the International Neuropsychological Society. 11(4):345-57, 2005.
36. Meehan III, W. P., P. d’Hemecourt, C. L. Collins and R. D. Comstock. Assessment and management of sport-related concussions in united states high schools. The American Journal of Sports Medicine. 39(11):2304-10, 2011.
37. Howell, D. R., J. Oldham, C. Lanois, I. Koerte, A. P. Lin, B. Berkstresser, F. Wang and W. P. Meehan, 3rd. Dual-task gait recovery after concussion among female and male collegiate athletes. Medicine & Science in Sports & Exercise. 52(5):1015-21, 2020.
38. Ross, L. M., J. K. Register-Mihalik, J. P. Mihalik, K. L. McCulloch, W. E. Prentice, E. W. Shields and K. M. Guskiewicz. Effects of a single-task versus a dual-task paradigm on cognition and balance in healthy subjects. Journal of Sport Rehabilitation. 20(3):296-310, 2011.
39. Vallabhajosula, S., C. W. Tan, M. Mukherjee, A. J. Davidson and N. Stergiou. Biomechanical analyses of stair-climbing while dual-tasking. Journal of Biomechanics. 48(6):921-9, 2015.
40. Hardy, W. N., M. J. Mason, C. D. Foster, C. S. Shah, J. M. Kopacz, K. H. Yang, A. I. King, J. Bishop, M. Bey, W. Anderst and S. Tashman. A study of the response of the human cadaver head to impact. Stapp Car Crash Journal. 51(17-80, 2007.
41. Hardy, W. N., C. D. Foster, M. J. Mason, K. H. Yang, A. I. King and S. Tashman. Investigation of head injury mechanisms using neutral density technology and high-speed biplanar x-ray. Stapp Car Crash Journal. 45(337-68, 2001.
42. Kleiven, S. Predictors for traumatic brain injuries evaluated through accident reconstructions. Stapp Car Crash Journal. 51(81-114, 2007.
43. Kleiven, S. and W. N. Hardy. Correlation of an fe model of the human head with local brain motion--consequences for injury prediction. Stapp Car Crash Journal. 46(123-44, 2002.
8
44. Takhounts, E. G., S. A. Ridella, V. Hasija, R. E. Tannous, J. Q. Campbell, D. Malone, K. Danelson, J. Stitzel, S. Rowson and S. Duma. Investigation of traumatic brain injuries using the next generation of simulated injury monitor (simon) finite element head model. Stapp Car Crash Journal. 52(1-31, 2008.
45. Unterharnscheidt, F. J. Translational versus rotational acceleration: Animal experiements with measured inputs. Proceedings of the 15th Stapp Car Crash Conference. SAE 710880(1971.
46. Zhang, L., K. H. Yang and A. I. King. A proposed injury threshold for mild traumatic brain injury. Journal of Biomechanical Engineering. 126(2):226-36, 2004.
47. Rowson, S., S. M. Duma, J. G. Beckwith, J. J. Chu, R. M. Greenwald, J. J. Crisco, P. G. Brolinson, A. C. Duhaime, T. W. McAllister and A. C. Maerlender. Rotational head kinematics in football impacts: An injury risk function for concussion. Annals of Biomedical Engineering. 40(1):1-13, 2012.
48. Duma, S. M., S. J. Manoogian, W. R. Bussone, P. G. Brolinson, M. W. Goforth, J. J. Donnenwerth, R. M. Greenwald, J. J. Chu and J. J. Crisco. Analysis of real-time head accelerations in collegiate football players. Clinical Journal of Sport Medicine. 15(1):3-8, 2005.
49. Broglio, S. P., T. Surma and J. A. Ashton-Miller. High school and collegiate football athlete concussions: A biomechanical review. Annals of Biomedical Engineering. 40(1):37-46, 2012.
50. Brolinson, P. G., S. Manoogian, D. McNeely, M. Goforth, R. Greenwald and S. Duma. Analysis of linear head accelerations from collegiate football impacts. Current Sports Medicine Reports. 5(1):23-8, 2006.
51. Crisco, J. J., B. J. Wilcox, J. G. Beckwith, J. J. Chu, A. C. Duhaime, S. Rowson, S. M. Duma, A. C. Maerlender, T. W. McAllister and R. M. Greenwald. Head impact exposure in collegiate football players. Journal of Biomechanics. 44(15):2673-8, 2011.
52. Guskiewicz, K. M., J. P. Mihalik, V. Shankar, S. W. Marshall, D. H. Crowell, S. M. Oliaro, M. F. Ciocca and D. N. Hooker. Measurement of head impacts in collegiate football players: Relationship between head impact biomechanics and acute clinical outcome after concussion. Neurosurgery. 61(6):1244-53, 2007.
53. Campolettano, E. T., R. A. Gellner, E. P. Smith, S. Bellamkonda, C. T. Tierney, J. J. Crisco, D. A. Jones, M. E. Kelley, J. E. Urban and J. D. Stitzel. Development of a concussion risk function for a youth population using head linear and rotational acceleration. Annals of Biomedical Engineering. 48(1):92-103, 2020.
54. Greenwald, R. M., J. T. Gwin, J. J. Chu and J. J. Crisco. Head impact severity measures for evaluating mild traumatic brain injury risk exposure. Neurosurgery. 62(4):789-98; discussion 98, 2008.
55. Rowson, S. and S. M. Duma. Brain injury prediction: Assessing the combined probability of concussion using linear and rotational head acceleration. Annals of Biomedical Engineering. 41(5):873-82, 2013.
56. Wilcox, B. J., J. G. Beckwith, R. M. Greenwald, N. P. Raukar, J. J. Chu, T. W. McAllister, L. A. Flashman, A. C. Maerlender, A.-C. Duhaime and J. J. Crisco. Biomechanics of head impacts associated with diagnosed concussion in female collegiate ice hockey players. Journal of Biomechanics. 48(10):2201-4, 2015.
57. Covassin, T., C. B. Swanik and M. L. Sachs. Sex differences and the incidence of concussions among collegiate athletes. Journal of Athletic Training. 38(3):238, 2003.
58. Delaney, J. S., V. J. Lacroix, S. Leclerc and K. M. Johnston. Concussions among university football and soccer players. Clinical Journal of Sport Medicine. 12(6):331-8, 2002.
59. Dick, R. Is there a gender difference in concussion incidence and outcomes? British Journal of Sports Medicine. 43(Suppl 1):i46-i50, 2009.
60. Fuller, C., A. Junge and J. Dvorak. A six year prospective study of the incidence and causes of head and neck injuries in international football. British Journal of Sports Medicine. 39(suppl 1):i3-i9, 2005.
9
61. Gessel, L. M., S. K. Fields, C. L. Collins, R. W. Dick and R. D. Comstock. Concussions among united states high school and collegiate athletes. Journal of Athletic Training. 42(4):495-503, 2007.
62. Tierney, R. T., M. Higgins, S. V. Caswell, J. Brady, K. McHardy, J. B. Driban and K. Darvish. Sex differences in head acceleration during heading while wearing soccer headgear. Journal of Athletic Training. 43(6):578-84, 2008.
63. Rowson, S., M. L. Bland, E. T. Campolettano, J. N. Press, B. Rowson, J. A. Smith, D. W. Sproule, A. M. Tyson and S. M. Duma. Biomechanical perspectives on concussion in sport. Sports Medicine and Arthroscopy Review. 24(3):100-7, 2016.
64. Brainard, L. L., J. G. Beckwith, J. J. Chu, J. J. Crisco, T. W. McAllister, A.-C. Duhaime, A. C. Maerlender and R. M. Greenwald. Gender differences in head impacts sustained by collegiate ice hockey players. Medicine & Science in Sports & Exercise. 44(2):297-304, 2012.
65. Hanlon, E. M. and C. A. Bir. Real-time head acceleration measurement in girls’ youth soccer. Medicine & Science in Sports & Exercise. 44(6):1102-8, 2012.
66. Wilcox, B. J., J. G. Beckwith, R. M. Greenwald, J. J. Chu, T. W. McAllister, L. A. Flashman, A. C. Maerlender, A.-C. Duhaime and J. J. Crisco. Head impact exposure in male and female collegiate ice hockey players. Journal of Biomechanics. 47(1):109-14, 2014.
67. Mertz, H. J., A. L. Irwin and P. Prasad. Biomechanical and scaling bases for frontal and side impact injury assessment reference values. Stapp Car Crash Journal. 47(155-88, 2003.
68. Ommaya, A. K., P. Yarnell, A. E. Hirsch and E. H. Harris. Scaling of experimental data on cerebral concussion in sub-human primates to concussion threshold for man. Proceedings of the 11th Stapp Car Crash Conference. SAE 670906(1967.
69. Barnes, B. C., L. Cooper, D. T. Kirkendall, T. P. McDermott, B. D. Jordan and W. E. Garrett. Concussion history in elite male and female soccer players. The American Journal of Sports Medicine. 26(3):433-8, 1998.
70. Broshek, D. K., T. Kaushik, J. R. Freeman, D. Erlanger, F. Webbe and J. T. Barth. Sex differences in outcome following sports-related concussion. Journal of Neurosurgery. 102(5):856-63, 2005.
71. Fakhran, S., K. Yaeger, M. Collins and L. Alhilali. Sex differences in white matter abnormalities after mild traumatic brain injury: Localization and correlation with outcome. Radiology. 272(3):815-23, 2014.
72. Frommer, L. J., K. K. Gurka, K. M. Cross, C. D. Ingersoll, R. D. Comstock and S. A. Saliba. Sex differences in concussion symptoms of high school athletes. Journal of Athletic Training. 46(1):76-84, 2011.
73. Queen, R. M., P. S. Weinhold, D. T. Kirkendall and B. Yu. Theoretical study of the effect of ball properties on impact force in soccer heading. Medicine & Science in Sports & Exercise. 35(12):2069-76, 2003.
74. Tierney, R. T., M. R. Sitler, C. B. Swanik, K. A. Swanik, M. Higgins and J. Torg. Gender differences in head-neck segment dynamic stabilization during head acceleration. Medicine & Science in Sports & Exercise. 37(2):272-9, 2005.
75. Bramlett, H. M. and W. D. Dietrich. Neuropathological protection after traumatic brain injury in intact female rats versus males or ovariectomized females. Journal of Neurotrauma. 18(9):891-900, 2001.
76. Roof, R. L. and E. D. Hall. Gender differences in acute CNS trauma and stroke: Neuroprotective effects of estrogen and progesterone. Journal of Neurotrauma. 17(5):367-88, 2000.
77. Dollé, J.-P., A. Jaye, S. A. Anderson, H. Ahmadzadeh, V. B. Shenoy and D. H. Smith. Newfound sex differences in axonal structure underlie differential outcomes from in vitro traumatic axonal injury. Experimental Neurology. 300(121-34, 2018.
78. Granito Jr, V. J. Psychological response to athletic injury: Gender differences. Journal of Sport Behavior. 25(3):243, 2002.
79. Anderson, M., K. M. Petit, J. Wallace, T. Covassin and E. Beidler. Factors associated with concussion nondisclosure in collegiate student-athletes. Journal of Athletic Training. 56(2):157-63, 2021.
10
80. Kontos, A. P., R. Elbin, P. Schatz, T. Covassin, L. Henry, J. Pardini and M. W. Collins. A revised factor structure for the post-concussion symptom scale: Baseline and postconcussion factors. The American Journal of Sports Medicine. 40(10):2375-84, 2012.
81. Miller, J. H., C. Gill, E. N. Kuhn, B. G. Rocque, J. Y. Menendez, J. A. O'Neill, B. S. Agee, S. T. Brown, M. Crowther and R. D. Davis. Predictors of delayed recovery following pediatric sports-related concussion: A case-control study. Journal of Neurosurgery: Pediatrics. 17(4):491-6, 2016.
82. Fuller, C. W., J. H. Brooks, R. J. Cancea, J. Hall and S. P. Kemp. Contact events in rugby union and their propensity to cause injury. British Journal of Sports Medicine. 41(12):862-7; discussion 7, 2007.
83. Fuller, C. W., A. Taylor and M. Raftery. Epidemiology of concussion in men's elite rugby-7s (sevens world series) and rugby-15s (rugby world cup, junior world championship and rugby trophy, pacific nations cup and english premiership). British Journal of Sports Medicine. 49(7):478-83, 2015.
84. Lopez, V., G. J. Galano, C. M. Black, A. T. Gupta, D. E. James, K. M. Kelleher and A. A. Allen. Profile of an american amateur rugby union sevens series. The American Journal of Sports Medicine. 40(1):179-84, 2012.
85. Barnes, A., J. L. Rumbold and P. Olusoga. Attitudes towards protective headgear in uk rugby union players. BMJ Open Sport Exercise Medicine. 3(1):e000255, 2017.
86. McIntosh, A. S., P. McCrory, C. F. Finch, J. P. Best, D. J. Chalmers and R. Wolfe. Does padded headgear prevent head injury in rugby union football? Medicine & Science in Sports & Exercise. 41(2):306-13, 2009.
87. McIntosh, A. S. and P. McCrory. Effectiveness of headgear in a pilot study of under 15 rugby union football. British Journal of Sports Medicine. 35(3):167-9, 2001.
88. Navarro, R. R. Protective equipment and the prevention of concussion - what is the evidence? Current Sports Medicine Reports. 10(1):27-31, 2011.
89. Wilson, B. D. Protective headgear in rugby union. Sports Medicine. 25(5):333-7, 1998. 90. Menger, R., A. Menger and A. Nanda. Rugby headgear and concussion prevention: Misconceptions
could increase aggressive play. Neurosurg Focus. 40(4):E12, 2016. 91. Kahanov, L., M. J. Dusa, S. Wilkinson and J. Roberts. Self-reported headgear use and concussions
among collegiate men's rugby union players. Research in Sports Medicine. 13(2):77-89, 2005. 92. Stokes, K. A., M. Cross, S. Williams, C. McKay, B. E. Hagel, S. W. West, S. P. Roberts, R. T.
Sant'Anna, E. Morrison and S. Kemp. Padded headgear does not reduce the incidence of match concussions in professional men's rugby union: A case-control study of 417 cases. International Journal of Sports Medicine. 2021.
93. Shuttleworth-Edwards, A. B., I. Smith and S. E. Radloff. Neurocognitive vulnerability amongst university rugby players versus noncontact sport controls. Journal of Clinical and Experimental Neuropsychology. 30(8):870-84, 2008.
94. McNabb, C., T. Reha, J. Georgieva, A. Jacques, K. Netto and A. P. Lavender. The effect of sub-concussive impacts during a rugby tackling drill on brain function. Brain Science. 10(12):2020.
95. Dyer, C. Rugby players plan negligence claim for chronic traumatic encephalopathy. BMJ. 371(m4789, 2020.
96. Marshall, S. W. and R. J. Spencer. Concussion in rugby: The hidden epidemic. Journal of Athletic Training. 36(3):334-8, 2001.
97. Hinton-Bayre, A., G. Geffen and P. Friis. Presentation and mechanisms of concussion in professional rugby league football. Journal of Science and Medicine in Sport. 7(3):400-4, 2004.
11
CHAPTER 2: ON THE USE OF WEARABLE SENSORS TO MEASURE
HEAD IMPACTS IN SPORTS
ABSTRACT
Head impact sensors allow researchers to learn more about human tolerance to concussive and repetitive
head impacts. These wearable devices have been implemented in helmets, headbands, skin patches,
mouthguards, and ear pieces in attempt to couple the device to the head to measure on-field kinematics of
athletes to correlate skull biomechanics to brain injury. The objective of this paper is to discuss head impact
sensors that are used on-field and explore their practicality and limitations. We present our experience using
two instrumented mouthguards, the Wake Forest Instrumented Retainer and the Prevent Biometrics
Intelligent Instrumented Mouthguard, to measure head impacts in athletes. We discuss data quality, athlete
compliance, general usability, and provide recommendations for future head impact sensor use.
Keywords: Biomechanics, Wearable Devices, Linear Acceleration, Rotational Acceleration
INTRODUCTION
With the prevalence of sports-related concussions and the consequences of long-term sequelae, head-impact
sensors are tools that can be used to supplement clinical findings for at risk-athletes, allowing us to
understand the effects of high magnitude or repetitive impacts. The concern of concussion biomechanics
led researchers to implement sensors in helmets of athletes who were subjected to repetitive head impacts
in their sports. The high head exposure rates in hockey and football were capitalized on, as sensors could
be mounted in their helmets to study the head kinematics associated with concussion. As concussion
awareness increased, more sensor devices have been developed for use independent of a helmet, so that
more populations of athletes in different loading conditions can be studied. The devices being implemented
for this research need to be accurate, with a high sensitivity, or proportion of head impacts correctly
identified as well as a high positive predictive value (PPV), or probability that there is a head impact when
the device records one. The objective of this paper is to discuss head impact sensors that are used on-field,
their practicality and limitations, and our experience using two mouthguards to measure head impacts in
athletes.
Current Head Impact Sensor Landscape
The first widely used sensor system was the Head Impact Telemetry (HIT) System implemented in football
helmets.1-3 With a proof of device usability and data collection, the sensor market expanded in the 2010s
with companies developing devices that could be used similarly in the field. Complications with many of
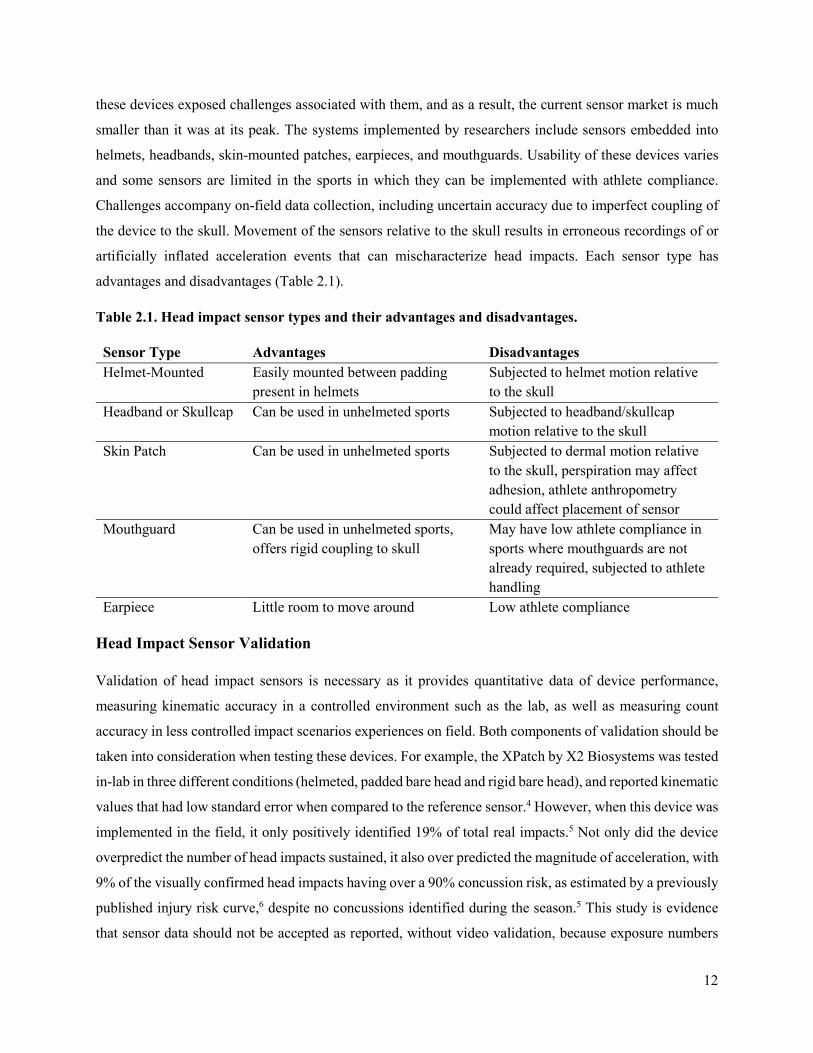
12
these devices exposed challenges associated with them, and as a result, the current sensor market is much
smaller than it was at its peak. The systems implemented by researchers include sensors embedded into
helmets, headbands, skin-mounted patches, earpieces, and mouthguards. Usability of these devices varies
and some sensors are limited in the sports in which they can be implemented with athlete compliance.
Challenges accompany on-field data collection, including uncertain accuracy due to imperfect coupling of
the device to the skull. Movement of the sensors relative to the skull results in erroneous recordings of or
artificially inflated acceleration events that can mischaracterize head impacts. Each sensor type has
advantages and disadvantages (Table 2.1).
Table 2.1. Head impact sensor types and their advantages and disadvantages.
Sensor Type Advantages Disadvantages Helmet-Mounted Easily mounted between padding
present in helmets Subjected to helmet motion relative to the skull
Headband or Skullcap Can be used in unhelmeted sports Subjected to headband/skullcap motion relative to the skull
Skin Patch Can be used in unhelmeted sports Subjected to dermal motion relative to the skull, perspiration may affect adhesion, athlete anthropometry could affect placement of sensor
Mouthguard Can be used in unhelmeted sports, offers rigid coupling to skull
May have low athlete compliance in sports where mouthguards are not already required, subjected to athlete handling
Earpiece Little room to move around Low athlete compliance
Head Impact Sensor Validation
Validation of head impact sensors is necessary as it provides quantitative data of device performance,
measuring kinematic accuracy in a controlled environment such as the lab, as well as measuring count
accuracy in less controlled impact scenarios experiences on field. Both components of validation should be
taken into consideration when testing these devices. For example, the XPatch by X2 Biosystems was tested
in-lab in three different conditions (helmeted, padded bare head and rigid bare head), and reported kinematic
values that had low standard error when compared to the reference sensor.4 However, when this device was
implemented in the field, it only positively identified 19% of total real impacts.5 Not only did the device
overpredict the number of head impacts sustained, it also over predicted the magnitude of acceleration, with
9% of the visually confirmed head impacts having over a 90% concussion risk, as estimated by a previously
published injury risk curve,6 despite no concussions identified during the season.5 This study is evidence
that sensor data should not be accepted as reported, without video validation, because exposure numbers
13
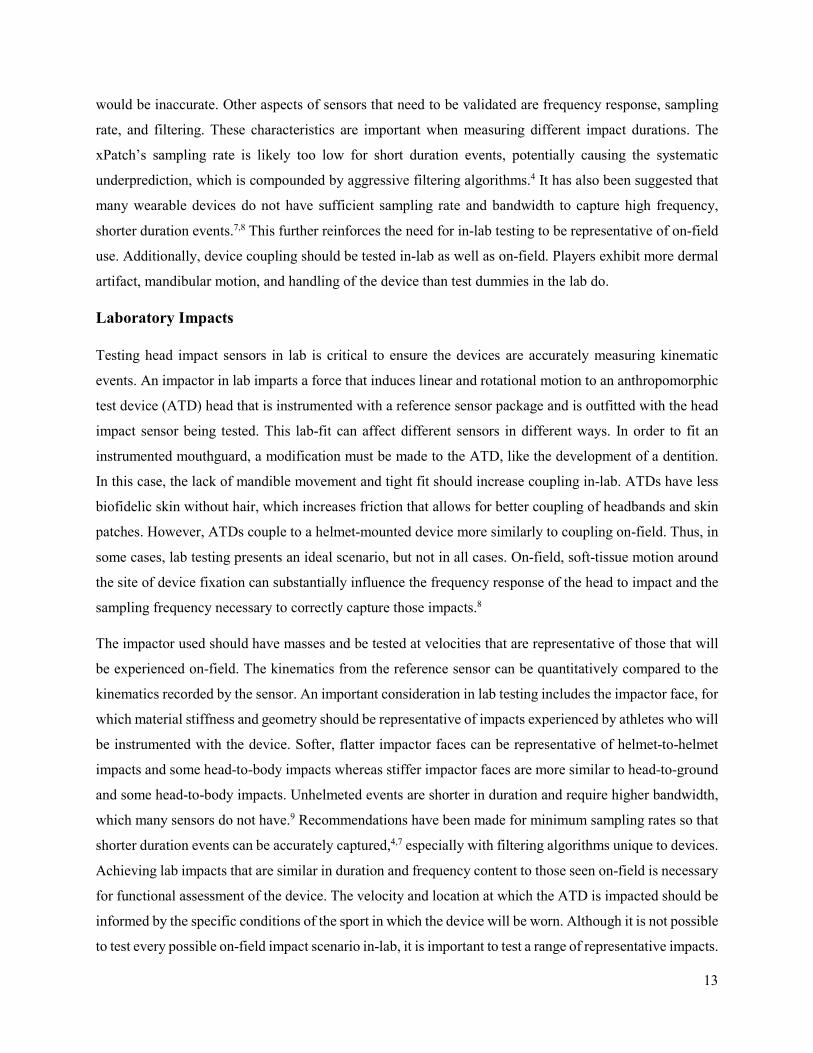
would be inaccurate. Other aspects of sensors that need to be validated are frequency response, sampling
rate, and filtering. These characteristics are important when measuring different impact durations. The
xPatch’s sampling rate is likely too low for short duration events, potentially causing the systematic
underprediction, which is compounded by aggressive filtering algorithms.4 It has also been suggested that
many wearable devices do not have sufficient sampling rate and bandwidth to capture high frequency,
shorter duration events.7,8 This further reinforces the need for in-lab testing to be representative of on-field
use. Additionally, device coupling should be tested in-lab as well as on-field. Players exhibit more dermal
artifact, mandibular motion, and handling of the device than test dummies in the lab do.
Laboratory Impacts
Testing head impact sensors in lab is critical to ensure the devices are accurately measuring kinematic
events. An impactor in lab imparts a force that induces linear and rotational motion to an anthropomorphic
test device (ATD) head that is instrumented with a reference sensor package and is outfitted with the head
impact sensor being tested. This lab-fit can affect different sensors in different ways. In order to fit an
instrumented mouthguard, a modification must be made to the ATD, like the development of a dentition.
In this case, the lack of mandible movement and tight fit should increase coupling in-lab. ATDs have less
biofidelic skin without hair, which increases friction that allows for better coupling of headbands and skin
patches. However, ATDs couple to a helmet-mounted device more similarly to coupling on-field. Thus, in
some cases, lab testing presents an ideal scenario, but not in all cases. On-field, soft-tissue motion around
the site of device fixation can substantially influence the frequency response of the head to impact and the
sampling frequency necessary to correctly capture those impacts.8
The impactor used should have masses and be tested at velocities that are representative of those that will
be experienced on-field. The kinematics from the reference sensor can be quantitatively compared to the
kinematics recorded by the sensor. An important consideration in lab testing includes the impactor face, for
which material stiffness and geometry should be representative of impacts experienced by athletes who will
be instrumented with the device. Softer, flatter impactor faces can be representative of helmet-to-helmet
impacts and some head-to-body impacts whereas stiffer impactor faces are more similar to head-to-ground
and some head-to-body impacts. Unhelmeted events are shorter in duration and require higher bandwidth,
which many sensors do not have.9 Recommendations have been made for minimum sampling rates so that
shorter duration events can be accurately captured,4,7 especially with filtering algorithms unique to devices.
Achieving lab impacts that are similar in duration and frequency content to those seen on-field is necessary
for functional assessment of the device. The velocity and location at which the ATD is impacted should be
informed by the specific conditions of the sport in which the device will be worn. Although it is not possible
to test every possible on-field impact scenario in-lab, it is important to test a range of representative impacts.
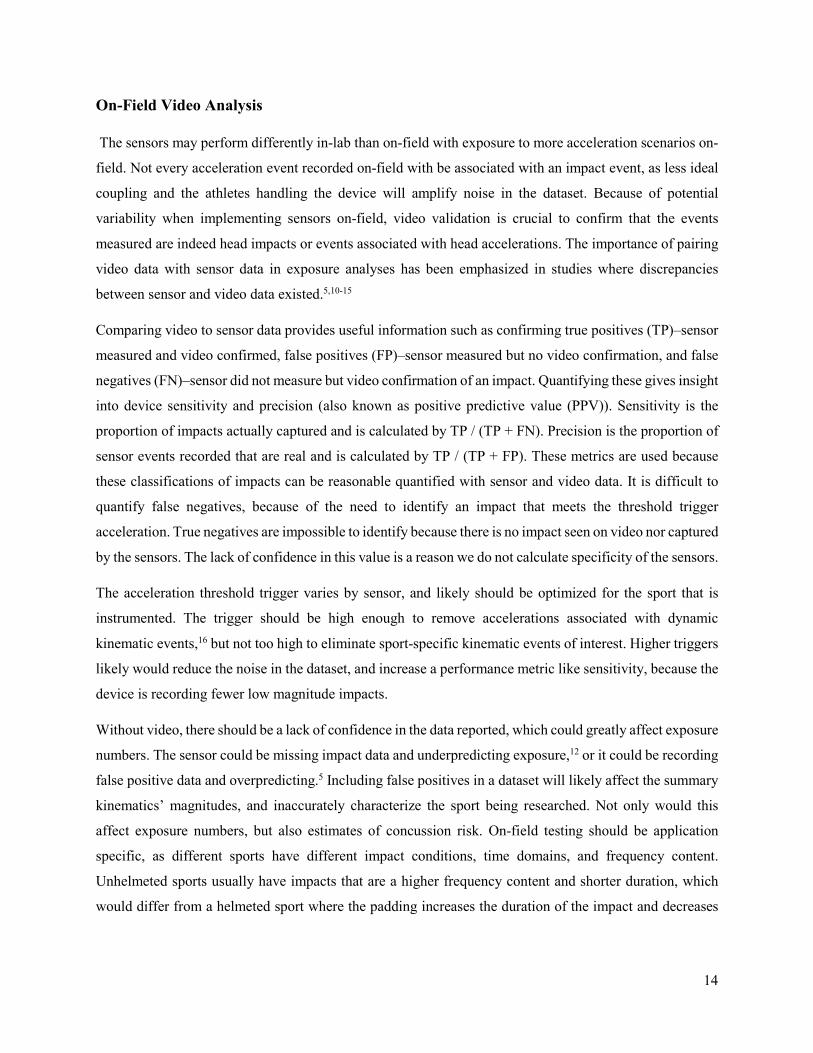
14
On-Field Video Analysis
The sensors may perform differently in-lab than on-field with exposure to more acceleration scenarios on-
field. Not every acceleration event recorded on-field with be associated with an impact event, as less ideal
coupling and the athletes handling the device will amplify noise in the dataset. Because of potential
variability when implementing sensors on-field, video validation is crucial to confirm that the events
measured are indeed head impacts or events associated with head accelerations. The importance of pairing
video data with sensor data in exposure analyses has been emphasized in studies where discrepancies
between sensor and video data existed.5,10-15
Comparing video to sensor data provides useful information such as confirming true positives (TP)‒sensor
measured and video confirmed, false positives (FP)‒sensor measured but no video confirmation, and false
negatives (FN)‒sensor did not measure but video confirmation of an impact. Quantifying these gives insight
into device sensitivity and precision (also known as positive predictive value (PPV)). Sensitivity is the
proportion of impacts actually captured and is calculated by TP / (TP + FN). Precision is the proportion of
sensor events recorded that are real and is calculated by TP / (TP + FP). These metrics are used because
these classifications of impacts can be reasonable quantified with sensor and video data. It is difficult to
quantify false negatives, because of the need to identify an impact that meets the threshold trigger
acceleration. True negatives are impossible to identify because there is no impact seen on video nor captured
by the sensors. The lack of confidence in this value is a reason we do not calculate specificity of the sensors.
The acceleration threshold trigger varies by sensor, and likely should be optimized for the sport that is
instrumented. The trigger should be high enough to remove accelerations associated with dynamic
kinematic events,16 but not too high to eliminate sport-specific kinematic events of interest. Higher triggers
likely would reduce the noise in the dataset, and increase a performance metric like sensitivity, because the
device is recording fewer low magnitude impacts.
Without video, there should be a lack of confidence in the data reported, which could greatly affect exposure
numbers. The sensor could be missing impact data and underpredicting exposure,12 or it could be recording
false positive data and overpredicting.5 Including false positives in a dataset will likely affect the summary
kinematics’ magnitudes, and inaccurately characterize the sport being researched. Not only would this
affect exposure numbers, but also estimates of concussion risk. On-field testing should be application
specific, as different sports have different impact conditions, time domains, and frequency content.
Unhelmeted sports usually have impacts that are a higher frequency content and shorter duration, which
would differ from a helmeted sport where the padding increases the duration of the impact and decreases
15
the frequency content.4 It is necessary that the settings of the sensor are appropriate for the conditions
relevant to the sport.
Some devices have algorithms that filter recorded events and discard events that do not share pulse
characteristics similar to those of lab head impacts. Video analysis is used to time-synchronize sensor data
in order to confirm measurements on-field. Video should be taken from a midpoint of the field, preferably
with a higher elevation, focusing on the instrumented athlete(s), and keeping them in field of the camera at
all times. In contact team sports, the opportunity exists for impacts to be obstructed from a single camera’s
view, which is why multiple camera angles from elevated heights are helpful to identify impacts. However,
when impacted players are underneath other players, the situation surrounding their impact could still be
unknown. It is also important that video reviewers are trained so that impacts can be identified accurately
and consistently. If multiple people are reviewing video, it is important to assess inter-rater reliability.10
HEAD IMPACT SENSOR USER EXPERIENCES
We have implemented and evaluated two instrumented mouthguards, Prevent Biometrics and Wake Forest
University (Figure 2.1Error! Reference source not found.), for on-field use by collecting and validating
head kinematic data from non-helmeted rugby players, assessing impact counts, discussing usability, and
providing recommendations for future data collection. The athletes in this IRB-approved study were
Virginia Tech men’s and women’s club rugby players and provided written, informed consent. They were
custom fit with a mouthguard from either Wake Forest University or Prevent Biometrics, with a similar
process of taking 3-diminsional images and reconstructing a dentition for mouthguard molding. It was
recommended for both companies that athletes who wear braces not be fit for these mouthguards. We
compensated our athletes for participating in the study which may have positively affected compliance.
Figure 2.1. (A) Wake Forest University Mouthguard with instrumentation along the upper palate and (B) Prevent Biometrics mouthguard with instrumentation along the teeth.
Many wearable head impact sensors perform inconsistently, depending on impact conditions, and can be
inaccurate in peak kinematics, impact count, and impact location.5,10-15 An instrumented mouthguard has
the potential for nearly perfect coupling to the skull by being custom-fit to the upper dentition, addressing
some limitation of previous devices. However, when players put their mouthguards in, or take them out of
their mouth, or handle them when they are not actively playing, acceleration events may be triggered. This
A B
16
reinforces the need for thorough video validation when using any type of head impact sensor. Without video
verification, it is impossible to quantify head impact exposure accurately, even with good coupling. Time-
syncing video to impact data allows for the classification and quantification of true positive and false
positive events. When calculating PPV, establishing temporal bounds of play can greatly affect the
outcome. For our study we included any accelerations that occurred during the time of play in the dataset.
Water breaks, half times, and minutes of play that the athlete was not actively participating in a drill or
game were included in this time segment. Subjects handling the devices during breaks from play likely
resulted in many false-positive events. If these “inactive minutes” were removed from analysis, the PPV
values would likely be higher for each device, although this value was not quantified. Overall, Prevent
Biometrics’ device had a PPV of 6.20% and Wake Forest’s device had a PPV of 14.39%.
Despite the video validation, the dataset still includes several suspiciously high accelerations measured for
verified impacts. We removed three acceleration events from the original dataset based on the inconsistency
in reported magnitude of kinematics and the video-observed impact. We had seven concussions which
resulted in no data. In four of these cases (1 Wake Forest, 3 Prevent), the athlete’s device seemed to be
functioning and recording data leading up to the concussive impact. It is difficult to quantify events seen
on film that are false negatives because it is impossible to visually identify if an impact observed yielded
an acceleration over 10 g for most impacts. However, missing data from these concussions raises awareness
for other potential false negatives that might have been missed. There were at least 17 sessions for which a
Prevent mouthguard did not function and 4 sessions of the Wake mouthguard not functioning.
Acceleration and velocity traces were verified for each impact, confirming that the peak of the event was
captured, the mouthguard recorded an actual impact, not just triggered on mouthguard motion, and the
collection did not include a secondary event or impact that could be more representative of the impact
observed on-field. Verifying the shape of the event trace was also important to measuring impact duration,
ensuring there was a clear start and end of the peak.
Wake Forest University Instrumented Retainer
Athlete Compliance
Rugby requires the use of a mouthguard, so the athletes were accustomed to playing while wearing one,
and even liked the instrumented one due to the custom-fit. However, there was some pushback on the size
of the device and its feel. Wake Forest houses their instrumentation along the hard palate of the mouth in a
hard, acrylic retainer and they added a polymer guard to protect the athletes’ teeth. Lack of comfort was the
primary reason for athlete non-compliance, as the device reached too high on their lingual surface, making
them gag and trapping their saliva, making it difficult to spit. Wake Forest shaved down the extra material
17
on the lingual surface as much as possible, which helped many athletes. However, we still had athletes who
could not wear them due to their lack of comfort. Often the coupling to the athlete’s teeth was so good, that
they could not remove the mouthguard on their first try. The devices loosened with wear and the subjects
could remove them more comfortably. Wake Forest has since attempted to set the instrumentation closer to
the teeth, requiring less material on the hard palate.
Data Quality
We had one player sustain a concussion after she was kicked in the head after diving to the ground. The
kinematics reported by her mouthguard were 14.2 g and 5.7 rad/s, which deserves scrutiny. Likely the
athlete’s body impacting the ground and the athlete’s head being kicked were two different acceleration
events. The kinematic values attributed to this concussion are likely the result of the ground impact. The
kick occurred about 167 ms after the ground impact, which is in the 300 ms window that the Wake Forest
mouthguard was preparing for the next impact. Awareness of turnover time between impacts is necessary
to accurately verify on-field kinematic data. Body-then-head acceleration events within the turnover
window are likely common. This complicates video verification, because it is challenging to visually
identify if a body impact prior to a head impact is high enough in magnitude to trigger data acquisition and
if events occur within device turnover time. Wake does not use any data filtering methods to reduce the
number of false positives in their dataset.
General Usability
The device developed by Wake Forest is newer and intended for use as a research tool. Their charging
boxes inconsistently functioned, the wireless charging coils were not always well aligned, and there was no
indication that the device was fully charged. Many issues involved Bluetooth connectivity, either before or
after the game. This limited our ability to set the devices for acquisition and download data. Each device
needed to be set up individually in a proprietary application to acquire data before a session. This was
generally challenging with 30 devices, all competing with Bluetooth, on the sideline of a rugby field. They
recently added a time delay feature, allowing the researcher to set the devices up in the lab, delaying
acquisition until the researcher traveled to the field and the session began. The researcher could choose how
many impacts should be recorded in the session, which in theory is an advantage, but with exploratory
research that number is difficult to know, especially because any time the athletes registers a false positive
event, that is counted in the impact number. This generally resulted in the maximum event collection (300
impacts) which sometimes was exceeded. As with the acquisition process, the downloading process is done
individually for each mouthguard. You can download data from up to two devices at once on one smart
tablet, but downloading 300 impacts took about 34 minutes. We used more than one tablet, but the process

18
still was very time consuming for an entire team of athletes. Wake Forest’s devices also had intermittent
gyroscope failure, and some of the internal clocks did not sync, both resulting in data that was erroneous
and unusable. The battery life on the Wake devices was shorter and there were issues with the charging
cases not working, causing several mouthguards to die mid-session. As the seasons progressed, both
companies made durability and usability improvements.
Prevent Biometrics
Athlete Compliance
The majority of the athletes did not complain about the comfort of the Prevent device, although the size of
the device was larger than they were accustomed to. Prevent houses their instrumentation on the outside of
the teeth, which made it difficult for the subject to close their mouth fully around the device. The material
was fairly compliant and flexible.
Data Quality
Prevent uses two methods to reduce the collection of false positives: sensors on the device to detect if the
athlete has the mouthguard on their teeth and a proprietary algorithm to identify head impacts
characteristics. This algorithm is optimized for helmeted athletes and not intended to work for non-helmeted
athletes. We turned off the algorithmic filtering so that actual events were not removed from the data (false
negatives). In pilot testing with Prevent’s device, we missed a head-to-head concussion because their
filtering algorithm was based on helmeted impacts, which differ from unhelmeted impacts in frequency
content and duration. Their algorithm discarded this concussion and other head-to-head impacts as their
high frequency and short duration were unlike typical helmeted impacts. The sensors that determine if the
device is on the teeth were still used but were imperfect, and commonly fooled when the athlete put the
device in or took it out of their mouth.
General Usability
As Prevent Biometrics intends for their device to be used commercially, their app interface, website,
equipment, and data download process were user friendly. Their cases delivered charge and UV light
sanitation while the mouthguards were put away. Some issues we encountered were: Bluetooth interference,
which usually could be addressed by taking a mouthguard away from competing devices, overwritten data,
which was addressed by using a mobile hotspot during games so locally stored data could be uploaded to
the cloud, and the material Prevent was using was so flexible that components of the instrumentation would
disconnect, rendering the device non-functioning. Sometimes you could manually manipulate the
mouthguards so that the instrumentation could reconnect again, but in the following season, Prevent chose
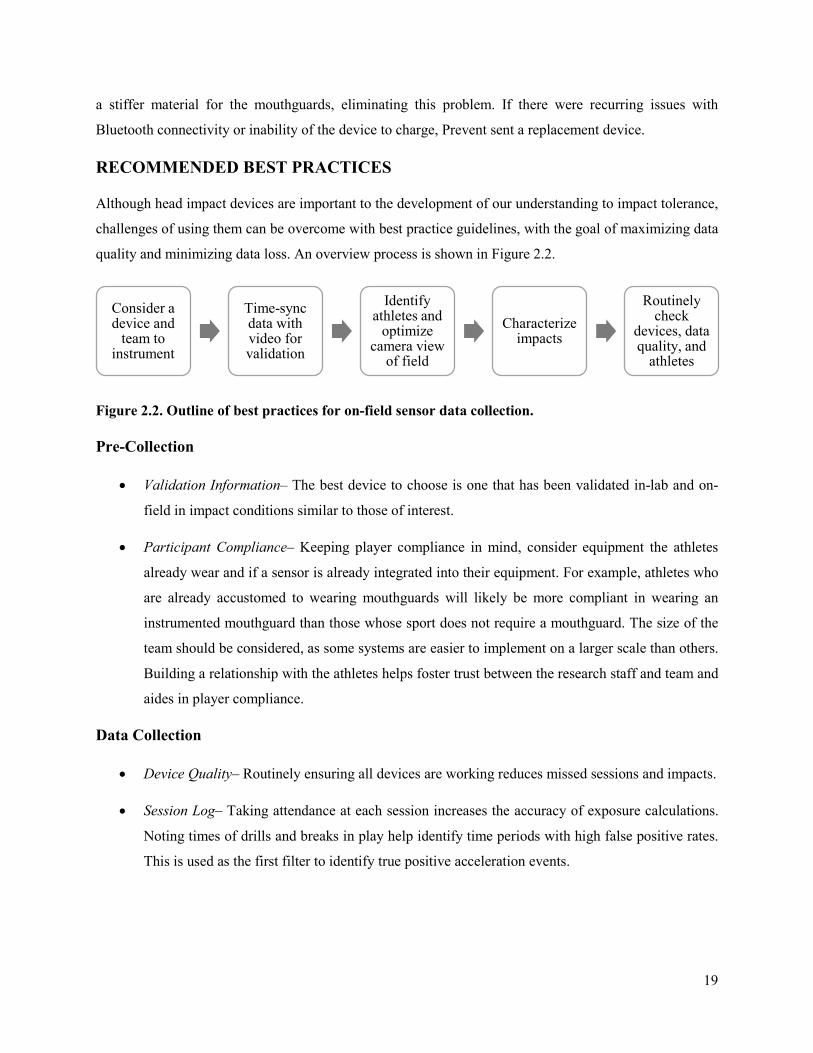
19
a stiffer material for the mouthguards, eliminating this problem. If there were recurring issues with
Bluetooth connectivity or inability of the device to charge, Prevent sent a replacement device.
RECOMMENDED BEST PRACTICES
Although head impact devices are important to the development of our understanding to impact tolerance,
challenges of using them can be overcome with best practice guidelines, with the goal of maximizing data
quality and minimizing data loss. An overview process is shown in Figure 2.2.
Figure 2.2. Outline of best practices for on-field sensor data collection.
Pre-Collection
• Validation Information‒ The best device to choose is one that has been validated in-lab and on-
field in impact conditions similar to those of interest.
• Participant Compliance‒ Keeping player compliance in mind, consider equipment the athletes
already wear and if a sensor is already integrated into their equipment. For example, athletes who
are already accustomed to wearing mouthguards will likely be more compliant in wearing an
instrumented mouthguard than those whose sport does not require a mouthguard. The size of the
team should be considered, as some systems are easier to implement on a larger scale than others.
Building a relationship with the athletes helps foster trust between the research staff and team and
aides in player compliance.
Data Collection
• Device Quality‒ Routinely ensuring all devices are working reduces missed sessions and impacts.
• Session Log‒ Taking attendance at each session increases the accuracy of exposure calculations.
Noting times of drills and breaks in play help identify time periods with high false positive rates.
This is used as the first filter to identify true positive acceleration events.
Consider a device and
team to instrument
Time-sync data with video for validation
Identify athletes and
optimize camera view
of field
Characterize impacts
Routinely check
devices, data quality, and
athletes
20
• Video Verification‒
o Athlete Identification‒ Knowing the athletes and being able to identify them while they are
playing is very helpful, especially if they do not wear identifying jerseys in practice, or if
the sport involves plays that involve several of the players at once.
o Camera View‒ The camera should be positioned at midfield, preferably at a higher
elevation to maximize field of view. Filming should be sports-specific. For example, a
larger field of view is required in sports like football where it is more likely for multiple
athletes across the field to experience contact; whereas in soccer, contact, as well as the
camera view, is centered around the ball, with only a few athletes who could potentially
engage in contact.
o Time-Syncing Video with Data‒ It can also give context to false positive impacts, if the
athletes are handling their devices in between plays or while they are on the sideline during
a game. When the data are time-synced, you can identify each impact recorded by the
sensor, and find it in the video, and characterize it as a true positive or false positive. In
this method, you can also compare the observed impact severity and the recorded
magnitude. This is an opportunity to note discrepancies between the two, possibly
identifying a secondary peak in the data trace or secondary impact outside of the data
collection window. These cases should be handled on an individual basis, potentially
excluding them from kinematic analyses but included in impact counts summaries.
Regularly checking the quality of data with video helps ensure data is correctly collected.
• Categorizing Impacts‒ Video validation also gives context to the impacts measured. Providing
information like what the athlete impacted, where, and what they were doing sheds light on head
impact mechanisms in the sport.
Post-Collection
• Data Quality‒ Checking the acceleration traces provides more insight into each impact, and is
another layer of data quality assurance. The general shape of the trace, frequency content, and
impact duration should be similar to what is expected for the given impact condition. If there are
traces that are not similar to what is expected and they will add error or bias in the dataset, exclusion
from the final dataset can be considered.
• Summarizing Data‒ When summarizing data, it would be best to summarize data first per-player,
and then for the team. This minimizes sampling bias so players with many impacts do not outweigh
21
the players with only a few impacts. It limits the opportunity for athletes with increased exposure
to acceleration events to bias the computed metrics.
CURRENT HEAD IMPACT SENSOR SPACE
Helmet-Mounted Sensors
Helmet mounted sensors present the first significant movement in the head impact space, allowing for a
widespread data collection of helmeted athletes. The limitation with these devices is relative helmet motion
to the head, although some systems have countermeasures to help accuracy.
Riddell Head Impact Telemetry System
The Head Impact Telemetry System (HITS) integrates a telemetry-based measurement and analysis system
with a computational algorithm to provide a wireless sensor system with real-time continuous monitoring
of head acceleration data from players on the field.1-3 The HITS device used 6 single-axis accelerometers
that fit into a Riddell Helmet. Researchers have implemented a 6 degree of freedom (6DOF) system with
the standard HITS device, which uses 12 single-axis accelerometers that positioned normally to the skull,
to monitor football players.1,17-23 This system has also allowed for continuous head impact monitoring of
athletes in hockey,24-31 boxing,32,33 soccer34, and snow sports.35 It has been used in lab to measure the
magnitude of soccer headers.36 HITS triggers on a 14.4 g acceleration on a single axis, and records 8 ms of
pre-impact and 32 ms of post-impact linear acceleration data at a sampling rate of 1000 Hz.
HITS has been validated in lab with pendulum impact testing, resulting in mean errors for linear
acceleration of 4% and rotational acceleration of 17%,37 showing good agreement between measured
accelerations of anthropomorphic test device (ATD) headform and HIT System.38 HITS has also been tested
with linear impactors and found to overestimate linear acceleration39 by 1% and underestimate rotational
acceleration by 6%.40 In one study, HITS identified 19% of impacts as perturbations and removed the data,
but otherwise correlated with the ATD headform data.24 Another study compared the size of helmet on the
performance of HITS, and found root-mean-square (RMS) errors of up to 18% and 66% for linear
acceleration and rotational acceleration for large helmets, although the high errors were associated with
impacts to the facemask.41 Impacting the shell of the helmet resulted in lower RMSE values.41 The HIT
System is associated with single impact random measurement error of 15.7% for linear acceleration and
31.7% for rotational acceleration.42,43 However, when data are aggregated, the effect of these random
measurement errors are reduced.42,43
Authors have noted the sensor’s interaction with helmet pads and movement in the helmet, potentially affect
the results of validation studies.39 The helmet is more susceptible to motion than the head, potentially
22
affecting the kinematics measured by an in-helmet system. However, the spring -based system in HITS
keeps the accelerometers in contact with the skull during head motion. This system is rather robust, easy to
instrument on a large scale, and straightforward to collect and download data. It has been widely used for
the collection of football head impact data that has been used to develop a concussion risk function for adult
male athletes6,44,45 and youth athletes,46 improve helmet design,47-49 and implement rule changes in Pop
Warner43 and the National Football League to keep the game safer.
InSite Impact Monitoring System
The Riddell InSite Impact Monitoring System is a flexible pressure-based insert that can be fit into a football
helmet and used primarily used as a coaches’ tool to measure impact count and severity. The system using
a proprietary algorithm to classify hits as “high,” “medium,” or “low” and signals “high impacts” with the
intention of medically evaluating the particular athlete. It has been implemented in youth football.50 The
lack of quantitative output data limit’s the device’s use in research.
GForceTracker
The GForceTracker is comprised of a triaxial accelerometer and gyroscope that allows for the continuous
collection of head impact data in real-time.51 This sensor samples linear acceleration at 3000 Hz and angular
velocity at 800 Hz, with the angular velocity signal passing through a low-pass filter with a cut-off
frequency of 100 Hz.51 The GForceTracker has been used to study exposure in men’s lacrosse,52-55 soccer.56
and football.57,58 It has been used in-lab to measure head impact kinematics in hockey59 and football.60
Accuracy of the GForceTracker was measured with a linear impactor, initially demonstrating differences
up to 150%.59 However, after applying a regression that took impact direction into account, mean absolute
errors were all lower than 15%. The authors recommended helmet-brand specific correction algorithms be
developed to transform the raw data to the center of gravity (CG) of the head.59 With a correction algorithm
applied, validation tests showed a strong correlation between sensor data and ATD linear acceleration
(R2=0.97) and rotational velocity (R2=0.94). Without device specific correction algorithms, the data are
quite prone to error, in addition to the error of relative head-helmet motion in helmet-based systems.
Shockbox Helmet Sensor
The i1 Biometrics Shockbox Helmet Sensor uses four binary switches to measure differential voltage
instead of a traditional accelerometry system.61 It has been used to measure head impact exposure in youth
football players.62,63 In-lab validation studies show an aggregate difference of 9% between Shockbox and
the reference headform data.64 Also tested with an impact hammer in lab, peak linear accelerations were
shown to have RMS errors of 92-298%.39 With RMS errors as large as they are in a controlled setting like
23
the lab, it is necessary to be skeptical of data collected on-field, as there are many confounding factors that
affect sensor performance in vivo.
Headband or Skull Cap Based Sensors
Headband and skull cap-based sensors attempt to fit head impact sensors closer to the head and can be worn
independently of helmets. However, these devices still do not provide perfect coupling to the skull, and are
limited in consistent measurements.
Checklight
The Checklight is a sensor device that fits into the back of a skull cap and categorizes impact data into
“mild,” “intermediate,” and “severe” impacts, and indicates magnitude by a green, yellow, or red light,
respectively.65 This device was implemented in a youth football setting.66 In validation testing, a football
helmet was placed on an ATD, over the instrumented skull cap and triggered the red light at an impact
magnitude of 123 g delivered by an impact hammer.39 Sensor location was tracked by fiducial grids and
high-speed video, and showed the skullcap had RMS errors of 16% for peak anterior-posterior linear
acceleration and 13% for both peak inferior-superior linear acceleration and peak angular velocity in the
sagittal plane.9
This sensor is not very useful for head impact studies because there is no way to extract raw data, it does
not allow for real-time sideline monitoring, and the threshold limits are unknown. A group that used this
also noted management issues including inability to visualize the LED lights in direct sunlight or under the
lights at night.66 Additionally, a skull cap worn under a helmet potentially undergoes some amount of
movement relative to the skull.
SIM-G
Triax Technologies developed the SIM-G Head Impact Sensor which houses a triaxial gyroscope and two
triaxial accelerometers, high-g, and low-g, mounted on a headband.67 Exposure has been quantified in
soccer,68,69 football,70,71 flag football,71,72 and lacrosse.73 This sensor has also been implemented into water
polo caps to quantify head impact exposure in men’s and women’s collegiate club water polo.11 However,
this group noted the inaccuracies of kinematic measures of the SIM-G during validation testing.12 The
proprietary SIM-G algorithm for classifying true and false positives only classified 55% of impacts
correctly, and identified the correct impact location in 68% of those impacts.12 The developers validated
their device with a pendulum impactor, but measured poor correlation of peak linear acceleration (R2=0.84)
and peak angular acceleration (R2=0.78) to the reference sensor.67 When tested with an impact hammer, the
SIM-G compared to the headform data with RMS errors of 18-75% over the impact locations tested.39 This
24
device has also demonstrated higher variance in laboratory testing, underpredicting linear acceleration,
rotational velocity, and rotational acceleration in helmeted tests.4
The ability to house the SIM-G in a headband allows for the collection of data in unhelmeted sports, but
external devices on the head can shift around and the presence of hair motion can potentially confound the
kinematics measures, especially in the absence of video review.
Skin Patches
Skin patch-based sensors are not limited to head-gear, and can be applied directly on the skin, allowing for
more opportunities of on-field data collection. However, this type of skin-adhered patch is susceptible to
dermal artifact, as the skin moves relatively to the skull, potentially contributing to sensor inaccuracy.74
X2 X-Patch
The X2 X-Patch is a small skin-patch based sensor worn over the mastoid process and comprised of a
triaxial accelerometer and gyroscope. The linear acceleration data are sampled at 1000 Hz and rotational
velocity data are sampled at 800 HZ, and transformed to the CG with rigid body dynamics.75 This sensor
has been used to collect head impact data for athletes in soccer,5,13,76 football,77,78 lacrosse,79 ice hockey,74
Australian football,80-83 taekwondo,84 and rugby.85-87 Several of these studies have used video validation to
confirm impacts, and noted its importance with sensors such as X-Patch, which lack consistent reliability
studies.13 Another group noted only a 19% true positive rate when comparing impact data to video validated
data.5 Validation included impacting a Hybrid III head and neck with three different sports balls and showed
poor agreement between ATD and sensor peak linear acceleration (PLA) and peak rotational acceleration
(PRA), especially as stiffness of the ball increased.8 Other groups have attempted to validate the X-Patch
in lab, with little success.4,9,39 Authors suspected the content of the impact signal was above the sensor’s
Nyquist frequency.8
Research have noted instances of device malfunction, including premature loss of battery and time stamp
corruption leading to data loss.74 X-Patch’s proprietary algorithm removes errant data from the dataset, and
if these impacts are not identified appropriately, there could be a misleading false positive rate.74
Additionally, there is no report of the potential influence of between-subject anatomic variability on X-
Patch’s impact location algorithm.74
Mouthguards
Instrumented mouthguards allow for ideal skull-coupling and opportunity for rigid-body dynamics.
Athletes not accustomed to intra-oral devices may be less compliant if the mouthguard lacks comfort, but
25
the accuracy of these wearable sensors presents a great opportunity for data collection in many populations
of athletes.
X2 Impact Mouthguard
Similar to the X-Patch, the X2 Impact mouthguard houses a triaxial accelerometer and gyroscope and
samples linear acceleration at 1000 Hz and angular velocity at 800 Hz. A collegiate football team was
instrumented with this device.88,89 This mouthguard has been used in an amateur rugby union team, with
the authors noting saliva ruining some of the components preventing impact data from being downloaded.14
Although this device has an impedance-based saliva sensor to determine if the mouthguard is in the mouth,90
the authors noted that about 65-85% of the impacts recorded per match could be verified in video review.14
This device was validated in lab, and showed normalized RMS errors around 10% for peak linear
acceleration, angular acceleration, and angular velocity.90 When they fit well, mouthguards offer a potential
solution to better coupling to the jaw, hopefully reducing the relative motion between the brain and sensor.
When testing mandible interaction in lab, researchers recommend mouthguard design to minimize noise by
isolating sensors from mandible loads.91
Prevent Biometrics Impact Monitoring Mouthguard
Prevent Biometrics acquired X2, and began to market their own ‘intelligent mouthguard,’ which had been
developed at the Cleveland Clinic.92-94 The impact monitoring mouthguard (IMM) has two sensing
packages: the first with 12 channels of linear acceleration and the second with three channels of linear
acceleration and three channels of angular velocity.95 The device samples data at 3200 Hz and off-loads
data wirelessly in real time via Bluetooth low energy to the iOS Prevent app and stores 460 impacts
locally.95 A cutoff frequency of 400 Hz is used to filter the data. A transformation formula based on a
medium NOCSAE headform is used to transform data to the head CG. The mouthguard requires 25 ms in-
between impacts. It has been used to monitor head impacts in football players95,96 and boxers.96 In laboratory
testing, the device was shown to compare well to the reference sensor in bare head (PLA: R2 = 0.95, PAA:
R2 = 0.94, and PRV: R2 = 0.92) and padded (PLA: R2 = 0.97, PAA: R2 = 0.90, and PRV: R2 = 0.93) impact
conditions.95
Stanford University Instrumented Mouthguard
Stanford University developed an instrumented mouthguard with a triaxial high-range accelerometer,
gyroscope, an infrared proximity sensor to determine if the mouthguard is on the teeth, and a support vector
machine classifier that was trained on frequency domain features of linear acceleration and rotational
velocity.97 In their lab validation tests with high speed video, their mouthguard had RMS errors of 16%,
26
18%, and 12% for peak anterior-posterior linear acceleration, peak inferior-superior linear acceleration, and
peak angular velocity in the sagittal plane, and showed close skull coupling when the jaw was clenched.9
Implemented in football players, this group acknowledged the need for video validation, as the device only
detected 71.2% of the video identified head impact events.10
Wake Forest University Instrumented Retainer
Wake Forest University has also developed a mouthpiece sensor that contains an accelerometer and
gyroscope that are embedded in a rigid retainer form, to couple with the upper dentition.15,98 Wake Forest’s
device sampled the accelerometers at 4684 Hz and the gyroscope at 1565 Hz. They used CFC 2000 to filter
the acceleration data and CFC 270 to filter the angular rate data. Subject-specific transformations were
applied to the Wake Forest device data to the head CG. Their device requires 300 ms in-between impacts
to prepare for acquisition. This device has been used in youth female soccer players with a sensitivity of
69.2% and a PPV of 80.3%.15,99 Pendulum validation studies slowed strong correlation between linear
acceleration (R2 = 0.95), angular velocity (R2 = 1.00), and angular acceleration (R2 = 0.97) of the
instrumented headform.15
i1 Biometrics Vector Mouthguard
This mouthguard is equipped with a tri-axial accelerometer and a tri-axial gyroscope to measure linear
acceleration, rotational acceleration, impact location, and impact frequency. The instrumentation sits
external to the mouth, attached to the front of the mouthguard. No peer-reviewed publications quantify the
performance of the Vector mouthguard. Little work has been published with this device, only studying the
head impact exposure in American football players from Japanese Universities,100,101 a pilot studying
comparing mitochondrial DNA levels to head impact exposure in football players,102 and the effect of level
of contact in football players.103
Other
Endevco Ear Plugs
Small ear plugs contain a ± 500 g’s Endevco 7269 tri-axial accelerometer that collect data at 2000 Hz.104
These ear plugs have been validated105 and used to measure head accelerations during soccer heading.104
The participants wore pre-wrap around the head to keep the sensors in place. Authors note that the coupling
and reliability of recordings improved in lab tests.106

27
DISCUSSION
There is great potential to use head impact sensors to collect on-field data and learn more about head impact
kinematics and concussion biomechanics. However, there are pros and cons to each type, and considerations
need to be made to choose the device most suitable for the population of interest. Additionally, steps and
precautions are needed to ensure quality data collection. Best practices are presented as recommendations
for use with in-mouth sensors based on our experience implementing them on-field.
REFERENCES
1. Greenwald, R. M., J. J. Chu, J. J. Crisco and J. A. Finkelstein. Head impact telemetry system (HITS) for measurement of head acceleration in the field. Proceedings of the American Society of Biomechanics Annual Meeting. 2003.
2. Crisco, J. J., J. J. Chu and R. M. Greenwald. An algorithm for estimating acceleration magnitude and impact location using multiple nonorthogonal single-axis accelerometers. Journal of Biomechanical Engineering. 126(6):849-54, 2004.
3. Chu, J. J., J. G. Beckwith, J. J. Crisco and R. Greenwald. A novel algorithm to measure linear and rotational head acceleration using single-axis accelerometers. Journal of Biomechanics. 39 supplement 1(S534, 2006.
4. Tyson, A. M., S. M. Duma and S. Rowson. Laboratory evaluation of low-cost wearable sensors for measuring head impacts in sports. 34(4):320, 2018.
5. Press, J. N. and S. Rowson. Quantifying head impact exposure in collegiate women's soccer. Clinical Journal of Sport Medicine. 27(2):104-10, 2017.
6. Rowson, S., S. M. Duma, J. G. Beckwith, J. J. Chu, R. M. Greenwald, J. J. Crisco, P. G. Brolinson, A. C. Duhaime, T. W. McAllister and A. C. Maerlender. Rotational head kinematics in football impacts: An injury risk function for concussion. Annals of Biomedical Engineering. 40(1):1-13, 2012.
7. Wu, L. C., K. Laksari, C. Kuo, J. F. Luck, S. Kleiven, R. Cameron and D. B. Camarillo. Bandwidth and sample rate requirements for wearable head impact sensors. Journal of Biomechanics. 49(13):2918-24, 2016.
8. Nevins, D., L. Smith and J. Kensrud. Laboratory evaluation of wireless head impact sensor. Procedia Engineering. 112(2015):175-9, 2015.
9. Wu, L. C., V. Nangia, K. Bui, B. Hammoor, M. Kurt, F. Hernandez, C. Kuo and D. B. Camarillo. In vivo evaluation of wearable head impact sensors. Annals of Biomedical Engineering. 44(4):1234-45, 2016.
10. Kuo, C., L. Wu, J. Loza, D. Senif, S. C. Anderson and D. B. Camarillo. Comparison of video-based and sensor-based head impact exposure. PLOS One. 13(6):e0199238-e, 2018.
11. Cecchi, N. J., D. C. Monroe, J. J. Phreaner, S. L. Small and J. W. Hicks. Patterns of head impact exposure in men’s and women’s collegiate club water polo. Journal of Science and Medicine in Sport. 2020.
12. Cecchi, N. J., D. C. Monroe, T. J. Oros, S. L. Small and J. W. Hicks. Laboratory evaluation of a wearable head impact sensor for use in water polo and land sports. Proceedings of the Institution of Mechanical Engineers, Part P: Journal of Sports Engineering and Technology. 1754337120901974, 2020.
13. Saunders, T. D., R. K. Le, K. M. Breedlove, D. A. Bradney and T. G. Bowman. Sex differences in mechanisms of head impacts in collegiate soccer athletes. Clinical Biomechanics. 74(14-20, 2020.
28
14. King, D., P. A. Hume, M. Brughelli and C. Gissane. Instrumented mouthguard acceleration analyses for head impacts in amateur rugby union players over a season of matches. The American Journal of Sports Medicine. 43(3):614-24, 2015.
15. Rich, A. M., T. M. Filben, L. E. Miller, B. T. Tomblin, A. R. Van Gorkom, M. A. Hurst, R. T. Barnard, D. S. Kohn, J. E. Urban and J. D. Stitzel. Development, validation and pilot field deployment of a custom mouthpiece for head impact measurement. Annals of Biomedical Engineering. 47(10):2109-21, 2019.
16. Ng, T. P., W. R. Bussone and S. M. Duma. The effect of gender and body size on linear accelerations of the head observed during daily activities. Biomedical Sciences Instrumentation. 42(25-30, 2006.
17. Rowson, S., J. J. Chu, J. G. Beckwith, R. M. Greenwald, J. D. Stitzel, H. Kimpara and S. M. Duma. Six degree of freedom head acceleration measurements in football players. Injury Biomechanics Research, Proceedings of the Thirty-Fifth International Workshop. 2007.
18. Rowson, S. and Duma, S. Six Degree of Freedom Head Acceleration Measurements in Collegiate Football. 2008, Virginia Tech - Wake Forest, Center for Injury Biomechanics.
19. Rowson, S., J. G. Beckwith, J. J. Chu, D. S. Leonard, R. M. Greenwald and S. M. Duma. A six degree of freedom head acceleration measurement device for use in football. Journal of Applied Biomechanics. 27(1):8-14, 2011.
20. Broglio, S. P., J. T. Eckner, D. Martini, J. J. Sosnoff, J. S. Kutcher and C. Randolph. Cumulative head impact burden in high school football. Journal of Neurotrauma. 28(10):2069-78, 2011.
21. Daniel, R. W., S. Rowson and S. M. Duma. Head impact exposure in youth football. Annals of Biomedical Engineering. 40(4):976-81, 2012.
22. Young, T. J., R. W. Daniel, S. Rowson and S. M. Duma. Head impact exposure in youth football: Elementary school ages 7-8 years and the effect of returning players. Clinical Journal of Sport Medicine. 24(5):416-21, 2014.
23. Duma, S. M. and S. Rowson. Every newton hertz: A macro to micro approach to investigating brain injury. 2009 Annual International Conference of the IEEE Engineering in Medicine and Biology Society. 1123-6, 2009.
24. Gwin, J., J. Chu and R. Greenwald. Head impact telemetry system™ for measurement of head acceleration in ice hockey. Journal of Biomechanics. 39):S153, 2006.
25. Duhaime, A. C., J. G. Beckwith, A. C. Maerlender, T. W. McAllister, J. J. Crisco, S. M. Duma, P. G. Brolinson, S. Rowson, L. A. Flashman, J. J. Chu and R. M. Greenwald. Spectrum of acute clinical characteristics of diagnosed concussions in college athletes wearing instrumented helmets: Clinical article. Journal of Neurosurgery. 117(6):1092-9, 2012.
26. Reed, N., T. Taha, M. Keightley, C. Duggan, J. McAuliffe, J. Cubos, J. Baker, B. Faught, M. McPherson and W. Montelpare. Measurement of head impacts in youth ice hockey players. International Journal of Sports Medicine. 31(11):826-33, 2010.
27. Mihalik, J. P., J. T. Blackburn, R. M. Greenwald, R. C. Cantu, S. W. Marshall and K. M. Guskiewicz. Collision type and player anticipation affect head impact severity among youth ice hockey players. Pediatrics. 125(6):e1394-e401, 2010.
28. Mihalik, J. P., K. M. Guskiewicz, S. W. Marshall, R. M. Greenwald, J. T. Blackburn and R. C. Cantu. Does cervical muscle strength in youth ice hockey players affect head impact biomechanics? Clinical Journal of Sport Medicine. 21(5):416-21, 2011.
29. Brainard, L. L., J. G. Beckwith, J. J. Chu, J. J. Crisco, T. W. McAllister, A.-C. Duhaime, A. C. Maerlender and R. M. Greenwald. Gender differences in head impacts sustained by collegiate ice hockey players. Medicine & Science in Sports & Exercise. 44(2):297-304, 2012.
30. Wilcox, B. J., J. T. Machan, J. G. Beckwith, R. M. Greenwald, E. Burmeister and J. J. Crisco. Head-impact mechanisms in men's and women's collegiate ice hockey. Journal of Athletic Training. 49(4):514-20, 2014.
29
31. Wilcox, B. J., J. G. Beckwith, R. M. Greenwald, J. J. Chu, T. W. McAllister, L. A. Flashman, A. C. Maerlender, A.-C. Duhaime and J. J. Crisco. Head impact exposure in male and female collegiate ice hockey players. Journal of Biomechanics. 47(1):109-14, 2014.
32. Beckwith, J., J. Chu and R. Greenwald. Development and validation of the head impact telemetry system™ for use in amateur boxing. Journal of Biomechanics. 39):S153, 2006.
33. Stojsih, S., M. Boitano, M. Wilhelm and C. Bir. A prospective study of punch biomechanics and cognitive function for amateur boxers. British Journal of Sports Medicine. 44(10):725-30, 2010.
34. Hanlon, E. M. and C. A. Bir. Real-time head acceleration measurement in girls’ youth soccer. Medicine & Science in Sports & Exercise. 44(6):1102-8, 2012.
35. Dickson, T. J., S. Trathen, G. Waddington, F. A. Terwiel and D. Baltis. A human factors approach to snowsport safety: Novel research on pediatric participants' behaviors and head injury risk. Applied Ergonomics. 53(79-86, 2016.
36. Hanlon, E. and C. Bir. Validation of a wireless head acceleration measurement system for use in soccer play. Journal of Applied Biomechanics. 26(4):424-31, 2010.
37. Crisco, J. J., J. Chu and R. Greenwald. An approach to calculating linear head accelerations is not affected by rotational head accelerations. Proceedings of the 20th Congress of the International Society of Biomechanics. 2005.
38. Manoogian, S., D. McNeely, S. Duma, G. Brolinson and R. Greenwald. Head acceleration is less than 10 percent of helmet acceleration in football impacts. Biomedical Sciences Instrumentation. 42(383-8, 2006.
39. Cummiskey, B., D. Schiffmiller, T. M. Talavage, L. Leverenz, J. J. Meyer, D. Adams and E. A. Nauman. Reliability and accuracy of helmet-mounted and head-mounted devices used to measure head accelerations. Proceedings of the Institution of Mechanical Engineers, Part P: Journal of Sports Engineering and Technology. 231(2):144-53, 2017.
40. Beckwith, J. G., R. M. Greenwald and J. J. Chu. Measuring head kinematics in football: Correlation between the head impact telemetry system and Hybrid III headform. Annals of Biomedical Engineering. 40(1):237-48, 2012.
41. Jadischke, R., D. C. Viano, N. Dau, A. I. King and J. McCarthy. On the accuracy of the head impact telemetry (hit) system used in football helmets. Journal of Biomechanics. 46(13):2310-5, 2013.
42. Cobb, B. R. Laboratory and field studies in sports-related brain injury. Doctoral dissertation:2015. 43. Cobb, B. R., J. E. Urban, E. M. Davenport, S. Rowson, S. M. Duma, J. A. Maldjian, C. T. Whitlow,
A. K. Powers and J. D. Stitzel. Head impact exposure in youth football: Elementary school ages 9-12 years and the effect of practice structure. Annals of Biomedical Engineering. 41(12):2463-73, 2013.
44. Funk, J. R., S. Rowson, R. W. Daniel and S. M. Duma. Validation of concussion risk curves for collegiate football players derived from hits data. Annals of Biomedical Engineering. 40(1):79-89, 2012.
45. Rowson, S. and S. M. Duma. Development of the star evaluation system for football helmets: Integrating player head impact exposure and risk of concussion. Annals of Biomedical Engineering. 39(8):2130-40, 2011.
46. Campolettano, E. T., R. A. Gellner, E. P. Smith, S. Bellamkonda, C. T. Tierney, J. J. Crisco, D. A. Jones, M. E. Kelley, J. E. Urban and J. D. Stitzel. Development of a concussion risk function for a youth population using head linear and rotational acceleration. Annals of Biomedical Engineering. 48(1):92-103, 2020.
47. Rowson, S., S. M. Duma, R. M. Greenwald, J. G. Beckwith, J. J. Chu, K. M. Guskiewicz, J. P. Mihalik, J. J. Crisco, B. J. Wilcox and T. W. McAllister. Can helmet design reduce the risk of concussion in football? Technical note. Journal of Neurosurgery. 120(4):919-22, 2014.
48. Gherman, J., E. Hess, J. Ramos and J. Teubert. Do newer football helmet designs reduce the risk of sports-related concussion? Evidence-Based Practice. 21(9):25-6, 2018.
49. Sone, J. Y., D. Kondziolka, J. H. Huang and U. Samadani. Helmet efficacy against concussion and traumatic brain injury: A review. Journal of Neurosurgery. 126(3):768-81, 2017.
30
50. Heary, R. F., N. Majmundar and R. Nagurka. Is youth football safe? An analysis of youth football head impact data. Neurosurgery. 2020.
51. GForceTracker. How it works, gforcetracker. Richmond Hill, Canada. 2016. 52. Miyashita, T., E. Diakogeorgiou, K. Marrie and R. Danaher. Frequency and location of head
impacts in division i men's lacrosse players. Athletic Training and Sports Health Care. 8(5):202-8, 2016.
53. Kindschi, K., M. Higgins, A. Hillman, G. Penczek and A. Lincoln. Video analysis of high-magnitude head impacts in men’s collegiate lacrosse. BMJ Open Sport & Exercise Medicine. 3(1):e000165, 2017.
54. VanderVegt, C., D. V. Gobert, T. Miyashita, L. Vela and R. A. Harter. Resultant effects of head impacts on vestibular function among ncaa division 1 male lacrosse players. 2016.
55. Miyashita, T. L., E. Diakogeorgiou and K. Marrie. The role of subconcussive impacts on sway velocities in division i men’s lacrosse players. Sports Biomechanics. 19(2):180-8, 2020.
56. Harriss, A., A. M. Johnson, D. M. Walton and J. P. Dickey. Head impact magnitudes that occur from purposeful soccer heading depend on the game scenario and head impact location. Musculoskeletal Science and Practice. 40(53-7, 2019.
57. Foss, B., D. Kim, C. DiCesare, J. A. Diekfuss, W. Yuan and G. D. Myer. Evaluation of head impact exposure between one season of youth versus high school football. Journal of Sports Medicine and Allied Health Sciences: Official Journal of the Ohio Athletic Trainers Association. 4(1):5, 2018.
58. Fitzpatrick, D., Thompson, P., Kipps, C., and Webborn, N. 324 Increased cervical strength is associated with reduced head impact magnitude in international blind football. 2020, BMJ Publishing Group Ltd and British Association of Sport and Exercise Medicine.
59. Allison, M. A., Y. S. Kang, M. R. Maltese, J. H. Bolte and K. B. Arbogast. Measurement of Hybrid III head impact kinematics using an accelerometer and gyroscope system in ice hockey helmets. Annals of Biomedical Engineering. 43(8):1896-906, 2015.
60. Wu, L. C., C. Kuo, J. Loza, M. Kurt, K. Laksari, L. Z. Yanez, D. Senif, S. C. Anderson, L. E. Miller and J. E. Urban. Detection of american football head impacts using biomechanical features and support vector machine classification. Scientific Reports. 8(1):1-14, 2017.
61. Biometrics, i. Shockbox helmet sensors. i1 Biometrics, Kirkland, Wash, USA, . 2016. 62. Wong, R. H., A. K. Wong and J. E. Bailes. Frequency, magnitude, and distribution of head impacts
in pop warner football: The cumulative burden. Clinical Neurology and Neurosurgery. 118(1-4, 2014.
63. Bellamkonda, S., S. J. Woodward, E. Campolettano, R. Gellner, M. E. Kelley, D. A. Jones, A. Genemaras, J. G. Beckwith, R. M. Greenwald and A. C. Maerlender. Head impact exposure in practices correlates with exposure in games for youth football players. Journal of Applied Biomechanics. 34(5):354-60, 2018.
64. Foreman, S. and D. Crossman. Comparative analysis for the measurement of head accelerations in ice hockey helmets using non-accelerometer based systems. Mechanism of concussion in sports. ASTM International. 2014.
65. Lightman, K. Silicon gets sporty. IEEE Spectrum. 53(3):48-53, 2016. 66. Harper, B., A. Aron, A. Siyufy, A. Mickle and K. Cox. Feasibility assessment of the reebok
checklight™ and king-devick tests as screening tools in youth football. Journal of Sports Medicine and Allied Health Sciences: Official Journal of the Ohio Athletic Trainers Association. 4(2):1, 2018.
67. Technologies, T. Laboratory validation of the sim-g head impact sensor. Triax Technologies, Norwalk, Conn, USA. 2014.
68. Lamond, L. C., J. B. Caccese, T. A. Buckley, J. Glutting and T. W. Kaminski. Linear acceleration in direct head contact across impact type, player position, and playing scenario in collegiate women's soccer players. Journal of Athletic Training. 53(2):115-21, 2018.
31
69. Caccese, J. B., L. C. Lamond, T. A. Buckley and T. W. Kaminski. Reducing purposeful headers from goal kicks and punts may reduce cumulative exposure to head acceleration. Research in Sports Medicine. 24(4):407-15, 2016.
70. Swartz, E. E., J. L. Myers, S. B. Cook, K. M. Guskiewicz, M. S. Ferrara, R. C. Cantu, H. Chang and S. P. Broglio. A helmetless-tackling intervention in american football for decreasing head impact exposure: A randomized controlled trial. Journal of Science and Medicine in Sport. 22(10):1102-7, 2019.
71. Lynall, R. C., L. B. Lempke, R. S. Johnson, M. N. Anderson and J. D. Schmidt. A comparison of youth flag and tackle football head impact biomechanics. Journal of Neurotrauma. 36(11):1752-7, 2019.
72. Lempke, L. B., R. S. Johnson, M. N. Anderson, R. K. Le, J. D. Schmidt and R. C. Lynall. Head impact biomechanics in youth flag football: An exploratory analysis. Medicine & Science in Sports & Exercise. 51:471-, 2019.
73. Patton, D., Huber, C., Lallo, V., McDonald, C., and Arbogast, K. 188 Gender differences in head impact rate and mechanism in high school lacrosse. 2020, BMJ Publishing Group Ltd and British Association of Sport and Exercise Medicine.
74. Eckner, J. T., K. L. O’Connor, S. P. Broglio and J. A. Ashton-Miller. Comparison of head impact exposure between male and female high school ice hockey athletes. The American Journal of Sports Medicine. 46(9):2253-62, 2018.
75. Biosystems, X. The x-patch: The world's most widely deployed wearable head impact monitor. X2 Biosystems, Redwood City, Calif, USA. 2016.
76. Nevins, D., K. Hildenbrand, A. Vasavada, J. Kensrud and L. Smith. In-game head impact exposure of male and female high school soccer players. Athletic Training and Sports Health Care. 11(4):174-82, 2019.
77. Kerr, Z. Y., S. W. Yeargin, T. C. Valovich McLeod, J. Mensch, R. Hayden and T. P. Dompier. Comprehensive coach education reduces head impact exposure in american youth football. Orthopaedic Journal of Sports Medicine. 3(10):2325967115610545, 2015.
78. Reynolds, B. B., J. Patrie, E. J. Henry, H. P. Goodkin, D. K. Broshek, M. Wintermark and T. J. Druzgal. Practice type effects on head impact in collegiate football. Journal of Neurosurgery. 124(2):501-10, 2016.
79. Reynolds, B. B., J. Patrie, E. J. Henry, H. P. Goodkin, D. K. Broshek, M. Wintermark and T. J. Druzgal. Quantifying head impacts in collegiate lacrosse. The American Journal of Sports Medicine. 44(11):2947-56, 2016.
80. Willmott, C., A. S. McIntosh, T. Howard, B. Mitra, B. Dimech-Betancourt, J. Donovan and J. V. Rosenfeld. Scat3 changes from baseline and associations with x2 patch measured head acceleration in amateur australian football players. Journal of Science and Medicine in Sport. 21(5):442-6, 2018.
81. McIntosh, A. S., C. Willmott, D. A. Patton, B. Mitra, J. H. Brennan, B. Dimech-Betancourt, T. S. Howard and J. V. Rosenfeld. An assessment of the utility and functionality of wearable head impact sensors in australian football. Journal of Science and Medicine in Sport. 22(7):784-9, 2019.
82. Reyes, J., B. Mitra, A. McIntosh, P. Clifton, M. Makdissi, J. V. Nguyen, P. Harcourt, T. S. Howard, P. A. Cameron and J. V. Rosenfeld. An investigation of factors associated with head impact exposure in professional male and female australian football players. The American Journal of Sports Medicine. 0363546520912416, 2020.
83. Reyes, J., C. Willmott, A. McIntosh, T. S. Howard, P. Clifton, M. Makdissi, P. Harcourt, P. Cameron, J. V. Rosenfeld and J. V. Nguyen. The potential of head acceleration measurement to augment current best practice in concussion screening in professional australian football players. Physical Therapy in Sport. 2020.
84. O'Sullivan, D. M. and G. P. Fife. Biomechanical head impact characteristics during sparring practice sessions in high school taekwondo athletes. Journal of Neurosurgery: Pediatrics. 19(6):662-7, 2017.
32
85. King, D., P. Hume, C. Gissane and T. Clark. Head impacts in a junior rugby league team measured with a wireless head impact sensor: An exploratory analysis. 19(1):13, 2017.
86. Carey, L., P. Stanwell, D. P. Terry, A. S. McIntosh, S. V. Caswell, G. L. Iverson and A. J. Gardner. Verifying head impacts recorded by a wearable sensor using video footage in rugby league: A preliminary study. Sports Medicine-open. 5(1):9, 2019.
87. King, D. A., P. Hume, C. Gissane and T. Clark. Measurement of head impacts in a senior amateur rugby league team with an instrumented patch: Exploratory analysis. ARC Journal of Research in Sports Medicine. 2(1):9-20, 2017.
88. Camarillo, D., J. Mattson, M. Flynn, S. Yang, P. Shull, R. Shultz, G. Matheson and D. Garza. Head contacts in collegiate football measured with an instrumented mouthguard. British Journal of Sports Medicine. 47(5):e1-e, 2013.
89. Camarillo, D., J. Mattson, M. Flynn, S. Yang, P. Shull, R. Shultz, G. Matheson and D. Garza. Head contacts in collegiate football measured with an instrumented mouthguard. British Journal of Sports Medicine. 47(5):e1, 2013.
90. Camarillo, D. B., P. B. Shull, J. Mattson, R. Shultz and D. Garza. An instrumented mouthguard for measuring linear and angular head impact kinematics in american football. Annals of Biomedical Engineering. 41(9):1939-49, 2013.
91. Kuo, C., L. C. Wu, B. T. Hammoor, J. F. Luck, H. C. Cutcliffe, R. C. Lynall, J. R. Kait, K. R. Campbell, J. P. Mihalik, C. R. Bass and D. B. Camarillo. Effect of the mandible on mouthguard measurements of head kinematics. Journal of Biomechanics. 49(9):1845-53, 2016.
92. Bartsch PhD, A., S. Samorezov, E. Benzel, C. Clinic, V. Miele and D. Brett. Validation of an "intelligent mouthguard" single event head impact dosimeter. 2014.
93. Hedin, D. S., P. L. Gibson, A. J. Bartsch and S. Samorezov. Development of a head impact monitoring “intelligent mouthguard”. 2016 38th Annual International Conference of the IEEE Engineering in Medicine and Biology Society (EMBC). 2007-9, 2016.
94. Bartsch, A. and S. Samorezov. Cleveland clinic intelligent mouthguard: A new technology to accurately measure head impact in athletes and soldiers. Sensing Technologies for Global Health, Military Medicine, and Environmental Monitoring III. 8723:87230N, 2013.
95. Bartsch, A. J., D. S. Hedin, P. L. Gibson, V. J. Miele, E. C. Benzel, J. L. Alberts, S. Samorezov, A. Shah, B. S. Stemper and M. M. McCrea. Laboratory and on-field data collected by a head impact monitoring mouthguard. 2019 41st Annual International Conference of the IEEE Engineering in Medicine and Biology Society (EMBC). 2068-72, 2019.
96. Bartsch, A., S. Samorezov, J. Alberts, E. Benzel, C. Bernick, R. Figler, R. Grey, A. Russman, D. Brett and V. Miele. A comparison of non-concussive head impacts in young athletes vs. Concussion-causing impacts in adult american footballers. British Journal of Sports Medicine. 51(11):A1, 2017.
97. Wu, L. C., L. Zarnescu, V. Nangia, B. Cam and D. B. Camarillo. A head impact detection system using svm classification and proximity sensing in an instrumented mouthguard. IEEE Transactions on Biomedical Engineering. 61(11):2659-68, 2014.
98. Miller, L. E., C. Kuo, L. C. Wu, J. E. Urban, D. B. Camarillo and J. D. Stitzel. Validation of a custom instrumented retainer form factor for measuring linear and angular head impact kinematics. Journal of Biomechanical Engineering. 140(5):2018.
99. Miller, L. E., E. K. Pinkerton, K. C. Fabian, L. C. Wu, M. A. Espeland, L. C. Lamond, C. M. Miles, D. B. Camarillo, J. D. Stitzel and J. E. Urban. Characterizing head impact exposure in youth female soccer with a custom-instrumented mouthpiece. Research in Sports Medicine. 28(1):55-71, 2020.
100. Fukuda, T., S. Koike, S. Miyakawa, H. Fujiya and Y. Yamamoto. Impact on the head during collisions between university american football players-focusing on the number of head impacts and linear head acceleration. The Journal of Physical Fitness and Sports Medicine. 6(4):241-9, 2017.
33
101. Fukuda, T., S. Koike, S. Miyakawa, H. Fujiya and Y. Yamamoto. Magnitude and frequency of head impact among university american football players. The Journal of Physical Fitness and Sports Medicine. 8(1):1-13, 2019.
102. Sayoc, J., K. Kawata, J. Shin, M. Rath, S.-G. Hong, S.-Y. Choi, R. Tierney and J.-Y. Park. Circulating mitochondrial DNA levels in collegiate football players: A pilot study. The FASEB Journal. 33(1_supplement):lb435-lb, 2019.
103. Kercher, K., J. A. Steinfeldt, J. T. Macy, K. Ejima and K. Kawata. Subconcussive head impact exposure differences between drill intensities in us high school football. medRxiv. 2020.
104. Self, B. P., J. Beck, D. Schill, C. Eames, T. Knox and J. Plaga. Head accelerations during soccer heading. The Engineering of Sport 6. Springer. 2006.
105. Knox, T. Validation of earplug accelerometers as a means of measuring head motion. 2004, SAE Technical Paper.
106. Knox, T., Pellettiere, J., Perry, C., Plaga, J., and Bonfeld, J. New sensors to track head acceleration during possible injurious events. 2009, Endevco Corporation San Juan Capistrano CA.
34
CHAPTER 3: A TWO-PHASED APPROACH TO QUANTIFYING HEAD
IMPACT SENSOR ACCURACY: IN-LABORATORY AND ON-FIELD
ASSESSMENTS
ABSTRACT
Measuring head impacts in sports can further our understanding of brain injury biomechanics and,
hopefully, advance concussion diagnostics and prevention. Although there are many head impact
sensors available, skepticism on their utility exists over concerns related to measurement error.
Previous studies report mixed reliability in head impact sensor measurements, but there is no
uniform approach to assessing accuracy, making comparisons between sensors and studies
difficult. The objective of this paper is to introduce a two-phased approach to evaluating head
impact sensor accuracy. The first phase consists of in-lab impact testing on a dummy headform at
varying impact severities under loading conditions representative of each sensor’s intended use.
We quantify in-lab accuracy by calculating the concordance correlation coefficient (CCC) between
a sensor’s kinematic measurements and headform reference measurements. For sensors that
performed reasonably well in the lab (CCC ≥ 0.80), we completed a second phase of evaluation
on-field. Through video validation of impacts measured by sensors on athletes, we classified each
sensor measurement as either true-positive and false-positive impact events and computed positive
predictive value (PPV) to summarize real-world accuracy. Eight sensors were tested in phase one,
but only four sensors were assessed in phase two. Sensor accuracy varied greatly. CCC from phase
one ranged from 0.13-0.97, with an average value of 0.72. Overall, the four devices that were
implemented on-field had PPV that ranged from 16.3-91.2%, with an average value of 60.8%.
Performance in-lab was not always indicative of the device’s performance on-field. The methods
proposed in this paper aim to establish a comprehensive approach to the evaluation of sensors so
that users can better interpret data collected from athletes.
Keywords: Concussion, Biomechanics, Accelerometer, Wearable Devices, Helmet, Linear
Acceleration, Rotational Acceleration
INTRODUCTION
Measuring head impacts in sports can further our understanding of brain injury biomechanics and,
hopefully, advance concussion diagnostics and prevention. To date, researchers have extensively
35
deployed sensor systems in large cohorts of athletes to quantify head impact exposure and
concussive biomechanics.1-7 While we now know more than ever about subconcussive and
concussive impacts, we still have much to learn before we can single out concussive impacts from
non-concussive impacts, which can seem like needles within a haystack.2 Several sensor systems
have been used in athletes, and all have been criticized for being unable to measure kinematics for
individual head impacts accurately.6,8-11 The ability of head impact sensors to measure kinematics
is extremely valuable to the understanding human tolerance to head impacts. The Head Impact
Telemetry System (HITS), for example, is the most widely used sensor, and has been implemented
for over fifteen years in football players.12 This research has allowed us to learn about head impact
exposure and concussion biomechanics,13-17 leading to rule changes18 and improved helmet design
that reduce the concussion risk in football.19,20 However, knowledge gaps remain and extend to
sports beyond football. To improve concussion diagnostics and prevention, head impact sensor
accuracy needs to be better understood in the context of real-world use, and likely, the accuracy
itself needs to be improved.
Previous studies report mixed reliability in head impact sensor measurements. Most studies have
been limited to individual sensor models,21-27 although some have used multiple sensor
models.10,28,29 Often, the developers of the sensor systems test and validate their own technology,
each with their own impact method and test matrix.22,23,30,31 Currently, there is no cohesive
methodology for comparing the performance of different head impact sensors. HITS, for example,
has had multiple validation studies conducted on it, all under varying impact conditions.24,30,32,33
Each study reported different levels of accuracy, but computed error differently, further
complicating the interpretation of the findings. The entire field would benefit if the impact
conditions, data treatment, and error estimates were universal, improving the interpretability of
performance results and helping comparisons across types of devices. However, the performance
assessment of the devices cannot be limited to in-lab assessments alone, as in-lab accuracy is not
always indicative of accuracy on the field. For instance, the X2 Biosystems xPatch was also tested
under varying conditions in laboratories,24,28,32,34,35 with most results suggesting high levels of
accuracy. However, when implemented in athletes, the magnitudes and frequencies measured were
obviously flawed9 due to coupling issues related to skin motion10 that dummy headforms cannot
replicate. Although the many validation studies aid in the understanding of sensor functionality,
there have not been equal efforts to evaluate head impact sensor accuracy consistently.
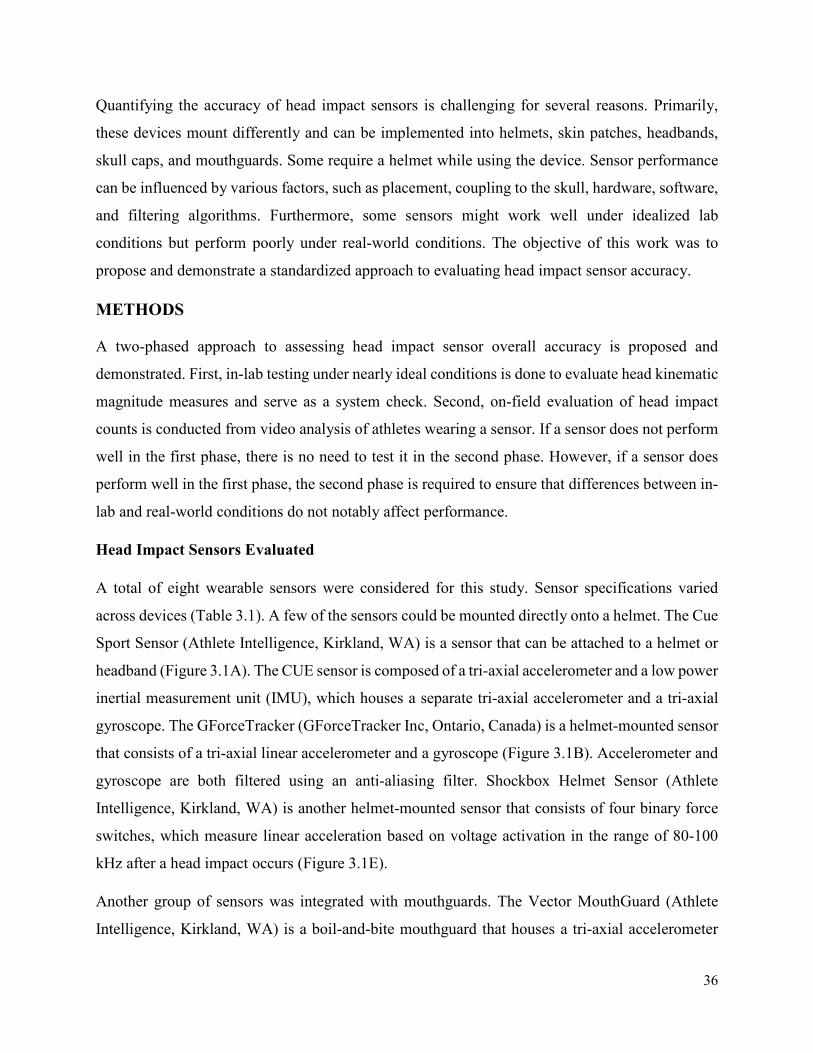
36
Quantifying the accuracy of head impact sensors is challenging for several reasons. Primarily,
these devices mount differently and can be implemented into helmets, skin patches, headbands,
skull caps, and mouthguards. Some require a helmet while using the device. Sensor performance
can be influenced by various factors, such as placement, coupling to the skull, hardware, software,
and filtering algorithms. Furthermore, some sensors might work well under idealized lab
conditions but perform poorly under real-world conditions. The objective of this work was to
propose and demonstrate a standardized approach to evaluating head impact sensor accuracy.
METHODS
A two-phased approach to assessing head impact sensor overall accuracy is proposed and
demonstrated. First, in-lab testing under nearly ideal conditions is done to evaluate head kinematic
magnitude measures and serve as a system check. Second, on-field evaluation of head impact
counts is conducted from video analysis of athletes wearing a sensor. If a sensor does not perform
well in the first phase, there is no need to test it in the second phase. However, if a sensor does
perform well in the first phase, the second phase is required to ensure that differences between in-
lab and real-world conditions do not notably affect performance.
Head Impact Sensors Evaluated
A total of eight wearable sensors were considered for this study. Sensor specifications varied
across devices (Table 3.1). A few of the sensors could be mounted directly onto a helmet. The Cue
Sport Sensor (Athlete Intelligence, Kirkland, WA) is a sensor that can be attached to a helmet or
headband (Figure 3.1A). The CUE sensor is composed of a tri-axial accelerometer and a low power
inertial measurement unit (IMU), which houses a separate tri-axial accelerometer and a tri-axial
gyroscope. The GForceTracker (GForceTracker Inc, Ontario, Canada) is a helmet-mounted sensor
that consists of a tri-axial linear accelerometer and a gyroscope (Figure 3.1B). Accelerometer and
gyroscope are both filtered using an anti-aliasing filter. Shockbox Helmet Sensor (Athlete
Intelligence, Kirkland, WA) is another helmet-mounted sensor that consists of four binary force
switches, which measure linear acceleration based on voltage activation in the range of 80-100
kHz after a head impact occurs (Figure 3.1E).
Another group of sensors was integrated with mouthguards. The Vector MouthGuard (Athlete
Intelligence, Kirkland, WA) is a boil-and-bite mouthguard that houses a tri-axial accelerometer
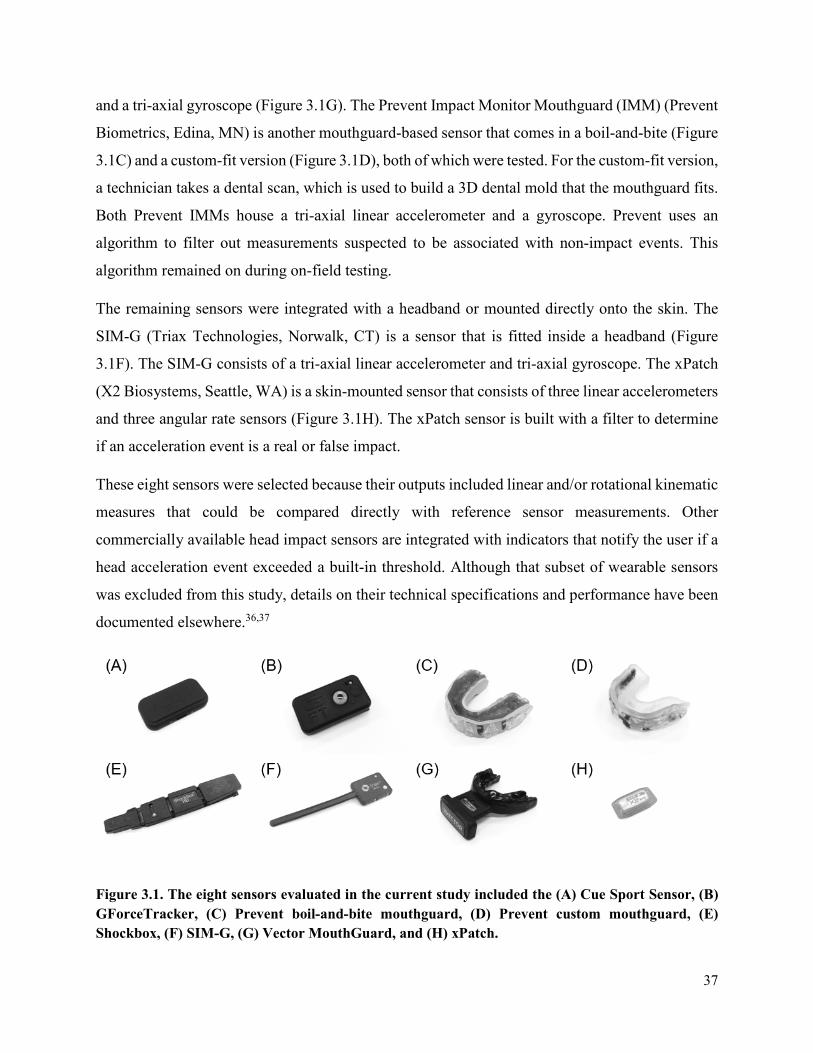
37
and a tri-axial gyroscope (Figure 3.1G). The Prevent Impact Monitor Mouthguard (IMM) (Prevent
Biometrics, Edina, MN) is another mouthguard-based sensor that comes in a boil-and-bite (Figure
3.1C) and a custom-fit version (Figure 3.1D), both of which were tested. For the custom-fit version,
a technician takes a dental scan, which is used to build a 3D dental mold that the mouthguard fits.
Both Prevent IMMs house a tri-axial linear accelerometer and a gyroscope. Prevent uses an
algorithm to filter out measurements suspected to be associated with non-impact events. This
algorithm remained on during on-field testing.
The remaining sensors were integrated with a headband or mounted directly onto the skin. The
SIM-G (Triax Technologies, Norwalk, CT) is a sensor that is fitted inside a headband (Figure
3.1F). The SIM-G consists of a tri-axial linear accelerometer and tri-axial gyroscope. The xPatch
(X2 Biosystems, Seattle, WA) is a skin-mounted sensor that consists of three linear accelerometers
and three angular rate sensors (Figure 3.1H). The xPatch sensor is built with a filter to determine
if an acceleration event is a real or false impact.
These eight sensors were selected because their outputs included linear and/or rotational kinematic
measures that could be compared directly with reference sensor measurements. Other
commercially available head impact sensors are integrated with indicators that notify the user if a
head acceleration event exceeded a built-in threshold. Although that subset of wearable sensors
was excluded from this study, details on their technical specifications and performance have been
documented elsewhere.36,37
Figure 3.1. The eight sensors evaluated in the current study included the (A) Cue Sport Sensor, (B) GForceTracker, (C) Prevent boil-and-bite mouthguard, (D) Prevent custom mouthguard, (E) Shockbox, (F) SIM-G, (G) Vector MouthGuard, and (H) xPatch.
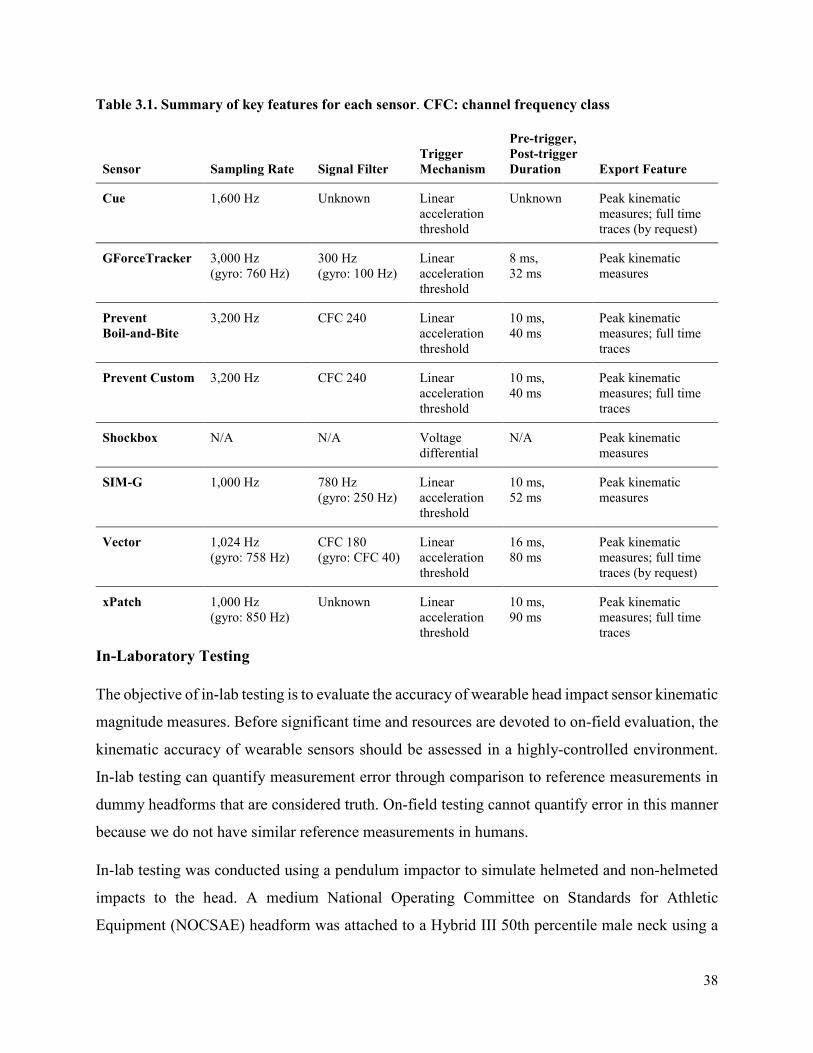
38
Table 3.1. Summary of key features for each sensor. CFC: channel frequency class
In-Laboratory Testing
The objective of in-lab testing is to evaluate the accuracy of wearable head impact sensor kinematic
magnitude measures. Before significant time and resources are devoted to on-field evaluation, the
kinematic accuracy of wearable sensors should be assessed in a highly-controlled environment.
In-lab testing can quantify measurement error through comparison to reference measurements in
dummy headforms that are considered truth. On-field testing cannot quantify error in this manner
because we do not have similar reference measurements in humans.
In-lab testing was conducted using a pendulum impactor to simulate helmeted and non-helmeted
impacts to the head. A medium National Operating Committee on Standards for Athletic
Equipment (NOCSAE) headform was attached to a Hybrid III 50th percentile male neck using a
Sensor Sampling Rate Signal Filter Trigger Mechanism
Pre-trigger, Post-trigger Duration Export Feature
Cue 1,600 Hz Unknown Linear acceleration threshold
Unknown Peak kinematic measures; full time traces (by request)
GForceTracker 3,000 Hz (gyro: 760 Hz)
300 Hz (gyro: 100 Hz)
Linear acceleration threshold
8 ms, 32 ms
Peak kinematic measures
Prevent Boil-and-Bite
3,200 Hz CFC 240 Linear acceleration threshold
10 ms, 40 ms
Peak kinematic measures; full time traces
Prevent Custom 3,200 Hz CFC 240 Linear acceleration threshold
10 ms, 40 ms
Peak kinematic measures; full time traces
Shockbox N/A N/A Voltage differential
N/A Peak kinematic measures
SIM-G 1,000 Hz 780 Hz (gyro: 250 Hz)
Linear acceleration threshold
10 ms, 52 ms
Peak kinematic measures
Vector 1,024 Hz (gyro: 758 Hz)
CFC 180 (gyro: CFC 40)
Linear acceleration threshold
16 ms, 80 ms
Peak kinematic measures; full time traces (by request)
xPatch 1,000 Hz (gyro: 850 Hz)
Unknown Linear acceleration threshold
10 ms, 90 ms
Peak kinematic measures; full time traces
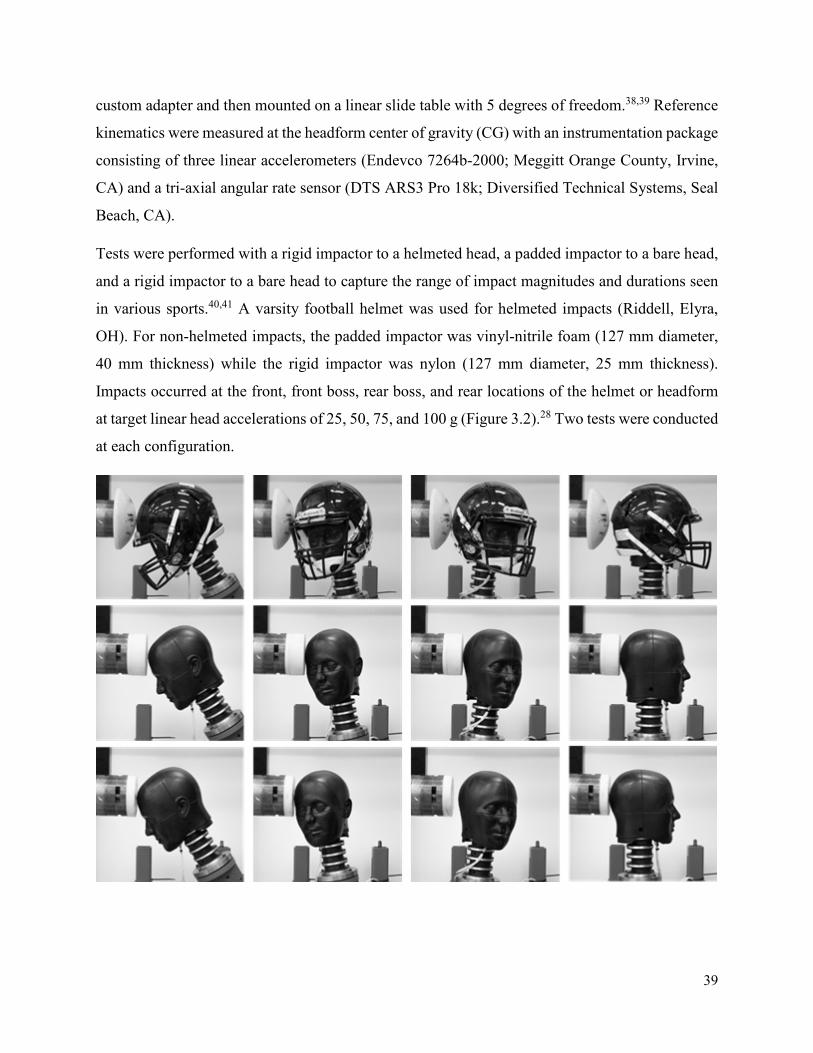
39
custom adapter and then mounted on a linear slide table with 5 degrees of freedom.38,39 Reference
kinematics were measured at the headform center of gravity (CG) with an instrumentation package
consisting of three linear accelerometers (Endevco 7264b-2000; Meggitt Orange County, Irvine,
CA) and a tri-axial angular rate sensor (DTS ARS3 Pro 18k; Diversified Technical Systems, Seal
Beach, CA).
Tests were performed with a rigid impactor to a helmeted head, a padded impactor to a bare head,
and a rigid impactor to a bare head to capture the range of impact magnitudes and durations seen
in various sports.40,41 A varsity football helmet was used for helmeted impacts (Riddell, Elyra,
OH). For non-helmeted impacts, the padded impactor was vinyl-nitrile foam (127 mm diameter,
40 mm thickness) while the rigid impactor was nylon (127 mm diameter, 25 mm thickness).
Impacts occurred at the front, front boss, rear boss, and rear locations of the helmet or headform
at target linear head accelerations of 25, 50, 75, and 100 g (Figure 3.2).28 Two tests were conducted
at each configuration.

40
Figure 3.2. Impact locations (left to right) included the front, front boss, rear boss, and rear. Tests included a rigid impactor to a helmeted head (top), a padded impactor to a bare head (middle), and a rigid impactor to a bare head (bottom).
Sensor placement varied by model. The Cue, GForceTracker, and Shockbox sensors were mounted
directly inside the helmet. The xPatch was mounted behind the left ear over the mastoid process
on the NOCSAE headform using an adhesive patch. The SIM-G was embedded in a headband
with the sensor component located at the back of the NOCSAE headform near the intersection of
the basic and midsagittal planes. The Vector and Prevent mouthguard sensors were mounted inside
a modified NOCSAE headform with a detachable dentition. Boil-and-bite mouthguard sensors
were not molded and evaluated using a smooth aluminum dentition, while the custom versions that
were reliant on a dentition were evaluated using a 3D-printed detention composed of acrylonitrile
butadiene styrene (ABS) plastic (Figure 3.3). In both cases it was important that the dentition was
shaped for the mouthguard. An aluminum plate was inserted in the gap between the mouthguard
and lower jaw of the NOCSAE head and screwed upward into place until there was no space
between it and the mouthguard-clad dentition. The plate functioned as a clamp to prevent
independent motion of the mouthguard during testing and to simulate jaw clenching.
Figure 3.3. Placement of non-helmeted sensors, including the (A-B) xPatch and SIM-G. Comparison between (C) smooth aluminum dentition for boil-and-bite mouthguard sensors and (D) ABS plastic dentition for custom mouthguard sensors.
Wearable sensor performance was assessed by calculating the concordance correlation coefficient
(CCC) (Equation 3.1). CCC quantifies the agreement between the sensor measurements and
reference measurements based on the deviation of paired measurements relative to the
concordance line. CCC addresses misleading characteristics of agreement like location shift, scale
shift, and precision errors.42 In Equation 1, ⍴ represents the Pearson correlation coefficient, 𝑥𝑥 and
𝑦𝑦 represent the reference and sensor measurements, 𝑥𝑥� and 𝑦𝑦� represent the measurement means,
41
and 𝑆𝑆𝑥𝑥 and 𝑆𝑆𝑦𝑦 represent the measurement standard deviations. Sensors output the peak resultant
values for linear kinematic measures (e.g., peak linear acceleration (PLA)) and rotational
kinematic measures (e.g., peak rotational velocity (PRV) and/or peak rotational acceleration
(PRA)). After the sensor and reference measurements are recorded, both are normalized relative
to the maximum reference measurement. CCC values are then computed for the linear kinematic
measure, the rotational kinematic measure(s), and then the combination of linear and rotational
measures. The combined CCC values are used to evaluate overall in-lab sensor performance and
determine if a sensor should proceed to on-field evaluation. The combined CCC accounts for PLA
and a single rotational measurement. If a sensor’s output includes both PRV and PRA, one
combined CCC value is calculated for PLA and PRV while another combined CCC value is
calculated PLA and PRA. In this scenario, the higher of the two combined CCC values is chosen
to represent the sensor’s in-lab performance. It should be noted that the CCC values are only
computed for the test conditions that correspond to the sports for which a sensor is designed. For
example, a sensor designed exclusively for helmeted sports would be assessed only in tests
involving a rigid impactor to a helmeted head, not impacts involving a bare head.
𝐶𝐶𝐶𝐶𝐶𝐶 = 2𝜌𝜌𝑣𝑣+1𝑣𝑣+𝑢𝑢
2 where 𝑣𝑣 = 𝑆𝑆𝑥𝑥𝑆𝑆𝑦𝑦
and 𝑢𝑢 = 𝑥𝑥�−𝑦𝑦�
�𝑆𝑆𝑥𝑥𝑆𝑆𝑦𝑦 (Equation 3.1)
On-Field Testing
We used a combined CCC value of 0.80 or greater as a threshold to qualify for on-field testing.
This threshold was chosen because the sensor does not need perfect accuracy to be useful, and its
on-field accuracy would be dependent on the application. A sensor could be tested on-field for just
a helmeted condition, just an unhelmeted condition, or both depending on its intended use and lab
performance. If measurements are not accurate in the controlled environment of the lab, the sensor
cannot be accurate on the field. In most cases, on-field use will be associated with larger errors
due to less-than-ideal coupling of the sensor to the skull. Poor real-world coupling will decrease
accuracy and introduce false event measurements.9 The goal of evaluating sensors on-field is to
check the extent that real-world use conditions deviate from nearly-ideal lab conditions by
classifying each event recorded as either an impact event or a spurious measurement.
To test sensors on-field, we equipped athletes with sensors that produced CCC values of at least
0.80 for matched scenarios (e.g., football players for helmeted lab tests or soccer players for
42
unhelmeted lab tests). We recorded video of players wearing sensors for several practices and/or
games. Camera placement was situational, depending on which sport was being studied and how
many athletes were instrumented. We specify the camera setup by sensor type in the results. All
activities related to the collection and analysis of video and sensor data from athletes was approved
by Virginia Tech’s Institutional Review Board.
Acceleration events recorded by the sensors were time-synchronized with video for verification
that each event was associated with an impact experienced by the athlete. A world clock was time-
stamped at the beginning of each video, so that the events in the film could be matched to time-
stamped sensor measured events. An impact could be either to an athlete’s head or body, as both
impart acceleration to the head.6 Only events with peak resultant linear accelerations greater than
10 g were verified, to distinguish kinematic events like running and jumping from impact events.43
Each event was classified as either a true positive (TP) impact event or a false positive (FP) impact
event. TP impact events were defined as event recordings where there was a time-matched impact
to the body or head. FP impact events were defined as event recordings where there was no impact
with the athlete observed on video. FP events could be generated from actions such as running,
jumping, talking, handling or touching a sensor, or taking off and putting on a sensor. We
calculated positive predictive values (PPV), or precision, (Equation 3.2) from the TP and FP counts
for each sensor that was tested on-field. 95% confidence intervals (CI) were computed for PPV
through bootstrapping.
Positive Predictive Value = True PositivesTrue Positives+False Positives
(Equation 3.2)
We were concerned about the role that inactive participation during games and practices could
have on the proportion of FP events. Many FP events are recorded during non-playing time where
athletes take the sensors off, handle them, and put them back on.6,44 We aimed to account for this
by generating activity logs for each session that differentiated periods of active play from inactivity
(e.g., water breaks, substitutions, half-time). We computed PPV two ways: over entire session
lengths and then again for only periods of active play within sessions.
43
RESULTS
Cue Sport Sensor
The Cue Sport Sensor was only evaluated under the helmeted condition since it is a helmet-
mounted sensor. Cue outputs included PLA and PRA. Analysis of in-lab tests resulted in a PLA-
based CCC of 0.43 and PRA-based CCC of -0.04, which corresponded to a combined CCC value
of 0.13 for both kinematic measures. On-field testing was not performed using the Cue sensor
because its combined CCC value was below the 0.80 threshold.
GForceTracker
The GForceTracker was evaluated under the helmeted condition only since it is a helmet-mounted
sensor. GForceTracker outputs included PLA and PRV. Analysis of in-lab tests resulted in a PLA-
based CCC of 0.37 and PRV-based CCC of 0.32, which corresponded to a combined CCC value
of 0.33 for both kinematic measures. On-field testing was not performed using the GForceTracker
because its combined CCC value was below the 0.80 threshold.
Prevent Biometrics IMM (Boil-and-Bite)
The boil-and-bite version of the Prevent Biometrics IMM was evaluated under helmeted and non-
helmeted impact conditions. The Prevent IMM outputs included PLA and PRA. Analysis of
helmeted tests resulted in a PLA-based CCC of 0.97 and PRA-based CCC of 0.98, which
corresponded to a combined CCC value of 0.97. Analysis of non-helmeted tests resulted in a PLA-
based CCC of 0.95 and PRA-based CCC of 0.95, which corresponded to a combined CCC value
of 0.95. On-field testing was performed using the boil-and-bite version of the Prevent IMM
because its combined CCC value exceeded 0.80.
Two collegiate football players were instrumented with a Prevent boil-and-bite IMM for three
practices. Prevent uses an algorithm to identify suspected impacts and filter out suspected non-
impact events. Prevent’s algorithm identified 218 suspected impacts, and we verified 120 of those
on video. This resulted in a PPV of 55.0% (95% CI: 48.2, 61.5). When only considering active
minutes within the sessions, Prevent recorded 147 suspected impacts, resulting in an active-minute
PPV of 81.6% (95% CI: 75.5, 87.8).
44
Prevent Biometrics IMM (Custom-Fit)
The custom-fit version of the Prevent Biometrics IMM was evaluated under helmeted and non-
helmeted impact conditions. The Prevent IMM outputs included PLA and PRA. Analysis of
helmeted tests resulted in a PLA-based CCC of 0.96 and PRA-based CCC of 0.97, which
corresponded to a combined CCC value of 0.97. Analysis of non-helmeted tests resulted in a PLA-
based CCC of 0.97 and PRA-based CCC of 0.91, which corresponded to a combined CCC value
of 0.95. On-field testing was performed using the custom-fit version of the Prevent mouthguard
sensor because its combined CCC value exceeded 0.80.
Fifteen collegiate men’s club rugby players were instrumented with Prevent custom-fit
mouthguards throughout 4 sessions that consisted of a total of 41 athlete-sessions. Prevent’s
algorithm identified 204 events that were suspected impacts, 186 of which were verified on video.
This resulted in a PPV of 91.2% (95% CI: 86.8, 95.1). When only considering active minutes
within the sessions, Prevent recorded 193 suspected impacts, resulting in an active-minute PPV of
96.4% (95% CI: 93.3, 99.0).
Shockbox Helmet Sensor
The Shockbox helmet sensor was evaluated under the helmeted condition only since it is a helmet-
mounted sensor. Shockbox only outputs PLA. Analysis of in-lab tests resulted in a PLA-based
CCC of 0.21. On-field testing was not performed using the Shockbox sensor because its CCC
value was below 0.80.
SIM-G
The SIM-G was evaluated under helmeted and non-helmeted conditions due to its integration with
a headband. SIM-G sensor outputs included PLA, PRV, and PRA. Analysis of helmeted tests
resulted in a PLA-based CCC of 0.47, PRV-based CCC of 0.88, and PRA-based CCC of 0.31. The
combination of PLA and PRV produced a CCC of 0.68. The combination of PLA and PRA
produced a CCC of 0.40. Analysis of non-helmeted tests resulted in a PLA-based CCC of 0.48,
PRV-based CCC of 0.95, and PRA-based CCC of 0.39. The combination of PLA and PRV
produced a CCC of 0.74. The combination of PLA and PRA produced a CCC of 0.51. On-field
45
testing was not performed using the SIM-G sensor because its combined CCC values for the
helmeted and non-helmeted conditions were both below 0.80.
Vector MouthGuard
The Vector MouthGuard was evaluated under the helmeted condition only because the version
tested was advertised exclusively for helmeted sports, including football, hockey, and lacrosse.
Vector outputs included PLA and PRA. Analysis of in-lab tests resulted in a PLA-based CCC of
0.94 and PRA-based CCC of 0.61, which corresponded to an overall CCC value of 0.80. On-field
testing was performed using the Vector MouthGuard sensor because its overall CCC value was at
the 0.80 threshold.
One collegiate football player was instrumented with a Vector MouthGuard throughout 3 sessions.
Vector collected 52 events, with 42 of those verified as impacts on video. This resulted in a PPV
of 80.8% (95% CI: 69.2, 90.4). When only considering active minutes within sessions, Vector
recorded 49 events, resulting in an active-minute PPV of 85.7% (95% CI: 75.5, 93.9).
xPatch
The xPatch sensor was evaluated under helmeted and non-helmeted conditions due to its
integration with a skin-mounted patch. The xPatch sensor outputs included PLA, PRV, and PRA.
Analysis of helmeted tests resulted in a PLA-based CCC of 0.89, PRV-based CCC of 1.00, and
PRA-based CCC of 0.79. The combination of PLA and PRV produced a CCC of 0.94. The
combination of PLA and PRA produced a CCC of 0.83. Analysis of non-helmeted tests resulted
in a PLA-based CCC of 0.84, PRV-based CCC of 1.00, and PRA-based CCC of 0.46. The
combination of PLA and PRV produced a CCC of 0.93. The combination of PLA and PRA
produced a CCC of 0.70. On-field testing was performed using the xPatch sensor because its
combined CCC values for the helmeted and non-helmeted conditions were above 0.80.
We used data we previously published to assess the PPV of the xPatch.9 Over 56 sessions
consisting of 916 athlete-sessions, 26 collegiate women’s soccer players had xPatches adhered to
their mastoid processes. The sensors identified 8,999 acceleration events as suspected head
impacts. Video validation was used to verify 1,436 of these events as impacts, yielding a PPV of
46
16.3% (95% CI: 15.5, 17.0). Only head impacts were quantified in this study, and we,
unfortunately, do not have a log of active minutes from this earlier study.
Testing Summary
In-lab and on-field performance are compared across sensors in the helmeted and unhelmeted
conditions (if applicable) in Table 3.2. CCC, the metric for in-lab performance, summarizes the
accuracy of linear and rotational measurements (Figure 3.4). Combined CCC values varied
between sensors with a range of 0.13 to 0.97. A total of 4 sensors had combined CCC values
greater than 0.80 and were tested on-field. PPV was used to summarize on-field performance by
quantifying the percentage of data recorded by a sensor that was associated with an impact event.
Considering all data collected by the sensors during sessions, PPV ranged from 6.3% to 91.2%
(Figure 3.5). Only considering active minutes of play time, something that must be manually
tracked for by the operator, increased PPV universally.
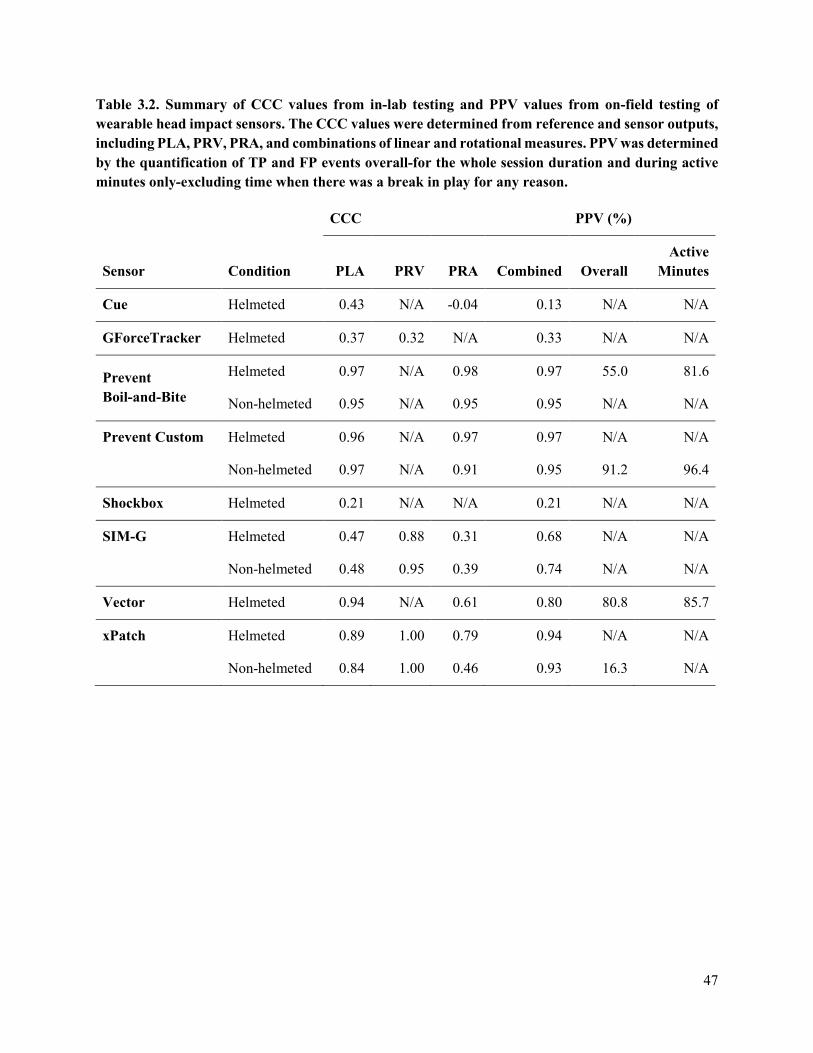
47
Table 3.2. Summary of CCC values from in-lab testing and PPV values from on-field testing of wearable head impact sensors. The CCC values were determined from reference and sensor outputs, including PLA, PRV, PRA, and combinations of linear and rotational measures. PPV was determined by the quantification of TP and FP events overall-for the whole session duration and during active minutes only-excluding time when there was a break in play for any reason.
Sensor Condition
CCC PPV (%)
PLA PRV PRA Combined Overall Active
Minutes
Cue Helmeted 0.43 N/A -0.04 0.13 N/A N/A
GForceTracker Helmeted 0.37 0.32 N/A 0.33 N/A N/A
Prevent Boil-and-Bite
Helmeted 0.97 N/A 0.98 0.97 55.0 81.6
Non-helmeted 0.95 N/A 0.95 0.95 N/A N/A
Prevent Custom Helmeted 0.96 N/A 0.97 0.97 N/A N/A
Non-helmeted 0.97 N/A 0.91 0.95 91.2 96.4
Shockbox Helmeted 0.21 N/A N/A 0.21 N/A N/A
SIM-G Helmeted 0.47 0.88 0.31 0.68 N/A N/A
Non-helmeted 0.48 0.95 0.39 0.74 N/A N/A
Vector Helmeted 0.94 N/A 0.61 0.80 80.8 85.7
xPatch Helmeted 0.89 1.00 0.79 0.94 N/A N/A
Non-helmeted 0.84 1.00 0.46 0.93 16.3 N/A
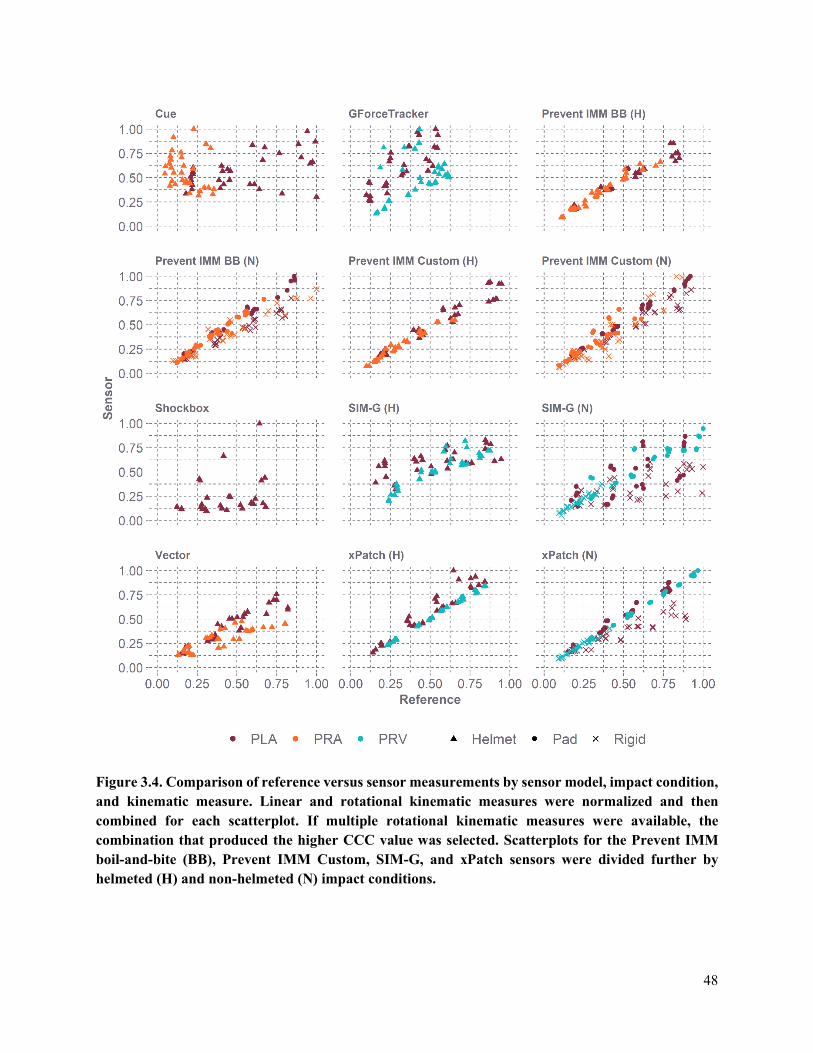
48
Figure 3.4. Comparison of reference versus sensor measurements by sensor model, impact condition, and kinematic measure. Linear and rotational kinematic measures were normalized and then combined for each scatterplot. If multiple rotational kinematic measures were available, the combination that produced the higher CCC value was selected. Scatterplots for the Prevent IMM boil-and-bite (BB), Prevent IMM Custom, SIM-G, and xPatch sensors were divided further by helmeted (H) and non-helmeted (N) impact conditions.
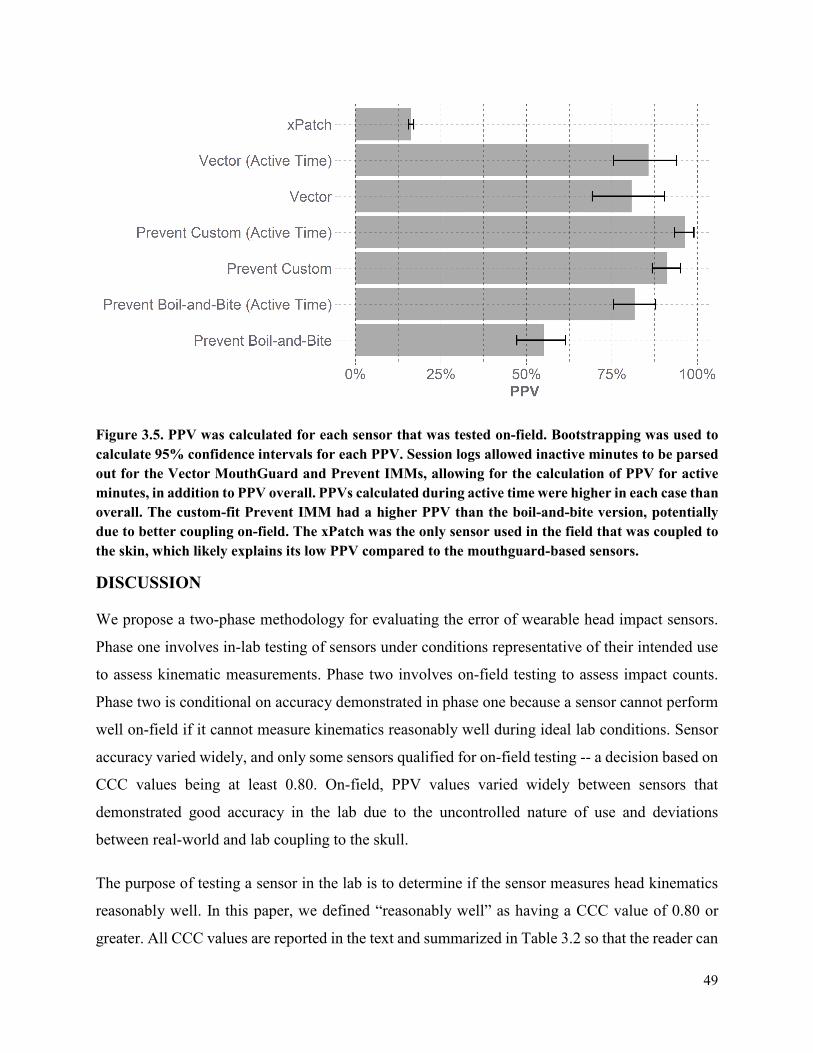
49
Figure 3.5. PPV was calculated for each sensor that was tested on-field. Bootstrapping was used to calculate 95% confidence intervals for each PPV. Session logs allowed inactive minutes to be parsed out for the Vector MouthGuard and Prevent IMMs, allowing for the calculation of PPV for active minutes, in addition to PPV overall. PPVs calculated during active time were higher in each case than overall. The custom-fit Prevent IMM had a higher PPV than the boil-and-bite version, potentially due to better coupling on-field. The xPatch was the only sensor used in the field that was coupled to the skin, which likely explains its low PPV compared to the mouthguard-based sensors.
DISCUSSION
We propose a two-phase methodology for evaluating the error of wearable head impact sensors.
Phase one involves in-lab testing of sensors under conditions representative of their intended use
to assess kinematic measurements. Phase two involves on-field testing to assess impact counts.
Phase two is conditional on accuracy demonstrated in phase one because a sensor cannot perform
well on-field if it cannot measure kinematics reasonably well during ideal lab conditions. Sensor
accuracy varied widely, and only some sensors qualified for on-field testing -- a decision based on
CCC values being at least 0.80. On-field, PPV values varied widely between sensors that
demonstrated good accuracy in the lab due to the uncontrolled nature of use and deviations
between real-world and lab coupling to the skull.
The purpose of testing a sensor in the lab is to determine if the sensor measures head kinematics
reasonably well. In this paper, we defined “reasonably well” as having a CCC value of 0.80 or
greater. All CCC values are reported in the text and summarized in Table 3.2 so that the reader can
50
make their own interpretations of accuracy. Lab testing is needed because there is no way to
measure true head kinematics in human subjects. We use gold-standard instrumentation rigidly
fixed to a dummy headform to quantify wearable sensor measurement error. Sensor accuracy is
dependent on its frequency response, sampling rate, signal filtering, and coupling to the
headform.10,21,28 Sensor limitations related to frequency response and sampling rate were most
evident for the rigid impactor striking the bare headform.28 Most notable was the error related to
poor coupling between the wearable sensor and headform. Helmet-based sensors did not perform
as well as sensors that were mounted directly onto the headform. This discrepancy can be attributed
to the decoupling that occurs between the helmet and headform during an impact. For non-
helmeted sensors, the headband experienced more independent motion relative to the headform
compared to the motion of the mouthguards and skin patch that were fixed to the headform. The
stronger coupling, aided by a clamp, between mouthguards and the headform dentitions resulted
in better in-lab performance. The skin patch sensor also performed well due its adhesive mounting
to the skinless headform.
The purpose of on-field testing was to determine how well the sensor performs during real-world
conditions. The reason this type of testing is needed beyond laboratory testing is that the sensor
coupling to the head may deviate from the in-lab coupling conditions. As a result, a sensor could
perform well under laboratory conditions but not when equipped on an athlete. A user could
unknowingly collect and interpret erroneous data without on-field assessments. The Prevent IMM
is an example of a sensor that performed well in the lab (high CCC) and the real-world (high PPV),
leading us to think that it is an overall accurate system. On the other hand, the xPatch is a sensor
that looks good in the lab (high CCC) but has very poor performance on-field (low PPV). This
discrepancy in performance is the result of the dummy headform not having skin that can move
relative to the skull like that of a human. Relative skin motion on a human results in erroneous
measurements of skull kinematics. Unreliable kinematic measurement in the real-world results in
the sensor more frequently recording events that are not impacts, as unrelated actions like jumping
will register accelerations greater than the sensor’s data acquisition trigger threshold.
We quantified PPV in two ways: 1) considering all events recorded between the start and end of a
session and 2) considering only events that were recorded during active play. We think this is an
important distinction because events recorded during inactive time during a session are extremely
51
dependent on the individuals and team instrumented. PPV quantified during active minutes, when
the athletes are less likely to fiddle with the sensors, is a more objective measure of on-field
performance. Obviously, for a user to collect data with the assumption that PPV is equally good
as reported here, inactive minutes during sessions would need to be tracked and events manually
removed. We view this as a bare minimum effort, and we recommend video verification of all
impacts when possible in research efforts.6 For football and rugby data collection, we kept detailed
logs of inactive minutes that allowed us to exclude FPs that occurred during those time windows.
Breaks in play included substitutions, half-times, time-outs, and dead time during or in-between
drills during practices. FPs were more likely to be generated during those windows because players
were more likely to remove mouthguards from their mouths. PPV was higher for all sensors when
only the impacts from active time were included. The dataset from the soccer team was previously
published and did not include sessions logs that indicated when athletes were actively
participating, or if there was a break in play. Therefore, FP events during inactive minutes were
not parsed out, and only overall PPV was calculated for the xPatch. We assume that PPV would
be improved for the xPatch if we only analyzed active minutes but still suspect on-field
performance would be considered poor due to weak coupling that resulted in video-verified head
impacts producing unrealistic head accelerations.9
PPV is not a perfect metric for on-field accuracy. It does not directly consider kinematic
magnitudes and does not capture false-negative event errors. Suspected false negatives are impacts
that are observed on camera but do not have any sensor data associated with the time stamp for
which the impact occurred. They are only suspected because it is near impossible to visually
identify if an impact is greater than the trigger threshold. Video reviewers can observe obvious
high magnitude impacts and note a lack of data for particular events. This scenario is most
commonly noticed when players sustain concussions and the specific impact is being identified in
video review. For example, several concussions were missed with the Prevent custom IMM during
the rugby season.6 However, we suspect that most false-negative impact events are likely low in
magnitude, potentially near the data acquisition trigger threshold. These impact magnitudes cannot
be confirmed, leading to most suspected false-negative impact events being impossible to verify.
We never know true head kinematics and whether they meet any triggering thresholds, but this
highlights the potential for other error types that can influence the collection and interpretation of
on-field data.
52
Sensor companies are working on developing methods of cleaning and filtering the data that are
measured on-field to reduce the noise and optimize the quality of the dataset. Strategies vary but
can include hardware to identify if the sensor is being worn, as well as algorithms that pass
individual kinematic signals, characterizing shape and comparing them to known head impacts.
For example, the Prevent IMM uses two sensors, a proximity sensor and a light sensor, to
determine if the mouthguard is on the teeth during a recorded event. They also look at frequency
content and signal-to-noise ratios of events in attempts to reduce recordings that are not associated
with impact events. Although sometimes successful, it is important to be aware of the filtering in
place with the device being used, as it may not be optimized for the particular sport being studied
and could incorrectly filter out true impacts that have atypical kinematic signatures. Such practices
are useful because they can be effective at removing non-impact events from recorded datasets;
however, there is the potential for increasing false-negative events and misleadingly inflating PPV
by overzealously removing events.
We aimed to illustrate how PPV is quantified from different datasets. We included confidence
intervals because the number of impacts collected by each sensor was different. PPV uncertainty
is influenced by the PPV magnitude and number of impacts recorded. For the same number of
impacts, a PPV of 99% will have a narrower confidence interval than a PPV of 50%. For example,
at a PPV of 80%, the 95% confidence interval is (68.0, 90.0) for 50 impacts, (72.0, 87.0) for 100
impacts, and (74.5, 85.5) for 200 impacts. Increasing PPV to 96%, the 95% confidence interval
narrows to (90.0, 100) for 50 impacts, (92.0, 99.0) for 100 impacts, and (93.0, 98.5) for 200
impacts.
These examples are intended to illustrate how you would choose a minimum number of impacts
for on-field assessments. While we did not have a minimum number of impacts because our data
are from multiple studies, we present the framework for doing so. Depending on the sport being
studied, it may take more time to achieve the desired number of impacts, in addition to resources
and effort to collect these data. For +/-10% at PPV of 80%, a minimum of 65 impacts should be
collected. There are obvious practical limitations to collecting large datasets with large numbers
of athletes over a long time just to see if the sensor performs well. This framework based on
calculating uncertainty provides important context on PPV computed from small sample sizes on-
field.
53
Although we offer an inclusive methodology to assess the performance of head impact sensors,
there were limitations to this study. Both the Prevent IMM versions tested in the helmeted and
unhelmeted conditions resulted in a CCC greater than 0.80, but we did not test both devices in both
conditions on-field. The boil-and-bite IMM was only tested in helmeted athletes, and the custom-
fit IMM was only tested in unhelmeted athletes. While we do not have reason to think they would
produce substantially different results in the missing conditions, we cannot be sure without on-
field testing. Using PPV as an on-field performance metric is not perfect, as it does not account
for false-negative impacts. The impacts that are missed by sensors are not practical to quantify due
to a lack of kinematic reference measurement on-field but are a concern when analyzing and
interpreting on-field kinematic data. Additionally, the NOCSAE headform used in lab testing does
not have biofidelic skin or hair, which could affect the coupling of the skin patch and headband to
the head. We used an aluminum plate to fix the mouthguards into place in the headform to mimic
jaw clenching, but this is not exactly representative of how an athlete would wear the device.
However, clamping the mouthguard into place allows us to measure the instrumentation in the
most ideal coupling scenario, enabling us to better quantify the sensors’ accuracy. The ability of
each device to couple would be reflected in the on-field assessment of PPV. The skin patch and
mouthguards are examples of devices whose coupling ability would differ from in-lab to on-field.
Not every head impact sensor available was evaluated in the process, as some did not output peak
metrics necessary to calculate CCC and others were not commercially available and only intended
for research purposes. HITS was not included in the evaluation because its use is specific to
football, and there is interest to assess devices that can be implemented in other populations.
However, the intent of this paper was to present a uniform method to determine sensor accuracy,
so sensors beyond those that we included can be evaluated using this approach in the future. We
also only used a football helmet to evaluate performance for helmeted impacts. There are other
helmeted sports in which the sensors could be deployed. Finally, our in-lab impact configurations
are not all-encompassing; we tested each sensor at four locations and four severities, but this
seemed to be enough to demonstrate a wide range of performance between sensors.
There is a clear need to evaluate wearable head impact sensors both in the lab as well as on the
field, as in-lab performance is not necessarily indicative of on-field accuracy. The uniqueness of
wearable sensors, limitations of different devices, and nuances of use warrant a thorough validation
54
process. The methods proposed in this paper aim to establish a comprehensive approach to the
evaluation of sensors so that users can better interpret data collected from athletes.
REFERENCES
1. Stemper, B. D., A. S. Shah, J. Harezlak, S. Rowson, J. P. Mihalik, S. M. Duma, L. D. Riggen, A. Brooks, K. L. Cameron, D. Campbell, J. P. DiFiori, C. C. Giza, K. M. Guskiewicz, J. Jackson, G. T. McGinty, S. J. Svoboda, T. W. McAllister, S. P. Broglio, M. McCrea and C. C. I. the. Comparison of head impact exposure between concussed football athletes and matched controls: Evidence for a possible second mechanism of sport-related concussion. Annals of Biomedical Engineering. 47(10):2057-72, 2019.
2. Rowson, S., E. T. Campolettano, S. M. Duma, B. Stemper, A. Shah, J. Harezlak, L. Riggen, J. P. Mihalik, K. M. Guskiewicz, C. Giza, A. Brooks, K. Cameron, T. McAllister, S. P. Broglio and M. McCrea. Accounting for variance in concussion tolerance between individuals: Comparing head accelerations between concussed and physically matched control subjects. Annals of Biomedical Engineering. 47(10):2048-56, 2019.
3. Hecimovich, M., D. King, A. Dempsey and M. Murphy. Head impact exposure in junior and adult australian football players. Journal of Sports Medicine. 2018(2018.
4. Tierney, G. J., C. Kuo, L. Wu, D. Weaving and D. Camarillo. Analysis of head acceleration events in collegiate-level american football: A combination of qualitative video analysis and in-vivo head kinematic measurement. Journal of Biomechanics. 109969, 2020.
5. Savino, A. K., L. Huang, J. Yang, N. M. Pizzimenti, M. T. McCarthy and S. C. Rose. Head impact burden differs between seasons in youth and high school us football players. Annals of Biomedical Engineering. 1-9, 2020.
6. Kieffer, E. E., C. Vaillancourt, P. G. Brolinson and S. Rowson. Using in-mouth sensors to measure head kinematics in rugby. IRCOBI. 2020.
7. Miller, L. E., E. K. Pinkerton, K. C. Fabian, L. C. Wu, M. A. Espeland, L. C. Lamond, C. M. Miles, D. B. Camarillo, J. D. Stitzel and J. E. Urban. Characterizing head impact exposure in youth female soccer with a custom-instrumented mouthpiece. Research in Sports Medicine. 28(1):55-71, 2020.
8. Cecchi, N. J., D. C. Monroe, J. J. Phreaner, S. L. Small and J. W. Hicks. Patterns of head impact exposure in men’s and women’s collegiate club water polo. Journal of Science and Medicine in Sport. 2020.
9. Press, J. N. and S. Rowson. Quantifying head impact exposure in collegiate women's soccer. Clinical Journal of Sport Medicine. 27(2):104-10, 2017.
10. Wu, L. C., V. Nangia, K. Bui, B. Hammoor, M. Kurt, F. Hernandez, C. Kuo and D. B. Camarillo. In vivo evaluation of wearable head impact sensors. Annals of Biomedical Engineering. 44(4):1234-45, 2016.
11. Eckner, J. T., K. L. O’Connor, S. P. Broglio and J. A. Ashton-Miller. Comparison of head impact exposure between male and female high school ice hockey athletes. The American Journal of Sports Medicine. 46(9):2253-62, 2018.
12. Duma, S. M., S. J. Manoogian, W. R. Bussone, P. G. Brolinson, M. W. Goforth, J. J. Donnenwerth, R. M. Greenwald, J. J. Chu and J. J. Crisco. Analysis of real-time head accelerations in collegiate football players. Clinical Journal of Sport Medicine. 15(1):3-8, 2005.
13. Funk, J. R., S. Rowson, R. W. Daniel and S. M. Duma. Validation of concussion risk curves for collegiate football players derived from hits data. Annals of Biomedical Engineering. 40(1):79-89, 2012.
14. Greenwald, R. M., J. J. Chu, J. J. Crisco and J. A. Finkelstein. Head impact telemetry system (HITS) for measurement of head acceleration in the field. Proceedings of the American Society of Biomechanics Annual Meeting. 2003.
55
15. Urban, J. E., E. M. Davenport, A. J. Golman, J. A. Maldjian, C. T. Whitlow, A. K. Powers and J. D. Stitzel. Head impact exposure in youth football: High school ages 14 to 18 years and cumulative impact analysis. Annals of Biomedical Engineering. 2013.
16. Daniel, R. W., S. Rowson and S. M. Duma. Head impact exposure in youth football. Annals of Biomedical Engineering. 40(4):976-81, 2012.
17. Rowson, S., M. W. Goforth, D. Dietter, P. G. Brolinson and S. M. Duma. Correlating cumulative sub-concussive head impacts in football with player performance - biomed 2009. Biomedical Sciences Instrumentation. 45(113-8, 2009.
18. Crisco, J. J. and R. M. Greenwald. Let's get the head further out of the game: A proposal for reducing brain injuries in helmeted contact sports. Current Sports Medicine Reports. 10(1):7-9, 2011.
19. Rowson, S. and S. M. Duma. Development of the star evaluation system for football helmets: Integrating player head impact exposure and risk of concussion. Annals of Biomedical Engineering. 39(8):2130-40, 2011.
20. Viano, D. C. and D. Halstead. Change in size and impact performance of football helmets from the 1970s to 2010. Annals of Biomedical Engineering. 40(1):175-84, 2012.
21. Nevins, D., K. Hildenbrand, J. Kensrud, A. Vasavada and L. Smith. Laboratory and field evaluation of a small form factor head impact sensor in un-helmeted play. Proceedings of the Institution of Mechanical Engineers, Part P: Journal of Sports Engineering and Technology. 232(3):242-54, 2018.
22. Bartsch PhD, A., S. Samorezov, E. Benzel, C. Clinic, V. Miele and D. Brett. Validation of an "intelligent mouthguard" single event head impact dosimeter. 2014.
23. Camarillo, D. B., P. B. Shull, J. Mattson, R. Shultz and D. Garza. An instrumented mouthguard for measuring linear and angular head impact kinematics in american football. Annals of Biomedical Engineering. 41(9):1939-49, 2013.
24. Siegmund, G. P., K. M. Guskiewicz, S. W. Marshall, A. L. DeMarco and S. J. Bonin. Laboratory validation of two wearable sensor systems for measuring head impact severity in football players. Annals of Biomedical Engineering. 44(4):1257-74, 2016.
25. Patton, D. A., C. M. Huber, C. C. McDonald, S. S. Margulies, C. L. Master and K. B. Arbogast. Video confirmation of head impact sensor data from high school soccer players. The American Journal of Sports Medicine. 48(5):1246-53, 2020.
26. Lamond, L. C., J. B. Caccese, T. A. Buckley, J. Glutting and T. W. Kaminski. Linear acceleration in direct head contact across impact type, player position, and playing scenario in collegiate women's soccer players. Journal of Athletic Training. 53(2):115-21, 2018.
27. Kuo, C., L. C. Wu, B. T. Hammoor, J. F. Luck, H. C. Cutcliffe, R. C. Lynall, J. R. Kait, K. R. Campbell, J. P. Mihalik, C. R. Bass and D. B. Camarillo. Effect of the mandible on mouthguard measurements of head kinematics. Journal of Biomechanics. 49(9):1845-53, 2016.
28. Tyson, A. M., S. M. Duma and S. Rowson. Laboratory evaluation of low-cost wearable sensors for measuring head impacts in sports. 34(4):320, 2018.
29. Cortes, N., A. E. Lincoln, G. D. Myer, L. Hepburn, M. Higgins, M. Putukian and S. V. Caswell. Video analysis verification of head impact events measured by wearable sensors. The American Journal of Sports Medicine. 45(10):2379-87, 2017.
30. Beckwith, J. G., R. M. Greenwald and J. J. Chu. Measuring head kinematics in football: Correlation between the head impact telemetry system and Hybrid III headform. Annals of Biomedical Engineering. 40(1):237-48, 2012.
31. Rich, A. M., T. M. Filben, L. E. Miller, B. T. Tomblin, A. R. Van Gorkom, M. A. Hurst, R. T. Barnard, D. S. Kohn, J. E. Urban and J. D. Stitzel. Development, validation and pilot field deployment of a custom mouthpiece for head impact measurement. Annals of Biomedical Engineering. 47(10):2109-21, 2019.
32. Cummiskey, B., D. Schiffmiller, T. M. Talavage, L. Leverenz, J. J. Meyer, D. Adams and E. A. Nauman. Reliability and accuracy of helmet-mounted and head-mounted devices used to measure
56
head accelerations. Proceedings of the Institution of Mechanical Engineers, Part P: Journal of Sports Engineering and Technology. 231(2):144-53, 2016.
33. Jadischke, R., D. C. Viano, N. Dau, A. I. King and J. McCarthy. On the accuracy of the head impact telemetry (hit) system used in football helmets. Journal of Biomechanics. 46(13):2310-5, 2013.
34. Nevins, D., L. Smith and J. Kensrud. Laboratory evaluation of wireless head impact sensor. Procedia Engineering. 112(2015):175-9, 2015.
35. Tiernan, S., G. Byrne and D. O’Sullivan. Evaluation of skin-mounted sensor for head impact measurement. Proceedings of the Institution of Mechanical Engineers, Part H: Journal of Engineering in Medicine. 233(095441191985096, 2019.
36. Patton, D. A. A review of instrumented equipment to investigate head impacts in sport. Applied Bionics and Biomechanics. 2016(2016.
37. O'Connor, K. L., S. Rowson, S. M. Duma and S. P. Broglio. Head-impact–measurement devices: A systematic review. Journal of Athletic Training. 52(3):206-27, 2017.
38. Cobb, B. R., A. MacAlister, T. J. Young, A. R. Kemper, S. Rowson and S. M. Duma. Quantitative comparison of Hybrid III and national operating committee on standards for athletic equipment headform shape characteristics and implications on football helmet fit. Proceedings of the Institution of Mechanical Engineers, Part P: Journal of Sports Engineering and Technology. 229(1):39-46, 2015.
39. Cobb, B. R., A. M. Zadnik and S. Rowson. Comparative analysis of helmeted impact response of Hybrid III and national operating committee on standards for athletic equipment headforms. Proceedings of the Institution of Mechanical Engineers, Part P: Journal of Sports Engineering and Technology. 230(1):50-60, 2016.
40. Zhou, Y. J., G. Lu and J. L. Yang. Finite element study of energy absorption foams for headgear in football (soccer) games. Materials & Design. 88(162-9, 2015.
41. Withnall, C., N. Shewchenko, R. Gittens and J. Dvorak. Biomechanical investigation of head impacts in football. British Journal of Sports Medicine. 39(suppl 1):i49-i57, 2005.
42. Lawrence, I. and K. Lin. A concordance correlation coefficient to evaluate reproducibility. Biometrics. 255-68, 1989.
43. Ng, T. P., W. R. Bussone and S. M. Duma. The effect of gender and body size on linear accelerations of the head observed during daily activities. Biomedical Sciences Instrumentation. 42(25-30, 2006.
44. Campolettano, E. T., R. A. Gellner and S. Rowson. High-magnitude head impact exposure in youth football. Journal of Neurosurgery: Pediatrics. 20(6):604-12, 2017.
57
CHAPTER 4: USING IN-MOUTH SENSORS TO MEASURE HEAD
KINEMATICS IN RUGBY
ABSTRACT
Sports-related concussions were once thought to present only transient symptoms, but recent research has
shown the potential for long -term neurological impairments. Previous research has instrumented helmeted
athletes with sensors to measure head kinematics and concussive biomechanics on-field. However,
expanding studies beyond helmeted players will help us to understand sex-specific differences and
unhelmeted loading conditions and their relationship to impact exposure and tolerance. Athletes on the
men’s and women’s club collegiate rugby teams at Virginia Tech were custom fit with instrumented
mouthguards and monitored over a year to quantify subconcussive and concussive biomechanics in
unhelmeted athletes. The objective of this study was to quantify head kinematics sustained from inertially
driven (body impacts) and direct head impacts in collegiate rugby players. The majority of the impacts
collected were low in magnitude, and head impacts were associated with higher PLAs than body impacts
(∆ = 2.5 g, p < 0.005). Head impacts had a median PLA of 15.2 g and a median ∆RV of 6.7 rad/s; body
impacts had a median PLA of 13.6 g and a median ∆RV of 6.6 rad/s. For each impact type, men and women
sustained similar peak linear accelerations (head impact: ∆ = 1.9 g, p = 0.219; body impact: ∆ = 0.5 g, p =
0.280), men sustained higher changes in rotational velocities for head impacts (∆ = 1.4 rad/s, p = 0.003)
and longer impact durations for both head (∆ = 2.6 ms, p < 0.001) and body (∆ = 2.8 ms, p = 0.023) impacts.
These findings can be used to advise best practices for in-mouth sensors and better understand the
mechanisms of concussion in unhelmeted sports.
Keywords: Acceleration, Biomechanics, Concussion, Female, Impact
INTRODUCTION
Not only do concussions present acute cognitive impairment at the time of injury and long-term
complications, but a history of repetitive head impact exposure may be similarly detrimental.1
Instrumenting American football players with sensors to measure head impact kinematics has improved our
understanding of head impact exposure and biomechanics.2-6 However, we still do not understand sex-
related differences in exposure and head impact tolerance. There is also much unknown about exposure in
other sports, especially in those with unhelmeted athletes, who likely undergo different loading conditions
than helmeted athletes. Concussive biomechanics in unhelmeted sports have not been quantified because
instrumenting these athletes is challenging. Different types of sensors have been used on-field, including
those worn in headbands,7-9 on skin-mounted patches,10-13 in the ear,14 and embedded into mouthguards.15,16
58
Of these, mouthguards offer the best solution as they allow for a nearly rigid coupling to the skull, which
improves head kinematics measurement accuracy.17
Similar to American football, rugby players have a high exposure to head impacts.18 Worldwide, rugby is
a popular full-contact team sport, and its physicality and competitiveness lead to a high concussion rate.19
The only protective equipment worn by rugby players is a mouthguard, which does not reduce the risk of
concussion.20 About 13–17% of rugby players will sustain a concussion during a season, though this varies
by the play style. Both men’s and women’s teams play at various levels of competition, under the same
rules.20
Athletes can play Rugby-7s (7s), or Rugby-15s (15s). Rugby-7s is played with seven players on the field
(per team) and is played for seven-minute halves. Rugby-15s is played with 15 players on the field (per
team) and is played for 40-minute halves. A previous study from Ireland found the incidence and severity
of concussion to be higher in Rugby-7s.21 The same study found that the leading causes of concussion were
tackling (7s) and collisions (15s).21 According to video review, concussion risk for a tackler is elevated in
a collision tackle, when the initial contact is made by the tackler’s head/neck, when the tackler does not use
their arms, or when the tackle is broken by the ball carrier.22 King et al. quantified head impacts in junior
league rugby and amateur rugby union (Rugby-15s), measuring resultant head accelerations similar to youth
football and some college football, but lower than those in female youth soccer and professional American
football.18,23 The junior league players were instrumented with skin-mounted sensors worn behind the ear,
and the union players wore molded instrumented mouthguards.23
Most of these studies did not include female athletes (the junior league had five girls who were under 11),
nor did they characterize head kinematics by impact type. Additionally, King noted limitations with his
devices, including a lack of consistent reliability studies with the skin-mounted sensor systems and saliva
ruining components in the instrumented mouthguards.23 Instrumentation approaches have improved since,
with new technologies coming to market. The objective of this study was to quantify head kinematics and
impact durations sustained from both inertially driven and direct impact head acceleration events
experienced by men and women collegiate rugby players. For this study, collegiate rugby players wore
custom-fit instrumented mouthguards. We hypothesized that head impacts would have higher peak
kinematics and shorter impact durations compared to body impacts, and that kinematics would not differ
between sexes.
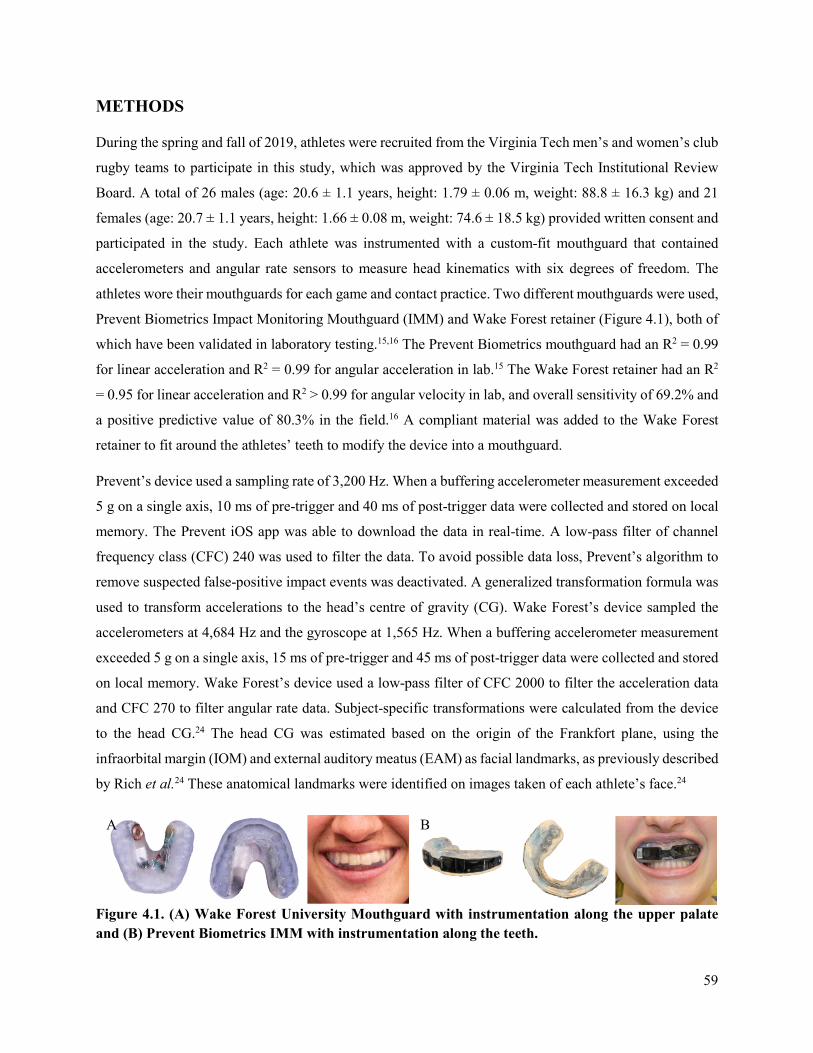
59
METHODS
During the spring and fall of 2019, athletes were recruited from the Virginia Tech men’s and women’s club
rugby teams to participate in this study, which was approved by the Virginia Tech Institutional Review
Board. A total of 26 males (age: 20.6 ± 1.1 years, height: 1.79 ± 0.06 m, weight: 88.8 ± 16.3 kg) and 21
females (age: 20.7 ± 1.1 years, height: 1.66 ± 0.08 m, weight: 74.6 ± 18.5 kg) provided written consent and
participated in the study. Each athlete was instrumented with a custom-fit mouthguard that contained
accelerometers and angular rate sensors to measure head kinematics with six degrees of freedom. The
athletes wore their mouthguards for each game and contact practice. Two different mouthguards were used,
Prevent Biometrics Impact Monitoring Mouthguard (IMM) and Wake Forest retainer (Figure 4.1), both of
which have been validated in laboratory testing.15,16 The Prevent Biometrics mouthguard had an R2 = 0.99
for linear acceleration and R2 = 0.99 for angular acceleration in lab.15 The Wake Forest retainer had an R2
= 0.95 for linear acceleration and R2 > 0.99 for angular velocity in lab, and overall sensitivity of 69.2% and
a positive predictive value of 80.3% in the field.16 A compliant material was added to the Wake Forest
retainer to fit around the athletes’ teeth to modify the device into a mouthguard.
Prevent’s device used a sampling rate of 3,200 Hz. When a buffering accelerometer measurement exceeded
5 g on a single axis, 10 ms of pre-trigger and 40 ms of post-trigger data were collected and stored on local
memory. The Prevent iOS app was able to download the data in real-time. A low-pass filter of channel
frequency class (CFC) 240 was used to filter the data. To avoid possible data loss, Prevent’s algorithm to
remove suspected false-positive impact events was deactivated. A generalized transformation formula was
used to transform accelerations to the head’s centre of gravity (CG). Wake Forest’s device sampled the
accelerometers at 4,684 Hz and the gyroscope at 1,565 Hz. When a buffering accelerometer measurement
exceeded 5 g on a single axis, 15 ms of pre-trigger and 45 ms of post-trigger data were collected and stored
on local memory. Wake Forest’s device used a low-pass filter of CFC 2000 to filter the acceleration data
and CFC 270 to filter angular rate data. Subject-specific transformations were calculated from the device
to the head CG.24 The head CG was estimated based on the origin of the Frankfort plane, using the
infraorbital margin (IOM) and external auditory meatus (EAM) as facial landmarks, as previously described
by Rich et al.24 These anatomical landmarks were identified on images taken of each athlete’s face.24
Figure 4.1. (A) Wake Forest University Mouthguard with instrumentation along the upper palate and (B) Prevent Biometrics IMM with instrumentation along the teeth.
A B
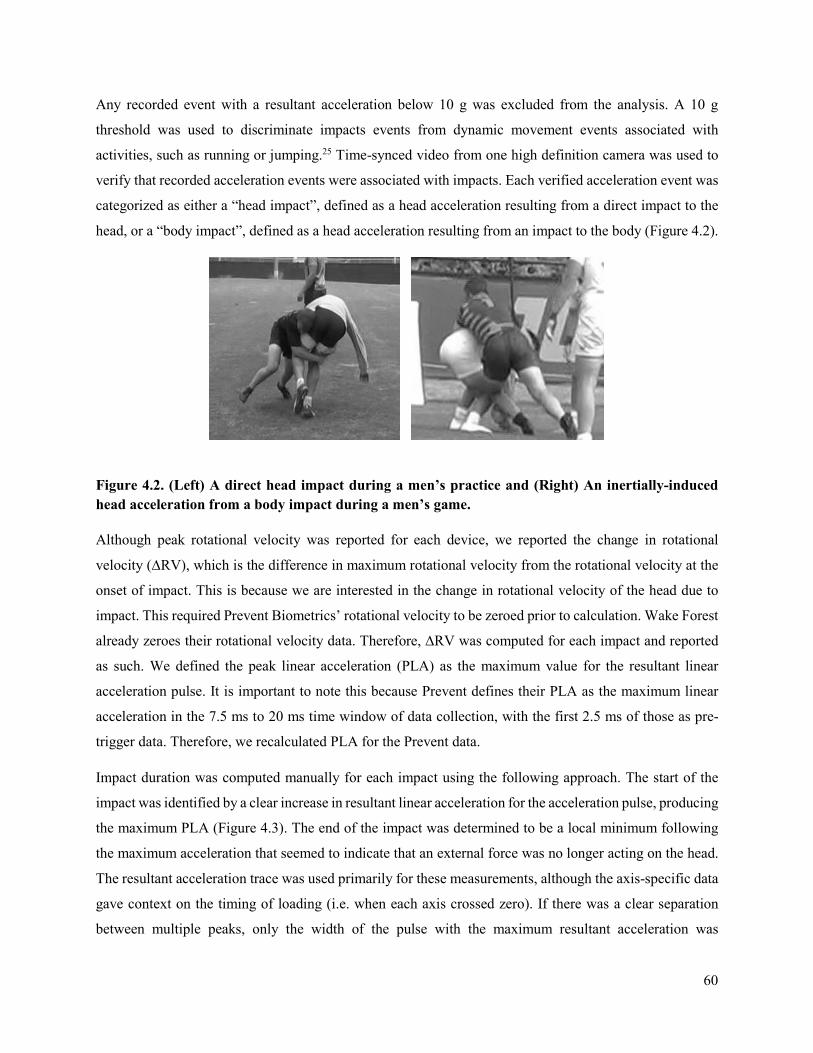
60
Any recorded event with a resultant acceleration below 10 g was excluded from the analysis. A 10 g
threshold was used to discriminate impacts events from dynamic movement events associated with
activities, such as running or jumping.25 Time-synced video from one high definition camera was used to
verify that recorded acceleration events were associated with impacts. Each verified acceleration event was
categorized as either a “head impact”, defined as a head acceleration resulting from a direct impact to the
head, or a “body impact”, defined as a head acceleration resulting from an impact to the body (Figure 4.2).
Figure 4.2. (Left) A direct head impact during a men’s practice and (Right) An inertially-induced head acceleration from a body impact during a men’s game.
Although peak rotational velocity was reported for each device, we reported the change in rotational
velocity (∆RV), which is the difference in maximum rotational velocity from the rotational velocity at the
onset of impact. This is because we are interested in the change in rotational velocity of the head due to
impact. This required Prevent Biometrics’ rotational velocity to be zeroed prior to calculation. Wake Forest
already zeroes their rotational velocity data. Therefore, ∆RV was computed for each impact and reported
as such. We defined the peak linear acceleration (PLA) as the maximum value for the resultant linear
acceleration pulse. It is important to note this because Prevent defines their PLA as the maximum linear
acceleration in the 7.5 ms to 20 ms time window of data collection, with the first 2.5 ms of those as pre-
trigger data. Therefore, we recalculated PLA for the Prevent data.
Impact duration was computed manually for each impact using the following approach. The start of the
impact was identified by a clear increase in resultant linear acceleration for the acceleration pulse, producing
the maximum PLA (Figure 4.3). The end of the impact was determined to be a local minimum following
the maximum acceleration that seemed to indicate that an external force was no longer acting on the head.
The resultant acceleration trace was used primarily for these measurements, although the axis-specific data
gave context on the timing of loading (i.e. when each axis crossed zero). If there was a clear separation
between multiple peaks, only the width of the pulse with the maximum resultant acceleration was
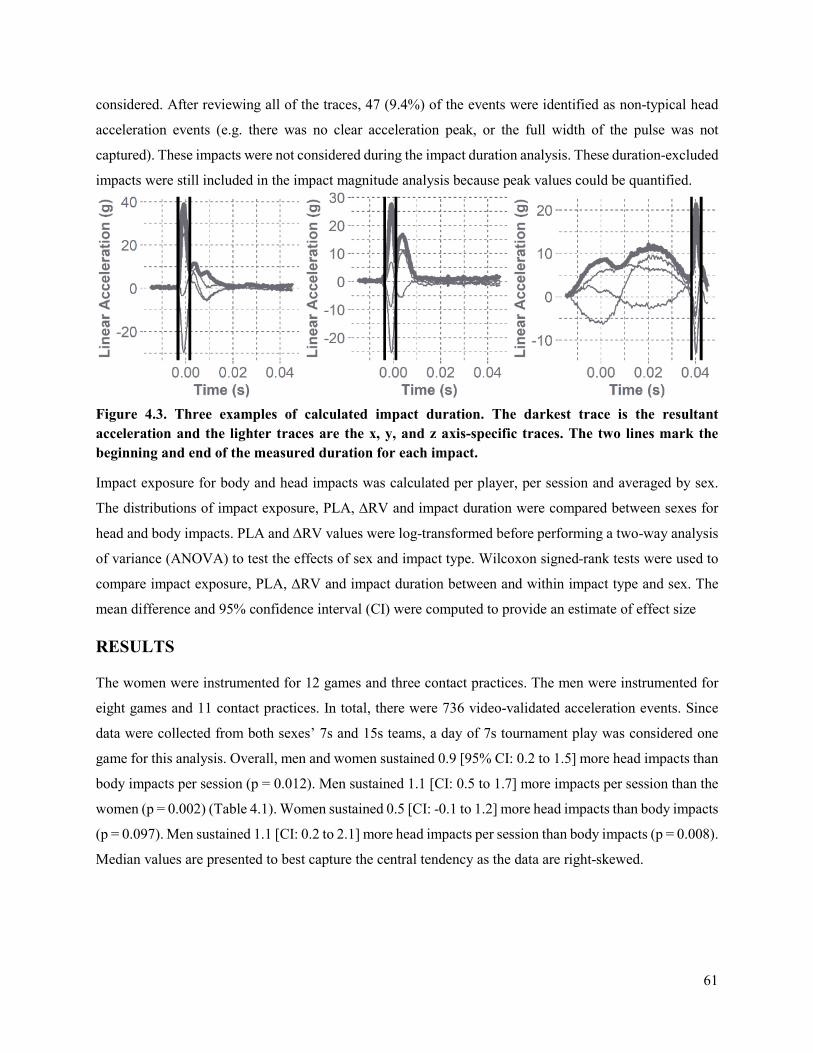
61
considered. After reviewing all of the traces, 47 (9.4%) of the events were identified as non-typical head
acceleration events (e.g. there was no clear acceleration peak, or the full width of the pulse was not
captured). These impacts were not considered during the impact duration analysis. These duration-excluded
impacts were still included in the impact magnitude analysis because peak values could be quantified.
Figure 4.3. Three examples of calculated impact duration. The darkest trace is the resultant acceleration and the lighter traces are the x, y, and z axis-specific traces. The two lines mark the beginning and end of the measured duration for each impact.
Impact exposure for body and head impacts was calculated per player, per session and averaged by sex.
The distributions of impact exposure, PLA, ∆RV and impact duration were compared between sexes for
head and body impacts. PLA and ∆RV values were log-transformed before performing a two-way analysis
of variance (ANOVA) to test the effects of sex and impact type. Wilcoxon signed-rank tests were used to
compare impact exposure, PLA, ∆RV and impact duration between and within impact type and sex. The
mean difference and 95% confidence interval (CI) were computed to provide an estimate of effect size
RESULTS
The women were instrumented for 12 games and three contact practices. The men were instrumented for
eight games and 11 contact practices. In total, there were 736 video-validated acceleration events. Since
data were collected from both sexes’ 7s and 15s teams, a day of 7s tournament play was considered one
game for this analysis. Overall, men and women sustained 0.9 [95% CI: 0.2 to 1.5] more head impacts than
body impacts per session (p = 0.012). Men sustained 1.1 [CI: 0.5 to 1.7] more impacts per session than the
women (p = 0.002) (Table 4.1). Women sustained 0.5 [CI: -0.1 to 1.2] more head impacts than body impacts
(p = 0.097). Men sustained 1.1 [CI: 0.2 to 2.1] more head impacts per session than body impacts (p = 0.008).
Median values are presented to best capture the central tendency as the data are right-skewed.
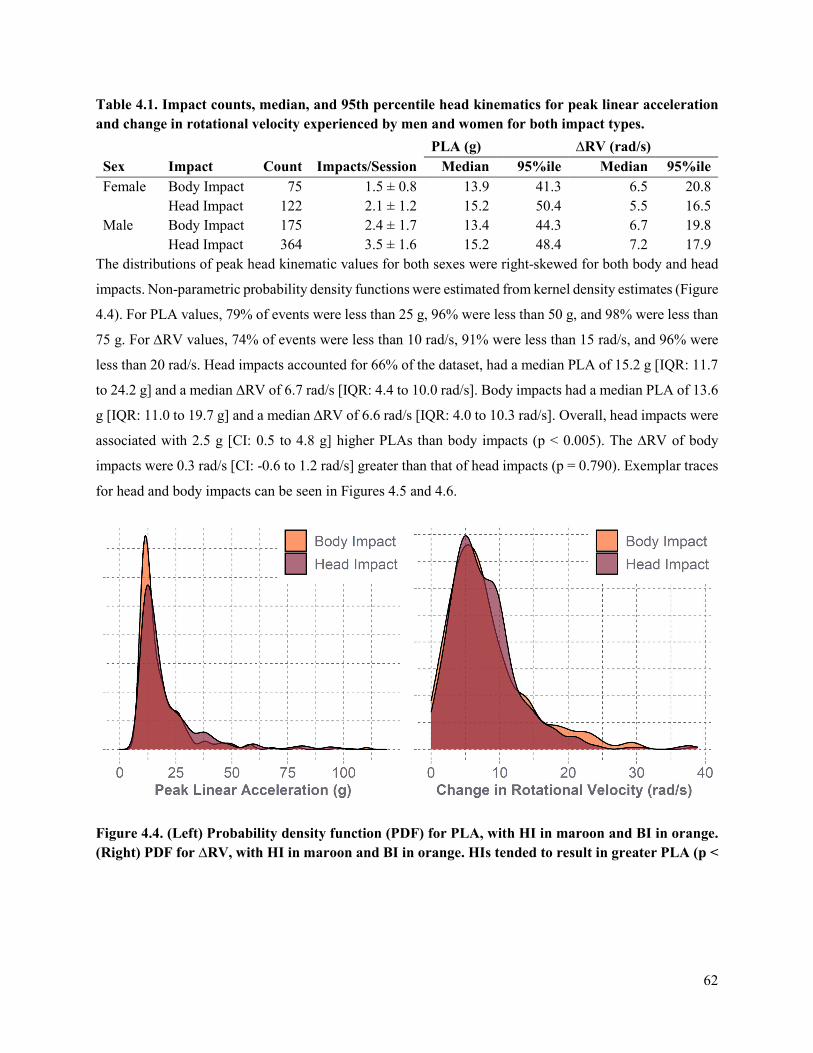
62
Table 4.1. Impact counts, median, and 95th percentile head kinematics for peak linear acceleration and change in rotational velocity experienced by men and women for both impact types.
The distributions of peak head kinematic values for both sexes were right-skewed for both body and head
impacts. Non-parametric probability density functions were estimated from kernel density estimates (Figure
4.4). For PLA values, 79% of events were less than 25 g, 96% were less than 50 g, and 98% were less than
75 g. For ∆RV values, 74% of events were less than 10 rad/s, 91% were less than 15 rad/s, and 96% were
less than 20 rad/s. Head impacts accounted for 66% of the dataset, had a median PLA of 15.2 g [IQR: 11.7
to 24.2 g] and a median ∆RV of 6.7 rad/s [IQR: 4.4 to 10.0 rad/s]. Body impacts had a median PLA of 13.6
g [IQR: 11.0 to 19.7 g] and a median ∆RV of 6.6 rad/s [IQR: 4.0 to 10.3 rad/s]. Overall, head impacts were
associated with 2.5 g [CI: 0.5 to 4.8 g] higher PLAs than body impacts (p < 0.005). The ∆RV of body
impacts were 0.3 rad/s [CI: -0.6 to 1.2 rad/s] greater than that of head impacts (p = 0.790). Exemplar traces
for head and body impacts can be seen in Figures 4.5 and 4.6.
Figure 4.4. (Left) Probability density function (PDF) for PLA, with HI in maroon and BI in orange. (Right) PDF for ∆RV, with HI in maroon and BI in orange. HIs tended to result in greater PLA (p <
PLA (g) ∆RV (rad/s) Sex Impact Count Impacts/Session Median 95%ile Median 95%ile Female Body Impact 75 1.5 ± 0.8 13.9 41.3 6.5 20.8 Head Impact 122 2.1 ± 1.2 15.2 50.4 5.5 16.5 Male Body Impact 175 2.4 ± 1.7 13.4 44.3 6.7 19.8 Head Impact 364 3.5 ± 1.6 15.2 48.4 7.2 17.9
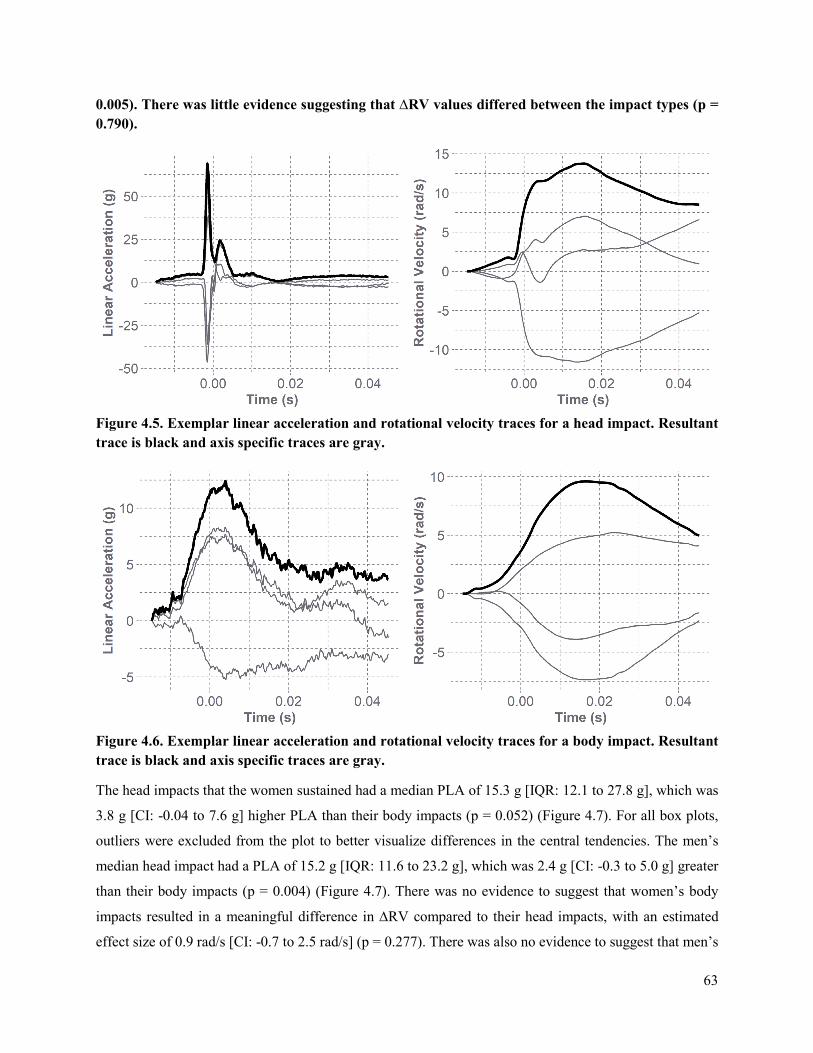
63
0.005). There was little evidence suggesting that ∆RV values differed between the impact types (p = 0.790).
Figure 4.5. Exemplar linear acceleration and rotational velocity traces for a head impact. Resultant trace is black and axis specific traces are gray.
Figure 4.6. Exemplar linear acceleration and rotational velocity traces for a body impact. Resultant trace is black and axis specific traces are gray.
The head impacts that the women sustained had a median PLA of 15.3 g [IQR: 12.1 to 27.8 g], which was
3.8 g [CI: -0.04 to 7.6 g] higher PLA than their body impacts (p = 0.052) (Figure 4.7). For all box plots,
outliers were excluded from the plot to better visualize differences in the central tendencies. The men’s
median head impact had a PLA of 15.2 g [IQR: 11.6 to 23.2 g], which was 2.4 g [CI: -0.3 to 5.0 g] greater
than their body impacts (p = 0.004) (Figure 4.7). There was no evidence to suggest that women’s body
impacts resulted in a meaningful difference in ∆RV compared to their head impacts, with an estimated
effect size of 0.9 rad/s [CI: -0.7 to 2.5 rad/s] (p = 0.277). There was also no evidence to suggest that men’s
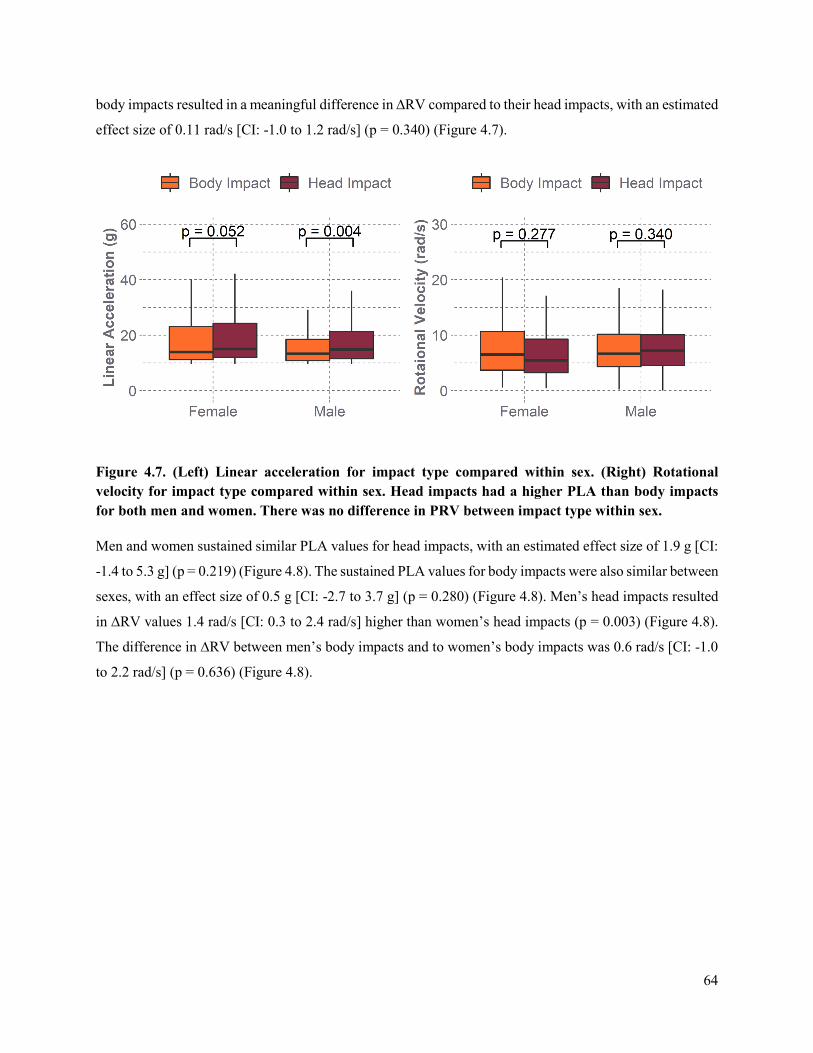
64
body impacts resulted in a meaningful difference in ∆RV compared to their head impacts, with an estimated
effect size of 0.11 rad/s [CI: -1.0 to 1.2 rad/s] (p = 0.340) (Figure 4.7).
Figure 4.7. (Left) Linear acceleration for impact type compared within sex. (Right) Rotational velocity for impact type compared within sex. Head impacts had a higher PLA than body impacts for both men and women. There was no difference in PRV between impact type within sex.
Men and women sustained similar PLA values for head impacts, with an estimated effect size of 1.9 g [CI:
-1.4 to 5.3 g] (p = 0.219) (Figure 4.8). The sustained PLA values for body impacts were also similar between
sexes, with an effect size of 0.5 g [CI: -2.7 to 3.7 g] (p = 0.280) (Figure 4.8). Men’s head impacts resulted
in ∆RV values 1.4 rad/s [CI: 0.3 to 2.4 rad/s] higher than women’s head impacts (p = 0.003) (Figure 4.8).
The difference in ∆RV between men’s body impacts and to women’s body impacts was 0.6 rad/s [CI: -1.0
to 2.2 rad/s] (p = 0.636) (Figure 4.8).
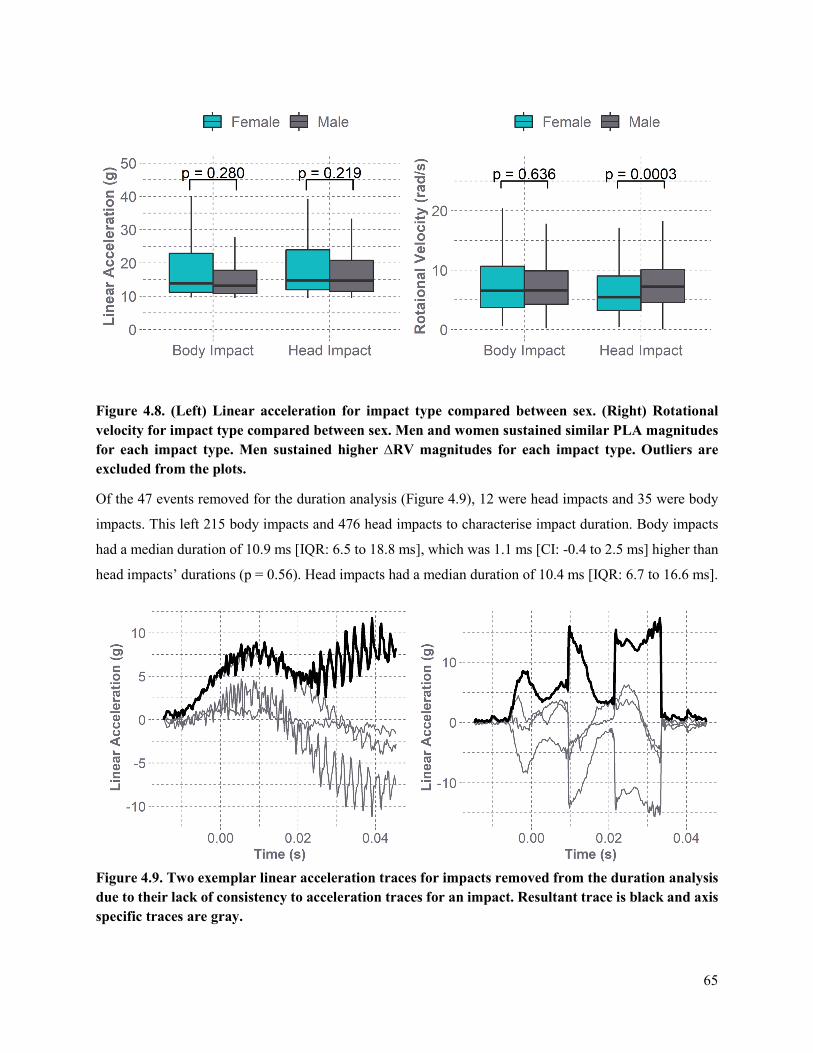
65
Figure 4.8. (Left) Linear acceleration for impact type compared between sex. (Right) Rotational velocity for impact type compared between sex. Men and women sustained similar PLA magnitudes for each impact type. Men sustained higher ∆RV magnitudes for each impact type. Outliers are excluded from the plots.
Of the 47 events removed for the duration analysis (Figure 4.9), 12 were head impacts and 35 were body
impacts. This left 215 body impacts and 476 head impacts to characterise impact duration. Body impacts
had a median duration of 10.9 ms [IQR: 6.5 to 18.8 ms], which was 1.1 ms [CI: -0.4 to 2.5 ms] higher than
head impacts’ durations (p = 0.56). Head impacts had a median duration of 10.4 ms [IQR: 6.7 to 16.6 ms].
Figure 4.9. Two exemplar linear acceleration traces for impacts removed from the duration analysis due to their lack of consistency to acceleration traces for an impact. Resultant trace is black and axis specific traces are gray.
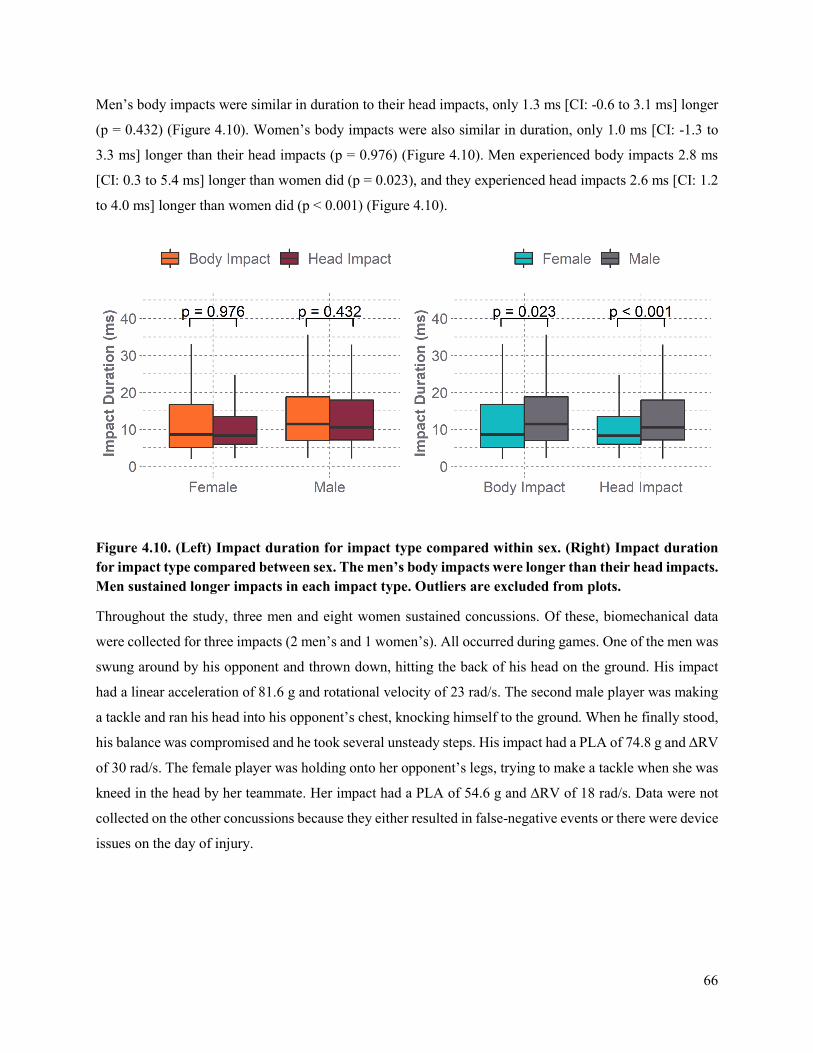
66
Men’s body impacts were similar in duration to their head impacts, only 1.3 ms [CI: -0.6 to 3.1 ms] longer
(p = 0.432) (Figure 4.10). Women’s body impacts were also similar in duration, only 1.0 ms [CI: -1.3 to
3.3 ms] longer than their head impacts (p = 0.976) (Figure 4.10). Men experienced body impacts 2.8 ms
[CI: 0.3 to 5.4 ms] longer than women did (p = 0.023), and they experienced head impacts 2.6 ms [CI: 1.2
to 4.0 ms] longer than women did (p < 0.001) (Figure 4.10).
Figure 4.10. (Left) Impact duration for impact type compared within sex. (Right) Impact duration for impact type compared between sex. The men’s body impacts were longer than their head impacts. Men sustained longer impacts in each impact type. Outliers are excluded from plots.
Throughout the study, three men and eight women sustained concussions. Of these, biomechanical data
were collected for three impacts (2 men’s and 1 women’s). All occurred during games. One of the men was
swung around by his opponent and thrown down, hitting the back of his head on the ground. His impact
had a linear acceleration of 81.6 g and rotational velocity of 23 rad/s. The second male player was making
a tackle and ran his head into his opponent’s chest, knocking himself to the ground. When he finally stood,
his balance was compromised and he took several unsteady steps. His impact had a PLA of 74.8 g and ∆RV
of 30 rad/s. The female player was holding onto her opponent’s legs, trying to make a tackle when she was
kneed in the head by her teammate. Her impact had a PLA of 54.6 g and ∆RV of 18 rad/s. Data were not
collected on the other concussions because they either resulted in false-negative events or there were device
issues on the day of injury.
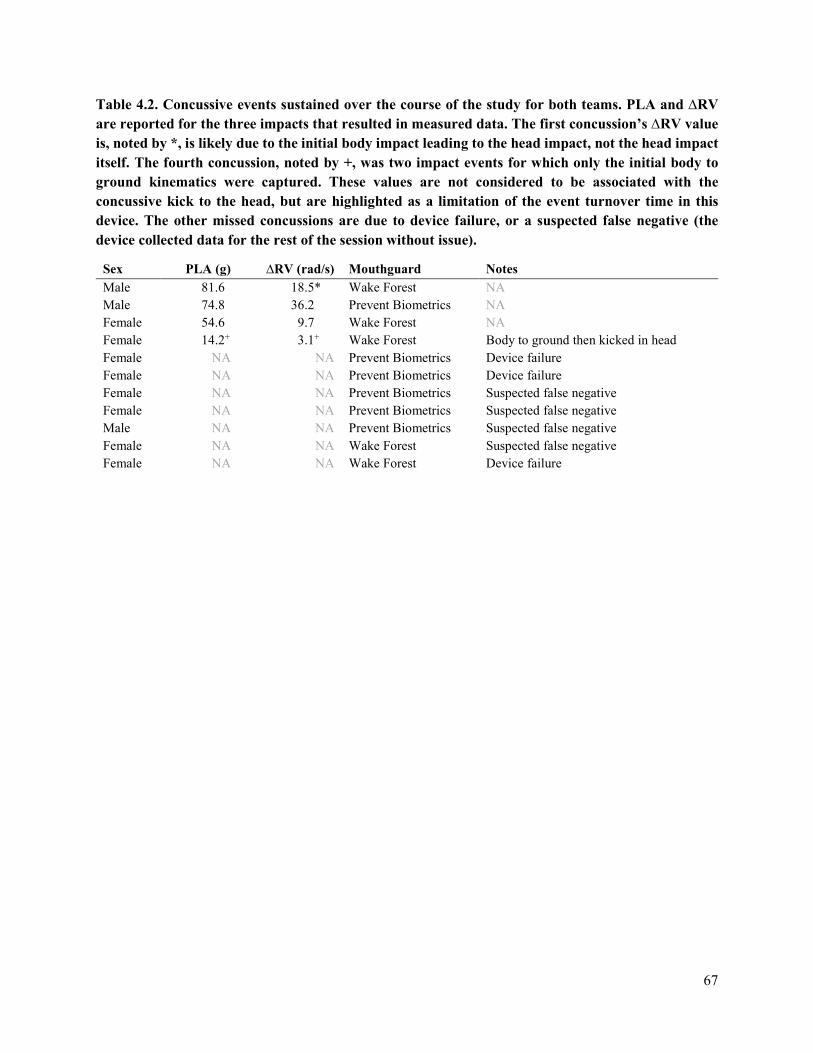
67
Table 4.2. Concussive events sustained over the course of the study for both teams. PLA and ∆RV are reported for the three impacts that resulted in measured data. The first concussion’s ∆RV value is, noted by *, is likely due to the initial body impact leading to the head impact, not the head impact itself. The fourth concussion, noted by +, was two impact events for which only the initial body to ground kinematics were captured. These values are not considered to be associated with the concussive kick to the head, but are highlighted as a limitation of the event turnover time in this device. The other missed concussions are due to device failure, or a suspected false negative (the device collected data for the rest of the session without issue).
Sex PLA (g) ∆RV (rad/s) Mouthguard Notes Male 81.6 18.5* Wake Forest NA Male 74.8 36.2 Prevent Biometrics NA Female 54.6 9.7 Wake Forest NA Female 14.2+ 3.1+ Wake Forest Body to ground then kicked in head Female NA NA Prevent Biometrics Device failure Female NA NA Prevent Biometrics Device failure Female NA NA Prevent Biometrics Suspected false negative Female NA NA Prevent Biometrics Suspected false negative Male NA NA Prevent Biometrics Suspected false negative Female NA NA Wake Forest Suspected false negative Female NA NA Wake Forest Device failure
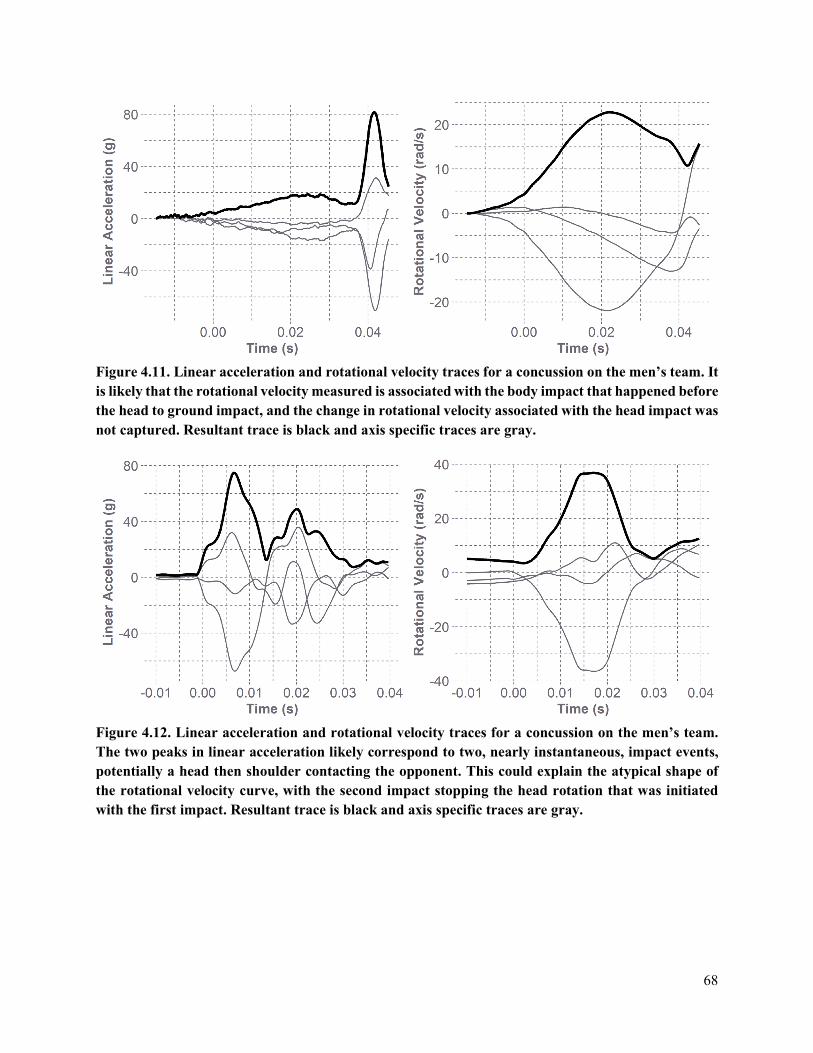
68
Figure 4.11. Linear acceleration and rotational velocity traces for a concussion on the men’s team. It is likely that the rotational velocity measured is associated with the body impact that happened before the head to ground impact, and the change in rotational velocity associated with the head impact was not captured. Resultant trace is black and axis specific traces are gray.
Figure 4.12. Linear acceleration and rotational velocity traces for a concussion on the men’s team. The two peaks in linear acceleration likely correspond to two, nearly instantaneous, impact events, potentially a head then shoulder contacting the opponent. This could explain the atypical shape of the rotational velocity curve, with the second impact stopping the head rotation that was initiated with the first impact. Resultant trace is black and axis specific traces are gray.
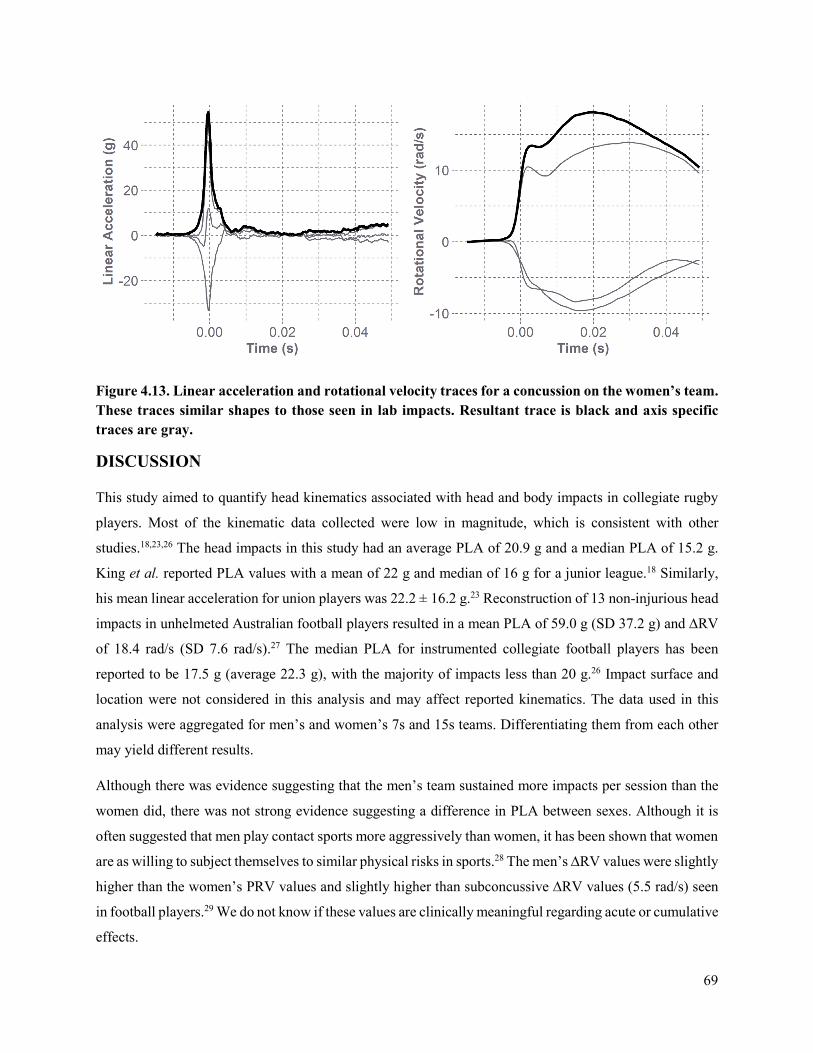
69
Figure 4.13. Linear acceleration and rotational velocity traces for a concussion on the women’s team. These traces similar shapes to those seen in lab impacts. Resultant trace is black and axis specific traces are gray.
DISCUSSION
This study aimed to quantify head kinematics associated with head and body impacts in collegiate rugby
players. Most of the kinematic data collected were low in magnitude, which is consistent with other
studies.18,23,26 The head impacts in this study had an average PLA of 20.9 g and a median PLA of 15.2 g.
King et al. reported PLA values with a mean of 22 g and median of 16 g for a junior league.18 Similarly,
his mean linear acceleration for union players was 22.2 ± 16.2 g.23 Reconstruction of 13 non-injurious head
impacts in unhelmeted Australian football players resulted in a mean PLA of 59.0 g (SD 37.2 g) and ∆RV
of 18.4 rad/s (SD 7.6 rad/s).27 The median PLA for instrumented collegiate football players has been
reported to be 17.5 g (average 22.3 g), with the majority of impacts less than 20 g.26 Impact surface and
location were not considered in this analysis and may affect reported kinematics. The data used in this
analysis were aggregated for men’s and women’s 7s and 15s teams. Differentiating them from each other
may yield different results.
Although there was evidence suggesting that the men’s team sustained more impacts per session than the
women did, there was not strong evidence suggesting a difference in PLA between sexes. Although it is
often suggested that men play contact sports more aggressively than women, it has been shown that women
are as willing to subject themselves to similar physical risks in sports.28 The men’s ∆RV values were slightly
higher than the women’s PRV values and slightly higher than subconcussive ∆RV values (5.5 rad/s) seen
in football players.29 We do not know if these values are clinically meaningful regarding acute or cumulative
effects.
70
Direct head impacts were associated with slighter higher PLA and significantly higher ∆RVs than body-
driven events. However, body impacts still resulted in notable head kinematic magnitudes. Accordingly,
limiting exposure analyses to only confirmed head impact, and not considering all video-verified
acceleration events, will underestimate the true exposure of athletes. Although contact phenomenon has
shown importance in brain injury tolerance,30-32 the clinical symptoms that accompany an inertially induced
acceleration event can be as severe as those associated with a direct impact, and their effect on cumulative
exposure should not be overlooked.33 Impact type is a confounding variable that should be accounted for
given differences in loading duration. We saw durations 8% greater for body impacts than for head impacts.
It is important to note that the change in angular velocity is occurring over a different time interval than the
duration reported, which hampers its interpretation compared to peak linear acceleration.
Five acceleration events were removed from the initial 741-event dataset based on perceived video-
observed impact severity and mouthguard-measured magnitude discrepancies. One impact was sustained
from a men’s player and resulted in a PLA recording of over 290 g. The video showed he was in a ruck,
and an opponent’s arm struck his head, but 290 g is not consistent with the impact severity observed. The
video was of a sufficient quality to identify this discrepancy. A similar scenario occurred for a female player
whose mouthguard measured a 135 g acceleration when tackling her opponent without making any head
contact. This magnitude is not consistent with any of the body impacts we have seen. The third event
removed was a 127 g measurement for a ball-to-face impact from one of the women’s players. After the
ball bounced off her face, she caught it and continued to play. Previous studies have measured soccer ball
headers to be around 20 g,34 nearly a fifth of the magnitude measured. The fourth is a 187 g impact from
the men’s team who was lying on the ground in a ruck, and was hit with a forearm. He appeared unaffected
by the impact. The fifth and final event removed had a magnitude of 158 g and occurred when a women
tackled an opponent to the ground and braced on her head on the ground after the impact. She continued to
play without any sign of significant injury, which would be expected with a PLA as high as this.
Good coupling to the skull is an advantage of using instrumented mouthguards to measure head impacts in
athletes. However, this approach is reliant on athletes wearing the mouthguards properly. If a mouthguard
is not set correctly on the teeth during an impact, the measured kinematics will be erroneous, potentially
explaining the inflated kinematics in the three events removed from the dataset. We removed 47 impacts
from the duration analysis given their atypical head acceleration traces. Poor coupling to the teeth is one
explanation for being suspicious of these events’ data quality.
The three concussive kinematic values in this study are similar to the concussion magnitudes found in two
union rugby players which were 94.8 g and 5319.8 rad/s2 and 54.9 g and 9935.2 rad/s2.23 The concussion
magnitudes measured in the current study are also within the range of observed in football players.29 There
71
is very little data on concussion in rugby and as we collect more, we expect the kinematics resulting in
concussion in unhelmeted rugby players to be less than that of helmeted football players, partly due to
different frequency content and contact phenomena.
There was another concussion on the women’s team resulting from being kicked in the head after diving to
the ground. Her mouthguard measured impact kinematics of 14.2 g and 6 rad/s. For this case, there were
likely two acceleration events: the athlete’s body impacting the ground; and the athlete’s head being kicked.
The Wake Forest devices require 300 ms between recording events. The kinematic values attributed to this
concussion are likely the result of the ground impact. The kick occurred approximately 167 ms after the
initial impact, which is during the time the mouthguard was preparing for the next impact. In comparison,
the Prevent mouthguard only has a 25 ms delay between impacts. Understanding this turnover time between
impacts is another critical component of properly verifying on-field kinematic data. Rugby players often
undergo body-then-head acceleration events during tackles. This can complicate video validation if it is
difficult to know if a body impact before a head impact is enough to trigger data acquisition and if events
are outside the device turnover time. King et al. also noted complications with video validation in rugby,
as athlete head position is difficult to distinguish in some tackles, rucks, mauls and scrums.23 The double-
impact scenario was something evident when inspecting the traces in our dataset. There were many events
observed that had secondary peaks within the data-collection window, sometimes having higher values than
the initial peak.
An obvious concern is the seven concussions for which data were not recorded. Four of these cases were
suspected false negative events (three Prevent Biometrics, one Wake Forest) and three were device issues
on the day of injury. Missing data from these concussions raises awareness for other potential false
negatives that the mouthguards may be missing, thus underestimating impact count estimates in exposure
studies. There were 17 instances of the Prevent mouthguard not functioning, and four instances of the Wake
Forest mouthguard not functioning. Sometimes the issue was Bluetooth connectivity, either before or after
the game, which complicated setting the devices for acquisition and downloading data. Wake Forest’s
devices also had intermittent gyroscope failures and some of the internal clocks did not sync, resulting in
data that were erroneous or unusable. The battery life on the Wake Forest devices was shorter and there
were issues with the charging cases not working, causing several mouthguards to die mid-session. As the
seasons progressed, both companies made durability and usability improvements to reduce data loss.
Another limitation of this dataset is the inability to summarise the data on a per-player basis. This is because
not every player in the study sustained enough impacts for an individualized analysis. In summarizing the
overall data, those athletes who experienced more impacts exert more weight in the analysis than their
72
counterparts with fewer impacts. Continued data collection will allow for the characterization of head
kinematics on a per-player basis, which would be critically important for defining exposure in rugby.
Potential systematic differences between the mouthguards were explored in the dataset presented. Impacts
measured by Wake Forest devices had a median PLA of 13.9 g [IQR: 11.2 to 21.1 g] and a median ∆RV of
5.6 rad/s [IQR: 3.5 to 9.0 rad/s]. Impacts measured by Prevent Biometrics devices had a median PLA of
15.2 g [IQR: 11.6 to 23.9 g] and a median ∆RV of 7.5 rad/s [IQR: 4.9 to 10.5 rad/s]. Attempting to stratify
the dataset to reduce confounding factors (like sex, session type, and individual players’ aggression)
decreases the sample size and resolution for comparison. The slight differences seen between devices are
more likely due to variance as a result of confounding factors than as a result of systematic differences
between the sensors.
On-field use of the in-mouth sensors proved challenging and interpretation of data nuanced, especially with
the missed concussions. Instrumented mouthguards offer great potential to collect on-field kinematic data
for women and unhelmeted athletes, but much consideration needs to be taken when collecting and
analyzing this data. Carefully monitoring each device and its functionality is imperative before and after
each session. Video validation is critical because each device recorded many false-positive events.
On-field head kinematic data were collected for male and female collegiate rugby players using
instrumented mouthguards. More head impacts per session than body impacts were sustained, and men
sustained more impacts per session than the women did. Head impacts had greater PLA values than body
impacts. Women sustained head impacts similar in PLA, lower in ∆RV, and shorter in duration to their
male counterparts. Analyzing and characterizing the axis-specific traces of each impact type provides more
insight into different kinematic signatures of acceleration events. This study suggests that users of in-mouth
sensors should carefully consider the technical specifications of sensors and further highlights that video
verification of acceleration events is required for meaningful dissemination of data.
REFERENCES
1. Committee on Sports-Related Concussions in, Y., Y. Board on Children, Families, M. Institute of and C. National Research. The national academies collection: Reports funded by national institutes of health. Sports-related concussions in youth: Improving the science, changing the culture. National Academies Press (US). Copyright 2014 by the National Academy of Sciences. All rights reserved. 2014.
2. Funk, J. R., S. Rowson, R. W. Daniel and S. M. Duma. Validation of concussion risk curves for collegiate football players derived from hits data. Annals of Biomedical Engineering. 40(1):79-89, 2012.
3. Broglio, S. P., B. Schnebel, J. J. Sosnoff, S. Shin, X. Feng, X. He and J. Zimmerman. The biomechanical properties of concussions in high school football. Medicine & Science in Sports & Exercise. 42(11):2064, 2010.
73
4. Brolinson, P. G., S. Manoogian, D. McNeely, M. Goforth, R. Greenwald and S. Duma. Analysis of linear head accelerations from collegiate football impacts. Current Sports Medicine Reports. 5(1):23-8, 2006.
5. Duma, S. M., S. J. Manoogian, W. R. Bussone, P. G. Brolinson, M. W. Goforth, J. J. Donnenwerth, R. M. Greenwald, J. J. Chu and J. J. Crisco. Analysis of real-time head accelerations in collegiate football players. Clinical Journal of Sport Medicine. 15(1):3-8, 2005.
6. Gysland, S. M., J. P. Mihalik, J. K. Register-Mihalik, S. C. Trulock, E. W. Shields and K. M. Guskiewicz. The relationship between subconcussive impacts and concussion history on clinical measures of neurologic function in collegiate football players. Annals of Biomedical Engineering. 40(1):14-22, 2012.
7. Campbell, K. R., M. J. Warnica, I. C. Levine, J. S. Brooks, A. C. Laing, T. A. Burkhart and J. P. Dickey. Laboratory evaluation of the gforce tracker™, a head impact kinematic measuring device for use in football helmets. Annals of Biomedical Engineering. 44(4):1246-56, 2016.
8. Tiernan, S., D. O’Sullivan and G. Byrne. Repeatability and reliability evaluation of a wireless head-band sensor. Asian Journal of Kinesiology. 20(4):70-5, 2018.
9. Cecchi, N. J., D. C. Monroe, T. J. Oros, S. L. Small and J. W. Hicks. Laboratory evaluation of a wearable head impact sensor for use in water polo and land sports. Proceedings of the Institution of Mechanical Engineers, Part P: Journal of Sports Engineering and Technology. 1754337120901974, 2020.
10. Tiernan, S., G. Byrne and D. O’Sullivan. Evaluation of skin-mounted sensor for head impact measurement. Proceedings of the Institution of Mechanical Engineers, Part H: Journal of Engineering in Medicine. 233(095441191985096, 2019.
11. Press, J. N. and S. Rowson. Quantifying head impact exposure in collegiate women's soccer. Clinical Journal of Sport Medicine. 27(2):104-10, 2017.
12. McCuen, E., D. Svaldi, K. Breedlove, N. Kraz, B. Cummiskey, E. L. Breedlove, J. Traver, K. F. Desmond, R. E. Hannemann, E. Zanath, A. Guerra, L. Leverenz, T. M. Talavage and E. A. Nauman. Collegiate women's soccer players suffer greater cumulative head impacts than their high school counterparts. Journal of Biomechanics. 48(13):3720-3, 2015.
13. Swartz, E. E., S. P. Broglio, S. B. Cook, R. C. Cantu, M. S. Ferrara, K. M. Guskiewicz and J. L. Myers. Early results of a helmetless-tackling intervention to decrease head impacts in football players. Journal of Athletic Training. 50(12):1219-22, 2015.
14. T. Knox, "Validation of earplug accelerometers as a means of measuring head motion," SAE Technical Paper 0148-7191, 2004.
15. Bartsch PhD, A., S. Samorezov, E. Benzel, C. Clinic, V. Miele and D. Brett. Validation of an "intelligent mouthguard" single event head impact dosimeter. 2014.
16. Miller, L. E., C. Kuo, L. C. Wu, J. E. Urban, D. B. Camarillo and J. D. Stitzel. Validation of a custom instrumented retainer form factor for measuring linear and angular head impact kinematics. Journal of Biomechanical Engineering. 140(5):2018.
17. Tyson, A. M., S. M. Duma and S. Rowson. Laboratory evaluation of low-cost wearable sensors for measuring head impacts in sports. 34(4):320, 2018.
18. King, D., P. Hume, C. Gissane and T. Clark. Head impacts in a junior rugby league team measured with a wireless head impact sensor: An exploratory analysis. 19(1):13, 2017.
19. Fuller, C. W., A. Taylor and M. Raftery. Epidemiology of concussion in men's elite rugby-7s (sevens world series) and rugby-15s (rugby world cup, junior world championship and rugby trophy, pacific nations cup and english premiership). British Journal of Sports Medicine. 49(7):478-83, 2015.
20. Lopez, V., G. J. Galano, C. M. Black, A. T. Gupta, D. E. James, K. M. Kelleher and A. A. Allen. Profile of an american amateur rugby union sevens series. The American Journal of Sports Medicine. 40(1):179-84, 2012.
21. Fuller, C. W., A. Taylor and M. Raftery. Epidemiology of concussion in men's elite rugby-7s (sevens world series) and rugby-15s (rugby world cup, junior world championship and rugby
74
trophy, pacific nations cup and english premiership). British Journal of Sports Medicine. 49(7):478, 2015.
22. Suzuki, K., S. Nagai, R. Ogaki, K. Iwai, T. Furukawa, S. Miyakawa and M. Takemura. Video analysis of tackling situations leading to concussion in collegiate rugby union. The Journal of Physical Fitness and Sports Medicine. 8(2):79-88, 2019.
23. King, D., P. A. Hume, M. Brughelli and C. Gissane. Instrumented mouthguard acceleration analyses for head impacts in amateur rugby union players over a season of matches. The American Journal of Sports Medicine. 43(3):614-24, 2015.
24. Rich, A. M., T. M. Filben, L. E. Miller, B. T. Tomblin, A. R. Van Gorkom, M. A. Hurst, R. T. Barnard, D. S. Kohn, J. E. Urban and J. D. Stitzel. Development, validation and pilot field deployment of a custom mouthpiece for head impact measurement. Annals of Biomedical Engineering. 47(10):2109-21, 2019.
25. Ng, T. P., W. R. Bussone and S. M. Duma. The effect of gender and body size on linear accelerations of the head observed during daily activities. Biomedical Sciences Instrumentation. 42(25-30, 2006.
26. Rowson, S., G. Brolinson, M. Goforth, D. Dietter and S. M. Duma. Linear and angular head acceleration measurements in collegiate football. Journal of Biomechanical Engineering. 131(6):061016, 2009.
27. McIntosh, A. S., D. A. Patton, B. Fréchède, P.-A. Pierré, E. Ferry and T. Barthels. The biomechanics of concussion in unhelmeted football players in australia: A case–control study. BMJ Open. 4(5):e005078, 2014.
28. Young, K. and P. White. Sport, physical danger, and injury: The experiences of elite women athletes. Journal of Sport & Social Issues. 19(1):45-61, 1995.
29. Rowson, S., S. M. Duma, J. G. Beckwith, J. J. Chu, R. M. Greenwald, J. J. Crisco, P. G. Brolinson, A. C. Duhaime, T. W. McAllister and A. C. Maerlender. Rotational head kinematics in football impacts: An injury risk function for concussion. Annals of Biomedical Engineering. 40(1):1-13, 2012.
30. Rowson, S., M. L. Bland, E. T. Campolettano, J. N. Press, B. Rowson, J. A. Smith, D. W. Sproule, A. M. Tyson and S. M. Duma. Biomechanical perspectives on concussion in sport. Sports Medicine and Arthroscopy Review. 24(3):100-7, 2016.
31. Ommaya, A. and A. Hirsch. Tolerances for cerebral concussion from head impact and whiplash in primates. Journal of Biomechanics. 4(1):13-21, 1971.
32. Ommaya, A. K. Biomechanics of head injuries: Experimental aspects. Biomechanics of Trauma. Appleton-Century-Crofts. 1985.
33. Hynes, L. M. and J. P. Dickey. Is there a relationship between whiplash-associated disorders and concussion in hockey? A preliminary study. Brain Injury. 20(2):179-88, 2006.
34. Naunheim, R. S., P. V. Bayly, J. Standeven, J. S. Neubauer, L. M. Lewis and G. M. Genin. Linear and angular head accelerations during heading of a soccer ball. Medicine & Science in Sports & Exercise. 35(8):1406-12, 2003.
75
CHAPTER 5: CONCUSSION RELATED SYMPTOM PRESENTATION IN
MEN’S AND WOMEN’S RUGBY
ABSTRACT
Concussive injuries are prevalent in many sports, but risk is higher in full-contact, team sports such as
rugby. Between 13% and 17% of rugby players sustain a concussion each season. The style of play and
lack of effective protective equipment put athletes at a higher risk for concussive brain injuries that can
result in neurological impairments. Diagnosis of concussion includes assessment of athlete reported
symptoms, but the rates of underreporting remain high due to players’ attempt to shorten their return-to-
play time. The objective of this study was to investigate in-season presentation of symptoms characteristic
of concussion and their relationship to head impacts sustained on the field. A matched cohort of male and
female rugby players were studied over a six-week period in the middle of a season. Head impacts from
games and practices were tracked through video identification and a Graded Symptom Checklist was
administered weekly to each athlete. The survey included 27 symptoms that were graded on a scale of 0-6,
with 6 being the most severe. The aggregate score for each week is the Symptom Severity Score (SSS). On
average, the men and women reported 1.8 symptoms per week, with a total SSS of 2.6. Approximately 25%
of athletes reported an SSS greater than or equal to 10 (23.1% of men and 26.3% of women). Although SSS
were elevated, they are much lower than those typically associated with concussions. Headaches were the
most common symptom reported by the women, while fatigue was the most commonly reported by the
men. More than 63% of subjects that reported elevated symptom scores experienced at least one head
impact in the week leading up to the symptom survey. This study demonstrated that symptoms associated
with concussion could be observed after head impact in the absence of diagnosed concussion in-season.
Keywords: Head Impact, Biomechanics, Underreporting, Subconcussive
INTRODUCTION
Concussions are brain injuries that are induced by biomechanical forces resulting from impact to the head.1
They affect the brain through a complex pathophysiological process and characteristically result in the onset
of acute neurological impairments.1 Sports-related concussions can be diagnosed with an assessment of
athlete-reported symptoms, physical signs, cognitive or neurobehavioral impairment, or sleep
disturbances.1 However, detection and diagnosis are complicated by a player’s tendency to underreport or
hide symptoms in order to shorten return-to-play time.2 This is a growing concern, as the consequences for
subsequent impacts while still sustaining symptoms from a previous concussion can be catastrophic.3
Underreporting has also been attributed to players’ lack of knowledge of potential consequences of head
76
injuries and their inability to recognize signs and symptoms of concussions.4 Some sports-related
concussions present symptoms immediately and can be attributed to a single impact. Others, however, result
in a delayed symptom presentation and thus make identifying a single impact more challenging.5-7 It is not
yet known how cumulative head impacts affect the pathophysiology of the brain or the clinical
manifestation of injury, but a player’s concussion history has been shown to be related to a slower
neurological recovery.8
Concussion is a concern in many sports, but risk is higher in full-contact, team sports.9 Rugby is the most
popular full-contact, team sport in the world, and has a correspondingly high concussion rate.9 Although
style of play varies, it has been reported that between 13% and 17% of rugby players sustain a concussion
each season10 This is due to the physicality of the sport, usually played without protective equipment.11
Some athletes choose to wear mouthguards and soft-shell headgear, but neither have been proven to reduce
the risk of concussion.12 Effective protective equipment would reduce the linear and rotational accelerations
that the head experiences during impact, thus reducing concussion risk.13,14 The objective of this study was
to monitor in-season presentation of concussion symptoms in the absence of diagnosed concussion and
relate it to head impacts experienced on-field in collegiate rugby players.
METHODS
The study was approved by and conducted according to the ethical guidelines of the Virginia Tech
Institutional Review Board (IRB). During the fall of 2018, athletes were recruited from the Virginia Tech
club women’s and men’s rugby teams. Written informed consent was obtained from each participant after
explaining the purpose, associated benefits, and risks of the study. All participants were identified with a
unique study ID to maintain confidentiality of study measures. The athletes were studied over the course of
six weeks, in the middle of their fall season. Video was recorded for each game and practice for the purpose
of visual identification of head impacts. A head impact was recorded if a player’s head impacted another
player, the ground, or another object on the field. Two research personnel identified each head impact in
the videos, and their reports were compared and finalized to quantify head impact frequency.
Each week, subjects were emailed a survey that included a Graded Symptom Checklist (GSC), which
included 27 symptoms that were graded on a scale of 0-6, with 0 being no presentation of that symptom,
and 6 being the most severe presentation (Table 5.1).15 The total symptom frequency score (maximum of
27) and the aggregate score, computed as the Symptom Severity Score (SSS) (maximum of 162), were
quantified for each week. Likert-style symptom score checklists have been validated as a simple and
effective method of self-reported symptom monitoring, and have been shown to differentiate between
concussed and non-concussed athletes with a sensitivity of 64% to 89% and specificity of 91%-100%.16-20

77
Only athletes that completed all six weeks of surveys were included in the analysis. This resulted in a final
study cohort of 19 female and 26 male athletes.
Table 5.1. List of 27 concussion symptoms in the Graded Symptom Checklist that subjects grade on a scale of 0 (None) to 6 (Most Severe). Total scores are determined for the total symptom presentation (maximum of 27) and total symptom severity score (maximum of 162).
Blurred Vision Unusually Emotional Poor Concentration Dizziness Irritability Ringing in the Ears Drowsiness Loss of Consciousness Sadness Sleeping More than Usual Loss of Orientation Seeing Stars Easily Distracted Memory Problems Sensitivity to Light Fatigue Nauseous Sensitivity to Noise Feeling "In a Fog" Nervousness Sleep Disturbances Feeling "Slowed Down" Personality Changes Vacant Stares/Glassy Eyes Headache Poor Balance/ Coordination Vomiting
An athlete’s SSS for each week was compared to the number of head impacts they sustained in the week
leading up to the survey. For athletes that reported an elevated SSS, greater than or equal to ten, their
distribution of symptoms and severities and head impact histories were characterized.
RESULTS
Over the six-week span, there were 496 video-identified head impacts. The men’s team accounted for 356
of those, while the women’s team sustained the other 140. The women’s team sustained 132 impacts from
three games in the six-week period with head impacts occurring at a rate of 3.43 ± 2.5 impacts/player/game.
Their games were played in weeks four, eight, and nine. During practices, the impact rate was 1.0 ± 0
impacts/player/practice. The other eight were sustained during the two practices that head impacts were
observed. The men’s team played in six games in the six weeks, and sustained 339 head impacts at a rate
of 3.32 ± 1.59 impacts/player/game. The impact rate for practices was 1.45 ± 0.69 impacts/player/practice.
The symptom checklist data was summarized each week for each athlete. Overall, the average number of
symptoms reported per player each week was 1.8, which was associated with an average SSS of 2.6. The
women reported 1.9 symptoms on average, with an SSS of 2.9. The men reported 1.8 symptoms on average,
with an SSS of 2.3. There was no pattern of SSS over the season, although SSS was slightly higher in the
weeks that the women’s team had games (4, 8, and 9) (Figure 5.1). The most commonly reported symptom
for the women was headache, accounting for 12.0% of the symptoms reported. The most commonly
reported symptom for the men was fatigue, accounting for 13.6% of the symptoms reported. There was no
reported loss of consciousness, loss of orientation, or vomiting.
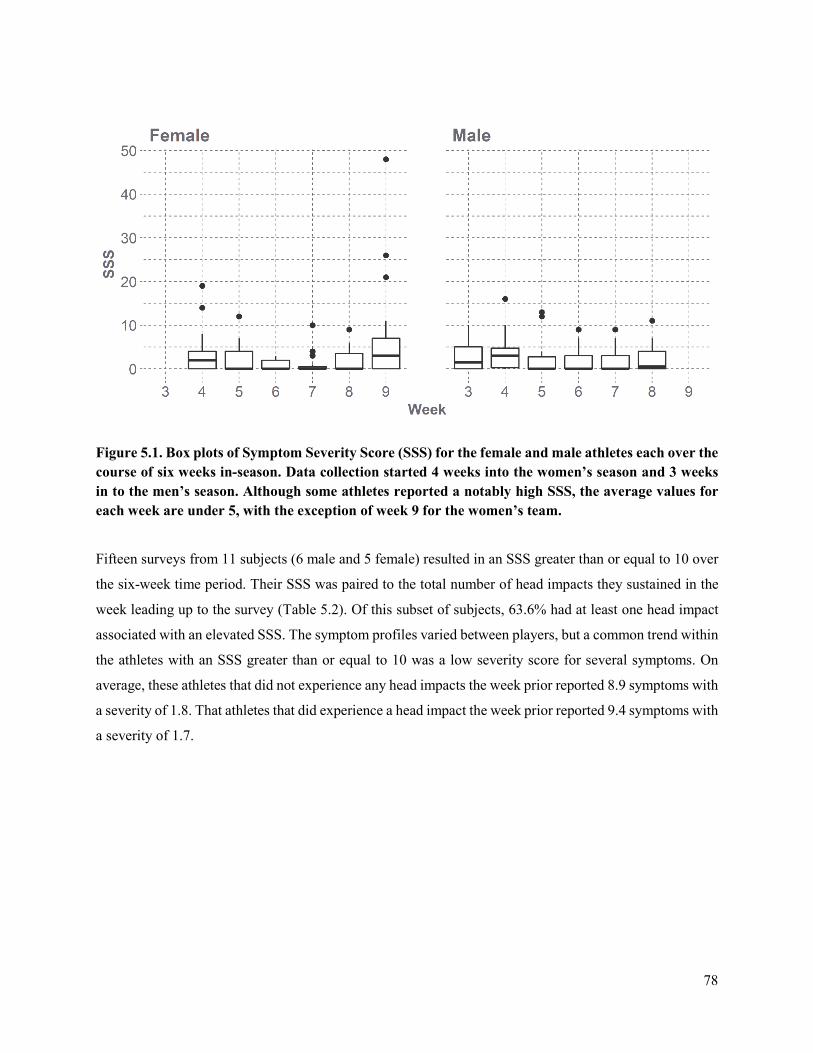
78
Figure 5.1. Box plots of Symptom Severity Score (SSS) for the female and male athletes each over the course of six weeks in-season. Data collection started 4 weeks into the women’s season and 3 weeks in to the men’s season. Although some athletes reported a notably high SSS, the average values for each week are under 5, with the exception of week 9 for the women’s team.
Fifteen surveys from 11 subjects (6 male and 5 female) resulted in an SSS greater than or equal to 10 over
the six-week time period. Their SSS was paired to the total number of head impacts they sustained in the
week leading up to the survey (Table 5.2). Of this subset of subjects, 63.6% had at least one head impact
associated with an elevated SSS. The symptom profiles varied between players, but a common trend within
the athletes with an SSS greater than or equal to 10 was a low severity score for several symptoms. On
average, these athletes that did not experience any head impacts the week prior reported 8.9 symptoms with
a severity of 1.8. That athletes that did experience a head impact the week prior reported 9.4 symptoms with
a severity of 1.7.
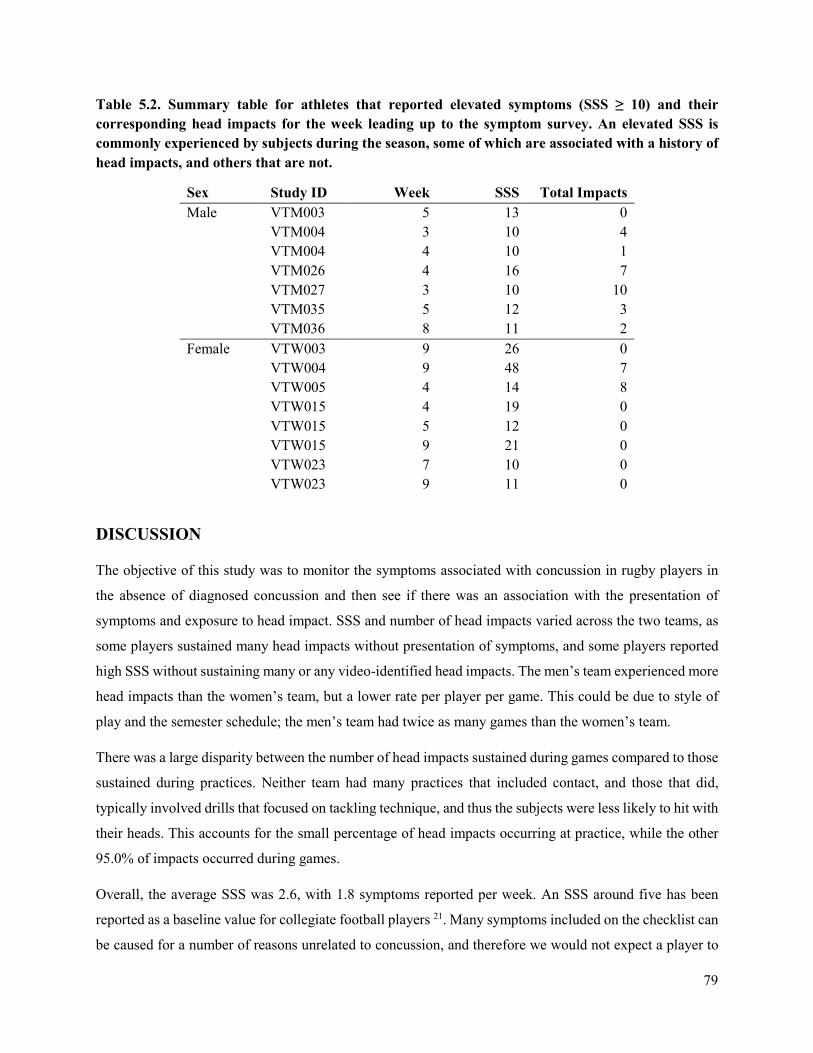
79
Table 5.2. Summary table for athletes that reported elevated symptoms (SSS ≥ 10) and their corresponding head impacts for the week leading up to the symptom survey. An elevated SSS is commonly experienced by subjects during the season, some of which are associated with a history of head impacts, and others that are not.
Sex Study ID Week SSS Total Impacts Male VTM003 5 13 0 VTM004 3 10 4 VTM004 4 10 1 VTM026 4 16 7 VTM027 3 10 10 VTM035 5 12 3 VTM036 8 11 2 Female VTW003 9 26 0 VTW004 9 48 7 VTW005 4 14 8 VTW015 4 19 0 VTW015 5 12 0 VTW015 9 21 0 VTW023 7 10 0 VTW023 9 11 0
DISCUSSION
The objective of this study was to monitor the symptoms associated with concussion in rugby players in
the absence of diagnosed concussion and then see if there was an association with the presentation of
symptoms and exposure to head impact. SSS and number of head impacts varied across the two teams, as
some players sustained many head impacts without presentation of symptoms, and some players reported
high SSS without sustaining many or any video-identified head impacts. The men’s team experienced more
head impacts than the women’s team, but a lower rate per player per game. This could be due to style of
play and the semester schedule; the men’s team had twice as many games than the women’s team.
There was a large disparity between the number of head impacts sustained during games compared to those
sustained during practices. Neither team had many practices that included contact, and those that did,
typically involved drills that focused on tackling technique, and thus the subjects were less likely to hit with
their heads. This accounts for the small percentage of head impacts occurring at practice, while the other
95.0% of impacts occurred during games.
Overall, the average SSS was 2.6, with 1.8 symptoms reported per week. An SSS around five has been
reported as a baseline value for collegiate football players 21. Many symptoms included on the checklist can
be caused for a number of reasons unrelated to concussion, and therefore we would not expect a player to
80
have an SSS value of zero 16. Approximately 25% of athletes reported an SSS greater than or equal to 10
(23.1% of men and 26.3% of women). Although SSS scores were elevated, they are much lower than those
typically associated with concussions. An SSS of 21 has been shown to differentiate a concussed athlete
from a non-concussed athlete 18,19. Of the 11 athletes who reported elevated an SSS, 63.6% had at least one
head impact in the week leading up to the symptom survey. They report a similar number and severity of
symptoms than those that did not have head impacts associated with an elevated SSS. Elevated SSS with a
lack of head impacts could be attributed to the symptoms reported by the athletes; factors like hydration,
amount of sleep, and stress could be the cause. In one instance, a subject self-reported a concussion from
an impact in a game but did not report elevated symptoms until the following week. Delayed onset of
symptoms and neuropsychological deficits have been shown in high school and collegiate athletes 22.
The results of this study could be affected by the symptoms surveys and the tendency of players to
underreport their symptoms. Due to the fact that the study did not start before the season for either team,
there is not a true baseline symptom score for each individual for comparison of later time points. Although
we chose to email a survey link personalized email to each athlete to maintain confidentiality and attempt
to decrease underreporting, there is still the chance athletes fail to report an accurate frequency of severity
of symptom. Another limitation is the use of researchers to video identify head impacts. In some instances,
the video angle, obstructions in the field of view, and resolution of the camera made identifying head
impacts challenging. However, the use of the two independent video observers aimed to minimize human
error.
The purpose of this study was to monitor in-season presentation of concussion symptoms in the absence of
diagnosed concussion and relate it to head impacts experienced on-field in collegiate rugby players. These
data demonstrate that the symptoms of concussion are commonly experienced by rugby players during a
season, some of which are associated with a history of head impact, and others are not. Including self-
reported symptom checklists in-season provides a simple and effective monitoring system will help reduce
underreported injuries.
REFERENCES
1. McCrory, P., W. H. Meeuwisse, M. Aubry, B. Cantu, J. Dvorak, R. J. Echemendia, L. Engebretsen, K. Johnston, J. S. Kutcher, M. Raftery, A. Sills, B. W. Benson, G. A. Davis, R. G. Ellenbogen, K. Guskiewicz, S. A. Herring, G. L. Iverson, B. D. Jordan, J. Kissick, M. McCrea, A. S. McIntosh, D. Maddocks, M. Makdissi, L. Purcell, M. Putukian, K. Schneider, C. H. Tator and M. Turner. Consensus statement on concussion in sport: The 4th international conference on concussion in sport held in Zurich, November 2012. British Journal of Sports Medicine. 47(5):250-8, 2013.
2. McCrea, M., T. Hammeke, G. Olsen, P. Leo and K. Guskiewicz. Unreported concussion in high school football players: Implications for prevention. Clinical Journal of Sport Medicine. 14(1):13-7, 2004.
81
3. Kelly, J. P., J. S. Nichols, C. M. Filley, K. O. Lillehei, D. Rubinstein and B. K. Kleinschmidt-DeMasters. Concussion in sports. Guidelines for the prevention of catastrophic outcome. Journal of the American Medical Association. 266(20):2867-9, 1991.
4. Delaney, J. S., V. J. Lacroix, S. Leclerc and K. M. Johnston. Concussions among university football and soccer players. Clinical Journal of Sport Medicine. 12(6):331-8, 2002.
5. Broglio, S. P., J. T. Eckner, T. Surma and J. S. Kutcher. Post-concussion cognitive declines and symptomatology are not related to concussion biomechanics in high school football players. Journal of Neurotrauma. 28(10):2061-8, 2011.
6. Duhaime, A.-C., J. G. Beckwith, A. C. Maerlender, T. W. McAllister, J. J. Crisco, S. M. Duma, P. G. Brolinson, S. Rowson, L. A. Flashman, J. J. Chu and R. M. Greenwald. Spectrum of acute clinical characteristics of diagnosed concussions in college athletes wearing instrumented helmets: Clinical article. Journal of Neurosurgery. 117(6):1092-9, 2012.
7. Beckwith, J. G., R. M. Greenwald, J. J. Chu, J. J. Crisco, S. Rowson, S. M. Duma, S. P. Broglio, T. W. McAllister, K. M. Guskiewicz, J. P. Mihalik, S. Anderson, B. Schnebel, P. G. Brolinson and M. W. Collins. Timing of concussion diagnosis is related to head impact exposure prior to injury. Medicine & Science in Sports & Exercise. 45(4):747-54, 2013.
8. Guskiewicz, K. M., M. McCrea, S. W. Marshall, R. C. Cantu, C. Randolph, W. Barr, J. A. Onate and J. P. Kelly. Cumulative effects associated with recurrent concussion in collegiate football players: The NCAA concussion study. Journal of the American Medical Association. 290(19):2549-55, 2003.
9. W Fuller, C., A. Taylor and M. Raftery. Epidemiology of concussion in men's elite rugby-7s (sevens world series) and rugby-15s (rugby world cup, junior world championship and rugby trophy, pacific nations cup and english premiership). 2014.
10. Lopez, V., G. J. Galano, C. M. Black, A. T. Gupta, D. E. James, K. M. Kelleher and A. A. Allen. Profile of an american amateur rugby union sevens series. The American Journal of Sports Medicine. 40(1):179-84, 2012.
11. Marshall, S. W. and R. J. Spencer. Concussion in rugby: The hidden epidemic. Journal of Athletic Training. 36(3):334-8, 2001.
12. Marshall, S. W., D. P. Loomis, A. E. Waller, D. J. Chalmers, Y. N. Bird, K. L. Quarrie and M. Feehan. Evaluation of protective equipment for prevention of injuries in rugby union. International Journal of Epidemiology. 34(1):113-8, 2005.
13. Rowson, S., R. W. Daniel and S. M. Duma. Biomechanical performance of leather and modern football helmets. 119(3):805, 2013.
14. Rowson, S., S. M. Duma, R. M. Greenwald, J. G. Beckwith, J. J. Chu, K. M. Guskiewicz, J. P. Mihalik, J. J. Crisco, B. J. Wilcox, T. W. McAllister, A. C. Maerlender, S. P. Broglio, B. Schnebel, S. Anderson and P. G. Brolinson. Can helmet design reduce the risk of concussion in football? Journal of Neurosurgery. 120(4):919-22, 2014.
15. Guskiewicz, K. M., S. L. Bruce, R. C. Cantu, M. S. Ferrara, J. P. Kelly, M. McCrea, M. Putukian and T. C. Valovich McLeod. National athletic trainers' association position statement: Management of sport-related concussion. Journal of Athletic Training. 39(3):280-97, 2004.
16. Lau, B., M. R. Lovell, M. W. Collins and J. Pardini. Neurocognitive and symptom predictors of recovery in high school athletes. Clinical Journal of Sport Medicine. 19(3):216-21, 2009.
17. Piland, S. G., R. W. Motl, M. S. Ferrara and C. L. Peterson. Evidence for the factorial and construct validity of a self-report concussion symptoms scale. Journal of Athletic Training. 38(2):104-12, 2003.
18. McCrea, M., K. M. Guskiewicz, S. W. Marshall and et al. Acute effects and recovery time following concussion in collegiate football players: The NCAA concussion study. Journal of the American Medical Association. 290(19):2556-63, 2003.
19. McCrea, M., W. B. Barr, K. Guskiewicz, C. Randolph, S. W. Marshall, R. Cantu, J. A. Onate and J. P. Kelly. Standard regression-based methods for measuring recovery after sport-related concussion. Journal of the International Neuropsychological Society. 11(1):58-69, 2005.
82
20. Lovell, M. R. and M. W. Collins. Neuropsychological assessment of the college football player. Journal of Head Trauma Rehabilitation. 13(2):9-26, 1998.
21. Rowson, S., S. M. Duma, B. D. Stemper, A. Shah, J. P. Mihalik, J. Harezlak, L. D. Riggen, C. C. Giza, J. P. DiFiori, A. Brooks, K. Guskiewicz, D. Campbell, G. McGinty, S. J. Svoboda, K. L. Cameron, S. P. Broglio, T. W. McAllister and M. McCrea. Correlation of concussion symptom profile with head impact biomechanics: A case for individual-specific injury tolerance. Journal of Neurotrauma. 35(4):681-90, 2018.
22. Sahler, C. S. and B. D. Greenwald. Traumatic brain injury in sports: A review. Rehabilitation Research and Practice. 2012(659652, 2012.
83
CHAPTER 6: IN-SEASON CONCUSSION SYMPTOM REPORTING IN
MALE AND FEMALE COLLEGIATE RUGBY
ABSTRACT
Repetitive subconcussive head impacts put athletes at risk for neuropsychological changes and cognitive
impairment. The clinical symptoms associated with these impacts may allude to potential undiagnosed
concussions. Despite differences in symptom presentation and outcome of concussion, no return-to-play
protocol takes sex into account. The purpose of this study was to monitor a cohort of contact-sport athletes
and compare the frequency and severity of in-season concussion-like symptom reporting between sexes.
Graded symptom checklists from 144 female and 107 male athlete-seasons were administered weekly to
quantify the effect of subconcussive impacts on frequency and severity of in-season symptom reporting.
In-season, mean SSS (p = 0.026, mean difference of 1.8), mean number of symptoms (p = 0.044, mean
difference of 0.9), max SSS (p < 0.001, mean difference of 19.2), and max number of symptoms (p < 0.001,
mean difference of 6.8) were higher in the females. The females’ survey results showed differences between
elevated and concussed SSS (p < 0.005, mean difference of 28.1) and number of symptoms reported (p =
0.001, mean difference of 6.6). The males did not have a difference in SSS (p = 0.97, mean difference of
1.12) nor in number of symptoms (p = 0.35, mean difference of 1.96). Rugby players report concussion-
like symptoms in the absence of a diagnosed concussion in-season. Female athletes reported elevated
symptom frequencies with greater severities than the males, but both sexes reported considerable levels
throughout the season. These findings suggest that the presence of symptoms in-season could indicate
subconcussive tissue changes or undiagnosed injuries.
Keywords: Concussion, Subconcussion, Symptoms, Sex-specific
INTRODUCTION
Although most people will fully recover from a concussion, their signs and symptoms may last minutes to
months after their injury.1 Long-term concussion complications can affect memory, cognition, learning,
language, and emotions.1 Research suggests that subconcussive impacts can be similarly harmful. These
impacts below the diagnostic threshold for a concussion have been of interest due to their potential
deleterious effect on neurological function.2,3 Results are mixed, with some studies identifying
neuropsychological changes,4-7 while others do not.7,8 Repetitive impact exposure has resulted in acute
cognitive changes in some studies4-6,9-13 but no cognitive impairment in others.14-16 Functional neuroimaging
has been used to understand brain structure changes when subjected to repetitive subconcussive impacts
with more consistent results. Researchers have identified lower fractional anisotropy in a brain region
84
associated with memory,17,18 neuro-metabolic alterations in brain regions associated with cognition19
specifically in female athletes,20 and decreased white matter integrity in the absence of symptom
presentation.21
Concussion diagnosis has taken a multi-pronged approach to include a consideration of clinical history,
acute sideline evaluation, a symptom assessment, detailed neurologic evalulation, and neurpsychological
testing.22 Diagnosis is complicated by athletes' tendency to hide or underreport symptoms to decrease
return-to-play time.23 Some studies have indicated that 30-50% of concussions go unreported.23,24 Athletes
who do not immediately report concussion symptoms and continue to participate in activities may be at
higher risk for longer recoveries and sustain post-concussion symptoms longer.25
Clinical symptoms associated with concussion begin at some level of repetitive subconcussive head impact
exposure, and likely those changes will worsen with increased impact exposure load. Without routine
monitoring in-season, the clinical effect of these repetitive head impacts and their similarity to diagnosed
concussions are unknown. A symptom inventory is subjective but helps clinicians understand the athlete’s
self-assessment of the presence and severity of symptoms. They are designed to assess changes over short
time periods, making them useful tools for repeated tests.22 In combination with neuropsychological
assessments, symptom resolution is generally the guideline for return-to-play for the athlete. Regular
monitoring of in-season symptoms would help researchers understand the presentation of subconcussive
impacts that are below typical diagnostic thresholds.
This study's objective was to monitor and compare in-season concussion symptom reporting between sexes.
We studied a cohort of collegiate rugby players because the females and males play by the same rules and
routinely experience head impacts.
We hypothesize that rugby athletes routinely experience mild concussion-like symptoms throughout a
season and that symptom presentation is sex-specific. Variation in presentation and outcome of concussion
by sex have been previously established.26-31 Neuroprotectants, such as estrogen and progesterone in
females, may contribute to the changes in tolerance between sexes.30,32,33 Further, some studies have shown
sex-specific differences in axon structure can lead to more severe pathophysiology in dynamic stretch-
injury in females.34 Beyond physiologic explanations, systematic differences in symptom reporting have
been suggested, as females report more concussions and greater severities than males.26,35,36 Previous studies
have noted females report higher symptoms at baseline,22,37 as well as post-injury.28,37 Females have also
exhibited a greater cognitive change post-concussion and more variation in cognitive assessment
performance than their male counterparts.12 Despite these differences, no return-to-play protocol takes sex
into account.28
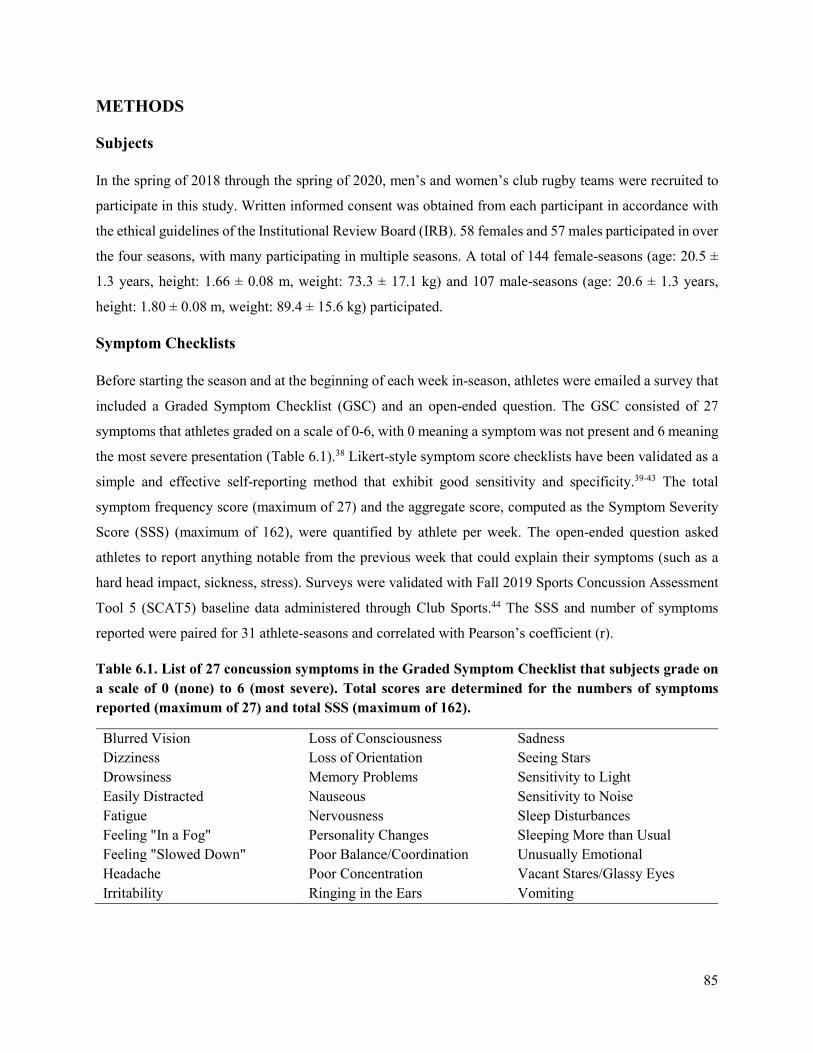
85
METHODS
Subjects
In the spring of 2018 through the spring of 2020, men’s and women’s club rugby teams were recruited to
participate in this study. Written informed consent was obtained from each participant in accordance with
the ethical guidelines of the Institutional Review Board (IRB). 58 females and 57 males participated in over
the four seasons, with many participating in multiple seasons. A total of 144 female-seasons (age: 20.5 ±
1.3 years, height: 1.66 ± 0.08 m, weight: 73.3 ± 17.1 kg) and 107 male-seasons (age: 20.6 ± 1.3 years,
height: 1.80 ± 0.08 m, weight: 89.4 ± 15.6 kg) participated.
Symptom Checklists
Before starting the season and at the beginning of each week in-season, athletes were emailed a survey that
included a Graded Symptom Checklist (GSC) and an open-ended question. The GSC consisted of 27
symptoms that athletes graded on a scale of 0-6, with 0 meaning a symptom was not present and 6 meaning
the most severe presentation (Table 6.1).38 Likert-style symptom score checklists have been validated as a
simple and effective self-reporting method that exhibit good sensitivity and specificity.39-43 The total
symptom frequency score (maximum of 27) and the aggregate score, computed as the Symptom Severity
Score (SSS) (maximum of 162), were quantified by athlete per week. The open-ended question asked
athletes to report anything notable from the previous week that could explain their symptoms (such as a
hard head impact, sickness, stress). Surveys were validated with Fall 2019 Sports Concussion Assessment
Tool 5 (SCAT5) baseline data administered through Club Sports.44 The SSS and number of symptoms
reported were paired for 31 athlete-seasons and correlated with Pearson’s coefficient (r).
Table 6.1. List of 27 concussion symptoms in the Graded Symptom Checklist that subjects grade on a scale of 0 (none) to 6 (most severe). Total scores are determined for the numbers of symptoms reported (maximum of 27) and total SSS (maximum of 162).
Blurred Vision Loss of Consciousness Sadness Dizziness Loss of Orientation Seeing Stars Drowsiness Memory Problems Sensitivity to Light Easily Distracted Nauseous Sensitivity to Noise Fatigue Nervousness Sleep Disturbances Feeling "In a Fog" Personality Changes Sleeping More than Usual Feeling "Slowed Down" Poor Balance/Coordination Unusually Emotional Headache Poor Concentration Vacant Stares/Glassy Eyes Irritability Ringing in the Ears Vomiting
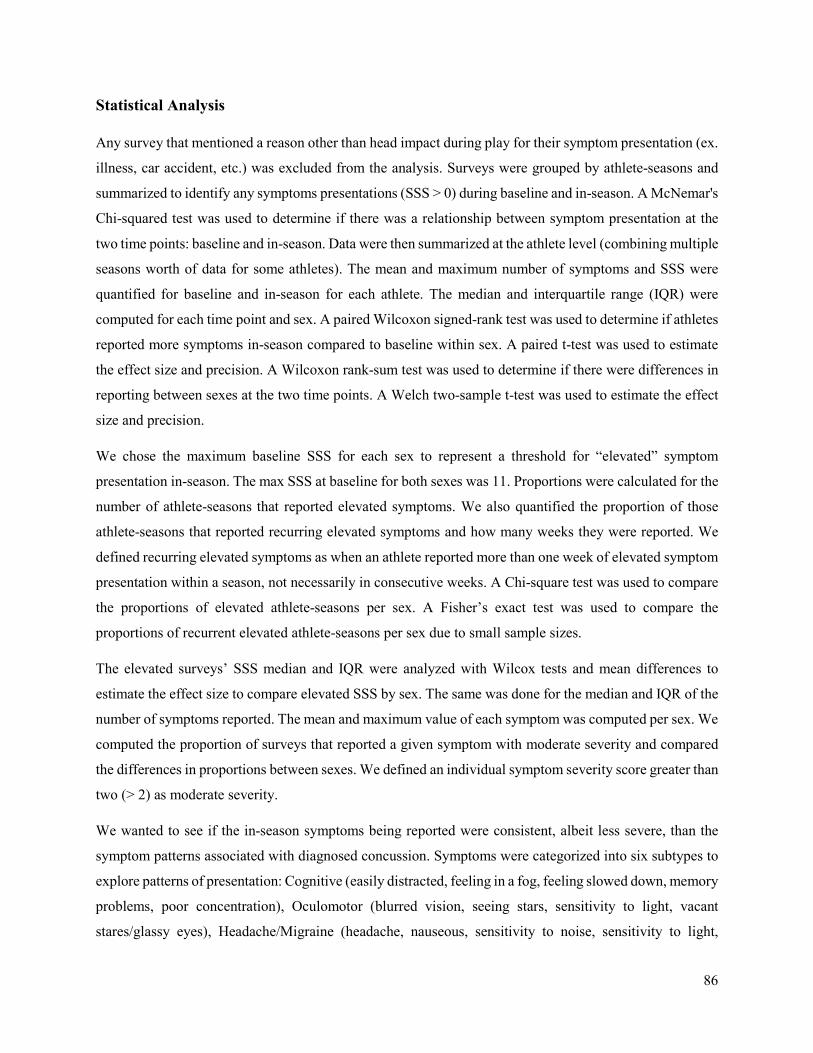
86
Statistical Analysis
Any survey that mentioned a reason other than head impact during play for their symptom presentation (ex.
illness, car accident, etc.) was excluded from the analysis. Surveys were grouped by athlete-seasons and
summarized to identify any symptoms presentations (SSS > 0) during baseline and in-season. A McNemar's
Chi-squared test was used to determine if there was a relationship between symptom presentation at the
two time points: baseline and in-season. Data were then summarized at the athlete level (combining multiple
seasons worth of data for some athletes). The mean and maximum number of symptoms and SSS were
quantified for baseline and in-season for each athlete. The median and interquartile range (IQR) were
computed for each time point and sex. A paired Wilcoxon signed-rank test was used to determine if athletes
reported more symptoms in-season compared to baseline within sex. A paired t-test was used to estimate
the effect size and precision. A Wilcoxon rank-sum test was used to determine if there were differences in
reporting between sexes at the two time points. A Welch two-sample t-test was used to estimate the effect
size and precision.
We chose the maximum baseline SSS for each sex to represent a threshold for “elevated” symptom
presentation in-season. The max SSS at baseline for both sexes was 11. Proportions were calculated for the
number of athlete-seasons that reported elevated symptoms. We also quantified the proportion of those
athlete-seasons that reported recurring elevated symptoms and how many weeks they were reported. We
defined recurring elevated symptoms as when an athlete reported more than one week of elevated symptom
presentation within a season, not necessarily in consecutive weeks. A Chi-square test was used to compare
the proportions of elevated athlete-seasons per sex. A Fisher’s exact test was used to compare the
proportions of recurrent elevated athlete-seasons per sex due to small sample sizes.
The elevated surveys’ SSS median and IQR were analyzed with Wilcox tests and mean differences to
estimate the effect size to compare elevated SSS by sex. The same was done for the median and IQR of the
number of symptoms reported. The mean and maximum value of each symptom was computed per sex. We
computed the proportion of surveys that reported a given symptom with moderate severity and compared
the differences in proportions between sexes. We defined an individual symptom severity score greater than
two (> 2) as moderate severity.
We wanted to see if the in-season symptoms being reported were consistent, albeit less severe, than the
symptom patterns associated with diagnosed concussion. Symptoms were categorized into six subtypes to
explore patterns of presentation: Cognitive (easily distracted, feeling in a fog, feeling slowed down, memory
problems, poor concentration), Oculomotor (blurred vision, seeing stars, sensitivity to light, vacant
stares/glassy eyes), Headache/Migraine (headache, nauseous, sensitivity to noise, sensitivity to light,
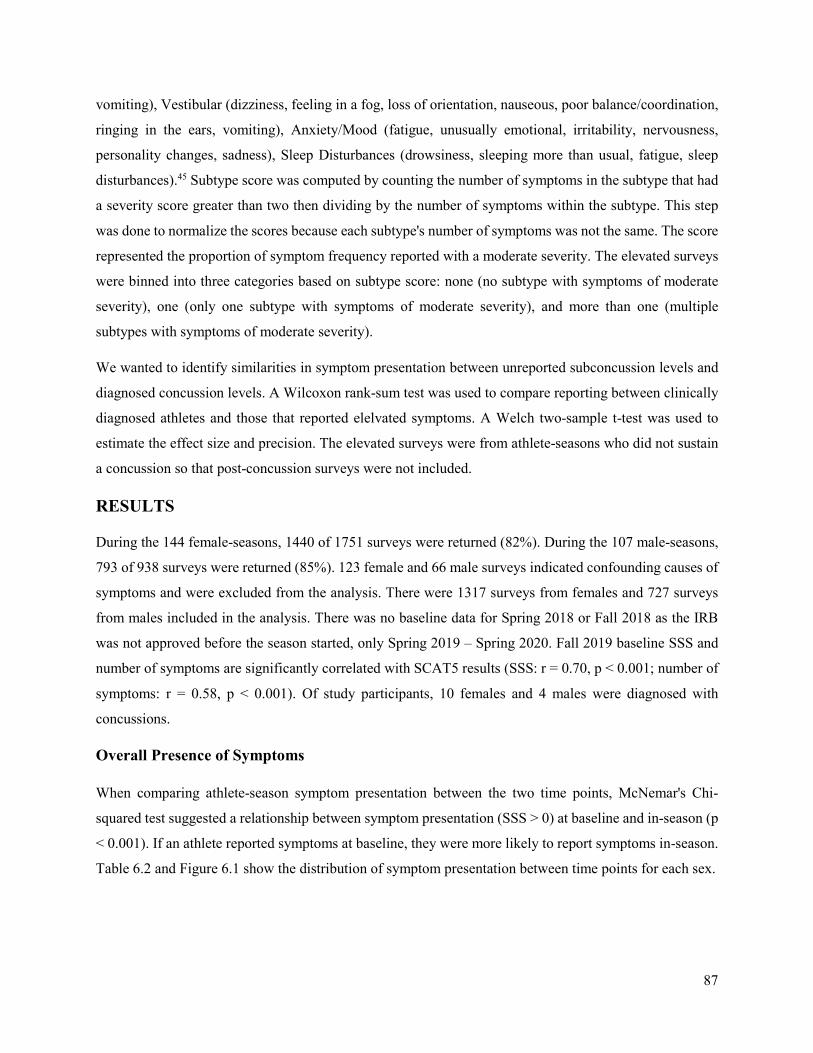
87
vomiting), Vestibular (dizziness, feeling in a fog, loss of orientation, nauseous, poor balance/coordination,
ringing in the ears, vomiting), Anxiety/Mood (fatigue, unusually emotional, irritability, nervousness,
personality changes, sadness), Sleep Disturbances (drowsiness, sleeping more than usual, fatigue, sleep
disturbances).45 Subtype score was computed by counting the number of symptoms in the subtype that had
a severity score greater than two then dividing by the number of symptoms within the subtype. This step
was done to normalize the scores because each subtype's number of symptoms was not the same. The score
represented the proportion of symptom frequency reported with a moderate severity. The elevated surveys
were binned into three categories based on subtype score: none (no subtype with symptoms of moderate
severity), one (only one subtype with symptoms of moderate severity), and more than one (multiple
subtypes with symptoms of moderate severity).
We wanted to identify similarities in symptom presentation between unreported subconcussion levels and
diagnosed concussion levels. A Wilcoxon rank-sum test was used to compare reporting between clinically
diagnosed athletes and those that reported elelvated symptoms. A Welch two-sample t-test was used to
estimate the effect size and precision. The elevated surveys were from athlete-seasons who did not sustain
a concussion so that post-concussion surveys were not included.
RESULTS
During the 144 female-seasons, 1440 of 1751 surveys were returned (82%). During the 107 male-seasons,
793 of 938 surveys were returned (85%). 123 female and 66 male surveys indicated confounding causes of
symptoms and were excluded from the analysis. There were 1317 surveys from females and 727 surveys
from males included in the analysis. There was no baseline data for Spring 2018 or Fall 2018 as the IRB
was not approved before the season started, only Spring 2019 – Spring 2020. Fall 2019 baseline SSS and
number of symptoms are significantly correlated with SCAT5 results (SSS: r = 0.70, p < 0.001; number of
symptoms: r = 0.58, p < 0.001). Of study participants, 10 females and 4 males were diagnosed with
concussions.
Overall Presence of Symptoms
When comparing athlete-season symptom presentation between the two time points, McNemar's Chi-
squared test suggested a relationship between symptom presentation (SSS > 0) at baseline and in-season (p
< 0.001). If an athlete reported symptoms at baseline, they were more likely to report symptoms in-season.
Table 6.2 and Figure 6.1 show the distribution of symptom presentation between time points for each sex.
88
Table 6.2. Summary of symptom presentation reported from paired baseline and in-season time points for male and female athletes. Males reported a higher mean SSS at baseline, but females reported higher SSS and number of symptoms in-season. The median scores of 0s suggest many surveys had reports of low symptom presentation. The mean and max SSS and number of symptoms were calculated for each athlete and then the median and IQR of the groups were summarized.
Sex Time Point
Athlete Count
SSS Median of the Mean [IQR]
SSS Median of the Max
# Symptoms Median
[IQR]
# Symptoms Median of
the Max Females Baseline 36 0 [0.0, 3.2] 0 0 [0.0, 2.0] 0 In-Season 36 3 [0.8, 5.2] 19 1.9 [0.7, 3.7] 12 Males Baseline 35 2 [0.5, 3.5] 3 1 [0.3, 2.0] 2 In-Season 35 1.5 [0.5, 3.2] 7 1.1 [0.4, 2.3] 5
The female athletes reported higher mean SSS (p = 0.001, mean difference of 2.1 [95% CI: 0.9, 3.3]),
number of symptoms (p = 0.003, mean difference of 1.1 [95% CI: 0.3, 1.9]), higher max SSS (p < 0.001,
mean difference of 24.7 [95% CI: 15.4, 33.9]), and higher max number of symptoms (p < 0.001, mean
difference of 9.7 [95% CI: 7.1, 12.3]) in-season compared to their baseline time point. The male athletes
reported similar mean in-season SSS (p = 0.645, mean difference of 0.02 [95% CI: -0.7, 0.7]), number of
symptoms (p = 0.6671, mean difference of 0.041 [95% CI: -0.4, 0.5]), higher max SSS (p < 0.001, mean
difference of 5.2 [95% CI: 3.2, 7.3]), and higher max number of symptoms (p < 0.001, mean difference of
2.7 [95% CI: 1.7, 3.6]) compared to their baseline time point.
At baseline, the mean SSS for females was not higher than for the males (p = 0.151, mean difference of 0.3
[95% CI: -1.5, 0.9]), nor was the mean number of symptoms reported per athlete (p = 0.102, mean difference
of 0.2 [95% CI: -1.1, 0.7]), max SSS (p = 0.204, mean difference of 0.2 [95% CI: -1.7, 1.2]), nor max
number of symptoms reported (p = 0.163, mean difference of 0.3 [95% CI: -1.3, 0.8]). However, in-season,
mean SSS (p = 0.026, mean difference of 1.8 [95% CI: 0.3, 3.2]), mean number of symptoms reported (p =
0.044, mean difference of 0.9 [95% CI: 0.02, 1.86]), max SSS (p < 0.001, mean difference of 19.2 [95%
CI: 9.7, 28.7]), and max number of symptoms reported (p < 0.001, mean difference of 6.8 [95% CI: 4.0,
9.5]) were higher in the females.
89
Figure 6.1. Boxplots and points for mean and max SSS and number of symptoms for males and females for paired baseline and in-season surveys. The median of the mean and max SSS and number of symptoms were higher in-season than those at baseline for the females, but were much more similar in magnitude for the males. These data are summarized by athlete per time point.
Elevated Symptom Presence
59 female athletes (41.5%) and 15 male athletes (14.7%) reported elevated symptoms (SSS >= 11) at some
point during the season. The proportion of females that reported elevated symptoms was higher than that
of males (Chi-square test for proportions, p < 0.001, 95% CI: 0.15, 0.38). 30 female athletes (50.8%) and 4
male athletes (26.7%) reported recurrent elevated symptoms. Fisher’s exact test was used to determine if
90
the reporting of recurrent elevated symptoms was related to sex (p = 0.146, 95% CI: 0.074, 1.38). For those
that reported recurrent symptoms, we compared the number of times an athlete reported elevated symptoms
between sexes. On average, 3.1 ± 1.8 surveys completed by females reported elevated symptoms and 3.3 ±
1.9 surveys completed by males reported elevated symptoms. This corresponded to 29.5% ± 14.3 of those
females’ surveys and 47.8% ± 18.5 of those males’ surveys.
The severity of elevated symptoms differed by sex. Table 6.3 summarizes elevated surveys per sex, and
Figure 6.2 shows that the central tendencies were similar, but deviate at higher end of the IQR. The
difference between the median SSS is 2, compared to the difference at the 75th percentile, where the
difference is 9. SSS showed evidence of a difference between sexes, with a mean difference of 8.9 (95%
CI: 5.0, 12.8, p = 0.044). The number of symptoms reported showed more evidence of difference between
sexes, with a mean difference of 3.6 (95% CI: 2.1, 5.1, p = 0.0012).
Table 6.3. Number of in-season surveys collected in total and those that reported elevated SSS per sex. A higher proportion of female surveys reported elevated symptoms. The females’ surveys also had a higher median SSS and number of symptoms reported.
Figure 6.2. Boxplots with data points for SSS and number of symptoms for elevated surveys. Outliers from the box plots were not pictured so that those data points were not plotted twice. Although the central tendencies do not seem to vary greatly between females and males, the upper end of both SSS and the number of symptoms reported is higher in females, highlighting a difference in distribution.
Sex In-Season Elevated (SSS ≥ 11) SSS Median [IQR] # Symptoms Median [IQR]
Females 1251 121 (9.67%) 17 [13, 26] 11 [9, 15]
Males 674 24 (3.56%) 15 [12.8, 17.3] 9 [6.8, 11]
91
The males were more evenly distributed across the scores while more females tended to report on the higher end, skewing the distribution to the right.
The highest reported mean severity for a symptom for females was headache, followed by fatigue and
drowsiness. The highest mean symptom score for the males was drowsiness, followed by fatigue and feeling
in a fog. The females reported higher symptom severity overall (Figure 6.3). Of the 27 symptoms, females
reported the maximum severity for 17 symptoms and the males only reported maximum severity for one
symptom.
Figure 6.3. Plot of differences in the percentage of elevated surveys that report the given symptom with moderate or greater severity (> 2) between sexes. A higher proportion of females reported all symptoms with a severity greater than two except loss of orientation (-6.7%), ringing in the ears (-0.9%), and sleep disturbances (-0.1%). The other symptoms' mean difference was 8.5%, ranging between 0.8% and 16.5%, except for headache (37.9%).
When grouping the symptoms into subtypes, most surveys (51.2% of females’ surveys and 45.8% of males’
surveys) indicated diffuse presentation of symptom subtypes ‒ identifying the presentation of more than
one subtype – for both males and females. 16.5% of females’ surveys indicated one predominant subtype,
92
and 80.0% of those predominant subtypes were Anxiety/Mood. Cognitive was never reported as the
predominant subtype for either sex. The 49 surveys (32.2% of females’ surveys and 41.7% of males’
surveys) that did not have any subtype with symptoms greater than 2 generally reported low-level severity
for multiple symptoms.
Concussion Symptom Presentation
There were 14 diagnosed concussions in the dataset. The median and max SSS and number of symptoms
for the diagnosed athletes and elevated surveys are summarized in Table 6.4. The females’ survey results
showed differences between elevated and concussed SSS (p < 0.005, mean difference of 28.1 [95% CI: 3.0,
53.2]) and number of symptoms reported (p = 0.001, mean difference of 6.6 [95% CI: 2.2, 10.9]). But the
men did not have a difference in SSS (p = 0.97, mean difference of 1.12 [95% CI: -10.6, 12.9]) nor in
number of symptoms reported (p = 0.35, mean difference of 1.96 [95% CI: -3.9, 7.8]).
Table 6.4. Summary of symptom presentation in athletes who were diagnosed with a concussion by clinical staff and those that reported elevated SSS. Two female athletes sustained concussions twice; the rest of the concussions are from unique athletes. Females report more symptoms with a higher severity than their male counterparts post-concussion.
Sex Category Survey Count SSS Median (Max) # of Symptoms Median (Max) Female Concussion 10 46 (113) 17.5 (27)
Subconcussion 92 16 (102) 10 (26) Male Concussion 4 15 (27) 10.5 (14)
Subconcussion 21 15 (25) 9 (13)
DISCUSSION
The rugby players commonly reported concussion symptoms in-season in the absence of diagnosed
concussion, but at lower severities than those associated with a diagnosed concussion.42,46 Previous work
has identified cognitive and neuroimaging changes in post-season testing in various sports, but in-season
symptoms have not been monitored before.3,5,7,8,17,19-21,47-50 The elevated symptom cases we identified in our
cohort may be the subconcussion injuries thought to cause the post-season changes previously measured.
Sex-specific differences were also noted: females generally reported more symptoms with higher severity
than their male counterparts. More females’ surveys were categorized as elevated, and females more
commonly reported symptoms of headache, anxiety, and mood.
While most athletes reported 0 symptoms at baseline, consistent with the literature,51 we observed that those
who did report symptoms at baseline were more likely to report symptoms in-season, potentially indicating
reporting tendencies. This pattern was stronger in the male athletes (p < 0.004, 95% CI: 1.8, 112.2) than the
93
female athletes (p = 0.315, 95% CI: 0.5, 27.1). Females reported higher in-season symptoms compared to
their baseline and higher than males in-season. These results are consistent with other studies that indicate
females report more baseline symptoms with higher severity.22,28
To identify a potential accumulation of symptoms, the number of weeks of recurrent elevated symptoms
were quantified. The results did not vary significantly by sex, which is of note because previous work has
identified post-concussion symptoms lasting longer in female athletes than their male counterparts.28,52,53
Of the males that reported recurrent elevated symptoms in this study, their elevated surveys made up a
higher percentage of their total surveys compared to the females. One explanation for this is that the male
athletes were more likely to fill out a survey if they were experiencing symptoms.
Headache has been the most frequently reported symptom in other studies,31 similar to the females in our
study. Females have a higher frequency for pre-existing headache54 which may explain a more frequent or
severe reporting in-season or post-concussion.55 The other most commonly reported symptoms by both
sexes with moderate severity included fatigue and drowsiness. Both could be more reflective of a cohort of
collegiate subjects and not specific to contact-sport athletes. A higher percentage of surveys from female
athletes reported symptoms with moderate severity, and females reported maximum severities for more
symptoms than males did (17 vs 1). These sex-specific patterns could be a systematic difference in reporting
or a difference in experiences; we cannot determine from these data.
Surveys that had mentioned confounding reasons for symptom presentation were excluded. However, the
symptoms included in the symptom checklist are not exclusive to concussions, and likely many more
surveys are affected by outside factors beyond rugby. For this study, we were seeking to understand patterns
in presentation between male and female collegiate rugby players and understand that the results presented
may not be specific to sport-related head impacts.
Our analysis results showed mostly diffuse presentation of symptoms across several subtypes, or no subtype
presentation at all. Strong evidence has supported cluster-based approaches to sport-related concussion
management, identifying the most common clusters as migraine, cognitive-emotional and sleep-emotional,
but acknowledged changes over recovery and overlap in the clusters.56 Interestingly, of the 20 female
surveys that reported a dominant subtype, 16 of those were Anxiety/Mood presentation. This is consistent
with studies that show females with higher levels of anxiety than males.57 Two limitations with the subtype
categorization are that not all subtypes and associated conditions are mutually exclusive, and they are not
all equally represented in standard post-concussion surveys, potentially skewing categorization to the
subtypes that are more reflected in surveys.58
94
There were 14 diagnosed concussions in the dataset and 9 additional athletes with suspected concussions,
i.e. they reported a suspected concussion to research staff but not to medical personnel. These suspected
concussions were included in the subconcussion dataset, as they were not clinically diagnosed and had a
SSS >= 11. The female athletes showed differences between the subconcussive and concussive levels, but
the men did not. This sex-specific difference could be a result of the males’ concussion severities being
lower than the females’ or that males experience higher level subconcussive events in-season. Post-
concussion symptoms present themselves on a different timeline for each individual, and those differences
are likely highlighted. As each week is treated in isolation, we may have missed delayed presentation of
symptoms.
In this study, we have shown that rugby players report concussion-like symptoms in the absence of
diagnosed concussion during the course of a season. The consequences of these symptom reports is unclear
as they might represent undiagnosed concussions, subconcussive tissue changes, or transient subclinical
effects. How they contribute to overt injury still needs to be determined. Recent work from the Concussion
Assessment, Research and Education (CARE) consortium demonstrated a relationship between the amount
of head impact exposure during the season and subsequent concussion.59 A relationship between measured
head impact exposure and these “ambient” symptoms is of great interest and may offer insight into
undiagnosed concussions. In this sample, female rugby players reported elevated symptom frequencies with
greater severities than the males during the season, consistent with other findings. However, both males
and females reported considerable levels of symptoms throughout the course of a season. Further strategies
for addressing these in-season symptom responses should be considered.
REFERENCES
1. Sarmiento, K., J. Mitchko, C. Klein and S. Wong. Evaluation of the centers for disease control and prevention's concussion initiative for high school coaches:“Heads up: Concussion in high school sports”. Journal of School Health. 80(3):112-8, 2010.
2. Gysland, S. M., J. P. Mihalik, J. K. Register-Mihalik, S. C. Trulock, E. W. Shields and K. M. Guskiewicz. The relationship between subconcussive impacts and concussion history on clinical measures of neurologic function in collegiate football players. Annals of Biomedical Engineering. 40(1):14-22, 2012.
3. McKee, A. C., R. C. Cantu, C. J. Nowinski, E. T. Hedley-Whyte, B. E. Gavett, A. E. Budson, V. E. Santini, H.-S. Lee, C. A. Kubilus and R. A. Stern. Chronic traumatic encephalopathy in athletes: Progressive tauopathy after repetitive head injury. Journal of Neuropathology & Experimental Neurology. 68(7):709-35, 2009.
4. Breedlove, E. L., M. Robinson, T. M. Talavage, K. E. Morigaki, U. Yoruk, K. O'Keefe, J. King, L. J. Leverenz, J. W. Gilger and E. A. Nauman. Biomechanical correlates of symptomatic and asymptomatic neurophysiological impairment in high school football. Journal of Biomechanics. 45(7):1265-72, 2012.
5. Levitch, C. F., M. E. Zimmerman, N. Lubin, N. Kim, R. B. Lipton, W. F. Stewart, M. Kim and M. L. Lipton. Recent and long-term soccer heading exposure is differentially associated with
95
neuropsychological function in amateur players. Journal of the International Neuropsychological Society : JINS. 24(2):147-55, 2018.
6. McAllister, T. W., L. A. Flashman, A. Maerlender, R. M. Greenwald, J. G. Beckwith, T. D. Tosteson, J. Crisco, P. G. Brolinson, S. M. Duma and A.-C. Duhaime. Cognitive effects of one season of head impacts in a cohort of collegiate contact sport athletes. Neurology. 78(22):1777-84, 2012.
7. Rutherford, A., R. Stephens, D. Potter and G. Fernie. Neuropsychological impairment as a consequence of football (soccer) play and football heading: Preliminary analyses and report on university footballers. Journal of Clinical and Experimental Neuropsychology. 27(3):299-319, 2005.
8. Kaminski, T. W., A. M. Wikstrom, G. M. Gutierrez and J. J. Glutting. Purposeful heading during a season does not influence cognitive function or balance in female soccer players. Journal of Clinical and Experimental Neuropsychology. 29(7):742-51, 2007.
9. Koerte, I. K., E. Nichols, Y. Tripodis, V. Schultz, S. Lehner, R. Igbinoba, A. Z. Chuang, M. Mayinger, E. M. Klier and M. Muehlmann. Impaired cognitive performance in youth athletes exposed to repetitive head impacts. Journal of Neurotrauma. 34(16):2389-95, 2017.
10. Seichepine, D. R., J. M. Stamm, D. H. Daneshvar, D. O. Riley, C. M. Baugh, B. E. Gavett, Y. Tripodis, B. Martin, C. Chaisson and A. C. McKee. Profile of self-reported problems with executive functioning in college and professional football players. Journal of Neurotrauma. 30(14):1299-304, 2013.
11. Singh, R., T. B. Meier, R. Kuplicki, J. Savitz, I. Mukai, L. Cavanagh, T. Allen, T. K. Teague, C. Nerio and D. Polanski. Relationship of collegiate football experience and concussion with hippocampal volume and cognitive outcomes. Journal of the American Medical Association. 311(18):1883-8, 2014.
12. Merritt, V. C., L. S. Greenberg, E. Guty, M. L. Bradson, A. R. Rabinowitz and P. A. Arnett. Beyond measures of central tendency: Novel methods to examine sex differences in neuropsychological performance following sports-related concussion in collegiate athletes. Journal of the International Neuropsychological Society. 25(10):1094-100, 2019.
13. Maerlender, A., E. Smith, P. G. Brolinson, J. Crisco, J. Urban, A. Ajamil, S. Rowson, E. T. Campolettano, R. A. Gellner, S. Bellamkonda, E. Kieffer, M. E. Kelley, D. Jones, A. Powers, J. Beckwith, J. Stitzel, R. M. Greenwald and S. Duma. Neuropsychological change after a single season of head impact exposure in youth football. Journal of the International Neuropsychological Society. 1-11, 2020.
14. Deshpande, S. K., R. B. Hasegawa, A. R. Rabinowitz, J. Whyte, C. L. Roan, A. Tabatabaei, M. Baiocchi, J. H. Karlawish, C. L. Master and D. S. Small. Association of playing high school football with cognition and mental health later in life. Journal of the American Medical Associaion Neurology. 74(8):909-18, 2017.
15. Caccese, J. B., R. M. DeWolf, T. W. Kaminski, S. P. Broglio, T. W. McAllister, M. McCrea, T. A. Buckley and C. C. Investigators. Estimated age of first exposure to american football and neurocognitive performance amongst ncaa male student-athletes: A cohort study. Sports Medicine. 49(3):477-87, 2019.
16. Janssen, P. H., J. Mandrekar, M. M. Mielke, J. E. Ahlskog, B. F. Boeve, K. Josephs and R. Savica. High school football and late-life risk of neurodegenerative syndromes, 1956-1970. Mayo ClinicProceedings. 92(1):66-71, 2017.
17. Lipton, M. L., N. Kim, M. E. Zimmerman, M. Kim, W. F. Stewart, C. A. Branch and R. B. Lipton. Soccer heading is associated with white matter microstructural and cognitive abnormalities. Radiology. 268(3):850-7, 2013.
18. McAllister, T. W., J. C. Ford, L. A. Flashman, A. Maerlender, R. M. Greenwald, J. G. Beckwith, R. P. Bolander, T. D. Tosteson, J. H. Turco, R. Raman and S. Jain. Effect of head impacts on diffusivity measures in a cohort of collegiate contact sport athletes. Neurology. 82(1):63-9, 2014.
96
19. Poole, V. N., K. Abbas, T. E. Shenk, E. L. Breedlove, K. M. Breedlove, M. E. Robinson, L. J. Leverenz, E. A. Nauman, T. M. Talavage and U. Dydak. Mr spectroscopic evidence of brain injury in the non-diagnosed collision sport athlete. Developmental Neuropsychology. 39(6):459-73, 2014.
20. Chamard, E., H. Théoret, E. N. Skopelja, L. A. Forwell, A. M. Johnson and P. S. Echlin. A prospective study of physician-observed concussion during a varsity university hockey season: Metabolic changes in ice hockey players. Part 4 of 4. Neurosurgical focus. 33(6):E4, 2012.
21. Koerte, I. K., A. P. Lin, M. Muehlmann, S. Merugumala, H. Liao, T. Starr, D. Kaufmann, M. Mayinger, D. Steffinger and B. Fisch. Altered neurochemistry in former professional soccer players without a history of concussion. Journal of Neurotrauma. 32(17):1287-93, 2015.
22. Lovell, M. R., G. L. Iverson, M. W. Collins, K. Podell, K. M. Johnston, D. Pardini, J. Pardini, J. Norwig and J. C. Maroon. Measurement of symptoms following sports-related concussion: Reliability and normative data for the post-concussion scale. Applied Neuropsychology. 13(3):166-74, 2006.
23. McCrea, M., T. Hammeke, G. Olsen, P. Leo and K. Guskiewicz. Unreported concussion in high school football players: Implications for prevention. Clinical Journal of Sport Medicine. 14(1):13-7, 2004.
24. Meehan III, W. P., R. C. Mannix, M. J. O'Brien and M. W. Collins. The prevalence of undiagnosed concussions in athletes. Clinical Journal of Sport Medicine: official journal of the Canadian Academy of Sport Medicine. 23(5):339, 2013.
25. Asken, B. M., M. A. McCrea, J. R. Clugston, A. R. Snyder, Z. M. Houck and R. M. Bauer. “Playing through it”: Delayed reporting and removal from athletic activity after concussion predicts prolonged recovery. Journal of Athletic Training. 51(4):329-35, 2016.
26. Dick, R. Is there a gender difference in concussion incidence and outcomes? British Journal of Sports Medicine. 43(Suppl 1):i46-i50, 2009.
27. Barnes, B. C., L. Cooper, D. T. Kirkendall, T. P. McDermott, B. D. Jordan and W. E. Garrett. Concussion history in elite male and female soccer players. The American Journal of Sports Medicine. 26(3):433-8, 1998.
28. Broshek, D. K., T. Kaushik, J. R. Freeman, D. Erlanger, F. Webbe and J. T. Barth. Sex differences in outcome following sports-related concussion. Journal of Neurosurgery. 102(5):856-63, 2005.
29. Covassin, T., R. J. Elbin III, E. Larson and A. P. Kontos. Sex and age differences in depression and baseline sport-related concussion neurocognitive performance and symptoms. Clinical Journal of Sport Medicine. 22(2):98-104, 2012.
30. Fakhran, S., K. Yaeger, M. Collins and L. Alhilali. Sex differences in white matter abnormalities after mild traumatic brain injury: Localization and correlation with outcome. Radiology. 272(3):815-23, 2014.
31. Frommer, L. J., K. K. Gurka, K. M. Cross, C. D. Ingersoll, R. D. Comstock and S. A. Saliba. Sex differences in concussion symptoms of high school athletes. Journal of Athletic Training. 46(1):76-84, 2011.
32. Bramlett, H. M. and W. D. Dietrich. Neuropathological protection after traumatic brain injury in intact female rats versus males or ovariectomized females. Journal of Neurotrauma. 18(9):891-900, 2001.
33. Roof, R. L. and E. D. Hall. Gender differences in acute CNS trauma and stroke: Neuroprotective effects of estrogen and progesterone. Journal of Neurotrauma. 17(5):367-88, 2000.
34. Dollé, J.-P., A. Jaye, S. A. Anderson, H. Ahmadzadeh, V. B. Shenoy and D. H. Smith. Newfound sex differences in axonal structure underlie differential outcomes from in vitro traumatic axonal injury. Experimental Neurology. 300(121-34, 2018.
35. Granito Jr, V. J. Psychological response to athletic injury: Gender differences. Journal of Sport Behavior. 25(3):243, 2002.
36. Gessel, L. M., S. K. Fields, C. L. Collins, R. W. Dick and R. D. Comstock. Concussions among united states high school and collegiate athletes. Journal of Athletic Training. 42(4):495-503, 2007.
97
37. Zuckerman, S. L., R. P. Apple, M. J. Odom, Y. M. Lee, G. S. Solomon and A. K. Sills. Effect of sex on symptoms and return to baseline in sport-related concussion. Journal of Neurosurgery: Pediatrics. 13(1):72-81, 2014.
38. Broglio, S. P., R. C. Cantu, G. A. Gioia, K. M. Guskiewicz, J. Kutcher, M. Palm, T. C. Valovich McLeod and A. National Athletic Trainer's. National athletic trainers' association position statement: Management of sport concussion. Journal of Athletic Training. 49(2):245-65, 2014.
39. Lau, B., M. R. Lovell, M. W. Collins and J. Pardini. Neurocognitive and symptom predictors of recovery in high school athletes. Clinical Journal of Sport Medicine. 19(3):216-21, 2009.
40. Piland, S. G., R. W. Motl, M. S. Ferrara and C. L. Peterson. Evidence for the factorial and construct validity of a self-report concussion symptoms scale. Journal of Athletic Training. 38(2):104, 2003.
41. Guskiewicz, K. M., J. P. Mihalik, V. Shankar, S. W. Marshall, D. H. Crowell, S. M. Oliaro, M. F. Ciocca and D. N. Hooker. Measurement of head impacts in collegiate football players: Relationship between head impact biomechanics and acute clinical outcome after concussion. Neurosurgery. 61(6):1244-53, 2007.
42. McCrea, M., W. B. Barr, K. Guskiewicz, C. Randolph, S. W. Marshall, R. Cantu, J. A. Onate and J. P. Kelly. Standard regression-based methods for measuring recovery after sport-related concussion. Journal of the International Neuropsychological Society. 11(1):58-69, 2005.
43. Lovell, M. R. and M. W. Collins. Neuropsychological assessment of the college football player. The Journal of Head Trauma Rehabilitation. 13(2):9-26, 1998.
44. Echemendia, R. J., W. Meeuwisse, P. McCrory, G. A. Davis, M. Putukian, J. Leddy, M. Makdissi, S. J. Sullivan, S. P. Broglio, M. Raftery, K. Schneider, J. Kissick, M. McCrea, J. Dvořák, A. K. Sills, M. Aubry, L. Engebretsen, M. Loosemore, G. Fuller, J. Kutcher, R. Ellenbogen, K. Guskiewicz, J. Patricios and S. Herring. The sport concussion assessment tool 5th edition (SCAT5): Background and rationale. British Journal of Sports Medicine. 51(11):848-50, 2017.
45. Lumba-Brown, A., M. Teramoto, O. J. Bloom, D. Brody, J. Chesnutt, J. R. Clugston, M. Collins, G. Gioia, A. Kontos and A. Lal. Concussion guidelines step 2: Evidence for subtype classification. Neurosurgery. 86(1):2-13, 2020.
46. McCrea, M., K. M. Guskiewicz, S. W. Marshall, W. Barr, C. Randolph, R. C. Cantu, J. A. Onate, J. Yang and J. P. Kelly. Acute effects and recovery time following concussion in collegiate football playersthe NCAA concussion study. Journal of the American Medical Association. 290(19):2556-63, 2003.
47. Matser, J. T., A. G. H. Kessels, M. D. Lezak and J. Troost. A dose-response relation of headers and concussions with cognitive impairment in professional soccer players. Journal of Clinical and Experimental Neuropsychology. 23(6):770-4, 2001.
48. Straume-Næsheim, T. M., T. E. Andersen, I. M. K. Holme, A. S. McIntosh, J. Dvorak and R. Bahr. Do minor head impacts in soccer cause concussive injury? A prospective case-control study. Neurosurgery. 64(4):719-25, 2009.
49. Witol, A. D. and F. M. Webbe. Soccer heading frequency predicts neuropsychological deficits. Archives of Clinical Neuropsychology. 18(4):397-417, 2003.
50. Rawlings, S., R. Takechi and A. P. Lavender. Effects of sub-concussion on neuropsychological performance and its potential mechanisms: A narrative review. Brain Research Bulletin. 165(56-62, 2020.
51. Katz, B. P., M. Kudela, J. Harezlak, M. McCrea, T. McAllister, S. P. Broglio and C. C. Investigators. Baseline performance of ncaa athletes on a concussion assessment battery: A report from the care consortium. Sports Medicine. 48(8):1971-85, 2018.
52. Chiang Colvin, A., J. Mullen, M. R. Lovell, R. Vereeke West, M. W. Collins and M. Groh. The role of concussion history and gender in recovery from soccer-related concussion. The American Journal of Sports Medicine. 37(9):1699-704, 2009.
53. Preiss-Farzanegan, S. J., B. Chapman, T. M. Wong, J. Wu and J. J. Bazarian. The relationship between gender and postconcussion symptoms after sport-related mild traumatic brain injury. American Journal of Physical Medicine & Rehabilitation. 1(3):245-53, 2009.
98
54. Covassin, T., R. Elbin, W. Harris, T. Parker and A. Kontos. The role of age and sex in symptoms, neurocognitive performance, and postural stability in athletes after concussion. The American Journal of Sports Medicine. 40(6):1303-12, 2012.
55. Hoffman, J. M., S. Lucas, S. Dikmen, C. A. Braden, A. W. Brown, R. Brunner, R. Diaz-Arrastia, W. C. Walker, T. K. Watanabe and K. R. Bell. Natural history of headache after traumatic brain injury. Journal of Neurotrauma. 28(9):1719-25, 2011.
56. Langdon, S., M. Königs, E. A. M. C. Adang, E. Goedhart and J. Oosterlaan. Subtypes of sport-related concussion: A systematic review and meta-cluster analysis. Sports Medicine. 50(10):1829-42, 2020.
57. McLean, C. P., A. Asnaani, B. T. Litz and S. G. Hofmann. Gender differences in anxiety disorders: Prevalence, course of illness, comorbidity and burden of illness. Journal of Psychiatric Research. 45(8):1027-35, 2011.
58. Lumba-Brown, A., J. Ghajar, J. Cornwell, O. J. Bloom, J. Chesnutt, J. R. Clugston, R. Kolluri, J. J. Leddy, M. Teramoto and G. Gioia. Representation of concussion subtypes in common postconcussion symptom-rating scales. Concussion. 4(3):CNC65, 2019.
59. Stemper, B. D., A. S. Shah, J. Harezlak, S. Rowson, J. P. Mihalik, S. M. Duma, L. D. Riggen, A. Brooks, K. L. Cameron, D. Campbell, J. P. DiFiori, C. C. Giza, K. M. Guskiewicz, J. Jackson, G. T. McGinty, S. J. Svoboda, T. W. McAllister, S. P. Broglio, M. McCrea and C. C. I. the. Comparison of head impact exposure between concussed football athletes and matched controls: Evidence for a possible second mechanism of sport-related concussion. Annals of Biomedical Engineering. 47(10):2057-72, 2019.
99
CHAPTER 7: DUAL-TASK GAIT PERFORMANCE FOLLOWING HEAD
IMPACT EXPOSURE IN MALE AND FEMALE COLLEGIATE RUGBY
PLAYERS
ABSTRACT
Decreased postural control and gait impairments have been well studied in concussed athletes. However,
the effect of subconcussive impacts on gait is not well understood. As concussions affect parts of the brain
responsible for cognitition as well as motor control, it is of interest to study the relationship between head
impact exposure and its effect on gait, and identify potential sex-specific differences. Dual-task gait
assessments, when a cognitive task is added to a walking task, can help amplify deficits in gait, and are
representative of tasks in everyday life. Dual-task cost is the difference in performance going from walking
(single-task) to walking with a cognitive load (dual-task). The objective of this study was to quantify
differences between sexes dual-task gait metrics, gait metric changes from pre-season to post-concussion
and post-season, and the dual-task costs associated with gait metrics. 77 female athlete-seasons and 64 male
athlete-seasons from the Virginia Tech club rugby teams participated in this study. Subjects wore inertial
sensors and completed walking trials with and without a cognitive test before the season began, after the
season ended, and after a concussion (if applicable). Females athletes showed improvement in cadence
(increase), double support time (decrease), gait speed (increase), and stride length (increase) in both task
conditions over the course of the season (p < 0.030). Male athletes showed no differences in the metrics
over the course of the season, with the exception of faster gait speeds and longer stride lengths in the dual-
task condition (p < 0.034). In all four gait characteristics, at baseline and post-season, females had higher
dual-task costs (p < 0.003) than the males. This study showed that there is little evidence suggesting a
relationship between repetitive head impact exposure and gait deficits, but there are sex-specific differences
that should be considered during the diagnosis and management of sports-related concussion.
Keywords: Dual-task, Gait, Sex-Specific, Subconcussion
INTRODUCTION
Concussions are a diffuse injury to the brain,1 affecting a variety of brain functions, including
neurocognition and motor control.2 Gait research has advanced the understanding of the effect of
concussions on motor control, and altered gait patterns have been observed as a result of sports related
concussion.3-6 Dual-task walking involves locomotion while performing a concurrent cognitive task.
Concussions usually affect both motor and cognitive functions, so the divided attention required in dual-
tasks may be more sensitive to post-concussion impairments than single-tasks.7 The addition of a cognitive
100
load while walking also allows for the evaluation of more subtle motor impairments due to the increase in
processing demands required, and decrease in available attention.8,9 It is of interest to quantify the change
in a specific variable with the addition of the load, or the change in the variable from single task to dual
task, known as dual-task cost.10 Assessing the effects of dual task is also advantageous as most sport and
daily living activities require both a motor and cognitive component, and understanding their interaction in
concussion may provide useful information in injury recovery.
Researchers have observed that a full recovery in gait performance post-concussion required months to
years, especially when the participant’s attention is divided.3,4,11,12 More traditional markers of recovery,
like symptom surveys or neurocognitive test performance, typically recover on a shorter timeline.13,14
Assessing gait is advantageous because it is a non-novel task and can be objectively measured,3,4,12,15 unlike
more obsolete methods of measuring balance16,17 or less mobile methods.18 Gait can be measured in-lab,
but also on-field, using portable inertial measurement units.19,20
Accelerometry can be used to quantify gait, and the incorporation of accelerometers into these body-worn
portable sensors allow for an assessment of gait that allows for widespread use.19 Including a gait
assessment in post-concussion protocols may provide an objective and sensitive measurement that can be
assessed throughout return-to-play, to monitor progress and management. Limited sex-specific normative
data exist for single and dual task gait characteristics,7,21 and baseline measurements are recommended22 as
gait is unique to individuals, and varies based on body size,23 concussion history,6,24 and sex.25 Females
generally report more symptoms post-concussion26 and take a longer time to fully recover27 than males.
Because of the differences in presentation of concussions, it is of interest to understand any sex-specific
gait changes as well. Understanding the effect of sex on presentation and recovery of concussion will
hopefully provide useful information to drive sex-specific interventions.
Athletes with a history of concussion have been shown to have a more conservative pattern in their gait,6
with decreased walking speed, decreased cadence, decreased stride length, and increased double-leg support
time compared with control subjects during dual-task walking.12 It is not known how a season worth of
cumulative head impacts in a contact sport in absence of a concussion affects gait. The objective is to
explore the differences between sexes in 1) dual-task gait metrics in 2) gait metric changes from pre-season
to post-concussion and post-season and 3) the dual-task costs associated with gait metrics.
101
METHODS
Study Participants
In the spring and fall of 2019 and spring of 2020, athletes from women’s and men’s club rugby teams were
recruited. Written informed consent was obtained from each participant after explaining the purpose,
associated benefits, and risks of the study with accordance to the ethical guidelines of the Virginia Tech
Institutional Review Board (IRB). 77 female athlete-seasons (age: 20.7 ± 1.2 years, height: 1.7 ± 0.1 m,
weight: 75.1 ± 17.6 kg) and 64 male athlete-seasons (age: 21.0 ± 1.2 years, height: 1.8 ± 0.1 m, weight:
89.5 ± 17.5 kg) participated in the study. If an athlete participated for two seasons, their data are treated as
two unique athlete-seasons. Athletes reported suspected concussions to the research team. Not all
concussions were clinically diagnosed.
Dual-Task Gait Protocol
The gait protocol was completed pre-season (baseline), post-season, and post-concussion (if applicable).
Athletes were not tested if they had a lower extremity injury. Those who sustained concussions were
evaluated an average of 2.7 days after injury (range = 1 - 4 days). There were no post-season data collected
for Spring 2020, as the season was interrupted due to COVID-19.
The gait protocol included two conditions: walking without a cognitive task (single-task walking) and
walking while completing a cognitive task (dual-task walking). Five trials were completed for each
condition.21 The subject walked at a self-selected, comfortable pace, barefoot or in socks. They were
instructed to walk towards an object 8 m in front of them, walk around it, and return to the starting point.21
For the dual-task trials, the test administrator explained the task prior to the start of the walk, and the athlete
began walking when cued by an auditory beep. The test administrator did not instruct the athlete to prioritize
the motor or cognitive task, just to continue walking while responding to the task as best as possible.21 The
dual task consisted of a Mini-Mental Status Examination (MMSE), which has been shown to detect
differences in dual-task walking after concussion.28 The MMSE contained three different tasks: spelling a
5-letter word backwards,15,29 subtracting by 6s or 7s from a randomly presented 2-digit number,30 and
reciting the months in reverse order starting from a randomly chosen month.31 This cognitive test is similar
to the Standardized Concussion Assessment Tool, Version 3, which is used for on-field concussion
diagnosis.22,32 The tasks were randomly ordered to reduce learning effects from one trial to the next.
During the walking protocols, athletes wore inertial measurement units (Opal Sensor, APDM Inc. Portland,
OR) attached with an elastic strap on the lumbar spine, at the lumbosacral junction, and on the dorsal
surfaces of the left and right feet (Figure 7.1). This system has been validated33 and utilized in clinical
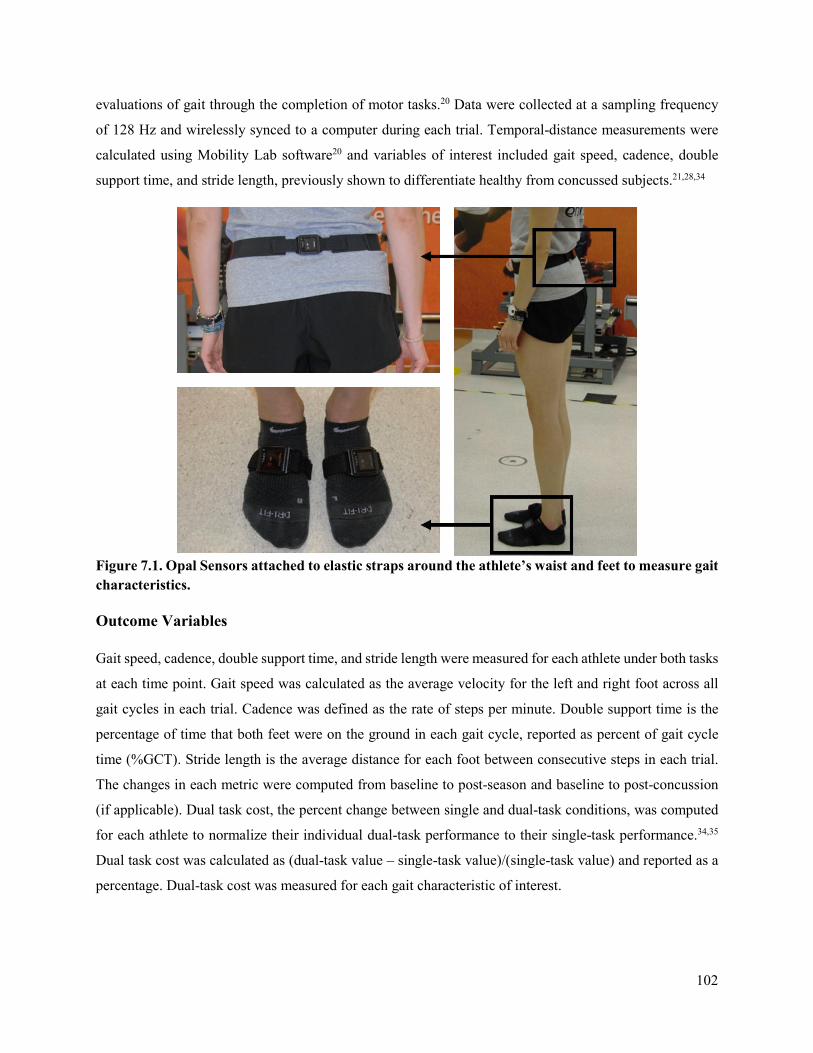
102
evaluations of gait through the completion of motor tasks.20 Data were collected at a sampling frequency
of 128 Hz and wirelessly synced to a computer during each trial. Temporal-distance measurements were
calculated using Mobility Lab software20 and variables of interest included gait speed, cadence, double
support time, and stride length, previously shown to differentiate healthy from concussed subjects.21,28,34
Figure 7.1. Opal Sensors attached to elastic straps around the athlete’s waist and feet to measure gait characteristics.
Outcome Variables
Gait speed, cadence, double support time, and stride length were measured for each athlete under both tasks
at each time point. Gait speed was calculated as the average velocity for the left and right foot across all
gait cycles in each trial. Cadence was defined as the rate of steps per minute. Double support time is the
percentage of time that both feet were on the ground in each gait cycle, reported as percent of gait cycle
time (%GCT). Stride length is the average distance for each foot between consecutive steps in each trial.
The changes in each metric were computed from baseline to post-season and baseline to post-concussion
(if applicable). Dual task cost, the percent change between single and dual-task conditions, was computed
for each athlete to normalize their individual dual-task performance to their single-task performance.34,35
Dual task cost was calculated as (dual-task value – single-task value)/(single-task value) and reported as a
percentage. Dual-task cost was measured for each gait characteristic of interest.
103
Statistical Analysis
Shapiro-Wilk tests were used to confirm normality of the gait metrics. Paired Welch two-sample t-tests
were used to compare the magnitudes and estimate the effect size and precision of cadence, double support
time, gait speed, and stride length from baseline to post-season within each task condition. The same paired
comparisons were done for athletes with baseline and post-concussion time point data. These comparisons
were paired per athlete and compared within sex. Welch two-sample t-tests were completed to compare the
differences in metrics between sexes from baseline to post-season for each task condition. Because there
was only one concussion for the males, only females’ data were compared from baseline to post-concussion
time points.
Dual-task costs were not normally distributed, so paired Wilcoxon rank-sum tests were used to compare
dual-task cost from baseline to post-season within sex for each gait characteristic. Welch two-sample t-tests
were used to estimate effect size and precision. Unpaired Wilcoxon rank-sum tests compared dual-task cost
for each metric at each time. Again, only the females’ data were compared for the differences in baseline
to post-concussion change, and between sex differences were not. Welch two-sample t-tests were used to
estimate effect size and precision of the comparisons.
RESULTS
Gait metrics are presented from both task conditions at each time point (where applicable) for all athletes
(Table 7.1). All comparisons within sex were paired, i.e. only athletes that had both time points were
included in the particular analysis.
104
Table 7.1. Summary table for the mean values ± the standard deviation for the four primary gait metrics from all athletes from baseline, post-concussion (CX), post-season, and at both single and dual task conditions. Count is the number of athlete-seasons in each category.
Sex Time Point Task Count Cadence
(step/min)
Double Support Time
(%GCT)
Gait Speed (m/s)
Stride Length (m)
Female Baseline Dual 77 105.5 ± 10.1 22.3 ± 3.2 0.9 ± 0.2 1.1 ± 0.1 Single 77 113.0 ± 9.0 20.1 ± 2.9 1.1 ± 0.2 1.1 ± 0.1 Post-CX Dual 14 102.4 ± 11.1 23.2 ± 3.2 0.9 ± 0.2 1.1 ± 0.1 Single 14 110.3 ± 11.1 20.8 ± 3.0 1.1 ± 0.2 1.1 ± 0.1 Post-Season Dual 39 106.9 ± 10.3 21.8 ± 3.5 0.9 ± 0.2 1.1 ± 0.1 Single 39 114.5 ± 9.2 19.4 ± 3.3 1.1 ± 0.2 1.2 ± 0.1 Male Baseline Dual 64 102.3 ± 7.0 22.3 ± 3.0 0.9 ± 0.1 1.1 ± 0.1 Single 64 106.5 ± 5.6 20.8 ± 2.7 1.0 ± 0.1 1.1 ± 0.1 Post-CX Dual 1 90.6 25.1 0.8 1.1 Single 1 96.1 24.2 0.9 1.1 Post-Season Dual 37 102.4 ± 7.5 22.4 ± 2.7 1.0 ± 0.1 1.1 ± 0.1 Single 37 106.3 ± 6.1 21.0 ± 2.5 1.1 ± 0.1 1.2 ± 0.1
At baseline and post-season, females walked with faster cadences at both task conditions than males (p <
0.032). Males walked with longer stride length in dual-task conditions at baseline and post-season (p <
0.023) and greater double support time in single-task conditions at baseline (p = 0.020). All other conditions
were similar between sexes. The addition of the dual task negatively impacted all gait metrics for both sexes
at each time point (p < 0.001). Mean percent differences and 95th percentile confidence intervals between
sex are shown in Figure 7.2.
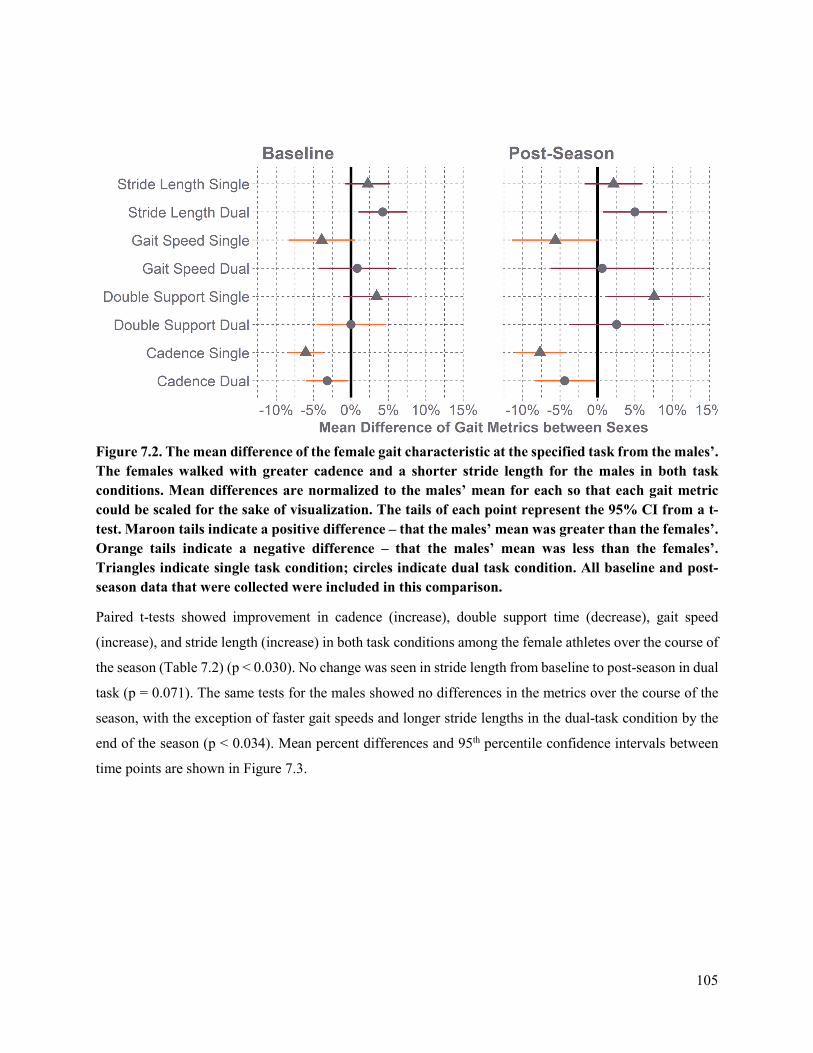
105
Figure 7.2. The mean difference of the female gait characteristic at the specified task from the males’. The females walked with greater cadence and a shorter stride length for the males in both task conditions. Mean differences are normalized to the males’ mean for each so that each gait metric could be scaled for the sake of visualization. The tails of each point represent the 95% CI from a t-test. Maroon tails indicate a positive difference – that the males’ mean was greater than the females’. Orange tails indicate a negative difference – that the males’ mean was less than the females’. Triangles indicate single task condition; circles indicate dual task condition. All baseline and post-season data that were collected were included in this comparison.
Paired t-tests showed improvement in cadence (increase), double support time (decrease), gait speed
(increase), and stride length (increase) in both task conditions among the female athletes over the course of
the season (Table 7.2) (p < 0.030). No change was seen in stride length from baseline to post-season in dual
task (p = 0.071). The same tests for the males showed no differences in the metrics over the course of the
season, with the exception of faster gait speeds and longer stride lengths in the dual-task condition by the
end of the season (p < 0.034). Mean percent differences and 95th percentile confidence intervals between
time points are shown in Figure 7.3.
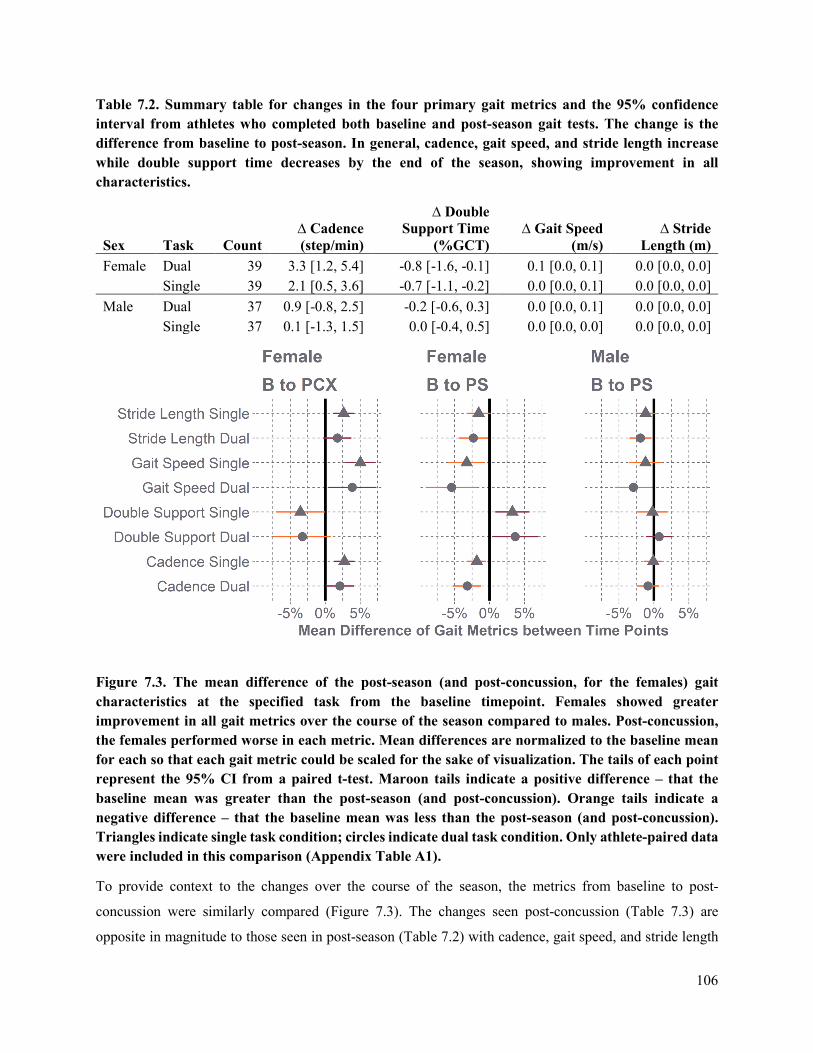
106
Table 7.2. Summary table for changes in the four primary gait metrics and the 95% confidence interval from athletes who completed both baseline and post-season gait tests. The change is the difference from baseline to post-season. In general, cadence, gait speed, and stride length increase while double support time decreases by the end of the season, showing improvement in all characteristics.
Sex Task Count ∆ Cadence (step/min)
∆ Double Support Time
(%GCT) ∆ Gait Speed
(m/s) ∆ Stride
Length (m) Female Dual 39 3.3 [1.2, 5.4] -0.8 [-1.6, -0.1] 0.1 [0.0, 0.1] 0.0 [0.0, 0.0] Single 39 2.1 [0.5, 3.6] -0.7 [-1.1, -0.2] 0.0 [0.0, 0.1] 0.0 [0.0, 0.0] Male Dual 37 0.9 [-0.8, 2.5] -0.2 [-0.6, 0.3] 0.0 [0.0, 0.1] 0.0 [0.0, 0.0] Single 37 0.1 [-1.3, 1.5] 0.0 [-0.4, 0.5] 0.0 [0.0, 0.0] 0.0 [0.0, 0.0]
Figure 7.3. The mean difference of the post-season (and post-concussion, for the females) gait characteristics at the specified task from the baseline timepoint. Females showed greater improvement in all gait metrics over the course of the season compared to males. Post-concussion, the females performed worse in each metric. Mean differences are normalized to the baseline mean for each so that each gait metric could be scaled for the sake of visualization. The tails of each point represent the 95% CI from a paired t-test. Maroon tails indicate a positive difference – that the baseline mean was greater than the post-season (and post-concussion). Orange tails indicate a negative difference – that the baseline mean was less than the post-season (and post-concussion). Triangles indicate single task condition; circles indicate dual task condition. Only athlete-paired data were included in this comparison (Appendix Table A1).
To provide context to the changes over the course of the season, the metrics from baseline to post-
concussion were similarly compared (Figure 7.3). The changes seen post-concussion (Table 7.3) are
opposite in magnitude to those seen in post-season (Table 7.2) with cadence, gait speed, and stride length

107
increasing, and most double support times decreasing. All characteristics showed deficits in the females in
both task conditions (p < 0.042) with the exceptions of double support time and stride length during the
dual task condition (p > 0.083). It is not possible to generalize about the males’ responses because post-
concussion gait data were only collected from one male athlete.
Table 7.3. Summary table for changes in the four primary gait metrics and the 95% confidence interval from athletes who completed both baseline and post-concussion gait tests. Consistent with prior literature, cadence, gait speed, and stride length decrease while double support time increases after concussion.
Sex Task Count ∆ Cadence (step/min)
∆ Double Support Time
(%GCT) ∆ Gait Speed
(m/s) ∆ Stride
Length (m) Female Dual 14 -2.2 [-4.3, -0.1] 0.7 [-0.2, 1.6] 0.0 [-0.1, 0.0] 0.0 [0.0, 0.0] Single 14 -3.1 [-4.8, -1.4] 0.7 [0.0, 1.4] -0.1[-0.1, 0.0] 0.0 [0.0, 0.0] Male Dual 1 -6.5 1.7 -0.1 0.0 Single 1 -5.8 1.9 -0.1 -0.1
The costs for cadence, gait speed, and stride length are all negative and double support time is positive,
because gait becomes more conservative with the addition of the cognitive load in the form of the dual-task
condition (Table 7.4). In all four gait characteristics, at baseline and post-season, females had higher dual-
task costs (p < 0.003) than the males (Figure 7.4).
Table 7.4. Summary table for mean dual task-cost (%) of four gait metrics in athletes at each time point.
Sex Time Point Count Cadence Cost (%)
Double Support Cost
(%) Gait Speed
Cost (%) Stride Length
Cost (%) Female Baseline 77 -6.6 ± 4.0 11.3 ± 7.7 -12.9 ± 6.8 -6.9 ± 4.3 Post-Concussion 14 -7.2 ± 2.9 11.9 ± 6.2 -13.0 ± 5.4 -6.2 ± 3.6 Post-Season 39 -6.7 ± 3.7 12.5 ± 5.8 -13.4 ± 5.9 -7.4 ± 3.9 Male Baseline 64 -4.0 ± 3.6 7.4 ± 5.5 -8.6 ± 6.0 -4.9 ± 3.7 Post-Concussion 1 -5.7 3.7 -8.8 -3.6 Post-Season 37 -3.6 ± 4.2 6.7 ± 5.6 -7.7 ± 6.8 -4.5 ± 3.7
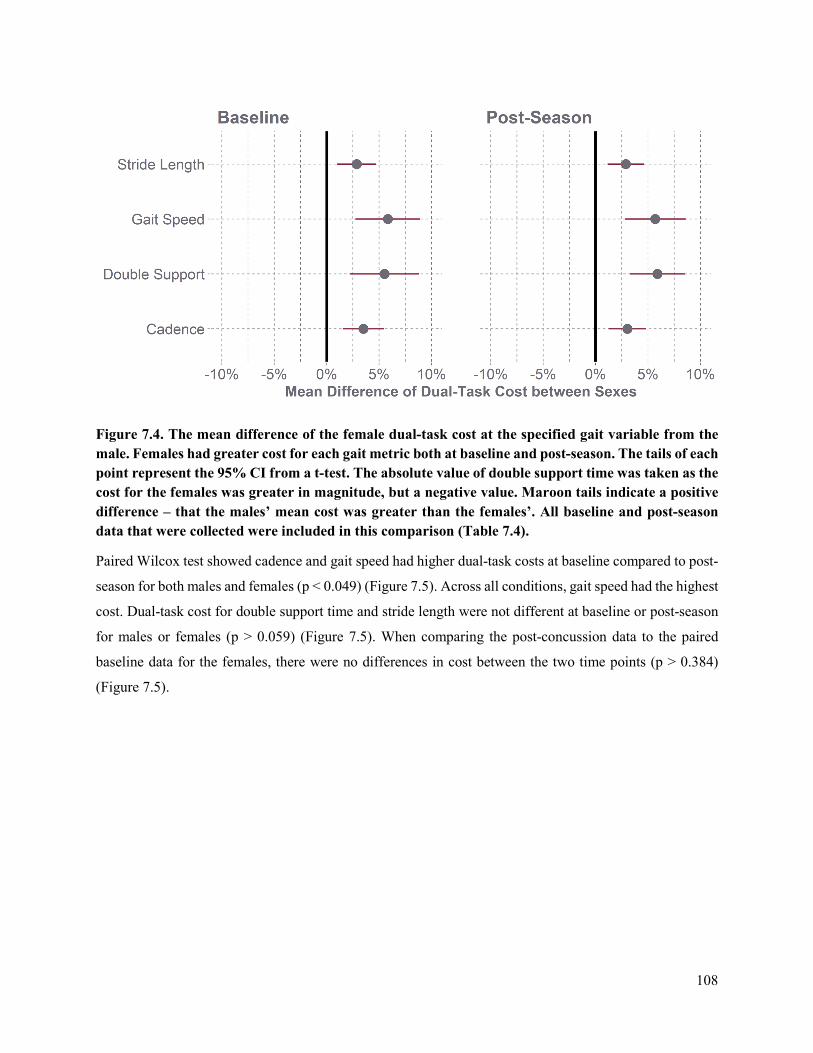
108
Figure 7.4. The mean difference of the female dual-task cost at the specified gait variable from the male. Females had greater cost for each gait metric both at baseline and post-season. The tails of each point represent the 95% CI from a t-test. The absolute value of double support time was taken as the cost for the females was greater in magnitude, but a negative value. Maroon tails indicate a positive difference – that the males’ mean cost was greater than the females’. All baseline and post-season data that were collected were included in this comparison (Table 7.4).
Paired Wilcox test showed cadence and gait speed had higher dual-task costs at baseline compared to post-
season for both males and females (p < 0.049) (Figure 7.5). Across all conditions, gait speed had the highest
cost. Dual-task cost for double support time and stride length were not different at baseline or post-season
for males or females (p > 0.059) (Figure 7.5). When comparing the post-concussion data to the paired
baseline data for the females, there were no differences in cost between the two time points (p > 0.384)
(Figure 7.5).
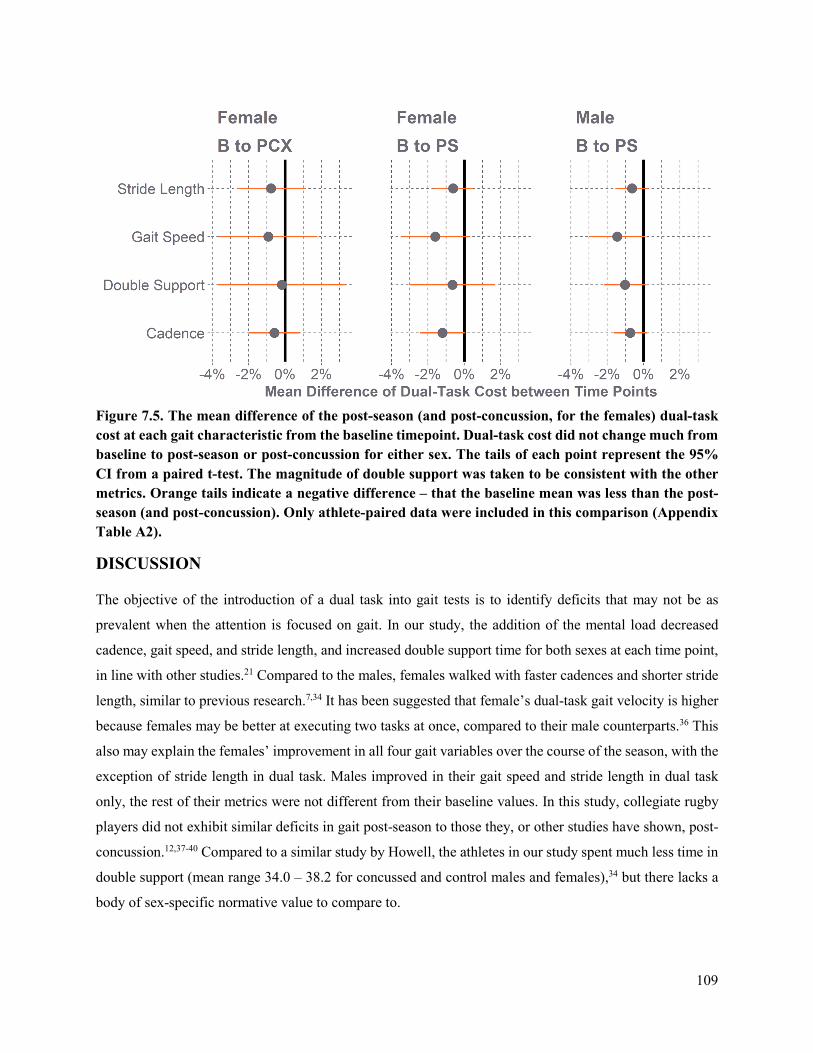
109
Figure 7.5. The mean difference of the post-season (and post-concussion, for the females) dual-task cost at each gait characteristic from the baseline timepoint. Dual-task cost did not change much from baseline to post-season or post-concussion for either sex. The tails of each point represent the 95% CI from a paired t-test. The magnitude of double support was taken to be consistent with the other metrics. Orange tails indicate a negative difference – that the baseline mean was less than the post-season (and post-concussion). Only athlete-paired data were included in this comparison (Appendix Table A2).
DISCUSSION
The objective of the introduction of a dual task into gait tests is to identify deficits that may not be as
prevalent when the attention is focused on gait. In our study, the addition of the mental load decreased
cadence, gait speed, and stride length, and increased double support time for both sexes at each time point,
in line with other studies.21 Compared to the males, females walked with faster cadences and shorter stride
length, similar to previous research.7,34 It has been suggested that female’s dual-task gait velocity is higher
because females may be better at executing two tasks at once, compared to their male counterparts.36 This
also may explain the females’ improvement in all four gait variables over the course of the season, with the
exception of stride length in dual task. Males improved in their gait speed and stride length in dual task
only, the rest of their metrics were not different from their baseline values. In this study, collegiate rugby
players did not exhibit similar deficits in gait post-season to those they, or other studies have shown, post-
concussion.12,37-40 Compared to a similar study by Howell, the athletes in our study spent much less time in
double support (mean range 34.0 – 38.2 for concussed and control males and females),34 but there lacks a
body of sex-specific normative value to compare to.
110
The changes the females showed post-concussion are consistent with post-concussion gait tests in
literature.7,34 Their cadence, gait speed, and stride length increased, and most double support times
decreased. Previous work has shown a decrease in these metrics post-concussion,34,35 indicating a more
conservative gait pattern, with the athletes walking slower with smaller steps post-concussion.
At baseline and post-season, females had higher dual-task costs than the males in all four variables. Across
the board, gait speed had the largest dual-task cost. Dual-task costs for gait speed have been used as a
predictor in prolonged recovery time in concussed athletes.41 Previous literature has shown a greater
cadence cost in females compared to males post-concussion.34 In the same study, they did not notice any
dual-task cost difference between male and female controls34 which is not consistent with our results at
baseline. They did not see a difference in dual-task cost from control males to concussed males either,34
which follows the same trend as our male athletes at baseline and post-season.
Although we expected females to have higher cost, we also expected cost to be higher with post-concussion,
similar to other studies.4,35,42 The additional cognitive load was expected to reflect functional changes post-
concussion and decreased interhemispheric brain connectivity,43 forcing the brain to reorganize to perform
the challenging task while simultaneously proving resources for walking. In concussed athletes, we would
except this resource allocation to be hindered,44,45 and appropriately reflected in dual-task costs. However,
there were no difference in cost in the baseline and post-concussion paired data. Previous work has shown
dual-task deficits at days 5-6,46 or in the year following,40 which is after all of the athletes in this study were
tested. Additionally, based on the performance of the athletes, improving over the season, it is unsurprising
that cadence and gait speed had higher dual-task costs at baseline compared to post-season for both males
and females. No study has quantified cost after a season of impacts to compare with.
The overall improvement in gait and decrease in dual-task cost could be the result of a learning effect of
the tests, but there does not appear to be a deficit in gait or more conservative gait pattern that accumulated
over the season. A study looking at acute postural control effects after a simulated match load of rugby
impacts also suggested no changes following subconcussive impacts.47 The learning effect is likely more
noticeable in our study as we had athletes complete the protocol multiple times in a season, and many
participate in multiple seasons. Other studies compared concussed athletes to controls,34,35 which reduces
the overall number of times an athlete would complete the dual-task protocol. Additionally, a season worth
of exercise and training in their sport may have also contributed to these numbers improving.
There were several limitations to this study. Namely, only one male post-concussion time point was
collected, making it impossible to generalize about males’ responses post-concussion, compare them to the
females at post-concussion, or compare them to males at baseline and post-season. Additionally, we did not
111
consider age, height, weight, or prior concussion history on the comparisons in our analysis. Although likely
the differences in sizes between males and females may contribute to the four gait variables, body mass
indices (BMIs) from the two groups are similar, and the dual-task cost normalizes performance in an
individual manner. The environment in which the tests were conducted were not always consistent. They
were conducted in the lab or the hallway, but sometimes the lab was busier than others, and the other
distractions may have confounded the subject’s attention. However, we chose not to check for accuracy of
these dual-task tests, because the divided attention should be enough to elucidate differences, their
performance on the MMSE should not matter. It has been shown that females prioritize the accuracy of
their answers over their gait, compared to their male counterparts.48
Although the results of this study are mixed, dual-task gait can be used to uncover functional deficits in
athletes who may be asymptomatic and do not exhibit neuropsychological dysfunction,45 but it is important
to use it in the context of other diagnostic tools. Dual-task gait assessment is especially relevant given the
implication of concussion on musculoskeletal injuries,49 and therefore should be incorporated into future
clinical assessments and sex-specific interventions post-concussion.
REFERENCES
1. McCrory, P., W. Meeuwisse, K. Johnston, J. Dvorak, M. Aubry, M. Molloy and R. Cantu. Consensus statement on concussion in sport 3rd international conference on concussion in sport held in Zurich, November 2008. Clinical Journal of Sport Medicine. 19(3):185-200, 2009.
2. Broglio, S. P. and T. W. Puetz. The effect of sport concussion on neurocognitive function, self-report symptoms and postural control. Sports Medicine. 38(1):53-67, 2008.
3. Howell, D. R., L. R. Osternig and L.-S. Chou. Dual-task effect on gait balance control in adolescents with concussion. Archives of Physical Medicine and Rehabilitation. 94(8):1513-20, 2013.
4. Fait, P., B. Swaine, J.-F. Cantin, J. Leblond and B. J. McFadyen. Altered integrated locomotor and cognitive function in elite athletes 30 days postconcussion: A preliminary study. The Journal of Head Trauma Rehabilitation. 28(4):293-301, 2013.
5. Baker, C. S. and M. E. Cinelli. Visuomotor deficits during locomotion in previously concussed athletes 30 or more days following return to play. Physiological reports. 2(12):e12252, 2014.
6. Buckley, T. A., S. Vallabhajosula, J. R. Oldham, B. A. Munkasy, K. M. Evans, D. A. Krazeise, C. J. Ketcham and E. E. Hall. Evidence of a conservative gait strategy in athletes with a history of concussions. Journal of Sport and Health Science. 5(4):417-23, 2016.
7. Howell, D. R., J. Oldham, C. Lanois, I. Koerte, A. P. Lin, B. Berkstresser, F. Wang and W. P. Meehan, 3rd. Dual-task gait recovery after concussion among female and male collegiate athletes. Medicine & Science in Sports & Exercise. 52(5):1015-21, 2020.
8. Ross, L. M., J. K. Register-Mihalik, J. P. Mihalik, K. L. McCulloch, W. E. Prentice, E. W. Shields and K. M. Guskiewicz. Effects of a single-task versus a dual-task paradigm on cognition and balance in healthy subjects. Journal of Sport Rehabilitation. 20(3):296-310, 2011.
9. Vallabhajosula, S., C. W. Tan, M. Mukherjee, A. J. Davidson and N. Stergiou. Biomechanical analyses of stair-climbing while dual-tasking. Journal of Biomechanics. 48(6):921-9, 2015.
10. McCulloch, K. Attention and dual-task conditions: Physical therapy implications for individuals with acquired brain injury. Journal of Neurologic Physical Therapy. 31(3):104-18, 2007.
112
11. Parker, T. M., L. R. Osternig, P. Van Donkelaar and L.-S. Chou. Gait stability following concussion. Medicine & Science in Sports & Exercise. 38(6):1032-40, 2006.
12. Martini, D. N., M. J. Sabin, S. A. DePesa, E. W. Leal, T. N. Negrete, J. J. Sosnoff and S. P. Broglio. The chronic effects of concussion on gait. Archives of Physical Medicine and Rehabilitation. 92(4):585-9, 2011.
13. Belanger, H. G. and R. D. Vanderploeg. The neuropsychological impact of sports-related concussion: A meta-analysis. Journal of the International Neuropsychological Society. 11(4):345-57, 2005.
14. Meehan III, W. P., P. d’Hemecourt, C. L. Collins and R. D. Comstock. Assessment and management of sport-related concussions in united states high schools. The American Journal of Sports Medicine. 39(11):2304-10, 2011.
15. Parker, T. M., L. R. Osternig, V. A. N. D. P and L. S. Chou. Gait stability following concussion. Medicine & Science in Sports & Exercise. 38(6):1032-40, 2006.
16. Valovich, T. C., D. H. Perrin and B. M. Gansneder. Repeat administration elicits a practice effect with the balance error scoring system but not with the standardized assessment of concussion in high school athletes. Journal of Athletic Training. 38(1):51, 2003.
17. Rahn, C., B. A. Munkasy, A. B. Joyner and T. A. Buckley. Sideline performance of the balance error scoring system during a live sporting event. Clinical Journal of Sport Medicine: official journal of the Canadian Academy of Sport Medicine. 25(3):248, 2015.
18. Quatman-Yates, C. C., M. S. Bonnette, J. A. Hugentobler, M. B. Médé, A. W. Kiefer, B. G. Kurowski and M. A. Riley. Postconcussion postural sway variability changes in youth: The benefit of structural variability analyses. Pediatric physical therapy: the official publication of the Section on Pediatrics of the American Physical Therapy Association. 27(4):316, 2015.
19. Howell, D., L. Osternig and L.-S. Chou. Monitoring recovery of gait balance control following concussion using an accelerometer. Journal of Biomechanics. 48(12):3364-8, 2015.
20. Mancini, M., L. King, A. Salarian, L. Holmstrom, J. McNames and F. B. Horak. Mobility lab to assess balance and gait with synchronized body-worn sensors. Journal of Bioengineering and Biomedical Science. Suppl 1(007, 2011.
21. Howell, D. R., J. R. Oldham, M. DiFabio, S. Vallabhajosula, E. E. Hall, C. J. Ketcham, W. P. Meehan and T. A. Buckley. Single-task and dual-task gait among collegiate athletes of different sport classifications: Implications for concussion management. Journal of Applied Biomechanics. 33(1):24-31, 2017.
22. McCrory, P., W. H. Meeuwisse, M. Aubry, R. C. Cantu, J. Dvořák, R. J. Echemendia, L. Engebretsen, K. Johnston, J. S. Kutcher, M. Raftery, A. Sills, B. W. Benson, G. A. Davis, R. Ellenbogen, K. M. Guskiewicz, S. A. Herring, G. L. Iverson, B. D. Jordan, J. Kissick, M. McCrea, A. S. McIntosh, D. Maddocks, M. Makdissi, L. Purcell, M. Putukian, K. Schneider, C. H. Tator and M. Turner. Consensus statement on concussion in sport: The 4th international conference on concussion in sport, Zurich, November 2012. Journal of Athletic Training. 48(4):554-75, 2013.
23. Ponta, M., M. Gozza, J. Giacinto, R. Gradaschi and G. Adami. Effects of obesity on posture and walking: Study prior to and following surgically induced weight loss. Obesity surgery. 24(11):1915-20, 2014.
24. Evans, K., C. Ketcham, S. Folger, S. Vallabhajosula and E. Hall. Relationship between information processing and postural stability in collegiate division i ncaa athletes: Does concussion history matter. International Journal of Physical Medicine and Rehabilitation. 3(2):268, 2015.
25. Kerrigan, D. C., M. K. Todd and U. C. Della. Gender differences in joint biomechanics during walking: Normative study in young adults. American Journal of Physical Medicine & Rehabilitation. 77(1):2-7, 1998.
26. Kontos, A. P., R. Elbin, P. Schatz, T. Covassin, L. Henry, J. Pardini and M. W. Collins. A revised factor structure for the post-concussion symptom scale: Baseline and postconcussion factors. The American Journal of Sports Medicine. 40(10):2375-84, 2012.
113
27. Miller, J. H., C. Gill, E. N. Kuhn, B. G. Rocque, J. Y. Menendez, J. A. O'Neill, B. S. Agee, S. T. Brown, M. Crowther and R. D. Davis. Predictors of delayed recovery following pediatric sports-related concussion: A case-control study. Journal of Neurosurgery: Pediatrics. 17(4):491-6, 2016.
28. Howell, D. R., L. R. Osternig, M. C. Koester and L. S. Chou. The effect of cognitive task complexity on gait stability in adolescents following concussion. Experimental Brain Research. 232(6):1773-82, 2014.
29. Catena, R. D., P. van Donkelaar and L. S. Chou. Altered balance control following concussion is better detected with an attention test during gait. Gait Posture. 25(3):406-11, 2007.
30. Folstein, M. F., S. E. Folstein and P. R. McHugh. "Mini-mental state". A practical method for grading the cognitive state of patients for the clinician. Journal of Psychiatric Research. 12(3):189-98, 1975.
31. Meagher, J., M. Leonard, L. Donoghue, N. O'Regan, S. Timmons, C. Exton, W. Cullen, C. Dunne, D. Adamis, A. J. Maclullich and D. Meagher. Months backward test: A review of its use in clinical studies. World Journal of Psychiatry. 5(3):305-14, 2015.
32. Guskiewicz, K. M., J. Register-Mihalik, P. McCrory, M. McCrea, K. Johnston, M. Makdissi, J. Dvorak, G. Davis and W. Meeuwisse. Evidence-based approach to revising the SCAT2: Introducing the SCAT3. British Journal of Sports Medicine. 47(5):289-93, 2013.
33. Mancini, M., A. Salarian, P. Carlson-Kuhta, C. Zampieri, L. King, L. Chiari and F. B. Horak. Isway: A sensitive, valid and reliable measure of postural control. J Neuroeng Rehabil. 9(59, 2012.
34. Howell, D. R., A. Stracciolini, E. Geminiani and W. P. Meehan. Dual-task gait differences in female and male adolescents following sport-related concussion. Gait & Posture. 54(284-9, 2017.
35. Fino, P. C. A preliminary study of longitudinal differences in local dynamic stability between recently concussed and healthy athletes during single and dual-task gait. Journal of Biomechanics. 49(9):1983-8, 2016.
36. Stoet, G., D. B. O’Connor, M. Conner and K. R. Laws. Are women better than men at multi-tasking? BMC Psychology. 1(1):1-10, 2013.
37. Howell, D. R., M. J. O'Brien, A. Raghuram, A. S. Shah and W. P. Meehan III. Near point of convergence and gait deficits in adolescents after sport-related concussion. Clinical Journal of Sport Medicine. 28(3):262-7, 2018.
38. Buckley, T. A., B. A. Munkasy, T. G. Tapia-Lovler and E. A. Wikstrom. Altered gait termination strategies following a concussion. Gait & Posture. 38(3):549-51, 2013.
39. Howell, D. R., M. Beasley, L. Vopat and W. P. Meehan III. The effect of prior concussion history on dual-task gait following a concussion. Journal of Neurotrauma. 34(4):838-44, 2017.
40. Howell, D. R., T. A. Buckley, R. C. Lynall and W. P. Meehan III. Worsening dual-task gait costs after concussion and their association with subsequent sport-related injury. Journal of Neurotrauma. 35(14):1630-6, 2018.
41. Howell, D. R., A. Brilliant, B. Berkstresser, F. Wang, J. Fraser and W. P. Meehan III. The association between dual-task gait after concussion and prolonged symptom duration. Journal of Neurotrauma. 34(23):3288-94, 2017.
42. Cossette, I., M.-È. Gagné, M.-C. Ouellet, P. Fait, I. Gagnon, K. Sirois, S. Blanchet, N. Le Sage and B. J. McFadyen. Executive dysfunction following a mild traumatic brain injury revealed in early adolescence with locomotor-cognitive dual-tasks. Brain Injury. 30(13-14):1648-55, 2016.
43. Johnson, B., K. Zhang, M. Gay, S. Horovitz, M. Hallett, W. Sebastianelli and S. Slobounov. Alteration of brain default network in subacute phase of injury in concussed individuals: Resting-state fmri study. NeuroImage. 59(1):511-8, 2012.
44. Yogev-Seligmann, G., J. M. Hausdorff and N. Giladi. The role of executive function and attention in gait. Movement Disorders. 23(3):329-42, 2008.
45. Imaging “brain strain” in youth athletes with mild traumatic brain injury during dual-task performance. Journal of Neurotrauma. 31(22):1843-59, 2014.
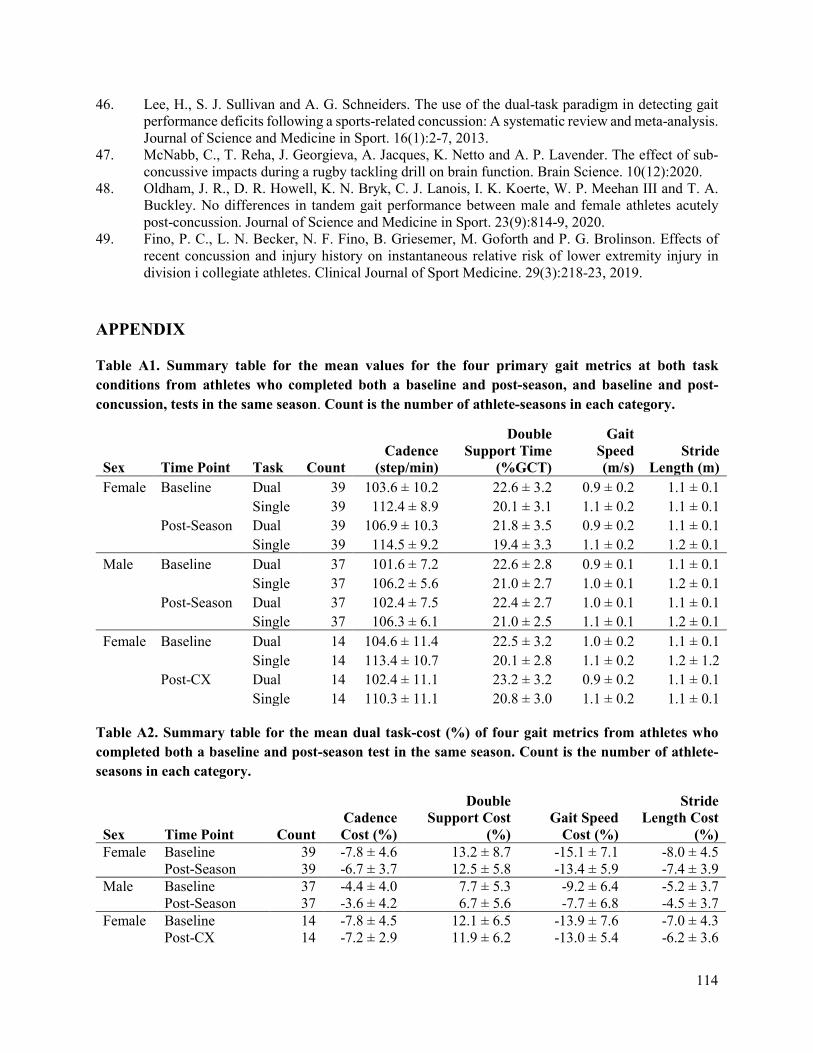
114
46. Lee, H., S. J. Sullivan and A. G. Schneiders. The use of the dual-task paradigm in detecting gait performance deficits following a sports-related concussion: A systematic review and meta-analysis. Journal of Science and Medicine in Sport. 16(1):2-7, 2013.
47. McNabb, C., T. Reha, J. Georgieva, A. Jacques, K. Netto and A. P. Lavender. The effect of sub-concussive impacts during a rugby tackling drill on brain function. Brain Science. 10(12):2020.
48. Oldham, J. R., D. R. Howell, K. N. Bryk, C. J. Lanois, I. K. Koerte, W. P. Meehan III and T. A. Buckley. No differences in tandem gait performance between male and female athletes acutely post-concussion. Journal of Science and Medicine in Sport. 23(9):814-9, 2020.
49. Fino, P. C., L. N. Becker, N. F. Fino, B. Griesemer, M. Goforth and P. G. Brolinson. Effects of recent concussion and injury history on instantaneous relative risk of lower extremity injury in division i collegiate athletes. Clinical Journal of Sport Medicine. 29(3):218-23, 2019.
APPENDIX
Table A1. Summary table for the mean values for the four primary gait metrics at both task conditions from athletes who completed both a baseline and post-season, and baseline and post-concussion, tests in the same season. Count is the number of athlete-seasons in each category.
Sex Time Point Task Count Cadence
(step/min)
Double Support Time
(%GCT)
Gait Speed (m/s)
Stride Length (m)
Female Baseline Dual 39 103.6 ± 10.2 22.6 ± 3.2 0.9 ± 0.2 1.1 ± 0.1 Single 39 112.4 ± 8.9 20.1 ± 3.1 1.1 ± 0.2 1.1 ± 0.1 Post-Season Dual 39 106.9 ± 10.3 21.8 ± 3.5 0.9 ± 0.2 1.1 ± 0.1 Single 39 114.5 ± 9.2 19.4 ± 3.3 1.1 ± 0.2 1.2 ± 0.1 Male Baseline Dual 37 101.6 ± 7.2 22.6 ± 2.8 0.9 ± 0.1 1.1 ± 0.1 Single 37 106.2 ± 5.6 21.0 ± 2.7 1.0 ± 0.1 1.2 ± 0.1 Post-Season Dual 37 102.4 ± 7.5 22.4 ± 2.7 1.0 ± 0.1 1.1 ± 0.1 Single 37 106.3 ± 6.1 21.0 ± 2.5 1.1 ± 0.1 1.2 ± 0.1 Female Baseline Dual 14 104.6 ± 11.4 22.5 ± 3.2 1.0 ± 0.2 1.1 ± 0.1 Single 14 113.4 ± 10.7 20.1 ± 2.8 1.1 ± 0.2 1.2 ± 1.2 Post-CX Dual 14 102.4 ± 11.1 23.2 ± 3.2 0.9 ± 0.2 1.1 ± 0.1 Single 14 110.3 ± 11.1 20.8 ± 3.0 1.1 ± 0.2 1.1 ± 0.1
Table A2. Summary table for the mean dual task-cost (%) of four gait metrics from athletes who completed both a baseline and post-season test in the same season. Count is the number of athlete-seasons in each category.
Sex Time Point Count Cadence Cost (%)
Double Support Cost
(%) Gait Speed
Cost (%)
Stride Length Cost
(%) Female Baseline 39 -7.8 ± 4.6 13.2 ± 8.7 -15.1 ± 7.1 -8.0 ± 4.5 Post-Season 39 -6.7 ± 3.7 12.5 ± 5.8 -13.4 ± 5.9 -7.4 ± 3.9 Male Baseline 37 -4.4 ± 4.0 7.7 ± 5.3 -9.2 ± 6.4 -5.2 ± 3.7 Post-Season 37 -3.6 ± 4.2 6.7 ± 5.6 -7.7 ± 6.8 -4.5 ± 3.7 Female Baseline 14 -7.8 ± 4.5 12.1 ± 6.5 -13.9 ± 7.6 -7.0 ± 4.3 Post-CX 14 -7.2 ± 2.9 11.9 ± 6.2 -13.0 ± 5.4 -6.2 ± 3.6
115
CHAPTER 8: CONCUSSION CASE REPORTS IN COLLEGIATE MEN’S
AND WOMEN’S RUGBY: CONSIDERATIONS FOR FUTURE DATA
COLLECTION
ABSTRACT
The previous on-field data collection has worked to quantify concussion biomechanics, based mostly in
helmeted, male athletes. Data from unhelmeted and female athletes still needs to be collected and quantified
to understand how concussion tolerance varies amongst these populations. Pairing clinical data with
biomechanics allows research to more holistically understand the negative effects of head impact exposure
on other domains of an athlete’s health. The goal of this study was to instrument collegiate rugby players
with head impact sensors embedded in mouthguards and to report concussive biomechanics with symptom
presentation and dual-task gait changes from pre-season to post-concussion. Over four seasons of data
collection, four males and 15 females sustained suspected concussions. We did not require a clinical
diagnosis in attempt to reduce underreporting. Kinematics were collected for two of the males’ concussions
and three of the females’ due to different challenges with the instrumentation. A post-concussion symptom
survey was collected after each, and corresponding gait data were collected in most cases. Not enough data
were collected to generalize about sex-specific or unhelmeted athlete concussion tolerance, but the
following reports may provide foundational and reference cases for future work.
Keywords: Concussion, Female, Linear Acceleraion, Rotational Velocity
INTRODUCTION
On-field data collection in contact sport athletes presents a unique opportunity to study human tolerance to
brain injury.1 By non-invasively measuring skull acceleration and velocity, researchers are able to correlate
impacts to the inertial response of the brain. The basis of on-field data collection comes from mounted
accelerometer arrays in the helmets of male football players.2-6 These helmet-mounted sensors helped
researchers understand the head impact tolerance of elite male athletes and build concussion risk functions
to predict injury.7 However females are underrepresented in concussion research, despite plenty of evidence
suggesting that presentation and outcome of concussion is sex-specific.8-13 These differences are likely due
to a combination of biomechanical, physiologic, and psychosocial factors that vary between female and
male populations. Since females have smaller heads and weaker necks, it has been suggested that they are
more likely to experience greater head accelerations for a given impact than males, thus increasing
concussion risk.14-17 From a physiologic standpoint, hormonal differences between sexes, where estrogen
116
and progesterone act as neuroprotectants, may contribute to the differences in presentation, outcome, and
tolerance of concussion.12,18,19 Moreover, studies have pointed to psychosocial factors that lead females to
be more honest in reporting concussions due to concerns about the effects of injury on their future health
and males less likely to report concussions due to cultural tendencies which encourage male athletes to play
despite injuries.8,14,20
The lack of female biomechanical data is partially due to the amount of research on football and the ability
to instrument helmets with relative ease. As the sensor market progressed, smaller sensors that could be
worn independently of a helmet were developed, allowing populations like females and unhelmeted athletes
to be studied. By comparing real-world biomechanical data with clinical outcomes, concussion tolerance
can be better understood. The mechanics of concussions are still unknown due to the variability in subject
population, type of sensor used and the need for large datasets to make conclusions on concussive
thresholds.5
Rugby is an ideal population to study, as it is a contact sport with a high exposure to head impact and
concussion, is played by the same rules for both sexes, and does not require the use of protective headgear.21-
24 The objective of this study is to report concussions in collegiate rugby players and their corresponding
symptom presentation and changes in gait that we observed over a two year study. Not enough concussive
biomechanics were captured for a concussion-specific analysis, but there is still value in sharing and making
these data available for researchers to use in the future.
METHODS
Subjects
A total of 107 male-seasons (age: 20.6 ± 1.3 years, height: 70.7 ± 3.0 in, weight: 197.0 ± 34.3 lbs) and 114
females-seasons (age: 20.6 ± 1.3 years, height: 65.3 ± 3.1 in, weight: 162.3 ± 38.7 lbs) from the Virginia
Tech men’s and women’s club rugby team participated in the study which was conducted from Fall 2018 –
Spring 2020. All participants provided written informed consent in this study approved by the Virginia
Tech Institutional Review Board (IRB).
Biomechanical Data
Each athlete was instrumented with a custom-fit mouthguard that housed linear accelerometers and angular
rate sensors to measure head kinematics with six degrees of freedom. The athletes wore their mouthguards
for each game and contact practice. The Prevent Biometrics Impact Monitoring Mouthguard and Wake
Forest mouthguard (Figure 8.1) have both been validated in laboratory testing.25-27
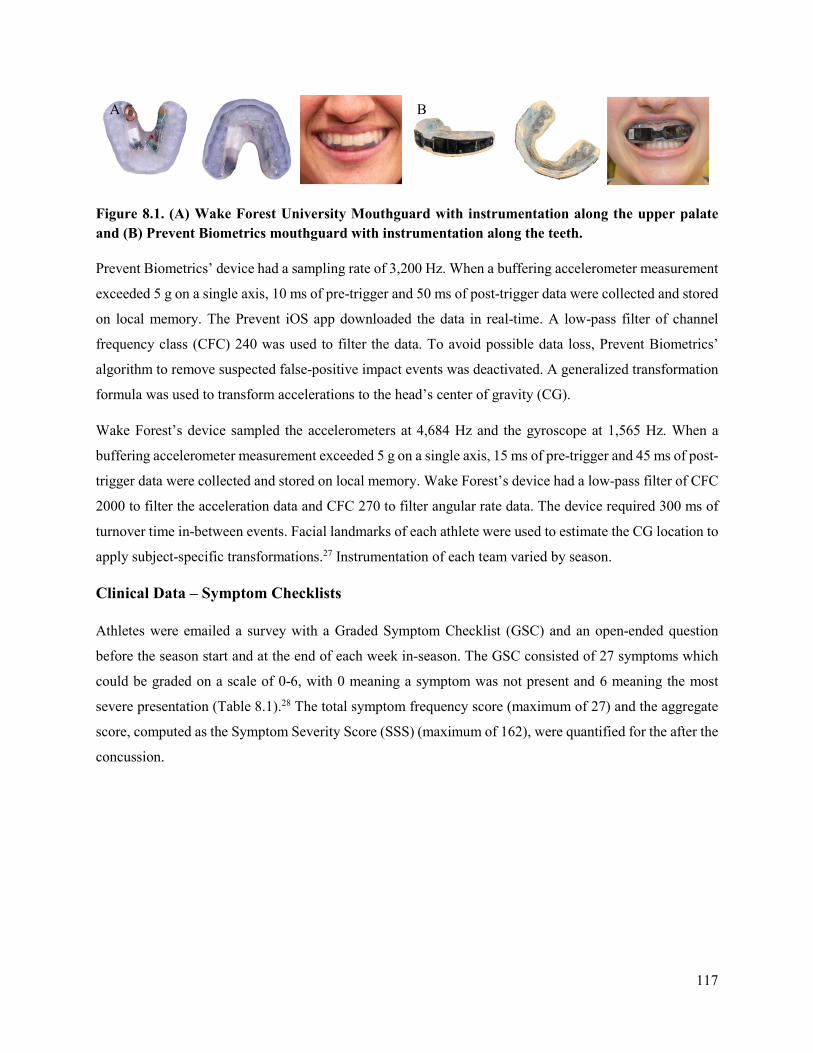
117
Figure 8.1. (A) Wake Forest University Mouthguard with instrumentation along the upper palate and (B) Prevent Biometrics mouthguard with instrumentation along the teeth.
Prevent Biometrics’ device had a sampling rate of 3,200 Hz. When a buffering accelerometer measurement
exceeded 5 g on a single axis, 10 ms of pre-trigger and 50 ms of post-trigger data were collected and stored
on local memory. The Prevent iOS app downloaded the data in real-time. A low-pass filter of channel
frequency class (CFC) 240 was used to filter the data. To avoid possible data loss, Prevent Biometrics’
algorithm to remove suspected false-positive impact events was deactivated. A generalized transformation
formula was used to transform accelerations to the head’s center of gravity (CG).
Wake Forest’s device sampled the accelerometers at 4,684 Hz and the gyroscope at 1,565 Hz. When a
buffering accelerometer measurement exceeded 5 g on a single axis, 15 ms of pre-trigger and 45 ms of post-
trigger data were collected and stored on local memory. Wake Forest’s device had a low-pass filter of CFC
2000 to filter the acceleration data and CFC 270 to filter angular rate data. The device required 300 ms of
turnover time in-between events. Facial landmarks of each athlete were used to estimate the CG location to
apply subject-specific transformations.27 Instrumentation of each team varied by season.
Clinical Data – Symptom Checklists
Athletes were emailed a survey with a Graded Symptom Checklist (GSC) and an open-ended question
before the season start and at the end of each week in-season. The GSC consisted of 27 symptoms which
could be graded on a scale of 0-6, with 0 meaning a symptom was not present and 6 meaning the most
severe presentation (Table 8.1).28 The total symptom frequency score (maximum of 27) and the aggregate
score, computed as the Symptom Severity Score (SSS) (maximum of 162), were quantified for the after the
concussion.
A B
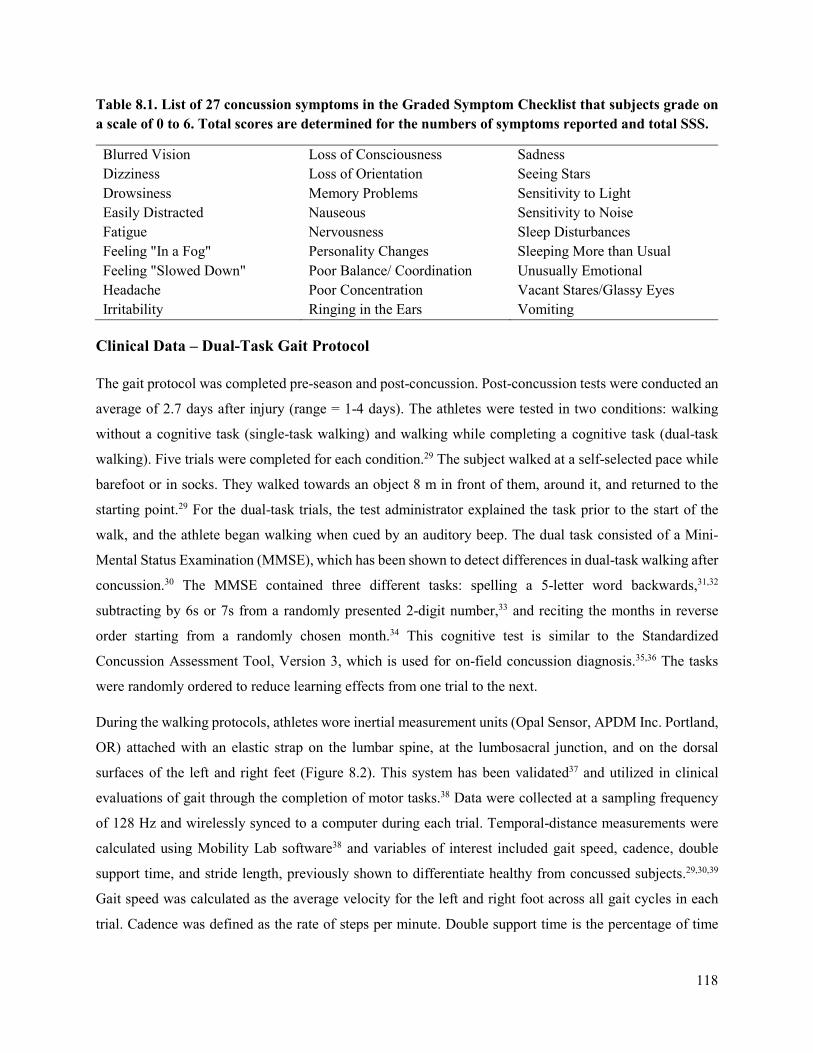
118
Table 8.1. List of 27 concussion symptoms in the Graded Symptom Checklist that subjects grade on a scale of 0 to 6. Total scores are determined for the numbers of symptoms reported and total SSS.
Blurred Vision Loss of Consciousness Sadness Dizziness Loss of Orientation Seeing Stars Drowsiness Memory Problems Sensitivity to Light Easily Distracted Nauseous Sensitivity to Noise Fatigue Nervousness Sleep Disturbances Feeling "In a Fog" Personality Changes Sleeping More than Usual Feeling "Slowed Down" Poor Balance/ Coordination Unusually Emotional Headache Poor Concentration Vacant Stares/Glassy Eyes Irritability Ringing in the Ears Vomiting
Clinical Data – Dual-Task Gait Protocol
The gait protocol was completed pre-season and post-concussion. Post-concussion tests were conducted an
average of 2.7 days after injury (range = 1-4 days). The athletes were tested in two conditions: walking
without a cognitive task (single-task walking) and walking while completing a cognitive task (dual-task
walking). Five trials were completed for each condition.29 The subject walked at a self-selected pace while
barefoot or in socks. They walked towards an object 8 m in front of them, around it, and returned to the
starting point.29 For the dual-task trials, the test administrator explained the task prior to the start of the
walk, and the athlete began walking when cued by an auditory beep. The dual task consisted of a Mini-
Mental Status Examination (MMSE), which has been shown to detect differences in dual-task walking after
concussion.30 The MMSE contained three different tasks: spelling a 5-letter word backwards,31,32
subtracting by 6s or 7s from a randomly presented 2-digit number,33 and reciting the months in reverse
order starting from a randomly chosen month.34 This cognitive test is similar to the Standardized
Concussion Assessment Tool, Version 3, which is used for on-field concussion diagnosis.35,36 The tasks
were randomly ordered to reduce learning effects from one trial to the next.
During the walking protocols, athletes wore inertial measurement units (Opal Sensor, APDM Inc. Portland,
OR) attached with an elastic strap on the lumbar spine, at the lumbosacral junction, and on the dorsal
surfaces of the left and right feet (Figure 8.2). This system has been validated37 and utilized in clinical
evaluations of gait through the completion of motor tasks.38 Data were collected at a sampling frequency
of 128 Hz and wirelessly synced to a computer during each trial. Temporal-distance measurements were
calculated using Mobility Lab software38 and variables of interest included gait speed, cadence, double
support time, and stride length, previously shown to differentiate healthy from concussed subjects.29,30,39
Gait speed was calculated as the average velocity for the left and right foot across all gait cycles in each
trial. Cadence was defined as the rate of steps per minute. Double support time is the percentage of time
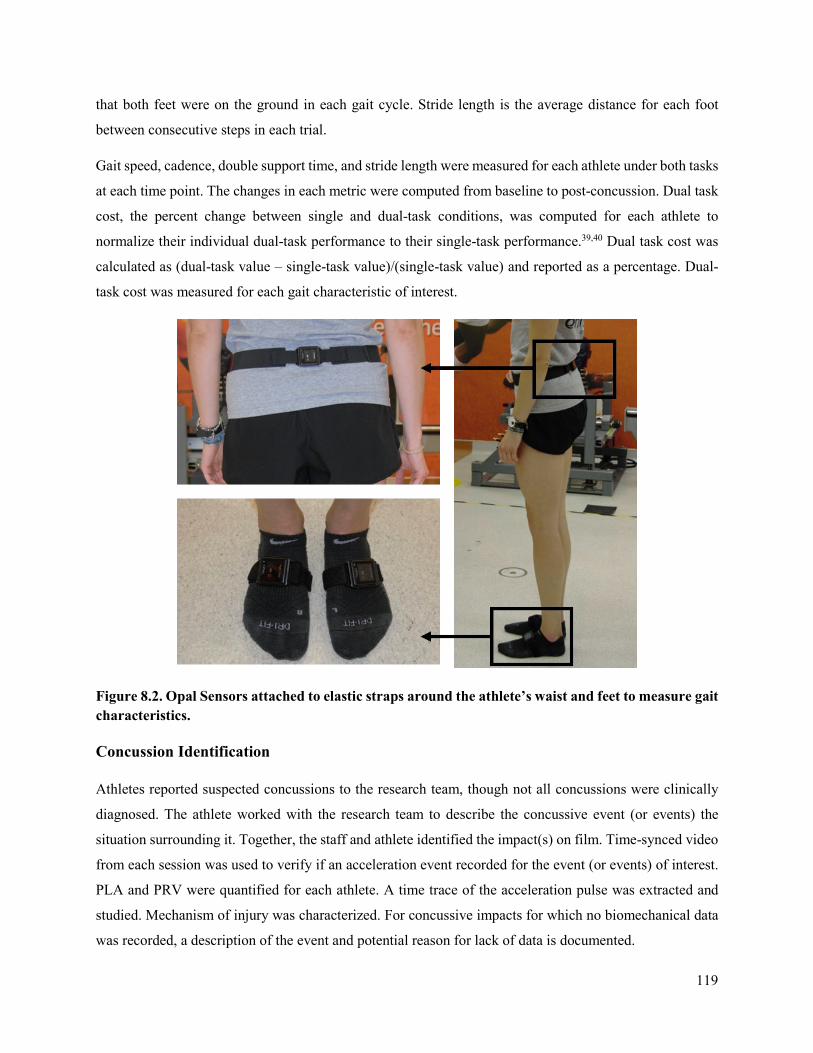
119
that both feet were on the ground in each gait cycle. Stride length is the average distance for each foot
between consecutive steps in each trial.
Gait speed, cadence, double support time, and stride length were measured for each athlete under both tasks
at each time point. The changes in each metric were computed from baseline to post-concussion. Dual task
cost, the percent change between single and dual-task conditions, was computed for each athlete to
normalize their individual dual-task performance to their single-task performance.39,40 Dual task cost was
calculated as (dual-task value – single-task value)/(single-task value) and reported as a percentage. Dual-
task cost was measured for each gait characteristic of interest.
Figure 8.2. Opal Sensors attached to elastic straps around the athlete’s waist and feet to measure gait characteristics.
Concussion Identification
Athletes reported suspected concussions to the research team, though not all concussions were clinically
diagnosed. The athlete worked with the research team to describe the concussive event (or events) the
situation surrounding it. Together, the staff and athlete identified the impact(s) on film. Time-synced video
from each session was used to verify if an acceleration event recorded for the event (or events) of interest.
PLA and PRV were quantified for each athlete. A time trace of the acceleration pulse was extracted and
studied. Mechanism of injury was characterized. For concussive impacts for which no biomechanical data
was recorded, a description of the event and potential reason for lack of data is documented.

120
RESULTS
There were 4 male concussions and 15 female concussions (Table 8.2). One male sustained two concussions
(M-2 and M-3), and one female sustained two concussions (F-8 and F-13) (both in different seasons). This
corresponded to 3.7% of male athlete-seasons concussed, and 13.2% of female athlete-seasons concussed.
Three of the men’s concussions were clinically diagnosed, and the fourth (M-3) was not reported to a
clinician because it was during the last minutes of the last game of the season. Nine of the women’s
concussions were reported to clinical staff. This corresponds to 25% of the male concussions and 40% of
the female concussions as unreported. Three of the females (F-4, F-7, and F-12) identified two impacts as
the cause of the concussion, and were only tested after sustaining the second one. The most common reason
for not reporting a potential concussion to clinical staff was that the athlete wanted to play in the next game.
Biomechanical data were collected for two male concussions and three female concussions. Data are
missing for a variety of reasons: a false negative impact, mouthguard died, mouthguard would not connect
to Bluetooth, mouthguard settings were not correct, mouthguard failure, and that the impact before
happened in too close of a time window, and the impact of interest occurred in the turnover time.
The median number of symptoms reported was 17 (range: 3-24) for women and the 10.5 (range: 6-14) for
men. The median SSS reported was 27 (range: 5-95) for women and the 15 (range: 9-25) for men. Most
athletes showed a decrease in cadence, gait speed, and stride length, and an increase in double support time
post-concussion (Table 8.3).
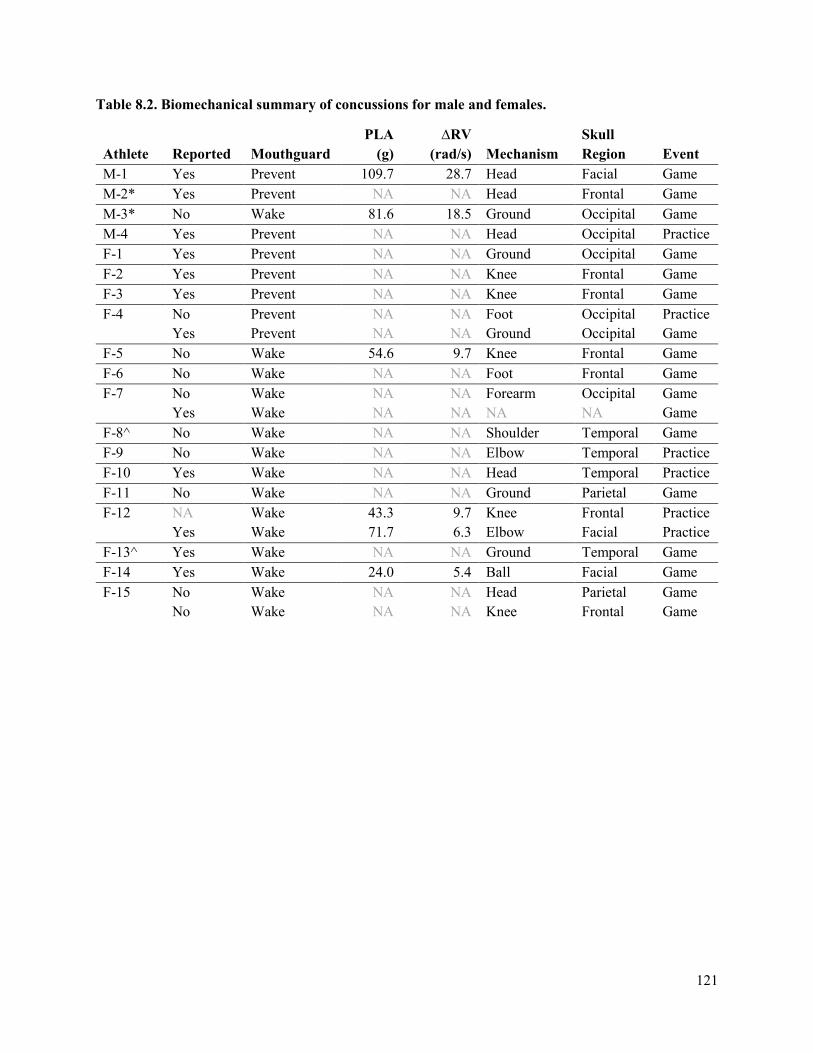
121
Table 8.2. Biomechanical summary of concussions for male and females.
Athlete Reported Mouthguard PLA
(g) ∆RV
(rad/s) Mechanism Skull Region Event
M-1 Yes Prevent 109.7 28.7 Head Facial Game M-2* Yes Prevent NA NA Head Frontal Game M-3* No Wake 81.6 18.5 Ground Occipital Game M-4 Yes Prevent NA NA Head Occipital Practice F-1 Yes Prevent NA NA Ground Occipital Game F-2 Yes Prevent NA NA Knee Frontal Game F-3 Yes Prevent NA NA Knee Frontal Game F-4 No Prevent NA NA Foot Occipital Practice
Yes Prevent NA NA Ground Occipital Game F-5 No Wake 54.6 9.7 Knee Frontal Game F-6 No Wake NA NA Foot Frontal Game F-7 No Wake NA NA Forearm Occipital Game
Yes Wake NA NA NA NA Game F-8^ No Wake NA NA Shoulder Temporal Game F-9 No Wake NA NA Elbow Temporal Practice F-10 Yes Wake NA NA Head Temporal Practice F-11 No Wake NA NA Ground Parietal Game F-12 NA Wake 43.3 9.7 Knee Frontal Practice
Yes Wake 71.7 6.3 Elbow Facial Practice F-13^ Yes Wake NA NA Ground Temporal Game F-14 Yes Wake 24.0 5.4 Ball Facial Game F-15 No Wake NA NA Head Parietal Game
No Wake NA NA Knee Frontal Game
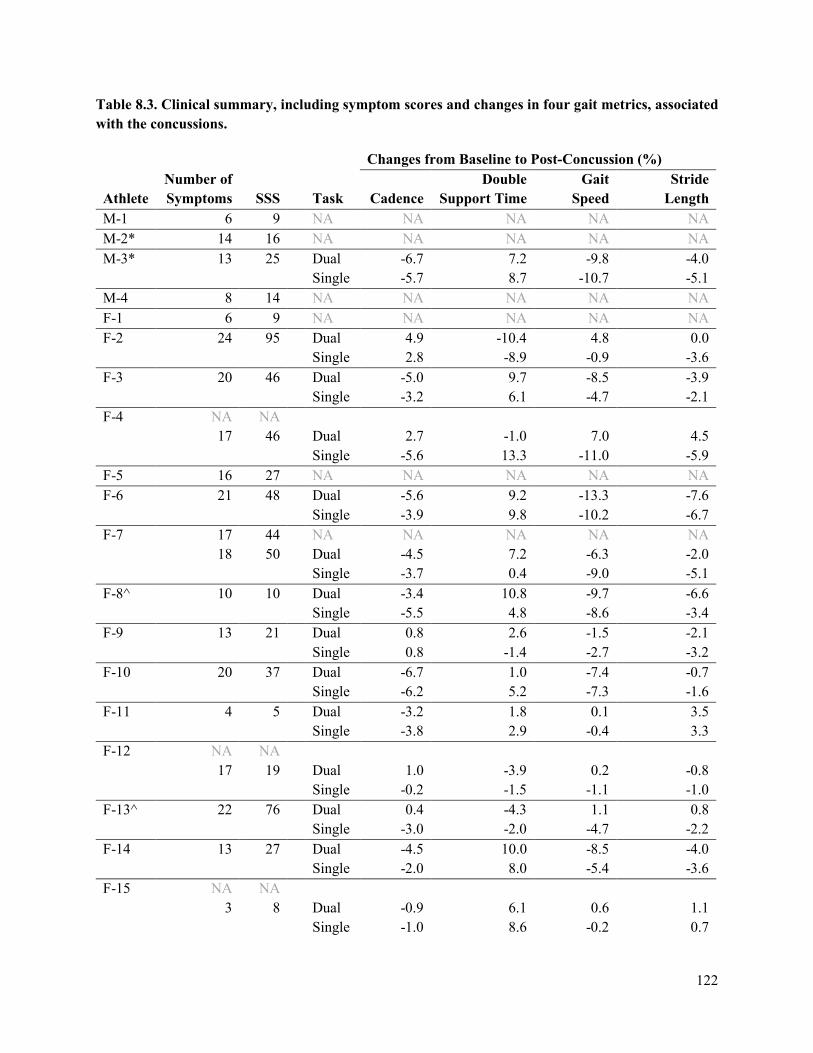
122
Table 8.3. Clinical summary, including symptom scores and changes in four gait metrics, associated with the concussions.
Changes from Baseline to Post-Concussion (%)
Athlete Number of Symptoms SSS
Task Cadence
Double Support Time
Gait Speed
Stride Length
M-1 6 9 NA NA NA NA NA M-2* 14 16 NA NA NA NA NA M-3* 13 25 Dual -6.7 7.2 -9.8 -4.0 Single -5.7 8.7 -10.7 -5.1 M-4 8 14 NA NA NA NA NA F-1 6 9 NA NA NA NA NA F-2 24 95 Dual 4.9 -10.4 4.8 0.0 Single 2.8 -8.9 -0.9 -3.6 F-3 20 46 Dual -5.0 9.7 -8.5 -3.9 Single -3.2 6.1 -4.7 -2.1 F-4 NA NA
17 46 Dual 2.7 -1.0 7.0 4.5 Single -5.6 13.3 -11.0 -5.9 F-5 16 27 NA NA NA NA NA F-6 21 48 Dual -5.6 9.2 -13.3 -7.6 Single -3.9 9.8 -10.2 -6.7 F-7 17 44 NA NA NA NA NA
18 50 Dual -4.5 7.2 -6.3 -2.0 Single -3.7 0.4 -9.0 -5.1 F-8^ 10 10 Dual -3.4 10.8 -9.7 -6.6 Single -5.5 4.8 -8.6 -3.4 F-9 13 21 Dual 0.8 2.6 -1.5 -2.1 Single 0.8 -1.4 -2.7 -3.2 F-10 20 37 Dual -6.7 1.0 -7.4 -0.7 Single -6.2 5.2 -7.3 -1.6 F-11 4 5 Dual -3.2 1.8 0.1 3.5 Single -3.8 2.9 -0.4 3.3 F-12 NA NA
17 19 Dual 1.0 -3.9 0.2 -0.8
Single -0.2 -1.5 -1.1 -1.0 F-13^ 22 76 Dual 0.4 -4.3 1.1 0.8 Single -3.0 -2.0 -4.7 -2.2 F-14 13 27 Dual -4.5 10.0 -8.5 -4.0 Single -2.0 8.0 -5.4 -3.6 F-15 NA NA
3 8 Dual -0.9 6.1 0.6 1.1
Single -1.0 8.6 -0.2 0.7
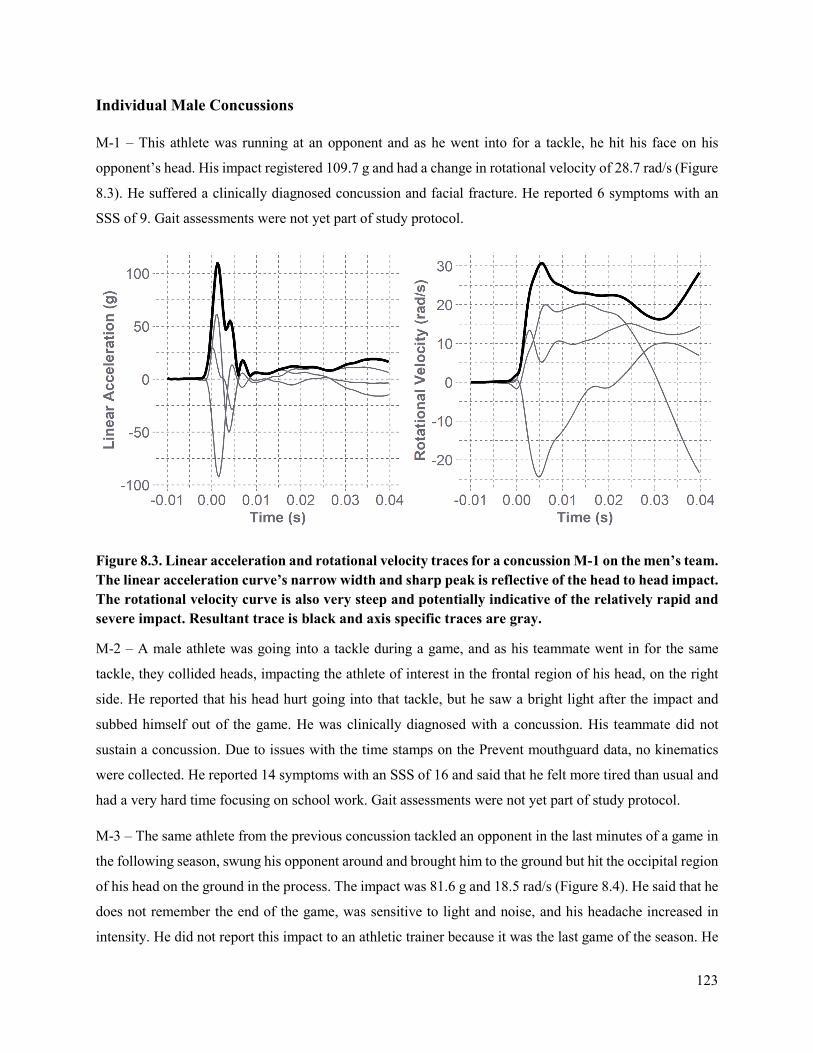
123
Individual Male Concussions
M-1 – This athlete was running at an opponent and as he went into for a tackle, he hit his face on his
opponent’s head. His impact registered 109.7 g and had a change in rotational velocity of 28.7 rad/s (Figure
8.3). He suffered a clinically diagnosed concussion and facial fracture. He reported 6 symptoms with an
SSS of 9. Gait assessments were not yet part of study protocol.
Figure 8.3. Linear acceleration and rotational velocity traces for a concussion M-1 on the men’s team. The linear acceleration curve’s narrow width and sharp peak is reflective of the head to head impact. The rotational velocity curve is also very steep and potentially indicative of the relatively rapid and severe impact. Resultant trace is black and axis specific traces are gray.
M-2 – A male athlete was going into a tackle during a game, and as his teammate went in for the same
tackle, they collided heads, impacting the athlete of interest in the frontal region of his head, on the right
side. He reported that his head hurt going into that tackle, but he saw a bright light after the impact and
subbed himself out of the game. He was clinically diagnosed with a concussion. His teammate did not
sustain a concussion. Due to issues with the time stamps on the Prevent mouthguard data, no kinematics
were collected. He reported 14 symptoms with an SSS of 16 and said that he felt more tired than usual and
had a very hard time focusing on school work. Gait assessments were not yet part of study protocol.
M-3 – The same athlete from the previous concussion tackled an opponent in the last minutes of a game in
the following season, swung his opponent around and brought him to the ground but hit the occipital region
of his head on the ground in the process. The impact was 81.6 g and 18.5 rad/s (Figure 8.4). He said that he
does not remember the end of the game, was sensitive to light and noise, and his headache increased in
intensity. He did not report this impact to an athletic trainer because it was the last game of the season. He
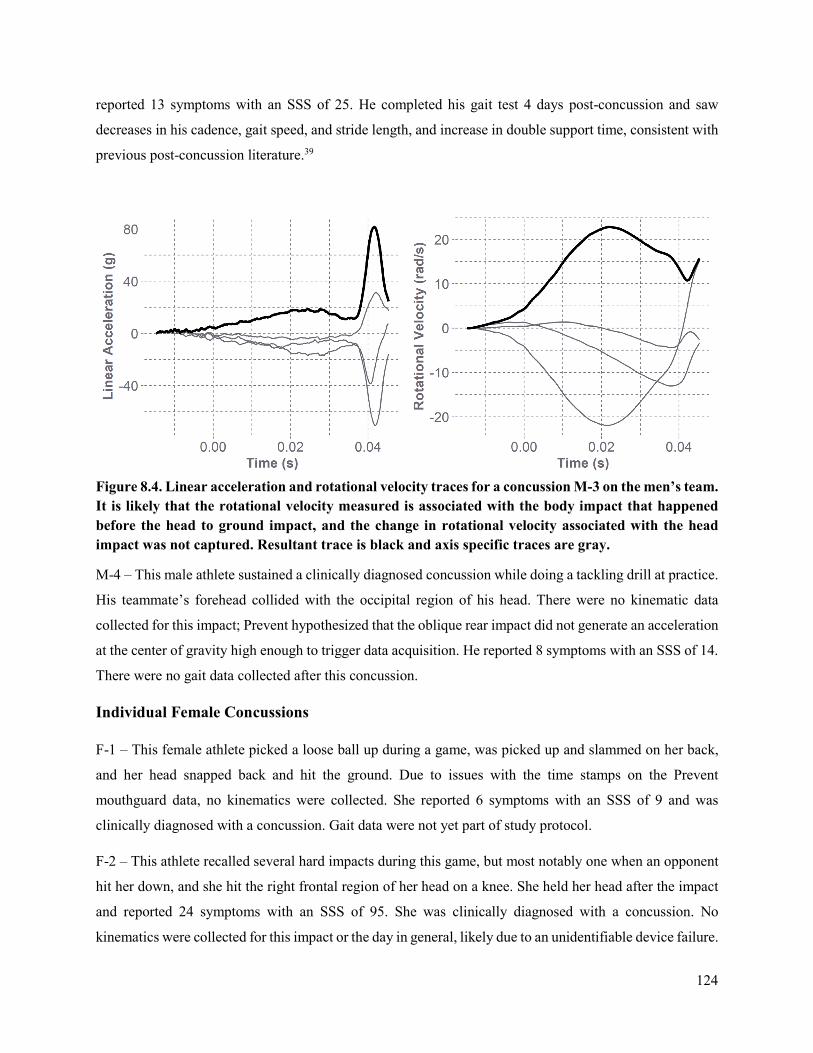
124
reported 13 symptoms with an SSS of 25. He completed his gait test 4 days post-concussion and saw
decreases in his cadence, gait speed, and stride length, and increase in double support time, consistent with
previous post-concussion literature.39
Figure 8.4. Linear acceleration and rotational velocity traces for a concussion M-3 on the men’s team. It is likely that the rotational velocity measured is associated with the body impact that happened before the head to ground impact, and the change in rotational velocity associated with the head impact was not captured. Resultant trace is black and axis specific traces are gray.
M-4 – This male athlete sustained a clinically diagnosed concussion while doing a tackling drill at practice.
His teammate’s forehead collided with the occipital region of his head. There were no kinematic data
collected for this impact; Prevent hypothesized that the oblique rear impact did not generate an acceleration
at the center of gravity high enough to trigger data acquisition. He reported 8 symptoms with an SSS of 14.
There were no gait data collected after this concussion.
Individual Female Concussions
F-1 – This female athlete picked a loose ball up during a game, was picked up and slammed on her back,
and her head snapped back and hit the ground. Due to issues with the time stamps on the Prevent
mouthguard data, no kinematics were collected. She reported 6 symptoms with an SSS of 9 and was
clinically diagnosed with a concussion. Gait data were not yet part of study protocol.
F-2 – This athlete recalled several hard impacts during this game, but most notably one when an opponent
hit her down, and she hit the right frontal region of her head on a knee. She held her head after the impact
and reported 24 symptoms with an SSS of 95. She was clinically diagnosed with a concussion. No
kinematics were collected for this impact or the day in general, likely due to an unidentifiable device failure.
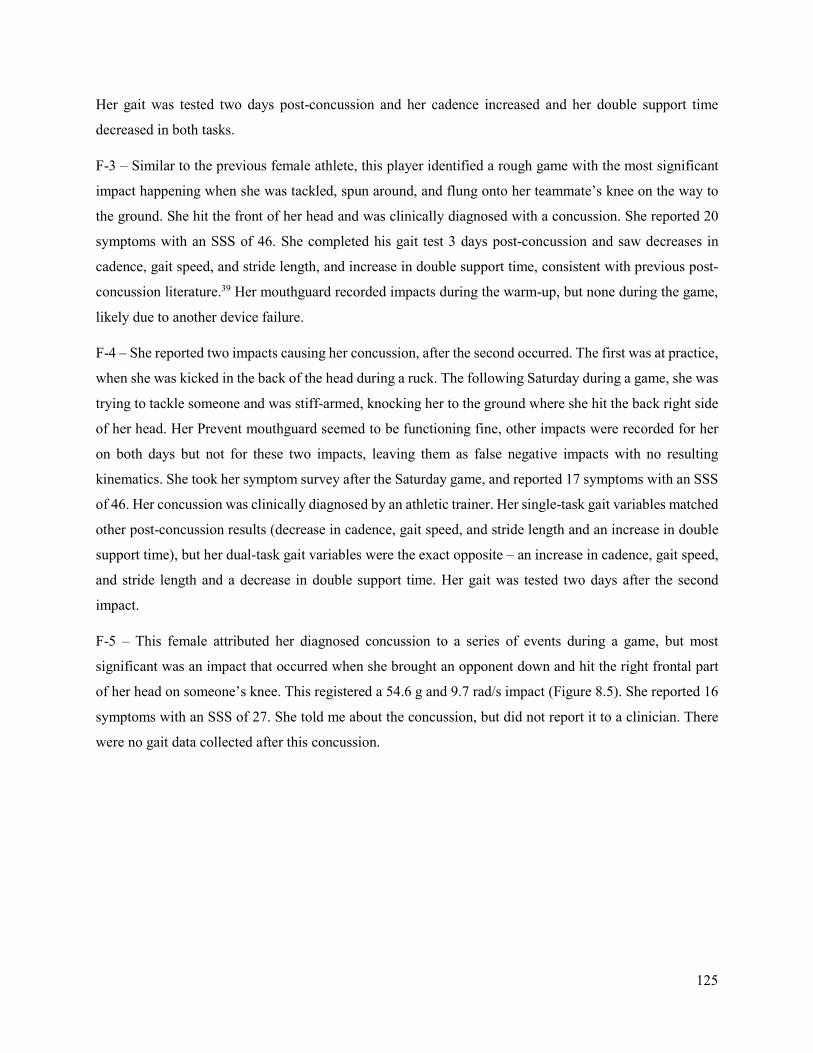
125
Her gait was tested two days post-concussion and her cadence increased and her double support time
decreased in both tasks.
F-3 – Similar to the previous female athlete, this player identified a rough game with the most significant
impact happening when she was tackled, spun around, and flung onto her teammate’s knee on the way to
the ground. She hit the front of her head and was clinically diagnosed with a concussion. She reported 20
symptoms with an SSS of 46. She completed his gait test 3 days post-concussion and saw decreases in
cadence, gait speed, and stride length, and increase in double support time, consistent with previous post-
concussion literature.39 Her mouthguard recorded impacts during the warm-up, but none during the game,
likely due to another device failure.
F-4 – She reported two impacts causing her concussion, after the second occurred. The first was at practice,
when she was kicked in the back of the head during a ruck. The following Saturday during a game, she was
trying to tackle someone and was stiff-armed, knocking her to the ground where she hit the back right side
of her head. Her Prevent mouthguard seemed to be functioning fine, other impacts were recorded for her
on both days but not for these two impacts, leaving them as false negative impacts with no resulting
kinematics. She took her symptom survey after the Saturday game, and reported 17 symptoms with an SSS
of 46. Her concussion was clinically diagnosed by an athletic trainer. Her single-task gait variables matched
other post-concussion results (decrease in cadence, gait speed, and stride length and an increase in double
support time), but her dual-task gait variables were the exact opposite – an increase in cadence, gait speed,
and stride length and a decrease in double support time. Her gait was tested two days after the second
impact.
F-5 – This female attributed her diagnosed concussion to a series of events during a game, but most
significant was an impact that occurred when she brought an opponent down and hit the right frontal part
of her head on someone’s knee. This registered a 54.6 g and 9.7 rad/s impact (Figure 8.5). She reported 16
symptoms with an SSS of 27. She told me about the concussion, but did not report it to a clinician. There
were no gait data collected after this concussion.
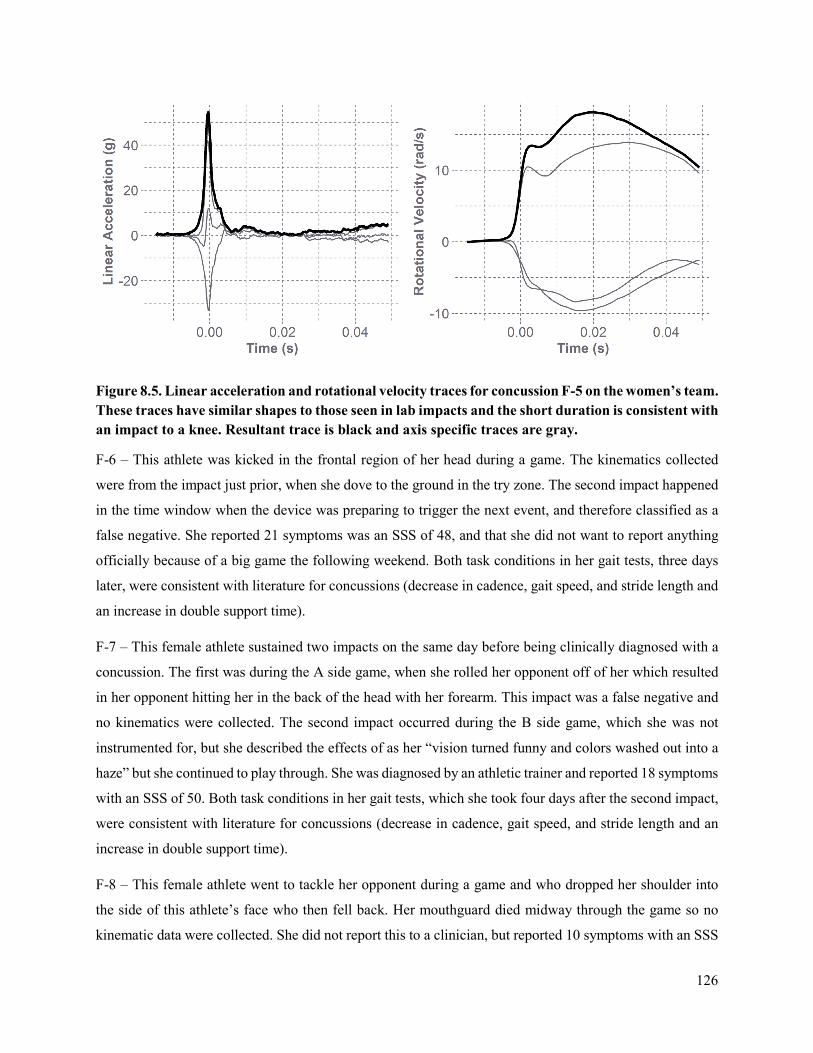
126
Figure 8.5. Linear acceleration and rotational velocity traces for concussion F-5 on the women’s team. These traces have similar shapes to those seen in lab impacts and the short duration is consistent with an impact to a knee. Resultant trace is black and axis specific traces are gray.
F-6 – This athlete was kicked in the frontal region of her head during a game. The kinematics collected
were from the impact just prior, when she dove to the ground in the try zone. The second impact happened
in the time window when the device was preparing to trigger the next event, and therefore classified as a
false negative. She reported 21 symptoms was an SSS of 48, and that she did not want to report anything
officially because of a big game the following weekend. Both task conditions in her gait tests, three days
later, were consistent with literature for concussions (decrease in cadence, gait speed, and stride length and
an increase in double support time).
F-7 – This female athlete sustained two impacts on the same day before being clinically diagnosed with a
concussion. The first was during the A side game, when she rolled her opponent off of her which resulted
in her opponent hitting her in the back of the head with her forearm. This impact was a false negative and
no kinematics were collected. The second impact occurred during the B side game, which she was not
instrumented for, but she described the effects of as her “vision turned funny and colors washed out into a
haze” but she continued to play through. She was diagnosed by an athletic trainer and reported 18 symptoms
with an SSS of 50. Both task conditions in her gait tests, which she took four days after the second impact,
were consistent with literature for concussions (decrease in cadence, gait speed, and stride length and an
increase in double support time).
F-8 – This female athlete went to tackle her opponent during a game and who dropped her shoulder into
the side of this athlete’s face who then fell back. Her mouthguard died midway through the game so no
kinematic data were collected. She did not report this to a clinician, but reported 10 symptoms with an SSS

127
of 10 on her survey. She said that “at first felt like I blacked out and I felt dizzy and my head hurt. I kept
playing, and had burry vision ten minutes after.” Both task conditions in her gait tests, which she took two
days later, were consistent with literature for concussions (decrease in cadence, gait speed, and stride length
and an increase in double support time).
F-9 – This female was impacted in a practice that she was not instrumented in. She took out opponent’s
legs to tackle her; she was then elbowed in the left side of the head while her opponent rolled over her and
the rucker kneed her in the left side of the jaw. She did not report her symptoms to a clinician, but reported
13 symptoms with a severity of 21. After the impact, she was dizzy, slow to get up, and nauseous, but
continued to play. Both her temple and jaw bruised. One day after her concussion, she took her gait test
where her cadence was slightly increased, and her gait speed and stride length were slightly decreased. Her
double support time increased for the dual task, but decreased for the single task.
F-10 – This female was also impacted in a practice that she was not instrumented in. Her teammate tackled
her head on to the left side of her head. She reported 20 symptoms with an SSS of 37. She said that right
after it happened it felt like her head exploded and she fell down. She woke up several times that night and
was nauseous. Her headache lingered and she felt sensitive to light. and that her symptoms resolved in a
few days. The athletic trainer said she had signs on a concussion. Both task conditions in her gait tests,
which she took one day later, were consistent with literature for concussions (decrease in cadence, gait
speed, and stride length and an increase in double support time).
F-11 – This athlete was tackled during a game, and impacted the parietal region of her head on the ground.
The acquisition settings of her device were wrong and no kinematic data were collected. She reported 4
symptoms with an SSS of 5, and did not notify clinical staff. She said that she “greyed out” at the time of
impact and saw stars, but did not notice other symptoms until the following days, with a constant headache,
increased fatigue, and inability to do homework. She continued to play and practice that week. She took
her gait test four days later, and showed a decrease in cadence and increase in double support time,
consistent with post-concussion gait tests. However, her stride length increased, and her gait speed barely
changed.
F-12 – This player sustained two impacts at practice that she attributes to her clinically diagnosed
concussion. In the first, a teammate was running at her with a ruck pad during a drill and she tripped on her
own foot and dove below the pad, hitting the front of her head on the pad holder’s knee. The kinematics
associated with this impact were 43.3 g and 9.7 rad/s (Figure 8.6). The second impact occurred when she
was the pad holder and a teammate was running toward her, and hit her in the left eye with her elbow. The
kinematics associated with this impact were 71.7 g and 6.3 rad/s (Figure 8.6). She had a lot of neck pain
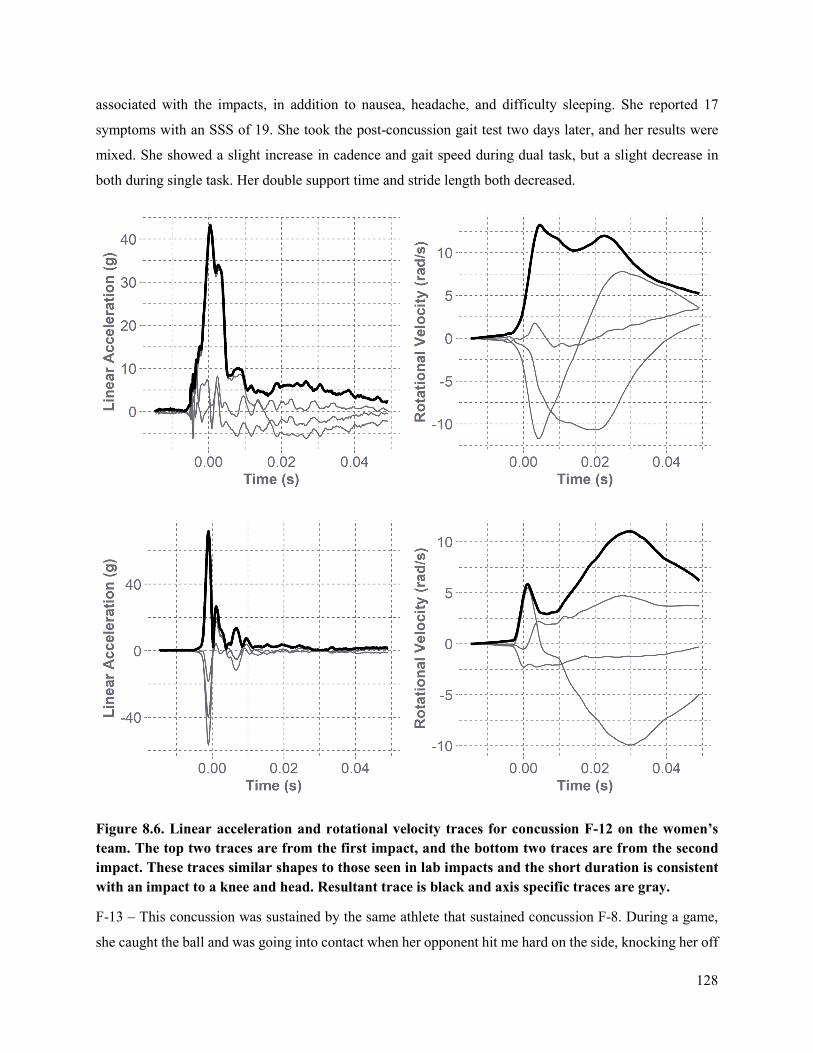
128
associated with the impacts, in addition to nausea, headache, and difficulty sleeping. She reported 17
symptoms with an SSS of 19. She took the post-concussion gait test two days later, and her results were
mixed. She showed a slight increase in cadence and gait speed during dual task, but a slight decrease in
both during single task. Her double support time and stride length both decreased.
Figure 8.6. Linear acceleration and rotational velocity traces for concussion F-12 on the women’s team. The top two traces are from the first impact, and the bottom two traces are from the second impact. These traces similar shapes to those seen in lab impacts and the short duration is consistent with an impact to a knee and head. Resultant trace is black and axis specific traces are gray.
F-13 – This concussion was sustained by the same athlete that sustained concussion F-8. During a game,
she caught the ball and was going into contact when her opponent hit me hard on the side, knocking her off
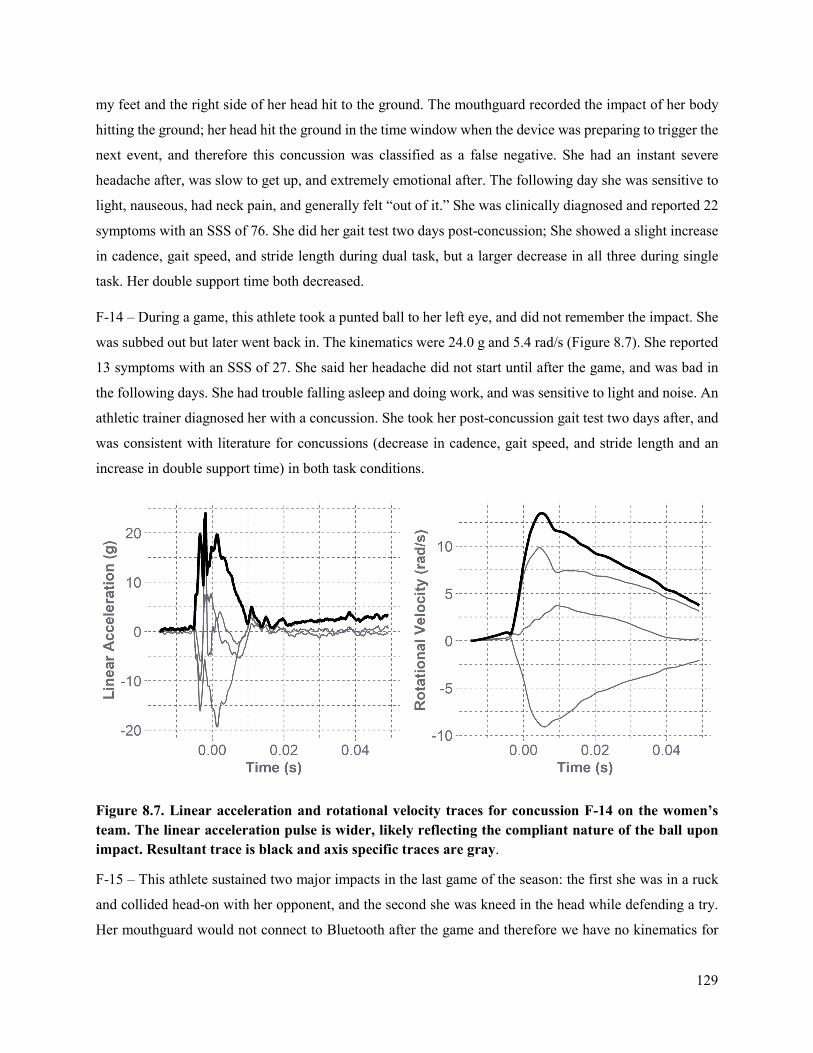
129
my feet and the right side of her head hit to the ground. The mouthguard recorded the impact of her body
hitting the ground; her head hit the ground in the time window when the device was preparing to trigger the
next event, and therefore this concussion was classified as a false negative. She had an instant severe
headache after, was slow to get up, and extremely emotional after. The following day she was sensitive to
light, nauseous, had neck pain, and generally felt “out of it.” She was clinically diagnosed and reported 22
symptoms with an SSS of 76. She did her gait test two days post-concussion; She showed a slight increase
in cadence, gait speed, and stride length during dual task, but a larger decrease in all three during single
task. Her double support time both decreased.
F-14 – During a game, this athlete took a punted ball to her left eye, and did not remember the impact. She
was subbed out but later went back in. The kinematics were 24.0 g and 5.4 rad/s (Figure 8.7). She reported
13 symptoms with an SSS of 27. She said her headache did not start until after the game, and was bad in
the following days. She had trouble falling asleep and doing work, and was sensitive to light and noise. An
athletic trainer diagnosed her with a concussion. She took her post-concussion gait test two days after, and
was consistent with literature for concussions (decrease in cadence, gait speed, and stride length and an
increase in double support time) in both task conditions.
Figure 8.7. Linear acceleration and rotational velocity traces for concussion F-14 on the women’s team. The linear acceleration pulse is wider, likely reflecting the compliant nature of the ball upon impact. Resultant trace is black and axis specific traces are gray.
F-15 – This athlete sustained two major impacts in the last game of the season: the first she was in a ruck
and collided head-on with her opponent, and the second she was kneed in the head while defending a try.
Her mouthguard would not connect to Bluetooth after the game and therefore we have no kinematics for
130
these impacts. She filled out her survey right after the game, with 3 symptoms and an SSS of 8, but said
that symptoms worsened into the week. She felt nauseous, “out of it”, dizzy, had a headache, and was
sensitive to light and noise. She took her post-concussion gait test 4 days after the game and showed a slight
decrease in cadence, slight increase in stride length, a larger increase in double support, and very small
changes in gait speed.
DISCUSSION
Over the course of the study, more women sustained concussions than their male counterparts. Of those
sustained, a higher proportion of males reported their symptoms to a clinician than the female athletes. It is
well documented that underreporting is extremely common in athletes and complicates concussion
diagnosis.41-43 We were transparent with the athletes in that we wanted to know if they suspected they had
a concussion, whether or not they reported their symptoms to an athletic trainer. Because of this, the number
of concussions reported to a clinician is much lower than the number of events reported to the research
staff, exemplifying the underreporting of concussion. This emphasizes the value of collecting weekly
symptom data from the athletes, and providing them a mechanism of self-reporting. The athletes may be
more aware of their symptoms in-season if they fill out a symptom survey each week, and may feel more
comfortable being honest in a survey, compared to the pressure of reporting to a clinician. It is also
interesting to note that three of the women identified two impacts contributing to their diagnosis, but did
not report the first impact initially. Many athletes played through their impacts during practices or games,
and did not acknowledge the severity of the impacts or report them until after the event was over. Previous
work has shown that athletes are likely to not report a concussion because they think the impact was not as
severe as a concussive impact.42
We were missing kinematic data from most events for a variety of reasons. For the data we have, the men’s
impacts were sustained at higher kinematics, but we cannot generalize as so much data are missing. The
concussive impacts for the men were measured at 109.7 g and 28.7 rad/s, and 81.6 g and 18.5 rad/s. This
compares to average concussion linear accelerations of 104 ± 30 g from collegiate football players.15 It is
important to note that football players are helmeted, compared to unhelmeted rugby players, so we would
expect lower concussive kinematics in rugby.
The women’s concussions occurred at 54.6 g and 9.7 rad/s, 43.4 and 9.7 rad/s and 71.7 g and 6.3 rad/s, and
24.0 g and 5.4 rad/s. While we cannot infer from the small sample of concussions we collected, we can
provide context of our data through comparison to concussions measured in other studies. Previous work
showed four female collegiate hockey players had an average concussive linear acceleration of 43.0 ± 11.5
g.44 The magnitudes recorded in our study are all lower than the male concussions in our study, but
131
comparable to the helmeted female hockey players. Data from potentially more severe impacts were missed,
which may have had kinematics of a more similar magnitude to the men’s.
Another head, a knee, and the ground were the most common things impacted. Going into a tackle and
colliding head to head with an opponent, rucking or going for the ball, and being flung to the ground were
the most frequent mechanisms for impacts with these three things respectively. These mechanisms are
similar to observational studies in other rugby teams.23 Several impacts happened with a teammate,
suggesting that potential better communication or field awareness could help decrease the risk of
concussion. Neck strengthening exercises may help mitigate the head acceleration when being tackled to
the ground, and decrease the severity of those impacts. Proper tackling form should be reinforced during
practices and games to reduce unnecessary risk of illegal and more dangerous tackles.45 Additionally,
protective soft-shelled headgear might reduce any force input to the head in these impacts. Headgear is
infrequently worn by rugby players, and has raised much controversy over the years.46-51
The number of symptoms reported and the SSS for each athlete vary greatly. This could be partially
attributed to differences in onset of symptoms per individual. Likely some athletes experienced a delay
compared to others, or some might have resolved before taking the symptom survey. An SSS ≥ 21 has been
associated with concussions in collegiate football players.52,53 The women in our study in general reported
a higher SSS (mean = 35.5) than the men (mean = 16). Sex may also play a role in perception of symptoms
and the tendency to underreport the severity of symptoms.54
In general, gait results were consistent with other dual-task studies post-concussion.39,55,56 We normalized
changes in the four gait metrics to the individual’s baseline measurements for comparison. Previous work
has identified changes in cadence, double support time, gait speed, and stride length in post-concussion
time points. Again, time could play a factor in the magnitude of changes in gait; all athletes were tested
within four days but it is possible that the clinical effect of a mild concussion of gait has resolved by that
time or, they have not presented yet. Previous work has shown dual-task deficits at days 5-6,57 or in the
year following the concussion,58 which is after all of the athletes in this study were tested. Interestingly, the
metrics of concussion F-2, showed all opposite of what we would expect post-concussion, and improved in
all of her gait metrics.
In this study, the frequency of women’s concussions is greater than the men’s team but the kinematics of
women’s concussions seem to be lower than those of the men. Women also reported more symptoms with
a higher severity, and increased gait deficits post-concussion. This dataset included a candid look into the
underreporting of collegiate athletes by including events that resulted in an increase in self-reported
symptoms. Some concussive kinematic data for women exist, but this is one of the first datasets comparing

132
a matched cohort of unhelmeted athletes, allowing for a comparison of sex-specific biomechanics,
incidence rates, and their clinical effects. Collecting these on-field kinematics is challenging and requires a
comprehensive approach to device use and great attention to detail. In the future, thoughtful emphasis
should be put on sensor validation, its sports-specific application, and its careful use to collect more on-
field biomechanics of contact sport athletes. Ideally, this dataset can be a foundation of injury risk curves
that are representative of women. Understanding the biomechanics of women’s concussions will provide
better understanding of concussion tolerance and hopefully pave the way for more sex-specific prevention
and intervention strategies.
REFERENCES
1. Moon, D., C. Beedle and C. Kovacic. Peak head acceleration of athletes during competition—football. Medicine and Science in Sports. 3(1):1971.
2. Broglio, S. P., T. Surma and J. A. Ashton-Miller. High school and collegiate football athlete concussions: A biomechanical review. Annals of Biomedical Engineering. 40(1):37-46, 2012.
3. Brolinson, P. G., S. Manoogian, D. McNeely, M. Goforth, R. Greenwald and S. Duma. Analysis of linear head accelerations from collegiate football impacts. Current Sports Medicine Reports. 5(1):23-8, 2006.
4. Crisco, J. J., B. J. Wilcox, J. G. Beckwith, J. J. Chu, A. C. Duhaime, S. Rowson, S. M. Duma, A. C. Maerlender, T. W. McAllister and R. M. Greenwald. Head impact exposure in collegiate football players. Journal of Biomechanics. 44(15):2673-8, 2011.
5. Guskiewicz, K. M., J. P. Mihalik, V. Shankar, S. W. Marshall, D. H. Crowell, S. M. Oliaro, M. F. Ciocca and D. N. Hooker. Measurement of head impacts in collegiate football players: Relationship between head impact biomechanics and acute clinical outcome after concussion. Neurosurgery. 61(6):1244-53, 2007.
6. Rowson, S., E. T. Campolettano, S. M. Duma, B. Stemper, A. Shah, J. Harezlak, L. Riggen, J. P. Mihalik, K. M. Guskiewicz, C. Giza, A. Brooks, K. Cameron, T. McAllister, S. P. Broglio and M. McCrea. Accounting for variance in concussion tolerance between individuals: Comparing head accelerations between concussed and physically matched control subjects. Annals of Biomedical Engineering. 47(10):2048-56, 2019.
7. Rowson, S., S. M. Duma, J. G. Beckwith, J. J. Chu, R. M. Greenwald, J. J. Crisco, P. G. Brolinson, A. C. Duhaime, T. W. McAllister and A. C. Maerlender. Rotational head kinematics in football impacts: An injury risk function for concussion. Annals of Biomedical Engineering. 40(1):1-13, 2012.
8. Dick, R. Is there a gender difference in concussion incidence and outcomes? British Journal of Sports Medicine. 43(Suppl 1):i46-i50, 2009.
9. Barnes, B. C., L. Cooper, D. T. Kirkendall, T. P. McDermott, B. D. Jordan and W. E. Garrett. Concussion history in elite male and female soccer players. The American Journal of Sports Medicine. 26(3):433-8, 1998.
10. Broshek, D. K., T. Kaushik, J. R. Freeman, D. Erlanger, F. Webbe and J. T. Barth. Sex differences in outcome following sports-related concussion. Journal of Neurosurgery. 102(5):856-63, 2005.
11. Covassin, T., C. B. Swanik and M. L. Sachs. Sex differences and the incidence of concussions among collegiate athletes. Journal of Athletic Training. 38(3):238, 2003.
12. Fakhran, S., K. Yaeger, M. Collins and L. Alhilali. Sex differences in white matter abnormalities after mild traumatic brain injury: Localization and correlation with outcome. Radiology. 272(3):815-23, 2014.
133
13. Frommer, L. J., K. K. Gurka, K. M. Cross, C. D. Ingersoll, R. D. Comstock and S. A. Saliba. Sex differences in concussion symptoms of high school athletes. Journal of Athletic Training. 46(1):76-84, 2011.
14. Gessel, L. M., S. K. Fields, C. L. Collins, R. W. Dick and R. D. Comstock. Concussions among united states high school and collegiate athletes. Journal of Athletic Training. 42(4):495-503, 2007.
15. Rowson, S. and S. M. Duma. Brain injury prediction: Assessing the combined probability of concussion using linear and rotational head acceleration. Annals of Biomedical Engineering. 41(5):873-82, 2013.
16. Tierney, R. T., M. Higgins, S. V. Caswell, J. Brady, K. McHardy, J. B. Driban and K. Darvish. Sex differences in head acceleration during heading while wearing soccer headgear. Journal of Athletic Training. 43(6):578-84, 2008.
17. Queen, R. M., P. S. Weinhold, D. T. Kirkendall and B. Yu. Theoretical study of the effect of ball properties on impact force in soccer heading. Medicine & Science in Sports & Exercise. 35(12):2069-76, 2003.
18. Bramlett, H. M. and W. D. Dietrich. Neuropathological protection after traumatic brain injury in intact female rats versus males or ovariectomized females. Journal of Neurotrauma. 18(9):891-900, 2001.
19. Roof, R. L. and E. D. Hall. Gender differences in acute CNS trauma and stroke: Neuroprotective effects of estrogen and progesterone. Journal of Neurotrauma. 17(5):367-88, 2000.
20. Granito Jr, V. J. Psychological response to athletic injury: Gender differences. Journal of Sport Behavior. 25(3):243, 2002.
21. Fuller, C. W., A. Taylor and M. Raftery. Epidemiology of concussion in men's elite rugby-7s (sevens world series) and rugby-15s (rugby world cup, junior world championship and rugby trophy, pacific nations cup and english premiership). British Journal of Sports Medicine. 49(7):478-83, 2015.
22. Collins, C. L., L. J. Micheli, E. E. Yard and R. D. Comstock. Injuries sustained by high school rugby players in the united states, 2005-2006. Archives of Pediatrics & Adolescent Medicine. 162(1):49-54, 2008.
23. Hinton-Bayre, A., G. Geffen and P. Friis. Presentation and mechanisms of concussion in professional rugby league football. Journal of Science and Medicine in Sport. 7(3):400-4, 2004.
24. Kemp, S. P., Z. Hudson, J. H. Brooks and C. W. Fuller. The epidemiology of head injuries in english professional rugby union. Clinical Journal of Sport Medicine. 18(3):227-34, 2008.
25. Bartsch, A. J., D. S. Hedin, P. L. Gibson, V. J. Miele, E. C. Benzel, J. L. Alberts, S. Samorezov, A. Shah, B. S. Stemper and M. M. McCrea. Laboratory and on-field data collected by a head impact monitoring mouthguard. 2019 41st Annual International Conference of the IEEE Engineering in Medicine and Biology Society (EMBC). 2068-72, 2019.
26. Bartsch PhD, A., S. Samorezov, E. Benzel, C. Clinic, V. Miele and D. Brett. Validation of an "intelligent mouthguard" single event head impact dosimeter. 2014.
27. Rich, A. M., T. M. Filben, L. E. Miller, B. T. Tomblin, A. R. Van Gorkom, M. A. Hurst, R. T. Barnard, D. S. Kohn, J. E. Urban and J. D. Stitzel. Development, validation and pilot field deployment of a custom mouthpiece for head impact measurement. Annals of Biomedical Engineering. 47(10):2109-21, 2019.
28. Broglio, S. P., R. C. Cantu, G. A. Gioia, K. M. Guskiewicz, J. Kutcher, M. Palm, T. C. Valovich McLeod and A. National Athletic Trainer's. National athletic trainers' association position statement: Management of sport concussion. Journal of Athletic Training. 49(2):245-65, 2014.
29. Howell, D. R., J. R. Oldham, M. DiFabio, S. Vallabhajosula, E. E. Hall, C. J. Ketcham, W. P. Meehan and T. A. Buckley. Single-task and dual-task gait among collegiate athletes of different sport classifications: Implications for concussion management. Journal of Applied Biomechanics. 33(1):24-31, 2017.
134
30. Howell, D. R., L. R. Osternig, M. C. Koester and L. S. Chou. The effect of cognitive task complexity on gait stability in adolescents following concussion. Experimental Brain Research. 232(6):1773-82, 2014.
31. Parker, T. M., L. R. Osternig, V. A. N. D. P and L. S. Chou. Gait stability following concussion. Medicine & Science in Sports & Exercise. 38(6):1032-40, 2006.
32. Catena, R. D., P. van Donkelaar and L. S. Chou. Altered balance control following concussion is better detected with an attention test during gait. Gait Posture. 25(3):406-11, 2007.
33. Folstein, M. F., S. E. Folstein and P. R. McHugh. "Mini-mental state". A practical method for grading the cognitive state of patients for the clinician. Journal of Psychiatric Research. 12(3):189-98, 1975.
34. Meagher, J., M. Leonard, L. Donoghue, N. O'Regan, S. Timmons, C. Exton, W. Cullen, C. Dunne, D. Adamis, A. J. Maclullich and D. Meagher. Months backward test: A review of its use in clinical studies. World Journal of Psychiatry. 5(3):305-14, 2015.
35. McCrory, P., W. H. Meeuwisse, M. Aubry, R. C. Cantu, J. Dvořák, R. J. Echemendia, L. Engebretsen, K. Johnston, J. S. Kutcher, M. Raftery, A. Sills, B. W. Benson, G. A. Davis, R. Ellenbogen, K. M. Guskiewicz, S. A. Herring, G. L. Iverson, B. D. Jordan, J. Kissick, M. McCrea, A. S. McIntosh, D. Maddocks, M. Makdissi, L. Purcell, M. Putukian, K. Schneider, C. H. Tator and M. Turner. Consensus statement on concussion in sport: The 4th international conference on concussion in sport, Zurich, November 2012. Journal of Athletic Training. 48(4):554-75, 2013.
36. Guskiewicz, K. M., J. Register-Mihalik, P. McCrory, M. McCrea, K. Johnston, M. Makdissi, J. Dvorak, G. Davis and W. Meeuwisse. Evidence-based approach to revising the SCAT2: Introducing the SCAT3. British Journal of Sports Medicine. 47(5):289-93, 2013.
37. Mancini, M., A. Salarian, P. Carlson-Kuhta, C. Zampieri, L. King, L. Chiari and F. B. Horak. Isway: A sensitive, valid and reliable measure of postural control. J Neuroeng Rehabil. 9(59, 2012.
38. Mancini, M., L. King, A. Salarian, L. Holmstrom, J. McNames and F. B. Horak. Mobility lab to assess balance and gait with synchronized body-worn sensors. Journal of Bioengineering and Biomedical Science. Suppl 1(007, 2011.
39. Howell, D. R., A. Stracciolini, E. Geminiani and W. P. Meehan. Dual-task gait differences in female and male adolescents following sport-related concussion. Gait & Posture. 54(284-9, 2017.
40. Fino, P. C. A preliminary study of longitudinal differences in local dynamic stability between recently concussed and healthy athletes during single and dual-task gait. Journal of Biomechanics. 49(9):1983-8, 2016.
41. Meier, T. B., B. J. Brummel, R. Singh, C. J. Nerio, D. W. Polanski and P. S. F. Bellgowan. The underreporting of self-reported symptoms following sports-related concussion. Journal of Science and Medicine in Sport. 18(5):507-11, 2015.
42. Davies, S. C. and B. M. Bird. Motivations for underreporting suspected concussion in college athletics. Journal of Clinical Sport Psychology. 9(2):101-15, 2015.
43. McCrea, M., T. Hammeke, G. Olsen, P. Leo and K. Guskiewicz. Unreported concussion in high school football players: Implications for prevention. Clinical Journal of Sport Medicine. 14(1):13-7, 2004.
44. Wilcox, B. J., J. G. Beckwith, R. M. Greenwald, N. P. Raukar, J. J. Chu, T. W. McAllister, L. A. Flashman, A. C. Maerlender, A.-C. Duhaime and J. J. Crisco. Biomechanics of head impacts associated with diagnosed concussion in female collegiate ice hockey players. Journal of Biomechanics. 48(10):2201-4, 2015.
45. Suzuki, K., S. Nagai, K. Iwai, T. Furukawa, N. Mukai, S. Miyakawa and M. Takemura. Characteristics and factors of concussion events for tacklers in collegiate rugby union. Scandinavian Journal of Medicine & Science in Sports. 30(1):185-92, 2020.
46. Barnes, A., J. L. Rumbold and P. Olusoga. Attitudes towards protective headgear in uk rugby union players. BMJ Open Sport Exercise Medicine. 3(1):e000255, 2017.
135
47. McIntosh, A. S., P. McCrory, C. F. Finch, J. P. Best, D. J. Chalmers and R. Wolfe. Does padded headgear prevent head injury in rugby union football? Medicine & Science in Sports & Exercise. 41(2):306-13, 2009.
48. McIntosh, A. S. and P. McCrory. Effectiveness of headgear in a pilot study of under 15 rugby union football. British Journal of Sports Medicine. 35(3):167-9, 2001.
49. Wilson, B. D. Protective headgear in rugby union. Sports Medicine. 25(5):333-7, 1998. 50. Menger, R., A. Menger and A. Nanda. Rugby headgear and concussion prevention: Misconceptions
could increase aggressive play. Neurosurgical Focus. 40(4):E12, 2016. 51. Kahanov, L., M. J. Dusa, S. Wilkinson and J. Roberts. Self-reported headgear use and concussions
among collegiate men's rugby union players. Research in Sports Medicine. 13(2):77-89, 2005. 52. McCrea, M., W. B. Barr, K. Guskiewicz, C. Randolph, S. W. Marshall, R. Cantu, J. A. Onate and
J. P. Kelly. Standard regression-based methods for measuring recovery after sport-related concussion. Journal of the International Neuropsychological Society. 11(1):58-69, 2005.
53. McCrea, M., K. M. Guskiewicz, S. W. Marshall, W. Barr, C. Randolph, R. C. Cantu, J. A. Onate, J. Yang and J. P. Kelly. Acute effects and recovery time following concussion in collegiate football playersthe NCAA concussion study. Journal of the American Medical Association. 290(19):2556-63, 2003.
54. McGroarty, N. K., S. M. Brown and M. K. Mulcahey. Sport-related concussion in female athletes: A systematic review. Orthopaedic Journal of Sports Medicine. 8(7):2325967120932306, 2020.
55. Howell, D. R., J. Oldham, C. Lanois, I. Koerte, A. P. Lin, B. Berkstresser, F. Wang and W. P. Meehan, 3rd. Dual-task gait recovery after concussion among female and male collegiate athletes. Medicine & Science in Sports & Exercise. 52(5):1015-21, 2020.
56. Howell, D. R., M. J. O'Brien, A. Raghuram, A. S. Shah and W. P. Meehan III. Near point of convergence and gait deficits in adolescents after sport-related concussion. Clinical Journal of Sport Medicine. 28(3):262-7, 2018.
57. Lee, H., S. J. Sullivan and A. G. Schneiders. The use of the dual-task paradigm in detecting gait performance deficits following a sports-related concussion: A systematic review and meta-analysis. Journal of Science and Medicine in Sport. 16(1):2-7, 2013.
58. Howell, D. R., T. A. Buckley, R. C. Lynall and W. P. Meehan III. Worsening dual-task gait costs after concussion and their association with subsequent sport-related injury. Journal of Neurotrauma. 35(14):1630-6, 2018.
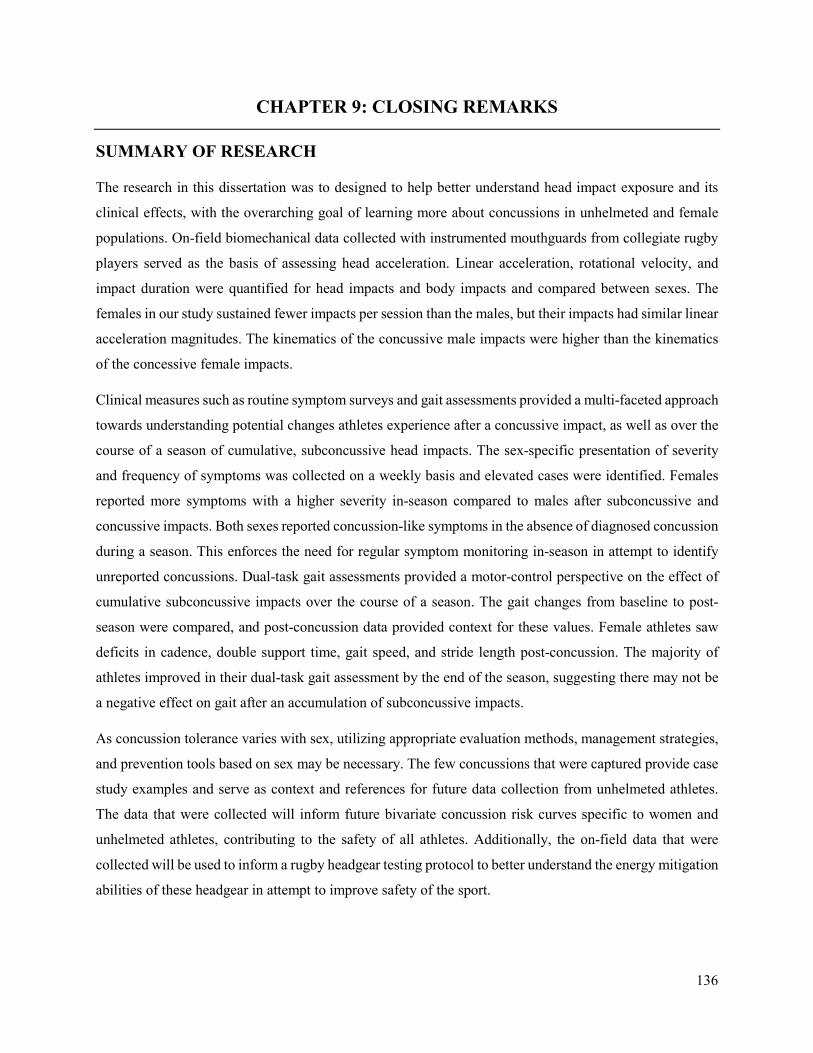
136
CHAPTER 9: CLOSING REMARKS
SUMMARY OF RESEARCH
The research in this dissertation was to designed to help better understand head impact exposure and its
clinical effects, with the overarching goal of learning more about concussions in unhelmeted and female
populations. On-field biomechanical data collected with instrumented mouthguards from collegiate rugby
players served as the basis of assessing head acceleration. Linear acceleration, rotational velocity, and
impact duration were quantified for head impacts and body impacts and compared between sexes. The
females in our study sustained fewer impacts per session than the males, but their impacts had similar linear
acceleration magnitudes. The kinematics of the concussive male impacts were higher than the kinematics
of the concessive female impacts.
Clinical measures such as routine symptom surveys and gait assessments provided a multi-faceted approach
towards understanding potential changes athletes experience after a concussive impact, as well as over the
course of a season of cumulative, subconcussive head impacts. The sex-specific presentation of severity
and frequency of symptoms was collected on a weekly basis and elevated cases were identified. Females
reported more symptoms with a higher severity in-season compared to males after subconcussive and
concussive impacts. Both sexes reported concussion-like symptoms in the absence of diagnosed concussion
during a season. This enforces the need for regular symptom monitoring in-season in attempt to identify
unreported concussions. Dual-task gait assessments provided a motor-control perspective on the effect of
cumulative subconcussive impacts over the course of a season. The gait changes from baseline to post-
season were compared, and post-concussion data provided context for these values. Female athletes saw
deficits in cadence, double support time, gait speed, and stride length post-concussion. The majority of
athletes improved in their dual-task gait assessment by the end of the season, suggesting there may not be
a negative effect on gait after an accumulation of subconcussive impacts.
As concussion tolerance varies with sex, utilizing appropriate evaluation methods, management strategies,
and prevention tools based on sex may be necessary. The few concussions that were captured provide case
study examples and serve as context and references for future data collection from unhelmeted athletes.
The data that were collected will inform future bivariate concussion risk curves specific to women and
unhelmeted athletes, contributing to the safety of all athletes. Additionally, the on-field data that were
collected will be used to inform a rugby headgear testing protocol to better understand the energy mitigation
abilities of these headgear in attempt to improve safety of the sport.
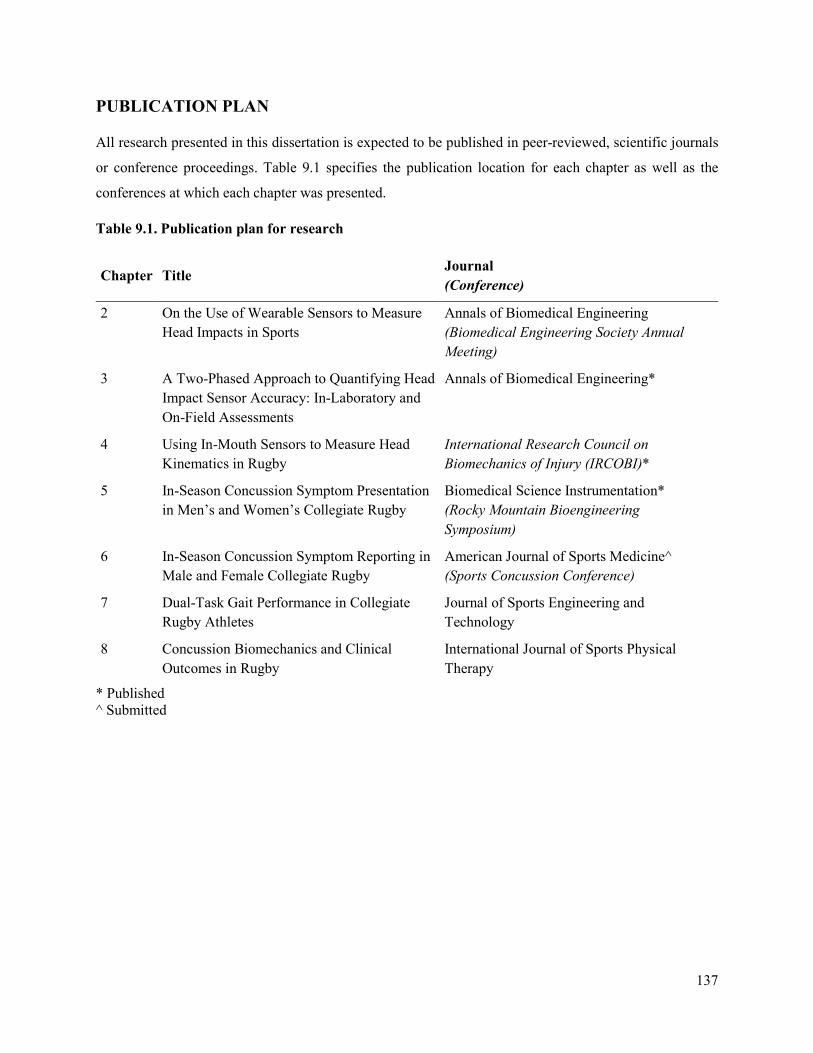
137
PUBLICATION PLAN
All research presented in this dissertation is expected to be published in peer-reviewed, scientific journals
or conference proceedings. Table 9.1 specifies the publication location for each chapter as well as the
conferences at which each chapter was presented.
Table 9.1. Publication plan for research
Chapter Title Journal (Conference)
2 On the Use of Wearable Sensors to Measure Head Impacts in Sports
Annals of Biomedical Engineering (Biomedical Engineering Society Annual Meeting)
3 A Two-Phased Approach to Quantifying Head Impact Sensor Accuracy: In-Laboratory and On-Field Assessments
Annals of Biomedical Engineering*
4 Using In-Mouth Sensors to Measure Head Kinematics in Rugby
International Research Council on Biomechanics of Injury (IRCOBI)*
5 In-Season Concussion Symptom Presentation in Men’s and Women’s Collegiate Rugby
Biomedical Science Instrumentation* (Rocky Mountain Bioengineering Symposium)
6 In-Season Concussion Symptom Reporting in Male and Female Collegiate Rugby
American Journal of Sports Medicine^ (Sports Concussion Conference)
7 Dual-Task Gait Performance in Collegiate Rugby Athletes
Journal of Sports Engineering and Technology
8 Concussion Biomechanics and Clinical Outcomes in Rugby
International Journal of Sports Physical Therapy
* Published ^ Submitted