Myological Variability in a Decoupled Skeletal System: Batoid Cranial Anatomy

Anthrop. Anz. 70/4 (2013), pp. 407–425 ArticleJ. Biol. Clinic. Anthrop.Stuttgart, December 2013
www.schweizerbart.de0003-5548/13/0363 $ 4.75
� 2013 E. Schweizerbart’sche Verlagsbuchhandlung, Stuttgart, Germany
DOI: 10.1127/0003-5548/2013/0363
Sex determination by three-dimensional geometricmorphometrics of the palate and cranial base
Maria-Eleni Chovalopoulou, Efstratios D. Valakos andSotiris K. Manolis
Department of Animal and Human Physiology, Faculty of Biology, School of Sciences, Uni-versity of Athens, Panepistimiopolis, Athens, [email protected]
With 6 figures and 4 tables
Summary: The purpose of this study is to assess sexual dimorphism in the palate and baseof adult crania using three-dimensional geometric morphometric methods. The study sampleconsisted of 176 crania of known sex (94 males, 82 females) belonging to individuals wholived during the 20th century in Greece. The three-dimensional co-ordinates of 30 ecto-cranial landmarks were digitized using a MicroScribe 3DX contact digitizer. GeneralizedProcrustes Analysis (GPA) was used to obtain size and shape variables for statistical analysis.Three discriminant function analyses were carried out: (1) using PC scores from Procrustesshape space, (2) centroid size alone, and (3) PC scores of GPA residuals which includes lnCSfor analysis in Procrustes form space. Results indicate that there are shape differencesbetween sexes. In males, the palate is deepest and more elongated; the cranial base is short-ened. Sex-specific shape differences for the cross-validated data give better classificationresults in the cranial base (77.2 %) compared with the palate (68.9 %). Size alone yielded bet-ter results for cranial base (82 %) in opposition to palate (63.1 %). As anticipated, the classifi-cation accuracy improves when both size and shape are combined (90.4 % for cranial base,and 74.8 % for palate).
Key words: Sexual dimorphism, Microscribe digitizer, shape analysis, cranial regions,Athens Collection, Greece.
IntroductionDetermining sex is an important feature of establishing the biological profile of anunidentified human skeleton. The pelvis produces strong evidence of sexual dimor-phism through accurate criteria to predict sex (Meindl et al. 1985, Burns 1999, Bru-zek & Murail 2006, Wärmländer & Sholts 2011). In the absence or severe deteriora-tion of postcranial remains, sex is often determined by the sexually dimorphic char-acteristics of the skull (Novotny et al. 1993, Buikstra & Ubelaker 1994, Bass 1995,White et al. 2011). Traditional approaches to estimate sex from skeletal remainsinclude qualitative morphological examination and morphometric methods. Qualita-tive morphological examination utilizes particular traits of the cranium, mandible,and the pelvis to accurately determine sex in 90 % of cases (Williams & Rogers2006). Implementing morphological methods requires thorough training by the

examiner but still poses high subjectivity concerning the evaluation of such traits(Bookstein et al. 1985, Slice 2007).
Morphometric methods utilize dimensional measurements of skeletal remains(Hanihara 1959, Giles & Eliot 1963, Giles 1964, Birkby 1966, Henke 1974), whichare then compared to calculations of known populations, the disadvantage of thismethod is that the geographical origin of the test specimen must also be known tofind a suitable comparative sample (Franklin et al. 2005, Frutos 2005, Kemkes-Grot-tenthaler 2005, Barrio et al. 2006, Bidmos 2006, Gualdi-Russo 2007, Rösing et al.2007). In the postcranial skeleton, accuracy in determining sex through morphomet-ric methods reaches 85–90% (Meindl et al. 1985, Krogman & Iscan 1986, Mays &Cox 2000), and up to 80 % accuracy for the crania alone (Hoyme & Iscan 1989).
Three-Dimensional Geometric Morphometric Analysis (3-D GM) utilizes theshape of the crania in sex determination by excluding the factor of cranial size (Corti1993, Slice 2007). Specifically, 3-D GM examines the skull based on 3-dimensionalcoordinates that correspond to particular landmarks. Advantages of this methodinclude repeatability, leading to objective results in sex estimation by evaluatingshape. Compared to traditional morphometric methods, 3-D GM produces moreaccurate results (about 87 %) in sex determination on cranial remains (Franklin et al.2005, Franklin et al. 2006a, Franklin et al. 2007a).
Most frequently, 3-D GM applications are used to determine population affinity ororigin (Ross et al. 1999, Buck & Vidarsdottir 2004), to determine sex (Steyn et al.2004, Oettle et al. 2005, Pretorius et al. 2006, Ross et al. 2006, Franklin et al. 2006a,Franklin et al. 2006b, Franklin et al. 2007a, Franklin et al. 2007b, Kimmerle et al.2008) and to estimate age at death (Braga & Treil 2007). Instead of replacing the tra-ditional methods of sex determination, 3-D GM aims to qualitatively identify shape,describe its variability and produce an objective estimate of shape variance, whilepreserving all the geometrical information of the original specimen (Slice 2005).
This study investigates the application of 3-D GM on a modern Greek skeletalsample and aims to identify the subsets of cranial landmarks that can be used to accu-rately determine sex in this population.
Material and methodsThe modern skeletal reference collection (known as the Athens Collection) is housed in theDepartment of Animal and Human Physiology (Faculty of Biology, National & KapodistrianUniversity of Athens). The collection consists of 225 skeletons. Information on the name, ageat death, occupation, cause of death and place of birth of each individual in the collection isderived from death records (Eliopoulos et al. 2007). Various Greek samples have mostrecently been used to determine unique sex-specific morphometric methods based on crania(Kranioti et al. 2008), on humerus (Kranioti et al. 2009a, Kranioti et al. 2009b), on hip joint(Papaloukas et al. 2008), on os coxae (Steyn & Iscan 2008), on metacarpals (Manolis et al.2009), metatarsals (Mountrakis et al. 2010), and arm bones (Charisi et al. 2011).
For the purpose of this research 176 crania of adult individuals of known sex and age atdeath were studied: ninety-four males (19–96 years old) and eighty-two females (22–99years old). Individuals without any evidence of pathology were selected. According to Elio-poulos et al. (2007) individuals in the Greek sample were born in a variety of locales withinthe country and died between 1960 and 1996.
This study uses thirty landmarks on the outer surface of the skull, chosen on the basis ofadequately illustrating the anatomy of the two regions of study (cranial base and palate).Landmarks are defined in Table 1 and are easily identified on the cranial surface, which
408 Maria-Eleni Chovalopoulou, Efstratios D. Valakos and Sotiris K. Manolis

Table 1. List of landmarks.
** Landmark Abbre-viation
Regions of skullwhere landmarks
used*
Definition
1 opisthion o Ba The midpoint of the posterior mar-gin of the foramen magnum in themidsagittal plane
2 basion ba Ba Lowest-midline point on the anteri-or margin of the foramen magnum
3 (a,b) foramino-laterale
fol Ba The most lateral point on the mar-gin of the foramen magnum
4 (a,b) occipitocon-dylion me-diale
meco Ba The most medial point on the mar-gin of the condylus occipitalis
5 (a,b) occipitocon-dylion poste-rior
poco Ba The most posterior point on themargin of the condylus occipitalis
6 (a,b) occipitocon-dylion late-rale
laco Ba The most lateral point on the mar-gin of the condylus occipitalis
7 (a,b) occipitocon-dylion ante-rior
antco Ba The most anterior point on themargin of the condylus occipitalis
8 (a,b) caroticummediale
cam Ba The most medial point of the mar-gin of the foramen caroticum exter-num
9 (a,b) spinale spi Ba The most medial point on the mar-gin of the foramen spinosum
10 (a,b) ovale media-le
ovm Ba The most medial point on the mar-gin of the foramen ovale
11 hormion ho Ba Intersection of the midsagittalplane and the line where the baseof vomer meets os sphenoidale
12 (a,b) infratempo-rale
it Ba Intersection of the sut. sphenosqua-mosa and crista infratemporalis ofthe sphenoid bone
13 (a,b) mastoidale ms Ba The most inferior point on the pro-cessus mastoideus
14 infraorbitale io Ba The most lateral point on the mar-gin of the foramen infraorbitale
15 (a,b) postalverion poa Pl The most posterior point of theprocessus alveolaris of the maxilla
16 staphylion sta Pl The point where subtence/chord ofposterior margin of the palate inter-sects the midsagittal plane
17 staurion sr Pl Intersection of the sut. palatina me-diana and sut. palatina transversa
18 foramen in-cisivum
inc Pl The point on the posterior marginof the foramen incisivum
* Ba – base; Pl – palate** a – left side, b – right side
Sex determination by 3-D GM 409

strengthens the repeatability of the technique (Rohlf 1996, Snow 2004, Bigoni et al. 2010).The absence of landmarks on the maxillary alveolar process is caused by ante-mortem toothloss, observed in high frequencies in our sample.
Three-dimensional data were acquired with a Microscribe 3DX at each of the thirty land-marks (Immersion Cor, San Jose, California). Both hemispheres of the skull were firmlyplaced independently on a custom built base in order to capture all of the landmarks. On eachside, four common landmarks are recorded as orientation reference, thus allowing for trans-position of the two subsets of landmarks (left and right side of the cranium) into a unified 3-dimensional geometric space.
Generalized Procrustes Analysis (GPA) rescales, translates, and rotates the raw landmarkcoordinates in order to eliminate any non-shape variation in the sample. The centroid size foreach cranium is also calculated. Results of GPA are analyzed through Principal ComponentAnalysis (PCA) utilizing Morphologika software (O’Higgins & Jones 2006). The purpose ofPCA is to simplify both the variation and covariation patterns of 3-dimensional coordinatesin GPA and replace them with principal components (PCs). Principal components are linearcombinations of the original variables. Because they are independent of each other, PCs areeasier to interpret than the original variables (Zelditch et al. 2004). The variation among indi-viduals of the sample is seen by a PCA scatterplot, on which the origin of the PCs representsthe mean shape of the sample.
In order to examine the overall shape difference between males and females, a Goodall’sF test was performed (Goodall 1991). This statistical test calculates the ratio of the Procrustessquare distance between the mean values of the two groups (male – female) to the Procrustessquare distance between each individual and the mean value of its group. Additionally, a per-mutation test (n = 1600) is applied to estimate the significance of the results generated by theGoodall’s F test. The permutation test randomly shifts the individuals of both groups and cal-culates the F distribution for each new pair of groups, while comparing the F value with theresult of the original groups. Simple 3D-IMP software was used to perform both Goodall’s Fand the permutation tests (Sheets & Mitchell 2001, IMP-Simple 3D).
The relevant shape variations are illustrated using wire-frame models and thin-platesplines (TPS). The wire-frame models were made with MorphoJ (Klingenberg 2011), whileMorphologika produces TPS. Thin-plate splines accurately define the location of the land-marks of one formation onto another (Slice 2007) and are used to visually explore the defor-mation of shape on a Cartesian grid, and to identify the landmarks responsible for the shapedifferences between extreme PC values.
Three discriminant function analyses were implemented. The first uses PC scores thatresulted from the PCA in the Procrustes shape space (where size is effectively removed). Thesecond discriminant function analysis uses the centroid size to determine its relevance to sex-ual dimorphism. The third analysis utilizes the PC scores as calculated from the PCA in theProcrustes form space (size is incorporated into the analysis by the means of the logarithm ofthe centroid size). Subset methods are used to determine the optimal combination of vari-ables, which provides a sex estimate, whereas Jackknife procedures verify cross-validatedclassification.
There are several underlying assumptions of discriminant function analysis. For instance,group sizes of the dependent variable should not be grossly different and should be at leastfive times the number of the independent variables. Moreover, each predictor variable shouldbe normally distributed. Hence, a test of normality for each PC score used in a discriminantfunction analysis was carried out (Table 2).
Finally, logistic regression is applied to the optimal combination of variables to determinethe correlation between independent (PCs) and dependent (sex) variables. All aforemen-tioned statistical analyses were performed using SPSS software (PASW Statistics 18.0).
410 Maria-Eleni Chovalopoulou, Efstratios D. Valakos and Sotiris K. Manolis

Tab
le2.
Nor
mal
ity
test
resu
lts.
Kol
mog
orov
-Sm
irno
va(S
ig.)
Shap
iro-
Wilk
(Sig
.)
Kol
mog
orov
-Sm
irno
va(S
ig.)
Shap
iro-
Wilk
(Sig
.)
Kol
mog
orov
-Sm
irno
va(S
ig.)
Shap
iro-
Wilk
(Sig
.)
Pal
ate
–sh
ape
Pal
ate
–sh
ape
Pal
ate
–fo
rm
PC
1.2
00*
0.27
Cen
troi
dSiz
e.2
00*
0.62
PC
1.2
00*
0.7
PC
2.2
00*
0.49
PC
2.2
00*
0.19
PC
3.2
00*
0.17
PC
3.2
00*
0.76
PC
4.2
00*
0.63
PC
4.2
00*
0.87
PC
5.2
00*
0.37
PC
5.2
00*
0.62
PC
6.2
00*
0.81
PC
6.2
00*
0.36
PC
7.2
00*
0.43
PC
70.
110.
36P
C8
.200
*0.
38
Bas
e–
shap
eB
ase
–si
zeB
ase
–fo
rmP
C1
.200
*0.
73C
entr
oidS
ize
0.03
0.39
PC
1.2
00*
0.35
PC
20.
070.
5P
C2
.200
*0.
74P
C3
.200
*0.
85P
C3
0.06
0.48
PC
4.2
00*
0.94
PC
4.2
00*
0.86
PC
5.2
00*
0.31
PC
5.2
00*
0.94
PC
6.2
00*
0.77
PC
6.2
00*
0.33
PC
7.2
00*
0.97
PC
7.2
00*
0.65
PC
8.2
00*
0.88
PC
8.2
00*
0.49
PC
90.
10.
16P
C9
0.07
0.41
PC
10.2
00*
0.53
PC
10.2
00*
0.17
PC
11.2
00*
0.61
PC
12.2
00*
0.85
PC
13.2
00*
0.77
PC
14.2
00*
0.69
PC
15.2
00*
0.95
*.T
his
isa
low
erbo
und
ofth
etr
uesi
gnif
ican
ce
Sex determination by 3-D GM 411

Results
Palate
The evaluation of sexual dimorphism in the region of the palate is based on the analy-sis of five landmarks (Fig. 1) from a sample of 103 crania (58 male, 45 female). TheProcrustes distance between male and female individuals was d = 0.04645 and is sta-tistically significant (F = 6.3487, df1 = 8, df2 = 808, p = 1.45×10⁻⁶) by the means ofa permutation test (n = 1600) and Goodall’s F test. Ninety-nine percent of the F distri-bution of the permuted groups is smaller than the F resulted for the originally definedgroups.
Shape analysis of the palate
Principal component analysis produced nine PCs representing the total variation inthe palate region. Based on the scree plot criterion, the first seven non-zero principalcomponents were used for sex determination as independent variables whichdescribed 99.2 % of the variation. The scree plot constitutes a biaxial graphical repre-sentation, on which PCs are rendered horizontally and their corresponding eigenval-ues are represented vertically. According to the scree plot criterion the maximumnumber of PCs used for further analysis equals the number of the PCs after which thegraph becomes horizontal (Jolliffe 2002).
Stepwise Discriminant Function Analysis (DFA) revealed optimal group separa-tion with PC 1, 2 and 6 (Wilk’s lambda = 0.810, p < 0.0001). The scatterplot inFig. 2a illustrates PC 2 and PC 6 on the x- and y-axes, respectively. Principal compo-nent 2 accounts for 27.5 % of the sample’s diversity, whereas PC 6 only 4.3 %. The
Fig. 1. Landmarks on the palate region.
412 Maria-Eleni Chovalopoulou, Efstratios D. Valakos and Sotiris K. Manolis

Fig. 2. Plots of principal components of PCA in palate. A: Shape space, B: Form space.
accuracy of classification of the original group was 68.9 %, a result also verified bythe Leave one out cross-validation procedure (which is similar to Jacknife). Logisticregression on PC 1, 2 and 6 showed 25.8 % correlation between PCs and sex.
The wireframes (Fig. 3) correspond to the landmark locations of male and femaleindividuals according to PC 2 projected on three different planes. On the right handside of each wireframe, a lollipop graph reveals the direction of change for each indi-vidual landmark of the palate area between the female and male groups. The latter isdepicted by the black dots corresponding to the relevant landmarks.
Remarkable shape differences between male and female groups were detected.Specifically, the angle formed by landmarks: left postalverion, staphylion, and rightpostalverion appears wider in the female group, whereas the height of this particulartriangle is greater in the male group. The distance between the landmarks staphylionand staurion is smaller in females, whereas the distance between staurion and fora-men incisivum is smaller in males. The angle formed by landmarks: left postalverion,foramen incisivum and right postalverion are wider in females and the height of therespective triangle is smaller compared to male individuals.
The thin-plate spline grid (Fig. 3) illustrates the variation in shape of the palateregion represented by PC 2, since DFA proved that PC 2 most significantly distin-guished the two sexes.
Sex determination by 3-D GM 413
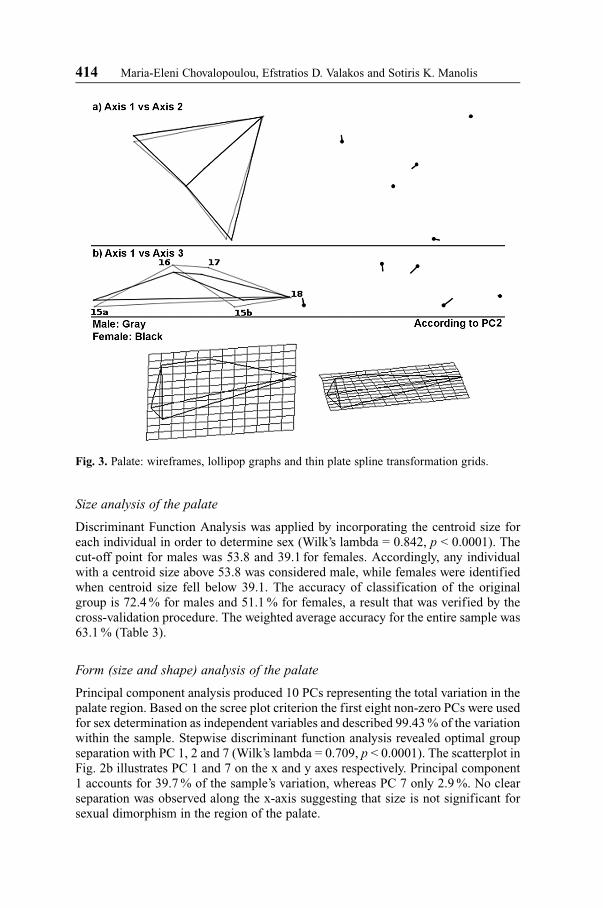
Fig. 3. Palate: wireframes, lollipop graphs and thin plate spline transformation grids.
Size analysis of the palate
Discriminant Function Analysis was applied by incorporating the centroid size foreach individual in order to determine sex (Wilk’s lambda = 0.842, p < 0.0001). Thecut-off point for males was 53.8 and 39.1 for females. Accordingly, any individualwith a centroid size above 53.8 was considered male, while females were identifiedwhen centroid size fell below 39.1. The accuracy of classification of the originalgroup is 72.4 % for males and 51.1 % for females, a result that was verified by thecross-validation procedure. The weighted average accuracy for the entire sample was63.1 % (Table 3).
Form (size and shape) analysis of the palate
Principal component analysis produced 10 PCs representing the total variation in thepalate region. Based on the scree plot criterion the first eight non-zero PCs were usedfor sex determination as independent variables and described 99.43 % of the variationwithin the sample. Stepwise discriminant function analysis revealed optimal groupseparation with PC 1, 2 and 7 (Wilk’s lambda = 0.709, p < 0.0001). The scatterplot inFig. 2b illustrates PC 1 and 7 on the x and y axes respectively. Principal component1 accounts for 39.7 % of the sample’s variation, whereas PC 7 only 2.9 %. No clearseparation was observed along the x-axis suggesting that size is not significant forsexual dimorphism in the region of the palate.
414 Maria-Eleni Chovalopoulou, Efstratios D. Valakos and Sotiris K. Manolis

Table 3. Classification accuracy using shape, form variables and centroid size for the palate.
Predicted group membership
Male Female Total
N % N % %
Shape variablesa Original group 42/58 72.4 29/45 64.4 68.9Cross-validated 42/58 72.4 29/45 64.4 68.9
Centroid size Original group 42/58 72.4 23/45 51.1 63.1Cross-validated 42/58 72.4 23/45 51.1 63.1
Form variablesb Original group 47/58 81.0 32/45 71.1 76.7Cross-validated 46/58 79.3 31/45 68.9 74.8
a – PC 1, 2 and 6b – PC 1, 2 and 7
The accuracy of classification for males and females was 81 % and 71.1 %,respectively. The cross-validation procedure produced slightly smaller numbers(79.3 %, 68.9 %), although this is not considered significant. Logistic regression onPC 1, 2 and 7 showed 39.8 % correlation between PCs and sex.
Cranial base
Twenty-five landmarks from a sample of 167 individuals (89 males, 78 females) wereexamined on the cranial base (Fig. 4) and the Procrustes distance was calculatedbetween sexes. The Procrustes distance (d = 0.02830) for this particular region is sta-tistically significant (F = 4.7263, df1 = 68, df2 = 11220, p = < 1×10–16), confirmedby a permutation test (n = 1600). Ninety-nine percent of the F distribution of the per-muted groups is smaller than the F resulted from the originally defined groups.
Fig. 4. Landmarks on the cranial base region.
Sex determination by 3-D GM 415

Shape analysis of the cranial base
Principal component analysis produced sixty-nine PCs representing the variation ofthe cranial base. Based on the scree plot criterion, the first fifteen non-zero PCs wereused for sex determination as independent variables describing 73.35 % of the varia-tion. Stepwise discriminant function analysis revealed optimal group separation withPCs 1, 2, 3, 4, 5, 7, 9, 10, 12 and 13 (Wilk’s lambda = 0.537, p < 0.0001).
The scatterplot in Fig. 5a illustrates PC 5 and PC 7 on the x- and y-axes, respec-tively. Principal component 5 accounts for 5.7 % of the sample’s variation, whereasPC 7 only 3.82 %. The accuracy of classification of the original group for males is83.1 % and for females 74.4 %. The cross-validation procedure did not yield signifi-cant differences (82 % and 71.8 % for males and females respectively). Logisticregression on PC 1, 2, 3, 4, 5, 7, 9, 10, 12 and 13 showed 60.6 % correlation betweenPCs and sex.
Fig. 5. Plots of principal components of PCA in cranial base.A: Shape space,B: Form space.
416 Maria-Eleni Chovalopoulou, Efstratios D. Valakos and Sotiris K. Manolis

Shape differences were observed at two angles formed by particular landmarks onthe cranial base (Fig. 6). The angle defined by landmarks: infraorbitale, infratempo-rale, and ovale mediale for both left and right sides was greater in female individuals,whereas the angle defined by landmarks: left foraminolaterale, opisthion, and rightforaminolaterale was greater in males. The distance between spinale and ovalemediale on both sides of the cranium was greater in male individuals. The distancesbetween landmarks: infraorbitale-infratemporale, as well as right-left infraorbitalewere greater in female individuals. Furthermore, the occipital condyles were moreelongated in males. The thin-plate spline grid shown on Fig. 6 illustrates the variationin shape of the cranial base region represented by PC 7.
Fig. 6. Cranial base: wireframes, lollipop graphs and thin plate spline transformation grids.
Sex determination by 3-D GM 417

Size analysis of the cranial base
Discriminant Function Analysis using centroid size was applied using the same pro-cedure as in the palate region described above (Wilk’s lambda = 0.842, p < 0.0001).The cut-off point for males was 208.1 and 180.1 for females. The accuracy ofclassification for the entire sample (both males and females) was 82 % (Table 4).
Form (size and shape) analysis of the cranial base
Principal component analysis produced seventy PCs representing the total variationof the cranial base region. Based on the scree plot criterion, the first ten non-zeroPCs were used in sex determination as independent variables describing 68.7 % ofthe variation. Stepwise discriminant function analysis revealed optimal group separa-tion with PC 1, 2, 3, 5, 8 and 9 (Wilk’s lambda = 0.368, p < 0.0001). The scatterplot inFig. 5b illustrates PC 1, which accounts for 22.66 % of the sample’s variation, and PC8, which accounts for 2.78 % of the sample’s variation, on the x and y axes, respectively.Strong separation was observed along the x-axis revealing the significance of size onsexual dimorphism in the region of the cranial base. The accuracy of classification formales was 94.4 %, verified by the cross-validation procedure. The accuracy of classifi-cation for the female group was 87.2 % however a cross-validation procedure produceda slightly lower accuracy of 85.9 %. Logistic regression on PC 1, 2, 3, 5, 8 and 9 resultedin a 79.7 % correlation between PCs and sex.
DiscussionFragmented, incomplete, scattered or burnt skeletal remains make sex determinationdifficult (Reichs 1986), yet anthropologists are responsible for completing the bio-logical profile despite these difficulties. Correct sex determination depends on sev-eral factors including selecting the appropriate method, the availability of anatomicalareas for inspection, as well as the significance of sexually dimorphic traits in anygiven population. Fragments of the pelvis, cranium, femoral head, and sternum usual-
Table 4. Classification accuracy using shape, form variables and centroid size for the cranialbase.
Predicted group membership
Male Female Total
N % N % %
Shape variablesa Original group 74/89 83.1 58/78 74.4 79.0Cross-validated 73/89 82.0 56/78 71.8 77.2
Centroid size Original group 70/89 78.7 67/78 85.9 82.0Cross-validated 70/89 78.7 67/78 85.9 82.0
Form variablesb Original group 84/89 94.4 68/78 87.2 91.0Cross-validated 84/89 94.4 67/78 85.9 90.4
a – PC 1, 2, 3, 4, 5, 7, 9, 10, 12 and 13b – PC 1, 2, 3, 5, 8 and 9
418 Maria-Eleni Chovalopoulou, Efstratios D. Valakos and Sotiris K. Manolis
ly lead to successful identification of sex (Kerley 1977). The study of isolated bonesor particular regions of specific bones (such as the pelvis or skull) aims to identifythose traits that are more reliable in determining sex accurately. The study of sexualdimorphism of particular bones relies on functional and hormonal differencesbetween males and females (Bijlsma 1983). The results of the present study suggestthat using a discrete number of morphological characteristics of the skull leads tosuccessful identification of sex with a rather high level of accuracy.
The palate is an essential region of the cranium and consists of two palatal pro-cesses of the maxilla and two horizontal plates of the palatal bone, all of which arelinked together by a suture (Williams 1995, Sicher & DuBrul 1977). The basic for-mation of the palatal shape is defined in early age through the process of ossificationof the apophyses of the palatal bone and the maxilla.
This current research has shown that the palate is a significant sex indicator for theGreek population, which agrees with previous work (Bass 1995, Krogman & Iscan1986, White et al. 2011). In Krogman’s (1946) study of cranial characteristics, heclassified the shape of the palatal bone as sexually dimorphic. Rogers (2005) classi-fied the ratio of size to shape of the palate in the sixth place among 17 cranial mor-phological traits used for sex identification of unknown skeletal remains. Bigoni etal. (2010) also noted important sex related differences in the region of the palate.
During growth and development (along with changes observed in adult life) theform of the palate is subject to various changes due to continuous forces applied bythe muscle of the tongue and the perioral muscles (Moorrees & Reed 1965, Raberinet al. 1993, Bishara et al. 1997). In adults, tooth loss leads to a decrease in bone massof the alveolar apophysis, thus altering the shape of the alveolar process and the depthof the palate. These factors may affect studies using the shape of the palatal region indetermining sex. In the current study, only two alveolar landmarks were employedthat are common to previous studies.
Research has demonstrated that the size of the palate is a sexually dimorphic fea-ture (Woo 1949, Larnach & Freedman 1964, Larnach & Macintosh 1966, Larnach &Macintosh 1970, Sumati & Phatak 2012). Woo (1949) studied a large diverse popula-tion of American Whites, Blacks (Negroes), Inuit (Eskimo), Native Americans(American Indians) and Central Asians (Mongolians); Larnach & Macintosh (1966,1970) studied the Coastal New South Wales series and the Queensland series respec-tively. All three researchers showed that the palate is larger in males. Sumati & Pha-tak (2012) used metric measurements of the palate of a North-Indian population andfound size classification accuracy of 70 % showing that the palate is larger in males,a trend that is supported by the current research. Suazo et al. (2008) performed shapeanalysis in a Brazilian population and noted an accuracy of 75.5 % in determining sex(males and females combined). The current research is significant because the resultsdemonstrate that palatal shape plays an important role in sex determination, yieldinghigher rates of percent correct classification than palatal size, which agrees with pre-vious work on this area of the cranium (Bigoni et al. 2010, Suazo et al. 2008). Burris& Harris (1998) showed that major discriminators between sexes were equally drivenby arch width and arch depth, which was also observed in the current study, althoughLima et al. (2012) found statistical significance only in arch depth when they exam-ined skulls from the Sao Goncalo Cemetery of Cuiaba, capital of Mato Grosso state,Brazil. One of the findings of the present study was that the combination of size andshape of the palatal region results in optimal sex classification. The variation in sex
Sex determination by 3-D GM 419

determination results observed among different researchers is caused by either popu-lation-specific differences of pronounced dimorphism in the palate, or the use of dif-ferent methods and/or landmarks for the analysis of the shape of the palatal region.
The cranial base is the most durable part of the cranium and is known to be sexu-ally dimorphic (Holland 1986, Graw 2001). The cranial base is protected by manylayers of soft tissue (Gapert et al. 2009a, Gapert et al. 2009b) and develops in earlyage, by about 8 years (Tillmann & Lorenz 1978). Hence, much research for profilingsexually dimorphic characteristics has been devoted to this particular region (Holland1986, Graw 2001). Wescott & Moore-Jansen (2001) studied a sample of 389 whiteand 133 black adult crania (20–80 years old) from the Terry and Hamann-Todd ana-tomical cadaver collections and investigated the reliability of determining both sexand ancestry based on the condylar region of the occipital bone. They found an accu-racy rate of 76 % where females were classified correctly more often than males.They also concluded that age does not have any apparent effect on the estimation ofsexual dimorphism in the basicranium. Gapert et al. (2009a) studied 158 (82 males /76 females) British adults from the St. Brides Church collection on the sexual dimor-phism in the foramen magnum. They found that the width of the foramen magnumcombined with the overall area of the foramen magnum yielded a prediction rate of70.3 %. Males were correctly classified at 70.7 % and females at 69.7 %. During thesame year they also examined the occipital condyles for sex determination. One hun-dred six 146 adult human skulls (75 males / 71 females) from the same collectionwere measured and the cross-validated classification accuracy ranged between 69.2and 76.7 % (Gapert et al. 2009b). In the present research the percent correct classifi-cation results are much higher because we combined a greater number of craniallandmarks to determine sex, which echoes the work of Holland (1986) who alsofound high levels of accuracy in classifying sex (up to 91 %) using linear discrimi-nant function analysis on nine measurements from the cranial base on 100 craniafrom the Terry collection.
In the Greek population, statistically significant sex-specific differences werefound in the cranial base. These results are consistent with research on other popula-tions (Franklin et al. 2006a, Bruner & Ripani 2008), even though Bigoni et al. (2010)found no statistically significance difference in sexual dimorphism of the cranialbase in 139 crania of a Bohemian population.
For the Greek population, male individuals consistently yielded a higher correct-classification rate independently of either shape or form analysis. On the contrary,size analysis resulted in a higher correct classification rate for females. All previousresearch demonstrates the significance of sexual dimorphism in the region of the cra-nial base; however 3-D GM used in the present study yields higher correct-classifica-tion results compared to other morphometric techniques. Finally, the utilization ofcombined shape and size analysis along with the particular selection of landmarksproduced remarkably high rates of sex estimation accuracy.
ConclusionThree-dimensional geometric morphometric techniques are an alternative tool forsex determination of unknown skeletal remains. In addition to size differences thathave long been identified through traditional morphometric methods, 3-D GM
420 Maria-Eleni Chovalopoulou, Efstratios D. Valakos and Sotiris K. Manolis
allows for accurate shape comparison of skeletal features. Results of the currentresearch demonstrate that it is possible to identify both size and shape differencesbetween males and females in certain regions of the cranium through DiscriminantFunction Analysis that lead to accurate assignment of sex. The next study will exam-ine different regions/features of the skull to classify the significance of sexuallydimorphic traits in modern Greeks. For now, it is clear that 3-D GM is an importanttool for determining sex in modern Greek populations in both bioarchaeological andforensic examinations.
AcknowledgementsAuthors are grateful to Georgios Liras for providing with the Microscribe equipment. Specialthanks to Stephanie Calce and Costa Eliopoulos for their recommendations in improving thiswork.
ReferencesBarrio, P.A., Trancho, G.J. & Sanchez, J.A. (2006): Metacarpal sexual determination in a
Spanish population. – J. Forensic Sci. 51, 990–995.Bass, WM. (1995): Human Osteology: A Laboratory and Field Manual, 4th ed. – Missouri
Archaeological Society, Columbia.Bidmos, M. (2006): Metrical and non-metrical assessment of population affinity from the
calcaneus. – Forensic Sci. Int. 159, 6–13.Bigoni, L., Velemınska, J. & Bruzek, J. (2010): Three-dimensional geometric morphometric
analysis of craniofacial sexual dimorphism in a Central European sample of known sex. –Homo J. Comp. Hum. Biol. 61, 16–32.
Bijlsma, J.W.J. (1983): Hormones and Bone: Influences of Growth Hormone, Thyroid andGonadal Hormones on Bone Metabolism. – Helmond Wibro, pp. 1–143.
Birkby, W.H. (1966): An evaluation of race and sex identification from cranial measure-ments. – Am. J. Phys. Anthropol. 24, 21–27.
Bishara, S.E., Jakobsen, J.R., Treder, J. & Nowak, A. (1997): Arch width changes from6 weeks to 45 years of age. – Am. J Orthod. Dentofac. Orthop. 111, 401–409.
Bookstein, F.L., Chernoff, B., Elder, R.L., Humphries, J.M., Smith, G.R. & Strauss, R.E.(1985): Morphometrics in evolutionary biology. – Spec. Publ. Acad. Nat. Sci. Philad. 15,1–277.
Braga, J. & Treil, J. (2007): Estimation of pediatric skeletal age using geometric morphomet-rics and three dimensional cranial size changes. – Int. J. Legal Med. 121, 439–443.
Bruner, E. & Ripani, M. (2008): A quantitative and descriptive approach to morphologicalvariation of the endocranial base in Modern humans. – Am. J. Phys. Anthropol. 137, 30–40.
Bruzek, J. & Murail, P. (2006): Methodology and reliability of sex determination from theskeleton. – In: Schmitt, A., Cunha, E. & Pinheiro, J. (eds): Forensic Anthropology andMedicine: Complementary Sciences from Recovery to Death. – Humana Press, Totowa,pp. 225–242.
Buck, T.J. & Vidarsdottir, U.S. (2004): A proposed method for the identification of race insub-adult skeletons: a geometric morphometric analysis of mandibular morphology. – J.Forensic Sci. 49, 1159–1164.
Buikstra, J.E. & Ubelaker, D.H. (1994): Standards for data collection from human skeletalremains. – Arkansas Archaeological Survey, Fayetteville, AK.
Burns, K.R. (1999): The Forensic Anthropology Training Manual. – Prentice-Hall, UpperSaddle River, New Jersey.
Sex determination by 3-D GM 421

Burris, B.G. & Harris, E.F. (1998): Identification of race and sex from palate dimensions. –J. Forensic Sci. 43, 959–963.
Charisi, D., Eliopoulos, C., Vanna, V., Koilias, C.G. & Manolis, S.K. (2011): Sexual Dimor-phism of the Arm Bones in a Modern Greek Population. – J. Forensic Sci. 56, 10–18.
Corti, M. (1993): Geometric morphometrics: an extension of the revolution. – Trends Ecol.Evol. 8, 302–303.
Eliopoulos, C., Lagia, A. & Manolis, S. (2007): A modern, documented human skeletal col-lection from Greece. – Homo J. Comp. Hum. Biol. 58, 221–228.
Franklin, D., Freedman, L. & Milne, N. (2005): Sexual dimorphism and discriminant func-tion sexing in indigenous South African crania. – Homo J. Comp. Hum. Biol. 55, 213–228.
Franklin, D., Freedman, L., Milne, N. & Oxnard, C.E. (2006a): A geometric morphometricstudy of sexual dimorphism in the crania of indigenous southern Africans. – S. Afr. J. Sci.102, 229–238.
Franklin, D., O’Higgins, P., Oxnard, C.E. & Dadour, I. (2006b): Determination of sex inSouth African blacks by discriminant function analysis of mandibular linear dimensions.A preliminary investigation using the Zulu local population. – Forensic Sci. Med. Pathol.2, 263–268.
Franklin, D., Freedman, L., Milne, N. & Oxnard, C.E. (2007a): Geometric morphometricstudy of population variation in indigenous Southern African crania. – Am. J. Hum. Biol.19, 20–33.
Franklin, D., Oxnard, C.E., O’Higgins, P. & Dadour, I. (2007b): Sexual dimorphism in thesubadult mandible: quantification using geometric morphometrics. – J. Forensic Sci. 52,6–10.
Frutos, L.R. (2005): Metric determination of sex from the humerus in a Guatemalan forensicsample. – Forensic Sci. Int. 147, 153–157.
Gapert, R., Black, S. & Last, J. (2009a): Sex determination from the foramen magnum: Dis-criminant function analysis in an eighteenth and nineteenth century British Sample. – Int.J. Leg. Med. 123, 25–33.
Gapert, R., Black, S. & Last, J. (2009b): Sex determination from the occipital condyle: Dis-criminant function analysis in an Eighteenth and Nineteenth Century British sample. –Am. J. Phys. Anthropol. 138, 384–394.
Giles, E. & Elliot, O. (1963): Sex determination by discriminant function analysis of crania.– Am. J. Phys. Anthropol. 21, 53–68.
Giles, E. (1964): Sex determination by discriminant function analysis of the mandible. – Am.J. Phys. Anthropol. 22, 129–135.
Goodall, C.R. (1991): Procrustes methods in the statistical analysis of shape (with discus-sion). – J. Roy. Statist. Soc. (Ser. B) 53, 285–339.
Graw, M. (2001): Morphometrische and morphognostische Geschlechtsdiagnostik an dermenschlichen Schädelbasis. – In: Oehmichen, M. & Geserick, G. (eds): OsteologischeIdentifikation and Altersschätzung. – Schmidt-Römhild, Lübeck, pp. 103–121.
Gualdi-Russo, E. (2007): Sex determination from the talus and calcaneus measurements. –Forensic Sci. Int. 171, 151–156.
Hanihara, K. (1959): Sex diagnosis of Japanese skulls by means of discriminant function. –J. Anthropol. Soc. Nippon 67, 191–197.
Henke, W. (1974): Zur Methode der diskriminanzanalytischen Geschlechtsbestimmung amSchädel. – Homo J. Comp. Hum. Biol. 24, 99–117.
Holland, T.D. (1986): Sex determination of fragmentary crania by analysis of crania base. –Am. J. Phys. Anthropol. 70, 203–208.
Hoyme, L.E. St. & Iscan, M.Y. (1989): Determination of sex and race: accuracy and assump-tions. – In: Iscan, M.Y. & Kennedy, K.A.R. (eds): Reconstruction of Life from the Skele-ton. – Alan R. Liss, New York, pp. 53–93.
Jolliffe, I.T. (2002): Principal Component Analysis, 2nd ed. – Springer-Verlag, pp. 112–133.
422 Maria-Eleni Chovalopoulou, Efstratios D. Valakos and Sotiris K. Manolis

Kemkes-Grottenthaler, A. (2005): Sex determination by discriminant analysis: an evaluationof the reliability of patella measurements. – Forensic Sci. Int. 147, 129–133.
Kerley, E.R. (1977): Forensic anthropology. – In: Tedeschi, C.G., Eckert, W.G. & Tedeschi,L.G. (eds): Forensic Medicine. – WB Saunders Company, Philadelphia, pp. 1101–1115.
Kimmerle, E.H., Ross, A. & Slice, D.E. (2008): Sexual dimorphism in America: geometricmorphometric analysis of the craniofacial region. – J. Forensic Sci. 53, 54–57.
Klingenberg, C.P. (2011): MORPHOJ: an integrated software package for Geometric Mor-phometrics. – Mol. Ecol. Res. 11, 353–357.
Kranioti, E.F., Iscau, M.Y. & Michalodimitrakis, M. (2008): Craniometric analysis of themodern Cretan population. – Forensic Sci. Int. 180, 110.e1–e5.
Kranioti, E.F., Bastir, M., Sanchez-Meseguer, A. & Rosas, A. (2009a): A geometric-morpho-metric study of the Cretan humerus for sex identification. – Forensic Sci. Int. 189, 111.e1–e8.
Kranioti, E.F. & Michalodimitrakis, M. (2009b): Sexual dimorphism of the humerus in con-temporary Cretans – a population-specific study and a review of the literature.– J. Foren-sic Sci. 54, 996–1000.
Krogman, W.M. (1946): Skeleton in Forensic medicine. – Transact. Inst. Med. Chicago 16,154–167.
Krogman, W.M. & Iscan, M.Y. (1986): The Human Skeleton in Forensic Medicine. – CharlesC. Thomas, Springfield, IL.
Larnach, S.L. & Freedman, L. (1964): Sex determination of aboriginal crania from CoastalNew South Wales, Australia. – Records of the Australian Museum 26, 295–308.
Larnach, S.L. & Macintosh, N.W.G. (1966): The craniology of the aborigines of Coastal NewSouth Wales. – The Oceania Monographs 13, 72–73.
Larnach, S.L. & Macintosh, N.W.G. (1970): The craniology of the aborigines of Queensland.– The Oceania Monographs 15, 58–59.
Lima, L.N.C., de Oliveira, O.F., Sassi, C., Picapedra, A., Francesquini, L. Jr. & Daruge, E. Jr.(2012): Sex Determination by Linear Measurements of Palatal Bones and Skull Base. –JFOS 30, 37–44.
Manolis, S.K., Eliopoulos, C., Koilias, C.G. & Fox, S.C. (2009): Sex determination usingmetacarpal biometric data from the Athens Collection. – Forensic Sci. Int. 193, 130.e1–e6.
Mays, S. & Cox, M. (2000): Sex determination in skeletal remains. – In: Cox, M. & Mays, S.(eds): Human Osteology in Archaeology and Forensic Science. – Greenwich MedicalMedia, London, pp. 117–130.
Meindl, R.S., Lovejoy, C.O., Mensford, R.S. & Don-Carlos, L. (1985): Accuracy and direc-tion of error in the sexing of the skeleton: implication for paleodemography. – Am. J.Phys. Anthropol. 68, 79–85.
Moorrees, C.F.A. & Reed, R.B. (1965): Changes in dental arch dimensions expressed on thebasis of tooth eruption as a measure of biologic age. – J. Dent. Res. 44, 129–141.
Mountrakis, C., Eliopoulos, C., Koilias, C.G. & Manolis, S.K. (2010): Sex determinationusing metatarsal osteometrics from the Athens collection. – Forensic Sci. Int. 178, e1–e7.
Novotny, V., Iscan, M.Y. & Loth, S.R. (1993): Morphologic and osteometric assessment ofage, sex, and race from the skull. – In: Iscan, M.Y. & Helmer, R.P. (eds): Forensic analysisof the skull. – Wiley-Liss, New York, pp. 71–88.
O’Higgins, P. & Jones, N. (2006): Tools for statistical shape analysis. – Hull York MedicalSchool.
Oettle, A.C., Pretorius, E. & Steyn, M. (2005): Geometric morphometric analysis of mandib-ular ramus flexure. – Am. J. Phys. Anthropol. 128, 623–629.
Papaloucas, C., Fiska, A. & Demetriou, T. (2008): Sexual dimorphism of the hip joint inGreeks. – Forensic Sci. Int. 179, 83.e1–e.3
Pretorius, E., Steyn, M. & Scholtz, Y. (2006): Investigation into the usability of geometricmorphometric analysis in assessment of sexual dimorphism. – Am. J. Phys. Anthropol.129, 64–70.
Sex determination by 3-D GM 423

Raberin, M., Laumon, B., Martin, J.L. & Brunner, F. (1993): Dimensions and form of dentalarches in subjects with normal occlusions. – Am. J. Orthod. Dentofac. Orthop. 104, 67–72.
Reichs, K.J. (1986) Forensic osteology: Advances in the identification of human remains inForensic implications of skeletal pathology: sex. – Charles C Thomas Publishers, Spring-field Illinois, p. 113.
Rogers, T.L. (2005): Determining the sex of human remains through cranial morphology. –J. Forensic Sci. 50, 493–500.
Rohlf, F.J. (1996): Morphometrics spaces, shape components and the effects of linear trans-formations. – In: Marcus, L.F., Corti, M., Loy, A., Naylor, G.J.P. & Slice, D.E. (eds):Advances in Morphometrics. – Plenum Press, New York, pp. 117–129.
Rösing, F.W., Graw, M., Marre, B., Ritz-Timme, S., Rothschild, M.A., Rötzscher, K., Schme-ling, A., Schröder, I. & Geserick, G. (2007): Recommendations for the forensic diagnosisof sex and age from skeletons. – Homo J. Comp. Hum. Biol. 58, 75–89.
Ross, A.H., Kimmerle, E.H., Slice, D.E. & Falsetti, A.B. (2006): What matters – size orshape? Three-dimensional analysis of craniofacial sexual variation among American pop-ulations [published abstract]. – American Academy of Forensic Sciences, WA 12, 279.
Ross, A.H., McKeown, A.H. & Konigsberg, L.W. (1999): Allocation of crania to groups viathe “new morphometry”. – J. Forensic Sci. 44, 584–587.
Sheets, H.D. & Mitchell, C.E. (2001): Why the null matters: statistical tests, random walksand evolution. – Genetica 112, 105–125.
Sicher, H. & DuBrul, E.L. (1977): Anatomia bucal. 7th ed. – Guanabara Koogan, Rio deJaneiro, p. 38.
Slice, D.E. (2005): Modern morphometrics. – In: Slice, D.E. (ed.): Modern Morphometricsin Physical Anthropology. – Kluwer Academic/Plenum Publishers, New York, pp. 1–45.
Slice, D.E. (2007): Geometric morphometrics. – Ann. Rev. Anthropol. 36, 261–281.Snow, F.J. (2004): Geometric Morphometric Analysis of the Scapula: Implications for the
Determination of Sex and Ancestry. – Ph.D. dissertation, University of Tennessee, Knox-ville.
Steyn, M., Pretorius, E. & Hutten, L. (2004): Geometric morphometric analysis of the greatersciatic notch in South Africans. – Homo J. Comp. Hum. Biol. 54, 197–206.
Steyn, M. & Iscau, M.Y. (2008): Metric sex determination from the pelvis in modern Greeks.– Forensic Sci. Int. 179, 86.e1–e6
Suazo, G.I.C., Zavando, M.D.A. & Smith, R.L. (2008): Sex determination using mastoid pro-cess measurements in Brazilian skulls. – Int. J. Morphol. 26, 941–944.
Sumati, P.W.G. & Phatak, A. (2012): Determination of sex from hard palate by discriminantfunction analysis. – Int. J. Basic Appl. Med. Sci. 2, 243–251.
Tilman, B. & Lorenz, R. (1978): The Stress at the Human Atlanto-Occipital Joint. – Anat.Embryol. 153, 269–277.
Wärmländer, S.K.T.S. & Sholts, S.B. (2011): A note on the statistics of the Suchey-Brooksmethod for pubic bone age estimation: implications for regional comparisons. – Sci. Jus-tice 51, 131–134.
Wescott, D.J. & Moore-Jansen, P.H. (2001): Metric variation in the human occipital bone:forensic anthropological applications. – J. Forensic Sci. 46, 1159–1163.
White, T.D., Black, M.T. & Folkens, P.A. (2011): Human osteology, 3rd ed. – Academic Press,Amsterdam.
Williams, B.A. & Rogers, T.L. (2006): Evaluating the accuracy and precision of cranial mor-phological traits for sex determination. – J. Forensic Sci. 51, 729–735.
Williams, P.L. (1995): Gray’s Anatomy. 38th ed. – Churchill Livingstone, New York.Woo, J.K. (1949): Direction and type of transverse palatine suture and its relation to the form
of hard palate. – Am. J. Phys. Anthrop. 7 (NS), 385–399.
424 Maria-Eleni Chovalopoulou, Efstratios D. Valakos and Sotiris K. Manolis

Zelditch, M.L., Swiderski, D.L, Sheets, H.D. & Fink, W.L. (2004): Geometric Morphomet-rics for Biologists: A Primer. – Elsevier Academic Press, pp. 156–170.
Submitted: 2013-May-07;accepted: 2013-September-09.
Address for correspondence: Maria-Eleni Chovalopoulou, BA, Department of Animal andHuman Physiology, Faculty of Biology, School of Sciences, University of Athens, Panepisti-miopolis, GR 157 81 Athens, [email protected]
Sex determination by 3-D GM 425
Copyright © 2022 FDOKUMEN