Serial magnetic resonance imaging in patients with Bal�'s concentric sclerosis: Natural history of...
23
Sleep Disorders in Children with Blindness Damien Leger, MD,*² Elisabeth Prevot, MD,² Pierre Philip, MD,² Charlotte Yence, MA,² Nadine Labaye, MD,² Michel Paillard, MD,² and Christian Guilleminault, MD* To evaluate the frequency and type of sleep disorders seen in blind children compared with matched controls, a 42-item questionnaire was used on 156 children (77 blind children) ranging from 3 to 18 years of age. A total of 17.4% of blind children reported sleeping less than 7 hours per night on weekdays compared with 2.6% of controls, with blind children awakening much earlier. Blind children had more sleep complaints, and 13.4% of blind subjects had daily episodes of involuntary sleepi- ness compared with 1.3% of controls. Blindness has an impact on sleep and alertness that adds to the primary disability. Leger D, Prevot E, Philip P, Yence C, Labaye N, Paillard M, Guilleminault C. Sleep disorders in children with blindness. Ann Neurol 1999;46:648 – 651 Blindness is an extensively researched disability, but only a few studies have investigated sleep disorders in the blind child. 1–3 Loss of vision may have an impor- tant impact on the sleep/wake cycle, because light has been demonstrated to be a powerful pacemaker of the human biological clock. 4–6 Blindness associated with impaired light perception has been linked to distur- bance of the biological clock and to the occurrence of various sleep disorders. 1–3,7–9 A preliminary report of 1,073 adult blind individuals indicated that the preva- lence of sleep complaints and sleep disorders was high. 10 There is, however, no information concerning problems occurring in childhood as a result of blind- ness and the additional handicaps that a secondary sleep disorder may cause. Population The Association Valentin Hau ¨y oversees all schools (from preschool to high school) dedicated to the instruction of children with blindness. At the time of the survey, about 600 blind children were registered with the Association. Four schools that the Association deemed to be representative of the general population of blind children in age range and geographic location were selected to participate in the study. All children and teen-agers up to 18 years of age who sub- mitted parental and child informed consent forms were en- tered into the study. A total of 80 children (92%) partici- pated in the study. A control group of children with normal vision (possibly corrected by glasses) and no disability, who were matched for age, gender, and academic level, was sought in the Yvelines region of France. The matched control group was drawn from different school districts in the region to obtain an ap- propriate socioeconomic and geographic (eg, rural, urban) match. Instrument Our research tool was a 42-item questionnaire based on the Stanford questionnaire 11 and that developed by Brouillette and co-workers. 12 Our questionnaire has been used in teen- agers, validated (in translation) in a representative sample of the French population, 13 and used in a study of blind adults. 10 The questions were derived from the minimum cri- teria for the definition of sleep/wake disorders outlined in the fourth edition of the Diagnostic and Statistical Manual of Mental Disorders (DSM-IV) 14 and the 1990 International Classification of Sleep Disorders (ICSD-90). 15 The questionnaire investigated sleep/wake habits, sleep complaints, symptoms associated with sleep disorders, dis- turbed nocturnal sleep, daytime alertness, and daytime con- sequences of disturbed nocturnal sleep. It also included gen- eral questions concerning health, blindness, and academic level. The Association Valentin Hau ¨y provided medical infor- mation on the severity of blindness and on light vision as assessed by ophthalmologists who regularly examined these children at school. The questionnaire was distributed to blind subjects through the Association Valentin Hau ¨y and to controls through their teachers. The questionnaire was completed by the child alone or with parental help if the subject was too young. Statistical Analysis Descriptive statistics were applied to the collected data. If normalcy of distribution was not demonstrated, the Mann- Whitney U test was used. Differences in proportions of com- plaints and diagnoses and in proportions of frequency and duration were evaluated by x 2 statistics as were assessments of the roles of light and age at onset of blindness (congenital vs acquired). Results Population The 2 subject groups were not significantly different in age, gender, or academic level even when taking drop- outs into account. Of a total of 160 potential subjects, 77 blind subjects (96%; 46 boys and 31 girls) and 79 From the *Stanford University Sleep Disorders Center, Stanford, CA; and ²Laboratoire du Sommeil, Centre Hospitalier Universitaire de l’Hotel-Dieu a ` Paris, Paris, France. Received Dec 7, 1998, and in revised form May 18 and May 24, 1999. Accepted for publication May 28, 1999. Address correspondence to Dr Guilleminault, Stanford University Sleep Disorder Center, 401 Quarry Road, Suite 3301, Stanford, CA 94305. BRIEF COMMUNICATIONS 648 Copyright © 1999 by the American Neurological Association
-
Upload
independent -
Category
Documents
-
view
5 -
download
0
Transcript of Serial magnetic resonance imaging in patients with Bal�'s concentric sclerosis: Natural history of...
Sleep Disorders in Childrenwith BlindnessDamien Leger, MD,*† Elisabeth Prevot, MD,†Pierre Philip, MD,† Charlotte Yence, MA,†Nadine Labaye, MD,† Michel Paillard, MD,†and Christian Guilleminault, MD*
To evaluate the frequency and type of sleep disordersseen in blind children compared with matched controls, a42-item questionnaire was used on 156 children (77blind children) ranging from 3 to 18 years of age. A totalof 17.4% of blind children reported sleeping less than 7hours per night on weekdays compared with 2.6% ofcontrols, with blind children awakening much earlier.Blind children had more sleep complaints, and 13.4% ofblind subjects had daily episodes of involuntary sleepi-ness compared with 1.3% of controls. Blindness has animpact on sleep and alertness that adds to the primarydisability.
Leger D, Prevot E, Philip P, Yence C, Labaye N,Paillard M, Guilleminault C. Sleep disorders
in children with blindness.Ann Neurol 1999;46:648–651
Blindness is an extensively researched disability, butonly a few studies have investigated sleep disorders inthe blind child.1–3 Loss of vision may have an impor-tant impact on the sleep/wake cycle, because light hasbeen demonstrated to be a powerful pacemaker of thehuman biological clock.4–6 Blindness associated withimpaired light perception has been linked to distur-bance of the biological clock and to the occurrence ofvarious sleep disorders.1–3,7–9 A preliminary report of1,073 adult blind individuals indicated that the preva-lence of sleep complaints and sleep disorders washigh.10 There is, however, no information concerningproblems occurring in childhood as a result of blind-ness and the additional handicaps that a secondarysleep disorder may cause.
PopulationThe Association Valentin Hauy oversees all schools (frompreschool to high school) dedicated to the instruction ofchildren with blindness. At the time of the survey, about 600
blind children were registered with the Association. Fourschools that the Association deemed to be representative ofthe general population of blind children in age range andgeographic location were selected to participate in the study.All children and teen-agers up to 18 years of age who sub-mitted parental and child informed consent forms were en-tered into the study. A total of 80 children (92%) partici-pated in the study.
A control group of children with normal vision (possiblycorrected by glasses) and no disability, who were matched forage, gender, and academic level, was sought in the Yvelinesregion of France. The matched control group was drawnfrom different school districts in the region to obtain an ap-propriate socioeconomic and geographic (eg, rural, urban)match.
InstrumentOur research tool was a 42-item questionnaire based on theStanford questionnaire11 and that developed by Brouilletteand co-workers.12 Our questionnaire has been used in teen-agers, validated (in translation) in a representative sample ofthe French population,13 and used in a study of blindadults.10 The questions were derived from the minimum cri-teria for the definition of sleep/wake disorders outlined inthe fourth edition of the Diagnostic and Statistical Manual ofMental Disorders (DSM-IV)14 and the 1990 InternationalClassification of Sleep Disorders (ICSD-90).15
The questionnaire investigated sleep/wake habits, sleepcomplaints, symptoms associated with sleep disorders, dis-turbed nocturnal sleep, daytime alertness, and daytime con-sequences of disturbed nocturnal sleep. It also included gen-eral questions concerning health, blindness, and academiclevel.
The Association Valentin Hauy provided medical infor-mation on the severity of blindness and on light vision asassessed by ophthalmologists who regularly examined thesechildren at school.
The questionnaire was distributed to blind subjectsthrough the Association Valentin Hauy and to controlsthrough their teachers. The questionnaire was completed bythe child alone or with parental help if the subject was tooyoung.
Statistical AnalysisDescriptive statistics were applied to the collected data. Ifnormalcy of distribution was not demonstrated, the Mann-Whitney U test was used. Differences in proportions of com-plaints and diagnoses and in proportions of frequency andduration were evaluated by x2 statistics as were assessmentsof the roles of light and age at onset of blindness (congenitalvs acquired).
ResultsPopulationThe 2 subject groups were not significantly different inage, gender, or academic level even when taking drop-outs into account. Of a total of 160 potential subjects,77 blind subjects (96%; 46 boys and 31 girls) and 79
From the *Stanford University Sleep Disorders Center, Stanford,CA; and †Laboratoire du Sommeil, Centre Hospitalier Universitairede l’Hotel-Dieu a Paris, Paris, France.
Received Dec 7, 1998, and in revised form May 18 and May 24,1999. Accepted for publication May 28, 1999.
Address correspondence to Dr Guilleminault, Stanford UniversitySleep Disorder Center, 401 Quarry Road, Suite 3301, Stanford, CA94305.
BRIEF COMMUNICATIONS
648 Copyright © 1999 by the American Neurological Association

controls (98.75%; 44 boys and 35 girls) participated inthe study. The mean age was 12.4 6 4.4 years for theblind children and 12.4 6 4.5 years for the controlchildren (range, 3–18 years in both groups).
None of the subjects presented any chronic illnessaside from blindness. There was no difference in bodymass index between groups (19 6 3.7 vs 19.1 6 3.2kg/m2 in the blind and control groups, respectively).Mean visual acuity was 0.6 6 1.5 and 0.7 6 1.6 dec-imal versus 8.4 6 3.1 and 8.3 6 3.1 decimal for rightand left eyes in the blind and control groups, respec-tively (p 5 0.001).
Of the blind children included in this study, 53(74.6%) were considered to be blind during the peri-natal period, and 18 (25.4%) became legally blind after1 year of life (unknown in 6 children). At the time ofthe study, 73.2% of the blind children were diagnosedas totally blind with no light perception and no pupil-lary reflexes, and 26.8% were considered to be “almostblind” but had light perception.
Sleep HabitsMean total sleep time was similar in both subjectgroups independent of age. The mean total sleep timefor the 2 groups was 526 6 61 minutes (blind chil-dren) versus 548 6 61 minutes (controls) duringweekdays and 600 6 69 minutes (blind children) ver-sus 601 6 61 minutes (controls) on weekends. Totalsleep time was less on weekdays compared with week-ends in both groups. This reduction in weekday totalsleep time was noted to begin at the age of 3 years inboth blind children and controls.
A total of 17.4% of blind children reported sleepingless than 7 hours per night on weekdays comparedwith 2.6% of controls (p 5 0.0009). The ages of thesechildren ranged from 3 to 17 years in the blind groupand from 10 to 17 years in controls. Far fewer childrenreported sleeping less than 7 hours per night on theweekend (5% of blind children vs 2.5% of controls;NS). Bedtime was fairly consistent in the total popu-lation as a result of school schedules (morning schoolschedules were similar in all of the schools selected).Blind children did not go to bed later than the con-trols: 13% of blind children and 23% of controls wentto bed after 11:00 PM on weekdays (NS). Blind chil-dren, however, got up much earlier than controls(32.5% got up before 6:00 AM vs 2.6% of controls;p 5 0.0001).
The “wake-up time” was obtained from the childrenthemselves and from their parents or caregivers. Thereappears to be a discrepancy in the data in that the totalsleep time for controls and blind children was similar,although blind children awakened earlier. The discrep-ancy is superficial, however, because blind children fellasleep more often in the daytime.
Sleep ComplaintsBlind subjects had many more complaints than con-trols:
1. Thirty-five percent claimed difficulties in initiat-ing sleep versus 24% of controls (p 5 0.005),and 7% acknowledged “regularly” taking sleep-ing pills to fall asleep (mean age, 12.7 years;range, 6–17 years) versus 0% of controls. Therewas, however, a discrepancy in the results. Theaverage sleep latency was not reported as beingsignificantly different between the 2 groups(29.1 6 37.5 minutes in blind children vs23.8 6 20 minutes in controls; NS), despite atrend toward higher sleep latency in blind chil-dren. Analysis of the SD, however, indicates agreater variability of sleep latency in the blindchildren (37 vs 20 minutes). This indicates thatmore extreme (ie, shorter and longer) sleep laten-cies were seen in children with blindness.
2. Awakening too early was reported by 30% of in-dex cases versus 9% of controls (p , 1024).
3. Sleep of poor quality was reported by 22.4% ofblind children versus 2.6% of controls (p ,1024).
4. Interestingly, an overall feeling of sleep loss wasasserted by a high proportion of both groups:50% of index cases and 34% of controls (NS).
Number of Sleep ProblemsThe number of sleep problems was tabulated followingthe criteria outlined in DSM-IV. Blind subjects alwayshad a higher score than controls (Table 1).
Daytime SleepinessExcessive daytime sleepiness was assessed by the ques-tions indicated in Table 2. Overall, 53.4% of blindchildren and 59.2% of controls had negative responsesto all questions; 25.3% of blind children and 21.1% ofcontrols acknowledged “sometimes” taking a nap (NS),but 13.4% of index cases versus 1.3% of controls (p ,
Table 1. Number of Sleep Problems
SubjectsReporting
Percentage ofBlind Children(77 5 100%)
Percentage ofSighted Controls(79 5 100%) p
One problem 79.0 63.3 0.022Two problems 48.0 25.3 1024
Three problems 23.4 7.6 1024
Four problems 11.7 5.1 1024
Five problems 6.5 0 1024
p 5 Comparison between severe blind children and controls (x2).
Brief Communication: Leger et al: Sleep Disorders in Blind Children 649
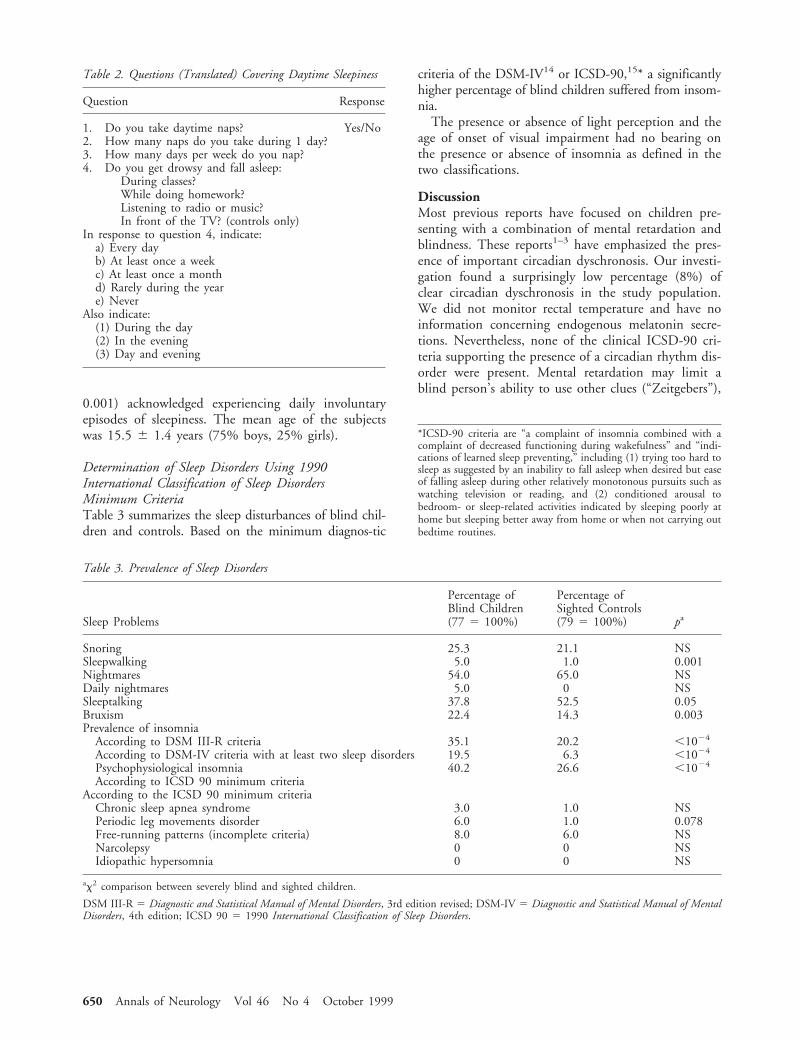
0.001) acknowledged experiencing daily involuntaryepisodes of sleepiness. The mean age of the subjectswas 15.5 6 1.4 years (75% boys, 25% girls).
Determination of Sleep Disorders Using 1990International Classification of Sleep DisordersMinimum CriteriaTable 3 summarizes the sleep disturbances of blind chil-dren and controls. Based on the minimum diagnos-tic
criteria of the DSM-IV14 or ICSD-90,15* a significantlyhigher percentage of blind children suffered from insom-nia.
The presence or absence of light perception and theage of onset of visual impairment had no bearing onthe presence or absence of insomnia as defined in thetwo classifications.
DiscussionMost previous reports have focused on children pre-senting with a combination of mental retardation andblindness. These reports1–3 have emphasized the pres-ence of important circadian dyschronosis. Our investi-gation found a surprisingly low percentage (8%) ofclear circadian dyschronosis in the study population.We did not monitor rectal temperature and have noinformation concerning endogenous melatonin secre-tions. Nevertheless, none of the clinical ICSD-90 cri-teria supporting the presence of a circadian rhythm dis-order were present. Mental retardation may limit ablind person’s ability to use other clues (“Zeitgebers”),
*ICSD-90 criteria are “a complaint of insomnia combined with acomplaint of decreased functioning during wakefulness” and “indi-cations of learned sleep preventing,” including (1) trying too hard tosleep as suggested by an inability to fall asleep when desired but easeof falling asleep during other relatively monotonous pursuits such aswatching television or reading, and (2) conditioned arousal tobedroom- or sleep-related activities indicated by sleeping poorly athome but sleeping better away from home or when not carrying outbedtime routines.
Table 2. Questions (Translated) Covering Daytime Sleepiness
Question Response
1. Do you take daytime naps? Yes/No2. How many naps do you take during 1 day?3. How many days per week do you nap?4. Do you get drowsy and fall asleep:
During classes?While doing homework?Listening to radio or music?In front of the TV? (controls only)
In response to question 4, indicate:a) Every dayb) At least once a weekc) At least once a monthd) Rarely during the yeare) Never
Also indicate:(1) During the day(2) In the evening(3) Day and evening
Table 3. Prevalence of Sleep Disorders
Sleep Problems
Percentage ofBlind Children(77 5 100%)
Percentage ofSighted Controls(79 5 100%) pa
Snoring 25.3 21.1 NSSleepwalking 5.0 1.0 0.001Nightmares 54.0 65.0 NSDaily nightmares 5.0 0 NSSleeptalking 37.8 52.5 0.05Bruxism 22.4 14.3 0.003Prevalence of insomnia
According to DSM III-R criteria 35.1 20.2 ,1024
According to DSM-IV criteria with at least two sleep disorders 19.5 6.3 ,1024
Psychophysiological insomnia 40.2 26.6 ,1024
According to ICSD 90 minimum criteriaAccording to the ICSD 90 minimum criteria
Chronic sleep apnea syndrome 3.0 1.0 NSPeriodic leg movements disorder 6.0 1.0 0.078Free-running patterns (incomplete criteria) 8.0 6.0 NSNarcolepsy 0 0 NSIdiopathic hypersomnia 0 0 NS
ax2 comparison between severely blind and sighted children.
DSM III-R 5 Diagnostic and Statistical Manual of Mental Disorders, 3rd edition revised; DSM-IV 5 Diagnostic and Statistical Manual of MentalDisorders, 4th edition; ICSD 90 5 1990 International Classification of Sleep Disorders.
650 Annals of Neurology Vol 46 No 4 October 1999
particularly social cues. Klerman and associates16 haveshown that nonphotic synchronizers can entrain the hu-man circadian pacemaker and permit blind individualsto have a 24-hour day. The absence of other disabilitiesin our population would make it possible for other sen-sory input to compensate for this lack of synchronizers.The absence of circadian dyschronosis, however, did notindicate an absence of sleep/wake problems.
A potential limitation of our study is that portionsof our questionnaire were based on ICSD-90 criteria,which were established mainly with older children andadults in mind. This limitation, however, should applyequally to both blind and control children, and we be-lieve that the comparisons we make between groups arestill valid. Independent of the classification used(DSM-IV or ICSD-90), blind children are more af-fected by “insomnia.” One of the major problems isthe early awakening reported by our index cases, par-ticularly on school days. Perhaps situational anxiety re-lated to the need to be ready for school on time wasinvolved in this early awakening. The ensuing daytimesleepiness adds a new dimension to the child’s disabil-ity and may have an impact on learning.
References1. Okawa M, Nanami T, Shimizu T, et al. Four congenitally
blind children with circadian sleep-wake rhythm disorder. Sleep1987;10:101–110
2. Palm L, Blennow G, Wetterberg L. Correction of non–24-hoursleep/wake cycle by melatonin in a blind retarded boy. AnnNeurol 1991;29:336–339
3. Mindell JA, Goldberg R, Fry JM. Treatment of a circadianrhythm disorder in a blind 2-year-old child. Sleep Res 1994;23:101 (Abstract)
4. Aschoff J. Circadian rhythm in man. Science 1965;148:1427–1432
5. Czeisler CA, Richardson GR, Zimmerman JC. Entrainment ofhuman circadian rhythms by light-dark cycles: A re-assessment.Photochem Photobiol 1981;34:239–247
6. Klerman EB, Dijk DJ, Kronauer RE, Czeisler CA. Simulationsof light effects on the human circadian pacemaker: Implicationsfor assessment of intrinsic period. Am J Physiol 1996;270:R271–R282
7. Miles LE, Raynal DM, Wilson MA. Blind man living in nor-mal society has circadian rhythms of 24.9 hours. Science 1973;198:421–423
8. Miles LE, Wilson MA. High incidence of cyclic sleep-wake dis-orders in the blind. Sleep Res 1977;6:192
9. Sack RL, Lewy AJ, Blood ML, et al. Circadian rhythm abnor-malities in totally blind people: Incidence and clinical signifi-cance. J Clin Endocrinol Metab 1992;75:127–134
10. Leger D, Guilleminault C, Defrance R, et al. Prevalence ofsleep/wake disorders in the blind. Lancet 1996;348:830–831
11. Miles LEM. Sleep questionnaire and assessment of wakefulness(SQAW). In: Guilleminault C, ed. Sleeping and waking disor-ders, indication and techniques. Menlo Park: Addison-Wesley,1982:383–414
12. Brouillette R, Hanson D, David R, et al. A diagnostic approachto suspected obstructive sleep apnea in children. J Pediatr 1984;105:10–14
13. Leger D, Janus C, Pellois A, Dreyfus JP. Using DSM-IV to
assess insomnia in epidemiological surveys. Sleep Res 1995;24A:481 (Abstract)
14. American Psychiatric Association. Diagnostic and statisticalmanual of mental disorders, 4th ed. Washington, DC: Ameri-can Psychiatric Association, 1993
15. Diagnostic Classification Steering Committee. Internationalclassification of sleep disorders (ICSD 90: Diagnostic codingmanual). Rochester, MN: American Sleep Disorders Associa-tion, 1990
16. Klerman EB, Rimmer DW, Dijk DJ, et al. Nonphotic entrain-ment of the human circadian pacemaker. Am J Physiol 1998;274:R991–R996
Serial Magnetic ResonanceImaging in Patients withBalo’s Concentric Sclerosis:Natural History ofLesion DevelopmentChi-Jen Chen, MD,* Nai-Shin Chu, MD, PhD,†Chin-Song Lu, MD,† and Chung-Yang Sung, MD†
We reviewed the magnetic resonance imaging scans from22 serial studies of 5 patients with Balo’s concentric scle-rosis collected during the past 3 years. The data showedthe concentric lesions did not occur simultaneously butdeveloped step by step in a centrifugal direction. The de-velopment of lesions was preceded by an enhancing ringrelatively devoid of demyelination and was followed byprogressive demyelination occurring mainly at the inneraspect of the enhancement. The same process recurred onthe edge of the previous enhanced zone. Thus, an appear-ance of concentric rings with alternating demyelinatedand relatively myelin-preserved bands was formed.
Chen C-J, Chu N-S, Lu C-S, Sung C-Y. Serialmagnetic resonance imaging in patients with
Balo’s concentric sclerosis: natural historyof lesion development.
Ann Neurol 1999;46:651–656
Balo’s concentric sclerosis is a rare demyelinating dis-order characterized pathologically by concentric ringsof alternating demyelinated and relatively myelin-preserved white matter.1–3 This disease, usually diag-
From the Departments of *Diagnostic Radiology and †Neurology,Chang Gung Memorial Hospital and University, Taipei, Taiwan.
Received Aug 24, 1998, and in revised form Jun 1, 1999. Acceptedfor publication Jun 4, 1999.
Address correspondence to Dr Chen, Department of Diagnostic Ra-diology, Second Division, Chang Gung Memorial Hospital, 199Tung Hwa North Road, Taipei, Taiwan.
Copyright © 1999 by the American Neurological Association 651

nosed postmortem in the past, can now be recognizedantemortem by its characteristic magnetic resonanceimaging (MRI) appearance.4–6 In this report, serialMRI studies from 5 patients with Balo’s concentricsclerosis were reviewed. The following controversial is-sues about the pathogenesis of Balo’s concentric sclero-sis were addressed: (1) How do the concentric ringsdevelop? Do they develop simultaneously or separately?(2) What do the myelin-preserved bands represent? Dothey represent remyelination of previous demyelinatedbands or an early stage of ongoing demyelination?
Patients and MethodsTwenty-two brain MRI studies from 5 patients with Balo’sconcentric sclerosis were reviewed retrospectively. There were3 men and 2 women ranging in age from 22 to 56 years(mean, 36 years). The data were collected from November1994 to November 1997. The diagnosis of Balo’s concentricsclerosis was based on clinical symptoms and course, exclu-sion of other neurological diseases, and, most importantly,the characteristic concentric rings on MRI. In the first 2cases, a brain biopsy was performed to rule out a neoplasm.The pathology of both specimens showed demyelination inthe white matter with infiltrating foamy macrophages, hyper-trophic astrocytes, and perivascular cuffing of lymphocytes.The typical appearance of alternating bands of demyelinationand relative myelin preservation was observed in Case 1.6
Patient age, sex, clinical symptoms, and follow-up course arelisted in the Table.
Twenty of the 22 MRI studies were performed by 1.5-Tmachines, and the remaining 2 were performed by 0.5-Tmachines. The pulse sequences included sagittal T1-weighted images (T1WIs) (repetition time/echo time/num-ber of excitations 5 400/10/2), axial T1WIs (416/18/2),axial proton density–weighted images (3,250/18/2), axial T2-weighted images (T2WIs) (3,250/90/2), and coronal T2WIs
(3,250/90/2). Enhanced axial and coronal T1WIs (416/18/2) were performed immediately after the administrationof gadolinium–diethylenetriamine-pentaacetic acid (Gd-DTPA). The matrix size was 2563192, and slice thicknesswas 5 mm with 2.5-mm intervals. The dose of Gd-DTPAwas 0.1 mmol/kg. For a comparison, the locations of imag-ing cuttings on each follow-up study were adjusted to nearlythe same as those of the initial study.
The numbers and intervals of the serial MRI examinationsare listed in the Table.
ResultsNumber, Size, and Location of Concentric LesionsA total of 27 concentric lesions were found on fiveinitial MRI studies. The largest had a maximum diam-eter of 5 cm, the smallest had a maximum diameter of1.5 cm, and the mean diameter was 3.1 cm. Twenty-two concentric lesions (82%) were located in the fron-tal and parietal lobes, especially in the centrum semi-ovale. Three (11%) were located in the temporal lobes,and only 2 (7%) were in the occipital lobes. The num-bers of concentric lesions in Cases 1 through 5 were 6,3, 9, 6, and 3, respectively. Four of 5 patients dem-onstrated plaque-like lesions at the periventricular re-gion, internal capsule, brainstem, and/or cerebellarhemispheres.
Progression of Size and Enhancement ofConcentric LesionsIn all concentric lesions, the size was increased at firstbut decreased later. In general, there were four patternsof lesion enhancement: (1) enhancement at all layersof the concentric lesions (Figs 1A and 2B), (2) en-hancement at the outer two or three layers (see Fig
Table. Clinical Data and MRI Manifestations
PatientNo.
Age (yr)/Sex
Symptomsat Onset
OligoclonicalBands inCSF
Time from Onset toPerforming MRI
LesionLocation
InitialEnhancingPatterns
SecondFollow-UpEnhancingPatterns
ClinicalRelapse
Time toFollow-Up(yr)
1 27/Fa R hemiparesis,dullness, mem-ory impairment
1 10 days, 24 days,3 mo, 5 mo
6 FP 2,3 4 No 3
2 56/Fa R hemiparesis,dysphagia
ND 16 days, 46 days,3.5 mo, 5.5 mo
3 FP 1 3, 4 No 1
3 22/M Tetraparesis,confusion
2 14 days, 1 mo,2 mo, 4 mo
5 FP, 2 T,2 O
2 3, 4 No 1
4 42/M L hemiparesis,dullness
ND 18 days, 30 days,2 mo, 3 mo, 4 mo,6 mo, 8 mo
5 FP, 1 T 4 4 No 2
5 33/F L hemiplegia ND 19 days, 49 days,3.5 mo
3 FP 1, 3 3, 4 No 1
aBrain biopsy was obtained.
M 5 male; F 5 female; R 5 right; L 5 left; 1 5 positive; 2 5 negative; ND 5 not done; CSF 5 cerebrospinal fluid; FP 5 frontal and parietallobes; T 5 temporal lobe; O 5 occipital lobe; 1 5 enhancement at all layers of the concentric lesions; 2 5 enhancement at the outer two or threelayers; 3 5 incomplete enhancement at the margin; 4 5 no enhancement at all.
652 Annals of Neurology Vol 46 No 4 October 1999
1A), (3) incomplete enhancement at the margin (seeFig 1C), and (4) no enhancement at all. Evolution ofthe enhancing patterns was generally from enhance-ment at all layers of concentric lesions to no enhance-ment at all (see Fig 1A and C). In addition, new en-hancing layers developed continuously at the outerborder of a concentric lesion, although the enhance-ment at the inner layers gradually faded away (see Fig1A and C).
T1WIs and T2WIs of Enhancing RingsWhen pre- and postcontrast images on the same lesionswere compared, the enhanced rings appeared to corre-spond to the rings with T1- and T2-weighted isointen-sity (see Fig 2A and B).
Evolution of Concentric RingsThe evolution of the concentric rings was as follows.The rings with T1-weighted hypointensity and T2-
weighted hyperintensity would develop mainly at theinner white matter adjoining the enhanced bands (seeFigs 1 and 2). These rings did not develop simulta-neously; instead, they developed step by step in a cen-trifugal direction (Fig 3). When the lesion reached itsmaximum diameter, the size of the concentric lesion aswell as the area of T1-weighted hypointense rings de-creased gradually. The rings with T1- and T2-weighted isointensity did not show significant changesin their thickness and signal intensity throughout thefollow-up period, however (Fig 4).
DiscussionThe pathogenesis of the concentric bands in Balo’s scle-rosis has intrigued many investigators since its originaldescription. Many mechanisms have been proposed1–
3,7,8; however, all of these assumptions were based onpostmortem pathology examinations. In a study compar-
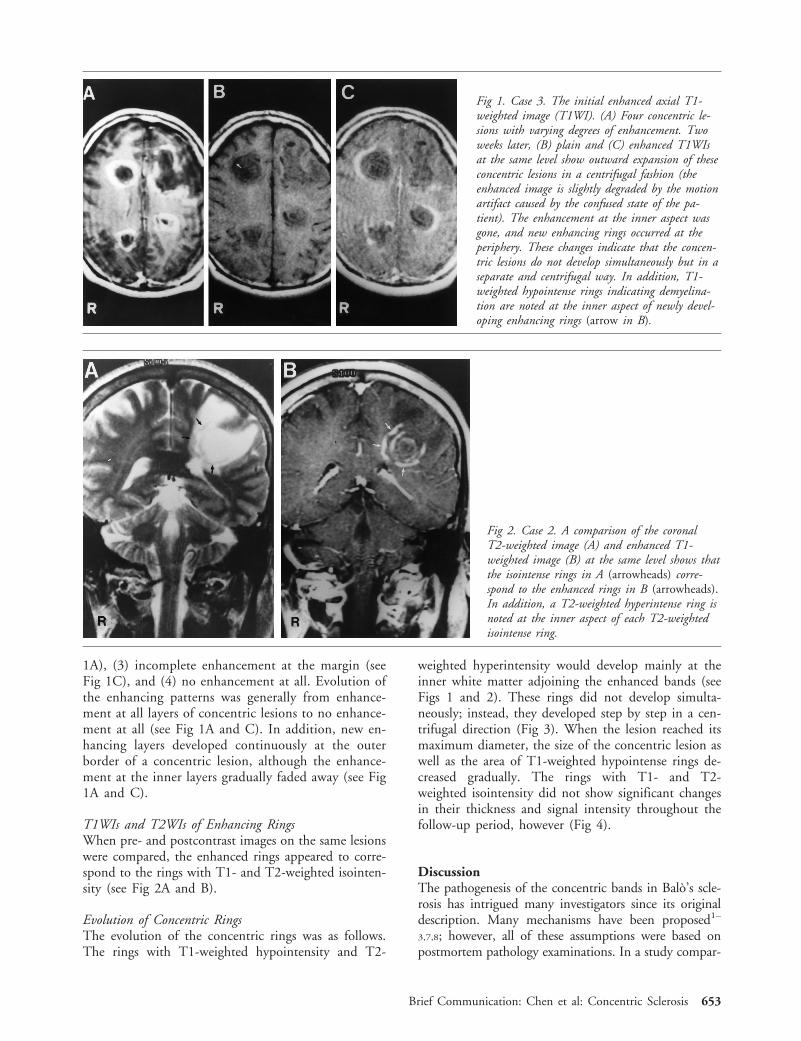
Fig 1. Case 3. The initial enhanced axial T1-weighted image (T1WI). (A) Four concentric le-sions with varying degrees of enhancement. Twoweeks later, (B) plain and (C) enhanced T1WIsat the same level show outward expansion of theseconcentric lesions in a centrifugal fashion (theenhanced image is slightly degraded by the motionartifact caused by the confused state of the pa-tient). The enhancement at the inner aspect wasgone, and new enhancing rings occurred at theperiphery. These changes indicate that the concen-tric lesions do not develop simultaneously but in aseparate and centrifugal way. In addition, T1-weighted hypointense rings indicating demyelina-tion are noted at the inner aspect of newly devel-oping enhancing rings (arrow in B).
Fig 2. Case 2. A comparison of the coronalT2-weighted image (A) and enhanced T1-weighted image (B) at the same level shows thatthe isointense rings in A (arrowheads) corre-spond to the enhanced rings in B (arrowheads).In addition, a T2-weighted hyperintense ring isnoted at the inner aspect of each T2-weightedisointense ring.
Brief Communication: Chen et al: Concentric Sclerosis 653

ing autopsy and MRI findings, Gharagozloo and co-workers4 found that the rings showing hypointensity onT1WIs and hyperintensity on T2WIs corresponded tothe areas of cavitary necrosis and pale demyelinatedwhite matter and that the rings of T1- and T2-weightedisointensity represented the relatively myelin-preservedwhite matter. MRI thus provides a good method to ob-serve the evolution of the concentric rings.
In this study, we found the following: (1) new en-hanced layers developed continuously at the outer bor-der of a concentric lesion, although enhancement atthe inner layers gradually faded away; (2) the ringswith T1- and T2-weighted isointensity corresponded
to the rings with enhancement; (3) the T1- and T2-weighted isointense rings, presumably lacking ongoingdemyelination, maintained their thickness and signalintensity throughout the follow-up period; and (4) therings with T1-weighted hypointensity and T2-weightedhyperintensity occurred step by step mainly at the in-ner aspect of each outward growing enhancing ring.
Similar findings have been mentioned in Courville’spathology review,3 in which the “storm center” wasconsidered to be the oldest part of the lesion (corre-sponding to our first finding above) and the rose-redcolor of the preserved rings was a result of hyperemicchange (corresponding to our second finding above).
Fig 3. Case 5. Initial axial T1-weighted image (T1WI; A) and T2-weighted image (T2WI; B) show threeconcentric lesions over the centrumsemiovale. The T1-weighted hypointen-sity and T2-weighted hyperintensity atthe outer layers (arrowheads in A andB) of each concentric lesion were lessconspicuous than those at the innerlayers. One month later, a T1WI (C)and T2WI (D) at the same level showmore obvious signal changes at theouter layers (arrowheads in C and D).The arrow in C indicates a newly de-veloped layer of T1-weighted hypointen-sity not seen on the initial study (com-pare with arrow in A). These findingssuggest that the demyelination does notform simultaneously but step by step ina centrifugal direction.
654 Annals of Neurology Vol 46 No 4 October 1999
Accordingly, the basic process of lesion developmentin Balo’s concentric sclerosis should include an inflam-matory ring manifesting as contrast enhancement andrelatively sparing demyelination and a later demyeli-nated ring located mainly at the inner aspect of theenhancement. This basic process continuously recurs atthe outer border of the previous enhanced area until apattern of concentric rings forms. After reaching amaximum diameter, the demyelinated areas shrink,partly as a result of the resolution of edema and partlyas a result of a reduction of the number of the cells inthe demyelinated white matter. If the above processeswere compared with the evolution of multiple sclerosis(MS) in the serial MRI studies,9,10 the basic processesof both diseases would appear to be similar. In an MSlesion, the first detectable abnormality is a focal in-crease in the permeability of the blood-brain barrier,manifested by contrast enhancement, followed by theappearance of abnormal T2-weighted signals inside theenhancement representing demyelination and ede-ma.9–11 When MS recurs, it usually involves the othernormal white matter. Nevertheless, on a number of oc-casions, relapses at the expanding edge of a preexistingMS lesion do happen,9,12 resulting in a larger enhance-ment at the expanding edge of the preexisting MS le-sion and leaving a larger residual lesion after the en-hancement has subsided. In this regard, the evolutionof the concentric lesions is similar to that in MS.
Studies on experimental allergic encephalomyelitisand postmortem studies of active MS lesions havestrongly suggested that the presence of Gd-DTPA en-hancement is associated with a significant inflamma-tory response,13,14 and that the level of contrast en-
hancement is related primarily to the degree ofmacrophage infiltration.15 Based on these reports andour MRI findings, we propose a possible pathogeneticmechanism for concentric sclerosis. In the initial stageof lesion development, a ring of inflammation at themargin of the nidus develops to limit the expansion ofthe lesion. This inflammatory barrier appears to be in-effective, however, and allows the lesion to breakthrough the inflammatory barrier and extend outward.This outward expansion induces a secondary ring ofinflammatory reaction at its new border. The same sce-nario is repeated again and again until the expansion ofthe lesion can be stopped by the inflammatory barrier.Because the inflammatory (enhanced) zones relativelyescape the brunt of demyelination, alternating demyeli-nated and relative myelin-preserved rings form. Al-though the factors causing the pathogen to breakthrough the inflammatory barrier are not known, twointeresting phenomena should be mentioned. First, thepatients in the large reported series on Balo’s concen-tric sclerosis are Chinese,16 Filipino,17 or Japanese.18
Second, in Chinese and Japanese patients with MS,spinal cord and optic nerve lesions with marked necro-sis, axonal loss, and less astrogliosis are much morecommon than in Caucasian patients.19,20 These phe-nomena may imply that different defense patterns existin different ethnic groups.
This study was supported in part by the Chang Gung Medical Re-search Grant (CMRP 592).
We thank Prof W. P. Dillon for helpful discussion.
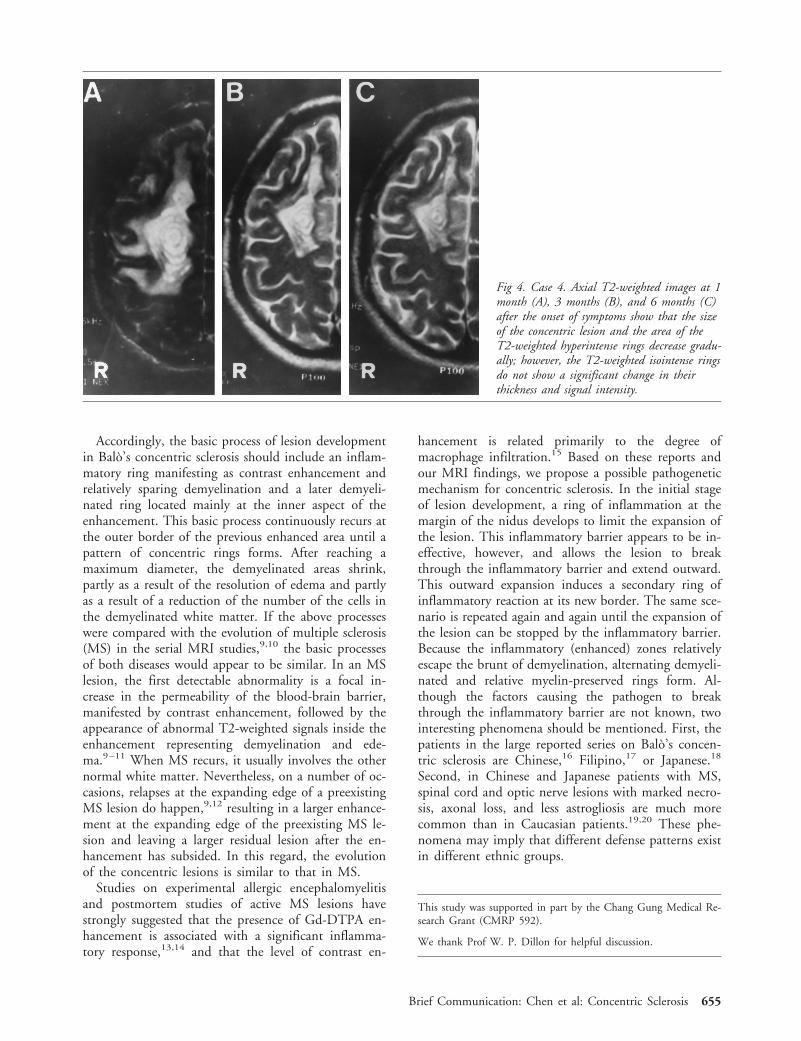
Fig 4. Case 4. Axial T2-weighted images at 1month (A), 3 months (B), and 6 months (C)after the onset of symptoms show that the sizeof the concentric lesion and the area of theT2-weighted hyperintense rings decrease gradu-ally; however, the T2-weighted isointense ringsdo not show a significant change in theirthickness and signal intensity.
Brief Communication: Chen et al: Concentric Sclerosis 655

References1. Marburg O. Die sogenannte “akut multiple Sklerose” (Enceph-
alomyelitis periaxialis scleroticans). Jb Neuro Psychiatry 1906;27:213–312
2. Balo J. Encephalitis periaxialis concentrica. Arch Neurol Psychi-atry 1928;19:242–264
3. Courville CB. Concentric sclerosis. In: Vinken P, Bruyn GW,eds. Handbook of clinical neurology, vol 9. Amsterdam: NorthHolland, 1970:437–451
4. Gharagozloo AM, Poe LB, Collins GH. Antemortem diagnosisof Balo concentric sclerosis: correlative MR imaging and patho-logic features. Radiology 1994;191:817–819
5. Korte JH, Bom EP, Vos LD, et al. Balo concentric sclerosis:MR diagnosis. AJNR Am J Neuroradiol 1994;15:1284–1285
6. Chen CJ, Ro LS, Chang CN, et al. Serial MRI studies inpathologically verified Balo concentric sclerosis. J Comput As-sist Tomogr 1996;20:732–735
7. Moore GRW, Neumann PE, Suzuki K, et al. Balo’s concentricsclerosis: new observations on lesion development. Ann Neurol1985;17:604–611
8. Yao DL, Webster H deF, Hudson LD, et al. Concentric scle-rosis (Balo): morphometric and in situ hybridization study oflesions in six patients. Ann Neurol 1994;35:18–30
9. McDonald WI, Miller DH, Barnes D. The pathological evolu-tion of multiple sclerosis. Neuropathol Appl Neurobiol 1992;18:319–334
10. Willoughby EW, Grochowski E, Li DKB, et al. Serial magneticresonance scanning in multiple sclerosis: a second prospectivestudy in relapsing patients. Ann Neurol 1989;25:43–49
11. Kermode AG, Thompson AJ, Tofts PS, et al. Breakdown of theblood-brain barrier precedes symptoms and other MRI signs ofnew lesion in multiple sclerosis: pathogenetic and clinical im-plications. Brain 1990;113:1477–1489
12. Harris JO, Frank JA, Patronas N, et al. Serial gadolinium-enhanced magnetic resonance imaging scans in patients withearly relapsing-remitting multiple sclerosis: implications forclinical trials and natural history. Ann Neurol 1991;29:548–555
13. Hawkins CP, Munro PMG, MacKenzie F, et al. Duration andselectivity of blood-brain barrier breakdown in chronic relaps-ing experimental allergic encephalomyelitis studied bygadolinium-DTPA and protein markers. Brain 1990;113:365–378
14. Katz D, Taubenberger JK, Cannella B, et al. Correlation be-tween magnetic resonance imaging findings and lesion develop-ment in chronic, active multiple sclerosis. Ann Neurol 1993;34:661–669
15. Nasbit GM, Forbes GS, Scheithauer BW, et al. Multiplesclerosis: histopathologic and MR and/or CT correlation in 37cases at biopsy and three cases at autopsy. Radiology 1991;180:467–474
16. Rao ML, Liu DS, Lin SH, et al. Clinical and pathological stud-ies on ten cases of Balo concentric sclerosis. Chin J Neurol Psy-chiatry 1983;16:299–302
17. Tabira T. Concentric sclerosis (Balo). Nippon Rinsho 1994;52:2971–2975
18. Itoyama Y, Tateish J, Kuroiwa Y. Atypical multiple sclerosiswith concentric or lamellar demyelinated lesions: two Japanesepatients studied post mortem. Ann Neurol 1985;17:481–487
19. Guo YP. Neuropathologic study of two cases of multiple scle-rosis. Chin Med J 1981;94:355–364
20. Tabira T, Tateishi J. Neuropathological features of MS in Ja-pan. In: Kuroiwa Y, Kurland LT, eds. Multiple sclerosis eastand west. Fukuoka: Kyushu University Press, 1982:273–296
Irregular Distribution ofCytochrome c OxidaseProtein Subunits in Agingand Alzheimer’s DiseaseJoseline Ojaimi, BSc (Hon),*† Colin L. Masters, MD,†Catriona McLean, MBBS, FRCPA,†Ken Opeskin, MBBS, FRCPA,‡Penny McKelvie, MBBS, FRCPA,§and Edward Byrne, MD, DSc*
This study aims to investigate the cellular distribution ofhuman cytochrome c oxidase (COX) subunit II (CII) andCOX subunit IV (CIV) in Alzheimer’s disease relative tocontrol brains. The levels of CIV and CII proteins in thecerebellar Purkinje cells were reduced in age-matchedcontrols relative to young controls and in the Alzheimer’sdisease group relative to both age-matched and young con-trols. Results suggest that these age-associated changes aremore marked in Alzheimer’s disease.
Ojaimi J, Masters CL, McLean C, Opeskin K,McKelvie P, Byrne E. Irregular distribution of
cytochrome c oxidase protein subunits inaging and Alzheimer’s disease.
Ann Neurol 1999;46:656–660
The pathoetiology of Alzheimer’s disease (AD) is com-plex with intercalating processes. Dysfunction in amy-loid processing, free radical damage, and calcium over-load conform to some of the factors that may beassociated with disease pathology in brain regions af-fected by AD. Study of mitochondrial subunit distri-bution in a cell population relatively spared from ADpathology should allow determination of whether mi-tochondrial dysfunction seen is secondary to other ADcausative factors or is an independent process.
Mitochondrial respiratory chain defects in humantissues have been reported in association with aging.1,2
The significance of an additional decline in mitochon-drial cytochrome c oxidase (COX) activity in AD3–7
remains controversial.8,9 Several histochemical and im-munocytochemical studies have shown focal COX de-
From the *Melbourne Neuromuscular Research Center and §De-partment of Anatomical Pathology, St Vincent’s Hospital, Fitzroy;†Department of Pathology, University of Melbourne, Parkville; and‡Victorian Institute of Forensic Medicine, South Bank, Victoria,Australia.
Received Dec 2, 1998, and in revised form Jun 14, 1999. Acceptedfor publication Jun 15, 1999.
Address correspondence to Dr Byrne, Director, Melbourne Neuro-muscular Research Center, St Vincent’s Hospital, Fitzroy, Victoria3065, Australia.
656 Copyright © 1999 by the American Neurological Association

ficiency in nonneuronal tissue in both human diseaseand aging.10–12 There is little quantitative informationabout the extent of focal neuronal COX deficiency inaging and disease in the literature, and a key questionin this phenomenon is whether it is primarily age re-lated or merely specifically related to disease processes.
This study was designed to determine whether inter-neuronal COX subunit distribution is variable in theaging brain, suggesting energy mosaicism; whethernuclear- and mitochondrial-encoded subunits are dif-ferentially involved; and whether there are significantdifferences between AD subjects and controls. The cer-ebellum was studied as a brain region affected by agebut not highly vulnerable to AD changes; it is ideal forquantitative studies because of the ease of identifyingand counting Purkinje cells. Observations in the Pur-kinje cell pool are more likely to reflect age-associatedchanges than AD-specific processes.
Patients and MethodsSubjectsSpecimens were obtained from forensic autopsies, with aver-age postmortem delays of 20 hours. The control group in-cluded 3 young subjects (under 55 years old) and 4 age-matched subjects with no clinical history of neurodegenerativedisease. The AD group included 5 subjects with a clinical di-agnosis of AD. A diagnosis of AD was made using the Con-sortium to Establish a Registry for Alzheimer’s Disease crite-ria.13 (The study met the ethics criteria of St Vincent’sHospital and the University of Melbourne.)
ImmunocytochemistryMouse monoclonal antibodies raised against human COXsubunit II (CII) and bovine COX subunit IV (CIV) wereused (Molecular Probe). The standard indirect immunoper-oxidase method was used with minor modifications.14 Theperoxidase activity was detected with 39-39-diaminobenzidine(Sigma, St Louis, MO) and 0.15% H2O2 in phosphate-buffered saline, and slides were counterstained with hematox-ylin. Appropriate controls were included to ensure specificityof the reactivity for COX subunits.
Statistical EvaluationThe total number of Purkinje cells per 1 mm2 of grid area at1003 total magnification was counted in 10 fields. Cellswere graded according to immunostaining intensity (strong,moderate, or weak). Each category was quoted as a percent-age of the total number counted per 1 mm2 of grid area. TheStatistica software program (StatSoft Inc, Tulsa, OK) wasused for the analysis. The Mann-Whitney U test was per-formed for each category, comparing the 3 groups relatively.A p value of less than 0.05 was taken as being statisticallysignificant.
ResultsDistribution of ImmunoreactivityReactivity was most distinct within the Purkinje celllayer. Nevertheless, the granular and molecular layers
displayed some level of reactivity (Fig 1), especially inyoung controls and at lower levels in age-matched con-trols.
The 3 groups studied demonstrated variations in theintensity of immunostaining among the different Pur-kinje cells for each subunit and relative to each other(Fig 2; see Fig 1). The expression of CII and CIV pro-teins in the Purkinje cell layer was uniform in theyoung control group. In both the AD group and aged-
Fig 1. Distribution pattern of immunoreactivity for humancytochrome c oxidase (COX) subunit II (CII) in the cerebel-lum. Sections were probed with a monoclonal antibody againstCOX mitochondrial-encoded CII. Immunoreactivity is observedmainly in the Purkinje cell layer (P). (A) The immunostain-ing intensity is generally strongest in the young control brain.(B) In the age-matched control brain, immunoreactivity isstrong in the granular layer (GR) as can be seen within gran-ule cells, granule cell axons, and mossy fibers; immunostainingis also strong in the stellate cells, basket cells, parallel andclimbing fibers as well as in Purkinje cell dendrites in themolecular layer (M). (C) The Alzheimer’s disease brain showsreduced immunoreactivity across all layers. (Magnification3250 before 38% reduction.)
Brief Communication: Ojaimi et al: COX Subunit Expression in the Human Brain 657

matched controls, some Purkinje cells showed consid-erable variability in CII and CIV levels, with low to nodetectable levels of CII proteins and higher levels ofCIV proteins (Fig 2).
Semiquantitative AssessmentData revealed significant differences in COX proteinlevels between the young control, age-matched control,and AD groups.
In general, CII showed reduced levels of expressionrelative to CIV in both the AD and age-matched con-trol groups (Fig 3). The AD group showed a 35% in-crease in the percentage of CII-positive Purkinje cellsdisplaying weak immunoreactivity (p 5 0.17) relativeto their CIV-positive counterparts and a 68.5% reduc-tion in the level of cells displaying strong immunore-activity (p 5 0.03). The age-matched controls did notreveal a significant difference in the level of immuno-reactivity for either subunit in Purkinje cells displayingweak CII reactivity (6% increase; p 5 0.56) or in thosedisplaying strong CII reactivity (14% reduction; p 50.38). The young control group did not show varia-
tions in the levels of CII- and CIV-positive Purkinjecells demonstrating strong reactivity; however, a 34%increase in CII-positive cells with weak immunoreac-tivity (p 5 0.12) was seen. No differences between thelevels of Purkinje cells displaying moderate reactivityfor CII and CIV were observed in the age-matchedcontrol and AD groups.
Reductions of 81% and 87.5% in the level of CII-positive Purkinje cells displaying strong immunoreac-tivity were observed in the AD group relative to theage-matched (p 5 0.014) and young controls (p 50.025), respectively. Meanwhile, 74.6% and 92% in-creases in the level of CII-positive Purkinje cells dis-playing weak immunoreactivity were observed in theAD group (p 5 0.014) relative to the age-matched andyoung (p 5 0.025) controls, respectively.
A similar pattern to that of CII protein was also ob-served for the expression levels of CIV protein in theAD group and in the young and age-matched controls(see Fig 3). There was a tendency towards a decline inthe level of CIV-positive Purkinje cells displayingstrong immunoreactivity in the AD group comparedwith the age-matched (47.5%, p 5 0.052) and youngcontrols (58.5%, p 5 0.052). In the AD group, how-ever, there were 63% and 92% increases in the level ofCIV-positive Purkinje cells displaying weak immunore-activity compared with the age-matched (p 5 0.03)and young (p 5 0.025) controls.
DiscussionThis study reveals that in the cerebellar Purkinje cellpool, there is considerable interneuronal variation inCOX protein subunit expression (energy mosaicism);this variation is more marked in AD subjects than inage-matched controls and is more marked in aged con-trols than in young controls. These findings in the Pur-kinje cell pool, an area not vulnerable to AD changes,suggest that this variation is related to age rather thanspecific to AD.
Previously, studies employing Northern blot analysison brain tissue from AD and age-matched controlshave shown a 50% decline in the expression levels ofCII mRNA throughout the hippocampal formation15
and CIV mRNA in the midtemporal cortex16 in AD.Our results show that defects in COX expression inAD are not specific to regions highly vulnerable to dis-ease pathology. Advanced age is the major predisposingfactor in AD. It is of interest that a patchy drop inneuronal COX expression is seen in aging but is muchmore marked in AD. As this fall affects a brain regionrelatively spared by AD pathology, it is unlikely to be acentral trigger but may have a contributing role favor-ing the expression of an additional process.
Several mechanisms may underlie the observed de-cline in subunit expression. A global downregulation inmitochondrial number induced by a reduction in neu-
Fig 2. Variation in the levels of expression between mitochon-drial and nuclear-encoded cytochrome c oxidase (COX) sub-units. Immunocytochemical detection using monoclonal anti-bodies against the mitochondrial human COX subunit II(CII; A) and nuclear bovine COX subunit IV (CIV; B) wascarried out on serial sections of human brain cerebellum froman Alzheimer’s disease case. Reactivity is most apparent in thePurkinje cell layer (PK). A number of Purkinje cells expressingCIV in A (X) do not express CII in B (Y). (Magnification3250 before 42% reduction.)
658 Annals of Neurology Vol 46 No 4 October 1999
ronal activity following synaptic dysfunction and loss islikely to contribute to these findings. Alternatively, thedecline in subunit expression may be caused by specificinsults against the molecular mechanisms involved insubunit transport and complex assembly. Our resultsdo not support the latter mechanism, however, and aremore suggestive of a downregulation in mitochondrialnumber. Further support for mitochondrial depletioncomes from studies in aging rat brain, where a decreasein mitochondrial number was observed in both synap-tic processes and perikarya of Purkinje cells.17
It is not yet fully understood what regulates the bio-genesis of the assembly and functional activity ofCOX.18,19 Intraneuronal variations between CII andCIV protein expression are likely to represent impair-ment of the regulatory mechanisms for mitochondrialproliferation and for the coordinate expression betweenthe nuclear and mitochondrial genomes. Neuronal mi-tochondria are thought to become assembled in the so-ma.18,20 Migration of organelles and other proteincomponents within the neuron is part of an activetransport process requiring adenosine triphosphate andan intact microtubular system.20,21 Therefore, in thecase of a reduction in adenosine triphosphate production
and/or a defective assembly of filaments, the migrationof organelles, including mitochondria, is affected. Therehave been suggestions that impairment in the formationand processing of microtubules/filaments plays a role inAD pathogenesis.21 This phenomenon might possiblyexplain the further damage observed in the AD group.
The findings in this study indicate that a patchy re-duction in the expression of both nuclear- andmitochondrial-encoded COX subunits occurs in thecerebellum with aging. A more marked drop is seen inAD patients than in age-matched controls. These resultsare best explained by the hypothesis that neuronal COXsubunit depletion is primarily an age-related phenome-non independent of AD pathology but likely to contrib-ute to the development of AD. Other factors specific toAD pathogenesis must be operative to allow for the fur-ther damage imposed on the mitochondrial system.
Dr Ojaimi was supported by an Australian postgraduate researchaward administered by the University of Melbourne. The MuscularDystrophy Association and the National Health and Medical Re-search Council of Australia also provided funding.
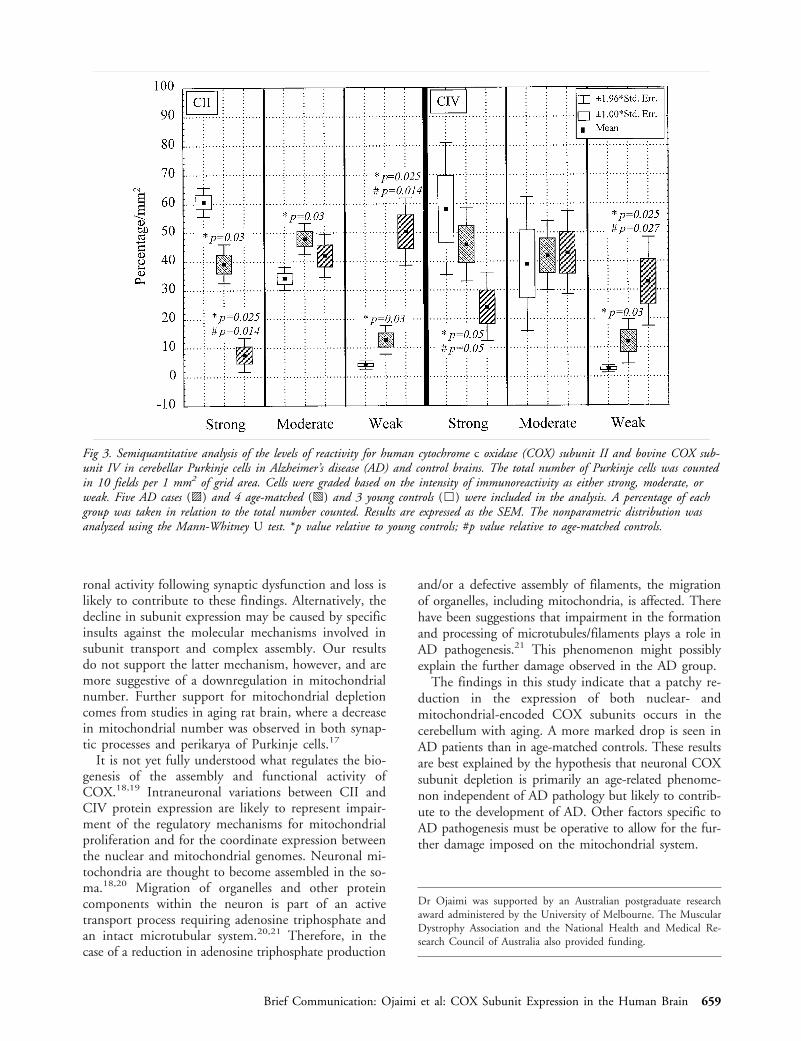
Fig 3. Semiquantitative analysis of the levels of reactivity for human cytochrome c oxidase (COX) subunit II and bovine COX sub-unit IV in cerebellar Purkinje cells in Alzheimer’s disease (AD) and control brains. The total number of Purkinje cells was countedin 10 fields per 1 mm2 of grid area. Cells were graded based on the intensity of immunoreactivity as either strong, moderate, orweak. Five AD cases (o ) and 4 age-matched (p ) and 3 young controls (h ) were included in the analysis. A percentage of eachgroup was taken in relation to the total number counted. Results are expressed as the SEM. The nonparametric distribution wasanalyzed using the Mann-Whitney U test. *p value relative to young controls; #p value relative to age-matched controls.
Brief Communication: Ojaimi et al: COX Subunit Expression in the Human Brain 659
References1. Trounce I, Byrne E, Marzuki S. Decline in skeletal muscle mi-
tochondrial respiratory chain function: possible factor in aging.Lancet 1989;1:1269
2. Yen TC, Chen YS, King KL, et al. Liver mitochondrial respi-ratory function decline with age. Biochem Biophys Res Com-mun 1989;165:994–1003
3. Kish SJ, Bergeron C, Raiput A, et al. Brain cytochrome oxidasein Alzheimer’s disease. J Neurochem 1992;59:776–779
4. Parker WD, Jr, Parks J, Filley CM, Kleinschmidt-DeMastersBK. Electron transport chain defects in Alzheimer’s diseasebrain. Neurology 1994;44:1090–1096
5. Mutisya EM, Bowling AC, Beal MF. Cortical cytochrome ox-idase activity is reduced in Alzheimer’s disease. J Neurochem1994;44:1086–1090
6. Maurer I, Zierz S, Moller H-J, Jerusalem F. Cytochrome c ox-idase in Alzheimer’s disease. Neurology 1995;45:1423 (Letter)
7. Chagnon P, Robitaille Y, Gauvreau D. Brain mitochondrialDNA polymorphism and cytochrome oxidase activity in Alzhei-mer’s disease. Alzheimer’s Res 1996;2:237–242
8. Cooper JM, Wischik C, Schapira AHV. Mitochondrial func-tion in Alzheimer’s disease. Lancet 1993;341:969–970
9. Reichmann H, Florke S, Heberstreit G, et al. Analyses of en-ergy metabolism and mitochondrial genome in postmortembrain from patients with Alzheimer’s disease. J Neurol 1993;240:377–380
10. Byrne E, Dennett X, Trounce I, Henderson R. Partial cyto-chrome oxidase (aa3) deficiency in chronic progressive externalophthalmoplegia. Histochemical and biochemical studies.J Neurol Sci 1985;71:257–271
11. Muller-Hocker J, Johannes A, Droste M, et al. Fatal cardiomy-opathy in Kearns-Sayre syndrome with deficiency of cyto-chrome c oxidase in cardiac and skeletal muscle. Virchows ArchB Cell Pathol Incl Mol Pathol 1986;52:353–367
12. Muller-Hocker J. Cytochrome c oxidase deficient cardiomyo-cytes in the human heart–an age-related phenomenon. Am JPathol 1989;134:1167–1173
13. Mirra SS, Heyman A, McKeel D, et al. The Consortium toEstablish a Registry for Alzheimer’s Disease (CERAD). Part II.Standardization of the neuropathologic assessment of Alzhei-mer’s disease. Neurology 1991;41:479–486
14. Boenisch T, Farmilo AJ, Stead RH. Handbook of immunochemi-cal staining methods. Carpenteria, CA: Dako Corporation, 1989
15. Simonian NA, Hyman BT. Functional alterations in Alzhei-mer’s disease: selective loss of mitochondrial-encoded cyto-chrome oxidase mRNA in the hippocampal formation. J Neu-ropathol Exp Neurol 1994;53:508–512
16. Chandrasekaran K, Hatanpaa K, Rapoport SI, Brady DR. De-creased expression of nuclear and mitochondrial DNA-encodedgenes of oxidative phosphorylation in association neocortex inAlzheimer’s disease. Brain Res Mol Brain Res 1997;44:99–104
17. Bertoni-Freddari C, Fattoretti P, Casoli T, et al. Morphologicalplasticity of synaptic mitochondria during aging. Brain Res1993;628:193–200
18. Hevner RF, Wong-Riley MTT. Neuronal expression of nuclearand mitochondrial genes for cytochrome oxidase (CO) subunitsanalyzed by in situ hybridization: comparison with CO activityand protein. J Neurosci 1991;11:1942–1958
19. Liu S, Wong-Riley M. Disproportionate regulation of nuclear-and mitochondrial-encoded cytochrome oxidase subunit proteinsby functional activity in neurons. Neuroscience 1995;67:197–210
20. Vale RD, Schnapp BJ, Reese TS, Sheetz MP. Movement oforganelles along filaments dissociated from the axoplasm of thesquid giant axon. Cell 1985;40:449–454
21. Matsuyama SS, Jarvik LF. Hypothesis: microtubules, a key to Alz-heimer’s disease. Proc Natl Acad Sci USA 1989;86:8152–8156
Diffuse Pachygyria withCerebellar Hypoplasia:A Milder Form ofMicrolissencephaly or aNew Genetic Syndrome?Mitsuhiro Kato, MD,* Noboru Takizawa, MD,†Sirou Yamada, MD,† Aiko Ito, MD,*Tomomi Honma, MD,* Motoya Hashimoto, MD,‡Emi Saito, MD,‡ Tomoko Ohta, MD,‡Hideo Chikaoka, MD,§ and Kiyoshi Hayasaka, MD*
We report on 2 families with diffuse pachygyria and cer-ebellar hypoplasia, who presented hypotonia, ataxia, sei-zures, and developmental delay since infancy. Computedtomography (CT) and magnetic resonance imaging(MRI) revealed decreased gyral formation in the cerebralcortex and marked hypoplasia in the cerebellum. Cere-bellar hypoplasia is often associated with type 2 lissen-cephaly; however, our cases showed no polymicrogyria,and their clinical findings were quite mild compared withthose of microlissencephaly. Their characteristic pheno-type suggested a new genetic syndrome, which was pos-sibly inherited as an autosomal recessive trait.
Kato M, Takizawa N, Yamada S, Ito A,Honma T, Hashimoto M, Saito E, Ohta T,
Chikaoka H, Hayasaka K. Diffuse pachygyriawith cerebellar hypoplasia: a milder form of
microlissencephaly or a new genetic syndrome?Ann Neurol 1999;46:660–663
Lissencephaly is a brain malformation caused by im-pairment of neuronal migration. It is classified by ra-diological and pathological findings. Most cases are ei-ther classical lissencephaly (type 1), represented by theMiller-Dieker syndrome, or cobblestone lissencephaly(type 2), represented by the Walker-Warburg syn-drome or Fukuyama type of congenital muscular dys-trophy. Although mild hypoplasia and upward rotationof the cerebellar vermis have been reported in classicallissencephaly with mutations of the XLIS gene,1 severe
From the *Department of Pediatrics, Yamagata University School ofMedicine, ‡Department of Pediatrics and Neonatal Medicine,Yamagata Saisei Hospital, and §Chikaoka Pediatric Clinic, Yama-gata; and †Department of Pediatrics, National Sanatorium IshikawaHospital, Kaga, Ishikawa, Japan.
Received Feb 9, 1999, and in revised form Jun 21, 1999. Acceptedfor publication Jun 22, 1999.
Address correspondence to Dr Kato, Department of Pediatrics,Yamagata University School of Medicine, Iida-nishi 2-2-2, Yama-gata 990-9585, Japan.
660 Copyright © 1999 by the American Neurological Association
cerebellar hypoplasia is rarely associated with classicallissencephaly. Barth and co-workers2 reported on 2 sib-lings who presented with lissencephaly with extensiveanomalies of the brainstem and cerebellum. Dobynsand Truwit3 classified the lissencephaly syndromewith a small cerebellum, including the case of Barthand co-workers,2 as a cerebrocerebellar lissencephalyvariant, which was revised as microlissencephaly (lis-sencephaly with severe microcephaly and cerebellarhypoplasia). There are several case reports of lissen-cephaly with cerebellar hypoplasia, suggesting etiolog-ical heterogeneities.2,4 –10
We report on 2 families with lissencephaly accom-panied by cerebellar hypoplasia, who presented charac-teristic clinical features different from those of previousreports.
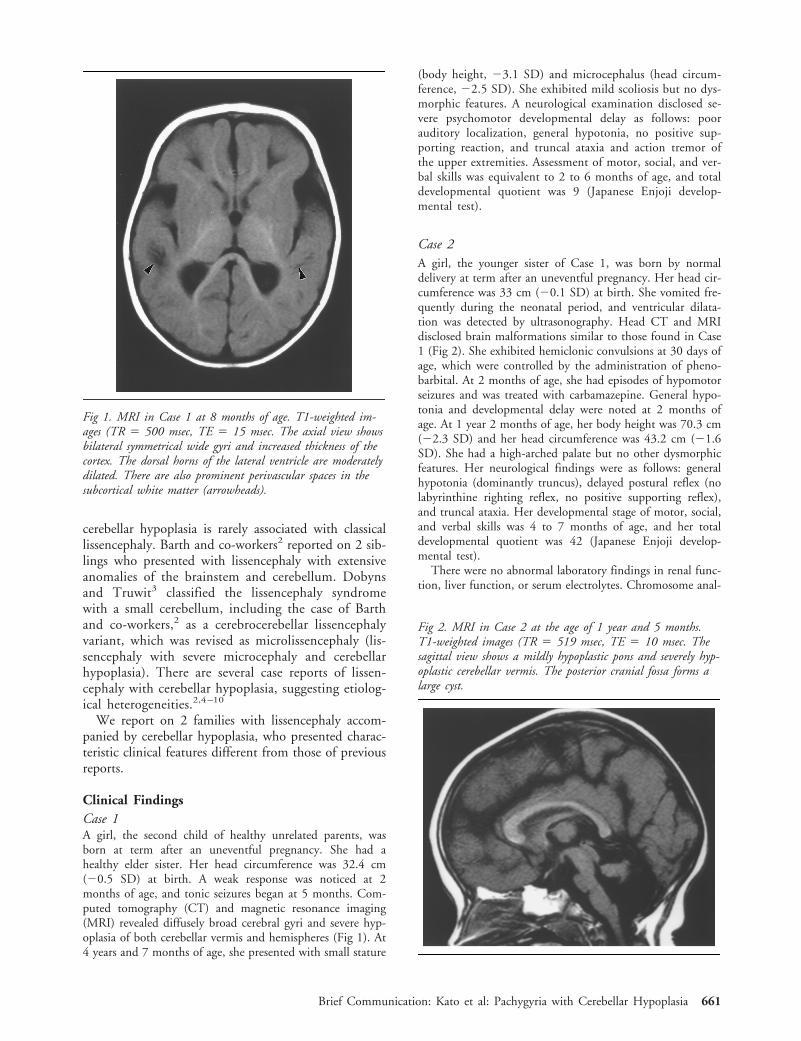
Clinical FindingsCase 1A girl, the second child of healthy unrelated parents, wasborn at term after an uneventful pregnancy. She had ahealthy elder sister. Her head circumference was 32.4 cm(20.5 SD) at birth. A weak response was noticed at 2months of age, and tonic seizures began at 5 months. Com-puted tomography (CT) and magnetic resonance imaging(MRI) revealed diffusely broad cerebral gyri and severe hyp-oplasia of both cerebellar vermis and hemispheres (Fig 1). At4 years and 7 months of age, she presented with small stature
(body height, 23.1 SD) and microcephalus (head circum-ference, 22.5 SD). She exhibited mild scoliosis but no dys-morphic features. A neurological examination disclosed se-vere psychomotor developmental delay as follows: poorauditory localization, general hypotonia, no positive sup-porting reaction, and truncal ataxia and action tremor ofthe upper extremities. Assessment of motor, social, and ver-bal skills was equivalent to 2 to 6 months of age, and totaldevelopmental quotient was 9 (Japanese Enjoji develop-mental test).
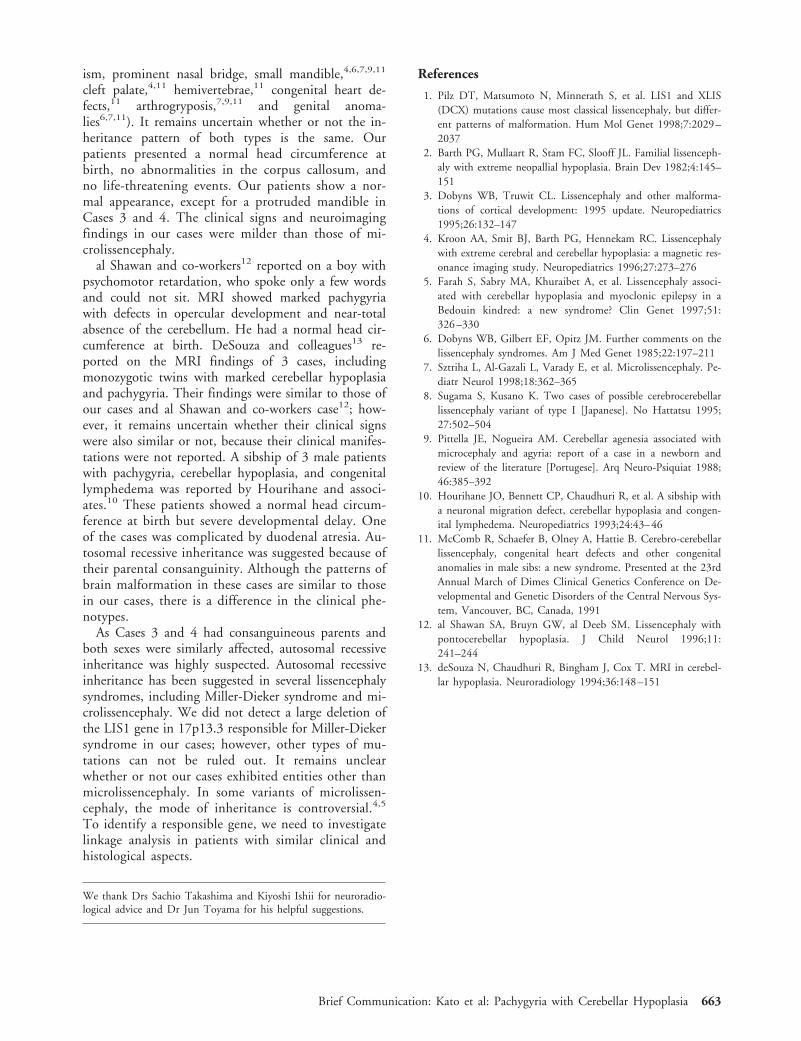
Case 2A girl, the younger sister of Case 1, was born by normaldelivery at term after an uneventful pregnancy. Her head cir-cumference was 33 cm (20.1 SD) at birth. She vomited fre-quently during the neonatal period, and ventricular dilata-tion was detected by ultrasonography. Head CT and MRIdisclosed brain malformations similar to those found in Case1 (Fig 2). She exhibited hemiclonic convulsions at 30 days ofage, which were controlled by the administration of pheno-barbital. At 2 months of age, she had episodes of hypomotorseizures and was treated with carbamazepine. General hypo-tonia and developmental delay were noted at 2 months ofage. At 1 year 2 months of age, her body height was 70.3 cm(22.3 SD) and her head circumference was 43.2 cm (21.6SD). She had a high-arched palate but no other dysmorphicfeatures. Her neurological findings were as follows: generalhypotonia (dominantly truncus), delayed postural reflex (nolabyrinthine righting reflex, no positive supporting reflex),and truncal ataxia. Her developmental stage of motor, social,and verbal skills was 4 to 7 months of age, and her totaldevelopmental quotient was 42 (Japanese Enjoji develop-mental test).
There were no abnormal laboratory findings in renal func-tion, liver function, or serum electrolytes. Chromosome anal-
Fig 1. MRI in Case 1 at 8 months of age. T1-weighted im-ages (TR 5 500 msec, TE 5 15 msec. The axial view showsbilateral symmetrical wide gyri and increased thickness of thecortex. The dorsal horns of the lateral ventricle are moderatelydilated. There are also prominent perivascular spaces in thesubcortical white matter (arrowheads).
Fig 2. MRI in Case 2 at the age of 1 year and 5 months.T1-weighted images (TR 5 519 msec, TE 5 10 msec. Thesagittal view shows a mildly hypoplastic pons and severely hyp-oplastic cerebellar vermis. The posterior cranial fossa forms alarge cyst.
Brief Communication: Kato et al: Pachygyria with Cerebellar Hypoplasia 661

ysis showed a normal female karyotype of 46,XX. There wasno deletion in 17p13.3 by fluorescence in situ hybridization(FISH) analysis. Electroencephalography (EEG) whileawake showed 9-Hz irregular alpha activity of the fronto-central area without paroxysmal activities. EEG while asleepshowed single, diffuse, high-voltage slow activity and frequentfocal spikes or spike and wave complex discharges. No abnormalfindings were found in the brainstem auditory evoked potential,visual evoked potential, or short-latency somatosensory evokedpotential.
Case 3A girl, the second child of healthy parents who were firstcousins, was born at term after an uneventful pregnancy. Herelder sister was mildly impaired in intelligence but had adaughter and son with normal intelligence. The patient’shead circumference was 34 cm (10.7 SD) at birth. Severepsychomotor developmental delay was noted since infancy.She walked without support at 15 years of age. At the age of30 years, she could eat by herself but could not speak anywords. She showed neither spasticity nor intentional tremor,but her motion was slow. She had a slightly protruded man-dible. Her head circumference was normal.
No abnormal findings were detected by laboratory exam-inations. Chromosomal analysis showed a normal femalekaryotype of 46,XX, and no deletion was found in 17p13.3by FISH analysis. EEG demonstrated no paroxysmal activi-ties. MRI of the brain revealed diffuse cortical pachygyriaand cerebellar hypoplasia similar to that in Cases 1 and 2(Fig 3).
Case 4A male patient, the younger brother of Case 3, was born asa twin at term. The other twin died of an unknown cause at
40 weeks of gestation before delivery. His head circumfer-ence was 36 cm (11.8 SD) at birth. He showed severe psy-chomotor developmental delay since infancy. He walkedwith support at 3 years of age. He exhibited generalized tonicclonic convulsions at 18 years of age. At the age of 25 years,he crawled and spoke five words. His head circumferencewas normal. He had a slightly protruded mandible. Heshowed no spasticity or intentional tremor.
He showed no abnormal findings by laboratory examina-tions. His chromosomal analysis was a male karyotype of46,XY, and no deletion was found in 17p13.3 by FISH anal-ysis. EEG demonstrated no paroxysmal activities. MRI of thebrain revealed diffuse pachygyria of the cerebrum and cere-bellar hypoplasia similar to that of his sibling and Cases1 and 2.
Discussion
MRI of all our cases showed diffuse pachygyria, whichappears more severe over the anterior than posteriorregion, with no agyric areas. The anterior and posteriorareas of the brain were similarly affected. Based on thegrading system for lissencephaly, these findings wouldbe classified as grade 4 lissencephaly, the rarely ob-served form.3 Dobyns and colleagues6 classified lissen-cephaly with cerebellar hypoplasia as “a cerebro-cerebellar lissencephaly variant,” which is differentfrom both type 1 and type 2 lissencephaly. They re-vised this term and divided it into “lissencephaly withcerebellar hypoplasia” and “microlissencephaly.” Thediversity of “lissencephaly with cerebellar hypoplasia,”excluding type 2 lissencephaly, is wide and heteroge-nous and has not been well defined.
Microlissencephaly, which is characterized by lissen-cephaly with severe congenital microcephaly (birthhead circumference , 23 SD) and severe hypoplasiaof both the cerebrum and cerebellum, has been previ-ously described.4,7 Kroon and associates4 proposed twotypes of microlissencephaly syndromes: the “Barth”type and the “McComb” type. The Barth type of mi-crolissencephaly was reported in 2 siblings by Barthand co-workers2 in 1982; it is characterized by verylow birth weight, complete agyria (four-layered neocor-tex), wide ventricles and thin neopallium (colpo-cephaly), agenesis of the corpus callosum, and extensivebrainstem and cerebellar anomalies without extracranialmalformations. Sugama and Kusano8 reported on 2similar cases of girls with congenital microcephaly, se-vere psychomotor delay, complete agyria, vermis apla-sia, and hypoplastic cerebellar hemispheres but with nodysmorphic features. The McComb type of lissenceph-aly syndrome is similar to the Barth microlissencephalysyndrome in that it shows lissencephaly with extrememicrocephaly, extreme cerebellar hypoplasia, and apoor prognosis.11 The former, however, unlike the lat-ter exhibits the extracranial multiple anomalies (dys-morphic features, such as sloping forehead, hypertelor-
Fig 3. MRI in case 3 at the age of 30 years. T2-weightedimages (TR 5 4000 msec, TE 5 104 msec). Symmetricaldiffuse pachygyria is demonstrated. The posterior horns of thelateral ventricles are mildly dilated. Both cerebellar vermis andhemispheres are severely hypoplastic.
662 Annals of Neurology Vol 46 No 4 October 1999
ism, prominent nasal bridge, small mandible,4,6,7,9,11
cleft palate,4,11 hemivertebrae,11 congenital heart de-fects,11 arthrogryposis,7,9,11 and genital anoma-lies6,7,11). It remains uncertain whether or not the in-heritance pattern of both types is the same. Ourpatients presented a normal head circumference atbirth, no abnormalities in the corpus callosum, andno life-threatening events. Our patients show a nor-mal appearance, except for a protruded mandible inCases 3 and 4. The clinical signs and neuroimagingfindings in our cases were milder than those of mi-crolissencephaly.
al Shawan and co-workers12 reported on a boy withpsychomotor retardation, who spoke only a few wordsand could not sit. MRI showed marked pachygyriawith defects in opercular development and near-totalabsence of the cerebellum. He had a normal head cir-cumference at birth. DeSouza and colleagues13 re-ported on the MRI findings of 3 cases, includingmonozygotic twins with marked cerebellar hypoplasiaand pachygyria. Their findings were similar to those ofour cases and al Shawan and co-workers case12; how-ever, it remains uncertain whether their clinical signswere also similar or not, because their clinical manifes-tations were not reported. A sibship of 3 male patientswith pachygyria, cerebellar hypoplasia, and congenitallymphedema was reported by Hourihane and associ-ates.10 These patients showed a normal head circum-ference at birth but severe developmental delay. Oneof the cases was complicated by duodenal atresia. Au-tosomal recessive inheritance was suggested because oftheir parental consanguinity. Although the patterns ofbrain malformation in these cases are similar to thosein our cases, there is a difference in the clinical phe-notypes.
As Cases 3 and 4 had consanguineous parents andboth sexes were similarly affected, autosomal recessiveinheritance was highly suspected. Autosomal recessiveinheritance has been suggested in several lissencephalysyndromes, including Miller-Dieker syndrome and mi-crolissencephaly. We did not detect a large deletion ofthe LIS1 gene in 17p13.3 responsible for Miller-Diekersyndrome in our cases; however, other types of mu-tations can not be ruled out. It remains unclearwhether or not our cases exhibited entities other thanmicrolissencephaly. In some variants of microlissen-cephaly, the mode of inheritance is controversial.4,5
To identify a responsible gene, we need to investigatelinkage analysis in patients with similar clinical andhistological aspects.
We thank Drs Sachio Takashima and Kiyoshi Ishii for neuroradio-logical advice and Dr Jun Toyama for his helpful suggestions.
References
1. Pilz DT, Matsumoto N, Minnerath S, et al. LIS1 and XLIS(DCX) mutations cause most classical lissencephaly, but differ-ent patterns of malformation. Hum Mol Genet 1998;7:2029–2037
2. Barth PG, Mullaart R, Stam FC, Slooff JL. Familial lissenceph-aly with extreme neopallial hypoplasia. Brain Dev 1982;4:145–151
3. Dobyns WB, Truwit CL. Lissencephaly and other malforma-tions of cortical development: 1995 update. Neuropediatrics1995;26:132–147
4. Kroon AA, Smit BJ, Barth PG, Hennekam RC. Lissencephalywith extreme cerebral and cerebellar hypoplasia: a magnetic res-onance imaging study. Neuropediatrics 1996;27:273–276
5. Farah S, Sabry MA, Khuraibet A, et al. Lissencephaly associ-ated with cerebellar hypoplasia and myoclonic epilepsy in aBedouin kindred: a new syndrome? Clin Genet 1997;51:326 –330
6. Dobyns WB, Gilbert EF, Opitz JM. Further comments on thelissencephaly syndromes. Am J Med Genet 1985;22:197–211
7. Sztriha L, Al-Gazali L, Varady E, et al. Microlissencephaly. Pe-diatr Neurol 1998;18:362–365
8. Sugama S, Kusano K. Two cases of possible cerebrocerebellarlissencephaly variant of type I [Japanese]. No Hattatsu 1995;27:502–504
9. Pittella JE, Nogueira AM. Cerebellar agenesia associated withmicrocephaly and agyria: report of a case in a newborn andreview of the literature [Portugese]. Arq Neuro-Psiquiat 1988;46:385–392
10. Hourihane JO, Bennett CP, Chaudhuri R, et al. A sibship witha neuronal migration defect, cerebellar hypoplasia and congen-ital lymphedema. Neuropediatrics 1993;24:43–46
11. McComb R, Schaefer B, Olney A, Hattie B. Cerebro-cerebellarlissencephaly, congenital heart defects and other congenitalanomalies in male sibs: a new syndrome. Presented at the 23rdAnnual March of Dimes Clinical Genetics Conference on De-velopmental and Genetic Disorders of the Central Nervous Sys-tem, Vancouver, BC, Canada, 1991
12. al Shawan SA, Bruyn GW, al Deeb SM. Lissencephaly withpontocerebellar hypoplasia. J Child Neurol 1996;11:241–244
13. deSouza N, Chaudhuri R, Bingham J, Cox T. MRI in cerebel-lar hypoplasia. Neuroradiology 1994;36:148–151
Brief Communication: Kato et al: Pachygyria with Cerebellar Hypoplasia 663
Association betweenAlzheimer’s Disease andthe NOS3 GeneMohammed Dahiyat, MSc,*† Alastair Cumming, PhD,†Charles Harrington, PhD,† Claude Wischik, MD,†John Xuereb, MD,‡ Frank Corrigan, MD,§Gerome Breen, MSc,*† Duncan Shaw, PhD,† andDavid St Clair, MD*
Alzheimer’s disease (AD) is the most common form ofneurodegenerative disorder of later life. Genetic studieshave demonstrated that the apolipoprotein E (ApoE)gene is an important susceptibility locus; however, otherenvironmental and genetic factors operating alone or incombination with ApoE must also be involved. Amongcandidate genes that may contribute to this residual riskis the endothelial nitric oxide synthase (NOS3) gene. NOrelease from vascular endothelium accounts in large partfor endothelium-derived relaxing factor bioactivity. Ab-normalities of cerebral small vessels occur early in AD,and it has been demonstrated recently that b-amyloid in-teracts with endothelial cells in blood vessels to producean excess of superoxide radicals. We have genotyped 122cases of early-onset AD (EOAD) and 317 cases of late-onset AD (LOAD) as well as 392 controls for a commonstructural polymorphism Glu/Asp at codon 298 in theNOS3 gene. We find a highly significant enrichment forGlu/Glu homozygotes in LOAD compared with controls.The effect appears to be independent of ApoE status.NOS3 may be a new genetic risk factor for LOAD.
Dahiyat M, Cumming A, Harrington C,Wischik C, Xuereb J, Corrigan F, Breen G,
Shaw D, St Clair D. Association betweenAlzheimer’s disease and the NOS3 gene.
Ann Neurol 1999;46:664–667
Alzheimer’s disease (AD) is the most common neuro-degenerative disorder of later life. It is characterizedclinically by a progressive dementia, often beginningwith memory loss, leading eventually to death. Neuro-pathological examination reveals b-amyloid peptide de-posits in senile plaques and cerebral blood vessel walls,neuronal cell death, and neurofibrillary tangles within
neurones of the cerebral cortex and hippocampus. Ge-netic studies of AD have demonstrated that the apoli-poproteinE (ApoE) gene is an important susceptibilitylocus for AD.1,2 The ε4 allele is a major risk factor forboth the rare early-onset (EOAD; ,65 years) and thecommon late-onset (LOAD; .65 years) forms of thedisorder.3 The ε4 allele is neither sufficient nor neces-sary for expression of AD, however. Other environ-mental and genetic factors operating either alone or incombination with ApoE must be involved. Recently, adeletion in the gene for a2-macroglobulin has been re-ported as a risk factor for AD in patients over 80 yearsold.4
Among other candidate genes is the endothelial ni-tric oxide synthase (NOS3) gene.5 Located on chromo-some 7q35, NOS3 encodes endothelial NOS (eNOS).NO release from vascular endothelium accounts inlarge part for endothelium-derived relaxing factor bio-activity.6 Abnormalities of cerebral small vessels occurearly in AD, and it has been demonstrated recentlythat b-amyloid interacts with endothelial cells in bloodvessels to produce an excess of superoxide radicals.7
These radicals can scavenge NO to produce oxidizingagents that can cause lipid peroxidation and other de-generative changes. Alternatively, it is possible that in-soluble b-amyloid deposition itself results from anNO/O22 imbalance.8 What is more, for poorly under-stood reasons, eNOS has a higher concentration inhippocampal pyramidal neurones, a principal site ofAD pathology, than in any other brain area.9 We hy-pothesized that polymorphic variants in the NOS3gene might influence these processes and consequentlyconfer variable degrees of genetic risk for AD. We havecompared the frequency of a common structural poly-morphism, Glu/Asp in codon 298 (exon 7) of NOS3in a series of EOAD and LOAD cases and controls us-ing a two-stage strategy in which we attempted to rep-licate positive results in a second series of LOAD cases.
MethodsPatients and ControlsEOAD (n 5 122). All cases met National Institute of Neu-rological and Communicative Disorders and Stroke(NINCDS) criteria for definite (n 5 52) or probable (n 570) AD.10 Patients with definite AD died in either psychi-atric or geriatric wards and had moderate or numerousplaques and tangles in the frontal and temporal cortex andhippocampus. Definite cases were collected by the MRCBrain Metabolism Unit, (Edinburgh) and the CambridgeBrain Bank. Patients with probable AD were identified inhospital wards or referred by clinical colleagues throughoutScotland. Age at onset averaged 57 years (range, 32–65years, 46 male, 76 female). Onset was defined as the time atwhich memory loss or change in behavior was first noticed.
LOAD: FIRST SERIES (n 5 138). All cases met NINCDS cri-teria for definite (n 5 105) and probable (n 5 33) AD.
From the *Department of Mental Health, University of AberdeenMedical School, and †Department of Molecular and Cell Biology,Institute of Medical Sciences, University of Aberdeen, Aberdeen;‡Cambridge Brain Bank, MRC Centre, Cambridge; and §Argylland Bute NHS Trust, Lochgilphead, Argyll, UK.
Received Feb 26, 1999, and in revised form Jun 23, 1999. Acceptedfor publication Jun 23, 1999.
Address correspondence to Dr St Clair, Department of MentalHealth, University of Aberdeen Medical School, Aberdeen AB252ZD, UK.
664 Copyright © 1999 by the American Neurological Association
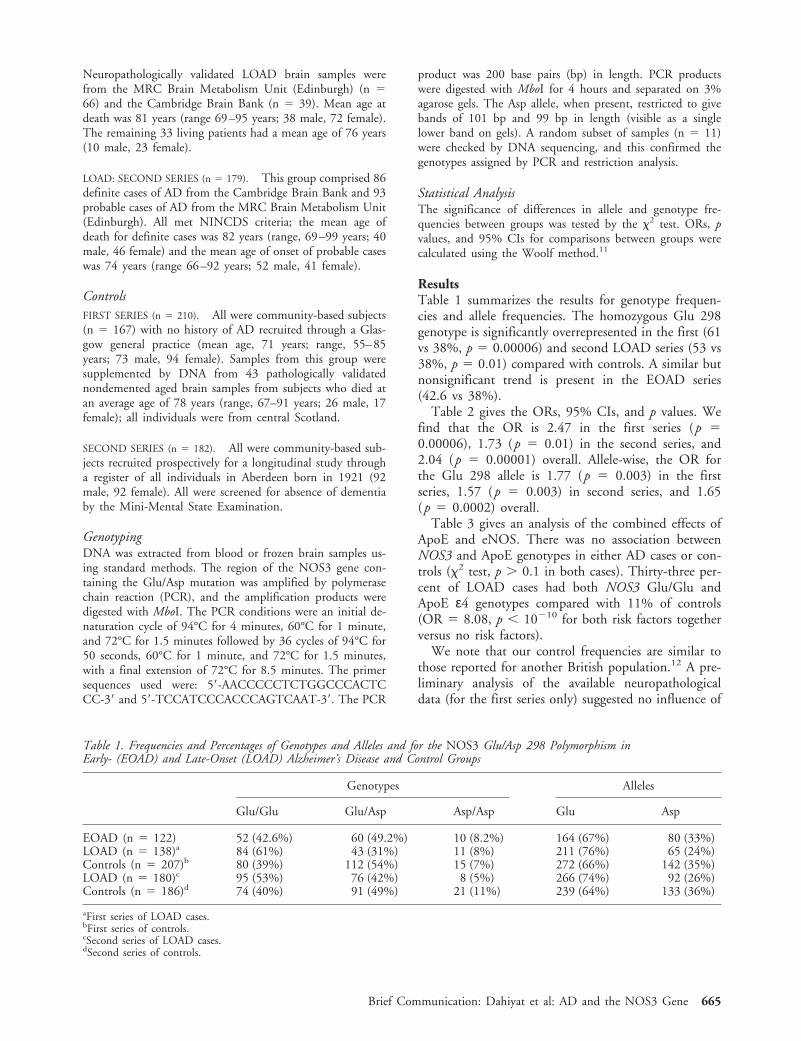
Neuropathologically validated LOAD brain samples werefrom the MRC Brain Metabolism Unit (Edinburgh) (n 566) and the Cambridge Brain Bank (n 5 39). Mean age atdeath was 81 years (range 69–95 years; 38 male, 72 female).The remaining 33 living patients had a mean age of 76 years(10 male, 23 female).
LOAD: SECOND SERIES (n 5 179). This group comprised 86definite cases of AD from the Cambridge Brain Bank and 93probable cases of AD from the MRC Brain Metabolism Unit(Edinburgh). All met NINCDS criteria; the mean age ofdeath for definite cases was 82 years (range, 69–99 years; 40male, 46 female) and the mean age of onset of probable caseswas 74 years (range 66–92 years; 52 male, 41 female).
ControlsFIRST SERIES (n 5 210). All were community-based subjects(n 5 167) with no history of AD recruited through a Glas-gow general practice (mean age, 71 years; range, 55–85years; 73 male, 94 female). Samples from this group weresupplemented by DNA from 43 pathologically validatednondemented aged brain samples from subjects who died atan average age of 78 years (range, 67–91 years; 26 male, 17female); all individuals were from central Scotland.
SECOND SERIES (n 5 182). All were community-based sub-jects recruited prospectively for a longitudinal study througha register of all individuals in Aberdeen born in 1921 (92male, 92 female). All were screened for absence of dementiaby the Mini-Mental State Examination.
GenotypingDNA was extracted from blood or frozen brain samples us-ing standard methods. The region of the NOS3 gene con-taining the Glu/Asp mutation was amplified by polymerasechain reaction (PCR), and the amplification products weredigested with MboI. The PCR conditions were an initial de-naturation cycle of 94°C for 4 minutes, 60°C for 1 minute,and 72°C for 1.5 minutes followed by 36 cycles of 94°C for50 seconds, 60°C for 1 minute, and 72°C for 1.5 minutes,with a final extension of 72°C for 8.5 minutes. The primersequences used were: 59-AACCCCCTCTGGCCCACTCCC-39 and 59-TCCATCCCACCCAGTCAAT-39. The PCR
product was 200 base pairs (bp) in length. PCR productswere digested with MboI for 4 hours and separated on 3%agarose gels. The Asp allele, when present, restricted to givebands of 101 bp and 99 bp in length (visible as a singlelower band on gels). A random subset of samples (n 5 11)were checked by DNA sequencing, and this confirmed thegenotypes assigned by PCR and restriction analysis.
Statistical AnalysisThe significance of differences in allele and genotype fre-quencies between groups was tested by the x2 test. ORs, pvalues, and 95% CIs for comparisons between groups werecalculated using the Woolf method.11
ResultsTable 1 summarizes the results for genotype frequen-cies and allele frequencies. The homozygous Glu 298genotype is significantly overrepresented in the first (61vs 38%, p 5 0.00006) and second LOAD series (53 vs38%, p 5 0.01) compared with controls. A similar butnonsignificant trend is present in the EOAD series(42.6 vs 38%).
Table 2 gives the ORs, 95% CIs, and p values. Wefind that the OR is 2.47 in the first series (p 50.00006), 1.73 (p 5 0.01) in the second series, and2.04 (p 5 0.00001) overall. Allele-wise, the OR forthe Glu 298 allele is 1.77 (p 5 0.003) in the firstseries, 1.57 (p 5 0.003) in second series, and 1.65(p 5 0.0002) overall.
Table 3 gives an analysis of the combined effects ofApoE and eNOS. There was no association betweenNOS3 and ApoE genotypes in either AD cases or con-trols (x2 test, p . 0.1 in both cases). Thirty-three per-cent of LOAD cases had both NOS3 Glu/Glu andApoE ε4 genotypes compared with 11% of controls(OR 5 8.08, p , 10210 for both risk factors togetherversus no risk factors).
We note that our control frequencies are similar tothose reported for another British population.12 A pre-liminary analysis of the available neuropathologicaldata (for the first series only) suggested no influence of
Table 1. Frequencies and Percentages of Genotypes and Alleles and for the NOS3 Glu/Asp 298 Polymorphism inEarly- (EOAD) and Late-Onset (LOAD) Alzheimer’s Disease and Control Groups
Genotypes Alleles
Glu/Glu Glu/Asp Asp/Asp Glu Asp
EOAD (n 5 122) 52 (42.6%) 60 (49.2%) 10 (8.2%) 164 (67%) 80 (33%)LOAD (n 5 138)a 84 (61%) 43 (31%) 11 (8%) 211 (76%) 65 (24%)Controls (n 5 207)b 80 (39%) 112 (54%) 15 (7%) 272 (66%) 142 (35%)LOAD (n 5 180)c 95 (53%) 76 (42%) 8 (5%) 266 (74%) 92 (26%)Controls (n 5 186)d 74 (40%) 91 (49%) 21 (11%) 239 (64%) 133 (36%)
aFirst series of LOAD cases.bFirst series of controls.cSecond series of LOAD cases.dSecond series of controls.
Brief Communication: Dahiyat et al: AD and the NOS3 Gene 665
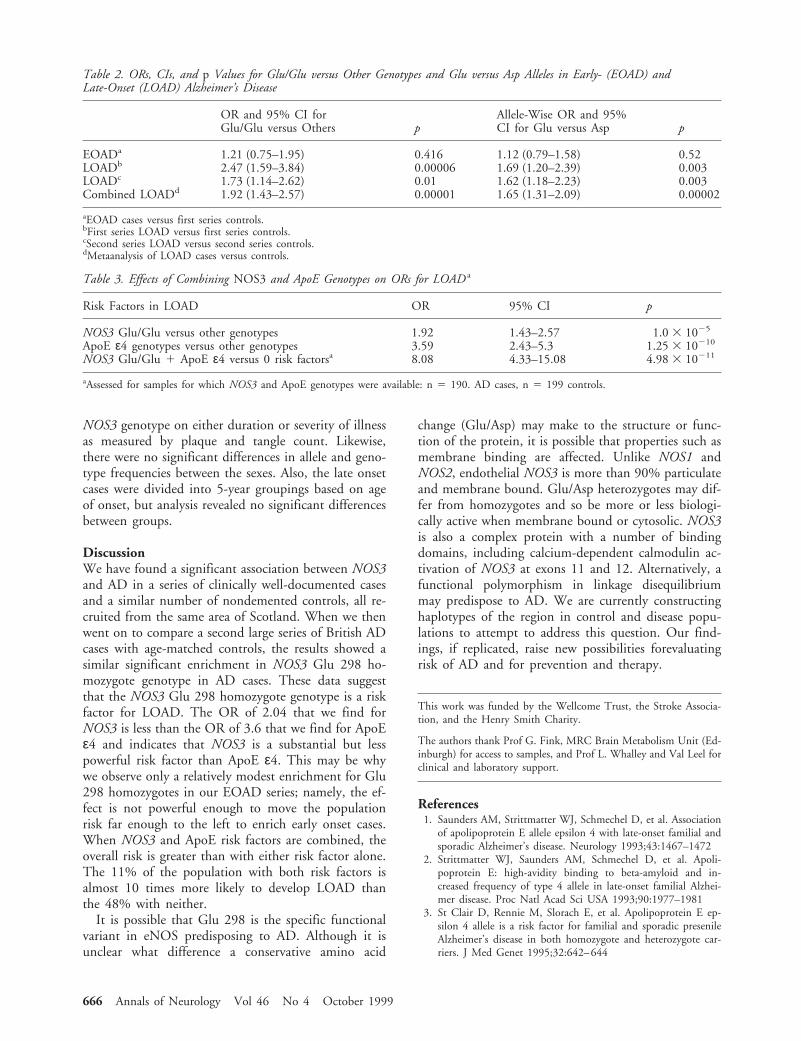
NOS3 genotype on either duration or severity of illnessas measured by plaque and tangle count. Likewise,there were no significant differences in allele and geno-type frequencies between the sexes. Also, the late onsetcases were divided into 5-year groupings based on ageof onset, but analysis revealed no significant differencesbetween groups.
DiscussionWe have found a significant association between NOS3and AD in a series of clinically well-documented casesand a similar number of nondemented controls, all re-cruited from the same area of Scotland. When we thenwent on to compare a second large series of British ADcases with age-matched controls, the results showed asimilar significant enrichment in NOS3 Glu 298 ho-mozygote genotype in AD cases. These data suggestthat the NOS3 Glu 298 homozygote genotype is a riskfactor for LOAD. The OR of 2.04 that we find forNOS3 is less than the OR of 3.6 that we find for ApoEε4 and indicates that NOS3 is a substantial but lesspowerful risk factor than ApoE ε4. This may be whywe observe only a relatively modest enrichment for Glu298 homozygotes in our EOAD series; namely, the ef-fect is not powerful enough to move the populationrisk far enough to the left to enrich early onset cases.When NOS3 and ApoE risk factors are combined, theoverall risk is greater than with either risk factor alone.The 11% of the population with both risk factors isalmost 10 times more likely to develop LOAD thanthe 48% with neither.
It is possible that Glu 298 is the specific functionalvariant in eNOS predisposing to AD. Although it isunclear what difference a conservative amino acid
change (Glu/Asp) may make to the structure or func-tion of the protein, it is possible that properties such asmembrane binding are affected. Unlike NOS1 andNOS2, endothelial NOS3 is more than 90% particulateand membrane bound. Glu/Asp heterozygotes may dif-fer from homozygotes and so be more or less biologi-cally active when membrane bound or cytosolic. NOS3is also a complex protein with a number of bindingdomains, including calcium-dependent calmodulin ac-tivation of NOS3 at exons 11 and 12. Alternatively, afunctional polymorphism in linkage disequilibriummay predispose to AD. We are currently constructinghaplotypes of the region in control and disease popu-lations to attempt to address this question. Our find-ings, if replicated, raise new possibilities forevaluatingrisk of AD and for prevention and therapy.
This work was funded by the Wellcome Trust, the Stroke Associa-tion, and the Henry Smith Charity.
The authors thank Prof G. Fink, MRC Brain Metabolism Unit (Ed-inburgh) for access to samples, and Prof L. Whalley and Val Leel forclinical and laboratory support.
References1. Saunders AM, Strittmatter WJ, Schmechel D, et al. Association
of apolipoprotein E allele epsilon 4 with late-onset familial andsporadic Alzheimer’s disease. Neurology 1993;43:1467–1472
2. Strittmatter WJ, Saunders AM, Schmechel D, et al. Apoli-poprotein E: high-avidity binding to beta-amyloid and in-creased frequency of type 4 allele in late-onset familial Alzhei-mer disease. Proc Natl Acad Sci USA 1993;90:1977–1981
3. St Clair D, Rennie M, Slorach E, et al. Apolipoprotein E ep-silon 4 allele is a risk factor for familial and sporadic presenileAlzheimer’s disease in both homozygote and heterozygote car-riers. J Med Genet 1995;32:642–644
Table 2. ORs, CIs, and p Values for Glu/Glu versus Other Genotypes and Glu versus Asp Alleles in Early- (EOAD) andLate-Onset (LOAD) Alzheimer’s Disease
OR and 95% CI forGlu/Glu versus Others p
Allele-Wise OR and 95%CI for Glu versus Asp p
EOADa 1.21 (0.75–1.95) 0.416 1.12 (0.79–1.58) 0.52LOADb 2.47 (1.59–3.84) 0.00006 1.69 (1.20–2.39) 0.003LOADc 1.73 (1.14–2.62) 0.01 1.62 (1.18–2.23) 0.003Combined LOADd 1.92 (1.43–2.57) 0.00001 1.65 (1.31–2.09) 0.00002
aEOAD cases versus first series controls.bFirst series LOAD versus first series controls.cSecond series LOAD versus second series controls.dMetaanalysis of LOAD cases versus controls.
Table 3. Effects of Combining NOS3 and ApoE Genotypes on ORs for LOAD a
Risk Factors in LOAD OR 95% CI p
NOS3 Glu/Glu versus other genotypes 1.92 1.43–2.57 1.0 3 1025
ApoE ε4 genotypes versus other genotypes 3.59 2.43–5.3 1.25 3 10210
NOS3 Glu/Glu 1 ApoE ε4 versus 0 risk factorsa 8.08 4.33–15.08 4.98 3 10211
aAssessed for samples for which NOS3 and ApoE genotypes were available: n 5 190. AD cases, n 5 199 controls.
666 Annals of Neurology Vol 46 No 4 October 1999

4. Blacker D, Wilcox MA, Laird NM, et al. Alpha-2-macroglobulin is genetically associated with Alzheimer disease.Nat Genet 1998;19:357–360
5. Marsden PA, Heng HH, Scherer SW, et al. Structure and chro-mosomal localization of the human constitutive endothelial ni-tric oxide synthase gene. J Biol Chem 1993;268:17478–17488
6. Forstermann U, Gath I, Schwarz P, et al. Isoforms of nitricoxide synthase. Properties, cellular distribution and expressionalcontrol. Biochem Pharmacol 1995;50:1321–1332
7. Furchgott RF, Zawadzki JV. The obligatory role of endothelialcells in the relaxation of arterial smooth muscle by acetylcho-line. Nature 1980;288:373–376
8. Thomas T, Thomas G, McLendon C, et al. b-Amyloid–mediatedvasoactivity and vascular endothelial damage. Nature 1996;380:168–171
9. Dinerman JL, Dawson TM, Schell MJ, et al. Endothelial nitricoxide synthase localized to hippocampal pyramidal cells: impli-cations for synaptic plasticity. Proc Natl Acad Sci USA 1994;91:4214–4218
10. McKhann G, Drachman D, Folstein M, et al. Clinical diagno-sis of Alzheimer’s disease: report of the NINCDS-ADRDAWork Group under the auspices of Department of Health andHuman Services Task Force on Alzheimer’s Disease. Neurology1984;34:939–944
11. Woolf B. On estimating the relation between blood groups anddisease. Ann Hum Genet 1955;19:251–253
12. Markus HS, Ruigrok Y, Ali N, Powell JF. Endothelial nitricoxide synthase exon 7 polymorphism, ischemic cerebrovasculardisease, and carotid atheroma. Stroke 1998;29:1908–1911
Quantitative Near-InfraredSpectroscopy Discriminatesbetween MitochondrialMyopathies andNormal MuscleMireille C. P. van Beekvelt, MSc,*†Baziel G. M. van Engelen, MD, PhD,*Ron A. Wevers, PhD,* and Willy N. J. M. Colier, PhD†
Five patients with chronic progressive external ophthal-moplegia (CPEO) and 27 healthy controls were examinedby near-infrared spectroscopy (NIRS) for the noninvasiveand direct quantitative measurement of muscle oxygenconsumption and forearm blood flow. NIRS measure-
ments were obtained in rest and during static isometrichandgrip exercise at 10% of the maximum voluntary con-traction (MVC) force. A significantly decreased oxygenconsumption at rest as well as during exercise was foundin patients with CPEO. Our results suggest that NIRS isable to discriminate between CPEO patients and healthycontrols, which makes NIRS a valuable tool in the diag-nostic workup of patients suspected to have a mitochon-drial myopathy.
van Beekvelt MCP, van Engelen BGM,Wevers RA, Colier WNJM. Quantitative near-
infrared spectroscopy discriminates betweenmitochondrial myopathies and normal muscle.
Ann Neurol 1999;46:667–670
Although mitochondrial myopathies are phenotypicallyand genetically heterogeneous disorders, they share ex-ercise intolerance, undue fatigue, and lactic acidosisduring low- to moderate-intensity work.1 As a resultof these common characteristics, exercise tests are usedto evaluate metabolic and especially mitochondrialmyopathies.2,3
Even apart from the very young and severely affectedpatients who are incapable of performing exercise, ex-ercise tests can be potentially hazardous in patientswith mitochondrial myopathies because of associatedcardiac involvement.4,5 Nevertheless, patients with mi-tochondrial myopathies have almost exclusively beentested during whole-body exercise. The isolated musclein vivo has been monitored by magnetic resonancespectroscopy (MRS),6 but no muscle studies have di-rectly and quantitatively examined oxygen uptake anddelivery in resting and exercising muscle of patientswith mitochondrial myopathies.
The aim of the present study was therefore to inves-tigate whether near-infrared spectroscopy (NIRS), a di-rect noninvasive method of tissue oximetry, could dis-criminate between a group of patients with chronicprogressive external ophthalmoplegia (CPEO) andhealthy controls. Furthermore, our goal was to developa test that is functional in the wide range of patientssuspected of having a mitochondrial myopathy.
Patients and MethodsWe studied a group of 5 patients with varying clinical sever-ity of sporadic CPEO diagnosed according to established cri-teria (Table).4 CPEO patients were compared with 27healthy controls. As described previously in detail,7 patientsand controls were measured at rest as well as during staticisometric handgrip exercise at a workload equal to 10% ofthe subject’s maximum voluntary contraction (MVC) force.NIRS was used for the quantitative measurement of oxygenconsumption and forearm blood flow.
NIRS is a noninvasive optical method for continuousmonitoring of oxygenation and hemodynamics in tissue. It isbased on the relative tissue transparency to light in the near-
From the *Neuromuscular Centre Nijmegen, Department of Neu-rology, and †Department of Physiology, Faculty of Medical Sci-ences, University of Nijmegen, Nijmegen, The Netherlands.
Received Dec 22, 1998, and in revised form Apr 26, 1999. Ac-cepted for publication Jun 28, 1999.
Address correspondence to Dr van Engelen, Neuromuscular CentreNijmegen, Department of Neurology, University Hospital Nijme-gen, PO Box 9101, 6500 HB Nijmegen, The Netherlands.
Copyright © 1999 by the American Neurological Association 667

Fig 1. Representative raw near-infrared spectroscopy data as dis-played in real time on the screen.Oxyhemoglobin (O2Hb), deoxyhe-moglobin (HHb), and the sum ofO2Hb and HHb, reflecting totalhemoglobin (tHb), are shown dur-ing arterial occlusion (A; 240 mmHg) and venous occlusion (B; 50mm Hg). Oxygen consumption iscalculated during arterial occlu-sion as the rate of decrease inO2Hb indicated by the straightline in A. Forearm blood flow iscalculated during venous occlu-sion as the rate of increase intHb indicated by the straight linein B.
Table. Clinical Characteristics of Patients with Sporadic Chronic Progressive External Ophthalmoplegia
NumberSex/Age(yr)
Maximum VoluntaryContraction Force(N)
DiseaseDuration(yr) Fatiguea
Proximal MuscleStrength (MRC)
ModifiedRankinScaleb
Muscle BiopsyRagged RedFibersc
Serum Lactated
(mmol/L)
1 M/54 132 28 2 4/5 2 1 1,5202 M/19 262 3 1 5/5 2 11 1,5863 F/36 168 4 2 5/5 2 11 1,2884 F/42 153 22 111 3/5 3 11 8445 F/54 100 27 11 3/5 3 1 2,660
a2 5 not present; 1 5 mild; 11 5 moderate; 111 5 severe.bModified Rankin scale described by Van Swieten et al.13
c1 5 present; 11 5 abundant.dNormal values ,1,700 mmol/L.
M 5 male; F 5 female; MRC 5 Medical Research Council.
668 Annals of Neurology Vol 46 No 4 October 1999
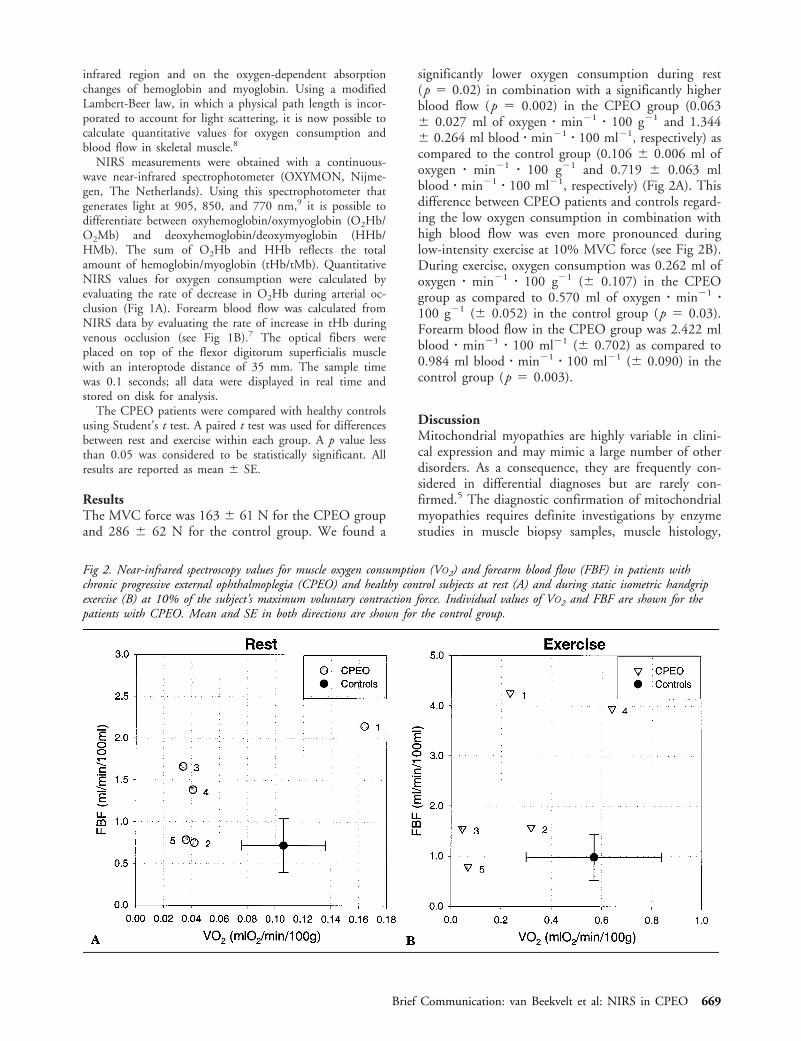
infrared region and on the oxygen-dependent absorptionchanges of hemoglobin and myoglobin. Using a modifiedLambert-Beer law, in which a physical path length is incor-porated to account for light scattering, it is now possible tocalculate quantitative values for oxygen consumption andblood flow in skeletal muscle.8
NIRS measurements were obtained with a continuous-wave near-infrared spectrophotometer (OXYMON, Nijme-gen, The Netherlands). Using this spectrophotometer thatgenerates light at 905, 850, and 770 nm,9 it is possible todifferentiate between oxyhemoglobin/oxymyoglobin (O2Hb/O2Mb) and deoxyhemoglobin/deoxymyoglobin (HHb/HMb). The sum of O2Hb and HHb reflects the totalamount of hemoglobin/myoglobin (tHb/tMb). QuantitativeNIRS values for oxygen consumption were calculated byevaluating the rate of decrease in O2Hb during arterial oc-clusion (Fig 1A). Forearm blood flow was calculated fromNIRS data by evaluating the rate of increase in tHb duringvenous occlusion (see Fig 1B).7 The optical fibers wereplaced on top of the flexor digitorum superficialis musclewith an interoptode distance of 35 mm. The sample timewas 0.1 seconds; all data were displayed in real time andstored on disk for analysis.
The CPEO patients were compared with healthy controlsusing Student’s t test. A paired t test was used for differencesbetween rest and exercise within each group. A p value lessthan 0.05 was considered to be statistically significant. Allresults are reported as mean 6 SE.
ResultsThe MVC force was 163 6 61 N for the CPEO groupand 286 6 62 N for the control group. We found a
significantly lower oxygen consumption during rest(p 5 0.02) in combination with a significantly higherblood flow (p 5 0.002) in the CPEO group (0.0636 0.027 ml of oxygen z min21 z 100 g21 and 1.3446 0.264 ml blood z min21 z 100 ml21, respectively) ascompared to the control group (0.106 6 0.006 ml ofoxygen z min21 z 100 g21 and 0.719 6 0.063 mlblood z min21 z 100 ml21, respectively) (Fig 2A). Thisdifference between CPEO patients and controls regard-ing the low oxygen consumption in combination withhigh blood flow was even more pronounced duringlow-intensity exercise at 10% MVC force (see Fig 2B).During exercise, oxygen consumption was 0.262 ml ofoxygen z min21 z 100 g21 (6 0.107) in the CPEOgroup as compared to 0.570 ml of oxygen z min21 z100 g21 (6 0.052) in the control group (p 5 0.03).Forearm blood flow in the CPEO group was 2.422 mlblood z min21 z 100 ml21 (6 0.702) as compared to0.984 ml blood z min21 z 100 ml21 (6 0.090) in thecontrol group (p 5 0.003).
DiscussionMitochondrial myopathies are highly variable in clini-cal expression and may mimic a large number of otherdisorders. As a consequence, they are frequently con-sidered in differential diagnoses but are rarely con-firmed.5 The diagnostic confirmation of mitochondrialmyopathies requires definite investigations by enzymestudies in muscle biopsy samples, muscle histology,
Fig 2. Near-infrared spectroscopy values for muscle oxygen consumption (VO2) and forearm blood flow (FBF) in patients withchronic progressive external ophthalmoplegia (CPEO) and healthy control subjects at rest (A) and during static isometric handgripexercise (B) at 10% of the subject’s maximum voluntary contraction force. Individual values of VO2 and FBF are shown for thepatients with CPEO. Mean and SE in both directions are shown for the control group.
Brief Communication: van Beekvelt et al: NIRS in CPEO 669

31P-MRS, and molecular genetic techniques. Moleculargenetics identify only known defects, sensitivity ofmuscle histology is limited, and routine use of 31P-MRS is restricted by its limited availability.2
Exercise tests provide a valuable tool to detect pa-tients with a suspected mitochondrial myopathy, asthese patients share the characteristics of exercise intol-erance, undue fatigue, and lactic acidosis during low-to moderate-intensity work. However, exercise can bepotentially hazardous in these patients as a result ofassociated cardiac conduction abnormalities reported,for example, in CPEO.4,5 Apart from that, there arepatients who are incapable of performing exercise be-cause they are severely affected or simply too young.This is why the development of a noninvasive widelyavailable screening test that is functional in the rangeof patients suspected of having mitochondrial myopa-thies is of the utmost importance.
In the present study, NIRS was used for the nonin-vasive direct examination of muscle oxygen consump-tion and forearm blood flow in patients with CPEO.Static isometric handgrip exercise was chosen to in-clude all patients independent of disease status. Wefound a decreased oxygen consumption in the CPEOgroup compared with controls, in combination with anincreased forearm blood flow present in both low-intensity exercise and at rest. Our NIRS data on oxy-gen consumption during exercise are compatible withthose of previous reports10,11 and support the hypoth-esis of a hyperkinetic circulatory response to exercise inmitochondrial myopathies.12 Furthermore, our datashow that this upregulated flow, compared with that incontrols, is also present during rest (see Fig 2A). Thismismatch between oxygen delivery and consumptionmight function as a compensatory mechanism for theimpaired oxygen consumption in CPEO muscle.
The present data on decreased oxygen consumptionin CPEO as measured by NIRS during low-intensitywork as well as at rest suggests that NIRS can serve asa highly valuable and promising tool in the diagnostic
workup of patients with mitochondrial myopathies ofvarying severity. Because NIRS is able to measurewithin the muscle, it provides unique informationabout local tissue oxygenation and might reveal newfacts about the process of mitochondrial myopathies.
References1. Taivassalo T, De Stefano N, Argov Z, et al. Effects of aerobic
training in patients with mitochondrial myopathies. Neurology1998;50:1055–1060
2. Argov Z, De Stefano N, Taivassalo T, et al. Abnormal oxidativemetabolism in exercise intolerance of undetermined origin.Neuromuscul Disord 1997;7:99–104
3. Haller RG, Bertocci LA. Exercise evaluation of metabolic my-opathies. In: Engel AG, Franzini-Armstrong C, eds. Myology.New York: McGraw-Hill, 1990:807–821
4. Bindoff L, Brown G, Poulton J. Mitochondrial myopathies. In:Emery AEH, ed. Diagnostic criteria for neuromuscular disor-ders. London: Royal Society of Medicine Press, 1997:85–90
5. Poulton J. Mitochondrial myopathies and related disorders. In:Emery AEH, ed. Neuromuscular disorders: clinical and molec-ular genetics. Chichester: John Wiley, 1998:203–213
6. Argov Z. Functional evaluation techniques in mitochondrialdisorders. Eur Neurol 1998;39:65–71
7. Van Beekvelt MCP, Colier WNJM, Van Engelen BGM, et al.Validation of measurement protocols to assess oxygen consump-tion and blood flow in the human forearm by near-infraredspectroscopy. SPIE Proc 1998;3194:133–144
8. Ferrari M, Binzoni T, Quaresima V. Oxidative metabolism inmuscle. Phil Trans R Soc Lond B 1997;352:677–683
9. Van der Sluijs MC, Colier WNJM, Houston RJF, Oeseburg B.A new and highly sensitive continuous wave near infrared spec-trophotometer with multiple detectors. SPIE Proc 1998;3194:63–72
10. Bank W, Chance B. An oxidative defect in metabolicmyopathies: diagnosis by noninvasive tissue oximetry. AnnNeurol 1994;36:830–837
11. Abe K, Matsuo Y, Kadekawa J, et al. Measurement of tissueoxygen consumption in patients with mitochondrial myopathyby noninvasive tissue oximetry. Neurology 1997;49:837–841
12. Haller RG. Oxygen utilization and delivery in metabolic my-opathies (Editorial; comment). Ann Neurol 1994;36:811–813
13. Van Swieten JC, Koudstaal PK, Visser MC, et al. Interobserveragreement for the assessment of handicap in stroke patients.Stroke 1988;19:604–607
670 Annals of Neurology Vol 46 No 4 October 1999