Sequencing error correction without a reference genome
9
Sequencing error correction without a reference genome Sleep et al. Sleep et al. BMC Bioinformatics 2013, 14:367 http://www.biomedcentral.com/1471-2105/14/367
-
Upload
independent -
Category
Documents
-
view
5 -
download
0
Transcript of Sequencing error correction without a reference genome
Sequencing error correction without areference genomeSleep et al.
Sleep et al. BMC Bioinformatics 2013, 14:367http://www.biomedcentral.com/1471-2105/14/367

Sleep et al. BMC Bioinformatics 2013, 14:367http://www.biomedcentral.com/1471-2105/14/367
METHODOLOGY ARTICLE Open Access
Sequencing error correction without areference genomeJulie A Sleep1,2*, Andreas W Schreiber3,4 and Ute Baumann1
Abstract
Background: Next (second) generation sequencing is an increasingly important tool for many areas of molecularbiology, however, care must be taken when interpreting its output. Even a low error rate can cause a large number oferrors due to the high number of nucleotides being sequenced. Identifying sequencing errors from true biologicalvariants is a challenging task. For organisms without a reference genome this difficulty is even more challenging.
Results: We have developed a method for the correction of sequencing errors in data from the Illumina Solexasequencing platforms. It does not require a reference genome and is of relevance for microRNA studies, unsequencedgenomes, variant detection in ultra-deep sequencing and even for RNA-Seq studies of organisms with sequencedgenomes where RNA editing is being considered.
Conclusions: The derived error model is novel in that it allows different error probabilities for each position along theread, in conjunction with different error rates depending on the particular nucleotides involved in the substitution,and does not force these effects to behave in a multiplicative manner. The model provides error rates which capturethe complex effects and interactions of the three main known causes of sequencing error associated with the Illuminaplatforms.
BackgroundThe combination of a high read depth and the highlyexpressed nature of some sequences can result in somereads occurring millions of times in a next generationsequencing data set. For these situations, even very lowerror rates may still result in the presence of a multitude ofsequence variants. Distinguishing these variants from truebiological variants is a technological and computationalchallenge. In many species, this difficulty is compoundedby the lack of an available reference genome.
The importance of identifying and correcting sequenceerrors has been highlighted by the recent discussionprompted by the report of the presence of widespread dif-ferences between the human genome (DNA) and readsderived from the corresponding RNA [1]. While it istempting to interpret such differences as being due to thepresence of RNA editing, a reanalysis of this same data set
*Correspondence: [email protected] Centre for Plant Functional Genomics, The University of Adelaide,Urrbrae, SA 5064, Australia2Phenomics and Bioinformatics Research Centre, University of South Australia,Mawson Lakes, SA 5095, AustraliaFull list of author information is available at the end of the article
showed that the majority of the reported differences wereactually consistent with technical artefacts arising fromsequencing errors (see, e.g. [2]).
It goes without saying that when the genome of anorganism has not been sequenced and assembled, the dif-ficulty of identifying possible sequencing errors is greatlyincreased, necessitating the development of alternateanalysis methods.
Sequencing errors arising from the use of Illuminasequencers, on which we concentrate, can occur for avariety of reasons. One source of error originates froma phenomena referred to as crosstalk. Crosstalk occurswhen there is an overlap in signals of the dye emissionfrequencies used in sequencing machines.
This overlap can lead to confusion of the nucleotideG with nucleotide T, and of A with C [3,4]. A secondcause of error is referred to as either dephasing or phasing.Since sequencing is done in cycles, an error in an earliercycle may propagate to and affect later cycles. This usuallyresults in the errors appearing more frequently toward theends of the reads. T fluorophore accumulation is anothersource of error, and results in more T’s being incorrectlyattributed towards the ends of reads. For an extensive
© 2013 Sleep et al.; licensee BioMed Central Ltd. This is an Open Access article distributed under the terms of the CreativeCommons Attribution License (http://creativecommons.org/licenses/by/2.0), which permits unrestricted use, distribution, andreproduction in any medium, provided the original work is properly cited.
Sleep et al. BMC Bioinformatics 2013, 14:367 Page 2 of 8http://www.biomedcentral.com/1471-2105/14/367
review, see [5], which also discusses other possible sourcesof sequencing errors such as signal decay, mixed clus-ters and boundary effects. Additionally, sequence-specificerror patterns, including inverted repeats and the effectsof the nucleotide sequence GGC have been proposedas an important cause of sequencing errors throughdephasing [6].
The issue of sequencing errors is so ubiquitous thatbeing able to detect and correct them is essential in manyareas of molecular biology, particularly in the identifi-cation of miRNAs. In [7], the occurrence of errors andtheir corresponding rates were investigated by lookingat Illumina data sets (2.8 million 27-base reads) takenfrom Beta vulgaris and Helicobacter acinonychis. By align-ing reads to the known genomes of these bacteria, errorrates were derived for each of the 12 possible nucleotidesubstitutions.
This work is typical of procedures that rely on the avail-ability of a reference genome and many methods andsoftware packages have been developed for the detectionand/or correction of sequencing errors in this setting [8].One such method [9] is based on an algorithm for cor-recting sequencing errors that uses a ‘generalized suffixtrie’. However, this method requires a reference genomeand assumes a uniformly distributed error rate. A simi-lar method using suffix arrays is that of Ilie et al. [10]. Analternative method for correcting short reads that takesinto account genomic repeats, is described in [11]. Basedon a position-dependent error model, error probabilitiesare estimated for each nucleotide substitution type. Themethod of [12] also requires a reference genome, has aposition dependent error model, but it is one that is notbase-specific.
A different approach, that does not rely on the exis-tence of a sequenced genome, was adopted in [13]. Shortreads are clustered into trees where the most abundantsequence is taken to be the root of a tree, and “children”,who differ by n nucleotide substitutions, are placed at thenth level. These children are classified either as sequenc-ing errors or biological variants. This approach utilisesthe Illumina quality scores, which are adjusted by meansof actual error rates determined by BAC sequencing dataused as a control. These error rates are used to estimatethe expected number of errors for a given position pos,quality value Q, and substitution pattern R (e.g. A→C) bycalculating
Nerror(pos, Q, R) = Perror1 − Perror(pos)
Ncorrect[Rate(Q, R)] (1)
where Perror is the overall probability of an error,Perror(pos) is the adjusted probability of an error at eachposition, and Rate(Q, R) gives the probability of pattern Roccurring when the quality score takes the value Q. Foreach child, the expected number of errors are compared to
the actual frequency, using a Z-test with the null hypoth-esis being that the sequence read contains a sequencingerror.
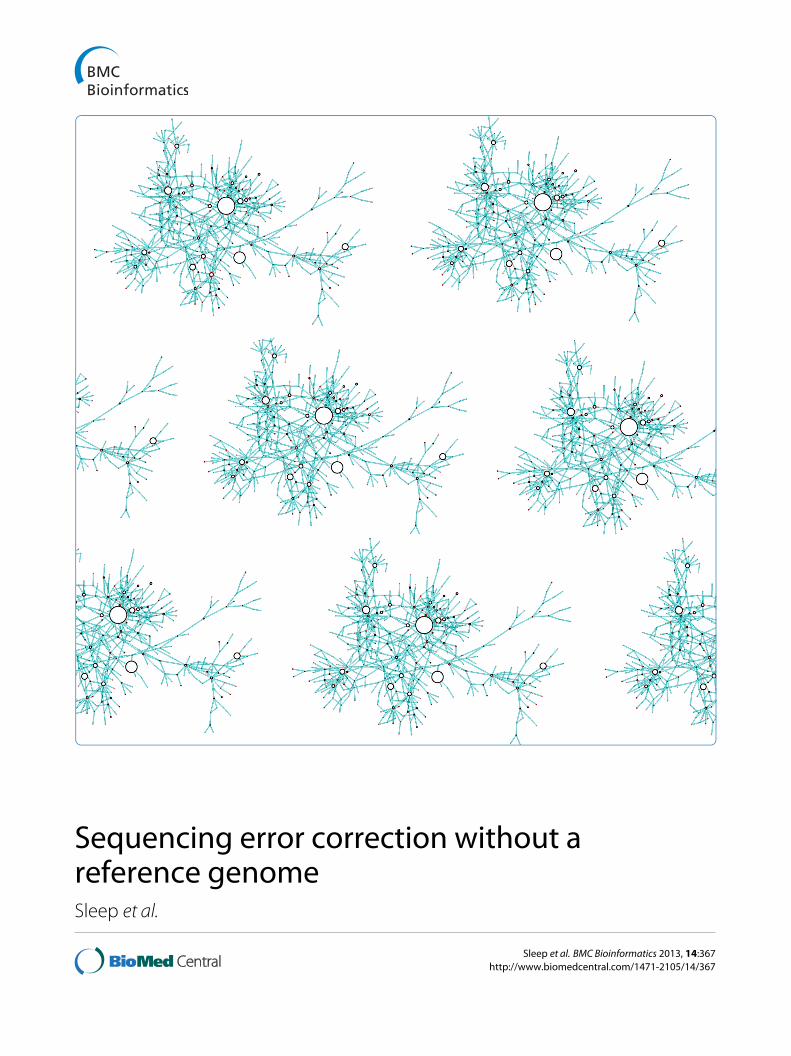
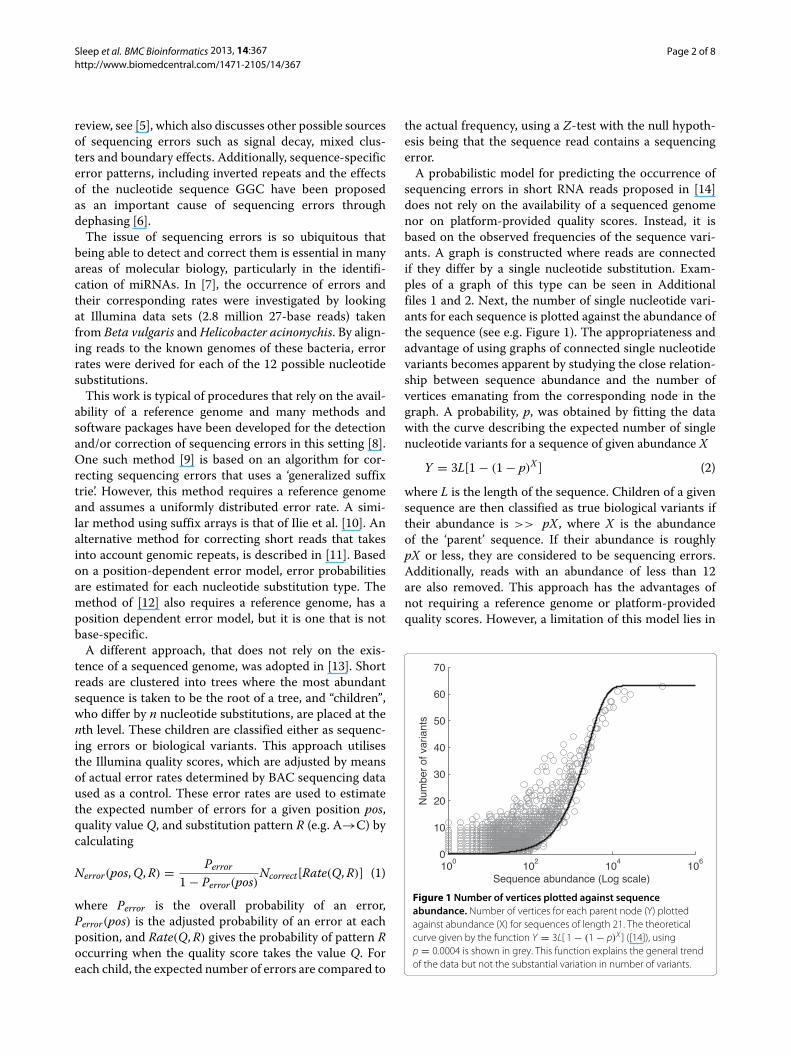
A probabilistic model for predicting the occurrence ofsequencing errors in short RNA reads proposed in [14]does not rely on the availability of a sequenced genomenor on platform-provided quality scores. Instead, it isbased on the observed frequencies of the sequence vari-ants. A graph is constructed where reads are connectedif they differ by a single nucleotide substitution. Exam-ples of a graph of this type can be seen in Additionalfiles 1 and 2. Next, the number of single nucleotide vari-ants for each sequence is plotted against the abundance ofthe sequence (see e.g. Figure 1). The appropriateness andadvantage of using graphs of connected single nucleotidevariants becomes apparent by studying the close relation-ship between sequence abundance and the number ofvertices emanating from the corresponding node in thegraph. A probability, p, was obtained by fitting the datawith the curve describing the expected number of singlenucleotide variants for a sequence of given abundance X
Y = 3L[1 − (1 − p)X] (2)
where L is the length of the sequence. Children of a givensequence are then classified as true biological variants iftheir abundance is >> pX, where X is the abundanceof the ‘parent’ sequence. If their abundance is roughlypX or less, they are considered to be sequencing errors.Additionally, reads with an abundance of less than 12are also removed. This approach has the advantages ofnot requiring a reference genome or platform-providedquality scores. However, a limitation of this model lies in
10
0
10
2
10
4
10
6
0
10
20
30
40
50
60
70
Sequence abundance (Log scale)
Num
ber of varia
nts
Figure 1 Number of vertices plotted against sequenceabundance. Number of vertices for each parent node (Y) plottedagainst abundance (X) for sequences of length 21. The theoreticalcurve given by the function Y = 3L[ 1 − (1 − p)X ] ([14]), usingp = 0.0004 is shown in grey. This function explains the general trendof the data but not the substantial variation in number of variants.

Sleep et al. BMC Bioinformatics 2013, 14:367 Page 3 of 8http://www.biomedcentral.com/1471-2105/14/367
the assumption of a constant error rate along the read.While the number of sequence variants does increase withincreasing abundance of a sequence, there is considerablevariation (as seen in Figure 1) that cannot be explained bya probabilistic model based on a constant error rate.
In the following sections we present a method formodelling sequencing errors, extending the graph-basedapproach described in [14] but incorporating position-and substitution-specific error rates. Additionally, we donot enforce these effects to be working multiplicatively,and the method does not require a reference genomeor quality scores. Results are included that highlight theadvantages of the method in its ability to account for theinteractions between the different causes of sequencingerrors.
MethodsWe extend the approach of [14] by allowing for errorrates that are both dependent on position along the readand vary by each nucleotide substitution pattern (e.g.,T→G). As stated earlier, we do not restrict ourselves tothe assumption that these two effects work in a multi-plicative fashion. The method was tested on data setsobtained from high-throughput sequencing of short RNAreads extracted from the leaves and roots of three differentcultivars of wheat. For this purpose, the Illumina Solexasequencing technology was employed.
The number of reads for each sample and lane rangedfrom 5 to 41 million reads, and several sequencing runswere performed approximately two years apart. The firstsamples were 36 base reads run on the Illumina GenomeAnalyzer (GeneWorks Pty. Ltd., c. 2009) and the sec-ond were 50 base reads from Illumina HiSeq with Illu-mina TruSeq v3 reagents (Australian Genome ResearchFacility Ltd., December 2011). What we term an indi-vidual data set is the sequenced data from a particularlane (numbered between 1 and 8), corresponding to theirphysical locations on the flow cell. We refer to lanes 4and 5 as being the innermost lanes and 1 and 8 as theoutermost.
Data processing and graph constructionProcessing began with the 3′ adaptors being trimmedfrom the sequences. A number of mismatches to thisadaptor were allowed depending on the length of thematching sections, as described in [14]. Reads contain-ing homopolymer tracts were not removed at this earlystage. Removal occurred as a final step after the errormodel is built and the data corrected for sequencingerrors. This was done so as to prevent the removal of anyparent sequences of erroneous reads. Reads containingundetermined nucleotides (denoted by the letter N) were,however, excluded from our analysis. Sequences of lengthoutside the region of interest (20-24 nucleotides) were
not studied any further. Unique sequences were identifiedalong with the frequency (abundance) with which eachwas seen in the data.
Graphs were constructed, according to the model of[14], by joining sequences that are single nucleotide vari-ants for each length of sequence. These graphs are thendecomposed to find the disconnected subgraphs. Table 1contains details of the size and number of these discon-nect subgraphs for one of the example data sets. An exam-ple of two of these disconnected subgraphs are shown inAdditional file 1 and Additional file 2. Subgraphs such asthese, were analysed further to develop a model of theerror rates in their respective data sets and used to identifysequencing errors.
Excluding adaptor trimming, the graphs are created inapproximately 40 minutes (on a single processor of a PCrunning 32 bit Windows XP with 3.45GB of RAM) fora file of 6 million 35-base reads. Our algorithm was notparallelised, but can be, which would greatly reduce theprocessing time. A similar amount of time is required forthe building of error models and correction of the graphs.The full source code is publicly available [15].
Error modelMore reliable error statistics can be extracted fromsequences that appear a large number of times and havemany sequence variants. Hence, for this purpose, we havechosen to select a subset of large subgraphs based on auser-defined threshold on the minimum number of nodes.These large subgraphs are then used to build a model ofthe error rate. Furthermore, to exclude as many graphscontaining a true biological variant as possible, we intro-duce an additional series of thresholds, t, for how much ofthe total abundance is attributable to the parent node
aparentatotal
≥ t100
t ∈ {30, 70, 75, 80, 85, 90}where aparent is the number of times the parent sequenceappears in the data set and atotal is the sum of the frequen-cies of sequences in the subgraph. Starting from graphssatisfying the highest parental abundance threshold, weanalyse the children of the most abundant sequence,
Table 1 Properties of created subgraphs
Illumina GA lane 2
Length Frequency of subgraph sizes Largest
1 2-20 20-40 40 +
20 33,170 2,530 27 17 992
21 132,373 11,992 170 105 1,048
22 86,118 7,078 63 32 387
23 171,287 9,714 79 47 296
24 1,277,008 101,108 1,264 757 2,030

Sleep et al. BMC Bioinformatics 2013, 14:367 Page 4 of 8http://www.biomedcentral.com/1471-2105/14/367
recording the abundances of the sequence and each childsequence, the position along the read where the childdiffers from the parent, and the nucleotide substitutionthat has occurred.
From this information we calculate, for each graph, aprobability of error for each combination of nucleotidesubstitution pattern type and position along the read.We use a weighted average (weighted on the basis ofthe abundance of the parent sequence) of all the indi-vidual probabilities, to determine our overall probabilityestimates. For example, given estimates P̂k(posi, Rj), k =1, . . . , K , for a position posi and substitution pattern Rj,we would calculate our probability estimate using thefollowing formula
P̂error( posi, Rj) =∑
k(aparentk × P̂k( posi, Rj))∑
k aparentk
where aparentk is the parental abundance of the parentsequence used to estimate P̂k( posi, Rj).
Using this estimate, and assuming that our data may bemodelled as coming from a binomial distribution B(n, p),we calculate 95% confidence intervals. The parametersused in the binomial distribution are n, being the numberof sequences, given by aparentk and p, being the error rateP̂error(posi, Rj). Those estimates P̂k(posi, Rj) lying abovethis confidence interval, and thus most likely to be derivedfrom biological variants, are precluded from being used inthe error model, and the weighted average and confidenceinterval is then recalculated. To ensure that positionswith no sequencing errors and only biological variants(which would not be removed by the confidence intervalmethod described above) did not contribute exceptionally
high data points, an additional smoothing technique wasemployed. This involved adjusting probability estimatesthat were greater than twice the average of their two near-est neighbours. These unusually high values were replacedwith this average.
We perform these calculations, as described in the pre-ceding paragraph, beginning at parental abundance ratio90% and working downwards. While the higher thresholdsprovide more reliable estimates, the number of graphsselected is not large and therefore all possible nucleotidesubstitutions are not seen at every position along thereads. Thus, we employ an iterative process to fill gapsin our estimates with probabilities derived from the sub-set of graphs with the next highest proportion threshold.Thereby, we have derived error probability estimates forall or most of the nucleotide transitions at each positionalong the read. We found that exponential curves pro-vided a satisfactory fit to the data and provided the besttheoretical fit to the expected error increase due to thephasing phenomenon. Consequently, we fitted exponen-tial curves to these error estimates for each transition typebetween positions 2 and 24. This helped to further elim-inate any effects of outliers (i.e., true biological variants)that were not rectified in the previous steps, and pro-vided values for substitution-position combinations thatwere not observed in previous steps. An example of this,for Illumina GA data and the case of A being misreadas C, is shown in Figure 2(a). Corresponding error ratesfor Illumina HiSeq data are an order of magnitude lower(Figure 2(b)). The error rate in the first position along theread is not fit to the exponential curve as, in the major-ity of cases, it was found to be much higher than theerror rate in position 2. This is consistent with what was
0 5 10 15 20 25
0
0.5
1
1.5
2
2.5
3
3.5
x 10
−3
Position along read
Error probability
(a)
0 5 10 15 20 25
0
1
2
x 10
−4
Position along read
Error probability
(b)
Figure 2 Example model fit. Data points and fitted model for the probability of an A being misread as a C, for (a) an Illumina GA data set and (b)an Illumina HiSeq data set.
Sleep et al. BMC Bioinformatics 2013, 14:367 Page 5 of 8http://www.biomedcentral.com/1471-2105/14/367
observed by [16], who attributed this to the lower intensityvalues that result from the longer handling time at thecommencement of a sequencing run.
Our method does not assume that position and errortype effects work multiplicatively. Our generalisation toaccount for these effects is simply
Nerror(pos, R) = Perror(pos, R)
1 − Perror(pos, R)× Ncorrect(pos, r1) (3)
where R is the nucleotide substitution pattern r1 → r2.Note that we do not enforce that
Perror(pos, R) = Perror(R) × Perror(pos) (4)
and hence are able to model non-multiplicative effects.The model described above is used to find and correct
sequencing errors by comparing the observed sequence
abundances with those predicted by the model. Statis-tical hypothesis testing is used for this purpose withthe null hypothesis being that a given sequence is asequencing error. Sequences for which the null hypoth-esis is rejected are classified as true biological variants,the remaining sequences are classified as sequencingerrors.
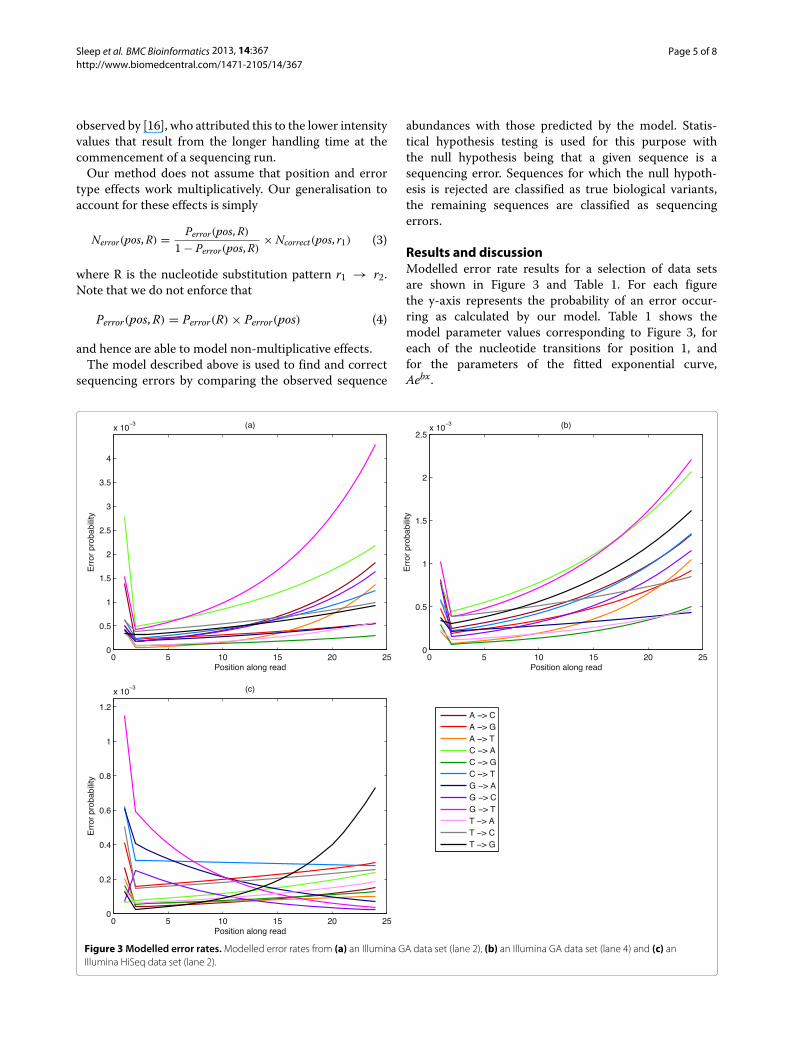
Results and discussionModelled error rate results for a selection of data setsare shown in Figure 3 and Table 1. For each figurethe y-axis represents the probability of an error occur-ring as calculated by our model. Table 1 shows themodel parameter values corresponding to Figure 3, foreach of the nucleotide transitions for position 1, andfor the parameters of the fitted exponential curve,Aebx.
0 5 10 15 20 25
0
0.5
1
1.5
2
2.5
3
3.5
4
x 10
−3(a)
Position along read
Error probability
0 5 10 15 20 25
0
0.5
1
1.5
2
2.5
x 10
−3(b)
Position along read
Error probability
0 5 10 15 20 25
0
0.2
0.4
0.6
0.8
1
1.2
x 10
−3(c)
Position along read
Error probability
A −> C
A −> G
A −> T
C −> A
C −> G
C −> T
G −> A
G −> C
G −> T
T −> A
T −> C
T −> G
Figure 3 Modelled error rates. Modelled error rates from (a) an Illumina GA data set (lane 2), (b) an Illumina GA data set (lane 4) and (c) anIllumina HiSeq data set (lane 2).

Sleep et al. BMC Bioinformatics 2013, 14:367 Page 6 of 8http://www.biomedcentral.com/1471-2105/14/367
Table 2 Summary of modelled error probabilities and model parameters
Illumina GA lane 2 Illumina GA lane 4 Illumina HiSeq lane 2
Error Position 1 A b Position 1 A b Position 1 A b
A→C 1.4E-03 1.4E-04 0.11 8.2E-04 2.2E-04 0.08 2.7E-04 3.7E-05 0.06
A→G 5.1E-04 2.0E-04 0.04 4.8E-04 1.7E-04 0.07 4.1E-04 1.5E-04 0.03
A→T 4.1E-04 3.4E-05 0.15 2.1E-04 5.8E-05 0.12 2.0E-04 5.6E-05 0.03
C→A 2.8E-03 4.3E-04 0.07 7.9E-04 3.9E-04 0.07 6.6E-05 6.9E-05 0.05
C→G 4.2E-04 8.0E-05 0.05 2.9E-04 5.3E-05 0.09 1.6E-04 5.2E-05 0.04
C→T 6.3E-04 2.1E-04 0.07 5.9E-04 1.9E-04 0.08 6.2E-04 3.1E-04 -0.01
G→A 4.3E-04 1.6E-04 0.05 3.7E-04 2.0E-04 0.03 6.1E-04 4.7E-04 -0.08
G→C 5.1E-04 1.4E-04 0.10 7.8E-04 1.3E-04 0.09 6.9E-05 3.1E-04 -0.11
G→T 1.5E-03 3.5E-04 0.10 1.0E-03 3.3E-04 0.08 1.2E-03 7.7E-04 -0.13
T→A 3.6E-04 7.4E-05 0.08 2.4E-04 1.0E-04 0.06 1.4E-04 5.4E-05 0.05
T→C 6.1E-04 3.5E-04 0.04 5.6E-04 3.6E-04 0.04 5.1E-04 1.4E-04 0.02
T→G 3.3E-04 2.8E-04 0.05 3.4E-04 2.7E-04 0.08 1.3E-04 2.0E-05 0.15
Probabilities for position 1 and exponents of the fitted exponential curves, Aebx , for positions 2 to 24 for the data sets corresponding to Figure 3.
Illumina GAThe G→T substitution error rate, which is the highest inthe Illumina GA data sets (Figures 3(a) and (b)) can beattributed to the combined effects of cross-talk and T flu-orophore accumulation. The transition C→A is also high,which can also be attributed to cross-talk. From Table 2we can see, however, that the A→T error rate is the onethat is increasing at the greatest rate at the ends of thereads, indicated by the largest exponent b, and this canbe attributed to T fluorophore accumulation. The overallerror rates found for these data concur for the most partwith those reported in [7]. However, our model demon-strates that the error rate effects of both position andnucleotide transition type, do not work multiplicatively.The main reason for this lack of factorisation appears tobe due to T fluorophore accumulation, which increasestoward the ends of the reads. Thus, a non-multiplicativemodel, such as proposed here, is necessary to account forthis phenomenon.
By comparing Figure 3(a) with Figure 3(b), it can beseen that in GA datasets there is a strong dependence ofoverall error rate on the sequencing lane, with error rateslowest in the inside lanes (Figure 3(b)). Whether this is amore general phenomenon requires further investigation.However, it highlights the necessity of processing lanesseparately.
Illumina HiSeqThe error profiles of the sequenced reads from lane 2of the Illumina HiSeq data (Figure 3(c)) show a qualita-tively different profile in that some error rates are initiallydecreasing along the reads. Error rates along the readare substantially lower overall. The substitution G→T ishigher at the beginning of the reads but becomes lower
moving along the read, which is in contrast to the reverseerror, T→G, which increases towards the end. The rea-son for this phenomena is unclear but it is hypothesisedas due either to altered chemistry (the washing awayof T fluorophores becoming more (too) effective) or tothe changes in the different base calling algorithm (over-compensation for the T fluorophore accumulation phe-nomenon). We consider the latter scenario more likelyas we see similar patterns for many of the other corre-sponding pairs of nucleotide substitutions. Moving alongthe first 24 bases of the read, C→T, G→A and G→C
Table 3 Summary of model parameters resulting fromsimulated data
Simulated data
Error Position 1 A b
A→C 1.4E-03 1.8E-04 0.10
A→G 6.8E-04 2.3E-04 0.04
A→T 4.6E-04 4.6E-05 0.15
C→A 3.0E-03 4.7E-04 0.07
C→G 4.3E-04 8.0E-05 0.08
C→T 8.3E-04 2.4E-04 0.06
G→A 4.9E-04 2.0E-04 0.06
G→C 5.3E-04 1.4E-04 0.11
G→T 1.8E-03 2.7E-04 0.14
T→A 4.1E-04 1.2E-04 0.06
T→C 5.9E-04 2.9E-04 0.06
T→G 3.9E-04 4.5E-04 0.02
Probabilities for position 1 and exponents of the fitted exponential curves, Aebx ,for positions 2 to 24 for the simulated data set. The corresponding figure isshown in Additional file 3.

Sleep et al. BMC Bioinformatics 2013, 14:367 Page 7 of 8http://www.biomedcentral.com/1471-2105/14/367
Table 4 Evaluation of error correction algorithm on PhiXgenomic sequences
Model prediction
Genome mapping Correct sequences Erroneous sequences
Exact match 10115 8
1 mismatch 2779 64137
2 mismatches 164 17636
3 mismatches 14 3217
Sequence counts comparing our model predictions of correct and erroneoussequences to results obtained by mapping the sequences to the correspondinggenome.
also decrease, while their reversed substitutions T→C,A→G and C→G increase. A lane trend is also observedin the Illumina HiSeq data. However, it does not involveall nucleotide transitions. The outer lanes, 2 and 8, havesignificantly higher error rates for the G→T and T→Gtransitions. These two error rates become progressivelylower toward the inside lanes. The other nucleotide tran-sition error rates remain essentially constant across thelanes.
EvaluationTo address the difficult matter of evaluation we under-took two benchmarking analyses. Firstly, we applied ourmodel to a simulated data set and secondly we checkedthe performance of our model by correcting reads from anorganism with a known reference genome.
In our creation of a simulated data set, for the sake ofcomparison, we used the error probabilities from eachposition and transition that were found in the Illumina GAlane 2 data set. We then took a data set of short RNA readsthought to contain no sequencing errors and randomlysimulated errors based on the given error rates and thecorresponding binomial distributions. The data set wasprocessed by our method in the same way as the otherdata sets. The resulting error model parameters are sum-marised in Table 3. A plot of this error model can also befound in Additional file 3. By comparing Table 3 to the first3 columns of Table 2, it can be seen that the reconstructionof the error rates using the simulated data is very close.The same parameters are highest in both data sets, and allparameter values are of the same order of magnitude.
To further evaluate our model we studied HiSeq readsfrom a publicly available PhiX data set (SRA accessionnumber SRS267273; SRX101468) [17]. After correctingthe reads using our algorithm as described in the Methodssection, we mapped our modelled correct and erroneousreads to a copy of the PhiX genome [18], obtaining a sen-sitivity measure of 99.29% and specificity of 96.64%. Inthe context of our error correction problem, this meansthat our algorithm retained 99.29% of correct sequenc-ing reads, and identified 96.64% of the erroneous reads.
The mapping was performed only up to 3 mismatches dueto limitations of the mapping software. However, usingfurther mismatches may result in an increased speci-ficity measure. The results of the evaluation are shown inTable 4.
ConclusionsWe have proposed a model of sequencing errors that isflexible enough to incorporate known sources of errorintrinsic to the Illumina sequencing technologies andthat does not rely on the availability of a referencegenome for error detection. We have demonstrated theadvantages of using of a non-factorisable model, par-ticularly necessitated by the presence of accumulated Tfluorophores in the Illumina GA data, and other unknownnon-multiplicative effects in the Illumina HiSeq data.The method described herein is potentially applicablenot only to short RNA reads but also to other sequenc-ing activities where a reliable sequenced genome is notavailable, such as in the field of metagenomics, wherea mixed sample containing reads from many organismsis sequenced, or when trying to distinguish sequenc-ing errors from single nucleotide polymorphisms. While,as discussed in the results section, our model performswell in identifying sequencing errors (our method iden-tifies at least 96.64% of errors in the example PhiX dataset), we note that our model may not account for someerrors that arise before the sequences enter a flowcell,e.g. during reverse transcription or library amplification.These errors may lack a highly abundant parent sequenceand thus are difficult to identify without a referencegenome.
A possible direction to improve this model is to includethe investigation of the role of single and multiple pre-ceding or following bases in determining error rates. Theinclusion in the model of error prone positions, suchas those reported in [6,17] is an area of future interest.Correcting for local variants in error rates within lanes,possibly produced by bubbles in flowcells, also warrantsfurther investigation. Additionally, we note that the char-acteristic phasing-related rise is not visible for all errortypes in the first 24 bases of GA data. If one were tomodel the error rate beyond this point one would haveto incorporate a second, increasing, exponential in thefitting function or use a more flexible method, such asfitting splines.
Additional files
Additional file 1: Connected subgraph of sequences. A connectedsubgraph of sequences of length 21 from an Illumina HiSeq data set. Themost abundant sequence in this subgraph occurred 45,484 times and isrepresented by the largest node (filled circle).
Sleep et al. BMC Bioinformatics 2013, 14:367 Page 8 of 8http://www.biomedcentral.com/1471-2105/14/367
Additional file 2: A larger connected subgraph. A connected subgraphof sequences of length 21 from an Illumina GA data set. The mostabundant sequence in this subgraph occurred 165,504 times in the dataset. The size of the nodes (filled circles) representing each sequence isproportional to their abundance. The edges connect sequences that varyin one position only.
Additional file 3: Modelled error rates. Modelled error rates from a dataset with simulated errors according to the pattern found in the data set ofFigure 3(a).
Competing interestsThe authors declare that they have no competing interests.
Authors’ contributionsJS performed the analyses, participated in the design and drafted themanuscript. AS conceived of the study, participated in the design and analysesand helped to draft the manuscript. UB participated in the design and analysesand helped to draft the manuscript. All authors read and approved the finalmanuscript.
AcknowledgementsThe authors would like to thank Professor Stan Miklavcic for feedback on themanuscript, Dr Chris Brien for useful statistical discussions, Mr John Toubia fortechnical assistance and Dr Bu-Jun Shi for providing the data used for analysis.This work was supported through funding from the Australian ResearchCouncil, Grains Research and Development Corporation, and the Governmentof South Australia.
Author details1Australian Centre for Plant Functional Genomics, The University of Adelaide,Urrbrae, SA 5064, Australia. 2Phenomics and Bioinformatics Research Centre,University of South Australia, Mawson Lakes, SA 5095, Australia. 3ACRF SouthAustralian Cancer Genome Facility, Centre for Cancer Biology, SA Pathology,Adelaide, SA 5000, Australia. 4School of Molecular and Biomedical Science,University of Adelaide, Adelaide, SA 5000, Australia.
Received: 3 May 2013 Accepted: 10 December 2013Published: 18 December 2013
References1. Li M, Wang IX, Li Y, Bruzel A, Richards AL, Toung JM, Cheung VG:
Widespread RNA and DNA sequence differences in the humantranscriptome. Science 2011, 333(6038):53–58.
2. Pickrell JK, Gilad Y, Pritchard JK: Comment on ‘Widespread RNA andDNA sequence differences in the human transcriptome’? Science1302, 335(6074).
3. Whiteford N, Skelly T, Curtis C, Ritchie ME, Löhr A, Zaranek AW, Abnizova I,Brown C: Swift: primary data analysis for the Illumina Solexasequencing platform. Bioinformatics 2009, 25(17):2194–2199.
4. Li L, Speed T: An estimate of the crosstalk matrix in four-dyefluorescence-based DNA sequencing. Electrophoresis 1999,20:1522–2683.
5. Ledergerber C, Dessimoz C: Base-calling for next-generationsequencing platforms. Brief Bioinform 2011, 12(5):489–497.
6. Nakamura K, Oshima T, Morimoto T, Ikeda S, Yoshikawa H, Shiwa Y,Ishikawa S, Linak MC, Hirai A, Takahashi H, Altaf-Ul-Amin M, Ogasawara N,Kanaya S: Sequence-specific error profile of Illumina sequencers.Nucleic Acids Res 2011, 39:e90.
7. Dohm JC, Lottaz C, Borodina T, Himmelbauer H: Substantial biases inultra-short read data sets from high-throughput DNA sequencing.Nucleic Acids Res 2008, 36(16):e105.
8. Yang X, Chockalingam SP, Aluru S: A survey of error-correctionmethods for next-generation sequencing. Brief Bioinformatics 2013,14:56–66.
9. Schröder J, Schröder H, Puglisi SJ, Sinha R, Schmidt B: SHREC a short-readerror correction method. Bioinformatics 2009, 25(17):2157–2163.
10. Ilie L, Fazayeli F, Ilie S: HiTEC: accurate error correction inhigh-throughput sequencing data. Bioinformatics 2011, 27(3):295–302.
11. Yang X, Aluru S, Dorman K: Repeat-aware modeling and correction ofshort read errors. BMC Bioinformatics 2011, 12(Suppl 1):S52.
12. Wijaya E, Frith MC, Suzuki Y, Horton P: Recount: expectationmaximization based error correction tool for next generationsequencing data. In Genome Inform 2009, 23:189–201.
13. Qu W, Hashimoto S i, Morishita S: Efficient frequency-based de novoshort-read clustering for error trimming in next-generationsequencing. Genome Res 2009, 19(7):1309–1315.
14. Schreiber A, Shi BJ, Huang CY, Langridge P, Baumann U: Discovery ofbarley miRNAs through deep sequencing of short reads. BMCGenomics 2011, 12:129.
15. Source code for sequencing error correction without a referencegenome. [http://unisa.edu.au/Research/Phenomics-and-Bioinformatics-Research-Centre/Software/]
16. Kircher M, Stenzel U, Kelso J: Improved base calling for the IlluminaGenome Analyzer using machine learning strategies. Genome Biol2009, 10(8):R83+.
17. Minoche A, Dohm J, Himmelbauer H: Evaluation of genomichigh-throughput sequencing data generated on illumina HiSeq andgenome analyzer systems. Genome Biol 2011, 12(11):R112.
18. Illumina IGenomes collection . [http://support.illumina.com/sequencing/sequencing_software/igenome.ilmn]
doi:10.1186/1471-2105-14-367Cite this article as: Sleep et al.: Sequencing error correction without areference genome. BMC Bioinformatics 2013 14:367.
Submit your next manuscript to BioMed Centraland take full advantage of:
• Convenient online submission
• Thorough peer review
• No space constraints or color figure charges
• Immediate publication on acceptance
• Inclusion in PubMed, CAS, Scopus and Google Scholar
• Research which is freely available for redistribution
Submit your manuscript at www.biomedcentral.com/submit