Separation and quantification of lignans inPhyllanthus species by a simple chiral densitometric...
9
J. Sep. Sci. 2008, 31, 47 – 55 V. Srivastava et al. 47 Vandana Srivastava 1 Manju Singh 1 Richa Malasoni 1 Karuna Shanker 1 Ram K. Verma 1 Madan M. Gupta 1 Anil K Gupta 2 Suman P. S. Khanuja 2 1 Analytical Chemistry Division, Central Institute of Medicinal and Aromatic Plants, Lucknow, India 2 Genetic Resource and Biotechnology Division, Central Institute of Medicinal and Aromatic Plants, Lucknow, India Original Paper Separation and quantification of lignans in Phyllanthus species by a simple chiral densitometric method A sensitive, selective, and robust high-performance TLC (HPTLC) method using chiral TLC plates for qualitative and quantitative analysis of phyllanthin (A), hypophyllan- thin (B), niranthin (C), and nirtetralin (D), the active lignans of Phyllanthus species, was developed and validated. The effectiveness and role of various stationary phases viz TLC silica gel 60F 254 , HPTLC silica gel 60F 254 , and chiral TLC plates in the quantita- tion were evaluated. A precoated chiral TLC plate was found suitable for the simulta- neous analysis of four pharmacologically active lignans. For achieving good separa- tion, the optimized mobile phase of n-hexane/acetone/1,4-dioxane (9:1:0.5 by vol- ume) was used (R f = 0.30, 0.36, 0.41, and 0.48 for compounds A, B, C, and D, respec- tively). A densitometric determination of the above compounds was carried out in reflection/absorption mode at 620 nm. Optimized chromatographic conditions pro- vide well-separated compact bands for the tested lignans. The calibration curves were found linear in the concentration range of 100 – 500 ng/band. Recoveries of A – D were 99.98, 100.51, 99.22, and 98.74%, respectively. The method was validated according to ICH guidelines. The method reported here is reproducible and applied for the quantitative analysis of the above lignans in the leaves of four Phyllanthus spe- cies, i.e., P. amarus, P. maderaspatensis, P. urinaria, and P. virgatus. Keywords: Chiral TLC / Hypophyllanthin / Niranthin / Nirtetralin / Phyllanthin / Received: June 27, 2007; revised: August 24, 2007; accepted: August 24, 2007 DOI 10.1002/jssc.200700282 1 Introduction Lignans, representing a class of bioactive molecules in a large number of medicinal plants, are considered as an interesting source for lead structures toward new drugs and of interest as drugs in the area of cancer chemother- apy [1]. Their chemistry and biological activity as well as therapeutic potential have been reviewed by many work- ers [2 – 5]. Commonly distributed species of Phyllanthus in India are P. amarus, P. fraternus, P. urinaria, P. virgartus, P. maderas- patensis, and P. deblis. P. amarus is highly valued in the treatment of liver ailments [6, 7]. Phyllanthin and hypo- phyllanthin have been shown to be antihepatotoxic [8]. Nirtetralin and niranthin are reported to possess hepato- protective and anti-inflammatory activities [9 – 11]. Cyto- toxic effect of nirtetralin, niranthin, and phyllanthin on two human leukemia cell lines, K-562 and Lucena-1, sug- gests a potential action of Phyllanthus lignans as multi- drug resistance (MDR) reversing agents [12]. Few analytical procedures based on TLC [13 – 17] and high performance chromatography [18 – 22] are reported for the quantitation of two lignans phyllanthin and hypophyllanthin. Recently, the use of high-performance TLC (HPTLC) has gained importance in plant analysis because of its simplicity, low cost, and rapid analytical capabilities [23 – 27]. During careful qualitative analysis, it was observed that in Phyllanthus species, mainly P. ama- rus, there were four major peaks of lignans. This led us to isolate four major lignans A – D by column chromatogra- phy followed by preparative HPLC and then structures were confirmed by spectral analysis. Here, a simple, vali- dated TLC separation and simultaneous quantitation of four major isomeric lignans A – D is reported for the first time. A well-resolved separation was achieved on a chiral TLC plate. The method was applied for the quantitation of these lignans in leaves of different Phyllanthus species. Various validation aspects of the analysis such as linear- ity, specificity, recovery, precision, robustness, LOD, LOQ, etc. have been measured. Correspondence: Dr. Madan M. Gupta, Analytical Chemistry Di- vision, Central Institute of Medicinal and Aromatic Plants, Luck- now 226015, India. E-mail: [email protected]. Fax: +91-522-2342666 Abbreviation: HPTLC, high-performance TLC i 2008 WILEY-VCH Verlag GmbH & Co. KGaA, Weinheim www.jss-journal.com
-
Upload
independent -
Category
Documents
-
view
0 -
download
0
Transcript of Separation and quantification of lignans inPhyllanthus species by a simple chiral densitometric...
J. Sep. Sci. 2008, 31, 47– 55 V. Srivastava et al. 47
Vandana Srivastava1
Manju Singh1
Richa Malasoni1
Karuna Shanker1
Ram K. Verma1
Madan M. Gupta1
Anil K Gupta2
Suman P. S. Khanuja2
1Analytical Chemistry Division,Central Institute of Medicinaland Aromatic Plants, Lucknow,India
2Genetic Resource andBiotechnology Division, CentralInstitute of Medicinal andAromatic Plants, Lucknow, India
Original Paper
Separation and quantification of lignansin Phyllanthus species by a simple chiraldensitometric method
A sensitive, selective, and robust high-performance TLC (HPTLC) method using chiralTLC plates for qualitative and quantitative analysis of phyllanthin (A), hypophyllan-thin (B), niranthin (C), and nirtetralin (D), the active lignans of Phyllanthus species,was developed and validated. The effectiveness and role of various stationary phasesviz TLC silica gel 60F254, HPTLC silica gel 60F254, and chiral TLC plates in the quantita-tion were evaluated. A precoated chiral TLC plate was found suitable for the simulta-neous analysis of four pharmacologically active lignans. For achieving good separa-tion, the optimized mobile phase of n-hexane/acetone/1,4-dioxane (9:1:0.5 by vol-ume) was used (Rf = 0.30, 0.36, 0.41, and 0.48 for compounds A, B, C, and D, respec-tively). A densitometric determination of the above compounds was carried out inreflection/absorption mode at 620 nm. Optimized chromatographic conditions pro-vide well-separated compact bands for the tested lignans. The calibration curveswere found linear in the concentration range of 100–500 ng/band. Recoveries of A–D were 99.98, 100.51, 99.22, and 98.74%, respectively. The method was validatedaccording to ICH guidelines. The method reported here is reproducible and appliedfor the quantitative analysis of the above lignans in the leaves of four Phyllanthus spe-cies, i. e., P. amarus, P. maderaspatensis, P. urinaria, and P. virgatus.
Keywords: Chiral TLC / Hypophyllanthin / Niranthin / Nirtetralin / Phyllanthin /
Received: June 27, 2007; revised: August 24, 2007; accepted: August 24, 2007
DOI 10.1002/jssc.200700282
1 Introduction
Lignans, representing a class of bioactive molecules in alarge number of medicinal plants, are considered as aninteresting source for lead structures toward new drugsand of interest as drugs in the area of cancer chemother-apy [1]. Their chemistry and biological activity as well astherapeutic potential have been reviewed by many work-ers [2–5].
Commonly distributed species of Phyllanthus in Indiaare P. amarus, P. fraternus, P. urinaria, P. virgartus, P. maderas-patensis, and P. deblis. P. amarus is highly valued in thetreatment of liver ailments [6, 7]. Phyllanthin and hypo-phyllanthin have been shown to be antihepatotoxic [8].Nirtetralin and niranthin are reported to possess hepato-protective and anti-inflammatory activities [9–11]. Cyto-toxic effect of nirtetralin, niranthin, and phyllanthin on
two human leukemia cell lines, K-562 and Lucena-1, sug-gests a potential action of Phyllanthus lignans as multi-drug resistance (MDR) reversing agents [12].
Few analytical procedures based on TLC [13–17] andhigh performance chromatography [18–22] are reportedfor the quantitation of two lignans phyllanthin andhypophyllanthin. Recently, the use of high-performanceTLC (HPTLC) has gained importance in plant analysisbecause of its simplicity, low cost, and rapid analyticalcapabilities [23–27]. During careful qualitative analysis,it was observed that in Phyllanthus species, mainly P. ama-rus, there were four major peaks of lignans. This led us toisolate four major lignans A–D by column chromatogra-phy followed by preparative HPLC and then structureswere confirmed by spectral analysis. Here, a simple, vali-dated TLC separation and simultaneous quantitation offour major isomeric lignans A–D is reported for the firsttime. A well-resolved separation was achieved on a chiralTLC plate. The method was applied for the quantitationof these lignans in leaves of different Phyllanthus species.Various validation aspects of the analysis such as linear-ity, specificity, recovery, precision, robustness, LOD,LOQ, etc. have been measured.
Correspondence: Dr. Madan M. Gupta, Analytical Chemistry Di-vision, Central Institute of Medicinal and Aromatic Plants, Luck-now 226015, India.E-mail: [email protected]: +91-522-2342666
Abbreviation: HPTLC, high-performance TLC
i 2008 WILEY-VCH Verlag GmbH & Co. KGaA, Weinheim www.jss-journal.com
48 V. Srivastava et al. J. Sep. Sci. 2008, 31, 47 –55
2 Experimental
2.1 Plant materials
Tested Phyllanthus species viz P. amarus, P. maderaspatensis,P. urinaria, and P. virgatus were grown in the experimentalfarm of CIMAP, Lucknow, India. The nursery sowing wasdone on 3rd July 2006; crop was transplanted in the fieldon 7th August, 2006. Matured crops of the Phyllanthus spe-cies were harvested on 16th September, 2006. All thestandard agricultural practices were followed during thecrop period. Herbarium specimen and seeds of the abovetest plant species are available in the National Gene Bankof Medicinal and Aromatic Plants at CIMAP, Lucknow.
2.2 Chemicals
All the solvents used were either of analytical or HPLCgrade and purchased from E. Merck (Mumbai, India).Before use, the solvents were filtered through a 0.45 lmMillipore membrane (Millipore, Billerica, MA) after soni-cation for 15 min. Precoated TLC silica gel 60F254, HPTLCsilica gel 60F254, and chiral TLC glass plates (10610 cm2;20610 cm2; E. Merck, Darmastadt, Germany) were usedfor the optimization of analytical methods. The standardcompounds phyllanthin (A), hypophyllanthin (B), niran-thin (C), and nirtetralin (D) were isolated (all purityA99%) and characterized by spectral analysis (Table 1) inour laboratory.
2.3 Extraction procedure of lignans fromP. amarus
Air-dried and finely powdered aerial parts of the plant(4.0 kg) were exhaustively extracted at room temperature(25 l 38C) using ethanol (10 L63) by percolation methodand the ethanolic extract was concentrated in vacuo togive a residue (804 g). Water (200) was added and it wasthen partitioned with n-hexane, chloroform, and n-buta-nol. A part (190 g) of the n-hexane soluble fraction (290 g)was subjected to column chromatography on silica gel,1.5 kg (60–120 mesh). Elution was carried out in varyingpercentage of ethyl acetate in hexane. Fractions 312–318 and 337–341 eluted with n-hexane/ethyl acetate(90:10 v/v) afforded compounds C (300 mg) and D(200 mg), respectively. Fractions 373–439 of n-hexane/ethyl acetate (90:10 v/v and 85:15 v/v) yielded compoundB (1.60 g), whereas fractions 454–529 of n-hexane/ethylacetate (80:20 v/v) resulted in the compound A (6.10 g).Compounds A and B were purified by the crystallizationof chloroform–methanol mixture. Compounds C and Dresisted crystallization and were purified by preparativeHPLC: Shimadzu LC-8A; PDA detector, column:25 cm621.2 mm id (SupelcosilTM L-18, 12 lm), mobilesolvent: MeOH –water (70:30), flow rate: 15 mL/min,
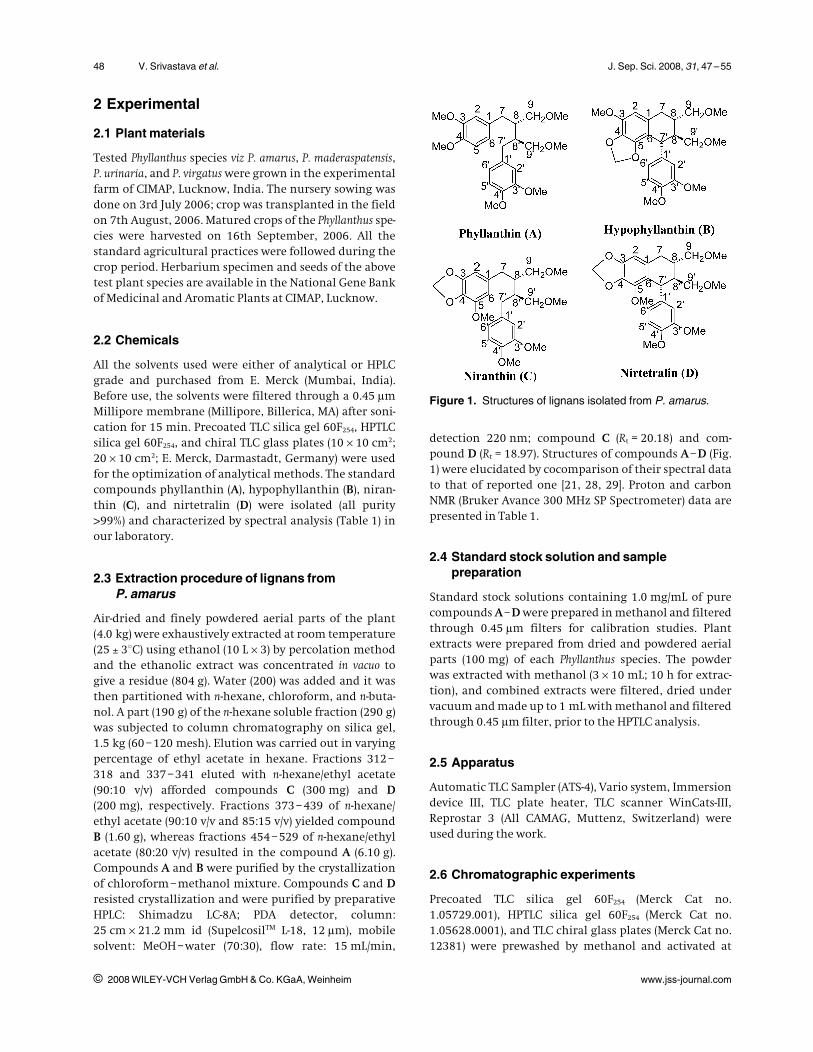
detection 220 nm; compound C (Rt = 20.18) and com-pound D (Rt = 18.97). Structures of compounds A–D (Fig.1) were elucidated by cocomparison of their spectral datato that of reported one [21, 28, 29]. Proton and carbonNMR (Bruker Avance 300 MHz SP Spectrometer) data arepresented in Table 1.
2.4 Standard stock solution and samplepreparation
Standard stock solutions containing 1.0 mg/mL of purecompounds A–D were prepared in methanol and filteredthrough 0.45 lm filters for calibration studies. Plantextracts were prepared from dried and powdered aerialparts (100 mg) of each Phyllanthus species. The powderwas extracted with methanol (3610 mL; 10 h for extrac-tion), and combined extracts were filtered, dried undervacuum and made up to 1 mL with methanol and filteredthrough 0.45 lm filter, prior to the HPTLC analysis.
2.5 Apparatus
Automatic TLC Sampler (ATS-4), Vario system, Immersiondevice III, TLC plate heater, TLC scanner WinCats-III,Reprostar 3 (All CAMAG, Muttenz, Switzerland) wereused during the work.
2.6 Chromatographic experiments
Precoated TLC silica gel 60F254 (Merck Cat no.1.05729.001), HPTLC silica gel 60F254 (Merck Cat no.1.05628.0001), and TLC chiral glass plates (Merck Cat no.12381) were prewashed by methanol and activated at
i 2008 WILEY-VCH Verlag GmbH & Co. KGaA, Weinheim www.jss-journal.com
Figure 1. Structures of lignans isolated from P. amarus.
J. Sep. Sci. 2008, 31, 47– 55 Liquid Chromatography 49
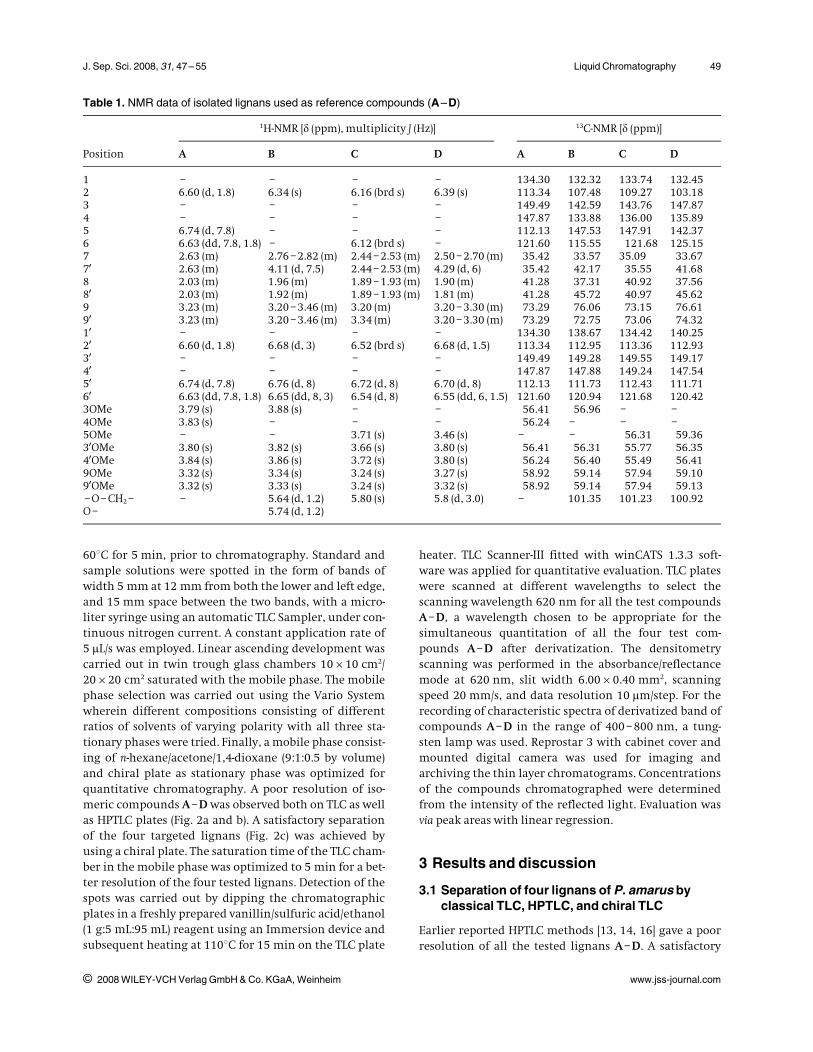
608C for 5 min, prior to chromatography. Standard andsample solutions were spotted in the form of bands ofwidth 5 mm at 12 mm from both the lower and left edge,and 15 mm space between the two bands, with a micro-liter syringe using an automatic TLC Sampler, under con-tinuous nitrogen current. A constant application rate of5 lL/s was employed. Linear ascending development wascarried out in twin trough glass chambers 10610 cm2/20620 cm2 saturated with the mobile phase. The mobilephase selection was carried out using the Vario Systemwherein different compositions consisting of differentratios of solvents of varying polarity with all three sta-tionary phases were tried. Finally, a mobile phase consist-ing of n-hexane/acetone/1,4-dioxane (9:1:0.5 by volume)and chiral plate as stationary phase was optimized forquantitative chromatography. A poor resolution of iso-meric compounds A–D was observed both on TLC as wellas HPTLC plates (Fig. 2a and b). A satisfactory separationof the four targeted lignans (Fig. 2c) was achieved byusing a chiral plate. The saturation time of the TLC cham-ber in the mobile phase was optimized to 5 min for a bet-ter resolution of the four tested lignans. Detection of thespots was carried out by dipping the chromatographicplates in a freshly prepared vanillin/sulfuric acid/ethanol(1 g:5 mL:95 mL) reagent using an Immersion device andsubsequent heating at 1108C for 15 min on the TLC plate
heater. TLC Scanner-III fitted with winCATS 1.3.3 soft-ware was applied for quantitative evaluation. TLC plateswere scanned at different wavelengths to select thescanning wavelength 620 nm for all the test compoundsA–D, a wavelength chosen to be appropriate for thesimultaneous quantitation of all the four test com-pounds A–D after derivatization. The densitometryscanning was performed in the absorbance/reflectancemode at 620 nm, slit width 6.0060.40 mm2, scanningspeed 20 mm/s, and data resolution 10 lm/step. For therecording of characteristic spectra of derivatized band ofcompounds A–D in the range of 400–800 nm, a tung-sten lamp was used. Reprostar 3 with cabinet cover andmounted digital camera was used for imaging andarchiving the thin layer chromatograms. Concentrationsof the compounds chromatographed were determinedfrom the intensity of the reflected light. Evaluation wasvia peak areas with linear regression.
3 Results and discussion
3.1 Separation of four lignans of P. amarus byclassical TLC, HPTLC, and chiral TLC
Earlier reported HPTLC methods [13, 14, 16] gave a poorresolution of all the tested lignans A–D. A satisfactory
i 2008 WILEY-VCH Verlag GmbH & Co. KGaA, Weinheim www.jss-journal.com
Table 1. NMR data of isolated lignans used as reference compounds (A–D)
1H-NMR [d (ppm), multiplicity J (Hz)] 13C-NMR [d (ppm)]
Position A B C D A B C D
1 – – – – 134.30 132.32 133.74 132.452 6.60 (d, 1.8) 6.34 (s) 6.16 (brd s) 6.39 (s) 113.34 107.48 109.27 103.183 – – – – 149.49 142.59 143.76 147.874 – – – – 147.87 133.88 136.00 135.895 6.74 (d, 7.8) – – – 112.13 147.53 147.91 142.376 6.63 (dd, 7.8, 1.8) – 6.12 (brd s) – 121.60 115.55 121.68 125.157 2.63 (m) 2.76 –2.82 (m) 2.44 –2.53 (m) 2.50–2.70 (m) 35.42 33.57 35.09 33.6779 2.63 (m) 4.11 (d, 7.5) 2.44 –2.53 (m) 4.29 (d, 6) 35.42 42.17 35.55 41.688 2.03 (m) 1.96 (m) 1.89 –1.93 (m) 1.90 (m) 41.28 37.31 40.92 37.5689 2.03 (m) 1.92 (m) 1.89 –1.93 (m) 1.81 (m) 41.28 45.72 40.97 45.629 3.23 (m) 3.20 –3.46 (m) 3.20 (m) 3.20–3.30 (m) 73.29 76.06 73.15 76.6199 3.23 (m) 3.20 –3.46 (m) 3.34 (m) 3.20–3.30 (m) 73.29 72.75 73.06 74.3219 – – – – 134.30 138.67 134.42 140.2529 6.60 (d, 1.8) 6.68 (d, 3) 6.52 (brd s) 6.68 (d, 1.5) 113.34 112.95 113.36 112.9339 – – – – 149.49 149.28 149.55 149.1749 – – – – 147.87 147.88 149.24 147.5459 6.74 (d, 7.8) 6.76 (d, 8) 6.72 (d, 8) 6.70 (d, 8) 112.13 111.73 112.43 111.7169 6.63 (dd, 7.8, 1.8) 6.65 (dd, 8, 3) 6.54 (d, 8) 6.55 (dd, 6, 1.5) 121.60 120.94 121.68 120.423OMe 3.79 (s) 3.88 (s) – – 56.41 56.96 – –4OMe 3.83 (s) – – – 56.24 – – –5OMe – – 3.71 (s) 3.46 (s) – – 56.31 59.3639OMe 3.80 (s) 3.82 (s) 3.66 (s) 3.80 (s) 56.41 56.31 55.77 56.3549OMe 3.84 (s) 3.86 (s) 3.72 (s) 3.80 (s) 56.24 56.40 55.49 56.419OMe 3.32 (s) 3.34 (s) 3.24 (s) 3.27 (s) 58.92 59.14 57.94 59.1099OMe 3.32 (s) 3.33 (s) 3.24 (s) 3.32 (s) 58.92 59.14 57.94 59.13– O – CH2 –O –
– 5.64 (d, 1.2)5.74 (d, 1.2)
5.80 (s) 5.8 (d, 3.0) – 101.35 101.23 100.92
50 V. Srivastava et al. J. Sep. Sci. 2008, 31, 47 –55
separation of the four major lignans A–D could not beachieved by classical TLC as well as HPTLC plates using n-hexane, cyclohexane, n-heptane, toluene, etc. as the basiccomponents and ethyl acetate, acetone, and methanol inthe capacity of the modifier of polarity and acetic andformic acids in the capacity of a sorbent modifier. Theassimilation of peaks of A–B and B–C with TLC while B–C and C–D with HPTLC, was observed when the four
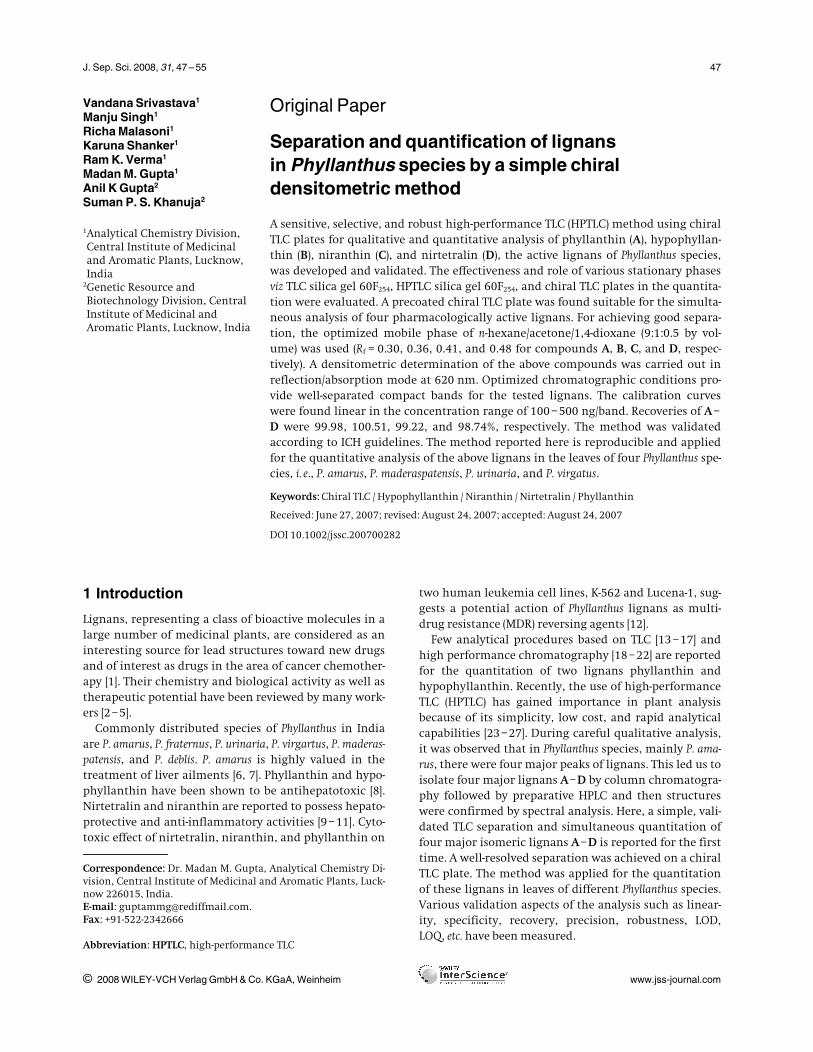
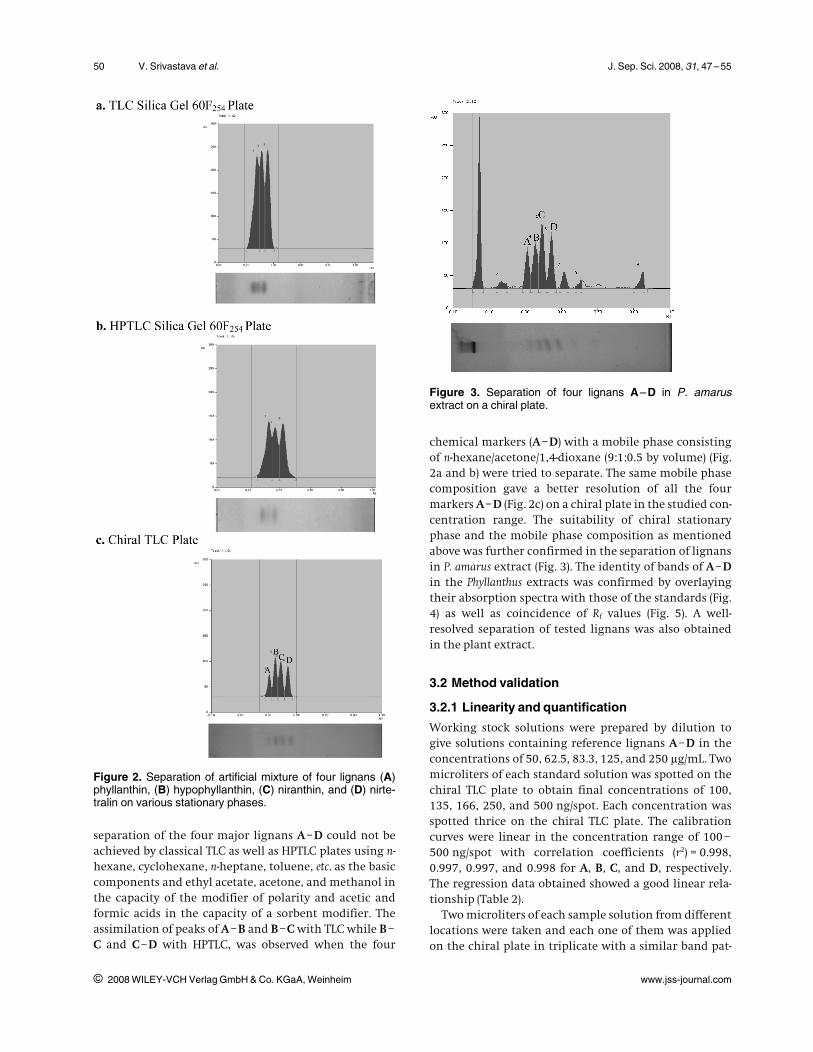
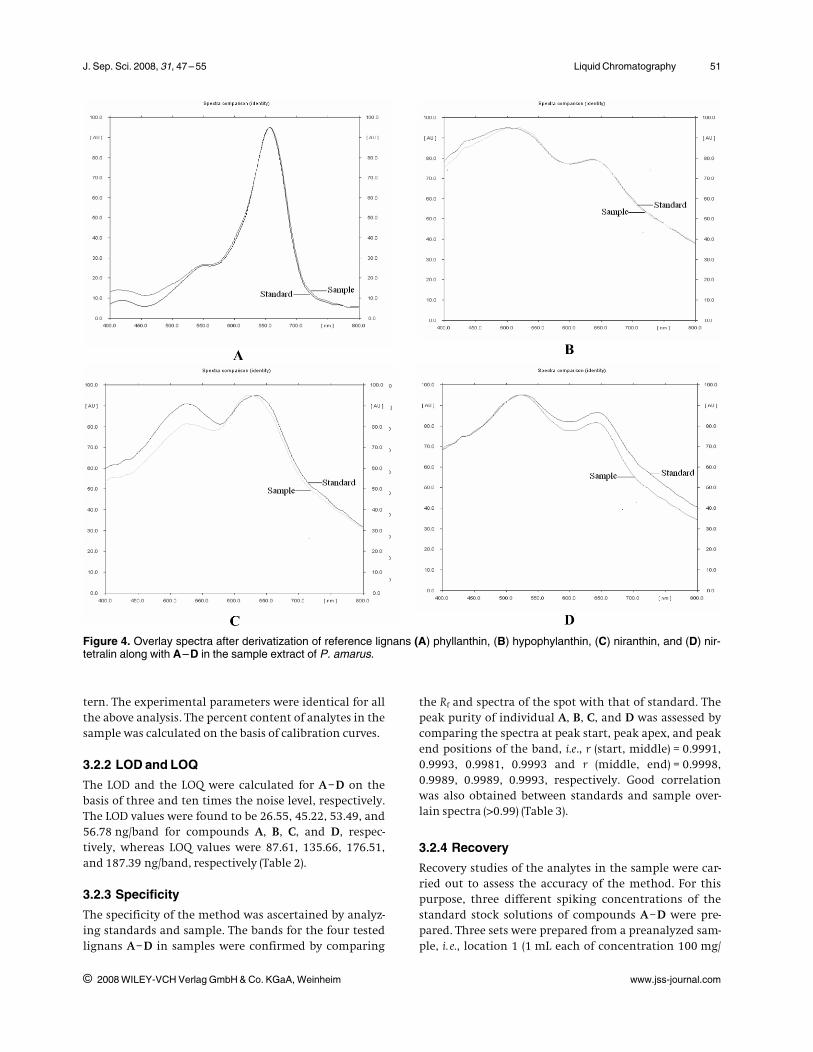
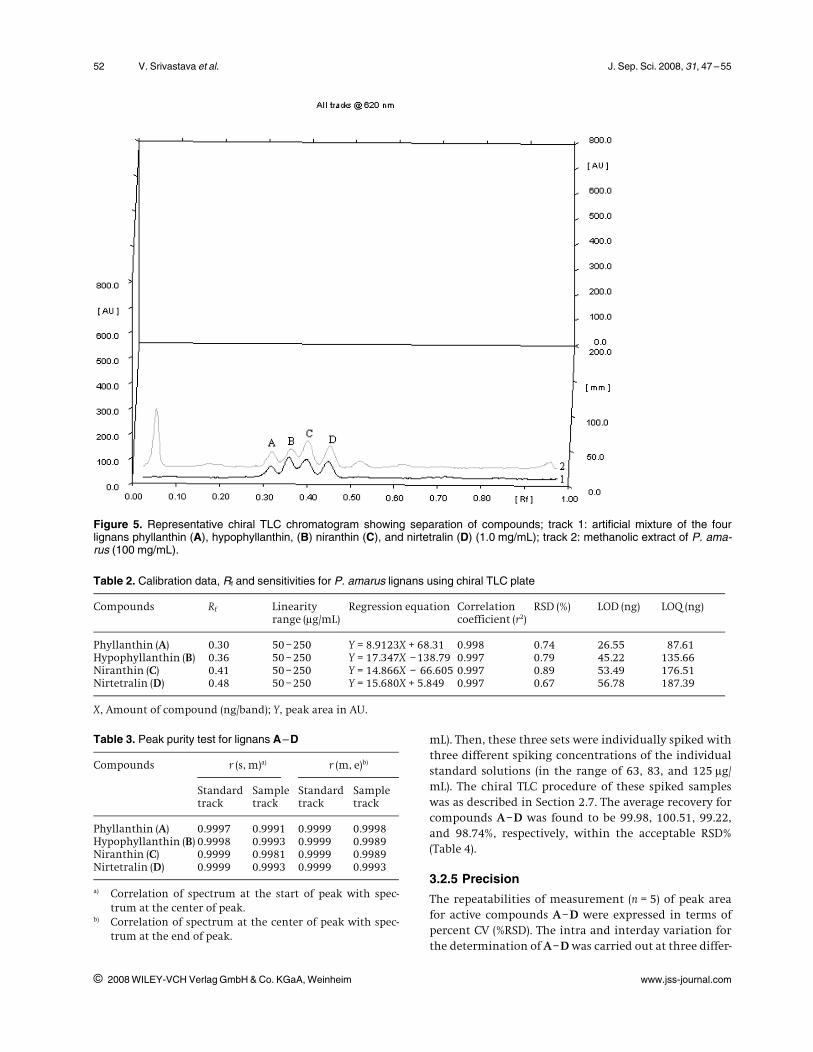
chemical markers (A–D) with a mobile phase consistingof n-hexane/acetone/1,4-dioxane (9:1:0.5 by volume) (Fig.2a and b) were tried to separate. The same mobile phasecomposition gave a better resolution of all the fourmarkers A–D (Fig. 2c) on a chiral plate in the studied con-centration range. The suitability of chiral stationaryphase and the mobile phase composition as mentionedabove was further confirmed in the separation of lignansin P. amarus extract (Fig. 3). The identity of bands of A–Din the Phyllanthus extracts was confirmed by overlayingtheir absorption spectra with those of the standards (Fig.4) as well as coincidence of Rf values (Fig. 5). A well-resolved separation of tested lignans was also obtainedin the plant extract.
3.2 Method validation
3.2.1 Linearity and quantification
Working stock solutions were prepared by dilution togive solutions containing reference lignans A–D in theconcentrations of 50, 62.5, 83.3, 125, and 250 lg/mL. Twomicroliters of each standard solution was spotted on thechiral TLC plate to obtain final concentrations of 100,135, 166, 250, and 500 ng/spot. Each concentration wasspotted thrice on the chiral TLC plate. The calibrationcurves were linear in the concentration range of 100–500 ng/spot with correlation coefficients (r2) = 0.998,0.997, 0.997, and 0.998 for A, B, C, and D, respectively.The regression data obtained showed a good linear rela-tionship (Table 2).
Two microliters of each sample solution from differentlocations were taken and each one of them was appliedon the chiral plate in triplicate with a similar band pat-
i 2008 WILEY-VCH Verlag GmbH & Co. KGaA, Weinheim www.jss-journal.com
Figure 2. Separation of artificial mixture of four lignans (A)phyllanthin, (B) hypophyllanthin, (C) niranthin, and (D) nirte-tralin on various stationary phases.
Figure 3. Separation of four lignans A–D in P. amarusextract on a chiral plate.
J. Sep. Sci. 2008, 31, 47– 55 Liquid Chromatography 51
tern. The experimental parameters were identical for allthe above analysis. The percent content of analytes in thesample was calculated on the basis of calibration curves.
3.2.2 LOD and LOQ
The LOD and the LOQ were calculated for A–D on thebasis of three and ten times the noise level, respectively.The LOD values were found to be 26.55, 45.22, 53.49, and56.78 ng/band for compounds A, B, C, and D, respec-tively, whereas LOQ values were 87.61, 135.66, 176.51,and 187.39 ng/band, respectively (Table 2).
3.2.3 Specificity
The specificity of the method was ascertained by analyz-ing standards and sample. The bands for the four testedlignans A–D in samples were confirmed by comparing
the Rf and spectra of the spot with that of standard. Thepeak purity of individual A, B, C, and D was assessed bycomparing the spectra at peak start, peak apex, and peakend positions of the band, i.e., r (start, middle) = 0.9991,0.9993, 0.9981, 0.9993 and r (middle, end) = 0.9998,0.9989, 0.9989, 0.9993, respectively. Good correlationwas also obtained between standards and sample over-lain spectra (A0.99) (Table 3).
3.2.4 Recovery
Recovery studies of the analytes in the sample were car-ried out to assess the accuracy of the method. For thispurpose, three different spiking concentrations of thestandard stock solutions of compounds A–D were pre-pared. Three sets were prepared from a preanalyzed sam-ple, i. e., location 1 (1 mL each of concentration 100 mg/
i 2008 WILEY-VCH Verlag GmbH & Co. KGaA, Weinheim www.jss-journal.com
Figure 4. Overlay spectra after derivatization of reference lignans (A) phyllanthin, (B) hypophylanthin, (C) niranthin, and (D) nir-tetralin along with A–D in the sample extract of P. amarus.
52 V. Srivastava et al. J. Sep. Sci. 2008, 31, 47 –55
mL). Then, these three sets were individually spiked withthree different spiking concentrations of the individualstandard solutions (in the range of 63, 83, and 125 lg/mL). The chiral TLC procedure of these spiked sampleswas as described in Section 2.7. The average recovery forcompounds A–D was found to be 99.98, 100.51, 99.22,and 98.74%, respectively, within the acceptable RSD%(Table 4).
3.2.5 Precision
The repeatabilities of measurement (n = 5) of peak areafor active compounds A–D were expressed in terms ofpercent CV (%RSD). The intra and interday variation forthe determination of A–D was carried out at three differ-
i 2008 WILEY-VCH Verlag GmbH & Co. KGaA, Weinheim www.jss-journal.com
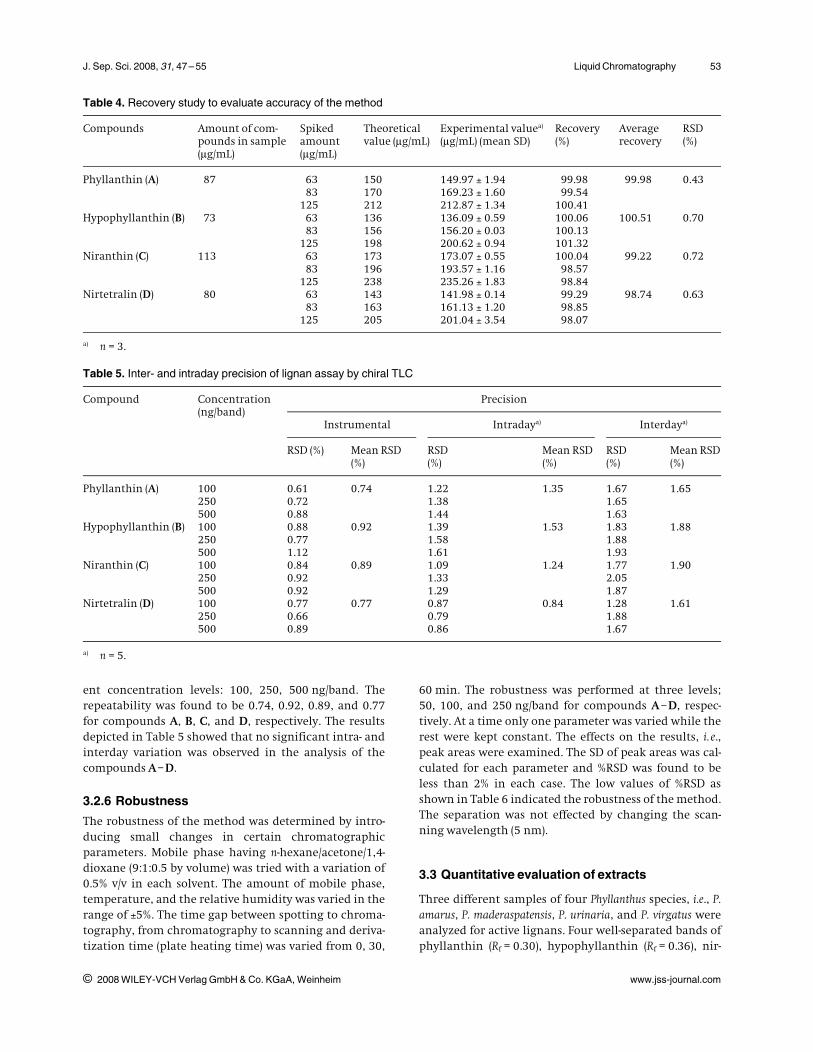
Table 2. Calibration data, Rf and sensitivities for P. amarus lignans using chiral TLC plate
Compounds Rf Linearityrange (lg/mL)
Regression equation Correlationcoefficient (r2)
RSD (%) LOD (ng) LOQ (ng)
Phyllanthin (A) 0.30 50 –250 Y = 8.9123X + 68.31 0.998 0.74 26.55 87.61Hypophyllanthin (B) 0.36 50 –250 Y = 17.347X –138.79 0.997 0.79 45.22 135.66Niranthin (C) 0.41 50 –250 Y = 14.866X – 66.605 0.997 0.89 53.49 176.51Nirtetralin (D) 0.48 50 –250 Y = 15.680X + 5.849 0.997 0.67 56.78 187.39
X, Amount of compound (ng/band); Y, peak area in AU.
Figure 5. Representative chiral TLC chromatogram showing separation of compounds; track 1: artificial mixture of the fourlignans phyllanthin (A), hypophyllanthin, (B) niranthin (C), and nirtetralin (D) (1.0 mg/mL); track 2: methanolic extract of P. ama-rus (100 mg/mL).
Table 3. Peak purity test for lignans A–D
Compounds r (s, m)a) r (m, e)b)
Standardtrack
Sampletrack
Standardtrack
Sampletrack
Phyllanthin (A) 0.9997 0.9991 0.9999 0.9998Hypophyllanthin (B) 0.9998 0.9993 0.9999 0.9989Niranthin (C) 0.9999 0.9981 0.9999 0.9989Nirtetralin (D) 0.9999 0.9993 0.9999 0.9993
a) Correlation of spectrum at the start of peak with spec-trum at the center of peak.
b) Correlation of spectrum at the center of peak with spec-trum at the end of peak.
J. Sep. Sci. 2008, 31, 47– 55 Liquid Chromatography 53
ent concentration levels: 100, 250, 500 ng/band. Therepeatability was found to be 0.74, 0.92, 0.89, and 0.77for compounds A, B, C, and D, respectively. The resultsdepicted in Table 5 showed that no significant intra- andinterday variation was observed in the analysis of thecompounds A–D.
3.2.6 Robustness
The robustness of the method was determined by intro-ducing small changes in certain chromatographicparameters. Mobile phase having n-hexane/acetone/1,4-dioxane (9:1:0.5 by volume) was tried with a variation of0.5% v/v in each solvent. The amount of mobile phase,temperature, and the relative humidity was varied in therange of l5%. The time gap between spotting to chroma-tography, from chromatography to scanning and deriva-tization time (plate heating time) was varied from 0, 30,
60 min. The robustness was performed at three levels;50, 100, and 250 ng/band for compounds A–D, respec-tively. At a time only one parameter was varied while therest were kept constant. The effects on the results, i. e.,peak areas were examined. The SD of peak areas was cal-culated for each parameter and %RSD was found to beless than 2% in each case. The low values of %RSD asshown in Table 6 indicated the robustness of the method.The separation was not effected by changing the scan-ning wavelength (5 nm).
3.3 Quantitative evaluation of extracts
Three different samples of four Phyllanthus species, i.e., P.amarus, P. maderaspatensis, P. urinaria, and P. virgatus wereanalyzed for active lignans. Four well-separated bands ofphyllanthin (Rf = 0.30), hypophyllanthin (Rf = 0.36), nir-
i 2008 WILEY-VCH Verlag GmbH & Co. KGaA, Weinheim www.jss-journal.com
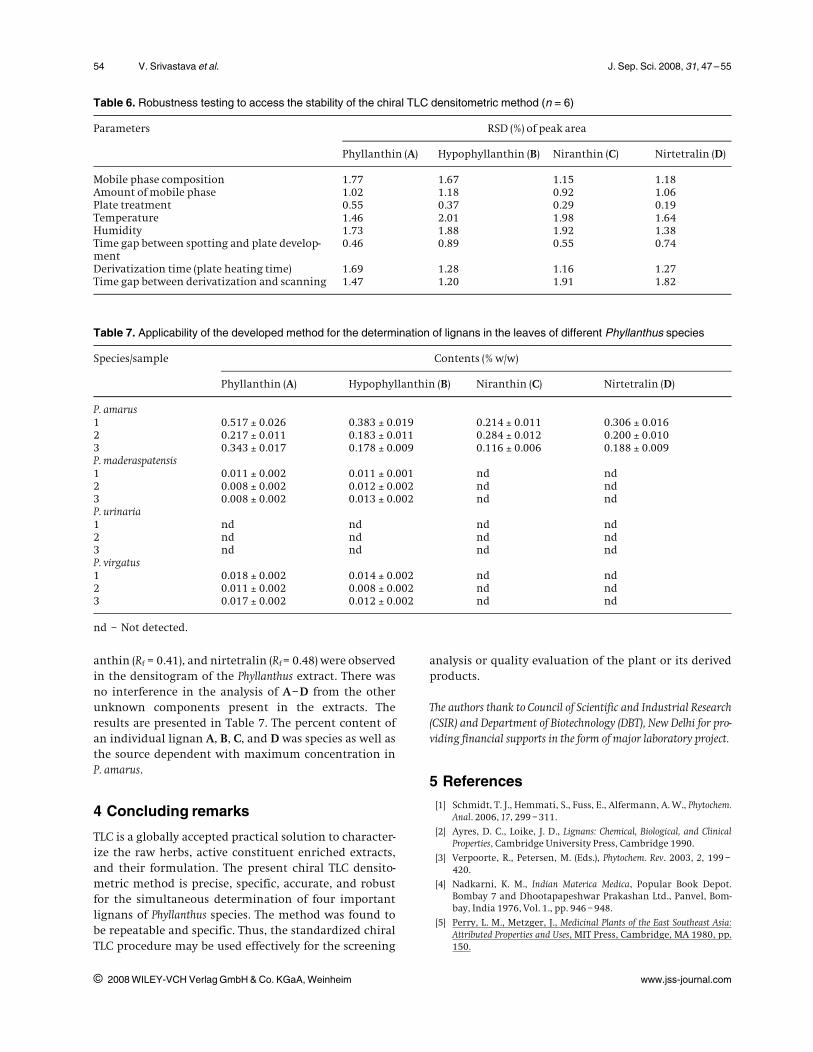
Table 4. Recovery study to evaluate accuracy of the method
Compounds Amount of com-pounds in sample(lg/mL)
Spikedamount(lg/mL)
Theoreticalvalue (lg/mL)
Experimental valuea)
(lg/mL) (mean SD)Recovery(%)
Averagerecovery
RSD(%)
Phyllanthin (A) 87 6383
125
150170212
149.97 l 1.94169.23 l 1.60212.87 l 1.34
99.9899.54
100.41
99.98 0.43
Hypophyllanthin (B) 73 6383
125
136156198
136.09 l 0.59156.20 l 0.03200.62 l 0.94
100.06100.13101.32
100.51 0.70
Niranthin (C) 113 6383
125
173196238
173.07 l 0.55193.57 l 1.16235.26 l 1.83
100.0498.5798.84
99.22 0.72
Nirtetralin (D) 80 6383
125
143163205
141.98 l 0.14161.13 l 1.20201.04 l 3.54
99.2998.8598.07
98.74 0.63
a) n = 3.
Table 5. Inter- and intraday precision of lignan assay by chiral TLC
Compound Concentration(ng/band)
Precision
Instrumental Intradaya) Interdaya)
RSD (%) Mean RSD(%)
RSD(%)
Mean RSD(%)
RSD(%)
Mean RSD(%)
Phyllanthin (A) 100 0.61 0.74 1.22 1.35 1.67 1.65250 0.72 1.38 1.65500 0.88 1.44 1.63
Hypophyllanthin (B) 100 0.88 0.92 1.39 1.53 1.83 1.88250 0.77 1.58 1.88500 1.12 1.61 1.93
Niranthin (C) 100 0.84 0.89 1.09 1.24 1.77 1.90250 0.92 1.33 2.05500 0.92 1.29 1.87
Nirtetralin (D) 100 0.77 0.77 0.87 0.84 1.28 1.61250 0.66 0.79 1.88500 0.89 0.86 1.67
a) n = 5.
54 V. Srivastava et al. J. Sep. Sci. 2008, 31, 47 –55
anthin (Rf = 0.41), and nirtetralin (Rf = 0.48) were observedin the densitogram of the Phyllanthus extract. There wasno interference in the analysis of A–D from the otherunknown components present in the extracts. Theresults are presented in Table 7. The percent content ofan individual lignan A, B, C, and D was species as well asthe source dependent with maximum concentration inP. amarus.
4 Concluding remarks
TLC is a globally accepted practical solution to character-ize the raw herbs, active constituent enriched extracts,and their formulation. The present chiral TLC densito-metric method is precise, specific, accurate, and robustfor the simultaneous determination of four importantlignans of Phyllanthus species. The method was found tobe repeatable and specific. Thus, the standardized chiralTLC procedure may be used effectively for the screening
analysis or quality evaluation of the plant or its derivedproducts.
The authors thank to Council of Scientific and Industrial Research(CSIR) and Department of Biotechnology (DBT), New Delhi for pro-viding financial supports in the form of major laboratory project.
5 References
[1] Schmidt, T. J., Hemmati, S., Fuss, E., Alfermann, A. W., Phytochem.Anal. 2006, 17, 299 – 311.
[2] Ayres, D. C., Loike, J. D., Lignans: Chemical, Biological, and ClinicalProperties, Cambridge University Press, Cambridge 1990.
[3] Verpoorte, R., Petersen, M. (Eds.), Phytochem. Rev. 2003, 2, 199 –420.
[4] Nadkarni, K. M., Indian Materica Medica, Popular Book Depot.Bombay 7 and Dhootapapeshwar Prakashan Ltd., Panvel, Bom-bay, India 1976, Vol. 1., pp. 946 – 948.
[5] Perry, L. M., Metzger, J., Medicinal Plants of the East Southeast Asia:Attributed Properties and Uses, MIT Press, Cambridge, MA 1980, pp.150.
i 2008 WILEY-VCH Verlag GmbH & Co. KGaA, Weinheim www.jss-journal.com
Table 6. Robustness testing to access the stability of the chiral TLC densitometric method (n = 6)
Parameters RSD (%) of peak area
Phyllanthin (A) Hypophyllanthin (B) Niranthin (C) Nirtetralin (D)
Mobile phase composition 1.77 1.67 1.15 1.18Amount of mobile phase 1.02 1.18 0.92 1.06Plate treatment 0.55 0.37 0.29 0.19Temperature 1.46 2.01 1.98 1.64Humidity 1.73 1.88 1.92 1.38Time gap between spotting and plate develop-ment
0.46 0.89 0.55 0.74
Derivatization time (plate heating time) 1.69 1.28 1.16 1.27Time gap between derivatization and scanning 1.47 1.20 1.91 1.82
Table 7. Applicability of the developed method for the determination of lignans in the leaves of different Phyllanthus species
Species/sample Contents (% w/w)
Phyllanthin (A) Hypophyllanthin (B) Niranthin (C) Nirtetralin (D)
P. amarus1 0.517 l 0.026 0.383 l 0.019 0.214 l 0.011 0.306 l 0.0162 0.217 l 0.011 0.183 l 0.011 0.284 l 0.012 0.200 l 0.0103 0.343 l 0.017 0.178 l 0.009 0.116 l 0.006 0.188 l 0.009P. maderaspatensis1 0.011 l 0.002 0.011 l 0.001 nd nd2 0.008 l 0.002 0.012 l 0.002 nd nd3 0.008 l 0.002 0.013 l 0.002 nd ndP. urinaria1 nd nd nd nd2 nd nd nd nd3 nd nd nd ndP. virgatus1 0.018 l 0.002 0.014 l 0.002 nd nd2 0.011 l 0.002 0.008 l 0.002 nd nd3 0.017 l 0.002 0.012 l 0.002 nd nd
nd – Not detected.

J. Sep. Sci. 2008, 31, 47– 55 Liquid Chromatography 55
[6] Calixto, J. B., Santos, A. R. S., Filho, V. C., Yunes, R. A., Med. Res.Rev. 1998, 18, 225 – 258.
[7] Khatoon, S., Rai, V., Rawat, A. K. S., Mehrotra, S., J. Ethnopharm.2006, 104, 79 – 86.
[8] Syamsunder, K. V., Singh, B., Thakur, R. S., Husain, A., Kiso, Y.,Hikino, H., J. Ethnopharm. 1985, 14, 41 – 44.
[9] Ha. nh, N. N., Quan, T. L., TC Duo. c ho. c. 2004, 8, 10 – 11.
[10] Huang, R. L., Huang, Y. L., Ou, J. C., Chen, C. C., Hsu, F. L., Chang,C., Phytother. Res. 2003, 17, 449 – 453.
[11] Kassuya, C. A., Leite, D. F., de Melo, L. V., Rehder, V. L., Calixto, J.B., Planta Med. 2005, 71, 721 – 726.
[12] Leite, D. F., Kassuya, C. A., Mazzuco, T. L., Silvestre, A., de-Melo, L.V., Rehder, V. L., Rumjanek, V. M., Calixto, J. B., Planta Med. 2006,72, 1353 – 1358.
[13] Deb, S., Mandal, S. K., Indian Drugs 1996, 33, 415 – 416.
[14] Sane, R. T., Chawla, J. L., Kuber, V. V., Indian Drugs 1997, 34, 580 –584.
[15] Dhalwal, K., Biradar, Y. S., Rajani, M., J. AOAC Int. 2006, 89, 619 –623.
[16] Tripathi, A. K., Verma, R. K., Gupta, A. K., Gupta, M. M., Khanuja,S. P. S., Phytochem. Anal. 2006, 17, 394 – 397.
[17] Mukherjee, P. K., Wahile, A., Kumar, V., Rai, S., Mukherjee, K.,Saha, B. P., Drug Inform. J. 2006, 40, 131 – 139.
[18] Sharma, A., Singh, R. T., Handa, S. S., Phytochem. Anal. 1993, 4,226 – 229.
[19] Vikram, B. T., Vandana, D. M., Modi, I. A., Rajiv, I. M., Balak-rishna, C., Indian Drugs 1996, 33, 611 – 614.
[20] Kumud, U. K., Parag, D., Vivek, C., Indian Drugs 2001, 38, 303 –306.
[21] Wang, C. Y., Lee, S. S., Phytochem. Anal. 2005, 16, 120 – 126.
[22] Murugaiyah, V., Chan, K., J. Chromatogr. A 2007, 1154, 198 – 204.
[23] Singh, D. V., Verma, R. K., Gupta, M. M., Kumar, S., Phytochem.Anal. 2002, 13, 207 – 210.
[24] Srivastava, A., Misra, H., Verma, R. K., Gupta, M. M., Phytochem.Anal. 2004, 15, 280 – 285.
[25] Coran, S. A., Giannellini, V., Bambagiotti-Alberti, M., J. Chroma-togr. A. 2004, 1045, 217 – 222.
[26] Pandey, R., Verma, R. K., Gupta, M. M., J. Sep. Sci. 2007, 30, 2086 –2091.
[27] Pozharitskaya, O. N., Ivanova, S. A., Shikov, A. N., Makarov, V. G.,J. Sep. Sci. 2007, 30, 1250 – 1254.
[28] Chang, C. C., Lien, Y. C., Liu, K. C. S., Lee, S. S., Phytochemistry 2003,63, 825 – 833.
[29] Somanabandhu, A., Nitayangkura, S., Mahidol, C., Ruchirawat,S., Likhitwitayawuid, K., Shieh, H. L., Chai, H., Pezzuto, J. M., Cor-dell, G. A., J. Nat. Prod. 1993, 56, 233 – 239.
i 2008 WILEY-VCH Verlag GmbH & Co. KGaA, Weinheim www.jss-journal.com