I. Stereochemical Control of Chiral Assembly and Liquid ...
304
Syracuse University Syracuse University SURFACE SURFACE Chemistry - Dissertations College of Arts and Sciences 5-2013 I. Stereochemical Control of Chiral Assembly and Liquid Crystal I. Stereochemical Control of Chiral Assembly and Liquid Crystal Phase Formation of Nonamphiphilic Molecules in Water II. Control Phase Formation of Nonamphiphilic Molecules in Water II. Control Bacterial Quorum Sensing and Quorum Sensing-mediated Bacterial Quorum Sensing and Quorum Sensing-mediated Activities Using Small Unnatural Molecules Activities Using Small Unnatural Molecules Sijie Yang Syracuse University Follow this and additional works at: https://surface.syr.edu/che_etd Part of the Chemistry Commons Recommended Citation Recommended Citation Yang, Sijie, "I. Stereochemical Control of Chiral Assembly and Liquid Crystal Phase Formation of Nonamphiphilic Molecules in Water II. Control Bacterial Quorum Sensing and Quorum Sensing-mediated Activities Using Small Unnatural Molecules" (2013). Chemistry - Dissertations. 197. https://surface.syr.edu/che_etd/197 This Dissertation is brought to you for free and open access by the College of Arts and Sciences at SURFACE. It has been accepted for inclusion in Chemistry - Dissertations by an authorized administrator of SURFACE. For more information, please contact [email protected].
-
Upload
khangminh22 -
Category
Documents
-
view
5 -
download
0
Transcript of I. Stereochemical Control of Chiral Assembly and Liquid ...

Syracuse University Syracuse University
SURFACE SURFACE
Chemistry - Dissertations College of Arts and Sciences
5-2013
I. Stereochemical Control of Chiral Assembly and Liquid Crystal I. Stereochemical Control of Chiral Assembly and Liquid Crystal
Phase Formation of Nonamphiphilic Molecules in Water II. Control Phase Formation of Nonamphiphilic Molecules in Water II. Control
Bacterial Quorum Sensing and Quorum Sensing-mediated Bacterial Quorum Sensing and Quorum Sensing-mediated
Activities Using Small Unnatural Molecules Activities Using Small Unnatural Molecules
Sijie Yang Syracuse University
Follow this and additional works at: https://surface.syr.edu/che_etd
Part of the Chemistry Commons
Recommended Citation Recommended Citation Yang, Sijie, "I. Stereochemical Control of Chiral Assembly and Liquid Crystal Phase Formation of Nonamphiphilic Molecules in Water II. Control Bacterial Quorum Sensing and Quorum Sensing-mediated Activities Using Small Unnatural Molecules" (2013). Chemistry - Dissertations. 197. https://surface.syr.edu/che_etd/197
This Dissertation is brought to you for free and open access by the College of Arts and Sciences at SURFACE. It has been accepted for inclusion in Chemistry - Dissertations by an authorized administrator of SURFACE. For more information, please contact [email protected].

ABSTRACT
The primary goal of this research is to utilize organic synthesis as a tool to prepare small
molecules that find potential application in different areas including colloidal and material science,
biological chemistry, and medicinal chemistry.
Chapter 1 describes the interpretation of the conformation of nonamphiphilic mesogen disodium
cromoglycate (5 DSCG) when it exists as part of an assembly in water. The study of thermodynamic
incompatibility and miscibility suggest that a previously proposed model for the assembly of
5 DSCG may be applicable to nonamphiphilic organic dyes and other mesogens.
Chapter 2 presents a study of stereochemical control on assembly and liquid crystal formation by
nonamphiphilic molecules. Three stereoisomers of a disodium chromonyl carboxylate derivative,
5 DSCG-diviol, were designed and synthesized. The chiral stereoisomers formed chiral nematic
liquid crystals while the achiral counterpart did not form any kind of liquid crystals. The hydrated
assemblies of chiral 5 DSCG-diviol were able to interact with each other across a 6 nm separation in
aqueous environment and the chirality information was transmitted through achiral medium.
Chapter 3 describes the synthesis and biological studies of a class of bicyclic brominated
furanones. These molecules interacted with quorum sensing in an opportunistic pathogen P.
aeruginosa. Some representative compounds in this class inhibited quorum sensing-controlled
activities such as biofilm formation and virulence factor production, which were key factors in the
pathogenicity of the bacteria. These compounds exhibited significant reduction in the toxicity of
human neuroblastoma SK-N-SH and did not inhibit bacterial growth. Furthermore, one compound,
6-BBF, significantly improved P. aeruginosa clearance in the lungs of mice in an
immunocompromised pneumonia mouse model in vivo.

Chapter 4 reports the synthesis of a library of squarylated homoserine lactones (SHLs) as
analogues to the natural autoinducers N-acyl homoserine lactones (AHL) in Gram-negative bacteria.
These SHLs were shown to have no or minimal impact of the growth of P. aeruginosa and V.
fischeri, but maintain the abilities to modulate quorum sensing and inhibit biofilm formation.
Primary studies of structural activity relationship revealed that the alkyl chain length was critical to
activities of SHLs. These SHLs are promising candidates as modulators of other AHL-mediated QS
systems.
I. Stereochemical Control of Chiral Assembly and Liquid Crystal Phase Formation of
Nonamphiphilic Molecules in Water
II. Control Bacterial Quorum Sensing and Quorum Sensing-mediated Activities Using
Small Unnatural Molecules
by
Sijie Yang
B.S., Wuhan University, Wuhan, China, 2005
M.Phil., Syracuse University, Syracuse 2008
Dissertation
Submitted in partial fulfillment of the requirements for the degree of
Doctor of Philosophy in Chemistry.
Syracuse University
May 2013

Copyright © Sijie Yang 2013
All Rights Reserved

v
ACKNOWLEDGEMENT
This dissertation would not have been possible without the guidance and support of many
people.
I would like to express my sincere gratitude to my advisor Professor Yan-Yeung Luk for
providing me an opportunity to work on the diverse, inspiring and challenging projects.
Professor Luk’s enthusiasm for science and drive for novel ideas have been a constant source of
inspiration through my years in his laboratory. I thank him for his continuous support and
valuable guidance during the course of my graduate studies.
I would like to thank all the members of my defense committee, Professors Pepling, Chaiken,
Chisholm, Dabrowiak and Sponsler for finding time out of their very busy schedule to be on my
defense committee. I’m grateful to them for critically reviewing of my PhD dissertation. My
special thanks to Professor Dabrowiak, who generously helped me with comments and
suggestions during my writing of this dissertation. I would also like to thank Professors
Hougland, Korendovych and Loh for generously allowing me to use various equipments in their
laboratories.
Each of my chapters involves extensive collaborations with fellow graduate students,
postdoctoral associates and other personnel. I thank Dr. Debjyoti Bandyopadhyay, Fei Cheng,
Dr. Dawei Cui, Dr. Junjie Han, Dr. Deborah Kerwood, Gauri Shetye, Nisha Varghese, Dr. Bing
Wang, Dr. Guirong Wang, and Dr. Stephen Wilkens. These works wouldn’t have been as fruitful
without their help and I never stopped learning from working and discussing science with them. I
also thank my other colleagues from Luk laboratory, Dr. Deepali Prashar, Dr. Karen Simon,
Nischal Singh and Luke Nye for being great friends in and outside the laboratory. Their company

vi
enabled the smooth progression of research during my graduate study. I have truly enjoyed
working and spending time with them.
I would also like to thank other faculty members who helped me during my graduate study.
These include but not limit to Dr. Nancy Totah, Dr. Christopher Boddy, Dr. Roger Hahn, and Dr.
Daniel Clark. Their guidance and critics during group meetings and problem sessions made me a
better organic chemist.
During my time in Syracuse University, I have made a few wonderful friends, whose
friendship is the treasure of my life. I thank Dr. Laura Bateman, Dr. Troy Lam, Dakin Sharum,
Dr. Alexander Augatis, Michael Robinson, Dr. Dennis Viernes and Lydia Choi, for all their
support, help and laughs. My special thanks to Laura and Troy, whose continuous support and
love helped me through my toughest time in graduate school and my life. Laura is not only a
sister I never had but also a role model that motivates me for my life.
I would also like to thank the wonderful staffs at the Department of Chemistry, Cathy, Jodi,
Deb and Joyce, for all their help during my years at Syracuse University.
My sincere gratitude also goes to my roommates and sisters during these years. To Dr. Nan
Qin, Dr. Yi Shi, and Dr. Bing Deng, for your understanding, encouragement and sharing laugh
and tears. You’ve made my life away from home so colorful.
Finally, I would like to thank my parents Xiaoying Qi and Xianqiao Yang, who planted the
seed for the love of science and knowledge in my heart since I was a kid, and whose
unconditional love and support enable me to reach where I am today.

vii
TABLE OF CONTENTS
Chapter 1 Page
Molecular Conformation and Self-assembly of Nonamphiphilic Liquid Crystals in Water…...- 1 -
1.1 Background and Significance ............................................................................................ - 1 -
1.1.1 Lyotropic, thermotropic, and nonamphiphilic liquid crystals ................................. - 1 -
1.1.2 Different assembly models of nonamphiphilic liquid crystals ................................. - 4 -
1.2 Results and Discussion ...................................................................................................... - 7 -
1.2.1 Possible molecular conformation and assembly formation mechanism of 5 DSCG in
water ........................................................................................................................ - 7 -
1.2.2 Promote the assembly formation of nonamphiphilic mesogens by thermodynamically
incompatible polymers .......................................................................................... - 12 -
1.2.3 Investigate assembly model of organic dye-based nonamphiphilic molecule by
miscibility .............................................................................................................. - 15 -
1.3 Conclusion and Perspectives............................................................................................ - 20 -
1.4 Experimental Section ....................................................................................................... - 20 -
Chapter 2
Stereochemical Control of Nonamphiphilic Liquid Crystals: Effect of Chiral Mesogens and
Dopants on Assemblies Separated by Six Nanometers of Aqueous Solvents.……………….- 23 -
2.1 Background and Significance .......................................................................................... - 23 -
2.1.1 Cholesteric liquid crystal phase ............................................................................ - 23 -
2.1.2 Chiral chromonic liquid crystals ........................................................................... - 24 -
2.2 Results and Discussion .................................................................................................... - 25 -
viii
2.2.1 Design and synthesis of the stereoisomers of 5 DSCG-diviols ............................. - 25 -
2.2.2 Stereochemistry controls the formation of liquid crystals ..................................... - 28 -
2.2.3 Stereoisomers of 5 DSCG-diviols exhibit different polymorphism ....................... - 30 -
2.2.4 Conformations of stereoisomers are different ....................................................... - 31 -
2.2.5 Circular dichroism indicates a chiral conformation ............................................. - 34 -
2.2.6 Cryogenic transmission electron microscopy reveals early-staged and crossed
assemblies by chiral mesogens .............................................................................. - 37 -
2.2.7 Nonuniform alignment formed by 5 DSCG-(R,R)-diviol ...................................... - 43 -
2.2.8 Homeotropic alignment (fingerprint texture) of chiral nematic phase of
nonamphiphilic liquid crystals .............................................................................. - 49 -
2.3 Conclusions and perspectives .......................................................................................... - 65 -
2.4 Experimental Section ....................................................................................................... - 66 -
Chapter 3
Bicyclic Brominated Furanones: A New Class of Quorum Sensing Modulators that Inhibit
Biofilm Formation with Reduced Toxicity and Improved Bacterial Clearance in
vivo….….…………………………………………………………………………………...- 133 -
3.1 Background and Significance ........................................................................................ - 133 -
3.2.1 Quorum sensing and autoinducers ...................................................................... - 133 -
3.2.2 Biofilm formation and consequences .................................................................. - 137 -
3.2.3 Use quorum sensing modulators to control biofilm formation ........................... - 140 -
3.2.4 Other biofilm inhibitors ....................................................................................... - 141 -
3.2.5 Quorum sensing and biofilm inhibitors with furanone moiety ............................ - 142 -

ix
3.2 Results and Discussion .................................................................................................. - 146 -
3.2.1 Synthesis of BBFs ................................................................................................ - 146 -
3.2.2 Inhibition of E.coli biofilm formation by BBFs ................................................... - 147 -
3.2.3 Cytotoxicity study of BBFs on the growth of E. coli ........................................... - 149 -
3.2.4 Inhibition of P. aeruginosa biofilm formation by BBFs ...................................... - 150 -
3.2.5 Cytotoxicity study of BBFs on the growth of P.aeruginosa ................................ - 156 -
3.2.6 Study of synergistic effect between BBFs and tobramycin .................................. - 157 -
3.2.7 Modulation of the quorum sensing in P. aeruginosa by BBFs ............................ - 160 -
3.2.8 Effect on elastase B production in P. aeruginosa by BBFs ................................. - 165 -
3.2.9 Improved bacterial clearance by 6-BBF in vivo ................................................. - 167 -
3.2.10 Cytotoxicity study of BBFs on human cells ......................................................... - 169 -
3.3 Conclusion and Perspectives.......................................................................................... - 173 -
3.4 Experimental Section ..................................................................................................... - 174 -
3.4.1 Biological studies ................................................................................................ - 174 -
3.4.2 Chemical synthesis and characterization ............................................................ - 181 -
Chapter 4
Modulation of Quorum Sensing in Gram-negative Bacteria by Squarylated Homoserine
Lactones...…………………………………………………………………………………...- 192 -
4.1 Background and Significance ........................................................................................ - 192 -
4.1.1 AHL-based quorum sensing in Gram-negative bacteria ..................................... - 192 -
4.1.2 Modulation of LuxI/LuxR-type quorum sensing system ...................................... - 194 -
x
4.1.3 Biofilm inhibitors containing squarate moiety .................................................... - 198 -
4.2 Results and Discussion .................................................................................................. - 201 -
4.2.1 Synthesis of SHLs ................................................................................................ - 201 -
4.2.2 Cytotoxicity study of SHLs on the growth of P. aeruginosa ................................ - 202 -
4.2.3 Modulation of quorum sensing in P. aeruginosa by SHLs .................................. - 203 -
4.2.4 Inhibition of P. aeruginosa biofilm formation by SHLs ...................................... - 206 -
4.2.5 Cytotoxicity study of SHLs on the growth of V. fischeri ...................................... - 207 -
4.2.6 Modulation of quorum sensing in V. fischeri by SHLs ........................................ - 209 -
4.3 Conclusion and Perspectives.......................................................................................... - 210 -
4.4 Experimental Section ..................................................................................................... - 211 -
References ............................................................................................................................... - 248 -

xi
LIST OF FIGURES
Chapter 1 Page
Figure 1.1 Illustrations of the molecular order in liquid, liquid crystal, and crystalline solid state
of matter. ..................................................................................................................................... - 2 -
Figure 1.2 Examples of thermotropic and lyotropic mesogens. ................................................. - 3 -
Figure 1.3 Examples of nonamphiphilic mesogens. ................................................................... - 4 -
Figure 1.4 Stacking models for nonamphiphilic mesogens. ....................................................... - 5 -
Figure 1.5 NMR spectroscopy of 1.20 wt% (~ 24 mM) 5 DSCG in water at 25 oC. (A)
1H NMR
with the linker region enlarged. (B) Partial NOESY spectrum showing the cross peaks between
proton a and proton e/e . ............................................................................................................. - 8 -
Figure 1.6 Possible conformations of 5 DSCG in water at 1.20 wt% (~ 24 mM) at 25 oC. (A)
Staggered. (B) Eclipsed. ............................................................................................................. - 9 -
Figure 1.7 Temperature effect on chemical shifts of protons in 1.20 wt% (~24 mM) 5 DSCG (in
water). NMR of 0.45 wt% (~ 8.8 mM) 5 DSCG in water at 25 oC is shown for comparison. . - 10 -
Figure 1.8 Effect of temperature on the chemical shifts of protons a-d in 5 DSCG (1.20 wt% in
water). ....................................................................................................................................... - 12 -
Figure 1.9 Two possible pathways of the LC formation promoted by addition of polymer. ... - 13 -
Figure 1.10 1H NMR of SSY mixed with ~ 8 wt% of PAAm (10K) in D2O at 25
oC. ............ - 14 -
Figure 1.11 1H NMR of 5 MSCG mixed with ~ 8 wt% of PAAm (10K) in D2O at 25
oC. ..... - 15 -
Figure 1.12: Asymmetric H-stacking model of Sunset Yellow FCF. Aggregations formed by five
SSY molecules are shown. ........................................................................................................ - 16 -
Figure 1.13: Optical images of organic dyes mixed with different concentrations of mono-
charged molecule viewed between crossed polarizers.............................................................. - 18 -
xii
Figure 1.14: Optical images of SY dye mixed with Allura Red AC or Acid Red 13 at different
concentrations viewed between cross polarizers ...................................................................... - 19 -
Chapter 2
Figure 2.1 Schematic representation of the cholesteric liquid crystal phase. ........................... - 24 -
Figure 2.2 The structures of the chiral isomers 5 DSCG-(R,R)-diviol 1a, 5 DSCG-(S,S)-diviol 1b,
and achiral isomer 5 DSCG-meso-diviol 1c. ............................................................................ - 25 -
Figure 2.3 Optical images (cross polarizers) of 12.0 wt % 5 DSCG-(R,R)-diviol 1a (A),
5 DSCG-(S,S)-diviol 1b (B), and 5 DSCG-meso-diviol 1c (C) in water sandwiched between two
glass slides (spacer: 13-15 µm) ................................................................................................. - 29 -
Figure 2.4 Optical images (cross polarizers) of 18.0 wt% 5 DSCG-(R,R)-diviol 1a, 18.1 wt%
5 DSCG-(S,S)-diviol 1b, and 18.0 wt% 5 DSCG-meso-diviol 1c in water when freshly prepared
(A, B, and C, respectively), and when aged at ambient temperature overnight in sealed vials (D,
E, and F, respectively) .............................................................................................................. - 31 -
Figure 2.5 ROESY of 0.503 wt% of 5 DSCG -(S,S)-diviol 1b and 0.503 wt% of 5 DSCG-meso-
diviol 1c in D2O at 25 oC. ......................................................................................................... - 33 -
Figure 2.6 ROESY spectrum of 0.503 wt% 5 DSCG -(S,S)-diviol 1b and 5 DSCG-meso-diviol
1c in D2O at 25 oC. .................................................................................................................... - 34 -
Figure 2.7 UV spectrum of 5 DSCG-(R,R)-diviol 1a (dot line) and CD spectra of 5 DSCG-(R,R)-
diviol 1a (solid line) and 5 DSCG-(S,S)-diviol 1b (dash line) in water (8 × 10⁻⁴
M) at 5 oC. . - 36 -
Figure 2.8 Temperature-dependent CD spectra of 5 DSCG-(R,R)-diviol 1a in water (8 × 10⁻⁴
M).
................................................................................................................................................... - 36 -
Figure 2.9 1H NMR of 5 DSCG-(S,S)-diviol 1b from 0.02 wt% (0.4 mM) to 3.5 wt% (72 mM) in
water. ......................................................................................................................................... - 37 -

xiii
Figure 2.10 Cryogenic transmission electronic microscopic image of 5.5 wt% (488) 5 DSCG
(inside the curved edge) ............................................................................................................ - 38 -
Figure 2.11 Cryogenic transmission electronic microscopic image of 5.0 wt% (587) 5 DSCG-
(R,R)-diviol 1a (inside the curved edge). .................................................................................. - 39 -
Figure 2.12 Cryogenic transmission electronic microscopic image of 8.2 wt% (321) 5 DSCG
(inside the curved edge) ............................................................................................................ - 39 -
Figure 2.13 Cryogenic transmission electronic microscopic image of 8.8 wt% (321) 5 DSCG-
(R,R)-diviol 1a(inside the curved edge). ................................................................................... - 40 -
Figure 2.14 Cryo-TEM images of 5.5 wt% of 5 DSCG, and 5.0 wt% of 5 DSCG-(R,R)-diviol 1a.
................................................................................................................................................... - 41 -
Figure 2.15 Cryogenic transmission electronic microscopic images of 8.2 wt% of 5 DSCG and
8.8 wt% of 5 DSCG-(R,R)-diviol 1a. ........................................................................................ - 42 -
Figure 2.16 (A). Geometry of gold deposition on glass slides at an oblique angle from the surface
normal. (B). Scheme of self-assembly molecules (SAMs) formed by HS(CH2)10(OCH2CH2)3OH.
(C). Schematic representation of uniform alignment of threads of 5 DSCG liquid crystal on
SAMs supported by gold films deposited at 45o from the surface normal of the glass slides.
Optical images (cross polarizers) of (D) 16.8 wt% 5 DSCG, (E) 14.1 wt% 5 DSCG mixed with
14.5 wt% xylitol, (F) 13.4 wt% 5 DSCG mixed with a 16.2 wt% racemic mixture of D- and L-
mannitol, (G) 13.4 wt% 5 DSCG doped with 16.2 wt% D-mannitol, and (H) 18.0 wt% 5 DSCG-
(R,R)-diviol 1a in water sandwiched between obliquely deposited gold films supporting
HS(CH2)10(O CH2CH2)3OH ...................................................................................................... - 45 -
Figure 2.17 Illustrations of the molecular assemblies in (A) homogeneous or (B) homeotropic
alignment of chiral nematic liquid crystal phase on surface. .................................................... - 47 -
xiv
Figure 2.18 Optical images (cross polarizers) of 13.5 wt% 5 DSCG doped with 16.5 wt% D-
mannitol in water sandwiched between obliquely deposited gold films supporting HS(CH2)10(O
CH2CH2)3OH with different thickness of spacers .................................................................... - 47 -
Figure 2.19 (A) Schematic representation of a wedge cell composed of
HS(CH2)10(OCH2CH2)3OH SAMs supported by gold films. Optical images (cross polarizers) of
13.4 wt% 5 DSCG mixed with 16.2 wt% D-mannitol when the thickness of the cell is (B) 13
µm, (C) 296 µm, (D) 555µm, and (E) 778 µm. Scale bar = 76 µm .......................................... - 51 -
Figure 2.20 Optical images (cross polarizers) of (A) 13.4 wt% 5 DSCG mixed with 16.2 wt% D-
mannitol and (B) 18.0 wt% 5 DSCG-(R,R)-diviol when the samples were sandwiched between
obliquely deposited gold films supporting HS(CH2)10(O CH2CH2)3OH in a 1 mm thick cell. - 52 -
Figure 2.21 Optical images with detailed rotations of 13.4 wt% 5 DSCG mixed with 16.2 wt%
D-mannitol in a wedge cell composed of HS(CH2)10(OCH2CH2)3OH SAMs supported by gold
films when the thickness of the cell ranges from 13 to 222 µm. .............................................. - 53 -
Figure 2.22 Optical images with detailed rotations of 13.4 wt% 5 DSCG mixed with 16.2 wt%
D-mannitol in a wedge cell composed of HS(CH2)10(OCH2CH2)3OH SAMs supported by gold
films when the thickness of the cell ranges from 296 to 778 µm. ............................................ - 54 -
Figure 2.23 Optical images with detailed rotations of 13.4 wt% 5 DSCG mixed with 16.2 wt%
D-mannitol in a wedge cell composed of plain glass slides when the thickness of the cell ranges
from 13 to 778 µm. ................................................................................................................... - 55 -
Figure 2.24 Optical images of 13.4 wt% 5 DSCG mixed with 16.2 wt% D-mannitol in a wedge
cell composed of HS(CH2)10(OCH2CH2)3OH SAMs supported by gold films when the cell
thickness is (A) 555 µm, (B) 593 µm, and (C) 778 µm. ........................................................... - 56 -
xv
Figure 2.25 Optical images (cross polarizers) of 13.4 wt% 5 DSCG mixed with 16.2 wt% D-
mannitol viewed in a wedge cell with (A) 27 mm and (B) 17 mm cell length. Both of the wedge
cells are composed of HS(CH2)10(OCH2CH2)3OH SAMs supported by gold films and the spacer
is 13 µm on one end and 1mm on the other .............................................................................. - 57 -
Figure 2.26 Schematic representation of splay deformation of liquid crystals in a wedge cell of
(A) small angle and (B) large angle. ......................................................................................... - 58 -
Figure 2.27 Schematic representation of chiral information transmitted through water molecules
if the molecular assemblies (thread model) are separated by pure wate ................................... - 60 -
Figure 2.28 Schematic representation of chiral information transmitted through water molecules
if the molecular assemblies (H-stacking model) are separated by pure water .......................... - 61 -
Figure 2.29 Schematic representation of chiral information transmitted through water molecules
with free solvated chiral mesogens between the molecular assemblies (thread model) ........... - 62 -
Figure 2.30 Schematic representation of chiral information transmitted through water molecules
with free solvated chiral mesogens between the molecular assemblies (H-stacking model). .. - 63 -
Figure 2.31 Schematic representation of chiral information transmitted through chiral mesogens
between the molecular assemblies (thread model). .................................................................. - 64 -
Figure 2.32 Schematic representation of chiral information transmitted through chiral mesogens
between the molecular assemblies (H-stacking model). ........................................................... - 64 -
Chapter 3
Figure 3.1 Five stages of biofilm development. ..................................................................... - 138 -
Figure 3.2 Examples of brominated furanones isolated form extracts of Delisea pulchra. ... - 143 -
Figure 3.3 Examples of synthetic brominated furanones........................................................ - 144 -
Figure 3.4 Structures of 5-BBF 15, 6-BBF 16 and 7-BBF 17. ............................................... - 146 -

xvi
Figure 3.5 The effect of brominated furanones on biofilm formation by E.coli RP437
(pRSH103). Representative confocal laser scanning microscopy (CLSM) images of biofilm
formed by E.coli RP437 (pRSH103) in the (A) absence and presence of 200 µM (B) 3, (C) 5-
BBF 15, (D) 6-BBF 16 and (E) 7-BBF 17. ............................................................................ - 148 -
Figure 3.6 Quantification of biofilm formation by E.coli RP437 (pRSH103) in the absence and
presence of 200 µM brominated furanones ............................................................................ - 149 -
Figure 3.7 Growth curve of E.coli RP437 in the absence and presence of 200 µM brominated
furanones ................................................................................................................................. - 150 -
Figure 3.8 The effect of brominated furanones on biofilm formation by P. aeruginosa.
Representative confocal laser scan microscopy (CLSM) images of biofilm formed by PAO1-
GFP (expresses green fluorescence on plasmid pSMC2) (A) in the absence of agents, and in the
presence of 400 µM (B) 2, (C) 5-BBF 15, (D) 6-BBF 16, and (E) 7-BBF 17........................ - 152 -
Figure 3.9 Quantification of biofilm formation by PAO1-GFP in the absence and presence of 400
µM brominated furanones ....................................................................................................... - 153 -
Figure 3.10 P. aeruginosa biofilm formation dose-response curves with IC50 values for (A) 5-
BBF 15, (B) 6-BBF 16, and (C) 7-BBF 17 ............................................................................. - 155 -
Figure 3.11 Growth curves of P. aeruginosa PAO1 in the absence (control) and presence of 400
µM brominated furanones. ...................................................................................................... - 157 -
Figure 3.12 Viability of cells within the biofilm treated with and without 6-BBF 16 after
exposure to tobramycin ........................................................................................................... - 159 -
Figure 3.13 GFP expression by PAO-JP2 (plasI-LVAgfp) in the presence of 1 µM 3-oxo-C12-
HSL alone (control) or 1 µM 3-oxo-C12-HSL plus various concentration of 5-BBF 15, 6-BBF
16, 7-BBF 17 or BF 3. ............................................................................................................ - 161 -

xvii
Figure 3.14 GFP expression by PAO1 (plasI-LVAgfp) in the absence or presence of 5-BBF 15,
6-BBF 16, 7-BBF 17 or BF 3 at 50, 150, and 300 µM ........................................................... - 162 -
Figure 3.15 GFP expression by PAO-JP2 (prhlI-LVAgfp) in the presence of 1 µM 3-oxo-C12-
HSL and 10 µM C4-HSL alone (control) or 1 µM 3-oxo-C12-HSL and 10 µM C4-HSL plus
various concentration of 5-BBF 15, 6-BBF 16, 7-BBF 17, or BF 3 ....................................... - 164 -
Figure 3.16 GFP expression by PAO1 (prhlI-LVAgfp) in the absence or presence of 5-BBF 15,
6-BBF 16, 7-BBF 17, or BF 3 at 50, 150, and 300 µM .......................................................... - 165 -
Figure 3.17 Elastase B activity produced by P. aeruginosa PAO-JP2 in the presence of 5 µM 3-
oxo-C12-HSL and 10 µM C4-HSL alone (control) or 5 µM 3-oxo-C12-HSL and 10 µM C4-HSL
plus 300 µM BBFs or 5 µM PAI1 and 10 µM PAI2 plus various concentration of 6-BBF 16
(insert) ..................................................................................................................................... - 167 -
Figure 3.18 Effect of 6-BBF on the bacterial clearance of mouse lung in vivo ...................... - 168 -
Figure 3.19 Survival (%) of human neuroblastoma SK-N-SH cells at 0, 24, and 48 h after 1 h
treatment of 100 µM 5-BBF 15, 6-BBF 16, 7-BBF 17 and BF 3, respectively...................... - 170 -
Figure 3.20 Survival (%) of SK-N-SH when treated with 100 µM 5-BBF 15, 6-BBF 16, 7-BBF
17 and BF 3 for 2, 4, and 6 h .................................................................................................. - 171 -
Figure 3.21 Survival (%) of human neuroblastoma SK-N-SH cells at 0, 24, and 48 h after 1 h
treatment of 400 µM 5-BBF 15, 6-BBF 16, 7-BBF 17 and BF 3, respectively...................... - 172 -
Chapter 4
Figure 4.1 General chemical structure of N-acyl homoserine lactones .................................. - 193 -
Figure 4.2 Venn diagrams showing the structures of selective most potent LuxR-type protein
antagonists and agonists identified and their selectivities for different LuxR-type proteins from
A. tumefaciens (TraR), V. fischeri (LuxR), and P. aeruginosa (LasR)................................... - 197 -

xviii
Figure 4.3 Chemical structures of squarate-based AHL analogues examined by Narasimhan et al.
on inhibitory activities against biofilm formation by E. coli RP437 ...................................... - 199 -
Figure 4.4 Chemical structures of squarate-based AHL analogues examined by Bandyopadhyay
et al. on inhibitory activities against biofilm formation by E. coli RP437 ............................. - 200 -
Figure 4.5 The library of SHLs used in this study .................................................................. - 201 -
Figure 4.5 Growth curves of P. aeruginosa PAO1 in the absence (control) and presence of 300
µM SHLs ................................................................................................................................. - 203 -
Figure 4.6 GFP expression by PAO-JP2 (plasI-LVAgfp) in the presence of 1 µM 3-oxo-C12-
HSL alone (control) or 150 µM SHLs. ................................................................................... - 205 -
Figure 4.7 GFP expression by PAO-JP2 (plasI-LVAgfp) in the presence of 1 µM 3-oxo-C12-
HSL alone (control) or 1 µM 3-oxo-C12-HSL plus different concentrations of SHLs. ......... - 205 -
Figure 4.8 P. aeruginosa biofilm formation in the presence of 300 µM SHLs ...................... - 207 -
Figure 4.9 Growth curves of V. fischeri VCW2G7 in the presence of 3 µM 3-oxo-C6-HSL alone
(control) or 3 µM 3-oxo-C6-HSL plus 10 µM SHLs. ............................................................ - 208 -
Figure 4.10 Luminescence expression by V. fischeri VCW2G7 in the presence of 3 µM 3-oxo-
C6-HSL alone (control) or 3 µM 3-oxo-C6-HSL plus 10 µM SHLs. .................................... - 210 -

xix
LIST OF SCHEMES
Chapter 1 Page
Scheme 1.1………………………………………………………………………………….... - 6 -
Chapter 2
Scheme 2.1…………………………………………………………………………………....- 26 -
Scheme 2.2………………………………………………………………………………........- 27 -
Chapter 3
Scheme 3.1………………………………………………………………………………..…- 146 -
Chapter 4
Scheme 4.1………………………………………………………………………………..…- 201 -

xx
LIST OF TABLES
Chapter 3 Page
Table 3.1…………………………………………………………………………………….- 134 -

- 1 -
Chapter 1
Molecular Conformation and Self-assembly of Nonamphiphilic Liquid Crystals in Water
Summary
NMR spectroscopy was used to interpret the conformation of nonamphiphilic mesogen disodium
cromoglycate (5 DSCG) when it exists as part of an assembly in water. In a 1.2 wt% sample,
5 DSCG forms thread assembly, possibly via an isodesmic mechanism. The validity of the thread
nature of nonamphiphilic organic dyes was also studied. Polyacrylamide promoted assembly
formation by 5 DSCG at concentrations below liquid crystal formation. The same phenomenon was
observed for another nonamphiphilic mesogen Sunset Yellow FCF (SSY) but not for 5 MSCG,
which does not form liquid crystal at any concentration. While 1H NMR alone was not sufficient to
show the potential thread nature of the assembly by SSY, a miscibility test further supported this
model.
1.1 Background and Significance
1.1.1 Lyotropic, thermotropic, and nonamphiphilic liquid crystals
Liquid crystal (LC) is a state of matter which has properties between the conventional liquid
and crystalline solid. Although a liquid crystal may flow like liquids, its molecules do exhibit a
certain degree of orientational order (Figure 1.1). The study of liquid crystals began in 1888
when Friedrich Reinitzer noted that cholesteryl benzoate had two distinct melting points. The
substance changed from a solid to a hazy liquid at the first melting point and then turned into a
clear liquid as the temperature increased further.1

- 2 -
Figure 1.1 Illustrations of the molecular order in liquid, liquid crystal, and crystalline solid state
of matter.
There are two main types of liquid crystals: thermotropic liquid crystals, the order of which is
temperature-dependent, and lyotropic liquid crystals, the order of which is both solvent-
dependent and temperature-dependent. Some of the earliest discovered liquid crystals are
thermotropic. Within a certain temperature range, cooperative ordering of the mesogens
(molecules that form LC) exhibited the LC phase. At too high temperature, the sample becomes
isotropic liquid; at too low temperature, the sample turns into crystalline solids. One such
example is para-azoxyanisole (Figure 1.2). Lyotropic liquid crystals exhibit liquid-crystalline
properties within certain concentration ranges. Typical compounds that form lyotropic liquid
crystals are amphiphilic; they consist of two immiscible hydrophobic and hydrophilic parts
within the same molecule and form micelles in solution above a critical concentration (critical
micelle concentration, or CMC). As the concentration increases further, the assemblies of the
micelles become ordered and lyotropic liquid crystalline phases form. There is a minimum
temperature for a given lyotropic liquid crystal, termed Krafft emperature, below which micelles
Liquid Liquid crystal Crystalline solid
Nematic phase Smectic A phase

- 3 -
will not form and the liquid crystal phase will not occur. Common examples of such molecules
are the salts of fatty acids, many of which are used in soap or detergents (Figure 1.2).
Figure 1.2 Examples of thermotropic and lyotropic mesogens.
Over the past forty years, a new fascinating class of lyotropic liquid crystals has become an
active field of research.2 These molecules structurally differ from the conventional amphiphilic
mesogens of lyotropic liquid crystals in that they are usually rigid, disk-like molecules having
aromatic cores with polar groups at the periphery, instead of flexible, rod-like molecules having
aliphatic chains with ionic groups at one end. They do not possess a critical micelle
concentration and the aggregation takes place at all concentrations, the process of which is
described as isodesmic, meaning that the energy advantage in adding a molecule to an aggregate
is independent of aggregate size. One of the most extensively studied example in this class is
disodium cromoglycate (5 DSCG) (Figure 1.3), an anti-asthmatic drug marketed under the trade
name INTAL in UK and Chromolyn in US.3 This special class of liquid crystals extends to other
drugs,4 dyes,
5-12 and nucleic acids (Figure 1.3),
13,14 and is also termed “chromonic liquid
crystals” (CLCs), not only because of the chromone moiety in 5´DSCG, but also because of the
connotations of both color (for dyes) and chromosomes (for nucleic acids).15
The existence of
nonamphiphilic liquid crystals has been known for some time. In 1915, Sandquist described a
system of 9-bromo-phenanthrene-3-sulfonic acid in aqueous solution that showed
NN
OO
O
O
O
Na
p-azoxyanisole
(thermotropic)
sodium dodecanoate
(lyotropic)

- 4 -
nonamphiphilic liquid crystal properties.16
5 DSCG was initially studied by Woodard and co-
workers in the 1970s17,18
and later investigated more extensively by Lydon and co-workers,4,19,20
and further by others.21-28
Figure 1.3 Examples of nonamphiphilic mesogens.
Nonamphiphilic liquid crystals have potential for a number of new applications, such as
preparation of optically anisotopic films,29
biosensing,30
controlled drug delivery,2
microptatterning,31
and nanofabrication.32
Understanding the assembly formation and the
structure-property relationships is important for designing novel nonamphiphilic mesogens,
controlling formation of nonamphiphilic LC and optimizing their properties.
1.1.2 Different assembly models of nonamphiphilic liquid crystals
Like in the case of many other nonamphiphilic LCs,10,33
there are two mesophases of
5 DSCG.18
The one formed at lower concentration shows optical textures typical for
thermotropic nematic phases and was termed the N phase. The second mesophases formed at
higher concentrations is characteristic of the amphiphile middle (hexagonal) phase and was
termed the M phase. The assembly structures of 5 DSCG in the two mesophases have been
studied by many and are still not known with certainty. The discoverers Hartshorne and
Woodard proposed a simple stacking model -- the planar molecules are arranged with their
O O
O
OO
OO
O
O
O
OHNa Na
NH
N
N
O
NH2N
O
OH
OP
OH
O
HO
OH
N
N
NaO3S
SO3Na
disodium chromoglycate
(5´DSCG)
Sunset Yellow FCF
(SSY)
deoxyguanosine-5´-monophosphate
(dGMP)

- 5 -
planes parallel or approximately parallel for the N phase and the planar discs of molecules
aggregate in cylindrical stacks which pack in a hexagonal lattice for the M phase.18
Later, a new
model was reported without any experimental results, proposing a hollow square columns of
5 DSCG filled with water.19
This paper was retracted by the author after a few years,15
even
though it is still cited in the literature sometimes.
In addition to 5 DSCG, the assembly behavior has been studied for other nonamphiphilic
molecules, including organic dyes, such as Sunset Yellow FCF (SSY), Blue 27, Direct Blue 67,
and Violet 20.10-12,34-37
The original H-stacking model for the nematic phase of these liquid
crystals is a continuous subject for discussion.15,17,18,38
For instance, a J-stacking model was
proposed,7,39-41
in which the molecules stack on an offset position by some fixed distance from
each other, instead of directly on top of each other (“H” type) (Figure 1.4).
Figure 1.4 Stacking models for nonamphiphilic mesogens.
Recently, our group reported a novel model for the assembly of nonamphiphilic molecule
5 DSCG in water, which showed that maintaining a nonamphiphilic molecular structure was
crucial to form a liquid crystal phase. This model consists of threads, instead of columns, of
5 DSCG molecules. Within each thread, the salt bridges formed between two molecules stacked
on another layer of aromatic rings, instead of simply aggregating to form molecular columns via
H-stacking J-stacking

- 6 -
π-π interaction of the aromatic rings (Scheme 1.1). Each thread is solvated with a hydration shell
of water.42
A mesogen mixing experiment was designed to validate the thread model. The
addition of mono-charged molecules attenuated or destroyed the liquid crystals phase of 5 DSCG
by acting as salt bridge terminators rather than column stackers. In contrast, adding divalent-
charged molecules retained the liquid crystal phases of 5 DSCG, suggesting two charged units in
the molecule are necessary to maintain a stable assembly and further demonstrating the thread
model.
Scheme 1.1 Thread model for the assembly of 5 DSCG in water. The drawing was adapted from
literature with modification.42
In another recent study by a previous group memeber, using self-assembled monolayers of
functionalized alkanethiols supported by anisotropic gold films with nanometer-scale
topography, it was demonstrated that uniform alignment of liquid crystals formed by hydrated
5 DSCG and Sunset Yellow molecules over a large surface area.43
This uniform alignment of
liquid crystals cannot be interpreted by the stacking assembly, but rather, by the thread assembly.
Hydration shell
O O
OO
O O
OH
O
O
O
O
Na Na
Salt bridges stacked on aromatic rings
+-+ - +-+ -
… …+-+ - +-+ -
-- --
… …+-+ - +-+ -
-- --+ ++ + ++

- 7 -
While oil-in-water emulsions (hydrophobic-hydrophilic separations) explain many
phenomena in conventional colloidal chemistry and novel fabrication methods,44-47
entirely water
soluble nonamphiphilic molecules can also exhibit phase separations in water. Water-in-water
emulsions are usually generated by mixing water-soluble and structurally different polymers, but
it was also revealed that some small nonamphiphilic molecules, such as 5 DSCG, can exhibit
phase separation with a non-ionic polymer when mixed in water.48-50
Later on, our group
demonstrated how mixing thermodynamically incompatible molecules, could promote non-
covalent polymerization and liquid crystal formation, as long as the assembly formed by
nonamphiphilic molecules was isodesmic in nature.51
1.2 Results and Discussion
1.2.1 Possible molecular conformation and assembly formation mechanism of 5 DSCG in water
We first used 1D and 2D NMR spectroscopy to investigate the conformation of 5 DSCG in
water. We noticed a clear splitting pattern for the protons at the linker region of 5 DSCG for a
1.20 wt% sample at 25 oC, which enabled us to calculate the coupling constants of these protons
and therefore the dihedral angles. Protons e and e on the methylene group at the linker are both
doublet of doublet, with coupling constants of 10.0 and 5.0 Hz; proton f on the methine group is
a quintet, with a coupling constant of 5.0 Hz (Figure 1.5A). According to the Karplus
relationship of dihedral angles and coupling constant,52,53
the dihedral angle of He-C-C-Hf and
He -C-C-Hf are the same (or very similar). In the spectrum of 2D Nuclear Overhauser effect
spectroscopy (NOESY), cross peaks between aromatic proton a and methylene protons e/e were
observed while no cross peak between proton a and proton f was present (Figure 1.5B). Because
the cross peaks connect resonances from nuclei that are spatially close to each other, it is very

- 8 -
likely that proton a is further away from proton f than from proton e/e . Based on the above data,
we proposed two possible conformations of 5 DSCG molecules in 1.20 wt% sample in water at
25 oC. If the dihedral angles of both He-C-C-Hf and He -C-C-Hf are 60 degree (Figure 1.6A),
5 DSCG is in a staggered conformation, meaning proton f is at the maximum distance from the
chromone moiety (abbreviated as “OR” in the figure). If the dihedral angles of both He-C-C-Hf
and He -C-C-Hf are 120 degree (Figure 1.6B), 5 DSCG is in an eclipsed conformation, and
proton f and the chromone moiety are in closest proximity. Even though the staggered
conformation is normally the conformational energy minimum, the repulsion between the lone
pairs on the carbonyl groups from the two “wings” of the chromone may disfavor this
conformation. The conformation of 5 DSCG under this condition is not known with certainty.
Figure 1.5 NMR spectroscopy of 1.20 wt% (~ 24 mM) 5 DSCG in water at 25 oC. (A)
1H NMR
with the linker region enlarged. (B) Partial NOESY spectrum showing the cross peaks between
proton a and proton e/e .
f
e/e’ e’/e
5.0
Hz5.0
Hz
10.0
Hz
10.0
Hz
e+e’
f
b
ca
d
A B

- 9 -
Figure 1.6 Possible conformations of 5 DSCG in water at 1.20 wt% (~ 24 mM) at 25 oC. (A)
Staggered. (B) Eclipsed.
When 5 DSCG exists as monomer in water, free rotation of the C-C bond in the linker region
should enable both protons e and e to experience identical chemical environment and therefore
appear as a doublet split by proton f in the 1H NMR. However, this is not the case observed. The
different chemical shift of protons e and e that resulted from different chemical environment
could only come from a more “locked” conformation, possibly in an assembly. We therefore
studied the effect of temperature on the chemical shift of protons in 5 DSCG (1.20 wt% in
water). If assembly exists at this concentration at 25 oC, heating might cause the assembly to
dissociate and proton peaks should shift. As shown in Figure 1.7, when the temperature of 1.20
wt% 5 DSCG sample was increased from 298 K to 363 K, all the proton peaks shifted downfield
(Figure 1.7). When the concentration decreased from 1.20 wt% to 0.45 wt%, all the peaks also
shifted downfield. In addition, the fine splitting pattern of protons e/e was lost, suggested a more
O
O
O
NaO2C
O
O
O
NaO2C
H
H
H
H
e'e
e
e'f
a
a
b
b
c
cd
d
H
OH
O
O
O
NaO2C
O
O
O
NaO2C
H
H
H
H
HHO
c
c
d
d
b
b
a
a
e
e
e'
e'
f
Red bonds are in the plane.
Blue bond points up out of the plane.
Green bond points down out of the plane.HO
H
R'
H
OR
H
f
e'e staggered
A
eclipsedOR
HH e'e
f H
HO
R'
B

- 10 -
“dynamic” conformation. These observations are in accordance with 5´DSCG forming a higher
order assembly structure in water. We also note that if 5 DSCG molecules formed assembly in
an “H-stacking”, the aromatic protons a-c would have experienced more deshielding due to the
aromatic ring current and would have shifted downfield instead of upfield upon assembly
formation. The observed upfield shift upon assembly formation (or downfield shift upon
assembly dissociation) by 5´DSCG suggested that the aromatic rings stack in an “off-set”
fashion, which agrees with the thread model.42
Figure 1.7 Temperature effect on chemical shifts of protons in 1.20 wt% (~24 mM) 5 DSCG (in
water). NMR of 0.45 wt% (~ 8.8 mM) 5 DSCG in water at 25 oC is shown for comparison. The
0.45 wt% 298 K
1.20 wt% 298 K
1.20 wt% 308 K
1.20 wt% 318 K
1.20 wt% 328 K
1.20 wt% 343 K
1.20 wt% 353 K
1.20 wt% 363 K
b c a d
f
e or e’e’ or e
HOD

- 11 -
chemical shift of the HOD peak is highly temperature-dependent and the HOD peaks at various
temperatures were calibrated to that reported in literature.54
The dependence of the chemical shift of the 5 DSCG aromatic protons on temperature was
analyzed in order to investigate the possible mechanism for the assembly formation in water
(Figure 1.8). A sudden change in the curve would suggest a cooperative self-assembly
mechanism while a smooth sigmoidal curve would suggest an isodesmic mechanism.55,56
Within
the temperature range tested, no obvious sigmoidal trend was observed for protons a-d; no
sudden change suggestive of cooperative mechanism was observed, either. It is very possible that
the solvent water limits the temperature range that could be tested and thus the plateau for a
sigmoidal curve could not be reached.57
However, the gradual, smooth increase of chemical shift
values upon heating indicates the assembly formation is more likely isodesmic than cooperative.

- 12 -
Figure 1.8 Effect of temperature on the chemical shifts of protons a-d in 5 DSCG (1.20 wt% in
water).
1.2.2 Promote the assembly formation of nonamphiphilic mesogens by thermodynamically
incompatible polymers
In a recent study, our group demonstrated LC formation of 5 DSCG molecules promoted by
addition of polymers based on thermodynamic incompatibility.51
A question arises naturally: Does
the presence of these polymers promote the assembly of 5 DSCG molecules in water directly into
liquid crystal phase (Figure 1.9, Path A) or does the presence of these polymers promote the
assembly formation by 5 DSCG before reaching the liquid crystal phase (Figure 1.9, Path B)?
7.56
7.57
7.58
7.59
7.6
7.61
7.62
7.63
7.64
298 308 318 328 338 348 358 368
δo
f H
b(p
pm
)
Temperature (K)
6.96
6.98
7
7.02
7.04
7.06
7.08
7.1
7.12
7.14
7.16
298 308 318 328 338 348 358 368
δo
f H
c(p
pm
)
Temperature (K)
6.52
6.54
6.56
6.58
6.6
6.62
6.64
6.66
6.68
6.7
6.72
298 308 318 328 338 348 358 368δ
of
Hd
(pp
m)
Temperature (K)
6.89
6.9
6.91
6.92
6.93
6.94
6.95
6.96
6.97
6.98
6.99
298 308 318 328 338 348 358 368
δo
f H
a(p
pm
)
Temperature (K)

- 13 -
Figure 1.9 Two possible pathways of the LC formation promoted by addition of polymer.
1H NMR experiments were performed to investigate at what stage the polymers promote the
liquid crystal formation of 5 DSCG in water. At ambient temperature, 5 DSCG forms LC above
~ 10-11wt%17
and SSY forms LC above ~ 25 wt%.11
We added 8 wt% polyacrylamide (PAAm,
molecular weight 10K) to aqueous 5 DSCG or SSY samples at concentrations far below the LC
formation concentrations. Upon concentration increase of SSY, the broadening of proton peaks
was a lot more significant in the presence of ~ 8 wt % of PAAm than in the absence of PAAm
(Figure 1.10). Similar phenomenon was also observed for 5 DSCG (data not shown). These
results indicated that the self-assembly by 5 DSCG or SSY was promoted by PAAm before
liquid crystal phase formed. On the contrary, for 5 -monosodium cromoglycate (5 MSCG),
which does not form LC at any concentration, the broadening of proton peaks was not much
different as the concentration increased, in the absence or presence of ~ 8 wt % of PAAm (10K)
(Figure 1.11). The similar self-assembly promoted by polymer suggested that like 5 DSCG, the
SSY may also form assembly in LC phases that can be explained by thread model.
dimer
oligomer
trimer
non-covalent polymerIsodesmic
assembly
Randomly aligned
non-covalent polymersLiquid crystal
Path B: A higher ordered
aggregation of assemblies forms
LC upon addition of polymer
Path A: LC forms directly
upon addition of polymer

- 14 -
Figure 1.10 1H NMR of SSY mixed with ~ 8 wt% of PAAm (10K) in D2O at 25
oC.
SSY PAAm (10K)
2.9 wt%
15.1 wt%
19.8 wt%
2.9 wt%
15.1 wt%
19.8 wt%
~ 8 wt%
~ 8 wt%
~ 8 wt%
0
0
0
- 15 -
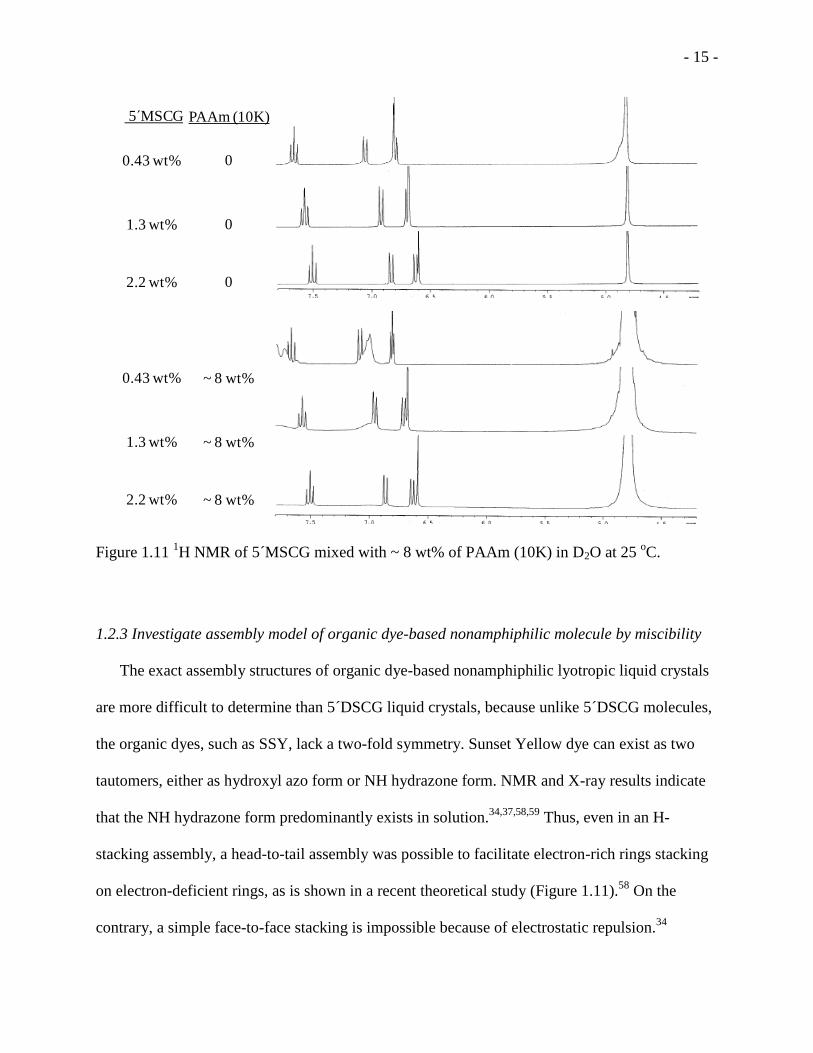
Figure 1.11 1H NMR of 5 MSCG mixed with ~ 8 wt% of PAAm (10K) in D2O at 25
oC.
1.2.3 Investigate assembly model of organic dye-based nonamphiphilic molecule by miscibility
The exact assembly structures of organic dye-based nonamphiphilic lyotropic liquid crystals
are more difficult to determine than 5 DSCG liquid crystals, because unlike 5 DSCG molecules,
the organic dyes, such as SSY, lack a two-fold symmetry. Sunset Yellow dye can exist as two
tautomers, either as hydroxyl azo form or NH hydrazone form. NMR and X-ray results indicate
that the NH hydrazone form predominantly exists in solution.34,37,58,59
Thus, even in an H-
stacking assembly, a head-to-tail assembly was possible to facilitate electron-rich rings stacking
on electron-deficient rings, as is shown in a recent theoretical study (Figure 1.11).58
On the
contrary, a simple face-to-face stacking is impossible because of electrostatic repulsion.34
5´MSCG PAAm (10K)
0.43 wt%
1.3 wt%
2.2 wt%
0.43 wt%
1.3 wt%
2.2 wt%
~ 8 wt%
~ 8 wt%
~ 8 wt%
0
0
0
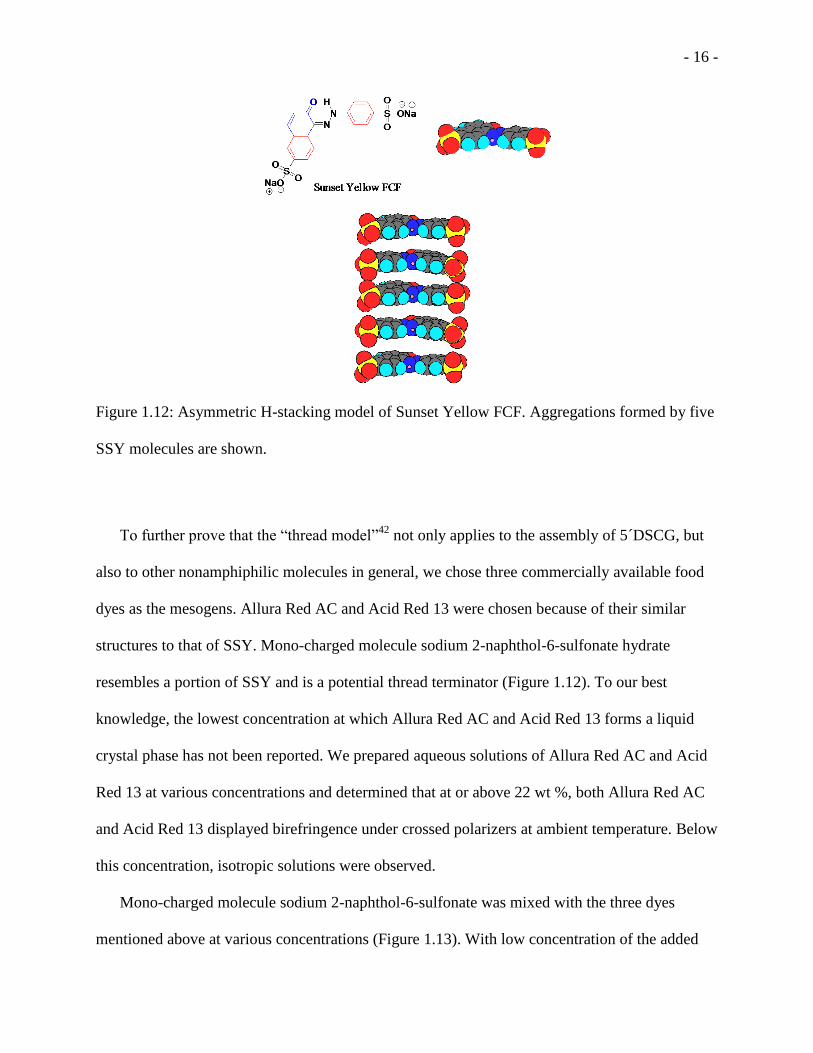
- 16 -
Figure 1.12: Asymmetric H-stacking model of Sunset Yellow FCF. Aggregations formed by five
SSY molecules are shown.
To further prove that the “thread model”42
not only applies to the assembly of 5 DSCG, but
also to other nonamphiphilic molecules in general, we chose three commercially available food
dyes as the mesogens. Allura Red AC and Acid Red 13 were chosen because of their similar
structures to that of SSY. Mono-charged molecule sodium 2-naphthol-6-sulfonate hydrate
resembles a portion of SSY and is a potential thread terminator (Figure 1.12). To our best
knowledge, the lowest concentration at which Allura Red AC and Acid Red 13 forms a liquid
crystal phase has not been reported. We prepared aqueous solutions of Allura Red AC and Acid
Red 13 at various concentrations and determined that at or above 22 wt %, both Allura Red AC
and Acid Red 13 displayed birefringence under crossed polarizers at ambient temperature. Below
this concentration, isotropic solutions were observed.
Mono-charged molecule sodium 2-naphthol-6-sulfonate was mixed with the three dyes
mentioned above at various concentrations (Figure 1.13). With low concentration of the added

- 17 -
mono-charged molecule (0.20 wt %) in SSY (30 wt %), the birefringence was reduced. As the
concentration of added mono-charged molecule increased to 0.80 wt%, the birefringence became
even less. At 1.51 wt % or higher of the added mono-charged molecule, no birefringence was
observed. At 5.19 wt % or higher of the added molecule, precipitate formed. When the mono-
charged molecule was added to Allura Red AC (22 wt %) and Acid Red 13 (22 wt %), even very
small amount of the addition of the mesogen (0.23 wt % and 0.26 wt %) destroyed the liquid
crystal phases completely. The results mentioned above indicated that the “thread model”
proposed for 5 DSCG42
could also be true for the LC phase formed by Sunset Yellow, Allura
Red AC, and Acid Red 13. Upon addition, sodium 2-naphthol-6-sulfonate acted as a salt bridge
terminator and attenuated or even annihilated the liquid crystal phase of these nonamphiphilic
dyes.
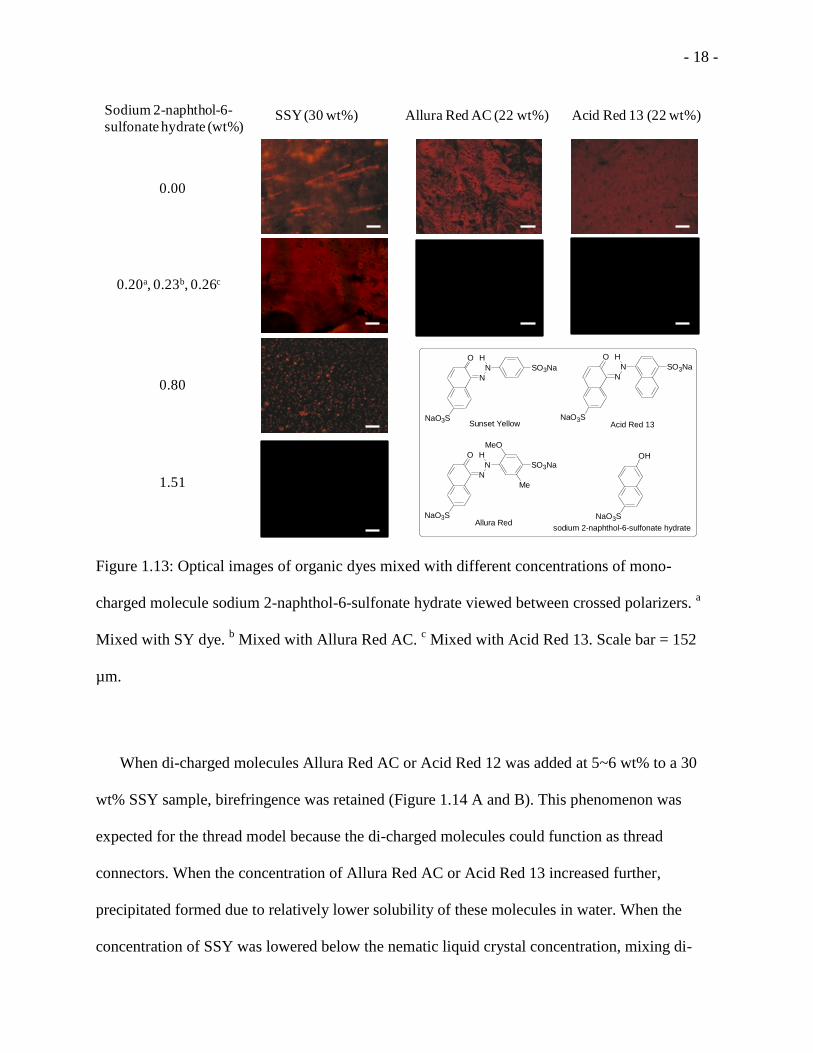
- 18 -
Figure 1.13: Optical images of organic dyes mixed with different concentrations of mono-
charged molecule sodium 2-naphthol-6-sulfonate hydrate viewed between crossed polarizers. a
Mixed with SY dye. b Mixed with Allura Red AC.
c Mixed with Acid Red 13. Scale bar = 152
µm.
When di-charged molecules Allura Red AC or Acid Red 12 was added at 5~6 wt% to a 30
wt% SSY sample, birefringence was retained (Figure 1.14 A and B). This phenomenon was
expected for the thread model because the di-charged molecules could function as thread
connectors. When the concentration of Allura Red AC or Acid Red 13 increased further,
precipitated formed due to relatively lower solubility of these molecules in water. When the
concentration of SSY was lowered below the nematic liquid crystal concentration, mixing di-
SSY (30 wt%) Allura Red AC (22 wt%) Acid Red 13 (22 wt%)
0.00
0.20a, 0.23b, 0.26c
0.80
1.51
Sodium 2-naphthol-6-
sulfonate hydrate (wt%)
O
N
NaO3SSunset Yellow
O
N
NaO3SAcid Red 13
O
N
NaO3SAllura Red
OH
NaO3S
sodium 2-naphthol-6-sulfonate hydrate
N SO3Na
HN
H
SO3Na
N
H
SO3Na
MeO
Me

- 19 -
charged molecule Allura Red AC or Acid Red 13 resulted in similar birefringence observed for
pure SSY. For example, when the concentration of SSY was reduced to as low as 14.7 wt %,
addition of 15.3 wt % Allura Red AC resulted in birefringence resembled to that formed by 30
wt % SY dye (Figure 1.14 C). Similar birefringence was observed when 14.0 wt % SSY sample
was mixed with 14.1 wt % Acid Red 13 (Figure 1.14 D). These results suggest that Allura Red
AC and Acid Red 13 not only promoted LC phase of SSY but also were thermodynamically
compatible with SSY. Therefore, the presence of Allura Red AC or Acid Red 13 promoted the
LC formation of SSY by elongating the salt bridge and further proved the validity of the thread
model.
Figure 1.14: Optical images of SY dye mixed with Allura Red AC or Acid Red 13 at different
concentrations viewed between cross polarizers. The orientation of the bars shown above the
SSY Allura Red AC
29.7 wt% 5.5 wt%
SSY Acid Red 13
29.9 wt% 5.0 wt%
SSY Allura Red AC
14.7 wt% 15.3 wt%
SSY Acid Red 13
14.0 wt% 14.1 wt%
A
B
C
D

- 20 -
images indicates the rotation angle of the samples under the cross polarizers. Scale bar = 152
µm.
1.3 Conclusion and Perspectives
In summary, 1D and 2D NMR spectroscopy revealed that 5 DSCG self-assembles into
hydrated threads via a possible isodesmic mechanism in a 1.2 wt% sample in water at 25 oC.
Similar to that by 5 DSCG, the assembly formation by nonamphiphilic molecule Sunset Yellow
FCF can also be promoted by thermodynamically incompatible polymer. In addition, miscibility
test showed that mono-charged molecule that is structurally similar to SSY annihilate LC
formation by SSY while di-charged molecules retain and promote LC formation. These results
suggest that the thread model proposed for 5 DSCG may in general explain the assembly
formation by nonamphiphilic dyes and other nonamphiphilic mesogens.
1.4 Experimental Section
Chemicals
Sunset Yellow FCF was purchased from Aldrich (Milwaukee, WI). Acid Red 13 and Allura Red AC
were purchased from TCI America. All aqueous solutions were prepared with deionized water with
a resistivity of 18.2 MΩ cm (MilliQ system, Millipore, Bedford, MA).
General procedure for preparation of optical cells and birefringence characterization
An aqueous solution of Sunset Yellow FCF (30.08 wt %) and Acid Red 13 (1.97 wt %) was prepared
and aged in a vial for 12 h to allow complete dissolution. The sample was assembled in a sandwiched
optical cell composed of two glass microscope slides with one sheet of Saran Wrap® (13-15 μm) to
afford a spacer. The sheet of Saran Wrap® was punched to create a hole to accommodate the sample
to be sandwiched between the glass slides. The sample was loaded between the slides and sealed

- 21 -
with binder clips on each side immediately to prevent the water from evaporating. The sample was
viewed and recorded between crossed and parallel polarizers on an Olympus BX51 polarizing
microscope.
General procedure for NMR study
1H spectra were recorded on a Bruker Advance DPX-300 spectrometer. Chemical shifts are reported
in ppm, using tetramethylsilane as the internal standard. NOESY spectra were recorded on a Bruker
Advance DRX-500 spectrometer.
- 22 -
Chapter 2
Stereochemical Control of Nonamphiphilic Liquid Crystals: Effect of Chiral Mesogens and
Dopants on Assemblies Separated by Six Nanometers of Aqueous Solvents
Summary
Unlike conventional thermotropic and lyotropic liquid crystals, the chromonic liquid
crystals consist of hydrated assemblies of nonamphiphilic molecules that are aligned with a
separation of about 6 nm between assemblies in an aqueous environment. This separation raises
the question of what the assembly structure would be for a chiral nematic (or cholesteric) phase
of this class of liquid crystals as the assemblies need to interact with each other that are about 6
nm apart. Here, we report the synthesis of three stereoisomers of disodium chromonyl
carboxylate derivative, 5 DSCG-diviol, and the correlation between the molecular structure, bulk
assembly and liquid crystal formation. Circular dichroism indicated a chiral conformation with
bisignate Cotton effect. Nuclear Overhauser Effect in proton NMR spectroscopy revealed
conformations that are responsible for liquid crystal formation. Cryogenic transmission electron
microscopy showed that chiral 5 DSCG-diviols form assemblies with crossings. We observed
that the chiral isomers formed chiral nematic liquid crystals while the achiral isomer 5 DSCG-
meso-diviol did not form any kind of liquid crystals. While generic 5 DSCG in water aligns
uniformly on SAMs supported by obliquely deposited gold films, 5 DSCG-(R,R)-diviol 1a
exhibited nonuniform alignment of on the same surfaces. Fingerprint texture of 18 wt%
5 DSCG-(R,R)-diviol can be observed with thick cell. Together, these results suggest that the
hydrated assemblies of chiral molecule 5 DSCG-(R,R)-diviol 1a interact with each other while
being separated by relatively large distance (6 nm) in water, causing a lyotropic chiral nematic
liquid crystal phase. These studies suggest that hydrated assemblies of chiral 5 DSCG-diviol can
- 23 -
interact with each other across a 6 nm separation in an aqueous environment, exhibiting a liquid
crystal phase with features that may indicate some type of chiral organization.
2.1 Background and Significance
2.1.1 Cholesteric liquid crystal phase
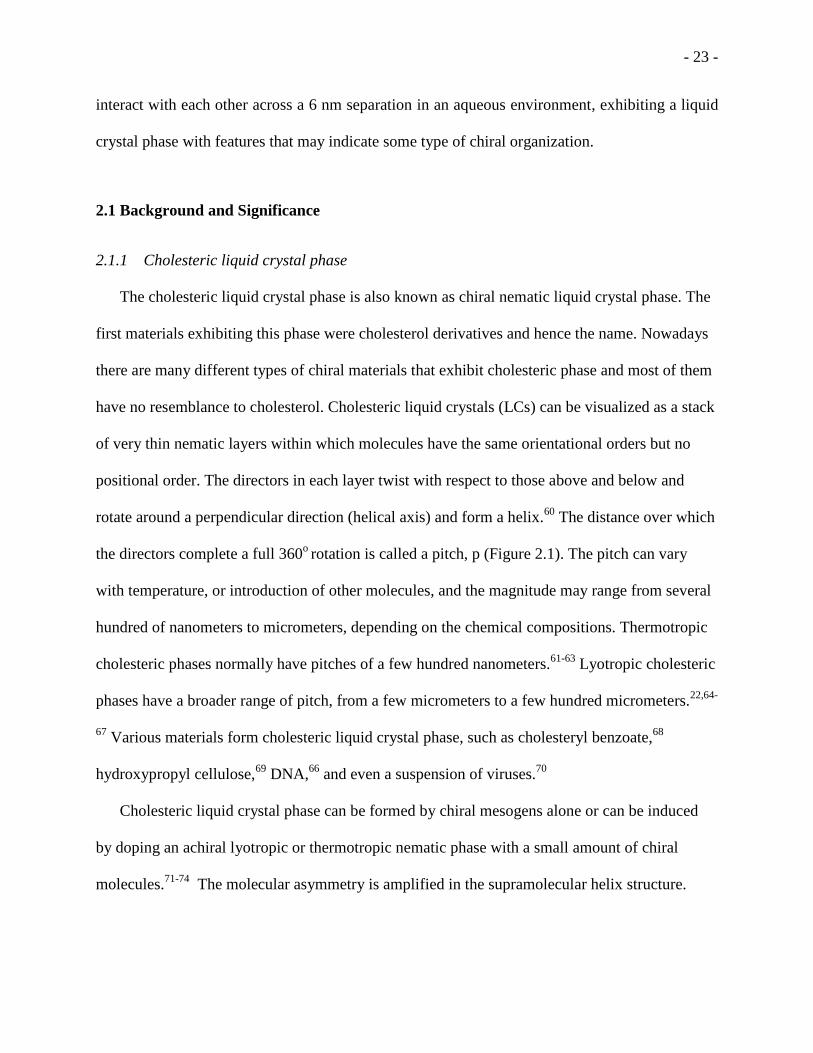
The cholesteric liquid crystal phase is also known as chiral nematic liquid crystal phase. The
first materials exhibiting this phase were cholesterol derivatives and hence the name. Nowadays
there are many different types of chiral materials that exhibit cholesteric phase and most of them
have no resemblance to cholesterol. Cholesteric liquid crystals (LCs) can be visualized as a stack
of very thin nematic layers within which molecules have the same orientational orders but no
positional order. The directors in each layer twist with respect to those above and below and
rotate around a perpendicular direction (helical axis) and form a helix.60
The distance over which
the directors complete a full 360o rotation is called a pitch, p (Figure 2.1). The pitch can vary
with temperature, or introduction of other molecules, and the magnitude may range from several
hundred of nanometers to micrometers, depending on the chemical compositions. Thermotropic
cholesteric phases normally have pitches of a few hundred nanometers.61-63
Lyotropic cholesteric
phases have a broader range of pitch, from a few micrometers to a few hundred micrometers.22,64-
67 Various materials form cholesteric liquid crystal phase, such as cholesteryl benzoate,
68
hydroxypropyl cellulose,69
DNA,66
and even a suspension of viruses.70
Cholesteric liquid crystal phase can be formed by chiral mesogens alone or can be induced
by doping an achiral lyotropic or thermotropic nematic phase with a small amount of chiral
molecules.71-74
The molecular asymmetry is amplified in the supramolecular helix structure.

- 24 -
Figure 2.1 Schematic representation of the cholesteric liquid crystal phase.
2.1.2 Chiral chromonic liquid crystals
There have been many reports on cholesteric liquid crystals formed by either conventional
thermotropic75-79
or lyotropic65,66,72,80-82
mesogens. The mechanism of how a chiral nematic phase
arises for lyotropic liquid crystals is still poorly understood.60,72,83-85
The most intriguing aspect is
that as lyotropic liquid crystals are formed by organized assemblies of molecules in a solvent, the
effect of chiral dopants or chiral mesogens must transmit across the solvent between assemblies,
and pivot the orientation of the assemblies as a whole continuously throughout the sample.72,85
How the chiral assemblies interact with the solvent molecules surrounding them and influence
the neighboring assemblies over distance is unclear. There are few reports on chiral mesogens
that form chromonic liquid crystal phase, but several reports examined chromonic liquid crystal
phases influenced by chiral dopants that have an interaction over 6 nm between the molecular
assemblies.22,23,64,86
To investigate how stereochemistry controls the assembly structure and liquid crystal
formation, we designed and synthesized three stereoisomers of derivatives of disodium
chromonyl carboxylates (5 DSCG-diviol) which posses a diviol linker (Figure 2.2), and
demonstrated a strong correlation between molecular structures and assembly properties, as well
½ helical pitch

- 25 -
as the ability of the molecules to form liquid crystals. We also present evidence for a liquid
crystal phase that requires chemical communication across a distance of 5-6 nm of the aqueous
solvent, and is perhaps different from the conventional cholesteric liquid crystal phase.
Figure 2.2 The structures of the chiral isomers 5 DSCG-(R,R)-diviol 1a, 5 DSCG-(S,S)-diviol
1b, and achiral isomer 5 DSCG-meso-diviol 1c.
2.2 Results and Discussion
2.2.1 Design and synthesis of the stereoisomers of 5 DSCG-diviols
The generic 5 DSCG exhibits a wide range of liquid crystal properties in water that are
unmatched by conventional lyotropic liquid crystals that are made of amphiphilic
molecules.12,38,42
Several other fused aromatic dye-based molecules also form assemblies and
chromonic liquid crystals in water, but 5 DSCG forms liquid crystal phases at lower
concentration with higher birefringence compared to other dye-based molecules.12
To explore the
structural requirement for chromonic liquid crystal phase formation, our group recently screened
O
O O
OH OH
O
O
O
NaO2C CO2Na
5'DSCG-(R,R)-diviol 1a
O
O O
OH OH
O
O
O
NaO2C CO2Na
5'DSCG-(S,S)-diviol 1b
O
O O
OH OH
O
O
O
NaO2C CO2Na
5'DSCG-meso-diviol 1c

- 26 -
a series of dichromonyl molecules, and found an optically inactive mixture of stereoisomers that
exhibited polymorphism, of which upon rapid cooling resulted in a nematic liquid crystal phase
whereas aging at ambient temperature resulted in precipitation. This mixture consists of three
stereoisomers: a pair of enantiomers (52%), 5 DSCG-(R,R)-diviol 1a and 5 DSCG-(S,S)-diviol
1b; and an achiral compound (48%), 5 DSCG-meso-diviol 1c.42
The precipitates obtained from
the above sample after aging overnight were comprised of a mixture of all three stereoisomers,
and thus spontaneous resolution87,88
was not achieved. To study the effect of stereochemistry on
assembly and liquid crystal formation, we synthesized each stereoisomer individually.
The synthesis of the chiral isomers 5 DSCG-(R,R)-diviol and 5 DSCG-(S,S)-diviol was
accomplished using the same route (Scheme 2.1), but started with L-(-)-arabitol and D-(+)-
arabitol, respectively. For brevity, the synthesis of 5 DSCG-(R,R)-diviol 1a is described below.
2,4-Dihydroxypentane-1,5-diyl bis-(2,4,6-triisopropyl-1-benzenesulfonate) 6a was obtained in 5
steps starting from L-(-)-arabitol.89,90
Regioselective acetonization of L-(-)-arabitol afforded
diacetal 2a, which reacted with 1,1 -thiocarbonyldiimidazole to give compound 3a.
Deoxygenation of 3a lead to compound 4a and deacetionization afforded (2R,4R)-pentane-
1,2,4,5-tetraol 5a, which was then converted to bis-sulfonate 6a. Acetonization of bis-sulfonate
6a provided acetal 7a followed by iodination that produced diiodide 8a. Deacetionization of 8a
yielded diiodo diol 9a which was treated directly with excess of 2,6-dihydroxyacetophenone to
give the substitution adduct 10a. A two-step cyclization sequence from modified conditions91
built the chromonyl ring of diester 11a. First, hydroxyl ketone 10a was added to a mixture of
sodium methoxide and dimethyl oxalate in a solvent mixture of Et2O and MeOH (2:1 by volume)
and the reaction mixture was refluxed overnight. Acidification of the reaction mixture gave a
yellow precipitate. Second, the yellow precipitate was treated with concentrated hydrochloric

- 27 -
acid under reflux in methanol to give dichromonyl ester 11a. We note that the use of this mixed
solvent system was critical for obtaining useful yields. Basic hydrolysis of dichromonyl ester 11a
with stoichiometric amount of sodium hydroxide provided the final product 5 DSCG-(R,R)-
diviol 1a.
Scheme 2.1 Synthesis of 5 DSCG-(R,R)-diviol 1a and 5 DSCG-(S,S)-diviol 1b.a
aTPS = Triisopropylbenzenesulfonyl.
Using xylitol as the starting material to attain desired meso stereochemistry, 5 DSCG-meso-
diviol was synthesized with a modified synthetic route from that for the chiral stereoisomers
(Scheme 2.2) because the same route was not effective to prepare the meso isomer. The
preparation of tetraol 5c was essentially the same to that of 5a/5b. However, the reaction of
tetraol 5c and TPSCl only provided mono-protection product. There was also a trace amount of
byproduct due to the cyclization of the mono-protection product. The different steps included
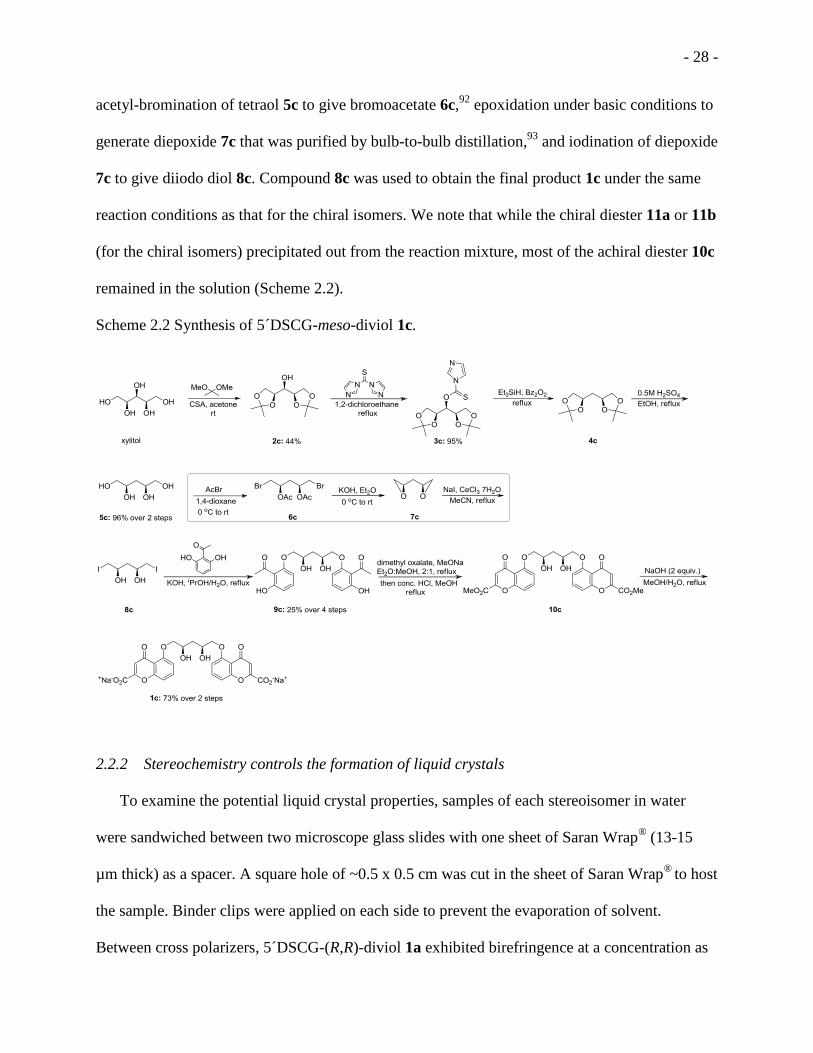
- 28 -
acetyl-bromination of tetraol 5c to give bromoacetate 6c,92
epoxidation under basic conditions to
generate diepoxide 7c that was purified by bulb-to-bulb distillation,93
and iodination of diepoxide
7c to give diiodo diol 8c. Compound 8c was used to obtain the final product 1c under the same
reaction conditions as that for the chiral isomers. We note that while the chiral diester 11a or 11b
(for the chiral isomers) precipitated out from the reaction mixture, most of the achiral diester 10c
remained in the solution (Scheme 2.2).
Scheme 2.2 Synthesis of 5 DSCG-meso-diviol 1c.
2.2.2 Stereochemistry controls the formation of liquid crystals
To examine the potential liquid crystal properties, samples of each stereoisomer in water
were sandwiched between two microscope glass slides with one sheet of Saran Wrap® (13-15
µm thick) as a spacer. A square hole of ~0.5 x 0.5 cm was cut in the sheet of Saran Wrap®
to host
the sample. Binder clips were applied on each side to prevent the evaporation of solvent.
Between cross polarizers, 5 DSCG-(R,R)-diviol 1a exhibited birefringence at a concentration as

- 29 -
low as 12.0 wt% (with a mole ratio of water to mesogen of 226:1) at ambient temperature, about
21 °C (Figure 2.3 A). At the same concentration (12.0 wt%), 5 DSCG-(S,S)-diviol 1b showed
liquid crystals phase at 18 °C (Figure 2.3 B). We believed that this small difference in phase
behavior between the (R,R)- and (S,S)- isomers may be caused by the miniscule difference in
purity such as small amounts of salts that are beyond the measurement of NMR. Salts are known
to change the nematic-isotropic transition temperature of liquid crystals formed by 5 DSCG.28
The achiral stereoisomer 5 DSCG-meso-diviol 1c was a mixture of isotropic solution and a small
amount of insoluble solid at the same concentration (12.0 wt%) (Figure 2.3 C). Furthermore,
rapid cooling did not induce liquid crystal formation in this sample. This result indicates that
5 DSCG-meso-diviol 1c is either less capable or incapable of forming liquid crystals, which
likely contributes to the fact that the mixture of all three stereoisomers requires a lower
temperature or a higher concentration than the individual chiral stereoisomers to form a liquid
crystal phase. We note that 5 DSCG-meso-diviol 1c has lower water solubility than the chiral
isomers 5 DSCG-(R,R)-diviol 1a and 5 DSCG-(S,S)-diviol 1b.
Figure 2.3 Optical images (cross polarizers) of 12.0 wt % 5 DSCG-(R,R)-diviol 1a (A),
5 DSCG-(S,S)-diviol 1b (B), and 5 DSCG-meso-diviol 1c (C) in water sandwiched between two
glass slides (spacer: 13-15 µm). Samples were freshly prepared by dissolving solid in water at
ambient temperature. Scale bar = 76 µm.
A
5 DSCG-meso-diviol5 DSCG-(S,S)-diviol5 DSCG-(R,R)-diviol
B C

- 30 -
2.2.3 Stereoisomers of 5 DSCG-diviols exhibit different polymorphism
To explore liquid crystal formation without any cooling, we prepared 18.0 wt% 5 DSCG-
(R,R)-diviol 1a and 18.1 wt % 5 DSCG-(S,S)-diviol 1b (Figure 2.4 A and B). Both of these
chiral 5 DSCG-diviols exhibited birefringence over the entire sample prepared at ambient
temperature. In contrast, 5 DSCG-meso-diviol 1c at this concentration resulted in an isotropic
solution with insoluble solids (Figure 2.4 C). Rapid cooling of this sample did not induce liquid
crystal formation. After aging overnight at ambient temperature in vials sealed with parafilm to
prevent evaporation, we observed that the chiral and meso 5 DSCG-divol resulted in different
assemblies. The sample of 18.0 wt% 5 DSCG-(R,R)-diviol 1a became a mixture of liquid
crystals with small precipitates, whereas 18.1 wt% 5 DSCG-(S,S)-diviol 1b remained a mixture
of liquid crystals and isotropic solution (Figure 2.4 D and E). Under the same conditions, 18.0
wt% of 5 DSCG-meso-diviol 1c in water remained a mixture of isotropic solution and aggregates
(Figure 2.4 F). In comparison, the polymorphism of the individual enantiomer was different from
that observed in the earlier work of an optically inactive mixture of all three stereoisomers (a
mixture of 52% racemic mixture and 48% meso isomer): a freshly prepared sample of 18.0 wt%
of mesogens transitioned from an isotropic solution to liquid crystal phase by rapid cooling to 15
oC without observable precipitates, whereas isothermal aging gives precipitates in isotropic
solution. Together, these results suggest that, for the optically inactive mixture,42
the liquid
crystal phase represents a local energy minimum, and the precipitation in isotropic solution is of
a global minimum in the energy profile.
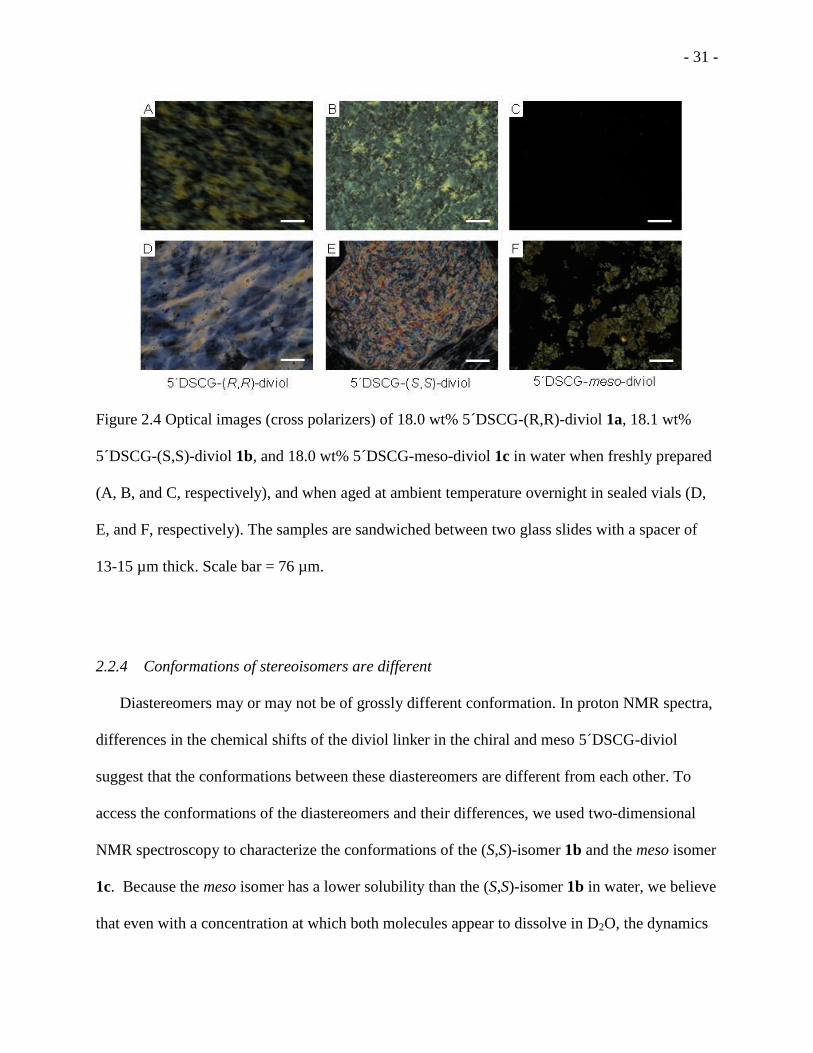
- 31 -
Figure 2.4 Optical images (cross polarizers) of 18.0 wt% 5 DSCG-(R,R)-diviol 1a, 18.1 wt%
5 DSCG-(S,S)-diviol 1b, and 18.0 wt% 5 DSCG-meso-diviol 1c in water when freshly prepared
(A, B, and C, respectively), and when aged at ambient temperature overnight in sealed vials (D,
E, and F, respectively). The samples are sandwiched between two glass slides with a spacer of
13-15 µm thick. Scale bar = 76 µm.
2.2.4 Conformations of stereoisomers are different
Diastereomers may or may not be of grossly different conformation. In proton NMR spectra,
differences in the chemical shifts of the diviol linker in the chiral and meso 5 DSCG-diviol
suggest that the conformations between these diastereomers are different from each other. To
access the conformations of the diastereomers and their differences, we used two-dimensional
NMR spectroscopy to characterize the conformations of the (S,S)-isomer 1b and the meso isomer
1c. Because the meso isomer has a lower solubility than the (S,S)-isomer 1b in water, we believe
that even with a concentration at which both molecules appear to dissolve in D2O, the dynamics

- 32 -
of the two molecules in solution may not be the same. For this reason, we focused on using
ROESY to characterize the structure to avoid the potential null of NOE signals due to the
dynamics of the molecules.94 We observed large differences in the NOE correlations in the
ROESY spectra for the diviol bridge region between the two diastereomers in D2O (Figure 2.5).
For 0.503 wt% of 5 DSCG-(S,S)-diviol 1b, NOE between protons g and e (and e ), and between
g and f were observed with similar peak intensities. This result suggests that these protons (g and
e/e , and g and f) may be in close proximity by similar distances. In contrast, for 5 DSCG-meso-
diviol 1c at the same wt%, protons g and g on the same methylene group were in different
chemical environment, and thus exhibited different chemical shifts. More importantly, one of the
“g” protons showed weak NOE correlation with only one of the “e” protons. The other “g”
proton exhibited NOE correlation with both of the “e” protons, with strong and weak NOE signal
intensities, respectively (Figure 2.6). These NOEs indicate that one of the “g” protons was in
close proximity to only one of the “e” protons, whereas the other “g” proton was close in space
to both of the “e” protons. These results suggest that the diviol linker region in the meso isomer
is twisted through certain preferred bond rotation angle. Together, these spacing of protons in the
two diastereomers suggests that 5 DSCG-(S,S)-diviol 1c likely adopts an overall “stretched”
conformation while 5 DSCG-meso-divol 1c is more of a “folded” conformation. These
conformational differences also appear to be consistent with the low solubility of the meso
isomer 1c and the formation of thread assemblies by the (S,S)-isomer 1b.

- 33 -
Figure 2.5 ROESY of 0.503 wt% of 5 DSCG -(S,S)-diviol 1b and 0.503 wt% of 5 DSCG-meso-
diviol 1c in D2O at 25 oC.
5'DSCG-(S,S)-diviol 5'DSCG-meso-diviol
f e/e'
g
f e/e'
g or g '
e/e'
f
d
bc
a
O
O O
OH OH
O
O
O
H H g
O
O O
ONa Na
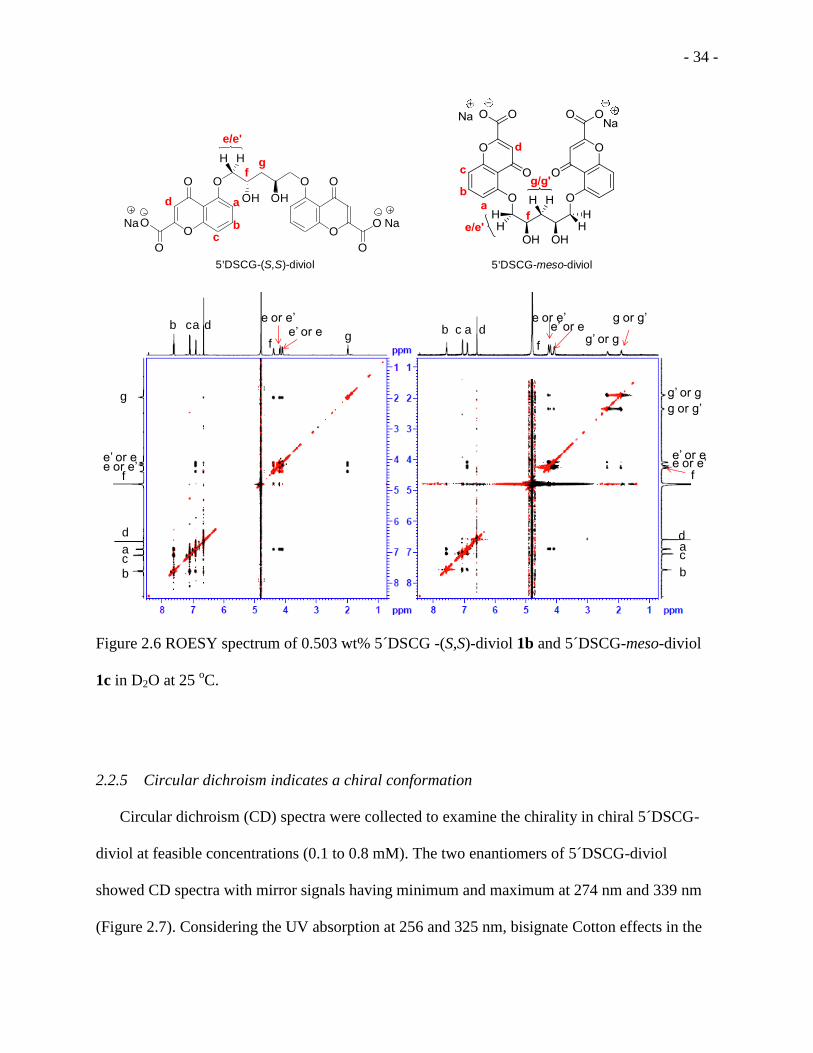
- 34 -
Figure 2.6 ROESY spectrum of 0.503 wt% 5 DSCG -(S,S)-diviol 1b and 5 DSCG-meso-diviol
1c in D2O at 25 oC.
2.2.5 Circular dichroism indicates a chiral conformation
Circular dichroism (CD) spectra were collected to examine the chirality in chiral 5 DSCG-
diviol at feasible concentrations (0.1 to 0.8 mM). The two enantiomers of 5 DSCG-diviol
showed CD spectra with mirror signals having minimum and maximum at 274 nm and 339 nm
(Figure 2.7). Considering the UV absorption at 256 and 325 nm, bisignate Cotton effects in the
e/e'
f
d
bc
a
O
O O
OH OH
O
O
O
H H g
O
O O
ONa Na
5'DSCG-(S,S)-diviol 5'DSCG-meso-diviol
acb
f
e or e’e’ or ed
g or g’
g’ or gacb
f
e or e’e’ or e g
d
ac
b
d
e or e’e’ or e
f
g
ac
b
d
e or e’e’ or e
f
g’ or g
g or g’

- 35 -
π-π* transition were observed in the CD spectra for 5´DSCG-(R,R)-diviol 1a (8 × 10⁻⁴
M) with a
positive effect at 339 nm and a negative effect at 274 nm (Figure 2.7). Although bisignate Cotton
effect may suggest the presence of ordered chiral assembly,95,96
temperature-dependence study
(Figure 2.8) showed insignificant decrease in the intensity of CD signal as the temperature
increased from 5 oC to 85
oC. Furthermore, in a concentration-dependent study of the absorbance
by 5 DSCG-(R,R)-diviol 1a in water, a near constant molar absorptivity was observed at 325 nm
in the concentration ranging from 5 µM to 1.6 mM using 1 mm- and 1 cm-path curvettes (data
not shown). Together, these results suggest that at this concentration range (<1.6 mM) the
molecules are mostly in the monomeric state, and that the chiral conformation is stable at
relatively high temperature. However, in a study of concentration-dependent chemical shift in
NMR, we observed significant peak broadening and an upfield chemical shift in the proton NMR
of 5 DSCG-(R,R)-diviol 1a in D2O as the concentration was increased from 0.02 wt% (400 µM)
to 3.5 wt% (72 mM) (Figure 2.9). The peak broadening resulted from a significant reduction in
the molecular mobility due to aggregation and the upfield chemical shift is in accordance with
the thread model assembly in which the aromatic rings stack in an “off-set” fashion (also see
Section 1.2.1). Considering the upper limit of concentration that could be detected by the CD
spectrometer used, it is plausible to suggest that chiral assemblies of 5 DSCG-(R,R)-diviol 1a
indeed form at relatively high concentrations (at least at above 20 mM).

- 36 -
Figure 2.7 UV spectrum of 5 DSCG-(R,R)-diviol 1a (dot line) and CD spectra of 5 DSCG-(R,R)-
diviol 1a (solid line) and 5 DSCG-(S,S)-diviol 1b (dash line) in water (8 × 10⁻⁴
M) at 5 oC.
Spectra were taken in a 1 mm path length cuvette.
Figure 2.8 Temperature-dependent CD spectra of 5 DSCG-(R,R)-diviol 1a in water (8 × 10⁻⁴
M).
Spectra were taken in a 1 mm path length cuvette.
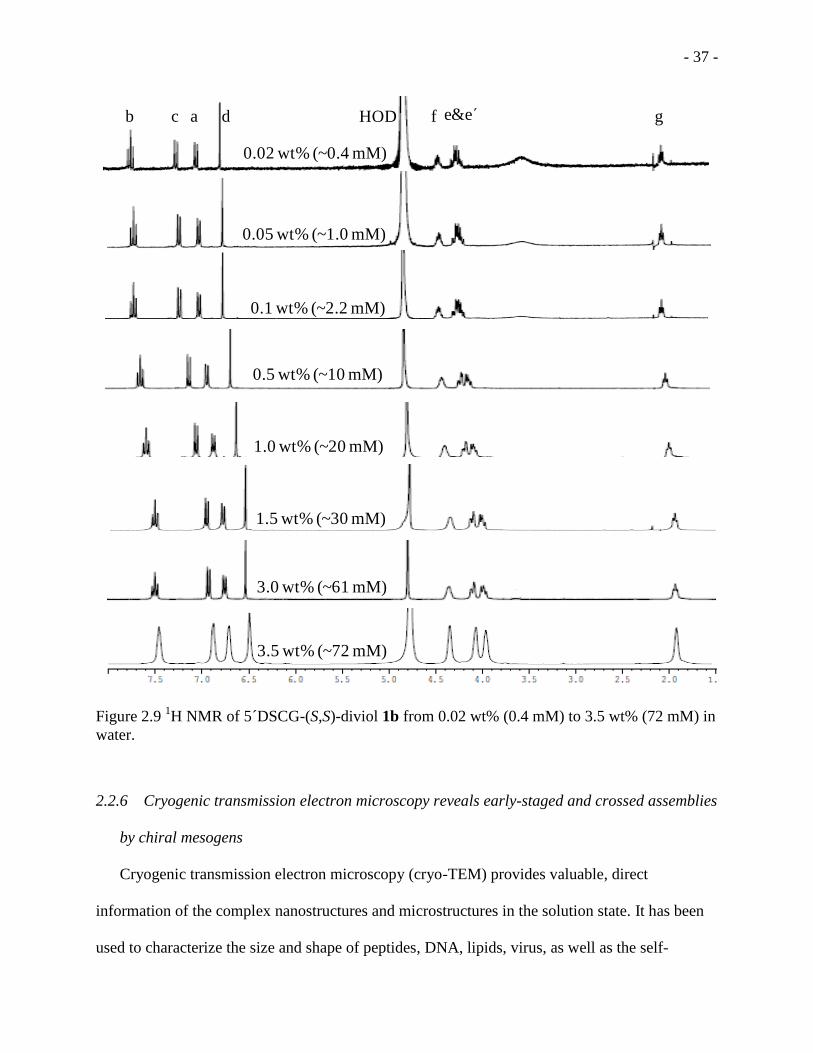
- 37 -
Figure 2.9 1H NMR of 5 DSCG-(S,S)-diviol 1b from 0.02 wt% (0.4 mM) to 3.5 wt% (72 mM) in
water.
2.2.6 Cryogenic transmission electron microscopy reveals early-staged and crossed assemblies
by chiral mesogens
Cryogenic transmission electron microscopy (cryo-TEM) provides valuable, direct
information of the complex nanostructures and microstructures in the solution state. It has been
used to characterize the size and shape of peptides, DNA, lipids, virus, as well as the self-
0.5 wt% (~10 mM)
3.5 wt% (65 mM) 5´DSCG-(S,S)-
diviol
0.1 wt% (~2.2 mM)
1.0 wt% (~20 mM)
cc
0.02 wt% (~0.4 mM)
1.5 wt% (~30 mM)
3.0 wt% (~61 mM)
3.5 wt% (~72 mM)
b c a d f e&e´ g
0.05 wt% (~1.0 mM)
HOD

- 38 -
assembly of polymers, surfactants, and liquid crystals.28,97
To access the assembly structure of
the chiral mesogens, we compared the cryo-TEM images of the 5 DSCG-(R,R)-diviol 1a and the
generic 5 DSCG at concentrations below and above which assemblies form (Figure 2.10-2.13).
Figure 2.10 Cryogenic transmission electronic microscopic image of 5.5 wt% (488) 5 DSCG
(inside the curved edge). (Mole ratio) indicates water/5 DSCG.

- 39 -
Figure 2.11 Cryogenic transmission electronic microscopic image of 5.0 wt% (587) 5 DSCG-
(R,R)-diviol 1a (inside the curved edge). (Mole ratio) indicates water/5 DSCG-(R,R)-diviol.
Figure 2.12 Cryogenic transmission electronic microscopic image of 8.2 wt% (321) 5 DSCG
(inside the curved edge). (Mole ratio) indicates water/5 DSCG.

- 40 -
Figure 2.13 Cryogenic transmission electronic microscopic image of 8.8 wt% (321) 5 DSCG-
(R,R)-diviol 1a(inside the curved edge). (Mole ratio) indicates water/5 DSCG-(R,R)-diviol.
A past study of small angle neutron scattering showed that the assembly structure started to
appear for 5 DSCG at about 5-6 wt%.42
Thus, we chose 5 DSCG (5.5 wt%, mole ratio of water
molecules to mesogens is 488) and 5 DSCG-(R,R)-diviol 1a (5.0 wt%, mole ratio of water to
mesogen is 587) to compare the early stage features of the molecular assembly. We note that the
sample of chiral mesogen 5 DSCG-(R,R)-diviol 1a had a lower concentration than the one with
achiral mesogen 5 DSCG. Interestingly, assemblies were more visible in the 5 DSCG-(R,R)-
diviol 1a samples, whereas mostly blocks of assemblies with about 5-7 nm gap were observed in
the 5 DSCG samples (Figure 2.14). These results indicate that the chiral mesogen 5 DSCG-
(R,R)-diviol 1a form assemblies at a lower concentration than that by 5 DSCG. At these
concentrations, a liquid crystal phase was not observed for either of the samples, and the
supramolecular assembly structures appeared to be connected by “blocks” of assemblies.

- 41 -
Although supramolecular assemblies were visible in the 5 DSCG-(R,R)-diviol 1a samples, they
were randomly oriented, consistent with a sample of isotropic solution at this concentration.
Figure 2.14 Cryo-TEM images of 5.5 wt% of 5 DSCG, and 5.0 wt% of 5 DSCG-(R,R)-diviol 1a.
Numbers in the parentheses indicate mole ratio of water and mesogens in the sample. The red
dash lines indicate the thread-like assembly. Scale bar = 10 nm.
As the concentration of 5 DSCG-(R,R)-diviol 1a increased to 8.8 wt%, the assemblies were
more elongated and more aligned with each other than those observed in samples at lower
concentrations (Figure 2.15). This elongation of the assemblies as the concentration increases is
consistent with the notion of an isodesmic assembly,35,56
for which there is no critical
concentration for assembly but the observed blocks of assemblies continue to grow to form
assembly. The cryo-TEM images also showed that the aligned assembly structures were
separated by about 6 nm, and the alignment between the assemblies was uniform over at least
hundreds of nanometers. Interestingly, there were more crossings between the assemblies formed
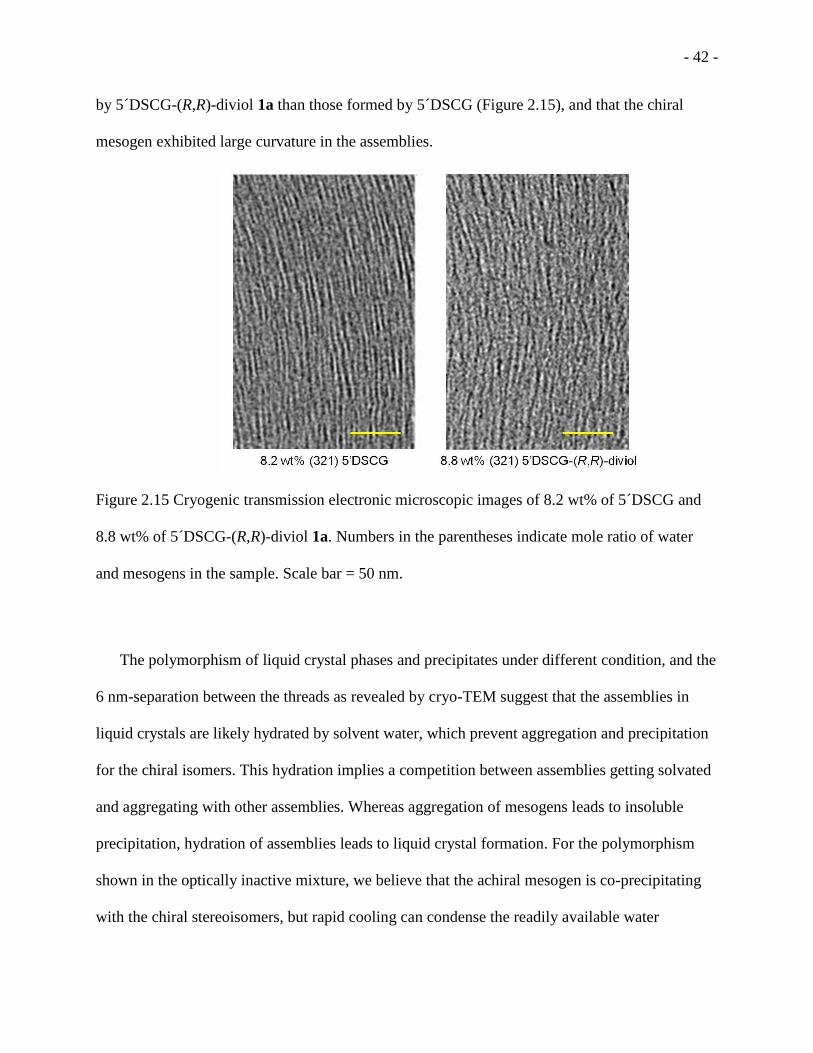
- 42 -
by 5 DSCG-(R,R)-diviol 1a than those formed by 5 DSCG (Figure 2.15), and that the chiral
mesogen exhibited large curvature in the assemblies.
Figure 2.15 Cryogenic transmission electronic microscopic images of 8.2 wt% of 5 DSCG and
8.8 wt% of 5 DSCG-(R,R)-diviol 1a. Numbers in the parentheses indicate mole ratio of water
and mesogens in the sample. Scale bar = 50 nm.
The polymorphism of liquid crystal phases and precipitates under different condition, and the
6 nm-separation between the threads as revealed by cryo-TEM suggest that the assemblies in
liquid crystals are likely hydrated by solvent water, which prevent aggregation and precipitation
for the chiral isomers. This hydration implies a competition between assemblies getting solvated
and aggregating with other assemblies. Whereas aggregation of mesogens leads to insoluble
precipitation, hydration of assemblies leads to liquid crystal formation. For the polymorphism
shown in the optically inactive mixture, we believe that the achiral mesogen is co-precipitating
with the chiral stereoisomers, but rapid cooling can condense the readily available water
- 43 -
molecules around the newly formed assembly to insulate the assemblies from aggregating, and
thus facilitate liquid crystal formation.
2.2.7 Nonuniform alignment formed by 5 DSCG-(R,R)-diviol
We note that this chiral mesogen in water at the concentrations studied did not give a
conventional fingerprint texture of the classical cholesteric liquid crystal phase.98
In addition,
without a magnetic field alignment, we did not observe the fingerprint texture of achiral 5’DSCG
mixed with small chiral dopants.22
To examine the liquid crystal phases comprised of chiral
mesogens, we used a surface that can align the generic 5 DSCG liquid crystal uniformly over a
large area and explored if a uniform alignment could also be obtained for the liquid crystals
formed by the chiral 5 DSCG-(R,R)-diviol 1a. Any chiral phase of a liquid crystal will not give a
uniform single-colored texture over the entire liquid crystal sample because of the continuous
change in the molecular orientation in the chiral nematic phase. Thus, a surface that can align a
nematic phase uniformly99,100
is a useful tool to determine whether a chiral nematic phase exists
or not. We have recently reported uniform alignment of 5 DSCG liquid crystal on surfaces
presenting self-assembled monolayers (SAMs) of functionalized alkanethiols supported on gold
films that were deposited onto glass slides at an incident angle oblique from the surface normal
of the glass slides. When sandwiched between two such surfaces, hydrated molecular assemblies
of 5 DSCG and Sunset Yellow dye aligned in parallel to the surface of the SAMs, and uniformly
in a preferred direction over the entire sample.43
For classical cholesteric liquid crystal samples, the characteristic fingerprint texture can often
be observed by chiral mesogens or by achiral mesogens mixed with a chiral dopant. Here, we
also compared the liquid crystal formed by chiral 5’DSCG-diviol 1a and by achiral 5’DSCG

- 44 -
mixed with a small chiral molecule. In this work, using the same surfaces (two SAMs of
HS(CH2)10(OCH2CH2)3OH on gold films that were deposited with a 45° incident angle),43
16.8
wt% 5 DSCG in water gave a uniform alignment (Fig 2.16 D), which exhibited a strong
modulation in the intensity of transmitted light when the sample is rotated with respect to either
one of the crossed polarizers. Uniform alignment was observed as expected for 14.1 wt%
5 DSCG mixed with 14.5 wt% achiral molecule xylitol (Figure 2.16 E). When 13.4 wt%
5 DSCG was mixed with a racemic mixture of D- and L-mannitol (8.1 wt% of each), uniform
alignment of liquid crystal phase was observed (Figure 2.16 F). On the contrary, a nonuniform
alignment was observed for a sample containing 13.4 wt% 5 DSCG doped with 16.2 wt%
enantiomerically pure D-mannitol (Figure 2.16 G). Two areas of different colors that switched
between bright and dark were observed as the sample was rotated between the cross polarizers.
Using the liquid crystal cell with the same monolayers, the 5 DSCG-(R,R)-diviol 1a (18.0
wt%) liquid crystal sample also exhibited non-uniform alignments with two domains of different
orientations (Figure 2.16 H). We note that all the samples were warmed to above liquid crystal-
isotropic transition temperature to remove potential effect of viscosity or flow on the liquid
crystal alignment. Because of the 6 nm solvent separation between the assemblies, this technique
cannot predict if the neighboring assemblies of the chiral molecules can twist relative to each
other in the aqueous solution. However, uniform alignment of liquid crystal is not obtained for
chiral lyotropic mesogens. This result suggests this liquid crystal phase may have chiral features,
perhaps different from those of the classical cholesteric phase.

- 45 -
Figure 2.16 (A). Geometry of gold deposition on glass slides at an oblique angle from the surface
normal. (B). Scheme of self-assembly molecules (SAMs) formed by HS(CH2)10(OCH2CH2)3OH.
(C). Schematic representation of uniform alignment of threads of 5 DSCG liquid crystal on
16.8 wt% (141)
5 DSCG
D
14.1 wt% (141) 5'DSCG +
14.5 wt% (41) xylitol
E
S
O
O
O
S
O
O
O
S
O
O
O
HO HO HO
Au
Au
S(CH2)10(OCH2CH2)3OH45o Au
S(CH2)10(OCH2CH2)3OH45o Au
A B C
45o
13.4 wt% (149) 5'DSCG +
8.1 wt% (88) D-mannitol + 8.1 wt% (88) L-mannitol
13.4 wt% (149) 5'DSCG +
16.2 wt% (44) D-mannitol
18.0 wt% (141)
5 DSCG-(R,R)-diviol
G
F
H
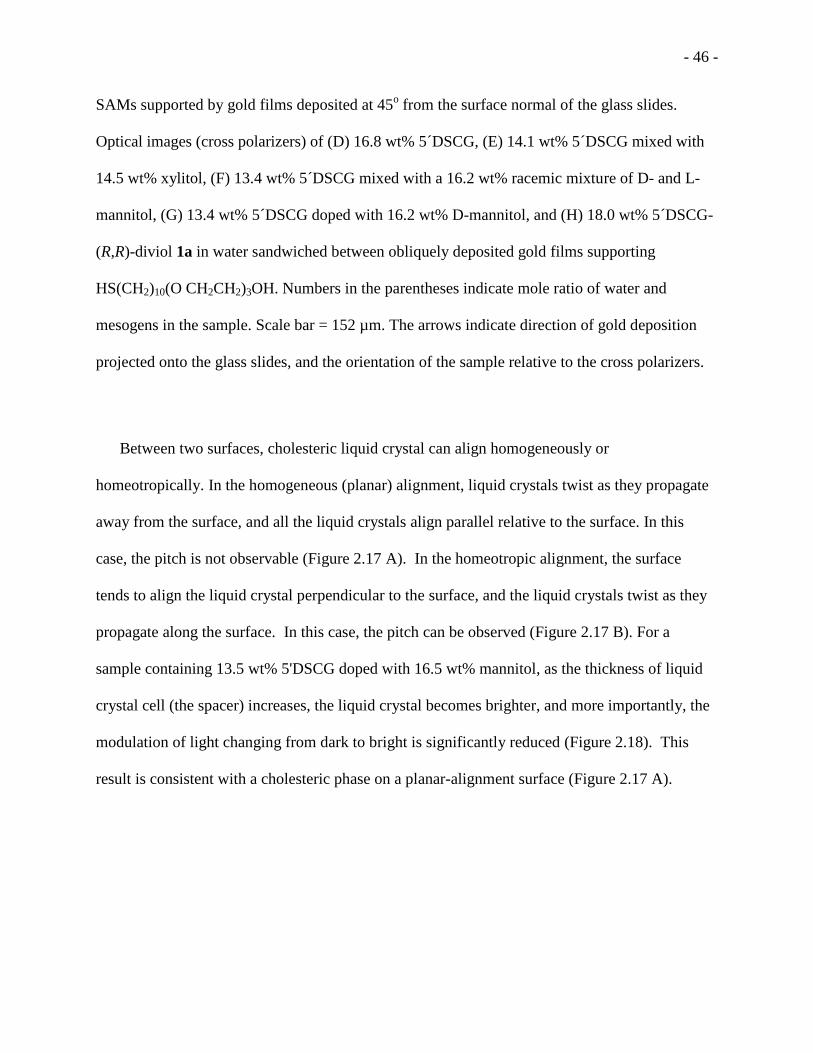
- 46 -
SAMs supported by gold films deposited at 45o from the surface normal of the glass slides.
Optical images (cross polarizers) of (D) 16.8 wt% 5 DSCG, (E) 14.1 wt% 5 DSCG mixed with
14.5 wt% xylitol, (F) 13.4 wt% 5 DSCG mixed with a 16.2 wt% racemic mixture of D- and L-
mannitol, (G) 13.4 wt% 5 DSCG doped with 16.2 wt% D-mannitol, and (H) 18.0 wt% 5 DSCG-
(R,R)-diviol 1a in water sandwiched between obliquely deposited gold films supporting
HS(CH2)10(O CH2CH2)3OH. Numbers in the parentheses indicate mole ratio of water and
mesogens in the sample. Scale bar = 152 µm. The arrows indicate direction of gold deposition
projected onto the glass slides, and the orientation of the sample relative to the cross polarizers.
Between two surfaces, cholesteric liquid crystal can align homogeneously or
homeotropically. In the homogeneous (planar) alignment, liquid crystals twist as they propagate
away from the surface, and all the liquid crystals align parallel relative to the surface. In this
case, the pitch is not observable (Figure 2.17 A). In the homeotropic alignment, the surface
tends to align the liquid crystal perpendicular to the surface, and the liquid crystals twist as they
propagate along the surface. In this case, the pitch can be observed (Figure 2.17 B). For a
sample containing 13.5 wt% 5'DSCG doped with 16.5 wt% mannitol, as the thickness of liquid
crystal cell (the spacer) increases, the liquid crystal becomes brighter, and more importantly, the
modulation of light changing from dark to bright is significantly reduced (Figure 2.18). This
result is consistent with a cholesteric phase on a planar-alignment surface (Figure 2.17 A).

- 47 -
Figure 2.17 Illustrations of the molecular assemblies in (A) homogeneous or (B) homeotropic
alignment of chiral nematic liquid crystal phase on surface.
Figure 2.18 Optical images (cross polarizers) of 13.5 wt% 5 DSCG doped with 16.5 wt% D-
mannitol in water sandwiched between obliquely deposited gold films supporting HS(CH2)10(O
CH2CH2)3OH with different thickness of spacers. Scale bar = 152 µm. The arrows indicate
direction of gold deposition projected onto the glass slides, and the orientation of the sample
relative to the cross polarizers.
In a conventional cholesteric phase created by doping thermotropic liquid crystals with a
small amount of chiral molecules, the chiral effect from the small molecule dopants is
transmitted over large distances – up to hundreds of micrometers.101,102
If one considers the
0 0
A B
Chiral nematic phase on homogenous
(planar) alignment surface.
Chiral nematic phase on
homeotropic alignment surface.
½ h
elic
al p
itch
½ helical pitch
~13 µm x 1 ~13 µm x 2 ~13 µm x 3 ~13 µm x 4 ~13 µm x 5Thickness
of spacer

- 48 -
nematic liquid crystal as the solvent for the chiral dopants, then the dopants are changing the
entire organization of the solvent molecules. In our case, the assemblies are separated by water
molecules – a medium that comprised of hydrogen bond networks. As the assemblies require
strong hydration by water molecules to prevent themselves from coalescing together, at the
boundary between the domains, the water molecules are likely organized to facilitate the
interaction between the assemblies.
It is important to note that there are precedents of organized water structures.103-109
For
example, the sucrose density gradients in water that are commonly used for purification of
biomolecules are stable over a long period of time.103,104
In such a gradient solution, water
molecules between the sucrose molecules are dynamically different across the gradient.105
In a
recent study using molecular dynamics simulation, water dynamics in the solvation shell of
proteins have shown to be different from bulk water. The terahertz spectroscopy data suggested
an influence on the correlated water network motion beyond two nm between neighboring
proteins.107
Our recent work also demonstrated that the stereochemistry of polyol diastereomers
on surfaces impacted their ability to resist protein adsorption, mammalian cell adhesion and
biofilm formation.109
As the atomic composition is the same for those surfaces, this resistance to
biofouling is likely due to the templated aqueous solvent structure at the interfaces. Surface force
studies on bioinert SAMs by Grunze and coworkers measured force effect as far as more than 10
nm from the surfaces.110,111
Finally, using chiral lyotropic liquid crystals as solvents,
discrimination of enantiomers can be observed in NMR spectra. These studies suggest that the
solvent is promoting a preferred orientation of the solutes.106,108
The formation of mesophases for conventional thermotropic liquid crystals (such as 5CB) is
primarily a result of anisotropic dispersion forces between molecules.60,112
In the present study,

- 49 -
hydrogen bonding appears to be the main factor that governs the interaction between assemblies
and the basis for mediating liquid crystal threads to influence each other in an aqueous
environment up to 6 nm apart. Together with the anisotropic interactions at meso-scale, liquid
crystal materials create complex and interesting assembly structures.113
With the potential of
structuring the organization of water molecules, new assemblies in water can be explored.
2.2.8 Homeotropic alignment (fingerprint texture) of chiral nematic phase of nonamphiphilic
liquid crystals
Homeotropic alignment is difficult to obtain for nonamphiphilic chiral nematic liquid
crystals. In a nematic liquid crystal, the homeotropic alignment on a surface occurs when the
directors of the mesogens are perpendicular to the surface. For a chiral nematic (or cholesteric)
phase, an entirely homeotropic alignment for all mesogens is impossible, as the director of each
neighboring layer continue to twist with a certain angle. It turns out that homeotropic alignment
is very difficult to attain for the achiral nonamphiphilic lyotropic liquid crystal. To date (2013),
there is not yet a report on homeotropic alignment of this class of liquid crystal (5 DSCG or
other dyes). Homeotropic alignment of conventional thermotropic liquid crystals, however, is
easily attainable and is routinely prepared by controlling the surface chemistry and structure. The
reason for this “homeotropic” difficulty for nonamphiphilic lyotropic liquid crystal is not clear.
From a macroscopic point of view, any long thread-like structure, wire-like or spaghetti-like or
else, does not stand vertical to a surface presumably due to weight. At molecular level, the
interaction between the long axis of the assembly and the surface is of close to infinitely larger
area than between the point of the assembly and the surface. For this reason, the interaction of

- 50 -
the long axes of the assemblies and the surface over a large area outweighs the interaction
between the endpoint of the assemblies and the surface.
In a homeotropic alignment of chiral nematic liquid crystals the helical axis is oriented
parallel to a surface, with directors in the planes of assembly continuously rotate along the
surface. For this surface alignment for chiral nonamphiphilic liquid crystals, some vertical (and
thus homeotropic alignment) assembly alignment on a surface is inevitable. Because the surface
control strongly favors planar alignment for thread or assembly-based lyotropic liquid crystals,
we seek to reduce the surface effect by increasing the cell thickness to achieve fingerprint
texture, which provides additional, and likely stronger evidence, for the existence of a lyotropic
chiral nematic phase.
Attaining fingerprint texture of nonamphiphilic chiral lyotropic liquid crystals. To explore
the existence of chiral nematic phase, we study the effect of cell thickness and liquid crystal
alignment by preparing a sandwiched sample of 13.4 wt% 5 DSCG mixed with 16.2 wt% D-
mannitol in a wedge cell composed of HS(CH2)10(OCH2CH2)3OH SAMs supported by gold
films. In the wedge cell, the thickness of the cell continuously increases from the thin end (13
µm) to the thick end (1 mm) (Figure 2.19 A). We observe that with thin cell thickness, planar
alignment is observed as the color of the optical images does not change much with rotation
(Figure 2.19 B and C). However, as the cell thickness increases to 555 um, fingerprint region
began to appear (Figure 2.19 D). As the cell thickness increases further, fingerprint region is
observed over a larger area (Figure 2.19 E). The helical pitch of the sample of 13.4 wt% 5 DSCG
mixed with 16.2 wt% D-mannitol observed in this wedge cell is 25~28 µm. These results are
consistent with the notion that with thin spacer, the surface alignment is dominant. As the
thickness of liquid crystal cell increases, the liquid crystal is less influenced by the surface, and
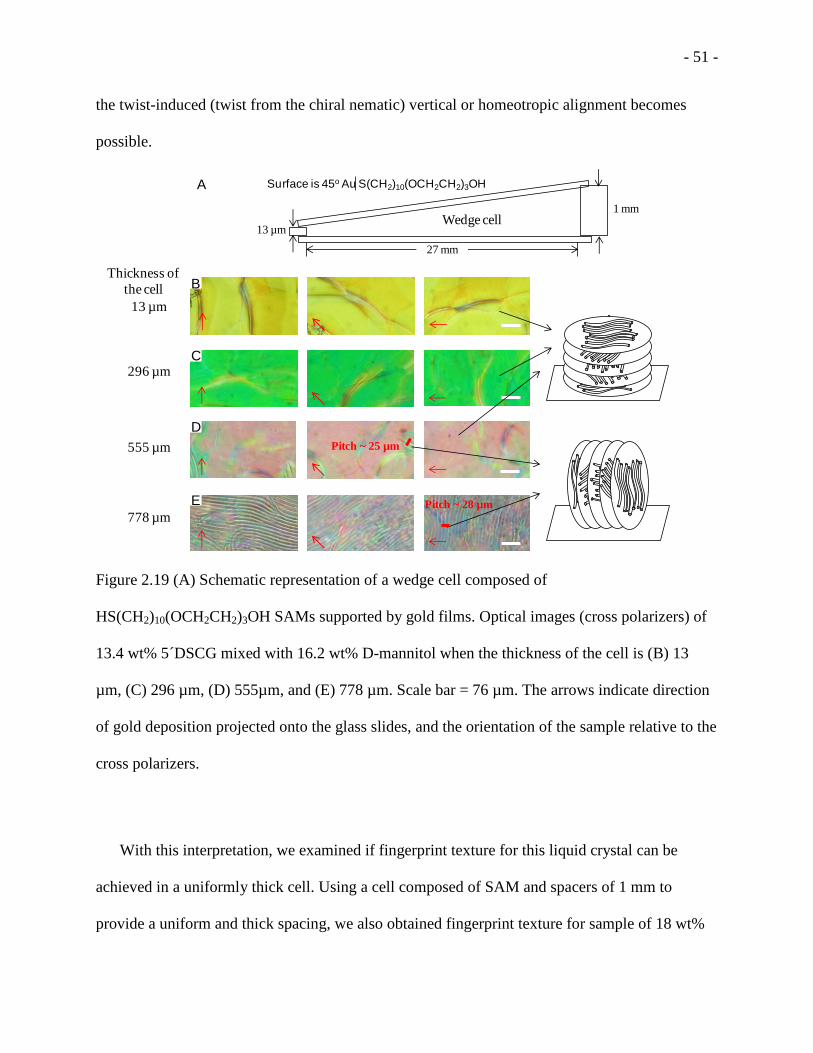
- 51 -
the twist-induced (twist from the chiral nematic) vertical or homeotropic alignment becomes
possible.
Figure 2.19 (A) Schematic representation of a wedge cell composed of
HS(CH2)10(OCH2CH2)3OH SAMs supported by gold films. Optical images (cross polarizers) of
13.4 wt% 5 DSCG mixed with 16.2 wt% D-mannitol when the thickness of the cell is (B) 13
µm, (C) 296 µm, (D) 555µm, and (E) 778 µm. Scale bar = 76 µm. The arrows indicate direction
of gold deposition projected onto the glass slides, and the orientation of the sample relative to the
cross polarizers.
With this interpretation, we examined if fingerprint texture for this liquid crystal can be
achieved in a uniformly thick cell. Using a cell composed of SAM and spacers of 1 mm to
provide a uniform and thick spacing, we also obtained fingerprint texture for sample of 18 wt%
13 µm
1 mm
27 mm
Thickness of
the cell
13 µm
296 µm
555 µm
778 µm
Wedge cell
S(CH2)10(OCH2CH2)3OHSurface is 45o Au
Pitch ~ 25 µm
Pitch ~ 28 µm
B
C
D
E
A

- 52 -
5 DSCG-(R,R)-diviol, which is a strong evidence that the liquid crystal phase formed is chiral
nematic (Figure 2.20 A). It is interesting to find that the liquid crystal phase of 13.4 wt%
5 DSCG mixed with 16.2 wt% D-mannitol has a longer helical pitch (17 ~19 µm) than that of
the chiral mesogen (10 µm) (Figure 2.20 B). Considering the distance between neighboring
thread assembly is ~ 6nm as evidenced in the cryo-TEM, we could calculate the degree of
rotation between neighboring assemblies in each case using Equation 2.1. P represents the
helical pitch. In the sample of 18 wt% 5 DSCG-(R,R)-diviol, each thread-like assembly twists
~0.22 degree with respect to the neighboring ones and that angle is 0.13 degree in the case of
13.4 wt% 5 DSCG mixed with 16.2 wt% D-mannitol.
Eqn 2.1
Figure 2.20 Optical images (cross polarizers) of (A) 13.4 wt% 5 DSCG mixed with 16.2 wt% D-
mannitol and (B) 18.0 wt% 5 DSCG-(R,R)-diviol when the samples were sandwiched between

- 53 -
obliquely deposited gold films supporting HS(CH2)10(O CH2CH2)3OH in a 1 mm thick cell.
Schematic representations of the distance and the twisting angle between two neighboring
assemblies are shown below the images.
Optical images with detailed rotations of 13.4 wt% 5 DSCG mixed with 16.2 wt% D-
mannitol in a wedge cell (composed of HS(CH2)10(OCH2CH2)3OH SAMs supported by gold
films) with different cell thickness are shown in Figure 2.21 and 2.22.
Figure 2.21 Optical images with detailed rotations of 13.4 wt% 5 DSCG mixed with 16.2 wt%
D-mannitol in a wedge cell composed of HS(CH2)10(OCH2CH2)3OH SAMs supported by gold
films when the thickness of the cell ranges from 13 to 222 µm.

- 54 -
Figure 2.22 Optical images with detailed rotations of 13.4 wt% 5 DSCG mixed with 16.2 wt%
D-mannitol in a wedge cell composed of HS(CH2)10(OCH2CH2)3OH SAMs supported by gold
films when the thickness of the cell ranges from 296 to 778 µm.
The above results are all on surfaces that provide uniform planar alignment of liquid crystals
(both thermotropic and this class of nonamphiphilic lyotropic liquid crystals). The observed
homeotropic alignment is caused by the splay strain and facilitated by the large thickness (see
below). To show that the chiral nematic phase forms on any surface for this class of liquid
crystal, we used a plane glass slides and wedge cells. Optical images with detailed rotations of

- 55 -
13.4 wt% 5 DSCG mixed with 16.2 wt% D-mannitol in a wedge cell (composed of plain glass
slides) with different cell thickness are shown in Figure 2.23
Figure 2.23 Optical images with detailed rotations of 13.4 wt% 5 DSCG mixed with 16.2 wt%
D-mannitol in a wedge cell composed of plain glass slides when the thickness of the cell ranges
from 13 to 778 µm.

- 56 -
For the planar alignment on the thin end, there are more domains on the plain glass slides
than on the SAMs supported by obliquely deposited gold films. This result is consistent with
uniform alignment on SAMs and random alignment on plane glass. As the samples are rotated
between the cross polarizers, the color did not change in either samples. These results are
consistent with a homogeneous planar alignment and random planar alignment of the chiral
nematic liquid crystal phase on oblique gold-supported SAMs and on plane glasses, respectively.
The helical pitch of the sample of 13.4 wt% 5 DSCG mixed with 16.2 wt% D-mannitol is not
uniform. For example, when cell thickness is 555, 593, and 778 µm, the helical pitch is 25, 22,
and 28 µm, respectively (Figure 2.24). The correlation between the size of the pitch and cell
thickness is not yet clear.
Figure 2.24 Optical images of 13.4 wt% 5 DSCG mixed with 16.2 wt% D-mannitol in a wedge
cell composed of HS(CH2)10(OCH2CH2)3OH SAMs supported by gold films when the cell
thickness is (A) 555 µm, (B) 593 µm, and (C) 778 µm.
Splay strain-induced homeotropic alignment. It is interesting that the “critical thickness” of
the wedge cell at which fingerprint region begins to show and the size of the helical pitch vary
with the shape of the wedge cell. For example, when a sample of 13.4 wt% 5 DSCG mixed with
16.2 wt% D-mannitol was viewed in a 27 mm wedge cell with an angle of 2.12o composed of
HS(CH2)10(OCH2CH2)3OH SAMs supported on gold films, the critical thickness that the
76 µm
Helical pitch ~ 28 µmHelical pitch ~ 22 µm
Helical pitch ~ 25 µm
A B C
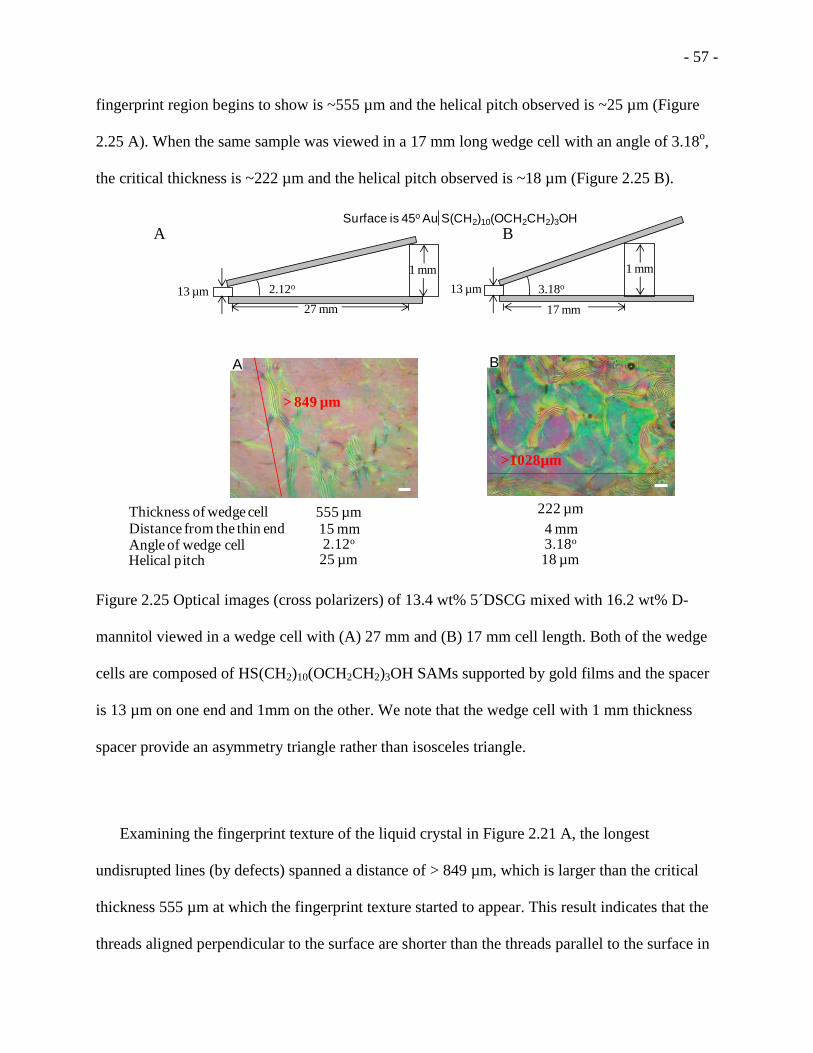
- 57 -
fingerprint region begins to show is ~555 µm and the helical pitch observed is ~25 µm (Figure
2.25 A). When the same sample was viewed in a 17 mm long wedge cell with an angle of 3.18o,
the critical thickness is ~222 µm and the helical pitch observed is ~18 µm (Figure 2.25 B).
Figure 2.25 Optical images (cross polarizers) of 13.4 wt% 5 DSCG mixed with 16.2 wt% D-
mannitol viewed in a wedge cell with (A) 27 mm and (B) 17 mm cell length. Both of the wedge
cells are composed of HS(CH2)10(OCH2CH2)3OH SAMs supported by gold films and the spacer
is 13 µm on one end and 1mm on the other. We note that the wedge cell with 1 mm thickness
spacer provide an asymmetry triangle rather than isosceles triangle.
Examining the fingerprint texture of the liquid crystal in Figure 2.21 A, the longest
undisrupted lines (by defects) spanned a distance of > 849 µm, which is larger than the critical
thickness 555 µm at which the fingerprint texture started to appear. This result indicates that the
threads aligned perpendicular to the surface are shorter than the threads parallel to the surface in
13 µm
1 mm
S(CH2)10(OCH2CH2)3OHSurface is 45o Au
> 849 µm
A
>1028µm
B
Thickness of wedge cellDistance from the thin end 15 mm
555 µm
4 mm
222 µm
Helical pitch 25 µm 18 µmAngle of wedge cell 2.12o 3.18o
13 µm
1 mm
2.12o 3.18o
17 mm27 mm
A B

- 58 -
the fingerprint domains of the liquid crystals. Interestingly, a more wedged cell (wedge angle
3.18o) caused the fingerprint texture (and thus homeotropic alignment) to occur at a relatively
small thickness (222 µm) whereas a less wedged cell (wedge angle 2.12o) caused the fingerprint
to occur at 555 µm thickness. As a larger wedge angle causes more splay strain in liquid crystals,
this result suggests that although the thickness of the cell is important, the strong splay strain can
also induce a forced homeotropic alignment of chiral nematic (i.e. fingerprint texture). As two
neighboring assemblies are splayed, the energy for a homeotropic alignment to fill up the void
space between the splayed assemblies is lowered (Figure 2.26 B).
Figure 2.26 Schematic representation of splay deformation of liquid crystals in a wedge cell of
(A) small angle and (B) large angle.
Significance of chiral nematic phase created by assemblies of chiral mesogens in water
versus achiral mesogens mixed with chiral molecules in water. In comparison with conventional
chiral nematic for thermotropic liquid crystals, the key question for a chiral nematic version of
lyotropic liquid crystal is how the chiral information is being transmitted between the assemblies
that are separated by a rather large volume of water molecules, more than 80% by weight. In
conventional thermotropic liquid crystal, the mesogens are in van der Waals contact; the chiral
information is transmitted through dispersion interaction between molecules and manifested by
θsθL
A B

- 59 -
molecules twisting relative to each other continuously throughout each domain in the liquid
crystal sample. In lyotropic liquid crystals, the assemblies are not in direct van der Waals contact
with each other. There are two scenarios. One is chiral mesogen in water, the other is achiral
mesogen mixed with a chiral molecule in water. We discuss each separately and first, the case of
chiral mesogen in water.
We believe that there are three possible modes for chemical information transmission
between the assemblies of chiral mesogens in water. First, the assemblies are separated by pure
water, and there is no or negligible amount of chiral mesogens. For both isodesmic and
cooperative assemblies, this case is probable when the self-association constant is high. In this
case chiral information is transmitted through an achiral solvent medium (Figure 2.27). For a
rough estimate in our case, the two neighboring assemblies are separated by at least 14 to 18
water molecules (Figure 2.27 and 2.28). This number is estimated by assuming a linear hydrogen
bonding arrangement between the water molecules.

- 60 -
Figure 2.27 Schematic representation of chiral information transmitted through water molecules
if the molecular assemblies (thread model) are separated by pure water. The number of water
molecules between neighboring thread-like assemblies is estimated.
HO
H
H
OH
HO
H
H
OH
O
O O
OH OH
O
O
O
NaO2C CO2Na
… …+-+ - +-+ -
-- --
… …+-+ - +-+ -
-- --+ ++ + ++
3.4 Å
60 Å
7.0 Å 0.96 Å
1.97 Å
+-+ - +-+ -
Number of water molecules between
neighboring thread-like assemblies
In the thread model
HO
H
H
OH
HO
H
H
OH
…
…

- 61 -
Figure 2.28 Schematic representation of chiral information transmitted through water molecules
if the molecular assemblies (H-stacking model) are separated by pure water. The number of
water molecules between neighboring assemblies is estimated.
Second, there may be some amount of chiral mesogens solvated as individual free molecules
in the aqueous solvent between the threads (Figure 2.29 and 2.30). These molecules may
function as a chiral dopant to twist the molecular assemblies. This scenario is possible, but the
transmission of chiral information is still mediated by the solvent molecules because the free
molecules are still solvated.
In the H-stacking model
O
O O
OH OH
O
O
O
NaO2C CO2Na
60 Å
18 Å
Number of water molecules between
neighboring thread-like assemblies
HO
H
H
OH
HO
H
H
OH
0.96 Å
1.97 Å
HO
H
H
OH
HO
H
H
OH
…
…

- 62 -
Figure 2.29 Schematic representation of chiral information transmitted through water molecules
with free solvated chiral mesogens between the molecular assemblies (thread model). The
number of water molecules between neighboring thread-like assemblies is estimated.
HO
H
H
OH
HO
H
H
OH
O
O O
OH OH
O
O
O
NaO2C CO2Na
… …+-+ - +-+ -
-- --
… …+-+ - +-+ -
-- --+ ++ + ++
3.4 Å
60 Å
7.0 Å 0.96 Å
1.97 Å
+-+ - +-+ -
Number of water molecules between
neighboring thread-like assemblies
In the thread model
HO
H
H
OH
HO
H
H
OH
…
…
+-+ -

- 63 -
Figure 2.30 Schematic representation of chiral information transmitted through water molecules
with free solvated chiral mesogens between the molecular assemblies (H-stacking model). The
number of water molecules between neighboring assemblies is estimated.
Third, the chiral mesogens branch out (or grow out) of the assemblies and connect to the
neighboring ones (Figure 2.31 and 2.32). Through this connection, the chiral information is
somehow transmitted and manifested as twisting neighboring assemblies. This scenario is
unlikely because such a cross-linking network will cause gel formation instead of a fluid phase.
In the H-stacking model
O
O O
OH OH
O
O
O
NaO2C CO2Na
60 Å
18 Å
Number of water molecules between
neighboring thread-like assemblies
HO
H
H
OH
HO
H
H
OH
0.96 Å
1.97 Å
HO
H
H
OH
HO
H
H
OH
…
…
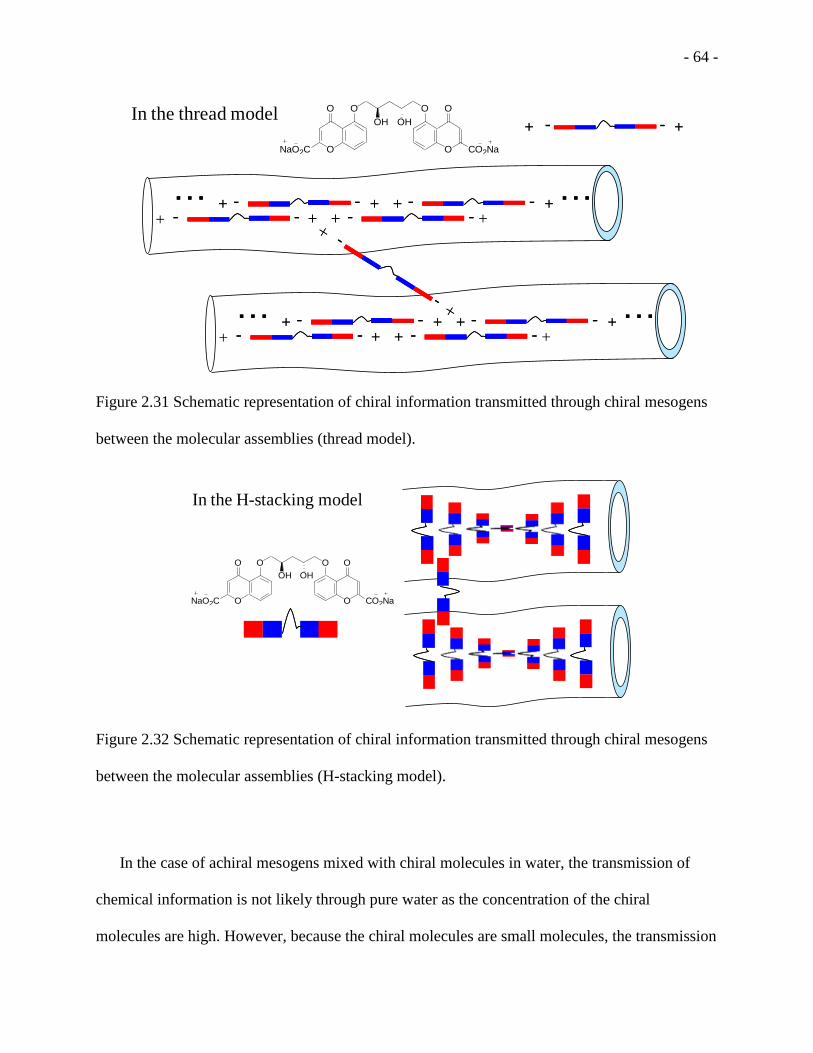
- 64 -
Figure 2.31 Schematic representation of chiral information transmitted through chiral mesogens
between the molecular assemblies (thread model).
Figure 2.32 Schematic representation of chiral information transmitted through chiral mesogens
between the molecular assemblies (H-stacking model).
In the case of achiral mesogens mixed with chiral molecules in water, the transmission of
chemical information is not likely through pure water as the concentration of the chiral
molecules are high. However, because the chiral molecules are small molecules, the transmission
O
O O
OH OH
O
O
O
NaO2C CO2Na
… …+-+ - +-+ -
-- --
… …+-+ - +-+ -
-- --+ ++ + ++
+-+ - +-+ -In the thread model
… …+-+ - +-+ -
-- --
… …+-+ - +-+ -
-- --+ ++ + ++
In the H-stacking model
O
O O
OH OH
O
O
O
NaO2C CO2Na
- 65 -
of the chemical information must still go through many molecular interactions between the chiral
molecules and the solvent water molecules, and eventually the neighboring assemblies. In an
aqueous solution, hydrogen bonds are ubiquitous. It is important to note that one does not know
the contribution from the dispersion force which is present regardless the types of functional
groups. What types of the molecular interactions are contributing and enabling the chiral
information transmission is a still an open question.
2.3 Conclusions and perspectives
In conclusion, enantiomers of 5 DSCG-(R,R)-diviol 1a and 5 DSCG-(S,S)-diviol 1b, and
achiral 5 DSCG-meso-diviol 1c were individually synthesized. Nuclear Overhauser Effect in
proton NMR spectroscopy revealed that the 5 DSCG-meso-divol 1c adopted a more “folded”
conformation while the chiral 5 DSCG-diviol had a more “stretched” conformation. Circular
dichroism suggested a stable chiral molecular conformation by 5 DSCG-(R,R)-diviol 1a. Proton
NMR revealed significant upfield chemical shift and peak broadening around 72 mM. Cryo-
TEM showed visible assembly at 5 wt% (~103 mM), and that chiral stereoisomer 5 DSCG-
(R,R)-diviol 1a forms more elongated assembly at low concentration in water, and exhibited
more crossings between the assemblies at high concentration than those shown by generic
5 DSCG in water. Chiral stereoisomers formed chiral nematic liquid crystal phases while the
meso isomer did not any liquid crystal phase. While generic 5 DSCG in water aligns uniformly
on SAMs supported by obliquely deposited gold films, 5 DSCG-(R,R)-diviol 1a exhibited
nonuniform alignment of on the same surfaces. Splay strain-induced homeotropic alignment of
liquid crystals formed by 13.4 wt% 5 DSCG mixed with 16.2 wt% D-mannitol. Fingerprint
texture of 18 wt% 5 DSCG-(R,R)-diviol can be observed with thick cell. Together, these results
suggest that the hydrated assemblies of chiral molecule 5 DSCG-(R,R)-diviol 1a interact with

- 66 -
each other while being separated by relatively large distance (6 nm) in water, causing a lyotropic
chiral nematic liquid crystal phase. Further works include investigate the assembly structure of
chiral 5 DSCG-diviol at higher concentration than already studied using cuvette with shorter
path length, and further investigate the mechanism and chiral features of the assembly thus
formed.
2.4 Experimental Section
Chemicals.
All reagent grade starting materials were obtained from commercial supplies (Sigma-Aldrich,
TCI, Alfa Aesar, and Acros) and used as received. Anhydrous solvents were purchased from
Sigma-Aldrich. Water used to prepare all buffers and solutions had resistivity of 18 MΩ cm
(Millipore, Billerica, MA).
General procedure.
All air sensitive reactions were performed in oven dried glassware under an atmosphere of argon
unless otherwise notified. Analytical thin layer chromatography was performed on EM silica gel
60 F254 glass plates (0.25 mm). Visualization of analytical thin layer chromatography was
achieved using UV absorbance (254 nm), KMnO4, and ceric ammonium molybdate stains. Flash
column chromatography was performed using SiliaFlash P60 silica gel (40-60 Å) from SiliCycle,
Inc (Quebec City, Quebec, Canada). 1D 1H and
13C NMR spectra were recorded on a Bruker
Advance DPX-300 spectrometer. Chemical shifts are reported in ppm, using tetramethylsilane as
the internal standard. ROESY spectra were acquired at a temperature of 300 K recorded on a
Bruker AVANCE-II NMR spectrometer equipped with a 5 mm TCI CryoProbe with z-gradient
operating at a frequency of 600.13 MHz for 1H. For 2D ROESY experiments,
114 a total of 320 t1
increments of 2048 complex points with 16 scans each were collected. The ROESY spin lock

- 67 -
was set to 250 ms for all experiments. NMR data were processed using Bruker TOPSPIN 3.0
software by setting forward linear prediction to 640 points and zero filled to 2048 points for F1
dimension.Mass spectra were measured using a MAT 95 XP mass spectrometer, carried out by
the Mass Spectroscopy Facility at Indiana University
Circular dichroism.
Wavelength scan and thermal study of chiral 5 DSCG-diviols were performed on an AVIV 420
CD spectrometer (AVIV Biomedical, Inc., Lakewood, NJ) using a 1 mm path length cuvette. For
thermal study, the temperature was increased at a rate of 2 oC/min and samples were equilibrated
for 60 s prior to each data collection.
UV.
UV measurements were performed on an Agilent 8453 spectrometer (Agilent Technologies,
Santa Clara, CA) using a 1mm or 1cm path length cuvette at ambient temperature.
Cleaning of glass substrates.109
Substrates used for gold films were Fisher’s Finest premium microscope slides purchased from
Fisher Scientific (Pittsburgh, PA). Prior to gold deposition, the glass slides were cleaned with
Piranha solution. The slides were soaked in Piranha solution (7 parts of 35% aqueous hydrogen
peroxide solution and 3 parts of concentrated sulfuric acid) for 45 min at 70 oC. Warning!
Piranha solution is extremely corrosive and can potentially detonate when mixed with significant
amounts of oxidizable materials. It is advised to neutralize the Piranha solution with sodium
hydroxide before disposal. After cooling to ambient temperature, the Piranha solution was
poured off and the glass slides rinsed 20 times sequentially with deionized water, followed by 10
times with ethanol, and then 10 times with methanol. The cleaned slides were dried individually
with a stream of nitrogen gas and kept in an 80 oC oven overnight.

- 68 -
Deposition of Gold Films.
Deposition of gold films was done following literature procedure.115
Semitransparent gold films
were deposited onto the glass substrate using an electron beam evaporation system (Thermionics,
Port Townsend, WA). A layer of titanium (~70 Å) was deposited first to enhance the adhesion of
the gold. A layer of gold (~280 Å) was then deposited at an oblique angle of 45o to the surface
normal of the substrate. The rate of deposition was kept at 0.2 Å/s for both gold and titanium and
the pressure was maintained at no higher than 2 × 10⁻⁶
Torr throughout the deposition.
Preparation of SAMs on obliquely deposited gold films.
Gold films deposited on microscope glass slides were cut into strips (8 mm × 2.5 mm) along the
direction of gold deposition. The strips were rinsed with 200 proof ethanol (3 ×), dried with a
stream of nitrogen gas and then immersed in ethanolic solutions containing 2 mM of thiols
overnight (~15 h). Each strip was rinsed with 200 proof ethanol (3 ×), dried with a stream of
nitrogen gas and used immediately.
Assembly of optical cells and characterization of birefringence.
Aqueous solutions of 5 DSCG and 5 DSCG-diviols were prepared by dissolution in deionized
water in vials. The vials were subjected to vortex mixing for at least 1 min before use. The liquid
crystal samples were assembled in a sandwiched cell composed of two microscope glass slides or
gold films supporting SAMs with one sheet of Saran Wrap® (13 – 15 µm) inserted in between as
a spacer. A square hole was cut on the sheet of Saran Wrap®
to accommodate the liquid crystal
sample. The liquid crystal samples were loaded between the slides in the square hole and sealed
with binder clips on each side to prevent the evaporation of solvent. The samples were viewed
under crossed polarizers on an Olympus BX51 polarizing microscope and were rotated form an
arbitrary starting point to record the birefringence.
- 69 -
Sample preparation for cryo-TEM.
The samples were prepared by applying ~5 µL droplet of the sample on the microperforated
cryo-TEM grid, followed by blotting the grid with a filter paper to produce a thin layer. The grid
was then rapidly plunged into liquid ethane that had been cooled to near liquid nitrogen
temperature to freeze the sample.
General information of synthesis.
All air sensitive reactions were performed in oven dried glassware under an atmosphere of argon
unless otherwise notified. Analytical thin layer chromatography was performed on EM silica gel
60 F254 glass plates (0.25 mm). Visualization of analytical thin layer chromatography was
achieved using UV absorbance (254 nm), KMnO4, and ceric ammonium molybdate stains. Flash
column chromatography was performed using SiliaFlash P60 silica gel (40-60 Å) from SiliCycle,
Inc (Quebec City, Quebec, Canada). 1D 1H and
13C NMR spectra were recorded on a Bruker
Advance DPX-300 spectrometer. 1H chemical shifts are reported in ppm, downfield from
tetramethylsilane using residual CHCl3 as the internal standard (δ 7.26 ppm). 13
C chemical shifts
are reported in ppm, downfield from tetramethylsilane relative to CDCl3 (δ 77.0 ppm), DMSO-d6
(δ 39.5 ppm) and CD3CN (δ 1.94 ppm). ROESY spectra were acquired at a temperature of 300 K
recorded on a Bruker AVANCE-II NMR spectrometer equipped with a 5 mm TCI CryoProbe
with z-gradient operating at a frequency of 600.13 MHz for 1H. For ROESY experiments,
114 a
total of 320 t1 increments of 2048 complex points with 16 scans each were collected. The
ROESY spin lock was set to 250 ms for all experiments. NMR data were processed using
Bruker TOPSPIN 3.0 software by setting forward linear prediction to 640 points and zero filled
to 2048 points for F1 dimension. Mass spectra were measured using a MAT 95 XP mass
spectrometer, carried out by the Mass Spectroscopy Facility at Indiana University.
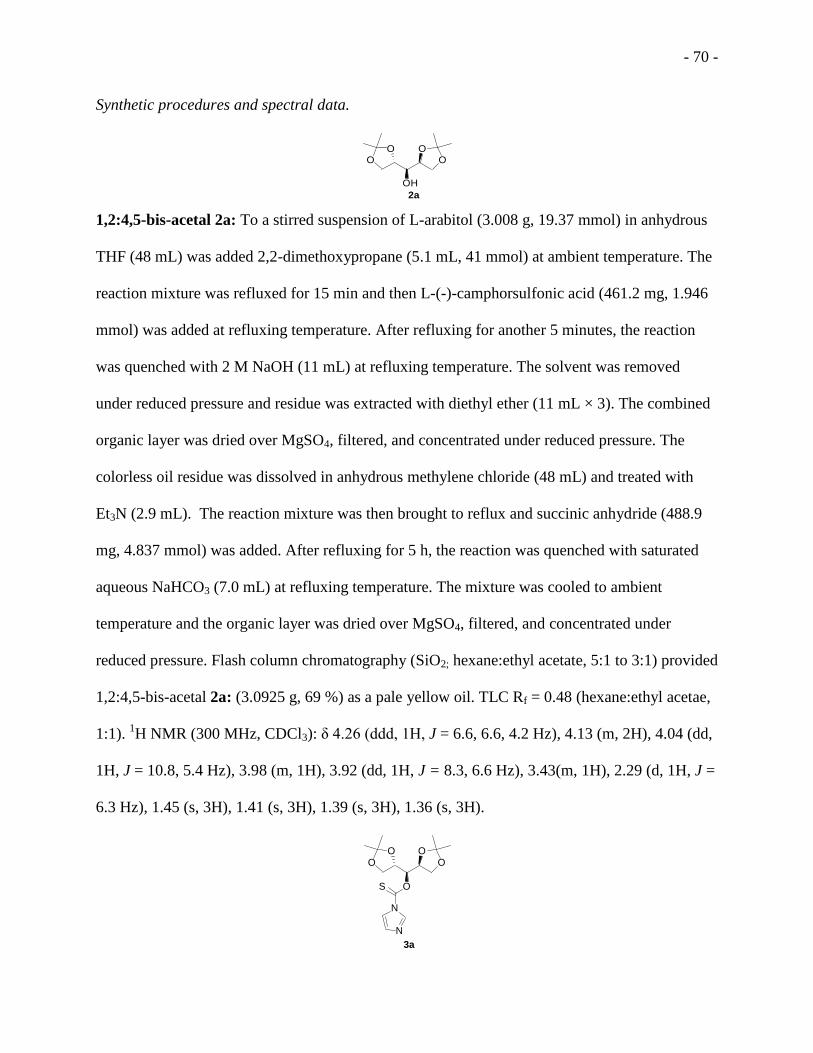
- 70 -
Synthetic procedures and spectral data.
OO O
O
OH
2a
1,2:4,5-bis-acetal 2a: To a stirred suspension of L-arabitol (3.008 g, 19.37 mmol) in anhydrous
THF (48 mL) was added 2,2-dimethoxypropane (5.1 mL, 41 mmol) at ambient temperature. The
reaction mixture was refluxed for 15 min and then L-(-)-camphorsulfonic acid (461.2 mg, 1.946
mmol) was added at refluxing temperature. After refluxing for another 5 minutes, the reaction
was quenched with 2 M NaOH (11 mL) at refluxing temperature. The solvent was removed
under reduced pressure and residue was extracted with diethyl ether (11 mL × 3). The combined
organic layer was dried over MgSO4, filtered, and concentrated under reduced pressure. The
colorless oil residue was dissolved in anhydrous methylene chloride (48 mL) and treated with
Et3N (2.9 mL). The reaction mixture was then brought to reflux and succinic anhydride (488.9
mg, 4.837 mmol) was added. After refluxing for 5 h, the reaction was quenched with saturated
aqueous NaHCO3 (7.0 mL) at refluxing temperature. The mixture was cooled to ambient
temperature and the organic layer was dried over MgSO4, filtered, and concentrated under
reduced pressure. Flash column chromatography (SiO2; hexane:ethyl acetate, 5:1 to 3:1) provided
1,2:4,5-bis-acetal 2a: (3.0925 g, 69 %) as a pale yellow oil. TLC Rf = 0.48 (hexane:ethyl acetae,
1:1). 1H NMR (300 MHz, CDCl3): δ 4.26 (ddd, 1H, J = 6.6, 6.6, 4.2 Hz), 4.13 (m, 2H), 4.04 (dd,
1H, J = 10.8, 5.4 Hz), 3.98 (m, 1H), 3.92 (dd, 1H, J = 8.3, 6.6 Hz), 3.43(m, 1H), 2.29 (d, 1H, J =
6.3 Hz), 1.45 (s, 3H), 1.41 (s, 3H), 1.39 (s, 3H), 1.36 (s, 3H).
OO O
O
OS
N
3a
N

- 71 -
Imidazolyl thiocarbonyl derivative 3a: To a stirred solution of 1,2:4,5-bis-acetal 2a (2.241 g,
9.657 mmol) in anhydrous 1,2-dichloroethane (32 mL) was added 1,1’-thiocarbonyl diimidazole
(2.249 g, 11.36 mmol) at ambient temperature. The resulting brown solution was refluxed for 7 h
and then cooled to ambient temperature. The solvent was removed under reduced pressure. Flash
column chromatography (SiO2; hexane:ethyl acetate 3:1) provided imidazolyl thiocarbonyl
derivative 3a (3.17 g, 96 %) as a yellow oil. TLC Rf = 0.36 (hexane:ethyl acetate, 1:1). 1H NMR
(300 MHz, CDCl3): δ 8.34 (m, 1H), 7.63 (m, 1H), 7.03 (m, 1H), 5.88 (dd, 1H, J = 5.7, 3.3 Hz),
4.45(m, 2H), 4.08 (m, 3H), 3,83 (dd, 1H, J = 9.0, 6.0 Hz), 1.39 (s, 3H), 1.33 (s, 9H); 13
C NMR
(75 MHz,CDCl3): δ 184.5, 137.0, 131.0, 118.0, 109.7, 109.6, 80.9, 74.8, 74.5, 65.8, 65.2, 26.3,
26.1, 25.0, 24.9. HRMS: Cacld. for (M + H)+: 343.1328, found: 343.1314.
OO O
O
4a
1,2:4,5-bis-acetal 4a: Benzoyl peroxide (202.9 mg, 0.821 mmol) was added to a stirred solution
of imidazolyl thiocarbonyl derivative 3a (1.444 g, 4.223 mmol) in triethylsilane (25 mL) at
refluxing temperature. The reaction mixture was refluxed for 2 h during which similar amount of
benzoyl peroxide was added after 30 min, 60 min, and 90 min, respectively. The solvent was
then removed under reduced pressure. Flash column chromatography (SiO2; hexane:ethyl
acetate, 3:1) provided 1,2:4,5-bis-acetal 4a as a light yellow oil which contained some aromatic
impurities and triethyl silane but was good enough to be carried on. TLC Rf = 0.65 (hexane:ethyl
acetate, 1:1).
HO OH
OH OH
5a
(2R,4R)-pentane-1,2,4,5-tetraol 5a: 0.5 M H2SO4 (5.4 mL, 2.7 mmol) was added to a stirred
solution of 1,2:4,5-bis-acetal 4a (1.508 g, impure) in ethanol (5.4 mL) at ambient temperature.

- 72 -
The reaction mixture was refluxed for 4.5 h and then BaCO3 was added to adjust the pH to 7.
The resulting milky mixture was filtered and the white solid thus collected was heated with
MeOH (5 mL) at 50 oC for 10 min. The combined filtrate was concentrated under reduced
pressure. Flash column chromatography (SiO2; DCM:MeOH, 7:3) provided (2R,4R)-pentane-
1,2,4,5-tetraol 5a (546.7 mg, 95 % over 2 steps) as a white solid. TLC Rf = 0.25 (DCM:MeOH,
7:3). 1H NMR (300 MHz, MeOH-d4):
δ 3.85 (m, 2H), 3.47 (m, 4H), 1.52 (dd, 2H, J = 7.1, 5.6
Hz); 13
C NMR (75 MHz, MeOH-d4): δ 70.1, 67.9, 38.1. HRMS: Cacld. for (M + Na)+:
159.0633, found: 159.0631.
TPSO OTPS
OH OH
6a
(2R,4R)-2,4-Dihydroxypentane-1,5-diyl Bis-(2,4,6-triisopropyl-1-benzenesulfonate) 6a: To a
stirred solution of (2R,4R)-Pentane-1,2,4,5-tetraol 5a (92.2 mg, 0.678 mmol) in anhydrous
pyridine (0.55 mL) was added 2,4,6-triisopropyl benzenesulfonyl chloride (529.2 mg, 1.695
mmol) at 0 oC. The pale yellow cloudy mixture was stirred at ambient temperature for 13 h and
then the solvent removed under reduced pressure. Flash column chromatography (SiO2;
hexane:acetone, 3:1) provided (2R,4R)-2,4-Dihydroxypentane-1,5-diyl bis-(2,4,6-triisopropyl-1-
benzenesulfonate) 6a (325.5 mg, 72 %) as a white fluffy solid. TLC Rf = 0.70 (hexane:ethyl
acetate, 1:1). 1H NMR (300 MHz, CDCl3): δ 7.20 (s, 4H), 4.23 (m, 2H), 4.10 (m, 6H), 3,98 (dd,
2H, J = 10.2, 6.9 Hz), 2.92 (septet, 2H, J = 6.9 Hz), 2.87 (br, 2H), 1.64 (t, 2H, J = 5.7 Hz), 1.27
(d, 24H, J = 6.9 Hz), 1.26 (d, 12H, J = 6.9 Hz).
TPSO OTPS
O O
7a
Acetonide 7a: To a stirred solution of (2R,4R)-2,4-Dihydroxypentane-1,5-diyl bis-(2,4,6-
triisopropyl-1-benzenesulfonate) 6a (472.8 mg, 0.708 mmol) in acetone (7.1 mL) was added 2,2-

- 73 -
dimethoxypropane (0.89 mL, 7.1 mmol) and p-toluenesulfonic acid (18.2 mg, 0.094 mmol) at
ambient temperature. The resulting colorless solution was stirred at ambient temperature
overnight (23 h). The reaction mixture was quenched with aqueous saturated NaHCO3 (8 mL)
and the solvent removed under reduced pressure. The residue was extracted with methylene
chloride (4 mL × 3) and the combined organic layer dried over Na2SO4, filtered, and
concentrated under reduced pressure. Flash column chromatography (SiO2; hexane:ethyl acetate,
3:1) provided acetonide 7a (473.4 mg, 94 %) as a pale yellow solid. TLC Rf = 0.64 (hexane:ethyl
acetate, 3:1). 1H NMR (300 MHz, CDCl3): δ 7.19 (s, 4H), 4.13 (septet, 4H, J = 6.9 Hz), 4.03 (m,
6H), 2.92 (septet, 2H, J = 6.9 Hz), 1.66 (t, 2H, J = 7.7 Hz), 1.26 (d, 36H, J = 6.9 Hz), 1.22 (s,
6H); HRMS: Cacld. for (M + Na)+: 731.3627, found: 731.3651.
I I
O O
8a
Diiodide 8a: To a stirred solution of (2R,4R)-2,4-Dihydroxypentane-1,5-diyl bis-(2,4,6-
triisopropyl-1-benzenesulfonate) 7a (938.1 mg, 1.325 mmol) in 2-butanone (13 mL) was added
sodium iodide (1.985 g, 13.24 mmol) followed by anhydrous pyridine (0.54 mL, 6.7 mmol) at
ambient temperature. The resulting light yellow suspension was refluxed overnight (25 h). The
reaction mixture was cooled to ambient temperature and the solvent was removed under reduced
pressure. The residue was treated with water (10 mL), extracted with ethyl acetate (10 mL × 4),
dried over MgSO4, filtered and concentrated under reduced pressure. Flash column
chromatography (SiO2; hexane to hexane:ethyl acetate, 15:1) provided diiodide 8a (484.7 mg, 92
%) as a colorless oil. TLC Rf = 0.55 (hexane:ethyl acetate, 10:1). 1H NMR (300 MHz, CDCl3): δ
3.85 (m, 2H), 3.18 (m, 4H), 1.78 (t, 2H, J = 3.3 Hz), 1.39 (s, 6H); 13
C NMR (75 MHz,CDCl3):
δ 101.6 (C), 66.9 (CH), 38.6 (CH2), 24.6 (CH3), 8.9 (CH2).
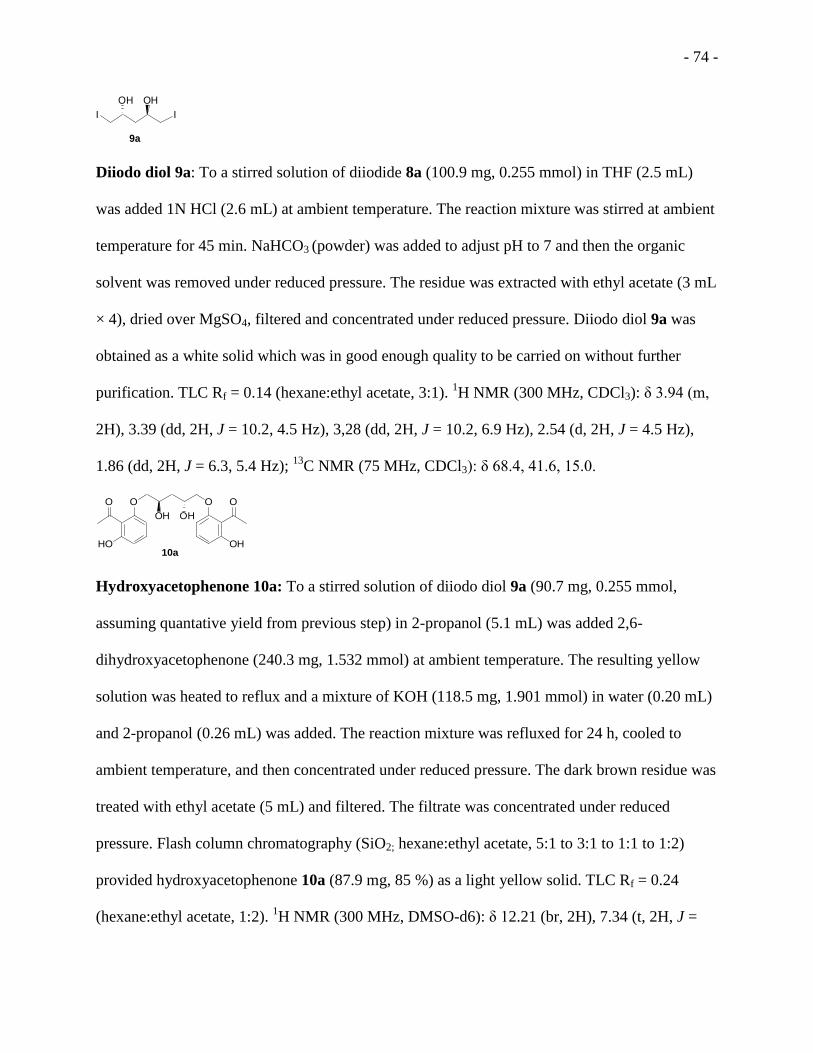
- 74 -
I I
OH OH
9a
Diiodo diol 9a: To a stirred solution of diiodide 8a (100.9 mg, 0.255 mmol) in THF (2.5 mL)
was added 1N HCl (2.6 mL) at ambient temperature. The reaction mixture was stirred at ambient
temperature for 45 min. NaHCO3 (powder) was added to adjust pH to 7 and then the organic
solvent was removed under reduced pressure. The residue was extracted with ethyl acetate (3 mL
× 4), dried over MgSO4, filtered and concentrated under reduced pressure. Diiodo diol 9a was
obtained as a white solid which was in good enough quality to be carried on without further
purification. TLC Rf = 0.14 (hexane:ethyl acetate, 3:1). 1H NMR (300 MHz, CDCl3): δ 3.94 (m,
2H), 3.39 (dd, 2H, J = 10.2, 4.5 Hz), 3,28 (dd, 2H, J = 10.2, 6.9 Hz), 2.54 (d, 2H, J = 4.5 Hz),
1.86 (dd, 2H, J = 6.3, 5.4 Hz); 13
C NMR (75 MHz, CDCl3): δ 68.4, 41.6, 15.0.
O O
HO OH
O O
OH OH
10a
Hydroxyacetophenone 10a: To a stirred solution of diiodo diol 9a (90.7 mg, 0.255 mmol,
assuming quantative yield from previous step) in 2-propanol (5.1 mL) was added 2,6-
dihydroxyacetophenone (240.3 mg, 1.532 mmol) at ambient temperature. The resulting yellow
solution was heated to reflux and a mixture of KOH (118.5 mg, 1.901 mmol) in water (0.20 mL)
and 2-propanol (0.26 mL) was added. The reaction mixture was refluxed for 24 h, cooled to
ambient temperature, and then concentrated under reduced pressure. The dark brown residue was
treated with ethyl acetate (5 mL) and filtered. The filtrate was concentrated under reduced
pressure. Flash column chromatography (SiO2; hexane:ethyl acetate, 5:1 to 3:1 to 1:1 to 1:2)
provided hydroxyacetophenone 10a (87.9 mg, 85 %) as a light yellow solid. TLC Rf = 0.24
(hexane:ethyl acetate, 1:2). 1H NMR (300 MHz, DMSO-d6): δ 12.21 (br, 2H), 7.34 (t, 2H, J =

- 75 -
8.3 Hz), 6.56 (d, 2H, J = 8.4 Hz), 6.49 (d, 2H, J = 8.1 Hz), 4.97 (d, 2H, J = 5.4 Hz), 4.08 (m,
2H), 3.99 (m, 4H), 2.62 (s, 6H), 1.64 (t, 2H, J = 6.3 Hz); HRMS: Cacld. for (M + Na)+:
427.1369, found: 427.1354.
O
O O
OH OH
O
O
O
MeO2C CO2Me11a
Diester 11a: To a freshly prepared NaOMe solution (206.8 mg of sodium cube in 18 mL of
anhydrous MeOH) was added anhydrous diethyl ether (36 mL) followed by dimethyl oxalate
(1.065 g, 8.931 mmol). After the solid disappeared, hydroxylacetophenone 10b (360.3 mg, 0.892
mmol) was added to the reaction mixture. The resulting yellow solution was refluxed for 24 h,
cooled to ambient temperature, and then concentrated under reduced pressure. The yellow solid
residue was treated with water (45 mL) and acidified with concentrated HCl (0.20 mL) until pH
~ 2. The yellow precipitated was filtered off, dissolved in anhydrous MeOH, and treated with
concentrated HCl (2.7 mL). The reaction mixture was refluxed for 40 min and then cooled to
ambient temperature. The pale brown precipitate was filter off and found to be pure to be carried
on (191.7 mg, 40 %). TLC Rf = 0.10 (ethyl acetate:ethanol, 9:1). 1H NMR (300 MHz, DMSO-
d6): δ 7.73 (t, 2H, J = 8.4 Hz), 7.22 (d, 2H, J = 8.4 Hz), 7.09 (d, 2H, J = 8.4 Hz), 6.75 (s, 2H),
4.07 (m, 6H), 3.92 (s, 6H), 3.50 (br, 2H), 1.78 (t, 2H, J = 6.0 Hz); 13
C NMR (75 MHz, DMSO-
d6): δ 176.6, 160.6, 158.6, 157.1, 150.1, 135.4, 115.4, 114.8, 110.4, 109.7, 74.4, 65.2, 53.4, 37.2.
HRMS: Cacld. for (M + Na)+: 563.1165, found: 563.1149.
O
O O
OH OH
O
O
O
NaO2C CO2Na1a
5 DSCG-(R,R)-diviol 1a: To a stirred suspension of diester 11a (101.5 mg, 0.188 mmol) in
ethanol (9.4 mL) was added aqueous NaOH solution (2.5 M, 0.15 mL, 0.38 mmol) at ambient

- 76 -
temperature. The reaction mixture was refluxed for 10 min, cooled to ambient temperature, and
then at 0 oC for 20 min. After filtration and drying under high vacuum for 24 h, 1a was obtained
as brown solid (91.2 mg, 89%). 1H NMR (300 MHz, D2O): δ 7.60 (t, 2H, J = 8.4 Hz), 7.08 (d,
2H, J = 8.4 Hz), 6.89 (d, 2H, J = 8.4 Hz), 6.64 (s, 2H), 4.37 (m, 2H), 4.13 (m, 4H), 1.97 (t, 2H, J
= 6.2 Hz); 13
C NMR (75 MHz, D2O): δ 181.4, 165.1, 157.2, 157.2, 156.2, 135.2, 113.0, 112.0,
110.6, 108.2, 73.1, 65.5, 35.5. HRMS: Cacld. for (M + Na)+: 579.0483, found: 579.0491.
OO O
O
OH
2b
1,2:4,5-bis-acetal 2b:116
To a stirred suspension of D-arabitol (3.004 g, 19.55 mmol) in
anhydrous THF (49 mL) was added 2,2-dimethoxypropane (5.1 mL, 41 mmol) at ambient
temperature. The reaction mixture was refluxed for 15 min and then L-(-)-camphorsulfonic acid
(463.7 mg, 1.956 mmol) was added at refluxing temperature. After refluxing for another 3
minutes, the reaction was quenched with 2 M NaOH (11 mL) at refluxing temperature. The
solvent was removed under reduced pressure and residue was extracted with diethyl ether (11
mL × 3). The combined organic layer was dried over MgSO4, filtered, and concentrated under
reduced pressure. The colorless oil residue was dissolved in anhydrous methylene chloride (49
mL) and treated with Et3N (3.0 mL). The reaction mixture was then brought to reflux and
succinic anhydride (504.6 mg, 4.891 mmol) was added. After refluxing for 6.5 h, the reaction
was quenched with saturated aqueous NaHCO3 (8.0 mL) at refluxing temperature. The mixture
was cooled to ambient temperature and the organic layer was dried over MgSO4, filtered, and
concentrated under reduced pressure. Flash column chromatography (SiO2; hexane:ethyl acetate,
5:1 to 3:1) provided 1,2:4,5-bis-acetal 2b: (2.7085g, 60 %) as a pale yellow oil. TLC Rf = 0.49
(hexane:ethyl acetate, 1:1). 1H NMR (300 MHz, CDCl3): δ 4.26 (ddd, 1H, J = 6.6, 6.6, 4.2 Hz),

- 77 -
4.13 (m, 2H), 4.04 (dd, 1H, J = 10.8, 5.4 Hz), 3.98 (m, 1H), 3.92 (dd, 1H, J = 8.3, 6.6 Hz),
3.43(m, 1H), 2.29 (d, 1H, J = 6.3 Hz), 1.45 (s, 3H), 1.41 (s, 3H), 1.39 (s, 3H), 1.36 (s, 3H).
OO O
O
OS
N
N3b
Imidazolyl thiocarbonyl derivative 3b: To a stirred solution of 1,2:4,5-bis-acetal 2b (2.678 g,
11.54 mmol) in anhydrous 1,2-dichloroethane (38 mL) was added 1,1’-thiocarbonyl diimidazole
(2.8955g, 14.62 mmol) at ambient temperature. The resulting brown solution was refluxed for 7
h and then cooled to ambient temperature. The solvent was removed under reduced pressure.
Flash column chromatography (SiO2; hexane:ethyl acetate 3:1 to 1:1) provided imidazolyl
thiocarbonyl derivative 3b (3.8679 g, 98 %) as a yellow oil. TLC Rf = 0.25 (hexane:ethyl acetate,
1:1). 1H NMR (300 MHz, CDCl3): δ 8.34 (m, 1H), 7.63 (m, 1H), 7.03 (m, 1H), 5.88 (dd, 1H, J =
5.7, 3.3 Hz), 4.45(m, 2H), 4.08 (m, 3H), 3,83 (dd, 1H, J = 9.0, 6.0 Hz), 1.39 (s, 3H), 1.33 (s, 9H);
13C NMR (75 MHz,CDCl3): δ 184.5, 137.0, 131.0, 118.0, 109.7, 109.6, 80.9, 74.8, 74.5, 65.8,
65.2, 26.3, 26.1, 25.0, 24.9. HRMS: Cacld. for (M + H)+: 343.1328, found: 343.1313.
O
O O
O
4b
1,2:4,5-bis-acetal 4b: Benzoyl peroxide (560.0 mg, 2.266 mmol) was added to a stirred solution
of imidazolyl thiocarbonyl derivative 3b (3.8679 g, 11.31 mmol) in triethylsilane (56 mL) at
refluxing temperature. The reaction mixture was refluxed for 2 h during which similar amount of
benzoyl peroxide was added after 30 min, 60 min, and 90 min, respectively. The solvent was
then removed under reduced pressure. Flash column chromatography (SiO2; hexane to
hexane:ethyl acetate, 30:1 to 15:1) provided 1,2:4,5-bis-acetal 4b (~2.42 g) as a light yellow oil
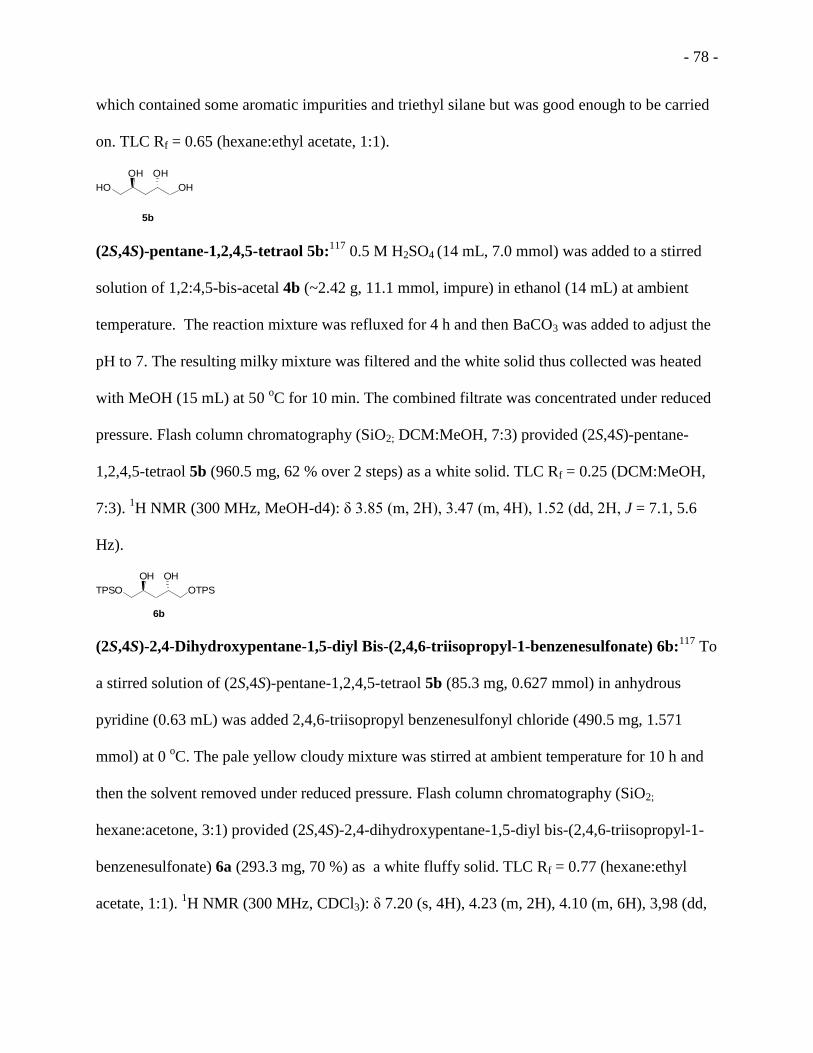
- 78 -
which contained some aromatic impurities and triethyl silane but was good enough to be carried
on. TLC Rf = 0.65 (hexane:ethyl acetate, 1:1).
HO OH
OH OH
5b
(2S,4S)-pentane-1,2,4,5-tetraol 5b:117
0.5 M H2SO4 (14 mL, 7.0 mmol) was added to a stirred
solution of 1,2:4,5-bis-acetal 4b (~2.42 g, 11.1 mmol, impure) in ethanol (14 mL) at ambient
temperature. The reaction mixture was refluxed for 4 h and then BaCO3 was added to adjust the
pH to 7. The resulting milky mixture was filtered and the white solid thus collected was heated
with MeOH (15 mL) at 50 oC for 10 min. The combined filtrate was concentrated under reduced
pressure. Flash column chromatography (SiO2; DCM:MeOH, 7:3) provided (2S,4S)-pentane-
1,2,4,5-tetraol 5b (960.5 mg, 62 % over 2 steps) as a white solid. TLC Rf = 0.25 (DCM:MeOH,
7:3). 1H NMR (300 MHz, MeOH-d4): δ 3.85 (m, 2H), 3.47 (m, 4H), 1.52 (dd, 2H, J = 7.1, 5.6
Hz).
TPSO OTPS
OH OH
6b
(2S,4S)-2,4-Dihydroxypentane-1,5-diyl Bis-(2,4,6-triisopropyl-1-benzenesulfonate) 6b:117
To
a stirred solution of (2S,4S)-pentane-1,2,4,5-tetraol 5b (85.3 mg, 0.627 mmol) in anhydrous
pyridine (0.63 mL) was added 2,4,6-triisopropyl benzenesulfonyl chloride (490.5 mg, 1.571
mmol) at 0 oC. The pale yellow cloudy mixture was stirred at ambient temperature for 10 h and
then the solvent removed under reduced pressure. Flash column chromatography (SiO2;
hexane:acetone, 3:1) provided (2S,4S)-2,4-dihydroxypentane-1,5-diyl bis-(2,4,6-triisopropyl-1-
benzenesulfonate) 6a (293.3 mg, 70 %) as a white fluffy solid. TLC Rf = 0.77 (hexane:ethyl
acetate, 1:1). 1H NMR (300 MHz, CDCl3): δ 7.20 (s, 4H), 4.23 (m, 2H), 4.10 (m, 6H), 3,98 (dd,

- 79 -
2H, J = 10.2, 6.9 Hz), 2.92 (septet, 2H, J = 6.9 Hz), 2.87 (br, 2H), 1.64 (t, 2H, J = 5.7 Hz), 1.27
(d, 24H, J = 6.9 Hz), 1.26 (d, 12H, J = 6.9 Hz).
TPSO OTPS
O O
7b
Acetonide 7b: To a stirred solution of (2S,4S)-2,4-Dihydroxypentane-1,5-diyl bis-(2,4,6-
triisopropyl-1-benzenesulfonate) 6b (1.115 g, 1.670 mmol) in acetone (17 mL) was added 2,2-
dimethoxypropane 2.1 mL, 17 mmol) and p-toluenesulfonic acid (36.5 mg, 0.189 mmol) at
ambient temperature. The resulting colorless solution was stirred at ambient temperature
overnight (25 h). The reaction mixture was quenched with aqueous saturated NaHCO3 (17 mL)
and the solvent removed under reduced pressure. The residue was extracted with methylene
chloride (17 mL × 3) and the combined organic layer dried over Na2SO4, filtered, and
concentrated under reduced pressure. Flash column chromatography (SiO2; hexane:ethyl acetate,
3:1) provided acetonide 7b (2.099 g, 80 %) as a white solid. TLC Rf = 0.73 (hexane:ethyl
acetate, 3:1). 1H NMR (300 MHz, CDCl3): δ 7.19 (s, 4H), 4.08 (m, 10H), 2.92 (septet, 2H, J =
6.9 Hz), 1.65 (t, 2H, J = 7.8 Hz), 1.27 (d, 12H, J = 7.5 Hz), 1.26 (d, 24H, J = 6.9 Hz), 1.23 (s,
6H) ); 13
C NMR (75 MHz,CDCl3): δ 153.7, 150.8, 129.3, 123.8, 101.0, 70.1, 64.5, 34.2, 30.0,
29.6, 24.7, 24.3, 23.5. Cacld. for (M+Na)+: 731.3627, found: 731.3610.
I I
O O
8b
Diiodide 8b: To a stirred solution of (2S,4S)-2,4-Dihydroxypentane-1,5-diyl bis-(2,4,6-
triisopropyl-1-benzenesulfonate) 7b (1.343 g, 1.897 mmol) in 2-butanone (19 mL) was added
sodium iodide (2.815 g, 18.78 mmol) followed by anhydrous pyridine (0.77 mL, 9.5 mmol) at
ambient temperature. The resulting light yellow suspension was refluxed overnight (22 h). The

- 80 -
reaction mixture was cooled to ambient temperature and the solvent was removed under reduced
pressure. The residue was treated with water (30 mL), extracted with ethyl acetate (30 mL × 3),
dried over MgSO4, filtered and concentrated under reduced pressure. Flash column
chromatography (SiO2; hexane to hexane:ethyl acetate, 15:1) provided diiodide 8b (1.632 g, 85
%) as a light yellow oil. TLC Rf = 0.53 (hexane:ethyl acetate, 10:1). 1H NMR (300 MHz,
CDCl3): δ 3.85 (m, 2H), 3.18 (m, 4H), 1.78 (t, 2H, J = 3.3 Hz), 1.39 (s, 6H); 13
C NMR (75 MHz
,CDCl3): δ 101.6 (C), 66.9 (CH), 38.6 (CH2), 24.6 (CH3), 8.9 (CH2).
I I
OH OH
9b
Diiodo diol 9b: To a stirred solution of diiodide 8b (972.0 mg 2.455 mmol) in THF (25 mL) was
added 1N HCl (25 mL) at ambient temperature. The reaction mixture was stirred at ambient
temperature for 2 h. NaHCO3 (powder) was added to adjust pH to 7 and then the organic solvent
was removed under reduced pressure. The residue was extracted with ethyl acetate (20 mL × 3),
dried over MgSO4, filtered and concentrated under reduced pressure. Diiodo diol 9b (1.339 g, 92
%) was obtained as a white solid which was in good enough quality to be carried on without
further purification. TLC Rf = 0.14 (hexane:ethyl acetate, 3:1). 1H NMR (300 MHz, CDCl3): δ
3.94 (m, 2H), 3.39 (dd, 2H, J = 10.2, 4.5 Hz), 3,28 (dd, 2H, J = 10.2, 6.9 Hz), 2.53 (d, 2H, J =
5.1 Hz), 1.86 (dd, 2H, J = 6.3, 5.4 Hz); 13
C NMR (75 MHz,CDCl3): δ 68.4, 41.6, 15.0. HRMS:
Cacld. for M+: 355.8765, found: 355.8768.
O O
HO OH
O O
OH OH
10b
Hydroxyacetophenone 10b: To a stirred solution of diiodo diol 9b (651.1 mg, 1.829 mmol) in 2-
propanol (37 mL) was added 2,6-dihydroxyacetophenone (1.7231 g, 10.99 mmol) at ambient
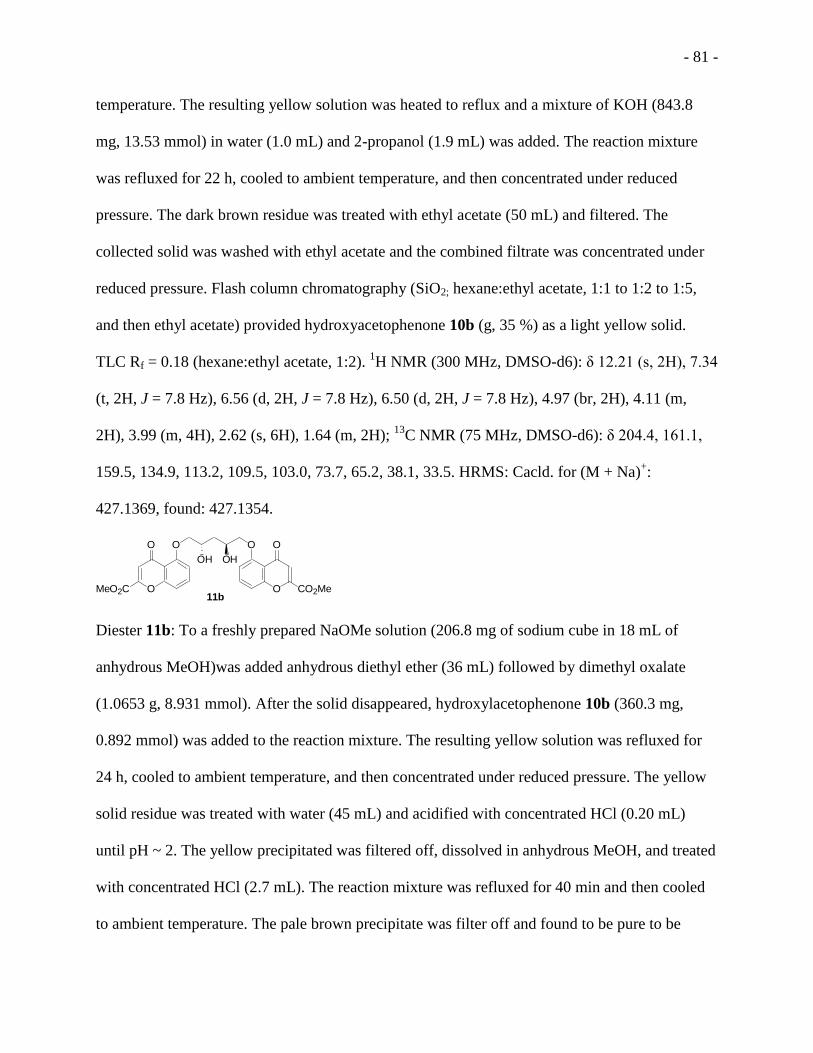
- 81 -
temperature. The resulting yellow solution was heated to reflux and a mixture of KOH (843.8
mg, 13.53 mmol) in water (1.0 mL) and 2-propanol (1.9 mL) was added. The reaction mixture
was refluxed for 22 h, cooled to ambient temperature, and then concentrated under reduced
pressure. The dark brown residue was treated with ethyl acetate (50 mL) and filtered. The
collected solid was washed with ethyl acetate and the combined filtrate was concentrated under
reduced pressure. Flash column chromatography (SiO2; hexane:ethyl acetate, 1:1 to 1:2 to 1:5,
and then ethyl acetate) provided hydroxyacetophenone 10b (g, 35 %) as a light yellow solid.
TLC Rf = 0.18 (hexane:ethyl acetate, 1:2). 1H NMR (300 MHz, DMSO-d6): δ 12.21 (s, 2H), 7.34
(t, 2H, J = 7.8 Hz), 6.56 (d, 2H, J = 7.8 Hz), 6.50 (d, 2H, J = 7.8 Hz), 4.97 (br, 2H), 4.11 (m,
2H), 3.99 (m, 4H), 2.62 (s, 6H), 1.64 (m, 2H); 13
C NMR (75 MHz, DMSO-d6): δ 204.4, 161.1,
159.5, 134.9, 113.2, 109.5, 103.0, 73.7, 65.2, 38.1, 33.5. HRMS: Cacld. for (M + Na)+:
427.1369, found: 427.1354.
O
O O
OH OH
O
O
O
MeO2C CO2Me11b
Diester 11b: To a freshly prepared NaOMe solution (206.8 mg of sodium cube in 18 mL of
anhydrous MeOH)was added anhydrous diethyl ether (36 mL) followed by dimethyl oxalate
(1.0653 g, 8.931 mmol). After the solid disappeared, hydroxylacetophenone 10b (360.3 mg,
0.892 mmol) was added to the reaction mixture. The resulting yellow solution was refluxed for
24 h, cooled to ambient temperature, and then concentrated under reduced pressure. The yellow
solid residue was treated with water (45 mL) and acidified with concentrated HCl (0.20 mL)
until pH ~ 2. The yellow precipitated was filtered off, dissolved in anhydrous MeOH, and treated
with concentrated HCl (2.7 mL). The reaction mixture was refluxed for 40 min and then cooled
to ambient temperature. The pale brown precipitate was filter off and found to be pure to be

- 82 -
carried on (191.7 mg, 40 %). TLC Rf = 0.10 (ethyl acetate:ethanol, 9:1). 1H NMR (300 MHz,
DMSO-d6): δ 7.73 (t, 2H, J = 8.4 Hz), 7.22 (d, 2H, J = 8.4 Hz), 7.09 (d, 2H, J = 8.4 Hz), 6.75 (s,
2H), 4.85 (d, 2H J = 4.8 Hz), 4.07 (m, 6H), 3.92 (s, 6H), 1.78 (t, 2H, J = 6.0 Hz); 13
C NMR (75
MHz, DMSO-d6): δ 176.6, 160.6, 158.6, 157.1, 150.1, 135.4, 115.4, 114.8, 110.4, 109.7, 74.4,
65.2, 53.4, 37.2. MS: Cacld. for (M + Na)+: 563.1165, found: 563.1178.
O
O O
OH OH
O
O
O
NaO2C CO2Na1b
5 DSCG-(S,S)-diviol 1b: To a stirred suspension of diester 11b (120.5 mg, 0.223 mmol) in
ethanol (11 mL) was added aqueous NaOH solution (2.5 M, 0.18 mL, 0.45 mmol) at ambient
temperature. The reaction mixture was refluxed for 10 min, cooled to ambient temperature, and
then at 0 oC for 20 min. After filtration and drying under high vacuum for 24 h, 1b was obtained
as brown solid (108.1 mg, 87%). 1H NMR (300 MHz, D2O): δ 7.59 (t, 2H, J = 8.4 Hz), 7.06 (d,
2H, J = 8.7 Hz), 6.87 (d, 2H, J = 8.4 Hz), 6.62 (s, 2H), 4.38 (m, 2H), 4.11 (m, 4H), 1.97 (t, 2H, J
= 6.2 Hz); 13
C NMR (75 MHz, D2O): δ 181.4, 165.1, 157.2, 157.1, 156.2, 135.2, 113.0, 112.0,
110.5, 108.1, 73.1, 65.5, 35.4. HRMS: Cacld. for (M + Na)+: 579.0483, found: 579.0491.
OO O
O
OH
2c
1,2:4,5-bis-acetal 2c:90
To a stirred suspension of xylitol (2.590 g, 16.85 mmol) in anhydrous
THF (48 mL) was added 2,2-dimethoxypropane (4.6 mL, 37 mmol) at ambient temperature. The
reaction mixture was refluxed for 15 min and then L-(-)-camphorsulfonic acid (398.7 mg, 1.682
mmol) was added at refluxing temperature. After refluxing for another 5 minutes, the reaction
was quenched with 2 M NaOH (10 mL) at refluxing temperature. After removing the majority of
the solvent under reduced pressure, the aqueous layer was extracted with diethyl ether (10 mL ×

- 83 -
3). The combined organic layer was dried over MgSO4, filtered, and concentrated under reduced
pressure. The colorless oil residue was dissolved in anhydrous DCM (50 mL) and Et3N (2.5 mL)
was added. The reaction mixture was then brought to reflux and succinic anhydride (427.6 mg,
4.203 mmol) was added. After refluxing for another hour, the reaction was quenched with
saturated aqueous NaHCO3 (5 mL) at refluxing temperature. The mixture was cooled to ambient
temperature and the organic layer was dried over MgSO4, filtered, and concentrated under
reduced pressure. Flash column chromatography (SiO2; diethyl ether:hexane) provided 1,2:4,5-
bis-acetal 5: (1.720 g, 44 %) as a pale yellow oil. TLC Rf = 0.23 (diethyl ether:hexane, 1:1). 1H
NMR (300 MHz, CDCl3): δ 4.18 (ddd, 2H, J = 6.6, 6.6, 5.1 Hz), 4.07 (dd, 2H, J = 8.1, 6.6 Hz),
3,89 (dd, 2H, J = 8.3, 6.8 Hz), 3.60 (dt, 1H, J = 6.0, 5.1 Hz), 2.44 (d, 1H, J = 6.0 Hz), 1.45 (s,
6H), 1.38 (s, 6H).
OO O
O
OS
N
3cN
Imidazolyl thiocarbonyl derivative 3c: To a stirred solution of 1,2:4,5-bis-acetal 5 (265.2 mg,
1.143 mmol) in anhydrous 1,2-dichloroethane (4.1 mL) was added N,N -thiocarbonyl
diimidazole (396.1 mg, 2.000 mmol) at ambient temperature. The resulting brown solution was
refluxed for 4 h and then cooled to ambient temperature. The solvent was removed under
reduced pressure. Flash column chromatography (SiO2; hexane:ethyl acetate) provided
imidazolyl thiocarbonyl derivative 6 (371.8 mg, 95 %) as a yellow oil. TLC Rf = 0.30 (diethyl
ether:hexane, 3:2). 1H NMR (300 MHz, CDCl3): δ 8.38 (t, 1H, J = 0.9 Hz), 7.68 (t, 1H, J = 1.5
Hz), 7.06 (dd, 1H, J = 1.8, 0.9 Hz), 5.84 (t, 1H, J = 5.4 Hz), 4.13 (m, 4H), 3.92 (dd, 2H, J = 8.9,
5.9 Hz), 1.43 (s, 6H), 1.35 (s, 6H). HRMS: Cacld. for (M + H): 343.1328, found: 343.1312.

- 84 -
OO O
O
4c
1,2:4,5-bis-acetal 4c:118
Benzoyl peroxide (53. 4 mg, 0.216 mmol) was added to a stirred
solution of imidazolyl thiocarbonyl derivative 6 (371.8 mg 1.087 mmol) in triethylsilane (8.0
mL) at refluxing temperature. The reaction mixture was refluxed for 2h during which similar
amount of benzoyl peroxide was added after 30 min, 60 min, and 90 min, respectively. The
solvent was then removed under reduced pressure. Flash column chromatography (SiO2;
hexane:ethyl acetate) provided 1,2:4,5-bis-acetal 7 (199.7 mg, 85 %) as a yellow oil. TLC Rf =
0.71 (diethyl ether:hexane, 1:1). 1H NMR (300 MHz, CDCl3): δ 4.19 (m, 2H), 4.09 (dd, 2H, J =
8.1, 6.0 Hz), 3.62 (dd, 2H, J = 7.8, 7.4 Hz), 2.01 (m, 1H), 1.79 (dt, 1H, J = 13.8, 6.0 Hz), 1.42 (s,
6H), 1.36 (s, 6H).
HO OH
OH OH
5c
(2S,4R)-pentane-1,2,4,5-tetraol 5c: 0.5 M H2SO4 (1.0 mL) was added to a stirred solution of
1,2:4,5-bis-acetal 7 (170.0 mg, 0.787 mmol) in ethanol (1 mL) at ambient temperature. The
reaction mixture was refluxed for 3.5 h and then BaCO3 was added to adjust the pH to 7. The
resulting milky mixture was refluxed for another 10 min, cooled to ambient temperature, and
then filtered. The solid was treated with MeOH (5 mL) and the mixture was stirred at 50 oC for
10 min. Filtered again and washed the solid with another 5 mL of MeOH. The combined filtrated
was concentrated under reduced pressure. Flash column chromatography (SiO2; DCM:MeOH)
provided (2S,4R)-pentane-1,2,4,5-tetraol 5c (119.4 mg, 97 %) as a white solid. TLC Rf = 0.01
(ethyl acetate). 1H NMR (300 MHz, MeOH-d4): δ3.82 (m, 4H), 3.49 (m, 2H), 1.73 (dt, 1H, J =
14.1, 4.8 Hz), 1.53 (dt, 1H, J = 14.1, 8.1 Hz); 13
C NMR (75 MHz,MeOH-d4): δ 71.7 (CH),
67.4 (CH2), 37.7 (CH2).

- 85 -
Br Br
OAc OAc
6c
Bromoacetate 6c: To a stirred suspension of (2S,4R)-pentane-1,2,4,5-tetraol 5c (597.7 mg, 4.395
mmol) in anhydrous 1,4-dioxane (11 mL) was added acetyl bromide (0.80 mL, 10 mmol)
dropwise at 0 oC. The reaction mixture was stirred at ambient temperature overnight (22 h) and
then the solvent was removed under reduced pressure. The residue was taken up in diethyl ether
(20 mL) and washed with saturated aqueous NH4Cl. The aqueous layer was extracted with
diethyl ether (20 mL × 3), dried over MgSO4, filtered, and concentrated under reduced pressure.
1H NMR of the crude indicated the presence of the desired product bromoacetate 6c, which was
unstable and carried on immediately without further purification.
O O
7c
Diepoxide 7c: The crude bromoacetate 6c obtained from previous step was dissolved in
anhydrous diethyl ether (44 mL) and then cooled to 0 oC. Freshly ground KOH (904.7 mg, 14.51
mmol) was added to the reaction mixture in one portion. The reaction mixture was then warmed
to ambient temperature while stirred vigorously. Another portion of freshly ground KOH (905.8
mg, 14.53 mmol) was added to the reaction mixture after 1 h at 0 oC. After stirring at ambient
temperature for 5 h, the reaction mixture was filter through a pad of MgSO4. The filtrate was
carefully distilled from an ice-water bath under reduce pressure with the receiving flask
immersed in a bath at -78 oC. The pale yellow oil left in the distilling flask was in good enough
purity to be carried on. TLC Rf = 0.40 (hexane:ethyl acetate, 3:1).
I I
OH OH
8c
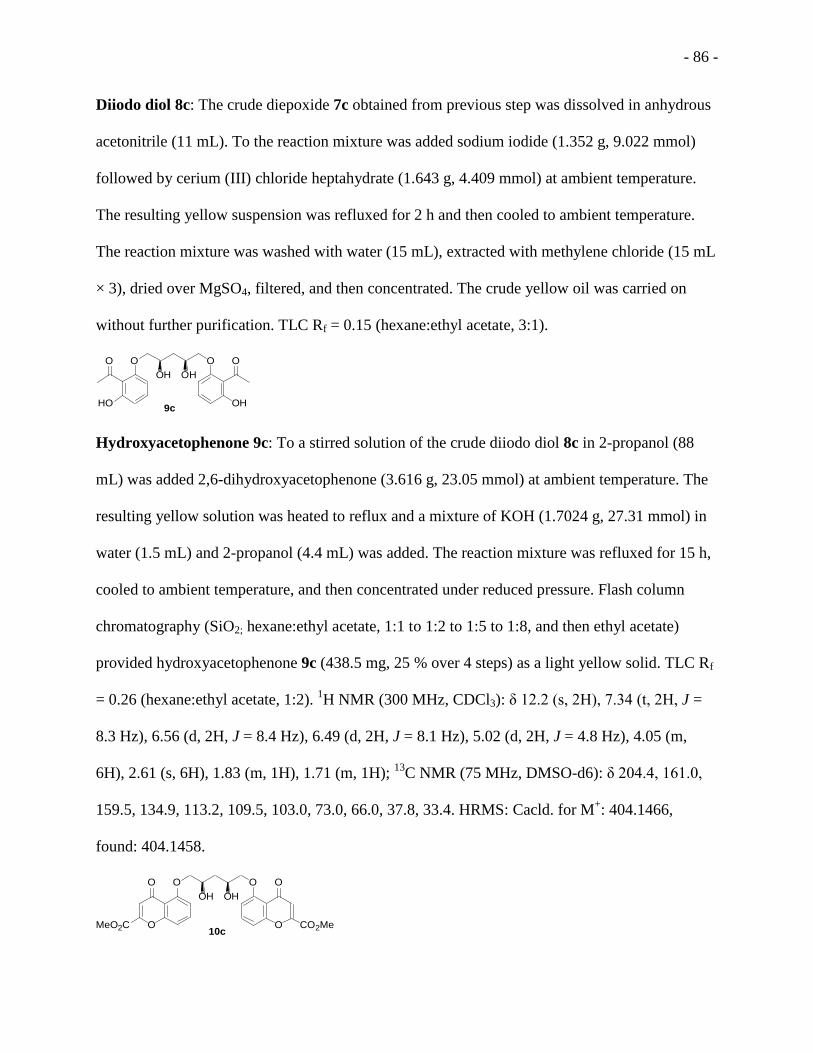
- 86 -
Diiodo diol 8c: The crude diepoxide 7c obtained from previous step was dissolved in anhydrous
acetonitrile (11 mL). To the reaction mixture was added sodium iodide (1.352 g, 9.022 mmol)
followed by cerium (III) chloride heptahydrate (1.643 g, 4.409 mmol) at ambient temperature.
The resulting yellow suspension was refluxed for 2 h and then cooled to ambient temperature.
The reaction mixture was washed with water (15 mL), extracted with methylene chloride (15 mL
× 3), dried over MgSO4, filtered, and then concentrated. The crude yellow oil was carried on
without further purification. TLC Rf = 0.15 (hexane:ethyl acetate, 3:1).
O O
HO OH
O O
OH OH
9c
Hydroxyacetophenone 9c: To a stirred solution of the crude diiodo diol 8c in 2-propanol (88
mL) was added 2,6-dihydroxyacetophenone (3.616 g, 23.05 mmol) at ambient temperature. The
resulting yellow solution was heated to reflux and a mixture of KOH (1.7024 g, 27.31 mmol) in
water (1.5 mL) and 2-propanol (4.4 mL) was added. The reaction mixture was refluxed for 15 h,
cooled to ambient temperature, and then concentrated under reduced pressure. Flash column
chromatography (SiO2; hexane:ethyl acetate, 1:1 to 1:2 to 1:5 to 1:8, and then ethyl acetate)
provided hydroxyacetophenone 9c (438.5 mg, 25 % over 4 steps) as a light yellow solid. TLC Rf
= 0.26 (hexane:ethyl acetate, 1:2). 1H NMR (300 MHz, CDCl3): δ 12.2 (s, 2H), 7.34 (t, 2H, J =
8.3 Hz), 6.56 (d, 2H, J = 8.4 Hz), 6.49 (d, 2H, J = 8.1 Hz), 5.02 (d, 2H, J = 4.8 Hz), 4.05 (m,
6H), 2.61 (s, 6H), 1.83 (m, 1H), 1.71 (m, 1H); 13
C NMR (75 MHz, DMSO-d6): δ 204.4, 161.0,
159.5, 134.9, 113.2, 109.5, 103.0, 73.0, 66.0, 37.8, 33.4. HRMS: Cacld. for M+: 404.1466,
found: 404.1458.
O
O O
OH OH
O
O
O
MeO2C CO2Me10c

- 87 -
Diester 10c: To a freshly prepared NaOMe solution (202.3 mg of sodium cube in 17.6 mL of
anhydrous MeOH) was added anhydrous diethyl ether (35.2 mL) followed by dimethyl oxalate
(1.060 g, 8.886 mmol). After the solid disappeared, hydroxylacetophenone 9c (355.7 mg, 0.880
mmol) was added to the reaction mixture. The resulting yellow solution was refluxed for 24 h,
cooled to ambient temperature, and then concentrated under reduced pressure. The yellow solid
residue was treated with water (45 mL) and acidified with concentrated HCl (0.22 mL) until pH
~ 2. The yellow precipitated was filtered off, dissolved in anhydrous MeOH, and treated with
concentrated HCl (2.7 mL). The reaction mixture was refluxed for 1.5 h, cooled to ambient
temperature and then 0 oC for 1 h. The brown precipitate was filter off and found to be the
desired product diester 10c (8.6 mg, 2 %). However, the majority of the diester 10c remained in
the filtrate as oily substance. The filtrate was concentrated to about half the volume and carried
on without further purification. 1H NMR (300 MHz, DMSO-d6): δ 7.71 (t, 2H, J = 8.4 Hz), 7.20
(d, 2H, J = 8.4 Hz), 7.08 (d, 2H, J = 8.4 Hz), 6.73 (s, 2H), 4.91 (br, 2H), 4.08 (m, 6H), 3.92 (s,
6H), 2.03 (m, 1H), 1.81 (m, 1H). HRMS: Cacld. for (M + Na)+: 563.1165, found: 563.1167.
O
O O
OH OH
O
O
O
NaO2C CO2Na1c
5 DSCG-meso-diviol 1c: To the filtrate from the previous step was added aqueous NaOH
solution (2.5 M, 5.0 mL, 13 mmol) at ambient temperature. Some pale brown precipitate formed
and the pH of the liquid was approximately 1. The reaction mixture was warmed to reflux and
treated with NaOH pellet in 10 portions. The resulting suspension was refluxed for 1.5 h, cooled
to ambient temperature, and then 0 oC for 30 min. The pale brown precipitate was collected by
centrifugation and dried under vacuum overnight. 5 DSCG-meso-diviol 1c was obtained as pale
brown powder (332.3 mg, 73% over 2 steps). 1H NMR (300 MHz, D2O): δ 7.58 (t, 2H, J = 8.4

- 88 -
Hz), 7.06 (d, 2H, J = 8.4 Hz), 6.91 (d, 2H, J = 8.4 Hz), 6.60 (s, 2H), 4.25 (m, 4H), 4.09 (m, 2H),
2.36 (m, 1H), 1.92 (m, 1H); 13
C NMR (75 MHz, D2O): 181.1, 165.1, 157.0, 156.9, 156.2, 135.2,
113.1, 112.1, 110.7, 108.4, 72.5, 65.9, 37.6. HRMS Cacld. for (M + Na)+: 579.0491, found:
579.0471.
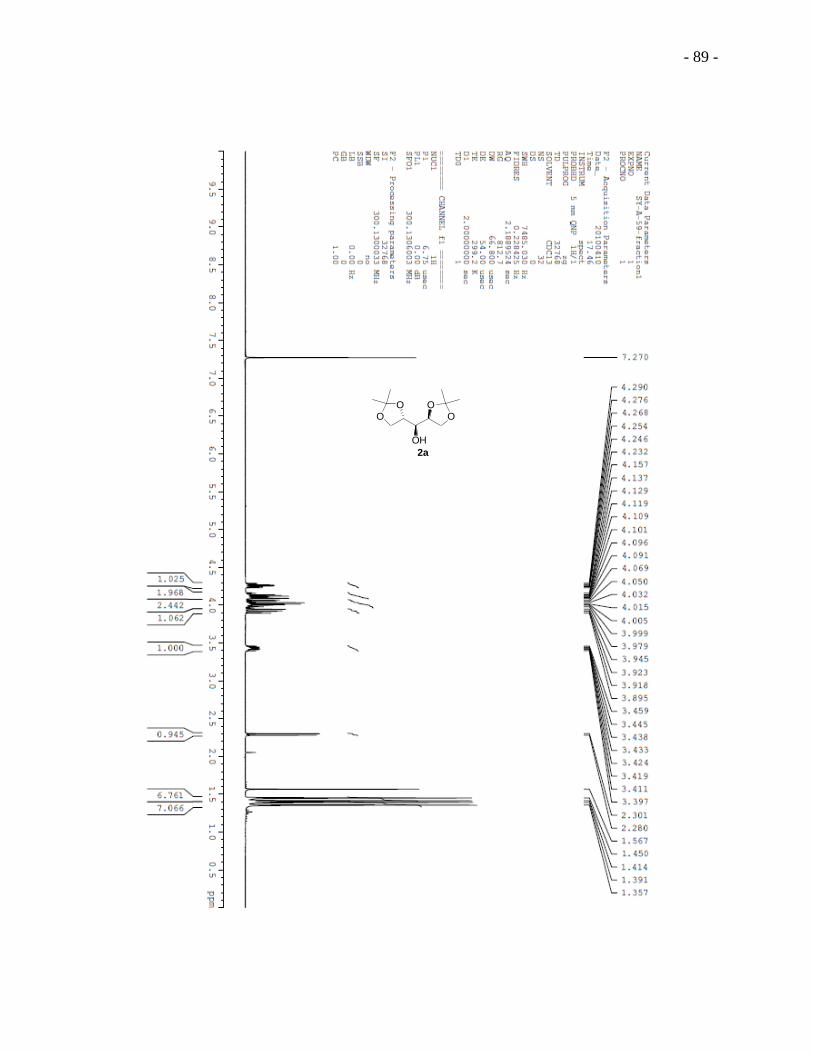
- 89 -
OO O
O
OH
2a
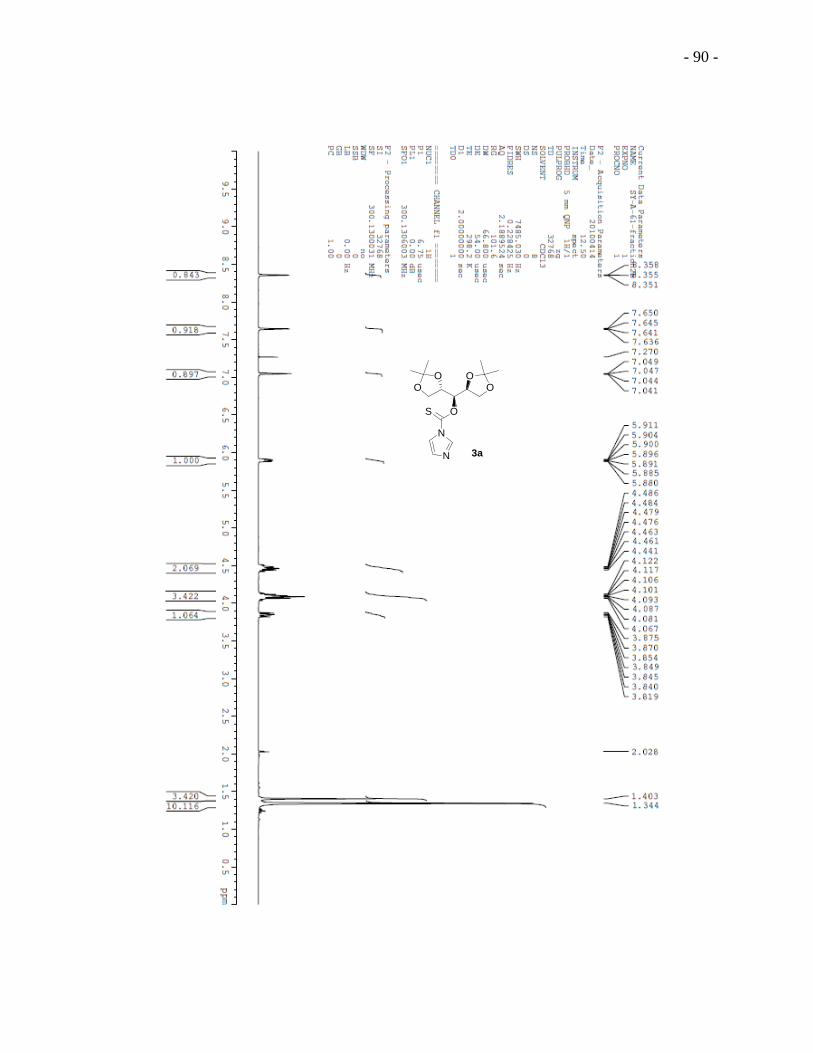
- 90 -
OO O
O
OS
N
N 3a

- 91 -
OO O
O
OS
N
N 3a

- 92 -
HO OH
OH OH
5a

- 93 -
HO OH
OH OH
5a
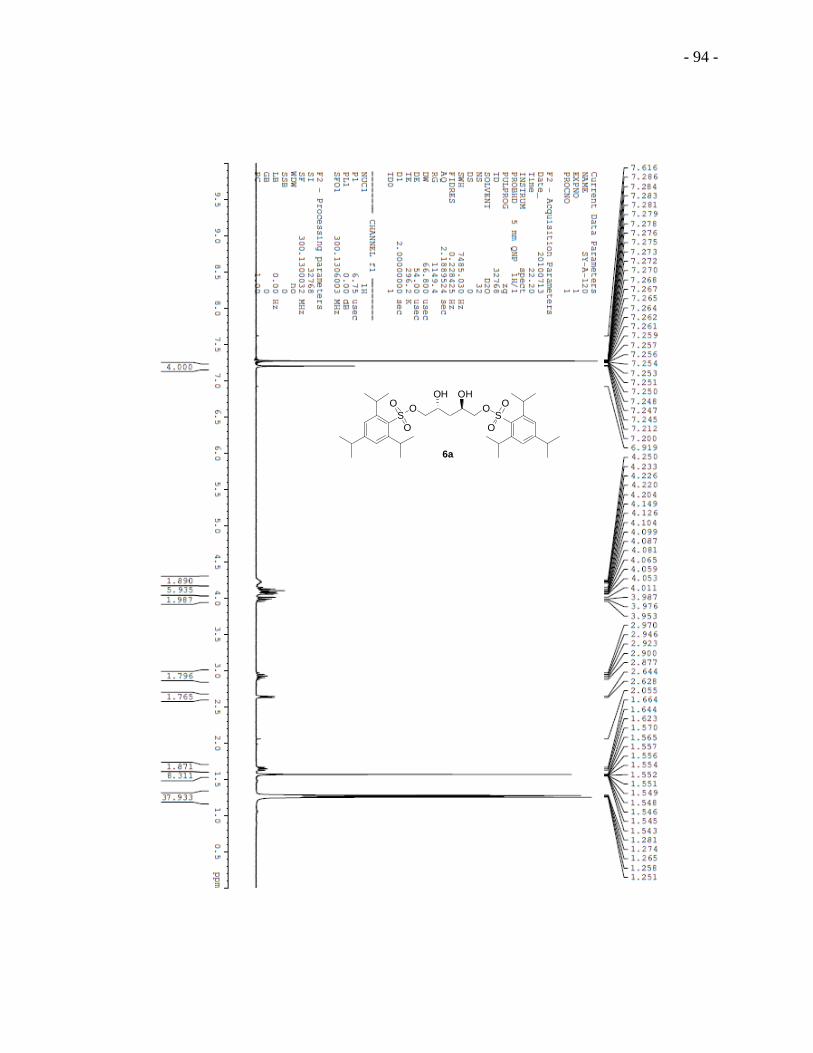
- 94 -
O OS S
O
O
O
O
OH OH
6a
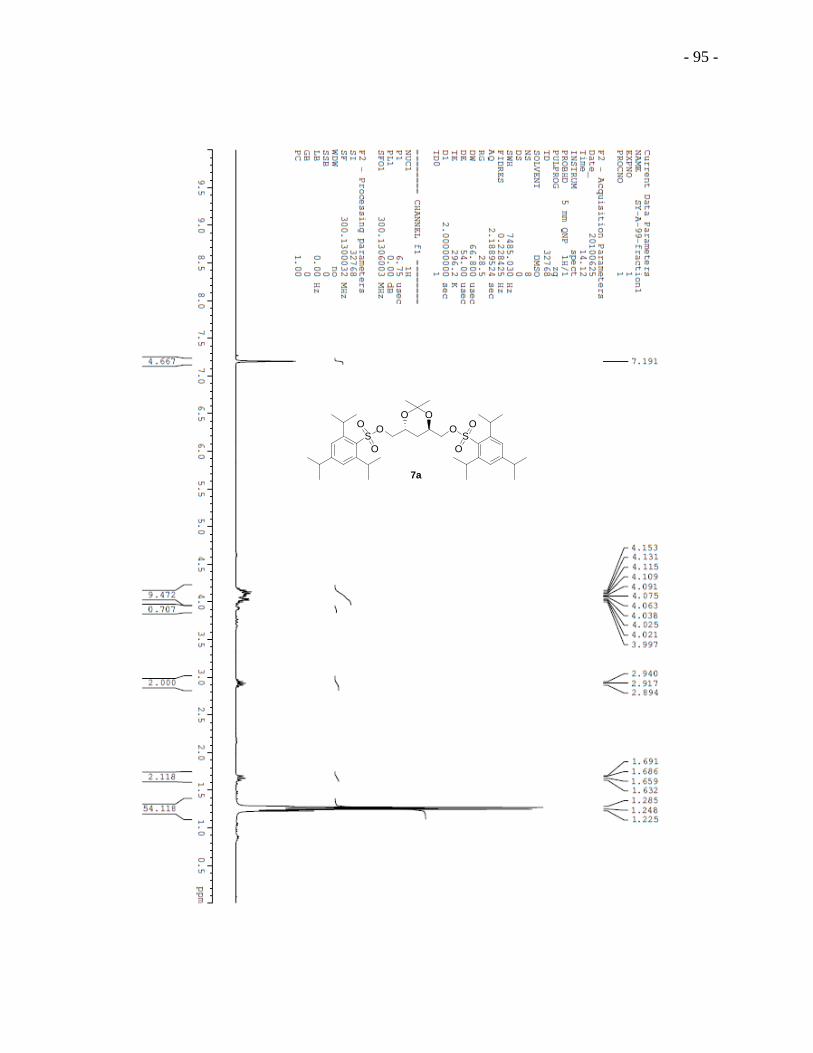
- 95 -
O OS S
O
O
O
O
OO
7a

- 96 -
O OS S
O
O
O
O
OO
7a
I I
O O
8a
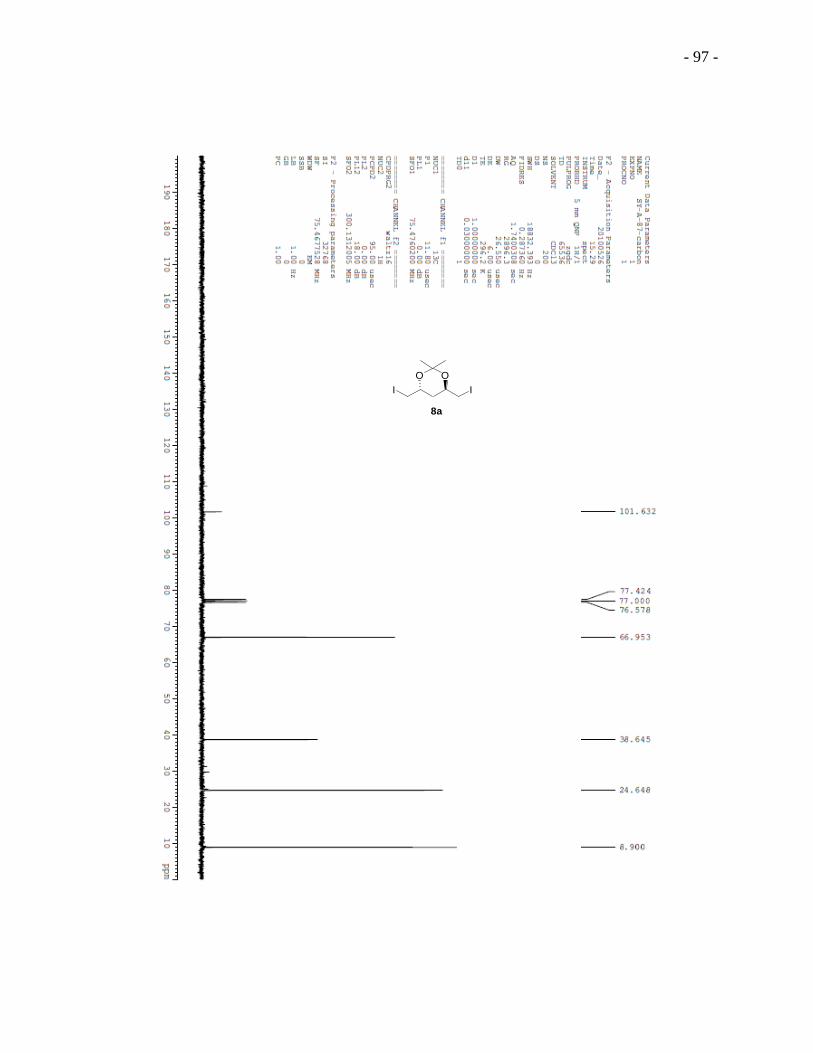
- 97 -
I I
O O
8a

- 98 -
I I
OH OH
9a

- 99 -
I I
OH OH
9a
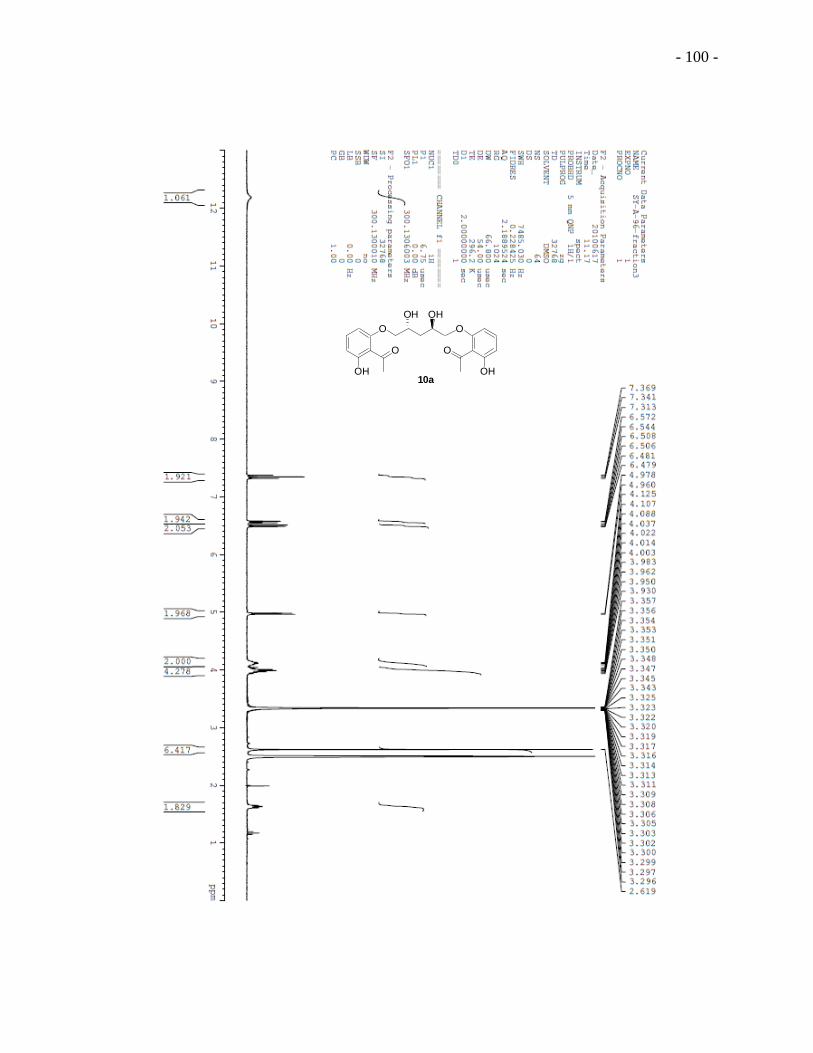
- 100 -
O O
OH OH
OH OH
OO
10a

- 101 -
O O
OH OH
O O
OO
CO2Me CO2Me11a

- 102 -
O O
OH OH
O O
OO
CO2Me CO2Me11a

- 103 -
O O
OH OH
O O
OO
CO2Me CO2Me11a
O
O O
OH OH
O
O
O
NaO2C CO2Na1a
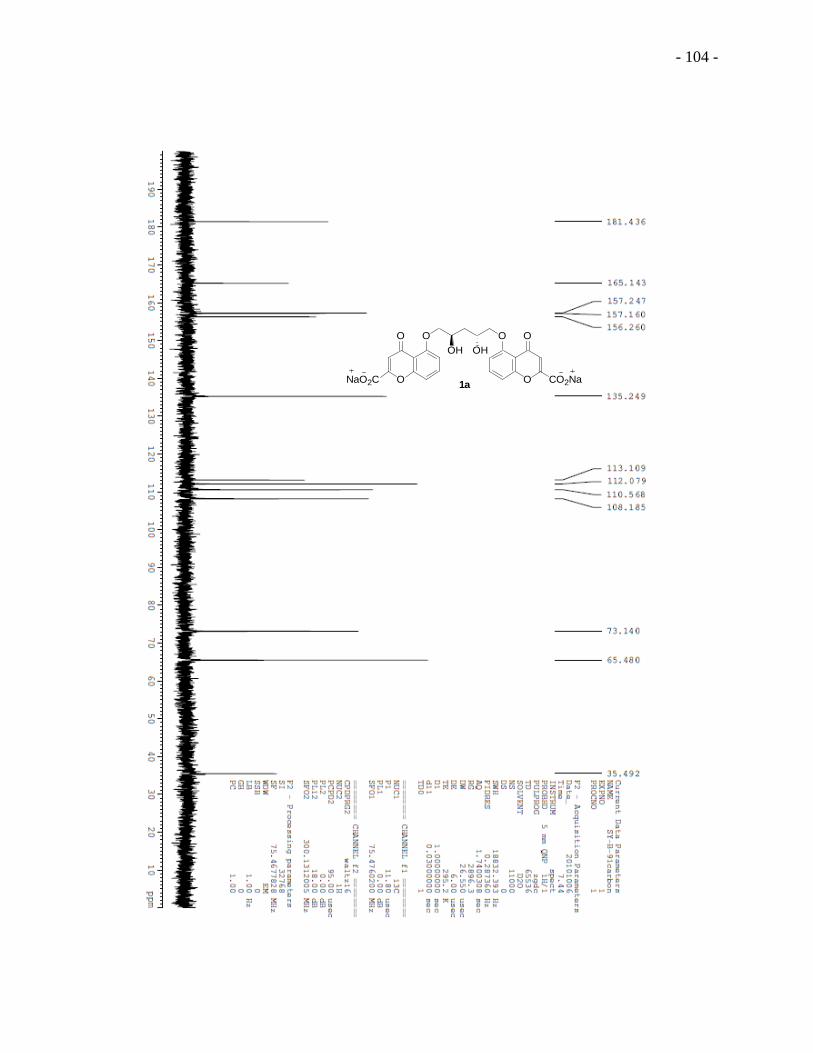
- 104 -
O
O O
OH OH
O
O
O
NaO2C CO2Na1a

- 105 -
O O
OH OH
O O
OO
CO2Na CO2Na12a
RR
OO O
O
OH
2b
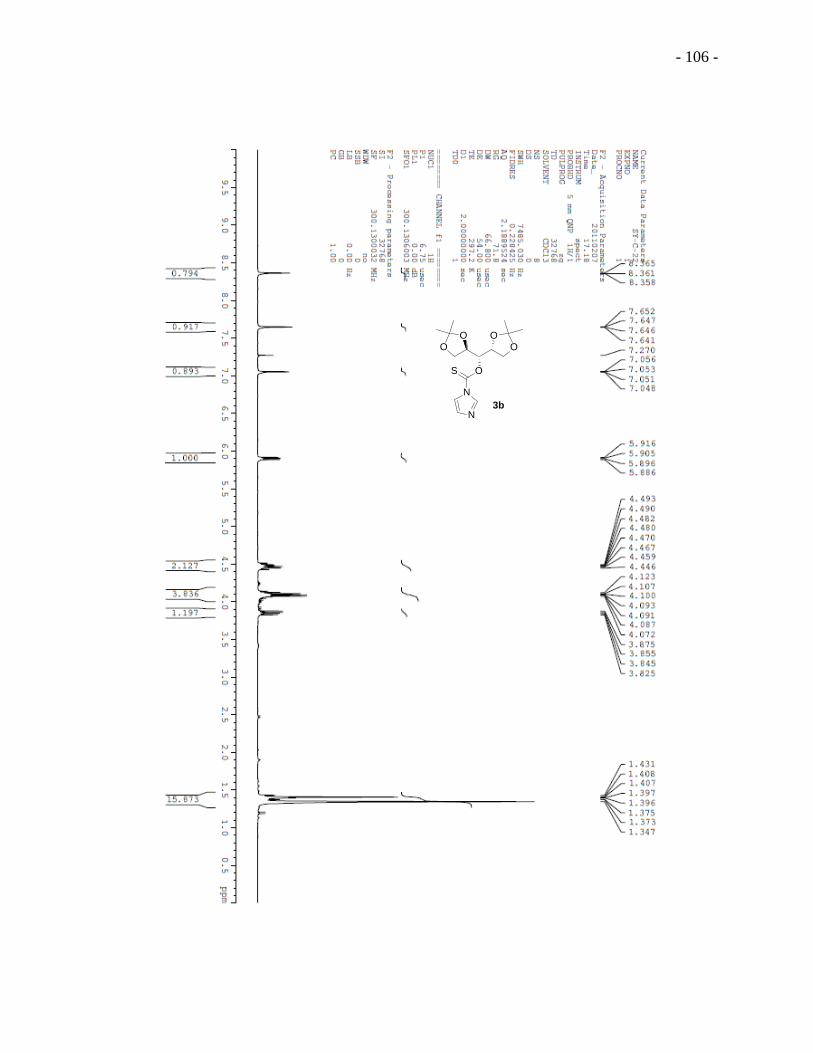
- 106 -
OO O
O
OS
N
3bN

- 107 -
OO O
O
OS
N
3bN

- 108 -
HO OH
OH OH
5b

- 109 -
TPSO OTPS
OH OH
6b

- 110 -
O OS S
O
O
O
O
OO
7b

- 111 -
O OS S
O
O
O
O
OO
7b
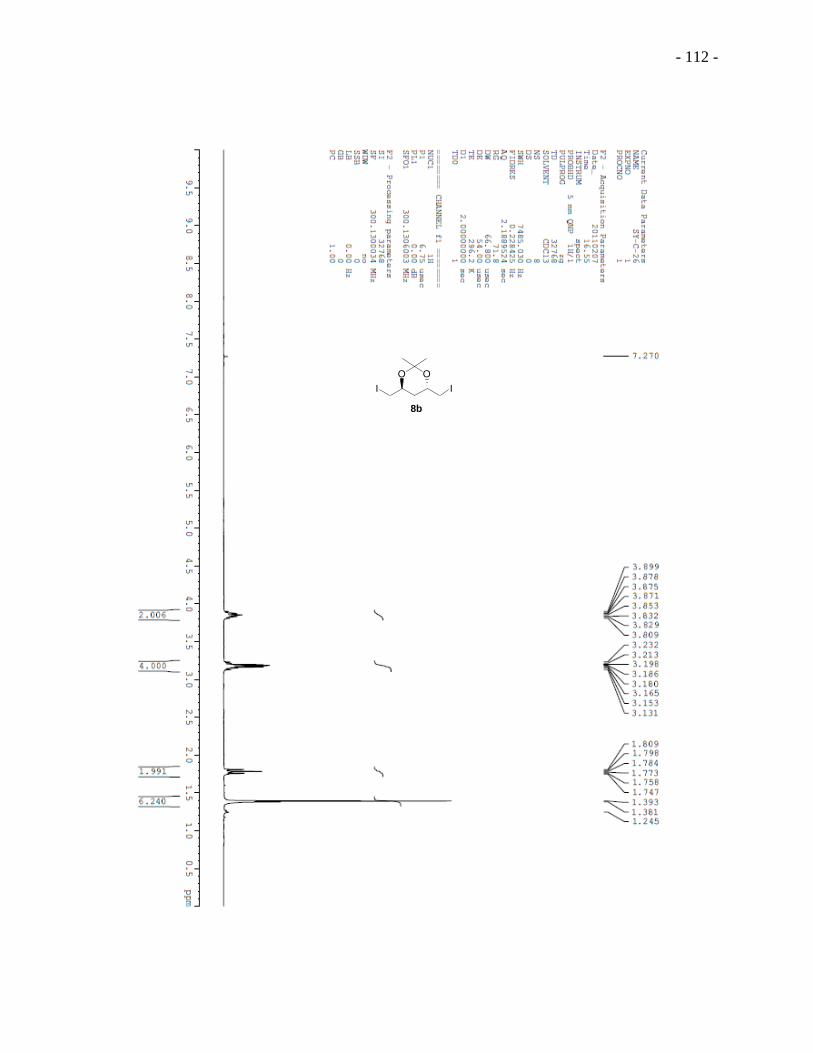
- 112 -
I I
O O
8b

- 113 -
I I
O O
8b

- 114 -
I I
OH OH
9b

- 115 -
I I
OH OH
9b

- 116 -
I I
OH OH
9b
O O
OH OH
OH OH
OO
10b

- 117 -
O O
OH OH
OH OH
OO
10b
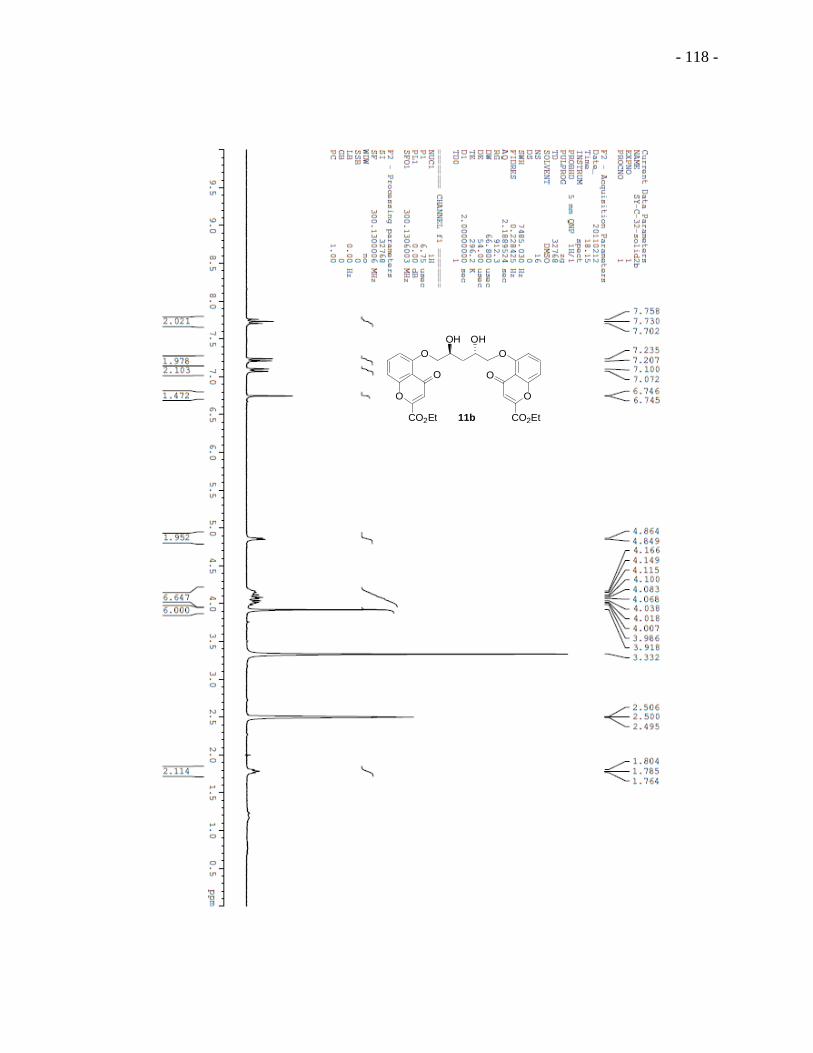
- 118 -
O O
OH OH
OH OH
OO
10b
O O
OH OH
O O
OO
CO2Et CO2Et11b

- 119 -
O O
OH OH
O O
OO
CO2Et CO2Et11b

- 120 -
O
O O
OH OH
O
O
O
NaO2C CO2Na1b

- 121 -
O
O O
OH OH
O
O
O
NaO2C CO2Na1b

- 122 -
O O
OH OH
O O
OO
CO2Na CO2Na12b
S S
OO O
O
OH
2c

- 123 -
OO O
O
OS
N
3cN
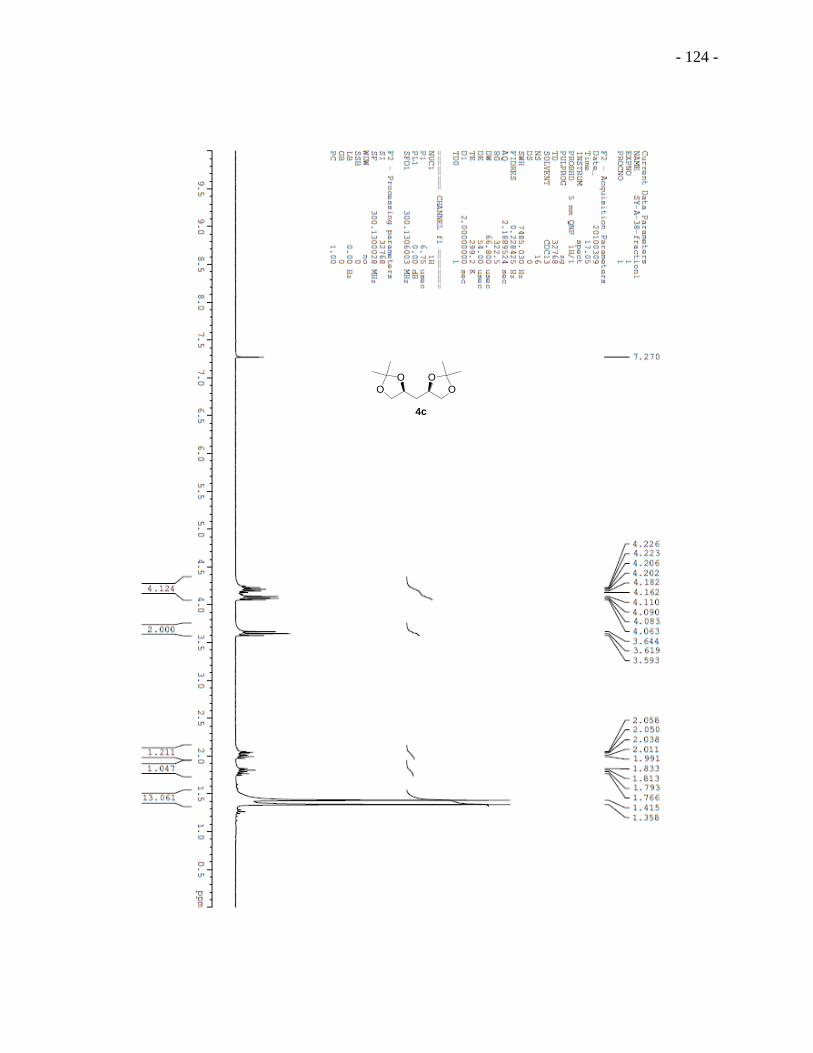
- 124 -
OO O
O
OS
N
3cN
O
O O
O
4c

- 125 -
HO OH
OH OH
5c
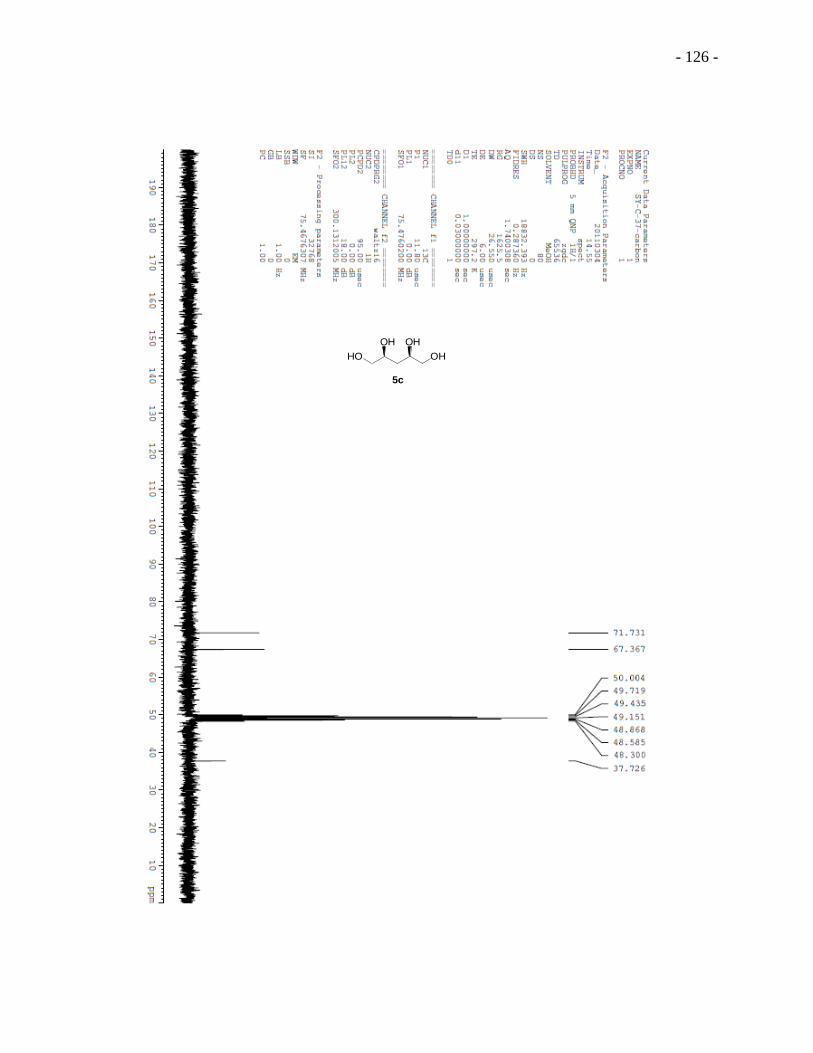
- 126 -
HO OH
OH OH
5c

- 127 -
O O
OH OH
OH OH
OO
9c

- 128 -
O O
OH OH
OH OH
OO
9c

- 129 -
O O
OH OH
OH OH
OO
9cO O
OH OH
O O
OO
CO2Me CO2Me10c

- 130 -
O O
OH OH
O O
OO
CO2Me CO2Me10c
O
O O
OH OH
O
O
O
NaO2C CO2Na1c

- 131 -
O
O O
OH OH
O
O
O
NaO2C CO2Na1c

- 132 -
OO O
O
OH
2a
OO O
O
OS
N
N 3a
OO O
O
OS
N
N 3a
OO O
O
4a
HO OH
OH OH
5a
O OS S
O
O
O
O
OO
7bI I
O O
8b
I I
OH OH
9b
I I
OH OH
9b
I I
OH OH
9b
O O
OH OH
OH OH
OO
10b
O O
OH OH
OH OH
OO
10b
O O
OH OH
O O
OO
CO2Et CO2Et11b
O O
OH OH
O O
OO
CO2Et CO2Et11b
O O
OH OH
O O
OO
CO2Et CO2Et11b
O O
OH OH
O O
OO
CO2Na CO2Na12b
S SO O
OH OH
O O
OO
CO2Na CO2Na12b
S S
OO O
O
OH
2c
OO O
O
OS
N
3cN
OO O
O
OS
N
3cN
O
O O
O
4c
HO OH
OH OH
5c
O O
OH OH
OH OH
OO
9c
O
O O
OH OH
O
O
O
NaO2C CO2Na1c

- 133 -
Chapter 3
Bicyclic Brominated Furanones: A new Class of Quorum Sensing Modulators that Inhibit
Biofilm Formation with Reduced Toxicity, and Improved Bacterial Clearance in vivo
Summary
Both natural and synthetic brominated furanones are known to inhibit biofilm formation by
bacteria, but their toxicity to mammalian or human cells is often not reported. Here, we designed
and synthesized a new class of bicyclic brominated furanones (BBFs) that contained only one
bromide group with controlled regiochemistry. This class of molecules exhibited significant
reduction in the toxicity to human neuroblastoma SK-N-SH cells and did not inhibit bacterial (E.
coli and P. aeruginosa) growth, but retained the inhibitory activity towards biofilm formation
and virulence factor expression of bacteria. A representative compound 6-BBF also increased the
susceptibility of P. aeruginosa in biofilms to the antibiotic tobramycin. All BBFs exhibited
antagonistic activities in the lasI quorum sensing circuit, while only 5-BBF showed agonistic
activity for the rhlI quorum sensing circuit. Furthermore, 6-BBF significantly improved P.
aeruginosa clearance in the lung of mice in an immunocompromised pneumonia mouse model in
vivo. This study suggests that structural variation of brominated furanones can be designed for
targeted biological activities.
3.1 Background and Significance
3.2.1 Quorum sensing and autoinducers
A number of bacteria species use small molecule signals to coordinate gene expression in a
cell-density dependent manner. This mechanism of sophisticated intercellular communication is

- 134 -
termed quorum sensing (QS).119,120
Quorum-sensing bacteria intracellularly synthesize small
diffusible molecules (autoinducers or AIs) that are released into the surroundings. The
extracellular concentration of AIs increases as the number of cells in a bacterial colony increases.
Upon reaching a threshold concentration, AIs bind to cognate receptors within the bacterial cells,
triggering a signal transduction cascade that results in a population-wide alteration in gene
expression. Therefore, the response of bacterial population of AIs facilitates multicellular
activities, such as bioluminescence, virulence factors expression, swarming, biofilm formation,
production of antibiotics, conjugation and sporulation.121
The first QS system studied was that in
the marine bacterium Vibrio fischeri which produces luminescence at high but not low cellular
densities.122
Although originally thought to be limited to a small number of marine bacterial
species, it is now widely recognized that QS is a common part of regulatory machinery utilized
by many bacterial species.120,123
A number of AIs have been identified, among which N-acyl
homoserine lactones (AHLs) are the most common signals used by Gram-negative bacteria and
oligopeptides by Gram-positive bacteria. A furanosyl borate diester (autoinducer-2 or AI-2) is
produced and used by both Gram-negative and Gram-positive bacteria and is proposed to enable
interspecies communication.124
Other small molecule signals have also been associated with QS
in Gram-negative bacteria, such as 2-heptyl-3-hydroxy-4-quinolone (PQS) used by P.
aeruginosa.125,126
One of the best-understood bacterial QS systems to date is that mediated by AHLs, which are
composed of a homoserine lactone ring (HSL) and an acyl chain. The types of AHLs produced
vary greatly among bacterial species (Table 3.1). Some species such as Agrobacterium
tumefaciens127
and Erwinia carotovara128
produce mainly a single type of AHL, N-(3-oxo-
octanoyl)-L-homoserine lactone (3-oxo-C8-HSL) for Agrobacterium tumefaciens and N-(β-

- 135 -
ketocaproyl)-L-homoserine lactone (3-oxo-C6-HSL) for Erwinia carotovara, respectively. Other
species such as Pseudomonas aeruginosa has two AHL synthases, LasI and RhlI, which produce
N-(3-oxo-dodecanoyl)-L-homoserine lactone (3-oxo-C12-HSL)129
and N-butanoyl-L-homoserine
lactone (C4-HSL)130
, respectively. In addition, some of the AHLs are produced by multiple
species. For example, 3-oxo-C6-HSL is produced by both Erwinia carotovara and Vibrio
fischeri.122

- 136 -
Table 3.1 Representative AHL systems and corresponding bacteria. (Adapted and modified from
the review by Spring and co-workers.131
)
aAHL abbreviation used in this chapter.
bQscR is an orphan receptor that responds to 3-oxo-C12-
HSL produced by LasI. cThis system is distinct from the typical V. fischeri as the genes coding
for LuxM and LuxN are not homologs with LuxI and LuxR.
Bacterium AHL Nomenclaturea LuxI/R homologs
3-oxo-C8-HSL TraI/R
C8-HSL CepI/R
C6-HSL CviI/R
3-oxo-C6-HSL ExpI/R; CarI/R
3-oxo-C12-HSL LasI/R; QscRb
C4-HSL RhlI/R
3-oxo-C12-HSL PpuI/R
3-oxo-C6-HSL
SpnI/SpnR
C6-HSL
3-oxo-C6-HSL LuxI/R
C8-HSL AinS/R
3-hydroxy-C4-HSLGenerated by LuxM,
detected by LuxNc
Agrobacterium
tumeaciens
Burkholderia
cenocepacia
Chromobacterium
violaceum
Erwinia
carotovara
Pseudonmonas
aeruginosa
Pseudonmonas
putida
Serratia
marcescens AS-1
Vibrio
fischeri
Vibrio
harveyic
NH
O
OO
O
NH
O
O
O
NH
O
O
O
NH
O
OO
O
NH
O
OO
O
NH
O
O
O
NH
O
OO
O
NH
O
OO
O
NH
O
OOH
O
NH
O
O
O
NH
O
OO
O
NH
O
O
O
- 137 -
3.2.2 Biofilm formation and consequences
Biofilms are surface-attached sessile communities of microorganisms enclosed in
extracellular polymeric substance (EPS). Approximately 65-80% of microbial infections
occurring in human body are biofilm-related according to the National Institute of Health (NIH)
estimation.132
Biofilms are associated with many diseases including tooth decay, catheter
infections, endocarditis, otitis media, chronic prostatitis, periodontal disease, chronic urinary
tract infections, and osteomyelitis,133-135
and cause enormous burden and detrimental effects in
medical and industrial settings.136,137
For example, the nosocomial infections caused and
perpetuated by the persistent bacterial biofilm colonization of hospital facilities place a $10
billion burden on the U.S. healthcare system annually.138
The formation of biofilm is regulated by multiple genes in the quorum sensing systems,
which results in highly complex biofilm structures on the surface of microbes.123,139,140
There are
several stages of biofilm formation (Figure 3.1).141
After the initial reversible attachment of
planktonic cells to a surface and irreversible attachment of the cells by secreting extracellular
polymeric matrix, quorum sensing triggers further development of biofilm and maturation.
Finally, the dispersion allows the detachment of cells from the biofilm and colonization of new
surfaces. The bacteria reside in the complex structure of biofilm are often up to 1000-fold more
tolerant to antibiotics and biocides than planktonic bacteria.133,142-144

- 138 -
Figure 3.1 Five stages of biofilm development: (1) initial reversible attachment of planktonic
cells, (2) irreversible attachment of cells, (3) early development of biofilm, (4) maturation of
biofilm, and (5) dispersion and release of cells.145
[Citation: Monroe D (2007) Looking for
Chinks in the Armor of Bacterial Biofilms. PLoS Biol 5(11): e308.
Doi:10.1371/journal.pbio.0050307; Image Credit: D. Davies; Copyright: ©2007 Don Monroe.
This is an open-access article distributed under the terms of the Creative Commons Attribution
License, which permits unrestricted use, distribution, and reproduction in any medium, provided
the original author and source are credited].
There are several mechanisms of biofilm resistance to antimicrobial compounds, which vary
with the species of bacteria present in the biofilm and the antimicrobials used.133,144
One of the
mechanisms is the failure of an agent to penetrate the biofilm. It has been suggested that the
exopolysaccharide matrix, one of the characteristics of biofilms, can be an initial barrier and
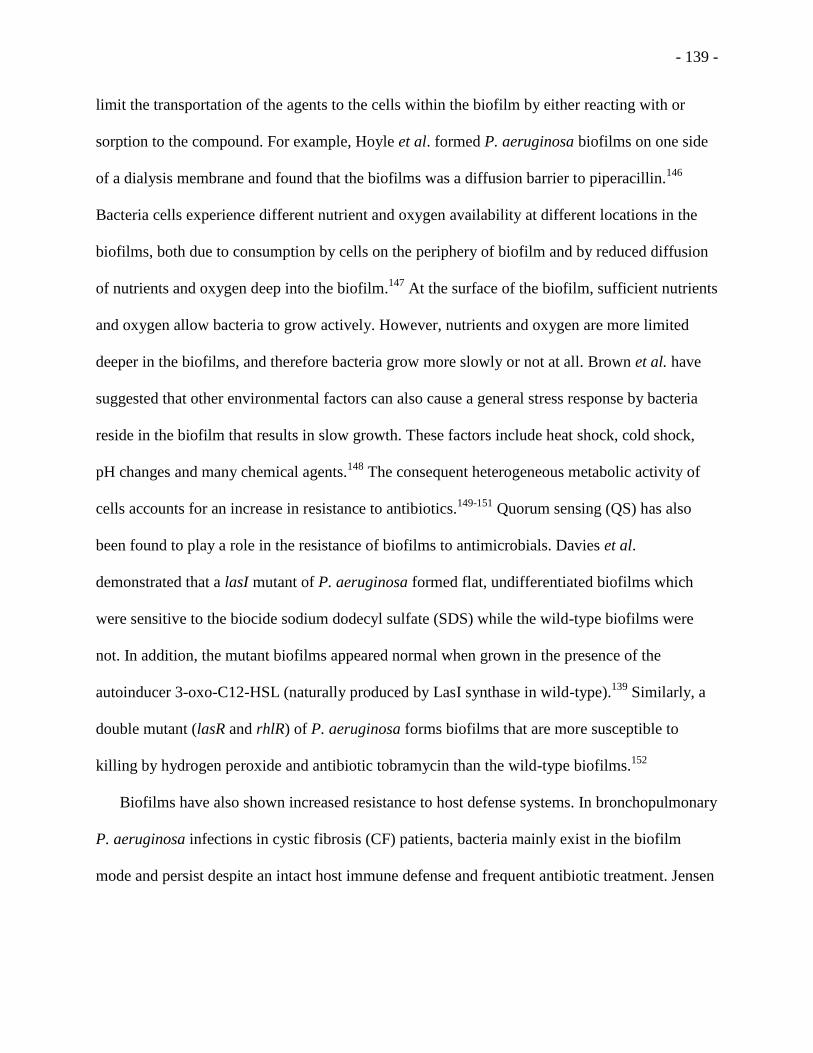
- 139 -
limit the transportation of the agents to the cells within the biofilm by either reacting with or
sorption to the compound. For example, Hoyle et al. formed P. aeruginosa biofilms on one side
of a dialysis membrane and found that the biofilms was a diffusion barrier to piperacillin.146
Bacteria cells experience different nutrient and oxygen availability at different locations in the
biofilms, both due to consumption by cells on the periphery of biofilm and by reduced diffusion
of nutrients and oxygen deep into the biofilm.147
At the surface of the biofilm, sufficient nutrients
and oxygen allow bacteria to grow actively. However, nutrients and oxygen are more limited
deeper in the biofilms, and therefore bacteria grow more slowly or not at all. Brown et al. have
suggested that other environmental factors can also cause a general stress response by bacteria
reside in the biofilm that results in slow growth. These factors include heat shock, cold shock,
pH changes and many chemical agents.148
The consequent heterogeneous metabolic activity of
cells accounts for an increase in resistance to antibiotics.149-151
Quorum sensing (QS) has also
been found to play a role in the resistance of biofilms to antimicrobials. Davies et al.
demonstrated that a lasI mutant of P. aeruginosa formed flat, undifferentiated biofilms which
were sensitive to the biocide sodium dodecyl sulfate (SDS) while the wild-type biofilms were
not. In addition, the mutant biofilms appeared normal when grown in the presence of the
autoinducer 3-oxo-C12-HSL (naturally produced by LasI synthase in wild-type).139
Similarly, a
double mutant (lasR and rhlR) of P. aeruginosa forms biofilms that are more susceptible to
killing by hydrogen peroxide and antibiotic tobramycin than the wild-type biofilms.152
Biofilms have also shown increased resistance to host defense systems. In bronchopulmonary
P. aeruginosa infections in cystic fibrosis (CF) patients, bacteria mainly exist in the biofilm
mode and persist despite an intact host immune defense and frequent antibiotic treatment. Jensen
- 140 -
et al. showed a reduced activation of a complex of blood serum proteins of the immune system in
biofilm-grown P. aeruginosa compared with planktonic cells.153
3.2.3 Use quorum sensing modulators to control biofilm formation
Controlling the formation of biofilm has been challenging because inhibition of biofilm
formation and dispersion of already formed biofilm are difficult.154
One rational approach to
control biofilm formation is to interfere with the chemical communication that results in a
quorum sensing between bacteria, which is one of the key events leading to the biofilm
formation.121,139 Existing antibiotics generally inhibit bacterial cellular processes that are
essential for survival and thus exerts an evolutionary selective pressure for drug-resistant
mutations.155
Although quorum sensing is essential for bacterial group behaviors such as biofilm
formation and production of virulence factors, it is not essential for survival.156
Thus inhibiting
quorum sensing may inhibit biofilm formation and attenuate pathogenicity without leading to the
development of drug-resistance.
The QS circuit in V. fischeri, the first discovered AHL-mediated system of its kind, is
composed of the autoinducer synthase LuxI, which is responsible for the synthesis of AHL
autoinducer, and the receptor LuxR, which is a transcriptional activator and upon binding to the
cognate autoinducer, promotes transcription of the luciferase structural operon luxCDABE and
the production of more AHL autoinducer.157-159
This circuit is the basic paradigm for AHL-based
QS systems in Gram-negative bacteria. The majority of autoinducer synthases and receptors
subsequently discovered in other Gram-negative bacteria are termed LuxI-type and LuxR-type
proteins, respectively. Even though several bacteria species have been demonstrated to have a
more complicated system for cell-to-cell signaling which involves more than one AHL signaling

- 141 -
molecules, and even other types of AIs, the general principles of AHL-based QS apply to the
majority of Gram-negative bacteria.
The strategies applied to inhibit QS can be generally separated into three categories. The first
is to interfere with the AHL production by targeting LuxI-type synthase protein. The second is to
interfere with the AHL signaling molecules themselves. And the majority of work focuses on the
third category that is to discover agents which can interact with the LuxR-type receptors. In this
chapter, I will mainly discuss existing examples and our efforts to synthesize and identify small
molecules as quorum sensing inhibitors (QSIs).
One of the most significant efforts lies in the design and synthesis of mimics to natural AHL
autoinducers. Several synthetic autoinducer analogs have been reported to induce or inhibit
quorum sensing of Gram-negative bacteria. Suga and coworkers reported autoinducer analogues
that reduced the production of virulence factors and biofilm formation by inhibiting quorum
sensing in P. aeruginosa.160,161
They also found that the agonist/antagonist activity of these
molecules could be tuned by structural modifications. Blackwell and coworkers reported a series
of systematic and comprehensive studies of synthesis of range of non-natural AHLs which were
shown to inhibit quorum sensing.162-167
Some of these AHLs were found to selectively modulate
one, two, or three LuxR-type proteins, namely LuxR in V. fischeri, TraR in A. tumefaciens, and
LasR in P. aeruginosa. Moreover, a few synthetic AHLs show moderate to high inhibition of
biofilm formation by the opportunistic pathogen P. aeruginosa.162,167
3.2.4 Other biofilm inhibitors
By dissecting the natural products instead of mimicking natural AHL autoinducers, Melander
and coworkers reported a library of 2-aminoimidazole derivatives that can inhibit and disperse
- 142 -
biofilm formation by one or multiple species, including Escherichia coli,168,169
Pseudomonas
aeruginosa,169,170
Acinetobacter baumannii,169
Bordetella bronchiseptica,171
Enterococcus
faecium,171
Streptococcus mutans,172
and methicillin-resistant Staphylococcus aureus
(MRSA).173
Davies et al. discovered that a fatty acid produced by P. aeruginosa is able to induce
dispersion of biofilms formed by a number of other bacterial species.174
Chemical library
screening has also been utilized to discover biofilm formation inhibitors.175-178
3.2.5 Quorum sensing and biofilm inhibitors with furanone moiety
Brominated furanones (BFs) were first isolated in 1970s from a red marine alga Delisea
pulchra largely unfouled in nature,179,180
found on the south-eastern coast of Australia. They are
released on the surface of the alga and inhibit the colonization by both prokaryotes and
eukaryotes,181,182
and are proposed to be an evolutionary response to the adverse effects of AHL-
driven colonization. Brominated furanones differ on the extent of bromination, both on the
furanone ring and on the exocyclic alkene, as well as on the substitution of the alkyl chain with
hydroxy or acetoxy functionality (Figure 3.2). There are apparent structural similarities between
brominated furanones and AHLs: both groups of compounds consist of a relatively polar “head”
and a non-polar aliphatic carbon “tail”. Studies have shown that some of the natural brominated
furanones are capable of inhibiting biofilm formation and swarming of both Gram-positive and
Gram-negative bacteria.183,184
These findings have led to the efforts to chemically modify the
furanone scaffold to identify the key components in the structure for biological activity and to
discover potent modulators of biological activities.

- 143 -
Figure 3.2 A few examples of brominated furanones isolated form extracts of Delisea pulchra.
A few brominated furanones have thus been synthesized and studied along with natural
brominated furanones for their activity to modulate quorum sensing and biofilm formation
(Figure 3.3). Both natural and synthetic brominated furanones were reported to control the
expression of AHL-dependent phenotypes.185
As a result, many brominated furanones have been
shown to inhibit a wide range of quorum sensing-controlled activities, including
bioluminescence,186-189
swarming,186,190-194
biofilm formation, 183,192,194-201
production of
prodigiosin,193,202
and production of virulence factor.195,203-206
Brominated furanones are also
reported to restore the antibiotic tolerance of persister cells.207
To give a few examples, Hentzer
et al. used in vitro studies to demonstrate that brominated furanone 1 inhibit QS-controlled
reporter genes and virulence factor expression. Although this compound did not inhibit the
formation of biofilms, it did affect biofilm architecture.195
In a subsequent study, brominated
furanone 2 was shown to not only inhibit virulence factor expression of P. aeruginosa both in
vitro and in vivo but also increased the susceptibility of P. aeruginosa biofilms to SDS and
antibiotic tobramycin. Moreover, in a mouse pulmonary infection model, compound 2
accelerated clearances of infecting bacteria from the lungs by the host.208
Wu et al. found that
both brominated furanones 1 and 2 were able to accelerate bacterial clearance in the lungs of
infected mice and reduced the severity of lung pathology. In mice treated with lethal P.
aeruginosa infections, treatment of compound 1 significantly prolonged the survival time.209
In
an effort to investigate the important structural elements responsible for biological activities of
OO
Br
Br
OO
Br
Br
OO
BrOO
Br
Br
OH OAc
OO
BrOO
Br
OH OAc

- 144 -
brominated furanones, Han et al. discovered potent inhibitors 3-5 for E.coli biofilms, together
with inactive compounds 6 and 7, as well as compounds 8 and 9, which are toxic to the growth
of strain E. coli RP437.198
Janssens et al. reported that brominated furanone 10 inhibit flagella
biosynthesis and biofilm formation by Salmonella enterica and increased the susceptibility of
Salmonella biofilms to antibiotics without affecting currently known QS systems in
Salmonella.210
A couple of adamantine tethered brominated furanones 13 and 14, together with
some of the synthesis intermediate 11 and 12, were tested for their cytotoxicity and inhibitory
activity of biofilm formation of the strain E. coli RP437.211
All the molecules tested in this work
showed moderate inhibition of biofilm formation without having significant impact on the
growth of bacteria under the conditions tested.
Figure 3.3 Examples of synthetic brominated furanones.
The mechanism of how brominated furanones interfere with quorum sensing is still unclear.
Manefield et al. demonstrated that brominated furanones may inhibit QS by binding to and
inducing degradation of the LuxR-type protein.185
Defoirdt et al. indicated that a natural
brominated furanone from Delisea pulchra blocks QS in V. harveyi by disabling the LuxR
OO
Br
OO
BrOO
BrOO
BrOO
Br
Br
OO
Br
Br
Br
OO
Br
Br
OO
Br
Br
OO
Br
Br
OO
Br
BrBr
Br
Br Br
BrBr
Br
Br
O
OH
OO
Br
OOO
Br
OO
Br
OO
Br
1 2 43 5
6 7 98 10
11 12 13 14
Br
- 145 -
protein to bind to the promoter sequence of QS-regulated genes.212
It is also proposed that
brominated furanones may disrupt AHL-mediated QS by competitively binding to the receptor
site.186,191,195,213-215
A natural brominated furanone from Delisea pulchra was suggested to inhibit
QS of E .coli via AI-2.184,216
In this work, we aim to develop new structures of inhibitors of biofilm formation that are
nonmicrobicidal to bacteria and nontoxic to mammalian cells which should have potent use in
clinics. Han et al. designed and studied a library of structurally closely related synthetic
brominated furanones and suggested the most important structural element of this class of
molecules to be a conjugated exocyclic vinyl bromide on the furanone ring as in compounds 3-5.
Supporting this hypothesis, brominated furanones 6 and 7 lack the conjugated exocyclic vinyl
bromide and were inactive. Brominated furanones 8 and 9 which bear monosubstituted bromides
on an exocyclic methyl group were found to be toxic to the growth of E. coli cells.198
Based on
these findings, we speculated that a bicyclic version of brominated furanones which retain the
conjugated exocyclic vinyl bromide in the furanone moiety could potentially reduce their toxicity
while retaining the biofilm inhibitory activities. Therefore, we designed a new class of bicyclic
brominated furanones (BBFs), 5-BBF 15, 6-BBF 16, and 7-BBF 17, with [3,3,0], [4,3,0], and
[5,3,0]-fused ring structures, respectively (Figure 3.4). Compared to the known brominated
furanones (will use “BF” from now on for brevity), such as 2208
and 3,198
the fused bicyclic
systems bear only one bromo-substitution, and introduce bulkier but semi-rigid cyclic
hydrocarbon skeletons into the molecules that can potentially increase the binding and selectivity
to the receptor proteins.

- 146 -
Figure 3.4 Structures of 5-BBF 15, 6-BBF 16 and 7-BBF 17.
3.2 Results and Discussion
3.2.1 Synthesis of BBFs
Bicyclic brominated furanones, 5-BBF 15, 6-BBF 16, and 7-BBF 17, were synthesized via a
similar route starting with keto acids. We describe the longest synthesis sequence that was used
to make 7-BBF in Scheme 1. Under basic conditions, coupling of cycloheptanone and dimethyl
carbonate provided methyl 2-oxo-1-cycloheptanecarboxylate 19,217
followed by acetoacetic ester
synthesis to give 2-oxocycloheptaneacetic acid 20218
. This intermediate was then subjected to
bromination and dehydration to build the fused ring framework, followed by elimination to
obtain the conjugated final product without isolating the intermediates (Scheme
3.1).219,220
Brominated furanones 2221
and 3198
were also synthesized to compare their toxicities
and biofilm inhibition activities to BBFs. Compound 2 was synthesized by Dr. Debjyoti
Bandyopadhyay in my research group.
OO
Br
O
O
Br
OO
Br
5-BBF 15 6-BBF 16 7-BBF 17

- 147 -
Scheme 3.1 Synthesis of BBFsa
aReagents and conditions: (a) Br2, CH2Cl2, 0 °C to rt; (b) P2O5, DCM, 0
oC to reflux; (c) Et3N,
DCM, 0 °C to reflux; (d) LiOH, THF/H2O (9:4), 23 h, 1M HCl (aq.), rt; (e) NaH, benzene, rt to
85 °C; (f) ethyl bromoacetate, K2CO3, acetone, rt to reflux, 16 h; (g) 6 M HCl (aq.), AcOH, rt to
reflux, 2 d.
3.2.2 Inhibition of E.coli biofilm formation by BBFs
We first evaluated the inhibitory activity of BBFs on biofilm formation by strain E.coli
RP437 (pRSH103), which constantly expresses red fluorescence and enables easy visualization
of the biofilm using confocal laser scanning microscopy (CLSM). BF 3 was a known biofilm
inhibitor to this strain198
at ~200 µM and was used as a positive control. Biofilms were grown on
sterile steel coupons in the absence or presence of 200 µM brominated furanones for 24 h before
visualization. Appropriate amount of DMSO was added to the non-BF treated control to
eliminate solvent effect. E. coli RP437 (pRSH103) biofilms grown in the presence of the
brominated furanones all displayed less fluorescence than the DMSO control. The formation of
O
Bra b c
HO
OO
HO
OO
Br
Br
O
Br
OO
Br
15
d a-cEtO
OO
HO
OO
OO
Br
1618
MeO OMe
O
O
MeO
O
O OO
O
Br
HO
O
1719 20
a-ce f,g
10% over 3 steps87% over 3 steps
3% over 3 steps
16% over 5 steps

- 148 -
biofilm was quantified from fluorescence images using COMSTAT software.222
Biomass, mean
thickness, and surface area values were calculated from 4 random locations on the steel coupons
as 4 replicates and were normalized by that of the DMSO control. Biomass represents the overall
volume of the biofilm. Mean thickness is the average thickness of the biofilm. Surface area is the
area summation of all biomass voxel surfaces exposed to the background. It is noteworthy that 6-
BBF 16 results in the least amount of biofilm formation (based on quantified biomass) of this
strain (31.3 ± 2.5%) (P < 0.01) compared with 5-BBF 15 (56.3 ± 5.0%) (P < 0.05) and 7-BBF 17
(49.7 ± 2.4%) (P < 0.01) and even less than that treated with BF 3 (49.1 ± 8.4%) (P < 0.05).
Figure 3.5 The effect of brominated furanones on biofilm formation by E.coli RP437
(pRSH103). Representative confocal laser scanning microscopy (CLSM) images of biofilm
formed by E.coli RP437 (pRSH103) in the (A) absence and presence of 200 µM (B) 3, (C) 5-
Control
5-BBF 6-BBF 7-BBF
3
A B
C D E
OO
Br
OO
Br
O
O
Br
OO
Me Br
Br

- 149 -
BBF 15, (D) 6-BBF 16 and (E) 7-BBF 17. The control is supplemented with the same amount
(0.4%) of DMSO as present in the brominated furanone-treated conditions. Scale bar = 100 µm.
Figure 3.6 Quantification of biofilm formation by E.coli RP437 (pRSH103) in the absence and
presence of 200 µM brominated furanones. Biomass, mean thickness, and surface area were
quantified from fluorescence image using COMSTAT software.222
Z-Stack images from four
different locations were used. Values are normalized by that of the brominated furanone-free
control and represent the means ± standard deviation from 4 replicates. Significant differences in
the biofilm formation from the BF-free control are indicated by asterisks: *, P < 0.05; **, P <
0.01.
3.2.3 Cytotoxicity study of BBFs on the growth of E. coli
We conducted cytotoxicity study of BBFs on the growth of E. coli to investigate if the
observed biofilm inhibition was due to cytotoxicity. Bacteria cells were allowed to grow in the
0
10
20
30
40
50
60
70
80
90
100
5-BBF 6-BBF 7-BBF BF8
Re
lative
bio
film
fo
rma
tio
n(%
)
Biomass
Mean thickness
Surface area
3
*
**
***
*
*
*
*

- 150 -
absence or presence of 200 µM BBFs and the OD600 values were measured every 2 h for the first
12 h and then after 24 h. BF 3 was used as a positive control (Figure 3.7). None of the BBFs
exhibited obvious impact on the growth of E. coli RP437. The growth curve of bacteria in the
presence of BF 3 deviated from that of the control for up to 8 h and then the OD600 values were
essentially the same to the control after then. Therefore, BBFs all showed moderate to good
biofilm inhibition of E. coli RP437 at concentrations that do not inhibit the growth of bacteria
cells.
Figure 3.7 Growth curve of E.coli RP437 in the absence and presence of 200 µM brominated
furanones. Values are normalized by that of the BF-free control and represent the means ±
standard deviation from 6 replicates.
3.2.4 Inhibition of P. aeruginosa biofilm formation by BBFs
P. aeruginosa is an opportunistic pathogen and the most common Gram-negative bacterium
found in nosocomial and life-threatening infections of immunocompromised patients, including
0
0.1
0.2
0.3
0.4
0.5
0 2 4 6 8 10 12 14 16 18 20 22 24
OD
600
Time (h)
control
5-BBF
6-BBF
7-BBF
BF83
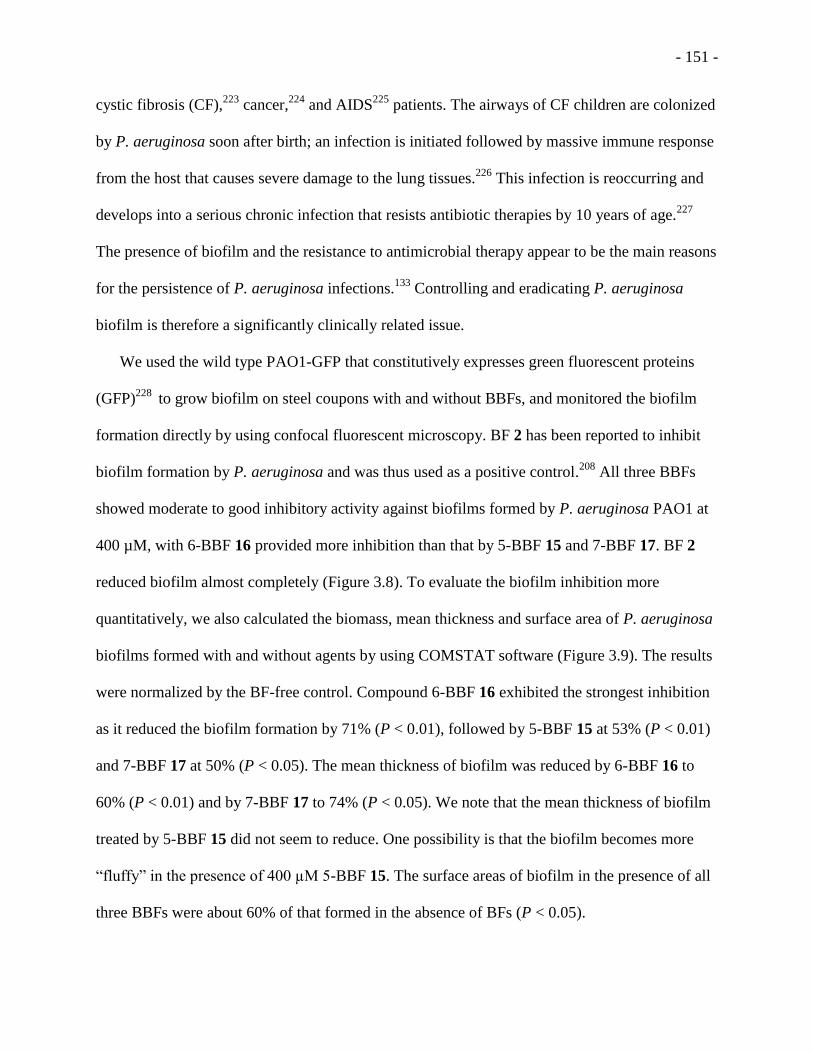
- 151 -
cystic fibrosis (CF),223
cancer,224
and AIDS225
patients. The airways of CF children are colonized
by P. aeruginosa soon after birth; an infection is initiated followed by massive immune response
from the host that causes severe damage to the lung tissues.226
This infection is reoccurring and
develops into a serious chronic infection that resists antibiotic therapies by 10 years of age.227
The presence of biofilm and the resistance to antimicrobial therapy appear to be the main reasons
for the persistence of P. aeruginosa infections.133
Controlling and eradicating P. aeruginosa
biofilm is therefore a significantly clinically related issue.
We used the wild type PAO1-GFP that constitutively expresses green fluorescent proteins
(GFP)228
to grow biofilm on steel coupons with and without BBFs, and monitored the biofilm
formation directly by using confocal fluorescent microscopy. BF 2 has been reported to inhibit
biofilm formation by P. aeruginosa and was thus used as a positive control.208
All three BBFs
showed moderate to good inhibitory activity against biofilms formed by P. aeruginosa PAO1 at
400 µM, with 6-BBF 16 provided more inhibition than that by 5-BBF 15 and 7-BBF 17. BF 2
reduced biofilm almost completely (Figure 3.8). To evaluate the biofilm inhibition more
quantitatively, we also calculated the biomass, mean thickness and surface area of P. aeruginosa
biofilms formed with and without agents by using COMSTAT software (Figure 3.9). The results
were normalized by the BF-free control. Compound 6-BBF 16 exhibited the strongest inhibition
as it reduced the biofilm formation by 71% (P < 0.01), followed by 5-BBF 15 at 53% (P < 0.01)
and 7-BBF 17 at 50% (P < 0.05). The mean thickness of biofilm was reduced by 6-BBF 16 to
60% (P < 0.01) and by 7-BBF 17 to 74% (P < 0.05). We note that the mean thickness of biofilm
treated by 5-BBF 15 did not seem to reduce. One possibility is that the biofilm becomes more
“fluffy” in the presence of 400 µM 5-BBF 15. The surface areas of biofilm in the presence of all
three BBFs were about 60% of that formed in the absence of BFs (P < 0.05).

- 152 -
Figure 3.8 The effect of brominated furanones on biofilm formation by P. aeruginosa.
Representative confocal laser scan microscopy (CLSM) images of biofilm formed by PAO1-
GFP (expresses green fluorescence on plasmid pSMC2) (A) in the absence of agents, and in the
presence of 400 µM (B) 2, (C) 5-BBF 15, (D) 6-BBF 16, and (E) 7-BBF 17. The control is
supplemented with the same amount (0.8%) of DMSO as present in the brominated furanone-
treated conditions. Scale bar = 50 µm.
2
OO
Br
Br
Control
5-BBF
OO
Br
6-BBF
OO
Br
7-BBF
O
O
Br
A B
C D E
- 153 -
Figure 3.9 Quantification of biofilm formation by PAO1-GFP in the absence and presence of 400
µM brominated furanones. Biomass, mean thickness, and surface area were quantified from
fluorescence image using COMSTAT software. Z-Stack images from four different locations
were used. Values are normalized by that of the BF-free control and represent the means ±
standard deviation from 4 replicates. Significant differences in biofilm formation from BF-free
control are indicated by asterisks: *, P < 0.05; **, P < 0.01.
We followed up with a dose-dependence study on inhibitory activity of BBFs on P.
aeruginosa biofilm using a colorimetric assay in 96-well plates employing crystal violet (CV)
(Figure 3.10).170
IC50 values obtained from the dose-response curves were more than 400 µM for
5-BBF 15, and 145.8 µM and 139.7 µM for 6-BBF 16 and 7-BBF 17, respectively. These results
suggest that 6-BBF 16 and 7-BBF 17 are stronger biofilm inhibitors than 5-BBF 15 for P.
aeruginosa. We note that the percentage of relative biofilm formation in the presence of 400 µM
BBFs obtained from confocal laser scan microscopy and that from the CV assay did not match
perfectly. This discrepancy most likely comes from the different experimental conditions and
0
20
40
60
80
100
120
140
1 2 3 4
Re
lative
pe
rce
nta
ge
(%
)
Biomass
Mean thickness
Surface area
5-BBF 6-BBF 7-BBF 2
**
**
***
**
**
** ** **

- 154 -
procedures used in the two different assays. However, the general trend that 6-BBF and 7-BBF
showed more inhibitory activity against Pseudomonas biofilm formation is similar in both
assays.

- 155 -
Figure 3.10 P. aeruginosa biofilm formation dose-response curves with IC50 values for (A) 5-
BBF 15, (B) 6-BBF 16, and (C) 7-BBF 17. Values are normalized by that of the BF-free control
0
20
40
60
80
100
120
0 100 200 300 400 500
Re
lative
bio
film
fo
rma
tio
n (%
)
Concentration (µM)
0
20
40
60
80
100
120
0 100 200 300 400 500
Re
lative
bio
film
fo
rma
tio
n (%
)
Concentration (µM)
0
20
40
60
80
100
120
0 100 200 300 400 500
Re
lative
bio
film
fo
rma
tio
n
Concentration (µM)
IC50 > 400 µM
IC50 = 145.8 µM
IC50 = 139.7 µM
OO
Br
5-BBF 15
OO
Br
6-BBF 16
OO
Br
7-BBF 17
A
B
C

- 156 -
and represent the means ± standard deviation from 4 replicates. Data shown is a representative of
at least three separate experiments.
3.2.5 Cytotoxicity study of BBFs on the growth of P.aeruginosa
The toxicity of brominated furanones to the growth of bacteria is difficult to predict based on
structures. For example, BF 3 does not inhibit the growth of E. coli, whereas similar structures
do.198
Here, we compared the toxicity of BBFs and BF 2 to the growth of P. aeruginosa. At 400
µM, none of the three BBFs showed dramatic inhibition to the growth of P. aeruginosa PAO1
(Figure 3.11), and bacteria grown in the presence of BBFs reached the same optical density
(OD600) as those in the absence of BBFs (control) after 24 h. At the same concentration and
under the same conditions, BF 2 completely inhibited bacterial growth (P < 0.01). Therefore,
BBFs all inhibited P. aeruginosa biofilm at concentrations that did not affect the bacterial
growth. Together with other reports,198,210,229
these results suggest that small structural
modifications of brominated furanones can have substantial impact on their activities.230
In
particular, the toxicity and biological activity of brominated furanones is highly sensitive to
small variation in the structure whereas the biofilm inhibition activity may be quite general for
most of the structures. We note that all three BBFs appear to be more stable than BF 2 and 3.
Bacteria culture containing BF 2 and 3 became pinkish after incubating for ~3 h and the
coloration deepens over time, which may indicate decomposition. However, BBFs did not show
any color change even after 72 h of incubation under the same condition.

- 157 -
Figure 3.11 Growth curves of P. aeruginosa PAO1 in the absence (control) and presence of 400
µM brominated furanones. Values represent the means ± standard deviation from six replicates.
Significant differences in the optical density from BF-free control are indicated by asterisks: **,
P < 0.01.
3.2.6 Study of synergistic effect between BBFs and tobramycin
As our results indicated that bicyclic brominated furanones were effective at inhibiting
biofilm formation with very low toxicity, we studied the effect of combined use of antibiotics
and these biofilm inhibitors on killing P. aeruginosa within the biofilm. We choose tobramycin
because of its clinical relevance, superior effectiveness against Pseudomonas than other
antibiotics, and wide use in treating Pseudomonas-related diseases.231
We applied 6-BBF 16 at
200 µM, a relatively low concentration at which the inhibition of biofilm formation is still
effective without killing bacteria cells. Tobramycin was initially applied at 2.0 µg/mL as
commonly used in clinics to one-day-old biofilm. However, tobramycin alone at this
0
0.2
0.4
0.6
0.8
1
1.2
1.4
0 2 4 6 8 10 12 14 16 18 20 22 24
OD
600
Time (h)
control
5-BBF
6-BBF
7-BBF
2
**
2
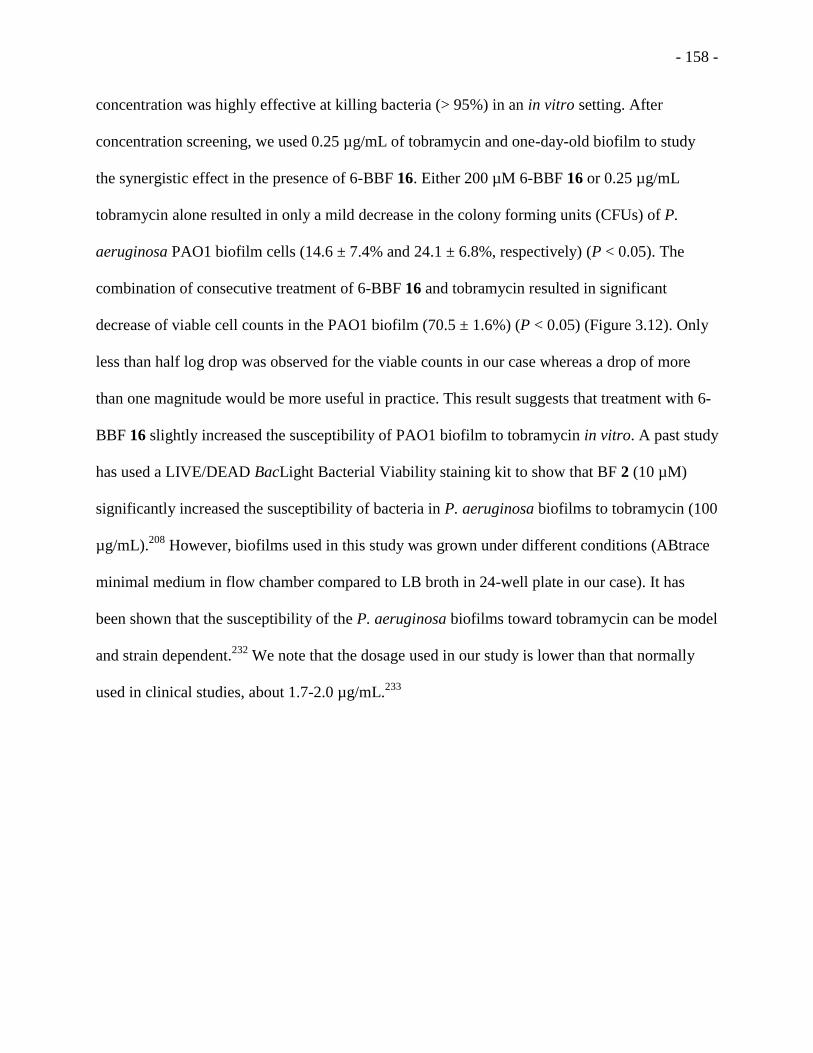
- 158 -
concentration was highly effective at killing bacteria (> 95%) in an in vitro setting. After
concentration screening, we used 0.25 µg/mL of tobramycin and one-day-old biofilm to study
the synergistic effect in the presence of 6-BBF 16. Either 200 µM 6-BBF 16 or 0.25 µg/mL
tobramycin alone resulted in only a mild decrease in the colony forming units (CFUs) of P.
aeruginosa PAO1 biofilm cells (14.6 ± 7.4% and 24.1 ± 6.8%, respectively) (P < 0.05). The
combination of consecutive treatment of 6-BBF 16 and tobramycin resulted in significant
decrease of viable cell counts in the PAO1 biofilm (70.5 ± 1.6%) (P < 0.05) (Figure 3.12). Only
less than half log drop was observed for the viable counts in our case whereas a drop of more
than one magnitude would be more useful in practice. This result suggests that treatment with 6-
BBF 16 slightly increased the susceptibility of PAO1 biofilm to tobramycin in vitro. A past study
has used a LIVE/DEAD BacLight Bacterial Viability staining kit to show that BF 2 (10 µM)
significantly increased the susceptibility of bacteria in P. aeruginosa biofilms to tobramycin (100
µg/mL).208
However, biofilms used in this study was grown under different conditions (ABtrace
minimal medium in flow chamber compared to LB broth in 24-well plate in our case). It has
been shown that the susceptibility of the P. aeruginosa biofilms toward tobramycin can be model
and strain dependent.232
We note that the dosage used in our study is lower than that normally
used in clinical studies, about 1.7-2.0 µg/mL.233

- 159 -
Figure 3.12 Viability of cells within the biofilm treated with and without 6-BBF 16 after
exposure to tobramycin. Preformed 24 h-old biofilms grown on steel coupons were treated with
200 µM 6-BBF 16 for 24 h and then with and without 0.25 µg/mL tobramycin for another 24 h.
Two independent experiments were performed, with four replicates per experiment. Values
represent the means ± standard error of a total of eight replicates. Significant differences in the
CFU from the control are indicated by asterisks: *, P < 0.05.
The mechanism of how the presence of 6-BBF 16 increases the effectiveness of antibiotics in
a synergistic way is not yet clear. One possible explanation is that 6-BBF 16 inhibits quorum
sensing, leading to a reduction of biofilm formation, which reduces the number of biofilm-
associated bacteria that bear high resistance to antibiotics. Changes in the biofilm structure may
also facilitate the transport of antibiotics to bacteria in the biofilm. In addition, quorum sensing
inhibitors may also lead to a reduction in persister formation, as a recent study have shown that
quorum sensing molecules (not inhibitors) can increase the persister formation by P.
6.4
6.6
6.8
7
7.2
7.4
7.6
7.8
control 200 µM 6-BBF 0.25 µg/mL TOB combine
Lo
gC
FU
(m
L-1
)
6-BBF
Tobramycin
-
-
-
++
+
+
-
*

- 160 -
aeruginosa.234
Alternatively, these bicyclic brominated furanones may directly target the proteins
that are required to maintain the persisters,235
and subsequently increase the susceptibility of the
persister bacteria to antibiotics.
3.2.7 Modulation of the quorum sensing in P. aeruginosa by BBFs
To investigate whether BBFs inhibit biofilm formation via interference with QS, we studied
the agonistic and antagonistic effects of these BBFs on the two quorum sensing systems in P.
aeruginosa.139
There are two identified AHL-mediated quorum sensing circuits in P.
aeruginosa.195
The las circuit involves autoinducer 3-oxo-C12-HSL and the rhl circuit utilizes
autoinducer C4-HSL.
A double-knockout reporter strain PAO-JP2236
(ΔlasIΔrhlI) harboring the plasmid plasI-
LVAgfp237
was used to evaluate the las quorum sensing system. When bacteria are growing in
the presence of exogenously introduced autoinducer 3-oxo-C12-HSL or analogues, LasR
receptor binds to the AI and activates transcription of the lasI promoter which controls green
fluorescence protein (GFP) expression. The GFP production is quantified by correcting the
measured fluorescence signal for cell density as shown in Equation 3.1. “RFUsample” is the
relative fluorescence unit measured by the plate reader. “No AI” represents bacteria culture
grown in the presence of no AI analogue, supplemented with the same amount of DMSO present
in the SHL stocks.
(3.1)
The antagonism assay was conducted with competition of BBFs against 1 µM natural AI 3-
oxo-C12-HSL (a concentration within the range produced by wild type P. aeruginosa).130,160-162
All BBFs decreased fluorescence signals as the concentration was increased from 50 to 150 to
- 161 -
300 µM, indicating inhibition of GFP expression (Figure 3.13). Of all the BBFs, 5-BBF 15
appeared to be the strongest inhibitor at all concentrations tested. In the presence of 50 µM
agents, the relative fluorescence was 68.5 ± 4.4% (P <0.001), 85.0 ± 14.2%, and 72.9 ± 1.5% (P
<0.01) for bacteria treated with 5-BBF 15, 6-BBF 16, and 7-BBF 17, respectively. At 300 µM,
the GFP expression in the presence of 5-BBF 15 was reduced to about 27.6 ± 4.7% (P <0.05) as
compared to control with only 1 µM of 3-oxo-C12-HSL, while 6-BBF 16 and 7-BBF 17 reduced
the GFP expression to 55.2 ± 17.8% (P < 0.01) and 39.8 ± 6.2% (P <0.05), respectively. BF 3
showed similar inhibitory activity to 5-BBF 15.
Figure 3.13 GFP expression by PAO-JP2 (plasI-LVAgfp) in the presence of 1 µM 3-oxo-C12-
HSL alone (control) or 1 µM 3-oxo-C12-HSL plus various concentration of 5-BBF 15, 6-BBF
16, 7-BBF 17 or BF 3. Fluorescence signals were corrected for cell density as shown in Equation
3.1 and the results were normalized to the BF-free control. Values represent the means ±
standard deviation from four replicates. Data shown is a representative of duplicate experiments.
Significant differences in the GFP expression from the control are indicated by asterisks: *, P <
0.05; **, P < 0.01; ***, P < 0.001.
0
10
20
30
40
50
60
70
80
90
100
5-BBF 6-BBF 7-BBF BF8
Re
lative
flu
ore
sce
nce
(%
)
50 µM
150 µM
300 µM
3
**
******
**
**
**
****
**
*

- 162 -
Similar results were obtained using the wild type strain PAO1 harboring plasmid plasI-
LVAgfp (Figure 3.14). Both 6-BBF 16 and 7-BBF 17 decreased fluorescent signals as the
concentration was increased from 50 to 150 to 300 µM (Figure 3.15). At 300 µM , the GFP
production in the presence of 6-BBF 16 or 7-BBF 17 was 78 ± 1.1% (P < 0.05) and 69 ± 4.0% (P
< 0.001), respectively, compared to that of the BF-free control. BF 3 showed similar inhibitory
activity to 5-BBF 15 in this strain, too, with 46 ± 4.8% (P < 0.001) GFP expression at 300 µM,
compared to that of the BF-free control (P < 0.001). However, BF 3 is in general more toxic than
6-BBF 16 and 7-BBF 17. Compound 5-BBF inhibited the GFP production slightly at 50 µM and
150 µM, and reduced the GFP expression by approximately half at 300 µM. These results
suggest that the BBFs are weak to moderate antagonists of LasR protein within the concentration
range of 50 to 300 µM.
Figure 3.14 GFP expression by PAO1 (plasI-LVAgfp) in the absence or presence of 5-BBF 15,
6-BBF 16, 7-BBF 17 or BF 3 at 50, 150, and 300 µM. Fluorescence signals were corrected for
cell density as shown in Equation 3.1and the results were normalized to the BF-free control.
0
20
40
60
80
100
120
5-BBF 6-BBF 7-BBF BF8
Re
lative
flu
ore
sce
nce
(%
)
50 µM
150 µM
300 µM
3
*
***
***
***
**
*
- 163 -
Values represent the means ± standard deviation from four replicates. Data shown is a
representative of at least three separate experiments. Significant differences in the GFP
expression from the control are indicated by asterisks: *, P < 0.05; ***, P < 0.001.
We also tested the effects of BBFs on the quorum sensing system of rhlI using PAO-JP2
(prhlI-LVAgfp) in the presence of 1 µM 3-oxo-C12-HSL and 10 µM C4-HSL (Figure 3.15).160
Surprisingly, 5-BBF 15 promoted, instead of suppressed, the GFP expression significantly as its
concentration was increased. At 50 µM and 150 µM, 5-BBF 15 increased the GFP expression by
16.4 ± 11.8% and 62.2 ± 14.2% (P < 0.001), respectively. When the concentration was increased
to 300 µM, the fluorescence was increased by 154 ± 18.6% (P < 0.001) compared to the control.
On the contrary, 6-BBF 16, 7-BBF 17 or BF 3 did not show observable increase in green
fluorescence. Similar results were also obtained when reporter strain PAO1 (prhlI-LVAgfp) was
used (Figure 3.16). At 150 µM and 300 µM, 5-BBF 15 increased the GFP expression by 82.6 ±
4.4% and 165 ± 17.6%, respectively (P < 0.01). On the contrary, 6-BBF 16, 7-BBF 17 and BF 3
had no effect on the GFP expression at all concentrations tested. These results suggest that 5-
BBF is a strong agonist of RhlR, while 6-BBF 16 and 7-BBF 17 are not.

- 164 -
Figure 3.15 GFP expression by PAO-JP2 (prhlI-LVAgfp) in the presence of 1 µM 3-oxo-C12-
HSL and 10 µM C4-HSL alone (control) or 1 µM 3-oxo-C12-HSL and 10 µM C4-HSL plus
various concentration of 5-BBF 15, 6-BBF 16, 7-BBF 17, or BF 3. Fluorescence signals were
corrected for cell density as shown in Equation 3.1 and the results were normalized to the BF-
free control. Values represent the means ± standard deviation from four replicates. Data shown is
a representative of at least three separate experiments. Significant differences in the GFP
expression from the control are indicated by asterisks: ***, P < 0.001.
0
50
100
150
200
250
300
5-BBF 6-BBF 7-BBF BF8
Re
lative
flu
ore
sce
nce
(%
)
50 µM
150 µM
300 µM
3
***
***

- 165 -
Figure 3.16 GFP expression by PAO1 (prhlI-LVAgfp) in the absence or presence of 5-BBF 15,
6-BBF 16, 7-BBF 17, or BF 3 at 50, 150, and 300 µM. Fluorescence signals were corrected for
cell density as shown in Equation 3.1 and the results were normalized to the BF-free control.
Values represent the means ± standard deviation from four replicates. Data shown is a
representative of at least three separate experiments. Significant differences in the GFP
expression from the control are indicated by asterisks: ***, P < 0.001.
3.2.8 Effect on elastase B production in P. aeruginosa by BBFs
Another bioactivity of P. aeruginosa that is also controlled by quorum sensing (las
pathway)238
is the production of the virulence factor metalloprotease elastase B. This highly toxic
virulence factor facilitates the invasion and destruction of host tissues,239
induces inflammatory
responses from the host240
and also signals the biofilm formation.241
Thus elastase B is a
potential target for developing antimicrobial agents. Molecules that inhibit virulence factor
production without bactericidal action would place little selection pressure on the bacteria strains
0
50
100
150
200
250
300
5-BBF 6-BBF 7-BBF BF8
Re
lative
flu
ore
sce
nce
(%
)
50 µM
150 µM
300 µM
3
***
***
***

- 166 -
for the emergence of resistance and therefore have been proposed as a class of second-generation
antibiotics.242
BF 2, for example, was reported to inhibit the production of virulence factors and
to increase the bacterial susceptibility to tobramycin.208
Another synthetic BF 1 was also shown
to reduce the production of virulence factors, including protease and chitinase.195
Because BBFs
appeared to be potent antagonists of LasR, we also tested their ability to inhibit elastase B
production. A colormeric assay that utilized elastin-congo red substrate was conducted to
measure the elastase B activity produced by P. aeruginosa PAO-JP2. Natural autoinducers 3-
oxo-C12-HSL and C4-HSL were added at 5 µM and 10 µM, respectively, for consistent
induction of elastase B activity in this strain.160
At 300 µM, all BBFs significantly reduced the
production of elastase B by ~80% (P < 0.05) (Figure 3.17). In a dose-dependent study, the
elastase B activity in the presence of 50 µM 6-BBF 16 was not significantly different from the
non-treated control. But the inhibitory activity of 6-BBF 16 increased as the concentration
increased up to 300 µM (Figure 3.17, insert). Because the elastase B production is controlled by
las quorum sensing pathway, these results are consistent with BBFs being antagonists of LasR in
P. aeruginosa.

- 167 -
Figure 3.17 Elastase B activity produced by P. aeruginosa PAO-JP2 in the presence of 5 µM 3-
oxo-C12-HSL and 10 µM C4-HSL alone (control) or 5 µM 3-oxo-C12-HSL and 10 µM C4-HSL
plus 300 µM BBFs or 5 µM PAI1 and 10 µM PAI2 plus various concentration of 6-BBF 16
(insert). Values were normalized to that of the brominated furanone-free control and represent
the means ± standard deviation from four replicates. Significant differences in the elastase B
activity from the control are indicated by asterisks: *, P < 0.05.
3.2.9 Improved bacterial clearance by 6-BBF in vivo
A more clinically-related method to evaluate the in vivo function of a QSI compound is by
means of a pulmonary infection model.243
To further explore the potential utility of BBFs in vivo,
we used a SP-A/D KO mouse model244
that lacked the expression of two host defense proteins
SP-A and SP-D in the lung and thus increased the mouse’s susceptibility to P. aeruginosa
infection. This model mimics microenvironments of the lung in the pulmonary
immunocompromised patients, who have a high susceptibility to lung infections. Four
0
20
40
60
80
100
120
control 5-BBF 6-BBF 7-BBF
Re
lative
ela
sta
se
B a
ctivity (
%)
0
10
20
30
40
50
60
70
80
90
100
50 µM 150 µM 200 µM 300 µM
Re
lative
ela
sta
se
B
activity (%
)
* *

- 168 -
independent experiments with a total of 68 age and gender matched mice were performed. The
results showed that the average CFU in mice treated with 6-BBF at 200 µM was significantly
lower (P < 0.05) than that in mice of the control group. The average CFU in the 6-BBF-treated
group and control group were (4.1 ± 0.29) × 104 CFU per lung and (18.6 ± 5.9) × 10
4 CFU per
lung, respectively, 48 hours after infection (Figure 3.18). Our results from this in vivo model
demonstrated that 6-BBF 16 can improve bacterial clearance compared to the controls (without
6-BBF treatment). The mechanisms underlying this increase clearance may be through the
inhibition of biofilm formation of bacteria by 6-BBF and/or increase of phagocytic efficiency of
bacteria by alveolar macrophages and neutrophils in the lung.
Figure 3.18 Effect of 6-BBF on the bacterial clearance of mouse lung in vivo. Each SP-A/D KO
mouse was infected with 50 µl (containing 1 × 10⁷ CFU of wilt-type P. aeruginosa )
intratracheally. Bacterial suspension contained either saline as the control group or 200 µM 6-
BBF 16. The mice were sacrificed 48 hours after infection and CFUs of each lung were
determined. The data showed one representative experiment (n= 8 mice for each group) of four
independent experiments and values are means ± standard deviation. Significant differences in
the bacterial clearance from the control are indicated by asterisk: *, P < 0.05. This experiment of
6-BBF

- 169 -
mouse model was performed by Dr. Osama A. Abdel-Razek from Dr. Guirong Wang’s research
group at Upstate Medical University (SUNY).
3.2.10 Cytotoxicity study of BBFs on human cells
To avoid invoking bacterial resistance,173,209,245,246
nonmicrobicidal agents that do not kill
bacteria or influence bacterial growth are being sought. However, for any potential therapeutic
development, the toxicity issue of the molecules towards mammalian or human cells must be
addressed. Although many natural and non-natural brominated furanones inhibit biofilm
formation by a wide range of bacteria, few studies have addressed their toxicity to mammalian or
human cells.230,247
Here, we compare the toxicity of BBFs to a nonmicrobicidal brominated
furanone, BF 3, against human neuroblastoma SK-N-SH. Cells were allowed to attach to and
grow in 96-well tissue culture-treated microtiter plates for 24 h, after which they were treated
with at 100 µM of each agent (5-BBF 15, 6-BBF 16, 7-BBF 17 and BF 3) for 1 h, and then the
agent-containing medium was replaced with fresh medium. After the 1-h treatment of agents, the
cells were then allowed to recover for 0, 24, and 48 h (recovery time), at which time the number
of live cells was determined by the CCK 8 assay.248
Survival (%) was calculated based on cells
without any agent treatment as shown in Equation 3.2. The sample absorbance values were
obtained from the wells containing cells and brominated furanones, and the control absorbance
values were obtained from BF-free wells containing cells and DMSO.
(3.2)
At 100 µM, BF 3 exhibited moderate toxic effect toward human neuroblastoma SK-N-SH
cells after 0 h of recovery; about 50.3 ± 9.3% of cells were alive compare to those not treated
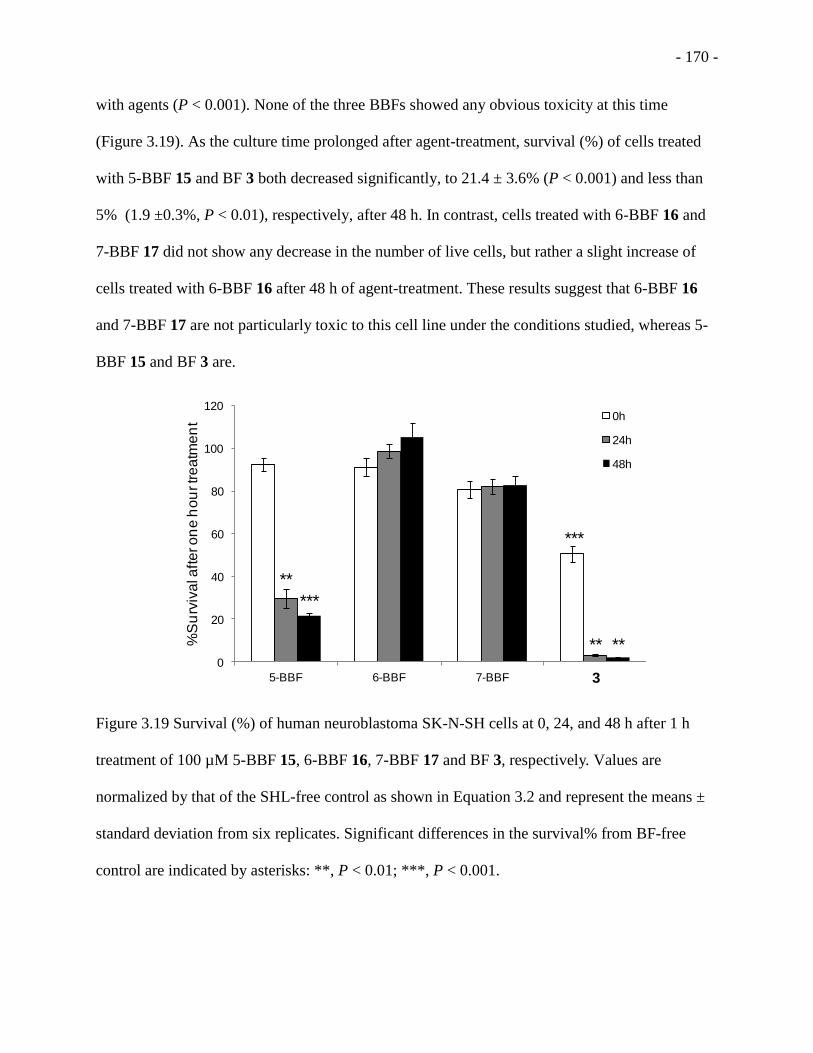
- 170 -
with agents (P < 0.001). None of the three BBFs showed any obvious toxicity at this time
(Figure 3.19). As the culture time prolonged after agent-treatment, survival (%) of cells treated
with 5-BBF 15 and BF 3 both decreased significantly, to 21.4 ± 3.6% (P < 0.001) and less than
5% (1.9 ±0.3%, P < 0.01), respectively, after 48 h. In contrast, cells treated with 6-BBF 16 and
7-BBF 17 did not show any decrease in the number of live cells, but rather a slight increase of
cells treated with 6-BBF 16 after 48 h of agent-treatment. These results suggest that 6-BBF 16
and 7-BBF 17 are not particularly toxic to this cell line under the conditions studied, whereas 5-
BBF 15 and BF 3 are.
Figure 3.19 Survival (%) of human neuroblastoma SK-N-SH cells at 0, 24, and 48 h after 1 h
treatment of 100 µM 5-BBF 15, 6-BBF 16, 7-BBF 17 and BF 3, respectively. Values are
normalized by that of the SHL-free control as shown in Equation 3.2 and represent the means ±
standard deviation from six replicates. Significant differences in the survival% from BF-free
control are indicated by asterisks: **, P < 0.01; ***, P < 0.001.
0
20
40
60
80
100
120
5-BBF 6-BBF 7-BBF BF8
%S
urv
iva
l aft
er o
ne
ho
ur tr
ea
tme
nt 0h
24h
48h
***
**
***
**
**
3

- 171 -
To further explore the toxic effect of 6-BBF and 7-BBF, we increased the exposure time to
2, 4, 6 h to the human cells. The A450 was measured immediately after incubation with the
agents. The results showed that the survival (%) decreased as the exposure time prolonged for
cells treated with 5-BBF 15 and BF 3, and was lower than that for 1h agent treatment. This result
further confirms that these two compounds are toxic to this cell line. The survival (%) for cells
treated with 6-BBF 16 remained the same after 2, 4, and 6 h treatment, and the survival (%)
decreased by ~ 20% for cells treated with 7-BBF 17 (Figure 3.20). These results suggest that 6-
BBF 16 and 7-BBF 17 are not as toxic as BF 3 to the cells line studied.
Figure 3.20 Survival (%) of SK-N-SH when treated with 100 µM 5-BBF 15, 6-BBF 16, 7-BBF
17 and BF 3 for 2, 4, and 6 h. Values are normalized by that of the SHL-free control as shown in
Equation 3.2 and represent the means ± standard deviation from six replicates. Significant
differences in the survival (%) with 2 h exposure time are indicated by asterisks: *, P < 0.05.
0
10
20
30
40
50
60
70
80
90
100
5-BBF 6-BBF 7-BBF BF8
%S
urv
iva
l aft
er d
iffe
ren
t dru
g
tre
atm
en
t tim
e
2h
4h
6h
3
*

- 172 -
Cytotoxicity of BBFs against this human neuroblastoma cell line SK-N-SH was also
evaluated at the highest concentration tested for biofilm inhibition (400 µM) following the same
protocols. After the 1 h treatment of agents and 0 h recovery time, BF 3 exhibited the strongest
toxic effect toward human neuroblastoma SK-N-SH cells; 29.0 ± 14.1 % of cells were alive
compare to those not treated with agents (P < 0.001). 5-BBF 15 and 6-BBF 16 showed mild
toxicity (~ 76% cell survival for both), and 7-BBF 17 resulted in ~ 44% of cell survival (Figure
3.21). At 24 h and 48 h of recovery time, survival (%) for cells treated with 5-BBF 15 dropped to
~ 21% and ~ 6%, respectively. For cells treated with BF 3, almost no live cell remained (< 2%)
after 24 and 48 h. For 7-BBF 17, cell survival dropped to ~ 7 % after 24 h of recovery time, but
appears to increase to 13 % after 48 h. In contrast, 6-BBF 16 exhibited the least toxic effect to
this human cell line. After 24 h and 48 h of recovery time, about 50 % survival was observed for
cells treated with 6-BBF 16.
Figure 3.21 Survival (%) of human neuroblastoma SK-N-SH cells at 0, 24, and 48 h after 1 h
treatment of 400 µM 5-BBF 15, 6-BBF 16, 7-BBF 17 and BF 3, respectively. Values represent
0
10
20
30
40
50
60
70
80
90
100
5-BBF 6-BBF 7-BBF BF8
%S
urv
iva
l aft
er o
ne
ho
ur tr
ea
tme
nt 0 h
24 h
48 h
***
*** ***
******
*******
**
**
3
- 173 -
the means ± standard deviation from six replicates. Significant differences between BF-treated
conditions in the survival% and BF-free control at each time point are indicated by asterisks: *, P
< 0.05; **, P < 0.01; ***, P < 0.001.
3.3 Conclusion and Perspectives
The bicyclic brominated furanones are a new class of synthetic brominated furanones with
increased chemical stability and significant reduction in toxicity to human cancer cells compared
to the known compound 3. These BBFs inhibit biofilm formation by E. coli and P. aeruginosa
and inhibit production of virulence factor elastase B in P. aeruginosa at nonmicrobicidal
concentrations. At 200 µM, the representative molecule 6-BBF 16 moderately increased the
susceptibility of Pseudomonas biofilm to tobramycin. These biological activities are probably
realized through interfering with quorum sensing in bacteria. The relative high IC50 of biofilm
inhibition of these brominated furanones plague their use in pharmaceutical area. However, they
may still be useful in treatment of external wound infections. This work indicates a complex and
sensitive structure-bioactivity relationship for brominated furanones. Future work would include
studying the ability of BBFs to modulate QS in other species such as V. fischeri and A.
tumefaciens. Using X-ray crystal structures of a few LuxR-type proteins bound to their cognate
AHL ligands as a guidance, one could design and tune the structure of brominated furanones and
other potential quorum sensing modulators. Computer simulated binding of candidates to the
active site of LuxR-type receptors would help to predict and understand the activity of these
molecules.

- 174 -
3.4 Experimental Section
3.4.1 Biological studies
Chemicals.
Minimum essential medium with Eagle’s salts and L-glutamine (EMEM) was obtained from
Mediatech (Herndon, VA). Trypan blue stain was purchased from Sigma-Aldrich (Milwaukee,
WI). Cell counting kit 8 (CCK-8) was purchased from Dojindo Molecular Technologies, Inc.
(Gaithersburg, MD). Water used for preparing all buffers and solutions had resistivity of 18 MΩ
cm (Millipore, Billerica, MA).
Bacteria strains and growth media.
Double-knockout mutants of Pseudomonas aeruginosa, PAO-JP2 (plasI-LVAgfp) and PAO-
JP2 (prhlI-LVAgfp) were kindly provided by Dr. Helen E. Blackwell (University of Wisconsin-
Madison) with permission by Dr. Babara H. Iglewski (University of Rochester Medical
Center).236,249
Plasmids plasI-LVAgfp and prhlI-LVAgfp were kindly provided by Dr. Hiroaki
Suga (The University of Tokyo). Escherichia coli RP437 250
and E. coli RP437 with pRSH103
plasmid (constitutively expresses red fluorescence proteins) 251
were kindly provided by Dr.
Dacheng Ren (Syracuse University). E. coli RP437 and E.coli RP437 (pRSH103) were grown in
Luria-Bertani (LB) broth (containing 10 µg/mL of tetracycline for E.coli RP437 (pRSH103)) at
37 oC. P. aeruginosa PAO1-BAA-47 (wild type) from ATCC and PAO1-GFP (constitutively
expresses green fluorescence proteins on plasmid pSMC2) 228
were grown in LB broth
(containing 300 µg/mL of carbenicillin for PAO1-GFP) at 37 oC. All the other P. aeruginosa
strains were grown in M9 minimal medium containing 300 µg/mL of carbenicillin.
Stock solutions of brominated furanones.

- 175 -
Stock solutions of all brominated furanones (BFs) (50 mM) were prepared in DMSO,
sterilized by filtering through a 0.2 µm syringe filter, and stored at -20 °C in sealed vials.
Appropriate amount of DMSO was added to controls in all assays to eliminate solvent effect.
The amount of DMSO in all cases was no more than 0.8%.
Confocal laser scanning microscopy (CLSM) analysis of biofilms.
Biofilms were grown on 316 stainless steel coupons (ca. 3/8 in. × 3/8 in., McMaster-Carr,
Elmhurst, IL) with or without BBFs in a 24-well microplate. The plate was wrapped in a Saran
wrap and incubated at 37 oC for 24 h without shaking. Each steel coupon was then washed gently
by dipping into 0.9% NaCl saline buffer 3 times (fresh saline buffer was used for each dipping)
and then placed upside down on a microscope cover glass (50 x 24mm, No. 2, Fisher Scientific,
Pittsburgh, PA). The biofilms were visualized using a Zeiss LSM 710 Confocal Laser Scanning
Microscope (Carl Zeiss, Jena, Germany). The biofilms formed by strain E.coli RP437
(pRSH103) were visualized by excitation with a HeNe laser at 543 nm and fluorescent emission
was detected with a LP 560 nm emission filter. A 488 nm laser line was used to visualize
biofilms formed by PAO1-GFP. Z-stacks from four randomly picked spots were taken for each
steel coupon. Quantification analysis of biomass, mean thickness, and surface area of the
biofilms formed in the absence and presence of brominated furanones were obtained from
fluorescence image using COMSTAT software 222
. Values are normalized by that of the BF-free
control.
Crystal violet biofilm assay in 96-well plates.
An overnight bacterial culture was subcultured at an optical density (OD600) of 0.1 in LB
broth. Appropriate amount of stock solutions of BBFs in DMSO were added to each well. The
outermost wells of the 96-well polystyrene microtiter plates (Costar 3370) were filled with 100

- 176 -
µL of sterile autoclaved water to prevent uneven evaporation. The plates were wrapped in Saran
wrap and incubated under stationary conditions at 37 oC for 24 h. The media was then discarded
and the plates were washed with deionized water (125 µL × 1) and dried for 30 min. Biofilms
were stained with 100 µL of 0.1% aqueous solution of crystal violet for 30 min at room
temperature. The crystal violet was discarded and then the plates were washed with deionized
water (125 µL × 3) and dried again for 30 min. The remaining stained cells were solubilized with
200 µL of 95% EtOH and 125 µL of the solubilized CV stain was transferred to a new
polystyrene microtiter dish. The amount of biofilm formation was determined by measure the
absorbance at 540 nm. The relative biofilm formation was determined using the following
equation: relative biofilm formation (%) = (A540 sample – A540 medium)/(A540 control – A540
medium) × 100. The sample absorbance values were obtained from the wells containing bacteria
and brominated furanones, and the control absorbance values were obtained from BF-free wells
containing bacteria and DMSO.
Growth curve of planktonic bacteria.
An overnight bacterial culture was diluted and grown to an OD600 of 0.05. The subculture
was aliquoted into 96-well plates at 200 µL per well. Appropriate amount of stock solutions of
brominated furanones in DMSO was added to each well. The outermost wells of the 96-well
plates were filled with 200 µL of sterile autoclaved water to prevent uneven evaporation. The
plates were incubated at 37 oC with shaking (250 rpm). The OD600 readings were acquired
aseptically at 0, 2, 4, 6, 8, 10, 12, and 24 h using Biotek ELx800 TM
absorbance microplate reader
(BioTek Instruments, Inc., Winooski, VT) using Gen5TM
data analysis software. The growth
curves were plotted as OD600 values (mean ± SD) versus time from six replicates.
Reporter gene assay for P. aeruginosa.162,167,195
- 177 -
An overnight culture of PAO1 (plasI-LVAgfp) and PAO1 (prhlI-LVAgfp) in M9 medium
(300 µg/mL carbenicillin) was grown from a single colony picked from an LB agar plate
supplemented with 300 µg/mL carbenicillin. The cell culture was diluted and grew to an OD600
of 0.1 in M9 medium containing 300 µg/mL of carbenicillin. Bacteria culture (200 µL) was
added to each well of a polystyrene 96-well microplate (Costar 3370, Corning Incorporated,
Corning, NY) containing appropriate amount of natural autoinducers with and without
brominated furanones. The plate was incubated at 37 oC for 24 h in a rotary shaking incubator
(250 rpm). The culture from each well was then transferred to a 96-well plate with black wall
(µClear, 655096, Greiner Bio-One North America, Inc., Monroe, NC). The fluorescence (an
excitation wavelength of 500 nm and an emission wavelength of 540 nm) and OD absorbance
(OD600) in each well was measured by Synergy H1 multi-mode microplate reader with a Gen5
data analysis software. Background signals from M9 medium were deducted from all samples.
Determination of combined effect of BBFs and tobramycin.
An overnight culture of P. aeruginosa PAO1 in LB broth was diluted 1:100 and grew to
OD600 of 0.1. The cell culture was inoculated on to 316 stainless steel coupons (ca. 3/8 in. x 3/8
in.) in a 24-well plate. After 24 h of biofilm formation at 37 oC, the old medium was then
replaced by fresh LB broth that contained 200 µM BBF and then the biofilms were allowed to
grow for another 24 h. Subsequently, the medium was replaced by fresh LB broth that contained
0.25 µg/mL tobramycin and then the biofilms were allowed to grow for another 24 h. Each steel
coupon was then washed gently by dipping into saline buffer (0.9% NaCl) 3 times and placed in
2 mL of saline buffer. The coupons were sonicated for 1 min and vortexed for 1 min; this process
was repeated twice to release biofilm cells 252
. The resulting cell suspensions were serially

- 178 -
diluted in saline buffer, spread on LB agar plates, and incubated at 37 oC for 24 h to count the
number of CFU.
Evaluating the production of virulence factor in the presence of BBFs.
The production of virulence factor elastase B by P. aeruginosa was measured as described
previously.160,253
Bacteria were grown overnight in PTSB media (5% Peptone, 0.1% Tryptic Soy
Broth) at 37 oC, diluted and grown to midlog phase, and subcultured to an OD600 of 0.05. The
culture was then added to test tubes containing BBFs at the desired final concentrations. The
tubes were incubated for 24 h at 37 oC with shaking (250 rpm). Culture supernatants were
recovered by centrifugation at 3000 rpm (Galaxy 5D centrifuge, VWR, Radnor, PA) for 10 min
at room temperature and then passed through a 0.45 µm PVDF syringe filter (Santa Cruz
Biotechnology, Inc., Santa Cruz, CA). A 100 µL aliquot of the supernatant was added to 900 µL
of Elastin-Congo red (ECR) buffer (100 mM Tris-HCl, 1 mM CaCl2, pH 7.2) containing 4.5 mg
of Elastin-Congo red and incubated for 24 h at 37 oC with shaking (250 rpm). After incubation,
0.2 mL of 0.12 M EDTA was added to stop the reaction. Insoluble ECR was removed by
centrifugation and the absorbance of the supernatant (OD490) was measured. Elastase B activity
was represented by OD490 of the samples treated with BBFs minus the OD490 of the bacteria-free
samples.
Mice (The protocols for SP-A/D KO mouse model, lung infection, tissue collection, lung
bacteriology and bronchoalveolar lavage were performed and described by Dr. Osama A. Abdel-
Razek from Dr. Guirong Wang’s research group at Upstate Medical University (SUNY)).
SP-A and SP-D double knockout (SP-A/D KO) mice with C57BL/6 background were used
for this study. The original SP-A/D KO mice were kindly provided by Dr. Samuel. Hawgood
(The University of Califonia San Francisco) and these mice had been backcrossed at least 10

- 179 -
generations against a C57BL/6 background 244
. Mice used in this study were bred in the animal
core facility at SUNY Upstate Medical University under pathogen-free conditions. All animal
experiments were conducted in accordance with the Institutional Animal Care and Use
Committee guidelines of SUNY Upstate Medical University and the National Institutes of Health
guidelines on the use of laboratory animals.
Lung infection model.
P. aeruginosa strain PAO1- BAA-47 (wild type) from frozen stocks were streaked onto LB
agar plates and incubated at 37°C for 24 hours, and a single colony was picked up and
transferred to a flask contains 20 mL of LB Broth and incubated at 37°C for 13 hours with
shaking at 250 rpm. The optical density at 600 nm (OD600) was measured and it is usually about
2.1 by this time. The bacterial cells were recovered by centrifugation, resuspended in saline and
diluted to an optical density of 0.6 at OD600. One mL of this solution was estimated to contain 2
× 109 CFU. The solution was diluted 10 times with saline for use. Based on our preliminary data,
a 50 µl (containing 1 × 10⁷ CFU) of the diluted bacterial solution was used to inject each mouse
intratracheally. The tracheal delivery of [50 µl (1 × 10⁷ CFU)/ mouse] was accomplished by
anesthetizing mice with 30 µl of the mixture of ketamine:xylazine (100 mg/kg:10 mg/kg). In 6-
BBF-treated group bacterial suspension was mixed with 6-BBF (final concentration to 200 µM
of 6-BBF). In control group bacterial suspension was added with same volume of saline. Forty
eight hours after lung infection the mice were sacrificed.
Tissue Collection.
After anesthetizing mice with 30 µl of the mixture of ketamine: xylazine (100 mg/kg:10
mg/kg), a large abdominal incision was made and the intestine was turned to the left side of the
- 180 -
inferior vena cava and aorta were cut using iris scissors and the animal was bleed and then lung
tissue was harvested or was lavaged.
Lung Bacteriology.
Mice from both 6-BBF-treated group and controls were studied for quantitative bacteriology.
The left half of the lung of each mouse was removed aseptically and homogenized in 1 ml of
sterile saline and 100 µl of appropriately serial diluted lung homogenates were plated on LB
agar, and incubated at 37°C for 24 hours after which bacterial colonies were counted. CFUs were
determined using the Quantity One colony-counting software (Bio-Rad, Hercules, CA).
Bronchoalveolar Lavage (BAL).
Mice from both 6-BBF-treated group and controls were prepared for BAL. After
anesthetizing mice with 30 µl of the mixture of ketamine/xylazine (90mg/kg/10mg/kg,
respectively), the animal was bleed and then the lung was lavaged 3 times each with 0.5 ml
saline. Then 100 µl of diluted BAL Fluid with saline was plated on LB agar plate, and incubated
at 37°C for 16 hours. Bacterial CFUs were determined using the Quantity One colony-counting
software (Bio-Rad, Hercules, CA).
Cytotoxicity Assay for human cells.
All cell cultures were maintained in a humidified incubator, at 37 °C, with 5% CO2
atmosphere. Human neuroblastoma SK-N-SH cells (a donation from Bonnie B. Toms at SUNY
Upstate Medical University) were cultured in 96-well plates with 100 µL of culture medium
(EMEM + 10% FBS, 100 μg/mL streptomycin, 100 IU/mL penicillin, and 2.0 mM L-glutamine).
Each well contained 100 µL of cell suspension with a concentration of 5×10⁴
cells/mL. The
viability of SK-N-SH was determined with a hemacytometer using standard trypan blue protocol.
For cytotoxicity assay, the colorimetric cell counting assay (CCK 8 assay) was used as described
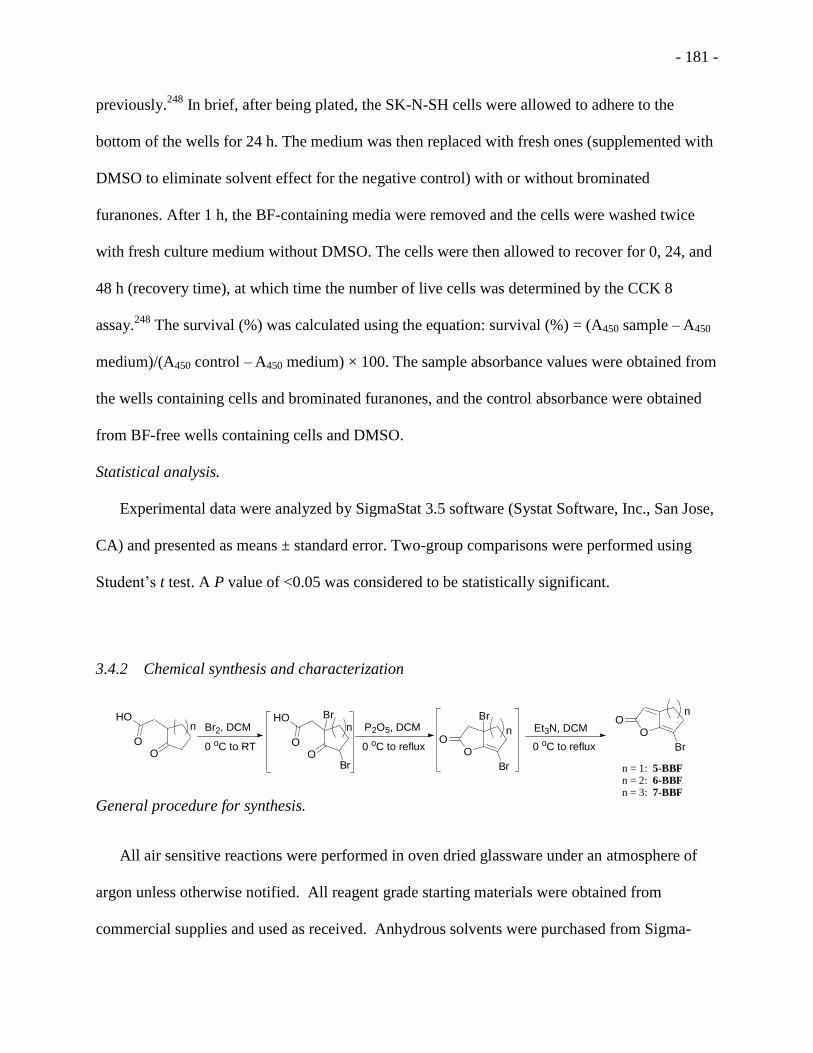
- 181 -
previously.248
In brief, after being plated, the SK-N-SH cells were allowed to adhere to the
bottom of the wells for 24 h. The medium was then replaced with fresh ones (supplemented with
DMSO to eliminate solvent effect for the negative control) with or without brominated
furanones. After 1 h, the BF-containing media were removed and the cells were washed twice
with fresh culture medium without DMSO. The cells were then allowed to recover for 0, 24, and
48 h (recovery time), at which time the number of live cells was determined by the CCK 8
assay.248
The survival (%) was calculated using the equation: survival (%) = (A450 sample – A450
medium)/(A450 control – A450 medium) × 100. The sample absorbance values were obtained from
the wells containing cells and brominated furanones, and the control absorbance were obtained
from BF-free wells containing cells and DMSO.
Statistical analysis.
Experimental data were analyzed by SigmaStat 3.5 software (Systat Software, Inc., San Jose,
CA) and presented as means ± standard error. Two-group comparisons were performed using
Student’s t test. A P value of <0.05 was considered to be statistically significant.
3.4.2 Chemical synthesis and characterization
General procedure for synthesis.
All air sensitive reactions were performed in oven dried glassware under an atmosphere of
argon unless otherwise notified. All reagent grade starting materials were obtained from
commercial supplies and used as received. Anhydrous solvents were purchased from Sigma-
O
BrBr2, DCM
0 oC to RT
P2O5, DCM
0 oC to reflux
Et3N, DCM
0 oC to reflux
HO
OO
HO
OO
Br
Br
O
Br
OO
Br
n = 1: 5-BBF
n = 2: 6-BBF
n = 3: 7-BBF
n n n
n
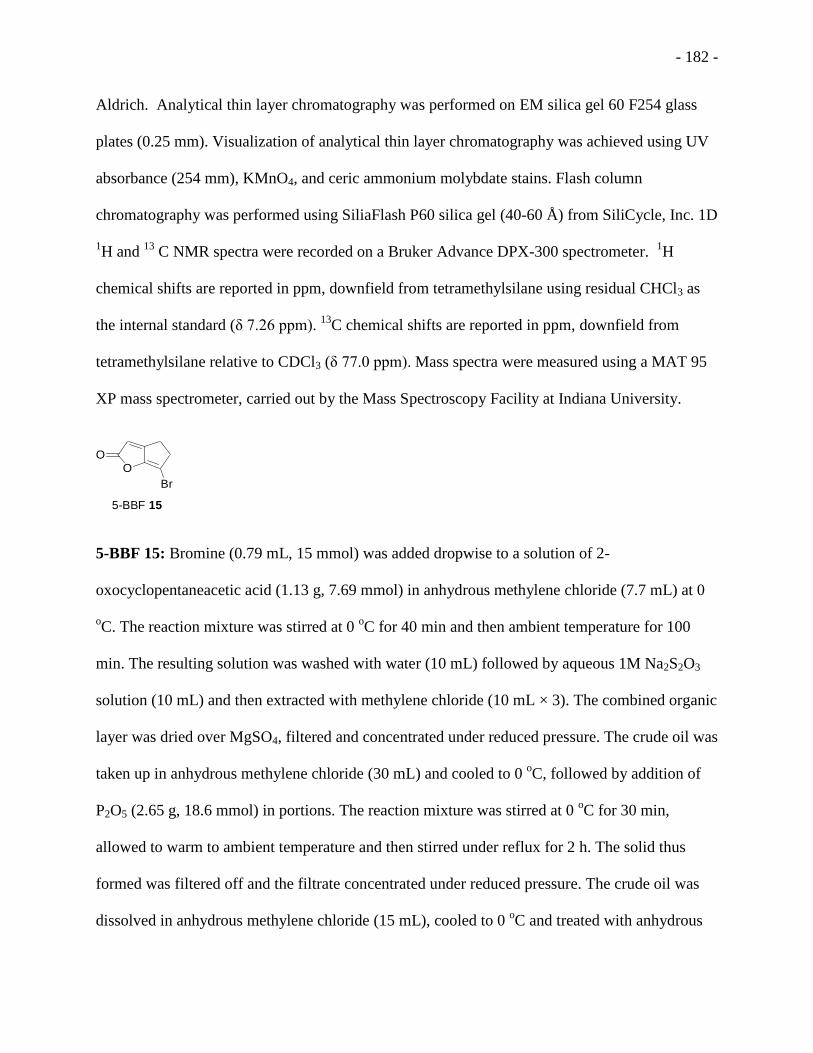
- 182 -
Aldrich. Analytical thin layer chromatography was performed on EM silica gel 60 F254 glass
plates (0.25 mm). Visualization of analytical thin layer chromatography was achieved using UV
absorbance (254 mm), KMnO4, and ceric ammonium molybdate stains. Flash column
chromatography was performed using SiliaFlash P60 silica gel (40-60 Å) from SiliCycle, Inc. 1D
1H and
13 C NMR spectra were recorded on a Bruker Advance DPX-300 spectrometer.
1H
chemical shifts are reported in ppm, downfield from tetramethylsilane using residual CHCl3 as
the internal standard (δ 7.26 ppm). 13
C chemical shifts are reported in ppm, downfield from
tetramethylsilane relative to CDCl3 (δ 77.0 ppm). Mass spectra were measured using a MAT 95
XP mass spectrometer, carried out by the Mass Spectroscopy Facility at Indiana University.
OO
Br
5-BBF 15
5-BBF 15: Bromine (0.79 mL, 15 mmol) was added dropwise to a solution of 2-
oxocyclopentaneacetic acid (1.13 g, 7.69 mmol) in anhydrous methylene chloride (7.7 mL) at 0
oC. The reaction mixture was stirred at 0
oC for 40 min and then ambient temperature for 100
min. The resulting solution was washed with water (10 mL) followed by aqueous 1M Na2S2O3
solution (10 mL) and then extracted with methylene chloride (10 mL × 3). The combined organic
layer was dried over MgSO4, filtered and concentrated under reduced pressure. The crude oil was
taken up in anhydrous methylene chloride (30 mL) and cooled to 0 oC, followed by addition of
P2O5 (2.65 g, 18.6 mmol) in portions. The reaction mixture was stirred at 0 oC for 30 min,
allowed to warm to ambient temperature and then stirred under reflux for 2 h. The solid thus
formed was filtered off and the filtrate concentrated under reduced pressure. The crude oil was
dissolved in anhydrous methylene chloride (15 mL), cooled to 0 oC and treated with anhydrous
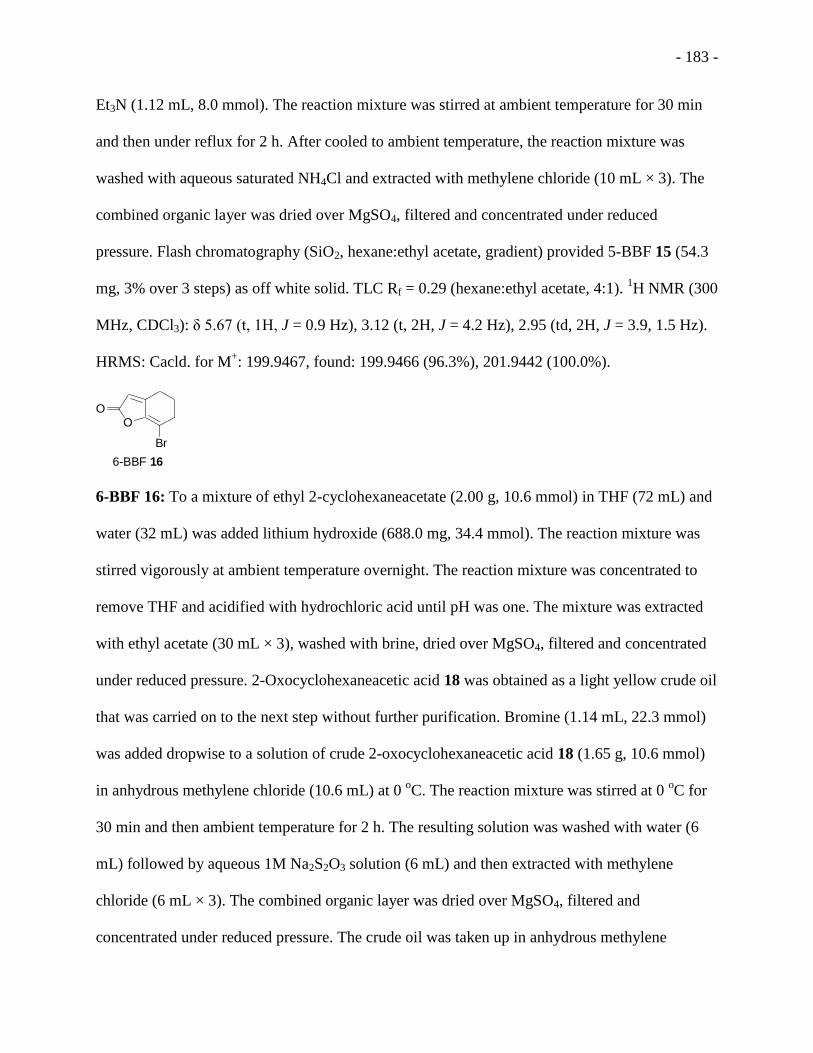
- 183 -
Et3N (1.12 mL, 8.0 mmol). The reaction mixture was stirred at ambient temperature for 30 min
and then under reflux for 2 h. After cooled to ambient temperature, the reaction mixture was
washed with aqueous saturated NH4Cl and extracted with methylene chloride (10 mL × 3). The
combined organic layer was dried over MgSO4, filtered and concentrated under reduced
pressure. Flash chromatography (SiO2, hexane:ethyl acetate, gradient) provided 5-BBF 15 (54.3
mg, 3% over 3 steps) as off white solid. TLC Rf = 0.29 (hexane:ethyl acetate, 4:1). 1H NMR (300
MHz, CDCl3): δ 5.67 (t, 1H, J = 0.9 Hz), 3.12 (t, 2H, J = 4.2 Hz), 2.95 (td, 2H, J = 3.9, 1.5 Hz).
HRMS: Cacld. for M+: 199.9467, found: 199.9466 (96.3%), 201.9442 (100.0%).
OO
Br
6-BBF 16
6-BBF 16: To a mixture of ethyl 2-cyclohexaneacetate (2.00 g, 10.6 mmol) in THF (72 mL) and
water (32 mL) was added lithium hydroxide (688.0 mg, 34.4 mmol). The reaction mixture was
stirred vigorously at ambient temperature overnight. The reaction mixture was concentrated to
remove THF and acidified with hydrochloric acid until pH was one. The mixture was extracted
with ethyl acetate (30 mL × 3), washed with brine, dried over MgSO4, filtered and concentrated
under reduced pressure. 2-Oxocyclohexaneacetic acid 18 was obtained as a light yellow crude oil
that was carried on to the next step without further purification. Bromine (1.14 mL, 22.3 mmol)
was added dropwise to a solution of crude 2-oxocyclohexaneacetic acid 18 (1.65 g, 10.6 mmol)
in anhydrous methylene chloride (10.6 mL) at 0 oC. The reaction mixture was stirred at 0
oC for
30 min and then ambient temperature for 2 h. The resulting solution was washed with water (6
mL) followed by aqueous 1M Na2S2O3 solution (6 mL) and then extracted with methylene
chloride (6 mL × 3). The combined organic layer was dried over MgSO4, filtered and
concentrated under reduced pressure. The crude oil was taken up in anhydrous methylene
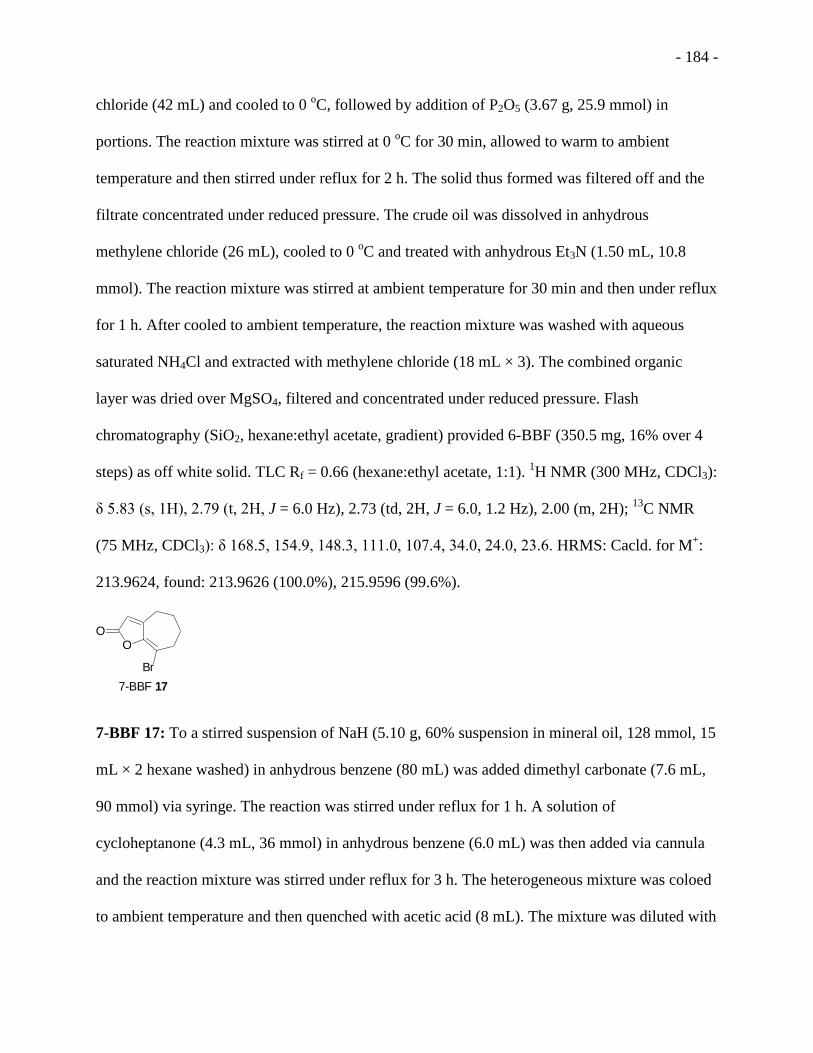
- 184 -
chloride (42 mL) and cooled to 0 oC, followed by addition of P2O5 (3.67 g, 25.9 mmol) in
portions. The reaction mixture was stirred at 0 oC for 30 min, allowed to warm to ambient
temperature and then stirred under reflux for 2 h. The solid thus formed was filtered off and the
filtrate concentrated under reduced pressure. The crude oil was dissolved in anhydrous
methylene chloride (26 mL), cooled to 0 oC and treated with anhydrous Et3N (1.50 mL, 10.8
mmol). The reaction mixture was stirred at ambient temperature for 30 min and then under reflux
for 1 h. After cooled to ambient temperature, the reaction mixture was washed with aqueous
saturated NH4Cl and extracted with methylene chloride (18 mL × 3). The combined organic
layer was dried over MgSO4, filtered and concentrated under reduced pressure. Flash
chromatography (SiO2, hexane:ethyl acetate, gradient) provided 6-BBF (350.5 mg, 16% over 4
steps) as off white solid. TLC Rf = 0.66 (hexane:ethyl acetate, 1:1). 1H NMR (300 MHz, CDCl3):
δ 5.83 (s, 1H), 2.79 (t, 2H, J = 6.0 Hz), 2.73 (td, 2H, J = 6.0, 1.2 Hz), 2.00 (m, 2H); 13
C NMR
(75 MHz, CDCl3): δ 168.5, 154.9, 148.3, 111.0, 107.4, 34.0, 24.0, 23.6. HRMS: Cacld. for M+:
213.9624, found: 213.9626 (100.0%), 215.9596 (99.6%).
OO
Br
7-BBF 17
7-BBF 17: To a stirred suspension of NaH (5.10 g, 60% suspension in mineral oil, 128 mmol, 15
mL × 2 hexane washed) in anhydrous benzene (80 mL) was added dimethyl carbonate (7.6 mL,
90 mmol) via syringe. The reaction was stirred under reflux for 1 h. A solution of
cycloheptanone (4.3 mL, 36 mmol) in anhydrous benzene (6.0 mL) was then added via cannula
and the reaction mixture was stirred under reflux for 3 h. The heterogeneous mixture was coloed
to ambient temperature and then quenched with acetic acid (8 mL). The mixture was diluted with

- 185 -
water (200 mL), extracted with ethyl acetate (50 mL × 4), washed with brine, dried over MgSO4,
filtered and concentrated under reduced pressure. Methyl 2-oxo-1-ccloheptanecarboxylate 19
was obtained as yellow oil that was carried on to the next step without further purification. To a
solution of crude methyl 2-oxo-1-ccloheptanecarboxylate 19 in acetone (100 mL) was added
potassium carbonate (23.2 g, 168 mmol) followed by ethyl bromoacetate (3.8 mL, 34 mmol).
The reaction mixture was stirred under reflux overnight (~17 h). The suspension was cooled to
ambient temperature and concentrated under reduced pressure to remove ~ half of the acetone.
The residue was diluted with water (50 mL), extracted with diethyl ether (50 mL × 3), washed
with brine, dried over MgSO4, filtered and concentrated under reduced pressure. The resulting
yellow oil was treated with a solution of hydrochloric acid (27 mL, 6M) and acetic acid (27 mL).
The reaction mixture was stirred under reflux for 2 days and cooled to ambient temperature. The
mixture was diluted with water (50 mL), extracted with methylene chloride (30 mL × 5), washed
with brine, dried over MgSO4, filtered and concentrated under reduced pressure. Flash
chromatography (SiO2, methylene chloride:ethyl acetate, gradient) provided 2-
oxocycloheptaneacetic acid 20 (5.35 g, 87% over 3 steps) as a light yellow oil. TLC Rf = 0.31
(methylene chloride:ethyl acetate, 1:1). The identity of this compound was confirmed by
comparing 1H NMR data with that previously reported.
218 Bromine (0.93 mL, 18 mmol) was
added dropwise to a solution of 2-oxocycloheptaneacetic acid 20 (1.47 g, 8.66 mmol) in
anhydrous methylene chloride (8.7 mL) at 0 oC. The reaction mixture was stirred at 0
oC for 30
min and then ambient temperature for 2 h. The resulting solution was washed with water (5 mL)
followed by aqueous 1M Na2S2O3 solution (5 mL) and then extracted with methylene chloride (5
mL × 3). The combined organic layer was dried over MgSO4, filtered and concentrated under
reduced pressure. The crude oil was taken up in anhydrous methylene chloride (35 mL) and
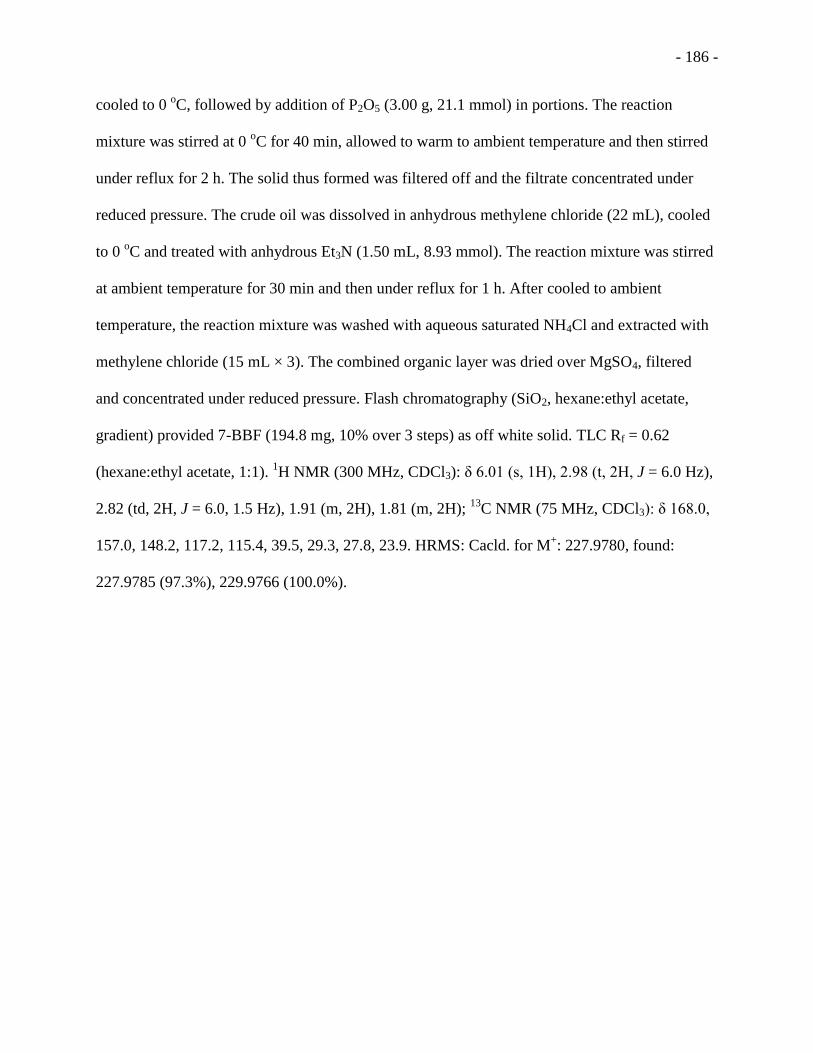
- 186 -
cooled to 0 oC, followed by addition of P2O5 (3.00 g, 21.1 mmol) in portions. The reaction
mixture was stirred at 0 oC for 40 min, allowed to warm to ambient temperature and then stirred
under reflux for 2 h. The solid thus formed was filtered off and the filtrate concentrated under
reduced pressure. The crude oil was dissolved in anhydrous methylene chloride (22 mL), cooled
to 0 oC and treated with anhydrous Et3N (1.50 mL, 8.93 mmol). The reaction mixture was stirred
at ambient temperature for 30 min and then under reflux for 1 h. After cooled to ambient
temperature, the reaction mixture was washed with aqueous saturated NH4Cl and extracted with
methylene chloride (15 mL × 3). The combined organic layer was dried over MgSO4, filtered
and concentrated under reduced pressure. Flash chromatography (SiO2, hexane:ethyl acetate,
gradient) provided 7-BBF (194.8 mg, 10% over 3 steps) as off white solid. TLC Rf = 0.62
(hexane:ethyl acetate, 1:1). 1H NMR (300 MHz, CDCl3): δ 6.01 (s, 1H), 2.98 (t, 2H, J = 6.0 Hz),
2.82 (td, 2H, J = 6.0, 1.5 Hz), 1.91 (m, 2H), 1.81 (m, 2H); 13
C NMR (75 MHz, CDCl3): δ 168.0,
157.0, 148.2, 117.2, 115.4, 39.5, 29.3, 27.8, 23.9. HRMS: Cacld. for M+: 227.9780, found:
227.9785 (97.3%), 229.9766 (100.0%).

- 187 -
OO
Br
5-BBF 15

- 188 -
OO
Br
6-BBF 16
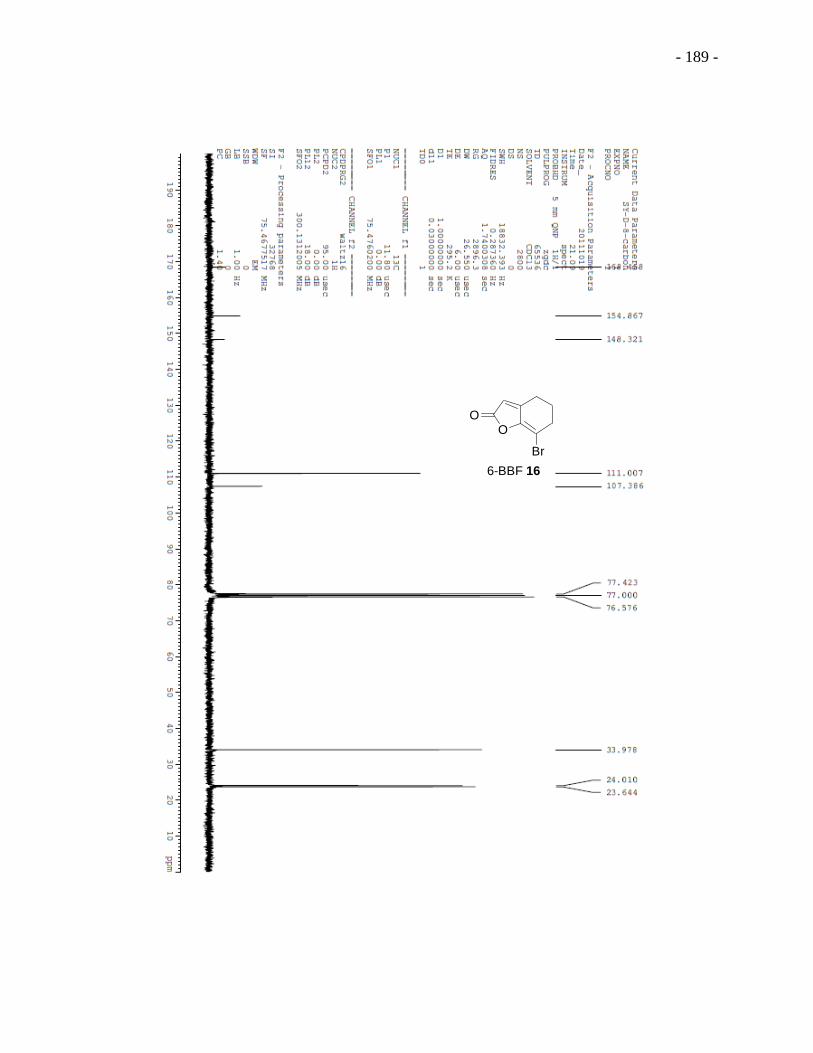
- 189 -
OO
Br
6-BBF 16

- 190 -
OO
Br
7-BBF 17
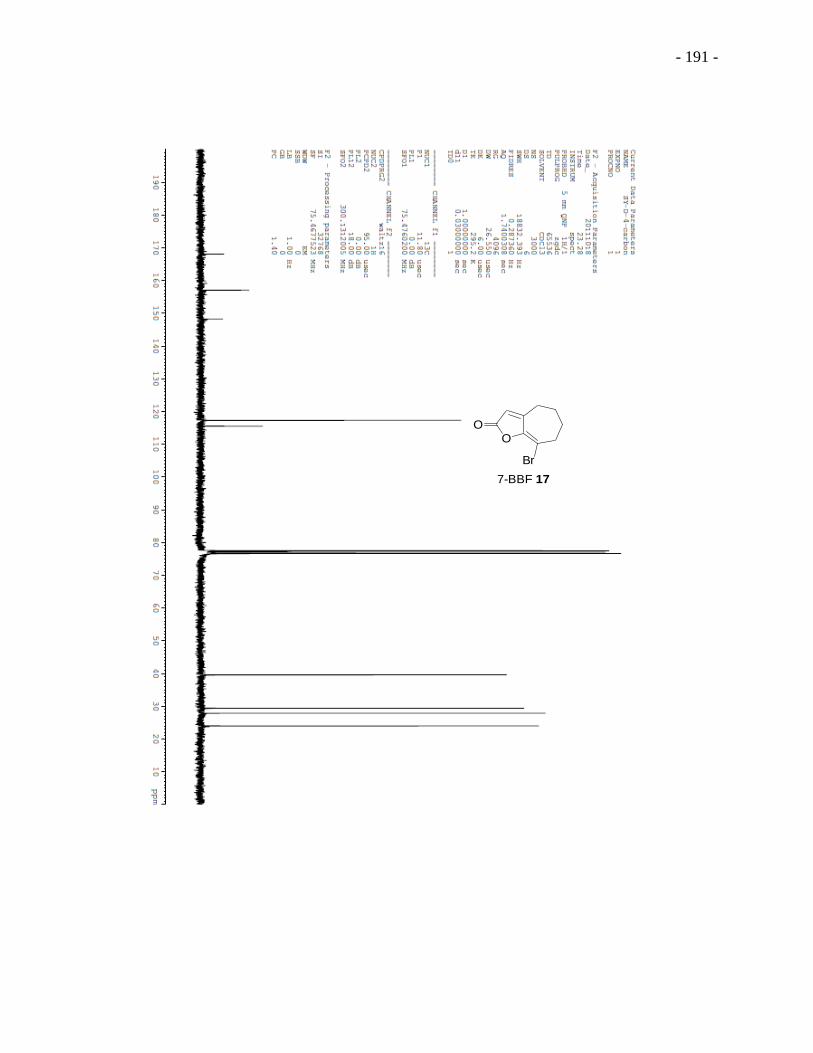
- 191 -
OO
Br
7-BBF 17

- 192 -
Chapter 4
Modulation of Quorum Sensing in Gram-negative Bacteria by Squarylated Homoserine
Lactones
Summary
An expanded library of squarylated homoserine lactones (SHLs) were designed and
synthesized as analogues to the natural AHLs. Together with some of the existing SHLs, these
compounds were evaluated for their activity to modulate the quorum sensing (QS) systems in
two Gram-negative bacteria, an opportunistic pathogen P. aeruginosa and a symbiont V. fischeri.
None of the SHLs were identified as agonists to LasR in P. aeruginosa or LuxR in V. fischeri at
the concentrations tested, except for octyl-SHL, which showed weak agonistic activity to LasR at
150 µM. The SHLs were weak to moderate antagonist to LasR in at 150 and 300 µM. All except
one SHL inhibited LuxR, with the alkyl-SHLs showing more inhibition in general than the aryl-
SHLs. The cytotoxicity study suggested that the SHLs have no or minimal inhibition to the
growth of these two bacteria species and the inhibition of QS or biofilm formation by P.
aeruginosa were not due to bactericidal effect. Primary investigation of structural activity
relationship indicated that alkyl chain length is critical to activity of SHLs. These SHLs are
promising candidates as modulators of other AHL-mediated QS systems.
4.1 Background and Significance
4.1.1 AHL-based quorum sensing in Gram-negative bacteria
N-Acyl homoserine lactones (AHLs) are the most common class of signaling molecules used
by Gram-negative bacteria in their intercellular communication called quorum sensing (QS).123
This signaling process allows the bacteria to coordinate gene expression in response to
NH
O
O
O
R1
R2
R1 = CH3, CH3(CH2)n, or CH3(CH2)nCH=CH(CH2)mR2 = H, O, or OH
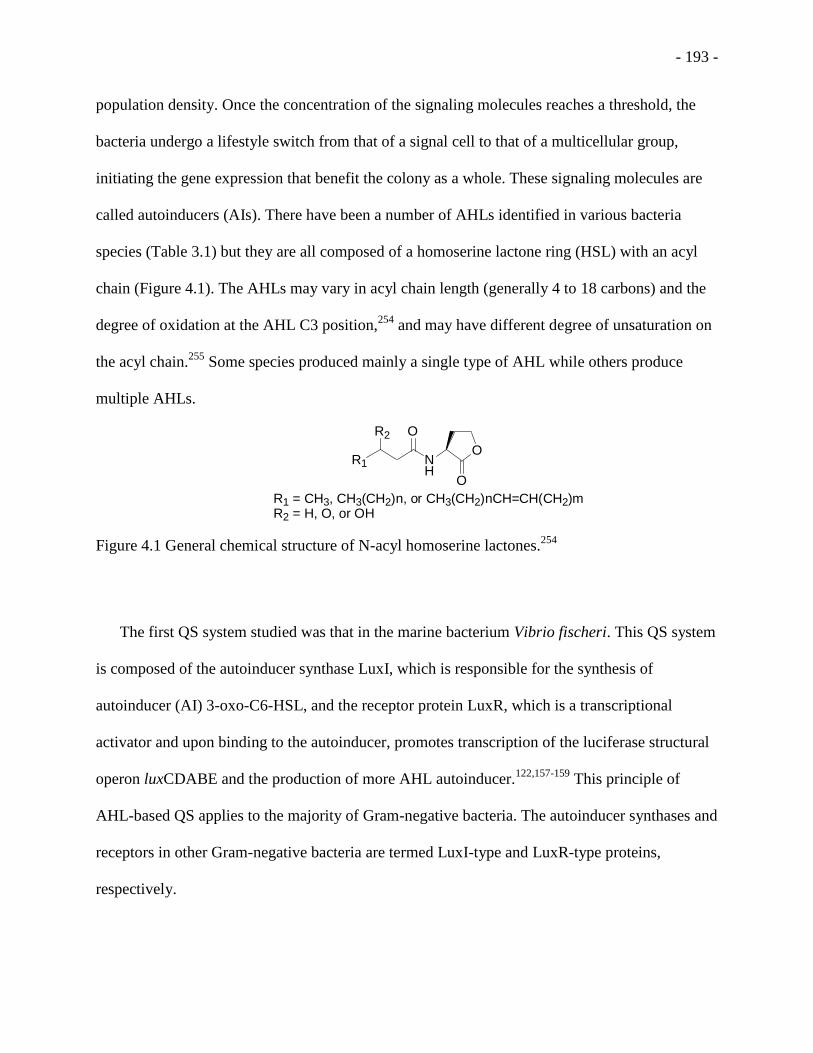
- 193 -
population density. Once the concentration of the signaling molecules reaches a threshold, the
bacteria undergo a lifestyle switch from that of a signal cell to that of a multicellular group,
initiating the gene expression that benefit the colony as a whole. These signaling molecules are
called autoinducers (AIs). There have been a number of AHLs identified in various bacteria
species (Table 3.1) but they are all composed of a homoserine lactone ring (HSL) with an acyl
chain (Figure 4.1). The AHLs may vary in acyl chain length (generally 4 to 18 carbons) and the
degree of oxidation at the AHL C3 position,254
and may have different degree of unsaturation on
the acyl chain.255
Some species produced mainly a single type of AHL while others produce
multiple AHLs.
Figure 4.1 General chemical structure of N-acyl homoserine lactones.254
The first QS system studied was that in the marine bacterium Vibrio fischeri. This QS system
is composed of the autoinducer synthase LuxI, which is responsible for the synthesis of
autoinducer (AI) 3-oxo-C6-HSL, and the receptor protein LuxR, which is a transcriptional
activator and upon binding to the autoinducer, promotes transcription of the luciferase structural
operon luxCDABE and the production of more AHL autoinducer.122,157-159
This principle of
AHL-based QS applies to the majority of Gram-negative bacteria. The autoinducer synthases and
receptors in other Gram-negative bacteria are termed LuxI-type and LuxR-type proteins,
respectively.
NH
O
O
O
R1
R2
R1 = CH3, CH3(CH2)n, or CH3(CH2)nCH=CH(CH2)mR2 = H, O, or OH

- 194 -
4.1.2 Modulation of LuxI/LuxR-type quorum sensing system
As discussed in Chapter 3, one of the most commonly used strategies to control QS is to
interfere with the binding of AIs to the LuxR-type receptors. There have been a number of
attempts to discover small molecules that can potentially interact with the LuxR-type receptors
and therefore modulate QS and QS-controlled bioactivities in bacteria. One powerful method is
the high-throughput screen which has been utilized to identify small molecules as inhibitors of
quorum sensing or biofilm formation.175-177
For example, ursolic acid was identified from 13000
compounds purified from plants as a biofilm inhibitor that inhibits biofilm formation by E. coli,
P. aeruginosa, and V. harveyi without being toxic.175
A rapid screening of 4509 compounds
revealed that ferric ammonium citrate inhibited biofilm formation by P. aeruginosa PA14 in a
dose-dependent manner.176
The human kind has long been utilizing plants and animals and fungus as traditional
medicines and we are still learning from Mother Nature as new technology allows us to identify
the active components in the therapy. We are therefore able to design and synthesize mimics of
the identified natural products which do not exist in nature, with similar or even higher biological
activities. One of the most successful approaches is based on the synthesis of mimics of naturally
occurring bacterial signaling molecules (e.g. AHLs).
The first a few AHL analogue studies were published by groups led by Eberhard,256
Greenberg,257
and Iglewski.258
They explored the agonistic and antagonistic activities of
synthetic AHL mimics against LuxR in V. fischeri or LasR in P. aeruginosa. These researchers
demonstrated that: (1). In general, the acyl chain length is critical for the activity of AHL
analogues. (2). For species whose natural AHLs possess a 3-oxo group, the presence of this
group in synthetic AHL analogues is important for activity, but not essential. The removal of the

- 195 -
3-oxo group most often results in reduced agonistic activity or results in antagonistic activity
rather than agonistic activity. (3). Replacement of the lactone ring in AHL analogues with γ-
thiolactone normally retains the same overall activity but switching to a γ-lactam is not tolerant.
In a series of studies reported by Doutheau and co-workers on AHL analogues and their
activities against LuxR, the authors found that medium-sized, branched acyl derivatives were
agonists of LuxR while phenyl derivatives were antagonists of LuxR.259
Moreover, they made a
group of AHLs in which the carbonyl group of the amide bond was replaced with a sulfonyl
group and determined that the sulfonyl AHLs with acyl chains close in length to 3-oxo-C6-HSL
and shorter were the strongest inhibitors of LuxR. None of the sulfonyl AHLs showed agonistic
activity against LuxR.260
In another report by the same group, it was shown that replacing the
amide in AHL with a urea resulted in compounds that displayed antagonistic but not agonistic
activities against LuxR.261
Suga and co-workers prepared a library of 96 AHL mimics, in which the lactone ring was
replaced with various heterocycles and carbocycles that could hydrogen-bond at the same
position as the carbonyl in the parent γ-lactone.160,161
They concluded that a five- or six-
membered ring with a hydrogen bond acceptor was necessary to activate LasR in P. aeruginosa
by AHL analogues. AHL mimics that contain an aromatic ring in place of the γ-lactone with a
hydrogen bond acceptor present could inhibit LasR. The authors speculate that compounds with
aromaticity at the AHL lactone ring position cause a conformational change of LasR upon
binding which then presumably reduces the ability of LasR to bind DNA, and therefore inhibits
transcription.262
The most comprehensive and systematic work to investigate the structure activity
relationship (SAR) for synthetic AHL analogues to date was done by Blackwell and co-

- 196 -
workers.263
Using a microwave-assisted, solid-phase route, these researchers synthesized more
than 100 AHL analogues and evaluated their activity to modulate QS across three Gram-negative
bacteria species: the symbiont V. fischeri and the pathogens P. aeruginosa and A.
tumefaciens.162,163,166,264
Their studies revealed that several of the AHL analogues exhibited
antagonistic activity in all three species examined, while other analogues were only active in one
or two species. Broad-spectrum agonists with high activity were not identified (Figure 4.2).
Several of the AHL analogues appeared to be agonist in one strain but antagonist in another.
Very interestingly, a few of these ligands were antagonists at lower concentrations but were able
to activate the transcriptional regulators at higher concentrations. From these studies, Blackwell
and co-workers summarized several SAR trends, a few of which are congruent with those found
by other groups previous reports as discussed above.256-258,260
In addition, the authors noted that:
(1). The TraR protein was the most sensitive to the length of the AHL acyl chains. Assuming the
synthetic AHLs target the same ligand-binding site on TraR compared to the natural AHL, this
finding suggests that the TraR may have a sterically crowded ligand-binding site, which is in
accordance with the X-ray crystal structure of TraR. (2). On the contrary, the LasR protein was
the most tolerant of varying AHL acyl chain length, functionality on the acyl chain, and the
stereochemistry of the homoserine lactone ring. This finding implies that LasR has a larger
ligand-binding site than TraR, which is in accordance with the X-ray crystal structure of LasR.
(3). The LuxR protein was most strongly activated by AHLs containing a phenylacetanoyl group
in the acyl chain with electron-withdrawing group in the 3-position, while was most strongly
inhibited by AHLs with acyl chain length of 6 to 14 carbons that had a 3-oxo group. These works
not only supply a highly efficient chemical tool to develop and expand new libraries of QS

- 197 -
modulators but also provide broad insights into the structural basis for QS mediated by AHL
signals in Gram-negative bacteria.
Figure 4.2 Venn diagrams showing the structures of selective most potent LuxR-type protein
antagonists and agonists identified and their selectivities for different LuxR-type proteins from
A. tumefaciens (TraR), V. fischeri (LuxR), and P. aeruginosa (LasR). Ligands in the
intersections of the circles have significant selectivity for two or more proteins.163
NA: No
applicable ligands identified.
Br
R
RMe
4
F3C R
RMe
8
MeR
O
10O
R
F3CO
OR
O2N R
NH
O
O
O
R =
Antagonists
Agonists
TraR LuxR
LasR
TraR
LasR
LuxR
MeR
O
8 O
R
MeR
O
10
MeR
O
2MeR
O
4 O2N R
NA
NA
NANA

- 198 -
4.1.3 Biofilm inhibitors containing squarate moiety
AHLs are prone to hydrolysis either at the lactone ring due to elevated pH or the activity of
acyl-HSL lactonases produced by strains of Agrobacterium, Arthrobacter, Bacillus, and
Klebsiella, or at the acyl-amide linkage catalyzed by acyl-HSL acylases produced by strains of
Pseudomonas, Ralstonia, and Variovorax.265
In addition, the flexible structures of the acyl chains
provide numerous possible conformations which may reduce the affinity of these molecules to
the receptor proteins. Taking these facts into consideration, Narasimhan et al. designed and
synthesized a group of squarylated homoserine lactones (SHLs) in which the homoserine lactone
is attached to a squarate moiety, which bears saturated or unsaturated aliphatic chains.266
Most
SHLs were prepared in a racemic form except for vinyl-SHL, which was prepared in both
enantiomerically pure forms (4 and 5) and the racemic form (3). Together with four squarylated
esters and two squarylated amides, these squarate-based AHL analogues were tested for their
inhibitory activity against biofilm formation by E.coli RP437 (Figure 4.3). Vinyl-SHL 3 and
butyl-SHL 6 were the most potent biofilm inhibitors among the molecules tested, with ~50%
inhibition at 200 µM. No different biofilm inhibitory activity was observed for the L- and D-
vinyl-SHLs and both resulted in only half biofilm inhibition compared to the racemic form.

- 199 -
Figure 4.3 Chemical structures of squarate-based AHL analogues examined by Narasimhan et al.
on inhibitory activities against biofilm formation by E. coli RP437. Figure adapted and modified
from Ph. D. thesis by Sri Kamesh Narasimhan.266
Bandyopadhyay et al. added three alkyl SHLs and three aryl SHLs to the library and
evaluated the ability of the new compounds to inhibit biofilm formation by E.coli RP437 (Figure
4.4).211
Butyl-SHL 6 was used as a control. In general, the aromatic SHLs appeared to exhibit
stronger biofilm inhibition, with the most potent compound tolyl-SHL 18 resulting in ~55%
inhibition while the least potent compound ethyl-SHL 14 showing ~34% inhibition.
Squarylated homoserine lactones (SHLs)
O O
O O
O O
O
O O
O O
O O
O O
7 8 9 10
O O
O NH
O O
NH
11 12
Squarylated esters
Squarylated amides
O O
O NH
O
O O
NH
O
O O
NH
O
O O
NH
O
O O
NH
O
1 2 3 4 5
NH
O O
O
6 OO O O O O
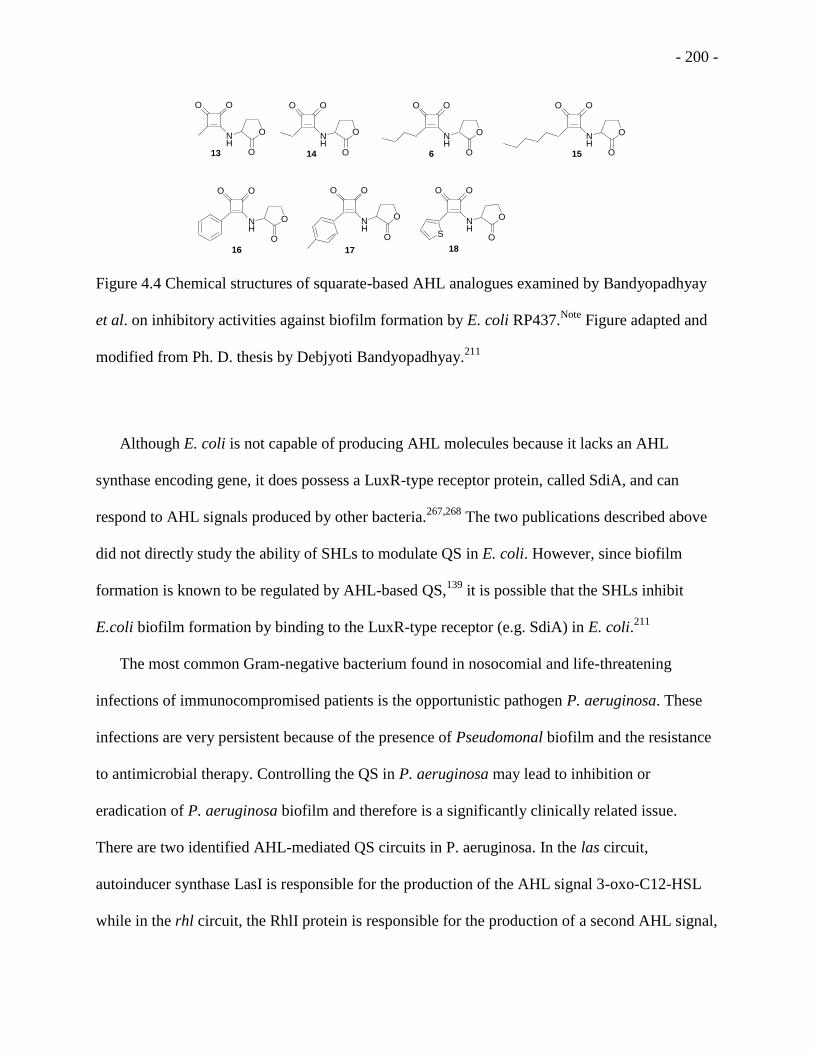
- 200 -
Figure 4.4 Chemical structures of squarate-based AHL analogues examined by Bandyopadhyay
et al. on inhibitory activities against biofilm formation by E. coli RP437.Note
Figure adapted and
modified from Ph. D. thesis by Debjyoti Bandyopadhyay.211
Although E. coli is not capable of producing AHL molecules because it lacks an AHL
synthase encoding gene, it does possess a LuxR-type receptor protein, called SdiA, and can
respond to AHL signals produced by other bacteria.267,268
The two publications described above
did not directly study the ability of SHLs to modulate QS in E. coli. However, since biofilm
formation is known to be regulated by AHL-based QS,139
it is possible that the SHLs inhibit
E.coli biofilm formation by binding to the LuxR-type receptor (e.g. SdiA) in E. coli.211
The most common Gram-negative bacterium found in nosocomial and life-threatening
infections of immunocompromised patients is the opportunistic pathogen P. aeruginosa. These
infections are very persistent because of the presence of Pseudomonal biofilm and the resistance
to antimicrobial therapy. Controlling the QS in P. aeruginosa may lead to inhibition or
eradication of P. aeruginosa biofilm and therefore is a significantly clinically related issue.
There are two identified AHL-mediated QS circuits in P. aeruginosa. In the las circuit,
autoinducer synthase LasI is responsible for the production of the AHL signal 3-oxo-C12-HSL
while in the rhl circuit, the RhlI protein is responsible for the production of a second AHL signal,
NH
O O
O
O
NH
O O
O
OS
16
O O
NH
O
O
17 18
NH
O O
O
O
NH
O O
O
O
NH
O O
O
O
NH
O O
O
O13 14 6 15
Squarylated homoserine lactones (SHLs)

- 201 -
C4-HSL. In the effort of evaluating the ability of synthetic AHLs to stimulate the expression of
the gene for elastase, one of many biological activities controlled by AHL-mediated QS in P.
aeruginosa, Passador et al. demonstrated that the length of the acyl side chain of the AHL
analogues is the most critical factor of activity.258
Therefore we designed the synthesis of SHLs
with chain length similar to that in the natural AI 3-oxo-C12-HSL (8 and 12 carbons for SHLs 19
and 20, respectively) (Scheme 4.1). Introduction of aromatic substituent to the structure of AHL
analogues leads to agonists and antagonists with increased activities.162,163,264
In addition to the
aryl-substituted SHLs 16-18 in hand, we also designed m-xylyl-SHL 21, which has more
substituents on the benzene ring. SHL 6, 13, and 15-21 constitute a library of candidates as
modulators for QS in P. aeruginosa (Figure 4.5).
Figure 4.5 The library of SHLs used in this study.Note.
4.2 Results and Discussion
4.2.1 Synthesis of SHLs
The synthesis route used to prepare SHLs was adapted and modified from that previously
reported by Narasimhan266
and Bandyopadhyay (Scheme 4.1).211
Briefly, 1,2-addition of various
alkylating reagents at one of the carbonyl groups of 3,4-dibutoxy-3-cyclobutene-1,2-dione 9
NH
O O
O
O
NH
O O
O
O
NH
O O
O
O13 6 15
NH
O O
O
O19
NH
O O
O
O20
NH
O O
O
O
NH
O O
O
OS
16
O O
NH
O
O
17 18
NH
O O
O
O
21
Alkyl-SHLs
Note: Methyl-SHL 13, butyl-SHL 6, and tolyl-SHL 17 were synthesized by Debjyoti Bandyopadhyay. Phenyl-SHL
16 and the precursor for tolyl-SHL 17 were synthesized by Nisha Varghese. All the other SHLs were synthesized
by Sijie Yang. Department of Chemistry, Syracuse University, Syracuse NY.

- 202 -
gave cyclobutenols 22-25, which yielded cyclobutenediones 26-30 upon treatment with
concentrated hydrochloric acid. The alkylating reagents were Grignard reagents or organolithium
reagent made from corresponding commercially available bromides. The cyclobutenediones 26-
30 then reacted with α-amino-γ-butyrolactone hydrobromide in the presence of triethylamine and
provided the desired SHLs, namely hexyl-SHL 15, thienyl-SHL 18, octyl-SHL 19, dodecyl-SHL
20, and xylyl-SHL 21. All the SHLs precipitated out from the reaction solvent EtOH, and did not
need further purification by column chromatography.
Scheme 4.1 Synthesis of SHLsa
aN/A indicates the shown compound was not obtained in purified form and a yield was not
available.
4.2.2 Cytotoxicity study of SHLs on the growth of P. aeruginosa
The increasing occurrence of drug-resistant bacteria strains and lack of new antibiotics pose a
significant challenge in treating diseases. It is essential to develop quorum sensing modulators
that do not exert evolutionary selective pressure on bacteria by inhibiting bacterial survival. We
first evaluate the cytotoxicity of SHLs on the growth of P. aeruginosa. Optical density values of
bacteria culture grown in the presence of 300 µM SHLs were measured at 600 nm (OD600) every
2 h for the first 12 h and then after 24h of incubation. Bacteria grown in the absence of SHLs
Sijie’s SHLs
O O
BuO OBuTHF, -78 oC to 0 oC
then NH4Cl (aq.)
conc. HCl, DCM, rtHO O
BuO OBu
O
BuO O EtOH, Et3N rt, overnight
OH3N
OBrNH
O
O
O O
RMgBr or RLin
n
n
9R = n-hexyl, 22 (44%) n-octyl, 23 (48%)
n-dodecyl, 24 (45%) thienyl, 25 (21%)
m-xylyl, (N/A)
R = n-hexyl, 15 (53%) n-octyl, 19 (65%)
n-dodecyl, 20 (30%) thienyl, 18 (60%) m-xylyl, 21 (65%)
R = n-hexyl, 26 (65%) n-octyl, 27 (80%)
n-dodecyl, 28 (21%) thienyl, 29 (59%)
m-xylyl, 30 (27% over 2 steps)

- 203 -
were used as the control (Figure 4.5). The same amount of DMSO introduced from the SHL
stocks was added to the control to eliminate solvent effect. None of the SHLs tested resulted in
any deviation of OD values from that of the SHL-free control and therefore these SHLs do not
inhibit the growth of P. aeruginosa PAO1under the conditions used.
Figure 4.5 Growth curves of P. aeruginosa PAO1 in the absence (control) and presence of 300
µM SHLs. Values represent the means ± standard deviation from four replicates.
4.2.3 Modulation of quorum sensing in P. aeruginosa by SHLs
A double-knockout reporter strain PAO-JP2 (ΔlasIΔrhlI)236
harboring the plasmid plasI-
LVAgfp237
was used to evaluate the effect of SHLs on the las QS system in P. aeruginosa. When
bacteria are growing in the presence of exogenously introduce autoinducer 3-oxo-C12-HSL or
functional analogues, LasR receptor protein binds to the AI, activating transcription of the lasI
promoter and thus the expression of green fluorescence protein (GFP). The GFP production is
quantified by correcting the measured fluorescence signal for cell density as shown in Equation
0
0.2
0.4
0.6
0.8
1
1.2
1.4
1.6
0 2 4 6 8 10 12 14 16 18 20 22 24
OD
600
Time (h)
control
Methyl-SHL
n-Butyl-SHL
n-Hexyl-SHL
n-Octyl-SHL
n-Dodecyl-SHL
Phenyl-SHL
Tolyl-SHL
Thienyl-SHL
m-Xylyl-SHL

- 204 -
4.1. “RFUsample” is the relative fluorescence unit measured by the plate reader. “No AI”
represents bacteria culture grown in the presence of no AI analogue, supplemented with the same
amount of DMSO present in the SHL stocks.
(4.1)
In the agonism assay, bacteria cultures grown in the presence of 150 µM SHLs were
compared to that grown in the presence of 1 µM natural AI 3-oxo-C12-HSL (a concentration
within the range produced by wild type P. aeruginosa).130,160-162
Only octyl-SHL 19 was able to
activate GFP production by a measurable amount, ~20% that of the control (1 µM 3-oxo-C12-
HSL). None of the other SHLs showed any activation at this concentration (Figure 4.6).
The antagonism assay was conducted with competition of 150 or 300 µM SHLs against 1
µM 3-oxo-C12-HSL (Figure 4.7). As the concentration increased from 150 to 300 µM, almost all
of the SHLs resulted in reduced GFP expression. The SHLs appeared to be weak to moderate
antagonists to LasR at the concentrations tested. The most potent antagonists were octyl-SHL 19
and tolyl-SHL 17, which showed ~35% and 42% inhibition, respectively.

- 205 -
Figure 4.6 GFP expression by PAO-JP2 (plasI-LVAgfp) in the presence of 1 µM 3-oxo-C12-
HSL alone (control) or 150 µM SHLs. Fluorescence signals were corrected for cell density as
shown in Equation 4.1 and the results were normalized to the control. Values represent the
means ± standard deviation from four replicates. Data shown is a representative of at least three
separate experiments.
Figure 4.7 GFP expression by PAO-JP2 (plasI-LVAgfp) in the presence of 1 µM 3-oxo-C12-
HSL alone (control) or 1 µM 3-oxo-C12-HSL plus different concentrations of SHLs.
0
20
40
60
80
100
120
Re
lative
flu
ore
sce
nce
(%
)
0
20
40
60
80
100
120
140
Re
lative
flu
ore
sce
nce
(%
)
150 µM
300 µM

- 206 -
Fluorescence signals were corrected for cell density as shown in Equation 4.1 and the results
were normalized to the control. Values represent the means ± standard deviation from four
replicates. Data shown is a representative of at least three separate experiments
4.2.4 Inhibition of P. aeruginosa biofilm formation by SHLs
Biofilm formation by P. aeruginosa in the presence of 300 µM SHLs was quantified using a
colorimetric assay in 96-well plates empolying crystal violet (CV) (Figure 4.8). The amount of
biofilm formation was determined indirectly by measuring the absorbance of CV at 540 nm after
workup (see experimental section for details) and normalized by that of the SHL-free control as
shown in Equation 4.2. The SHL-free control was supplemented with the same amount of
DMSO present in the SHL stocks to eliminate solvent effect.
(4.2)
In contrast to the trend that aryl-SHLs showed more biofilm inhibition than alkyl-SHLs for
E.coli as observed by Bandyopadhyay,211
alkyl-SHLs seemed to have stronger inhibitory
activities than aryl-SHLs against biofilm formation by P. aeruginosa. This difference may be
due to different structure at the binding site of receptors SdiA (in E. coli) and LasR (in P.
aeruginosa). Moreover, a clear structure activity relationship was observed for the alkyl-SHLs.
Within the range of one to eight carbons in the alkyl side chain, the biofilm inhibitory activity
increased as the chain length increased. Octyl-SHL 19, which possess the chain length most
similar to the natural AI 3-oxo-C12-HSL, resulted in the most inhibition, ~76% compared to the
control. We note that dodecyl-SHL 20 did not seem to be completely soluble in the bacterial
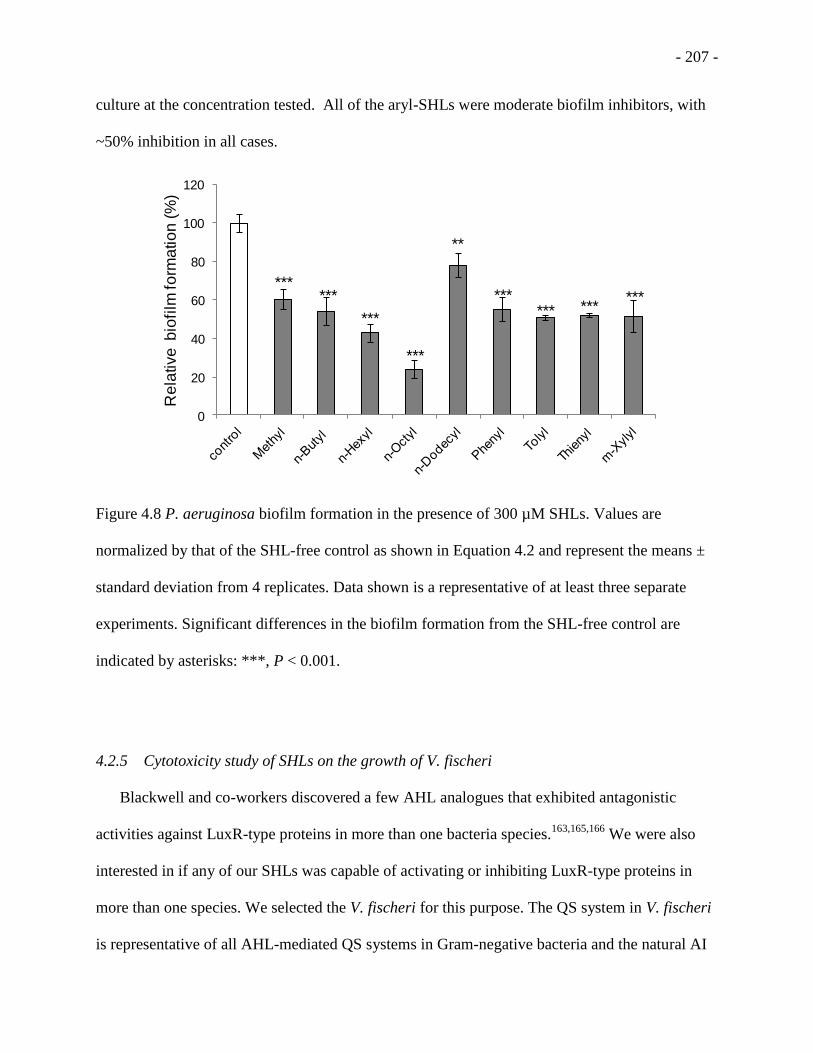
- 207 -
culture at the concentration tested. All of the aryl-SHLs were moderate biofilm inhibitors, with
~50% inhibition in all cases.
Figure 4.8 P. aeruginosa biofilm formation in the presence of 300 µM SHLs. Values are
normalized by that of the SHL-free control as shown in Equation 4.2 and represent the means ±
standard deviation from 4 replicates. Data shown is a representative of at least three separate
experiments. Significant differences in the biofilm formation from the SHL-free control are
indicated by asterisks: ***, P < 0.001.
4.2.5 Cytotoxicity study of SHLs on the growth of V. fischeri
Blackwell and co-workers discovered a few AHL analogues that exhibited antagonistic
activities against LuxR-type proteins in more than one bacteria species.163,165,166
We were also
interested in if any of our SHLs was capable of activating or inhibiting LuxR-type proteins in
more than one species. We selected the V. fischeri for this purpose. The QS system in V. fischeri
is representative of all AHL-mediated QS systems in Gram-negative bacteria and the natural AI
0
20
40
60
80
100
120R
ela
tive
bio
film
fo
rma
tio
n (%
)
******
***
***
**
****** ***
***

- 208 -
3-oxo-C6-HSL is structurally similar to the 3-oxo-C12-HSL produced by P. aeruginosa. We
expected at least one or more of the SHLs with shorter alkyl side chain should show some
activity for the LuxR protein.
The cytotoxicity of the SHLs to the V.fischeri was first studied. The strain VCW2G7 we used
lacks the luxI gene that encodes the AI synthase LuxI and does not produce the natural AI 3-oxo-
C6-HSL, but possesses the native lux operon that expresses luminescence.269
The EC50 of 3-oxo-
C6-HSL was determined to be 3 µM.163
We used this concentration as the control and compared
the growth curves of bacteria culture in the presence of 3 µM 3-oxo-C6-HSL plus 10 µM SHLs
to the control (Figure 4.9). At 10 µM, none of the SHLs except methyl-SHL 13 had negative
impact on the growth of bacteria. Methyl-SHL 13 caused about ~20% reduction in OD600 values
than the control throughout the experiment. Therefore, the SHLs had no or very little effect on
the growth of V. fischeri.
Figure 4.9 Growth curves of V. fischeri VCW2G7 in the presence of 3 µM 3-oxo-C6-HSL alone
(control) or 3 µM 3-oxo-C6-HSL plus 10 µM SHLs. Values represent the means ± standard
deviation from four replicates.
0
0.1
0.2
0.3
0.4
0.5
0.6
0.7
0.8
0 2 4 6 8 10 12 14 16 18 20 22 24
OD
600
Time (h)
control
Methyl-SHL
n-Butyl-SHL
n-Hexyl-SHL
n-Octyl-SHL
n-Dodecyl-SHL
Phenyl-SHL
Tolyl-SHL
Thienyl-SHL
m-Xylyl-SHL

- 209 -
4.2.6 Modulation of quorum sensing in V. fischeri by SHLs
The ability of SHLs to modulate the QS in V. fischeri was evaluated similarly to that in P.
aeruginosa except luminescence was measured instead of fluorescence. The luminescence
expression is quantified as shown in Equation 4.3. “RLUsample” is the relative luminescence unit
measured by the plate reader. “No AI” represents bacteria culture grown in the presence of no AI
analogue, supplemented with the same amount of DMSO present in the SHL stocks.
(4.3)
In the agonism assay, 10 µM SHLs were compared to 3 µM 3-oxo-C6-HSL and none of the
SHLs showed measurable agonistic activity (data not shown). When 10 µM SHLs competed
with 3 µM 3-oxo-C6-HSL in the antagonism assay (Figure 4.10), hexyl-SHL 15 and octyl-SHL
19 were the most potent antagonists identified, as expected, with ~90% and >99% reduction in
luminescence expression, respectively. Moreover, the alkyl-SHLs in general resulted in less
luminescence expression than aryl-SHLs. We note that while m-xylyl-SHL 21 (two methyl
substitution on the benzene ring) appeared to be a strong antagonist (23% relative fluorescence
signal of the control), tolyl-SHL 17 (one methyl substitution on the aromatic ring) appeared to be
a weak agonist (112% relative luminescence expression of the control). This difference in
activity is likely caused by structural difference and the specific mechanism is under
investigation.

- 210 -
Figure 4.10 Luminescence expression by V. fischeri VCW2G7 in the presence of 3 µM 3-oxo-
C6-HSL alone (control) or 3 µM 3-oxo-C6-HSL plus 10 µM SHLs. Luminescence signals were
corrected for cell density as shown in Equation 4.3 and the results were normalized to the
control. Values represent the means ± standard deviation from four replicates. Data shown is a
representative of at least three separate experiments. Significant differences in the luminescence
expression from the SHL-free control are indicated by asterisks: ***, P < 0.001.
4.3 Conclusion and Perspectives
An expanded library of squarylated homoserine lactones were designed and synthesized as
analogues to the natural AHLs. The SHLs were weak to moderate antagonist to LasR in P.
aeruginosa at 150 and 300 µM while only the octyl-SHL 19 was a weak agonist to LasR at 150
µM. Although none of the SHLs were capable of activating LuxR in V. fischeri at 10 µM, all
except one SHL inhibited LuxR, with the alkyl-SHLs showing more inhibition in general than
the aryl-SHLs. Octyl-SHL 19 was the most potent inhibitor of biofilm formation by P.
0
20
40
60
80
100
120
140
Re
lative
lum
ine
sce
nce
(%
)
*** ***
******
***
***
- 211 -
aeruginosa among all SHLs tested. Primary investigation of structural activity relationship
indicated that alkyl chain length is critical to the activity of SHLs. Future works include study of
the ligand-receptor binding between SHLs to LuxR-type receptor proteins by computationally
docking to elucidate the mechanism of observed structural activity relationship. This
computational analysis should provide important guidance in the in silico design of new QS
modulators of LuxI/LuxR-type QS systems in Gram-negative bacteria.
4.4 Experimental Section
Bacteria strains and growth media.
Double-knockout mutants of Pseudomonas aeruginosa, PAO-JP2 (plasI-LVAgfp) was kindly
provided by Dr. Helen E. Blackwell (University of Wisconsin-Madison) with permission by Dr.
Babara H. Iglewski (University of Rochester Medical Center).236,249
P. aeruginosa PAO1-BAA-
47 (wild type) from ATCC and PAO-JP2 (plasI-LVAgfp) were grown in Luria-Bertani (LB)
broth (containing 300 µg/mL of carbenicillin for PAO-JP2 (plasI-LVAgfp)) at 37 oC. V. fischeri
VCW2G7 was grown in LB salt media (LBS) at ambient temperature. LBS media contained 2%
NaCl, 1% tryptone, 0.5% yeast extract, 0.3% (v/v) glycerol, and 50 mM Tris-HCl buffer (pH =
7.5).163
Stock solutions of SHLs.
Stock solutions of all SHLs (200 µM to 5 mM) were prepared in DMSO, sterilized by filtering
through a 0.2 µm syringe filter, and stored at -20 °C in sealed vials. Appropriate amount of
DMSO was added to controls in all assays to eliminate solvent effect. The amount of DMSO in
all cases was no more than 0.2%.
Growth curve of planktonic bacteria, reporter gene assay for P. aeruginosa, and crystal violet
biofilm assay in 96-well plates.

- 212 -
These experiments were performed as described in Chapter 3.
Reporter gene assay for V. fischeri.
An overnight culture of V. fischeri VCW2G7 in LBS broth was grown from a single colony
picked from an LBS agar. The cell culture was diluted by 10 times and aliquoted (200 µL per
well) to a polystyrene 96-well microplate (Costar 3370, Corning Incorporated, Corning, NY)
containing appropriate amount of natural autoinducers with and without SHLs. The plate was
incubated at ambient temperature (~21 oC) for 5~6 h in a rotary shaking incubator. The culture
from each well was then transferred to a 96-well plate with white wall (µClear, 655095, Greiner
Bio-One North America, Inc., Monroe, NC). The luminescence and OD absorbance (OD600) in
each well was measured by Synergy H1 multi-mode microplate reader with a Gen5 data analysis
software.
General procedure for synthesis.
All air sensitive reactions were performed in oven dried glassware under an atmosphere of argon
unless otherwise notified. All reagent grade starting materials were obtained from commercial
supplies and used as received. Anhydrous solvents were purchased from Sigma-Aldrich.
Analytical thin layer chromatography was performed on EM silica gel 60 F254 glass plates (0.25
mm). Visualization of analytical thin layer chromatography was achieved using UV absorbance
(254 mm), KMnO4, and ceric ammonium molybdate stains. Flash column chromatography was
performed using SiliaFlash P60 silica gel (40-60 Å) from SiliCycle, Inc. 1H and
13 C NMR
spectra were recorded on a Bruker Advance DPX-300 spectrometer. 1H chemical shifts are
reported in ppm, downfield from tetramethylsilane using residual CHCl3 as the internal standard
(δ 7.26 ppm). 13
C chemical shifts are reported in ppm, downfield from tetramethylsilane relative
to CDCl3 (δ 77.0 ppm), (δ 39.5 ppm) and CD3CN (δ 1.94 ppm). Mass spectra were measured

- 213 -
using a MAT 95 XP mass spectrometer, carried out by the Mass Spectroscopy Facility at Indiana
University.
O
O O
OH
22
To a stirred solution of 3,4-butoxy-3-cyclobutene-1,2-dione (269.0 mg, 1.165 mmol) in
anhydrous THF (12 mL) was added hexylmagnesium bromide (2.0 M solution in diethyl ether,
0.61 mL, 1.2 mmol) dropwise at -78 oC. The reaction mixture was stirred at -78
oC for 4 h and
another portion of hexylmagnesium bromide (2.0 M solution in diethyl ether, 0.30 mL, 0.60
mmol) was added. After stirring at -78 oC for 1 h further, the reaction mixture was poured into a
separatory funnel containing 5% NH4Cl (14 mL) and diethyl ether (14 mL). The aqueous layer
was extracted with diethyl ether (14mL × 3) and the combined organic layer was washed with
brine, dried over MgSO4, filtered, and concentrated under reduced pressure. Column
chromatography (SiO2; hexane:ethyl acetate, 50:1 to 3:1, gradient) provided alcohol 22 (161.5
mg, 44%) as a colorless oil. TLC Rf = 0.20 (hexane:ethyl acetae, 5:1). 1H NMR (300 MHz,
CDCl3) δ 4.35 (m, 2H), 4.19 (td, 2H, J = 6.6, 1.8 Hz), 3.68 (br, 1H), 1.76 (m, 4H), 1.59 (m, 2H),
1.38 (m, 4H), 1.25 (m, 8H), 0.93 (t, 3H, J = 7.5 Hz), 0.89 (t, 3H, J = 7.4 Hz), 0.83 (t, 3H, J = 6.5
Hz); 13
C NMR (75 MHz, CDCl3): δ 187.6, 167.9, 132.6, 86.4, 72.8, 70.5, 32.6, 31.7, 31.5, 31.4,
29.3, 24.9, 22.4, 18.7, 18.6, 13.9, 13.6, 13.5.
O O
O
26
To a stirred solution of alcohol 22 (138.5 mg, 0.444 mmol) in anhydrous methylene chloride (3.0
mL) was added one drop of concentrated hydrochloric acid (12 M) at ambient temperature. The
reaction mixture was stirred at ambient temperature for 20 min and concentrated under reduced
pressure. Column chromatography (SiO2; hexane:ethyl acetate, 50:1 to 15:1, gradient) provided
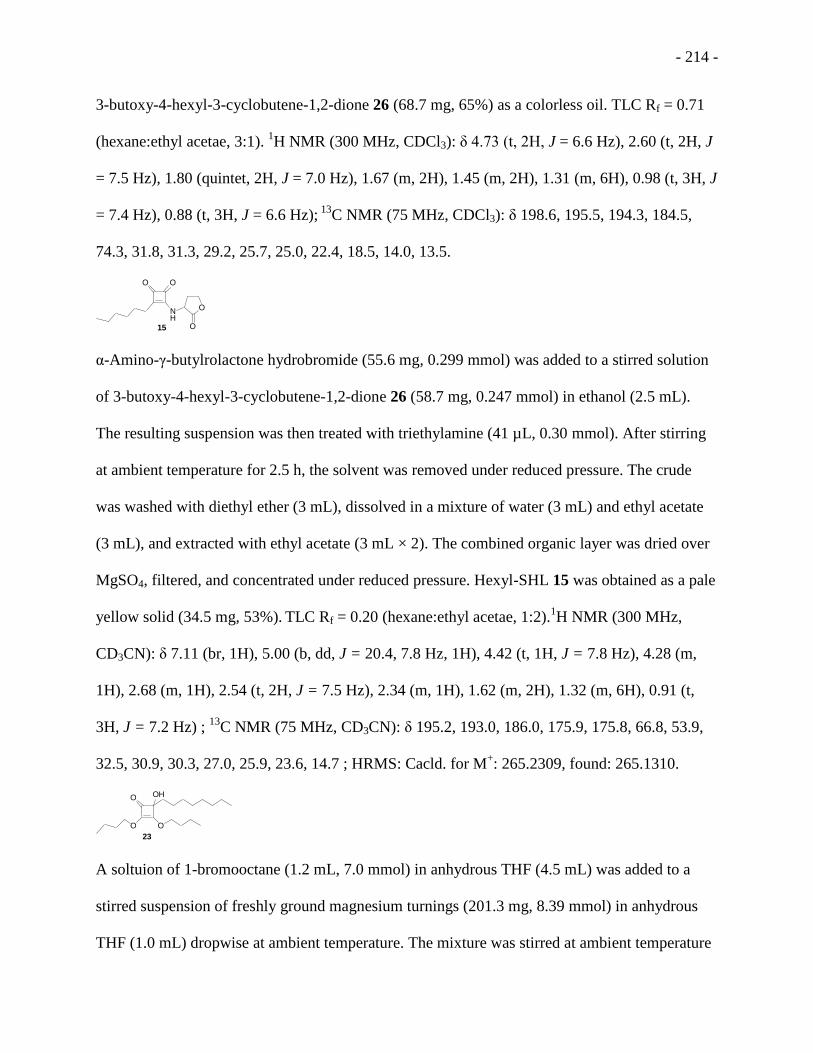
- 214 -
3-butoxy-4-hexyl-3-cyclobutene-1,2-dione 26 (68.7 mg, 65%) as a colorless oil. TLC Rf = 0.71
(hexane:ethyl acetae, 3:1). 1H NMR (300 MHz, CDCl3): δ 4.73 (t, 2H, J = 6.6 Hz), 2.60 (t, 2H, J
= 7.5 Hz), 1.80 (quintet, 2H, J = 7.0 Hz), 1.67 (m, 2H), 1.45 (m, 2H), 1.31 (m, 6H), 0.98 (t, 3H, J
= 7.4 Hz), 0.88 (t, 3H, J = 6.6 Hz); 13
C NMR (75 MHz, CDCl3): δ 198.6, 195.5, 194.3, 184.5,
74.3, 31.8, 31.3, 29.2, 25.7, 25.0, 22.4, 18.5, 14.0, 13.5.
NH
O O
O
O15
α-Amino-γ-butylrolactone hydrobromide (55.6 mg, 0.299 mmol) was added to a stirred solution
of 3-butoxy-4-hexyl-3-cyclobutene-1,2-dione 26 (58.7 mg, 0.247 mmol) in ethanol (2.5 mL).
The resulting suspension was then treated with triethylamine (41 µL, 0.30 mmol). After stirring
at ambient temperature for 2.5 h, the solvent was removed under reduced pressure. The crude
was washed with diethyl ether (3 mL), dissolved in a mixture of water (3 mL) and ethyl acetate
(3 mL), and extracted with ethyl acetate (3 mL × 2). The combined organic layer was dried over
MgSO4, filtered, and concentrated under reduced pressure. Hexyl-SHL 15 was obtained as a pale
yellow solid (34.5 mg, 53%). TLC Rf = 0.20 (hexane:ethyl acetae, 1:2).
1H NMR (300 MHz,
CD3CN): δ 7.11 (br, 1H), 5.00 (b, dd, J = 20.4, 7.8 Hz, 1H), 4.42 (t, 1H, J = 7.8 Hz), 4.28 (m,
1H), 2.68 (m, 1H), 2.54 (t, 2H, J = 7.5 Hz), 2.34 (m, 1H), 1.62 (m, 2H), 1.32 (m, 6H), 0.91 (t,
3H, J = 7.2 Hz) ; 13
C NMR (75 MHz, CD3CN): δ 195.2, 193.0, 186.0, 175.9, 175.8, 66.8, 53.9,
32.5, 30.9, 30.3, 27.0, 25.9, 23.6, 14.7 ; HRMS: Cacld. for M+: 265.2309, found: 265.1310.
O
O O
OH
23
A soltuion of 1-bromooctane (1.2 mL, 7.0 mmol) in anhydrous THF (4.5 mL) was added to a
stirred suspension of freshly ground magnesium turnings (201.3 mg, 8.39 mmol) in anhydrous
THF (1.0 mL) dropwise at ambient temperature. The mixture was stirred at ambient temperature

- 215 -
for 5 h and then added to a solution of 3,4-dibutoxy-3-cyclobutene-1,2-dione (0.77 mL, 3.5
mmol) in anhydrous THF (70 mL) via cannula at -78 oC. The reaction mixture was stirred at this
temperature for 4 h and then quenched with saturated aqueous NH4Cl. The aqueous layer was
extracted with diethyl ether (25 mL × 3), dried over MgSO4, filtered, and concentrated under
reduced pressure. Column chromatography (SiO2; hexane:ethyl acetate, 20:1 to 5:1, gradient)
provided alcohol 23 (569.6 mg, 48%) as a colorless oil. TLC Rf = 0.23 (hexane:ethyl acetae,
5:1). 1H NMR (300 MHz, CDCl3): δ 4.31 (m, 2H), 4.14 (m, 2H), 1.71 (m, 4H),
1.55 (m, 2H),
1.35 (m, 4H), 1.18 (m, 13H), 0.88 (t, 3H, J = 7.5 Hz), 0.85 (t, 3H, J = 7.5 Hz), 0.79 (t, 3H, J =
6.6 Hz); 13
C NMR (75 MHz, CDCl3): δ 187.8, 168.0, 132.4, 86.2, 72.7, 70.3, 32.5, 31.6 (2 C),
31.3, 29.5, 29.2, 29.0, 24.9, 22.4, 18.6, 18.5, 13.8, 13.5, 13.4.
O O
O
27
To a stirred solution of alcohol 23 (333.8 mg, 0.982 mmol) in anhydrous methylene chloride (6.5
mL) was added two drops of concentrated hydrochloric acid (12 M) at ambient temperature. The
reaction mixture was stirred at ambient temperature for 40 min and concentrated under reduced
pressure. Column chromatography (SiO2; hexane:ethyl acetate, 20:1 to 10:1, gradient) provided
3-butoxy-4-octyl-3-cyclobutene-1,2-dione 27 (209.9 mg, 80%) as a colorless oil. TLC Rf = 0.54
(hexane:ethyl acetae, 5:1). 1H NMR (300 MHz, CDCl3): δ 4.73 (t, 2H, J = 6.6 Hz), 2.59 (t, 2H, J
= 7.5 Hz), 1.79 (m, 2H), 1.68 (m, 2H), 1.45 (m, 2H), 1.26 (m, 10H), 0.97 (t, 3H, J = 7.5 Hz),
0.89 (t, 3H, J = 6.6 Hz); 13
C NMR (75 MHz, CDCl3): δ 198.6, 195.6, 194.3, 184.5, 74.3, 31.8,
31.7, 29.5, 29.0 (2 C), 25.7, 25.0, 22.6, 18.5, 14.0, 13.5. HRMS: Cacld. for M+: 266.1882, found:
266.1868.
NH
O O
O
O19

- 216 -
α-Amino-γ-butylrolactone hydrobromide (179.3 mg, 0.965 mmol) was added to a stirred solution
of 3-butoxy-4-octyl-3-cyclobutene-1,2-dione (209.9 mg, 0.789 mmol) in ethanol (7.9 mL). The
resulting suspension was then treated with triethylamine (0.13 mL, 0.94 mmol). After stirring at
ambient temperature for 1.5 h, the solvent was removed under reduced pressure. The crude was
washed with diethyl ether (10 mL), dissolved in a mixture of water (10 mL) and ethyl acetate (10
mL), and extracted with ethyl acetate (10 mL × 2). The combined organic layer was dried over
MgSO4, filtered, and concentrated under reduced pressure. Octyl-SHL 19 was obtained as a
white solid (150.3 mg, 65%). TLC Rf = 0.41 (ethyl acetae).
1H NMR (300 MHz, CD3CN): δ 6.99
(br, 1H), 5.00 (td, 1H, J = 11.7, 9.0 Hz), 4.42 (t, 1H, J = 9.0 Hz), 4.28 (m, 1H), 2.69 (m, 1H),
2.54 (t, 2H, J = 7.5 Hz), 2.32 (m, 1H), 1.63 (m, 2H), 1.28 (m, 10H), 0.88 (t, 3H, J = 6.6 Hz) 13
C
NMR (75 MHz, CD3CN): δ 195.2, 193.0, 186.0, 176.0, 175.8, 67.0, 66.9, 54.0, 32.9, 31.0, 30.7,
30.3, 27.1, 26.0, 23.7, 14.8. HRMS: Cacld. for M+: 293.1627, found: 293.1624.
O
O O
OH
24
A soltuion of 1-bromododecane (1.23 mL, 4.97 mmol) in anhydrous THF (4.0 mL) was added to
a stirred suspension of freshly ground magnesium turnings (148.3 mg, 6.18 mmol) in anhydrous
THF (0.5 mL) dropwise at ambient temperature. The mixture was stirred at ambient temperature
for 5 h and then added to a solution of 3,4-dibutoxy-3-cyclobutene-1,2-dione (0.55 mL, 2.5
mmol) in anhydrous THF (45 mL) via cannula at -78 oC. The reaction mixture was stirred at this
temperature for 2 h and then quenched with saturated aqueous NH4Cl. The aqueous layer was
extracted with diethyl ether (10 mL × 3), dried over MgSO4, filtered, and concentrated under
reduced pressure. Column chromatography (SiO2; hexane:ethyl acetate, 20:1 to 5:1, gradient)
provided alcohol 24 (407.5 mg, 45%) as a pale yellow oil. TLC Rf = 0.27 (hexane:ethyl acetae,
5:1). 1H NMR (300 MHz, CDCl3): 4.27 (m, 2H), 4.10 (td, 2H, J = 6.6, 1.8 Hz), 3.88 (br, 1H),

- 217 -
1.67 (m, 4H), 1.51 (m, 2H), 1.30 (m, 4H), 1.15 (m, 20H), 0.85 (t, 3H, J = 7.2 Hz), 0.82 (t, 3H, J
= 7.5 Hz), 0.77 (t, 3H, J = 6.9 Hz).
O O
O
28
To a stirred solution of alcohol 24 (407.5 mg, 1.03 mmol) in anhydrous methylene chloride (7.0
mL) was added three drops of concentrated hydrochloric acid (12 M) at ambient temperature.
The reaction mixture was stirred at ambient temperature for 20 min and concentrated under
reduced pressure. Column chromatography (SiO2; hexane:ethyl acetate, 20:1 to 10:1, gradient)
provided 3-butoxy-4-dodecyl-3-cyclobutene-1,2-dione 28 (69.5 mg, 21%) as a pale yellow oil.
TLC Rf = 0.62 (hexane:ethyl acetae, 5:1). 1H NMR (300 MHz, CDCl3): δ 4.73 (t, 2H, J = 6.6
Hz), 2.60 (t, 2H, J = 7.5 Hz), 1.80 (m, 2H), 1.67 (m, 2H), 1.46 (m, 2H), 1.25 (m, 18H), 0.98 (t,
3H, J = 7.5 Hz), 0.88 (t, 3H, J = 6.6 Hz); 13
C NMR (75 MHz, CDCl3): δ 198.8, 195.5, 194.3,
184.5, 74.3, 31.9, 31.8, 29.6 (3C), 29.5, 29.4, 29.3, 29.1, 25.7, 25.0, 22.7, 18.5, 14.1, 13.5.
HRMS: Cacld. for M+: 322.2508, found: 322.2505.
NH
O O
O
O20
α-Amino-γ-butylrolactone hydrobromide (48.6 mg, 0.262 mmol) was added to a stirred solution
of 3-butoxy-4-dodecyl-3-cyclobutene-1,2-dione 28 (69.5 mg, 0.216 mmol) in ethanol (2.2 mL).
The resulting suspension was then treated with triethylamine (0.37 mL, 0.27 mmol). After
stirring at ambient temperature for 1 h, the solvent was removed under reduced pressure. The
crude was washed with diethyl ether (5 mL), dissolved in a mixture of water (2 mL) and ethyl
acetate (2 mL), and extracted with ethyl acetate (2 mL × 2). The combined organic layer was
dried over MgSO4, filtered, and concentrated under reduced pressure. Octyl-SHL 20 was
obtained as a white solid (22.3 mg, 30%). TLC Rf = 0.77 (ethyl acetae).
1H NMR (300 MHz,

- 218 -
CD3CN): δ 7.06 (br, 1H), 5.00 (td, 1H, J = 11.7, 9.0 Hz), 4.42 (t, 1H, J = 6.0 Hz), 4.28 (m, 1H),
2.68 (m, 1H), 2.54 (t, 2H, J = 7.5 Hz), 2.33 (m, 1H), 1.63 (m, 2H), 1.27 (m, 18H), 0.88 (t, 3H, J
= 6.6 Hz); 13
C NMR (75 MHz, CD3CN): δ 195.0, 192.6, 185.6, 175.7, 175.5, 118.4, 66.5, 53.6,
32.7, 30.7, 30.4 (3C), 30.3, 30.1, 30.0, 26.8, 25.7, 23.5, 14.5. HRMS: Cacld. for M+: 349.2253,
found: 349.2251.
O
O O
OH
S
25
To a stirred solution of 2-bromothiophene (52 µL, 0.53 mmol) in anhydrous THF (7.0 mL) was
added n-butyllithium (2.5 M solution in hexane, 0.21 mL, 0.53 mmol) dropwise at -78 oC. The
reaction mixture was stirred at -78 oC for 20 min and then added to a stirred solution of 3,4-
dibutoxy-3-cyclobutene-1,2-dione (111.8 mg, 0.484 mmol) in anhydrous THF (17 mL) via
cannula at -78 oC. The reaction mixture was stirred at -78
oC for 20 min and then poured into a
sepatorary funnel containing 5% NH4Cl (15 mL) and diethyl ether (5 mL). The aqueous layer
was extracted with diethyl ether (5mL × 3) and the combined organic layer was washed with
brine, dried over MgSO4, filtered, and concentrated under reduced pressure. Column
chromatography (SiO2; hexane:ethyl acetate, 20:1 to 5:1, gradient) provided alcohol 25 (31.5 mg,
21%) as a colorless oil. TLC Rf = 0.38 (hexane:ethyl acetae, 5:1). 1H NMR (300 MHz, CDCl3): δ
7.30 (dd, 1H, J = 5.1, 1.2 Hz), 7.10 (dd, 1H, J = 3.6, 1.2 Hz), 7.01 (dd, 1H, J = 5.1, 3.6 Hz),
4.39 (m, 2H), 4.30 (t, 2H, J = 6.6 Hz), 3.53 (br, 1H), 1.70 (m, 4H), 1.43 (m, 4H), 0.95 (t, 3H, J =
7.2 Hz), 0.93 (t, 3H, J = 7.2 Hz).
O O
O
S29
To a stirred solution of alcohol 25 (31.5 mg, 0.102 mmol) in anhydrous methylene chloride (2.0
mL) was added one drop of concentrated hydrochloric acid (12 M) at ambient temperature. The

- 219 -
reaction mixture was stirred at ambient temperature for 10 min and concentrated under reduced
pressure. Column chromatography (SiO2; hexane:ethyl acetate, 20:1 to 10:1, gradient) provided
3-butoxy-4-thienyl-3-cyclobutene-1,2-dione 29 (14.1 mg, 59%) as needle-like yellow crystals.
1H NMR (300 MHz, CDCl3): δ 7.91 (dd, 1H, J = 3.6, 1.2 Hz), 7.81 (dd, 1H, J = 5.1, 1.2 Hz),
7.28 (dd, 1H, J = 5.1, 3.6 Hz), 4.92 (t, 2H, J = 6.6 Hz), 1.90 (m, 2H), 1.53 (m, 2H), 1.02 (t, 3H, J
= 7.2 Hz).
NH
O O
O
OS
18
α-Amino-γ-butylrolactone hydrobromide (14.8 mg, 0.080 mmol) was added to a stirred solution
of 3-butoxy-4-thienyl-3-cyclobutene-1,2-dione 29 (14.1 mg, 0.060 mmol) in ethanol (2.0 mL).
The resulting suspension was then treated with triethylamine (11 µL, 0.079 mmol). After stirring
at ambient temperature for 2 h, the precipitate was collected by filtration. Diethyl ether (8.0 mL)
was added to the filtrate and precipitate thus formed was collected by filtration. The combined
solid was washed with pentane (5 mL) and dried under vacuum. Thienyl-SHL 18 was obtained
as a pale yellow solid (9.4 mg, 60%). TLC Rf = 0.35 (hexane:ethyl acetae, 1:3).
1H NMR (300
MHz, DMSO-d6): δ 9.35 (d, 1H, J = 4.5 Hz), 8.04 (d, 1H, J = 4.8 Hz), 7.87 (d, 1H, J = 3.6 Hz),
7.39 (t, 1H, J = 4.2 Hz), 5.27 (m, 1H), 4.48 (t, 1H, J = 8.9 Hz), 4.32 (m, 1H), 2.29 (m, 1H), 2.41
(m, 1H); 13
C NMR (75 MHz, DMSO-d6): δ 190.3, 186.6, 176.8, 174.6, 157.7, 132.2, 128.8,
128.8, 128.7, 65.6, 52.9, 29.3. HRMS: Cacld. for M+: 263.0247, found: 263.0240.
O O
O
30
To a stirred solution of 5-bromo-m-xylene (0.45 mL, 3.2 mmol) in anhydrous THF (15 mL) was
added n-butyllithium (2.5 M solution in hexane, 1.2 mL, 3.0 mmol) dropwise at -78 oC. The

- 220 -
reaction mixture was stirred at -78 oC for 20 min and then added to a stirred solution of 3,4-
dibutoxy-3-cyclobutene-1,2-dione (0.24 mL, 1.1 mmol) in anhydrous THF (35 mL) via cannula
at -78 oC. The reaction mixture was stirred at -78
oC for 45 min and then poured into a
sepatorary funnel containing 5% NH4Cl (15 mL) and diethyl ether (15 mL). The aqueous layer
was extracted with diethyl ether (15 mL × 3) and the combined organic layer was washed with
brine, dried over MgSO4, filtered, and concentrated under reduced pressure. Column
chromatography (SiO2; hexane:ethyl acetate, 10:1 to 3:1, gradient) provided a mixture of mono-
and di-subsituted product. The mixture was dissolved in DCM (5 mL) and treated with 2 drops
of concentration hydrochloric acid (12 M). The reaction mixture was concentrated under reduced
pressure after stirred at ambient temperature for 45 min. Column chromatography (SiO2;
hexane:ethyl acetate, 5:1) provided 3-butoxy-4-(3,5-dimethyl-phenyl)-3-cyclobutene-1,2-dione
30 (41.5 mg, 27% over 2 steps) as a light yellow oil. TLC Rf = 0.52 (hexane:ethyl acetae, 5:1).
1H NMR (300 MHz, CDCl3): δ 7.67 (s, 2H),
7.19 (s, 1H), 4.93 (t, 2H, J = 6.6 Hz), 2.39 (s, 6H),
1.92 (quintet, 2H, J = 7.2Hz), 1.53 (m, 2H), 1.03 (t, 3H, J = 7.5 Hz); 13
C NMR (75 MHz,
CDCl3): δ 194.5, 193.1, 192.6, 174.2, 138.8, 134.6, 127.6, 125.3, 75.1, 32.0, 21.2, 18.6, 13.6.
HRMS: Cacld. for M+: 258.1256, found: 258.1252.
NH
O O
O
O
21
α-Amino-γ-butylrolactone hydrobromide (35.6 mg, 0.192 mmol) was added to a stirred solution
of 3-butoxy-4-(3,5-dimethyl-phenyl)-3-cyclobutene-1,2-dione 30 (41.5 mg, 0.161 mmol) in
ethanol (1.6 mL). The resulting suspension was then treated with triethylamine (27 µL, 0.20
mmol). After stirring at ambient temperature for 1 h, the precipitate was collected by filtration.
Diethyl ether (10 mL) was added to the filtrate and precipitate thus formed was collected by
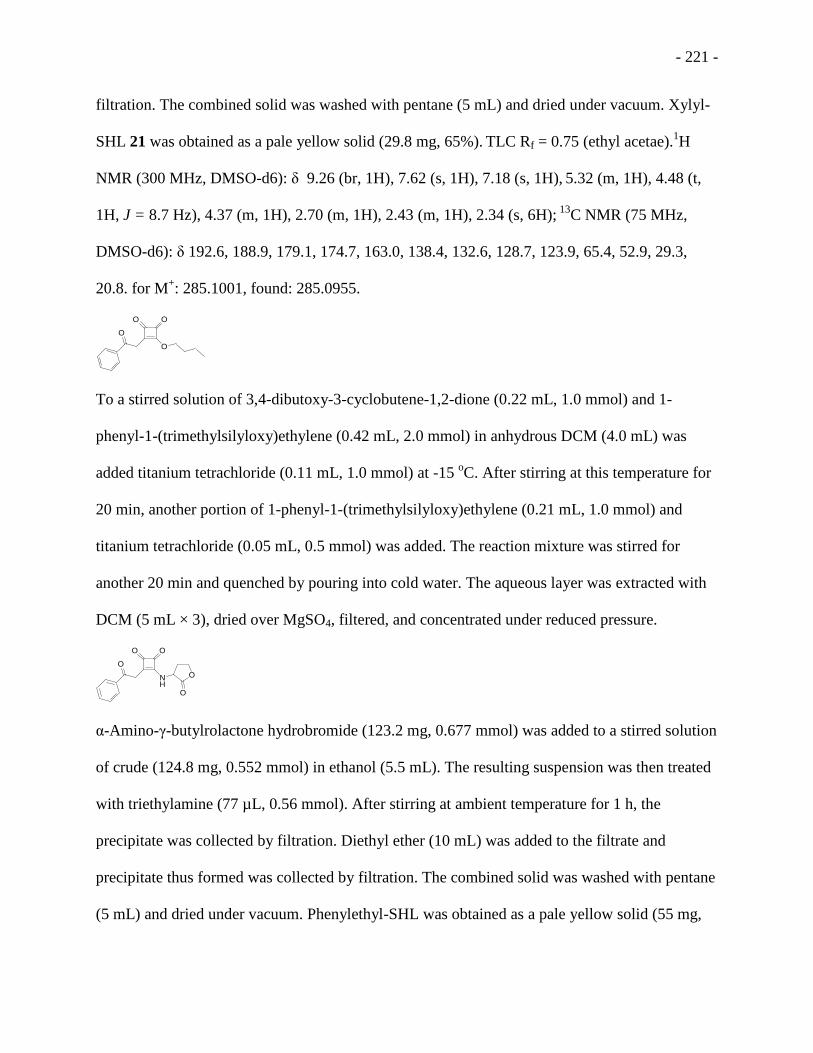
- 221 -
filtration. The combined solid was washed with pentane (5 mL) and dried under vacuum. Xylyl-
SHL 21 was obtained as a pale yellow solid (29.8 mg, 65%). TLC Rf = 0.75 (ethyl acetae).
1H
NMR (300 MHz, DMSO-d6): δ 9.26 (br, 1H), 7.62 (s, 1H), 7.18 (s, 1H), 5.32 (m, 1H), 4.48 (t,
1H, J = 8.7 Hz), 4.37 (m, 1H), 2.70 (m, 1H), 2.43 (m, 1H), 2.34 (s, 6H); 13
C NMR (75 MHz,
DMSO-d6): δ 192.6, 188.9, 179.1, 174.7, 163.0, 138.4, 132.6, 128.7, 123.9, 65.4, 52.9, 29.3,
20.8. for M+: 285.1001, found: 285.0955.
O O
O
O
To a stirred solution of 3,4-dibutoxy-3-cyclobutene-1,2-dione (0.22 mL, 1.0 mmol) and 1-
phenyl-1-(trimethylsilyloxy)ethylene (0.42 mL, 2.0 mmol) in anhydrous DCM (4.0 mL) was
added titanium tetrachloride (0.11 mL, 1.0 mmol) at -15 oC. After stirring at this temperature for
20 min, another portion of 1-phenyl-1-(trimethylsilyloxy)ethylene (0.21 mL, 1.0 mmol) and
titanium tetrachloride (0.05 mL, 0.5 mmol) was added. The reaction mixture was stirred for
another 20 min and quenched by pouring into cold water. The aqueous layer was extracted with
DCM (5 mL × 3), dried over MgSO4, filtered, and concentrated under reduced pressure.
O O
NH
O
O
O
α-Amino-γ-butylrolactone hydrobromide (123.2 mg, 0.677 mmol) was added to a stirred solution
of crude (124.8 mg, 0.552 mmol) in ethanol (5.5 mL). The resulting suspension was then treated
with triethylamine (77 µL, 0.56 mmol). After stirring at ambient temperature for 1 h, the
precipitate was collected by filtration. Diethyl ether (10 mL) was added to the filtrate and
precipitate thus formed was collected by filtration. The combined solid was washed with pentane
(5 mL) and dried under vacuum. Phenylethyl-SHL was obtained as a pale yellow solid (55 mg,

- 222 -
33%). TLC Rf = 0.18 (hexane:ethyl acetate, 1:1).
1H NMR or
13C NMR either indicate a mixture
or rotamers and/or decomposed products during the time of NMR experiment. This batch of
compound showed no activity in preliminary biofilm or reporter gene assay.

- 223 -
O
O O
OH
22

- 224 -
O
O O
OH
22
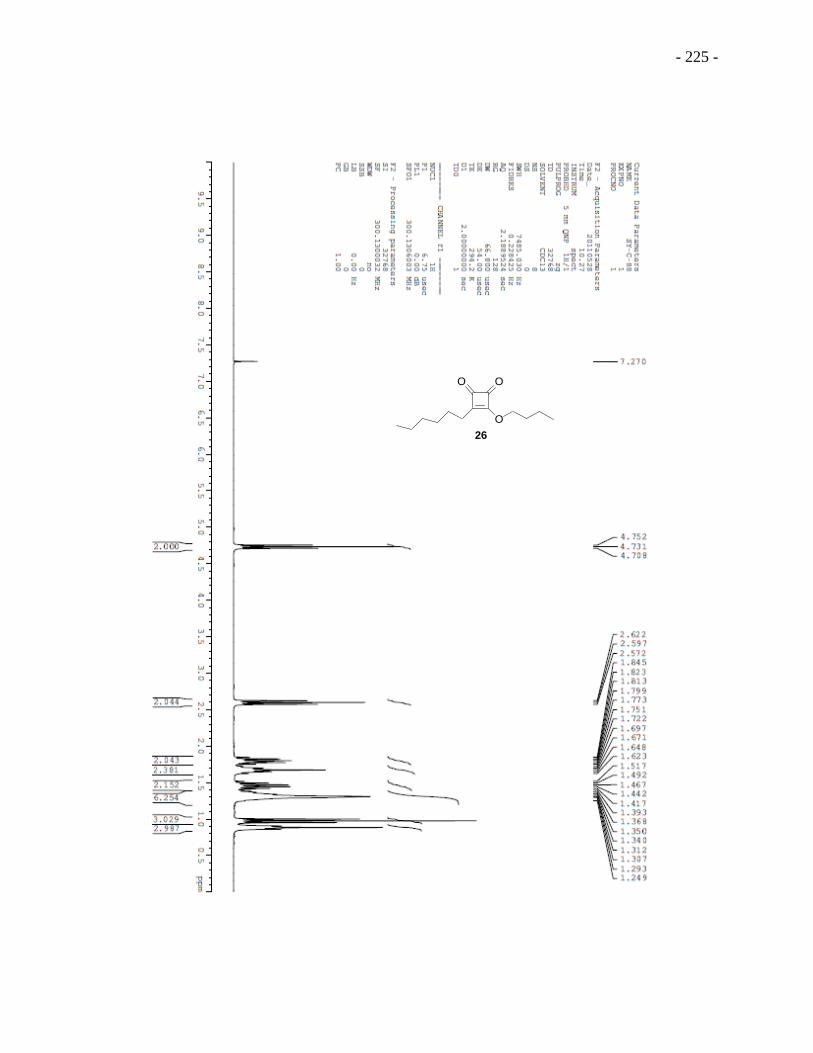
- 225 -
O O
O
26

- 226 -
O O
O
26

- 227 -
NH
O O
O
O15

- 228 -
NH
O O
O
O15

- 229 -
O
O O
OH
23

- 230 -
O
O O
OH
23
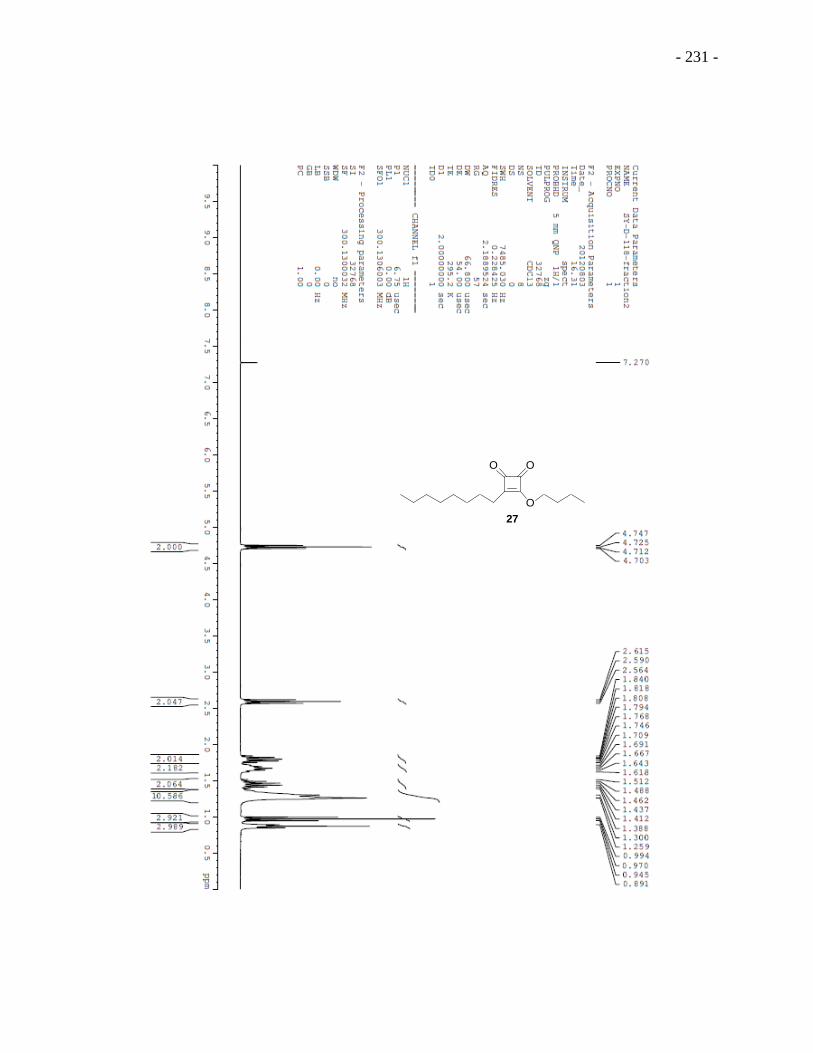
- 231 -
O O
O
27
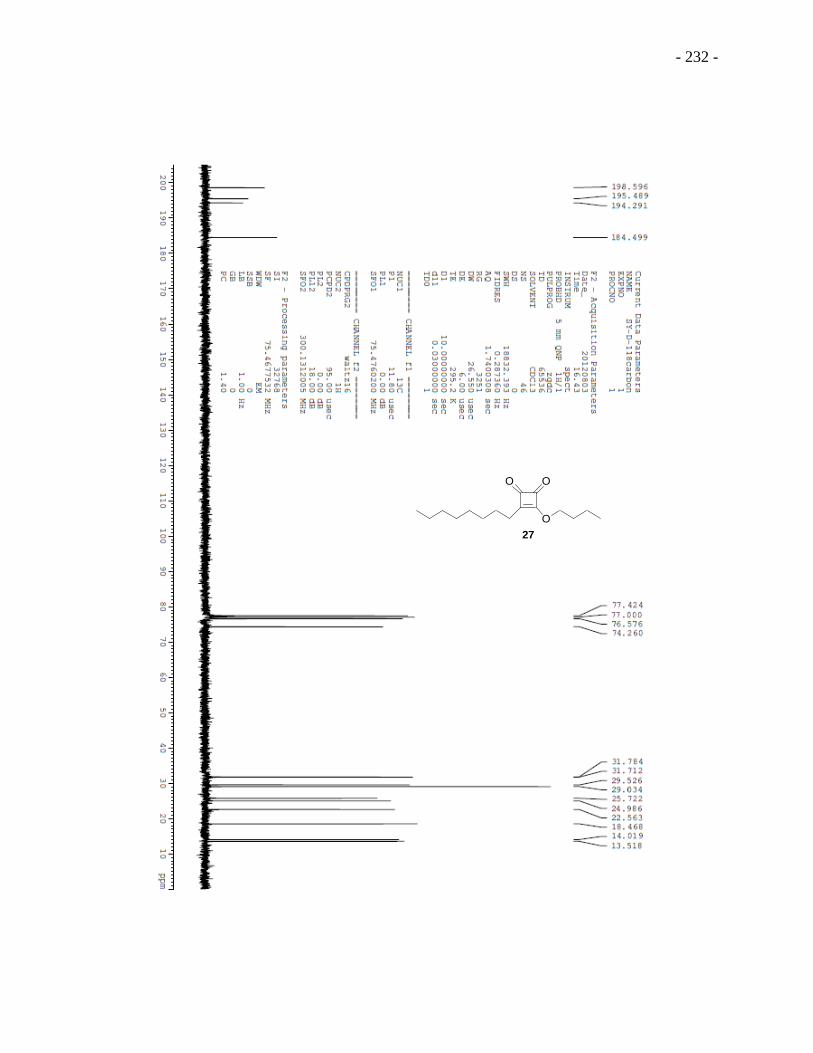
- 232 -
O O
O
27

- 233 -
NH
O O
O
O19
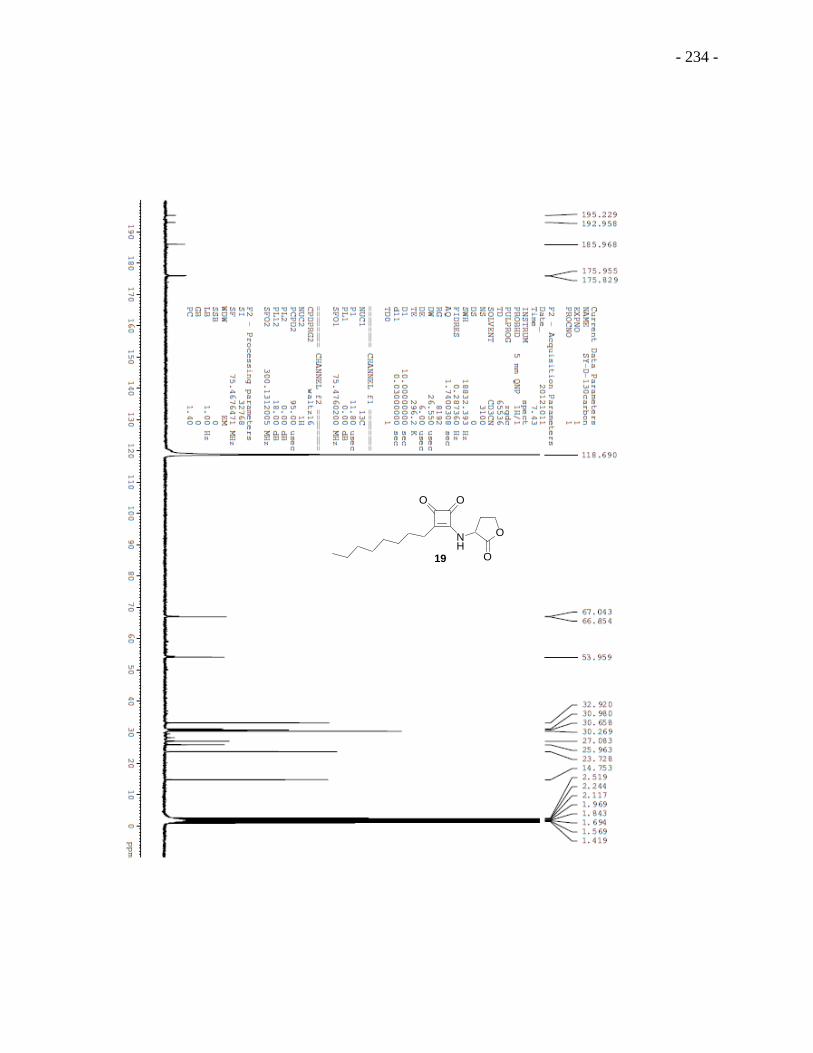
- 234 -
NH
O O
O
O19
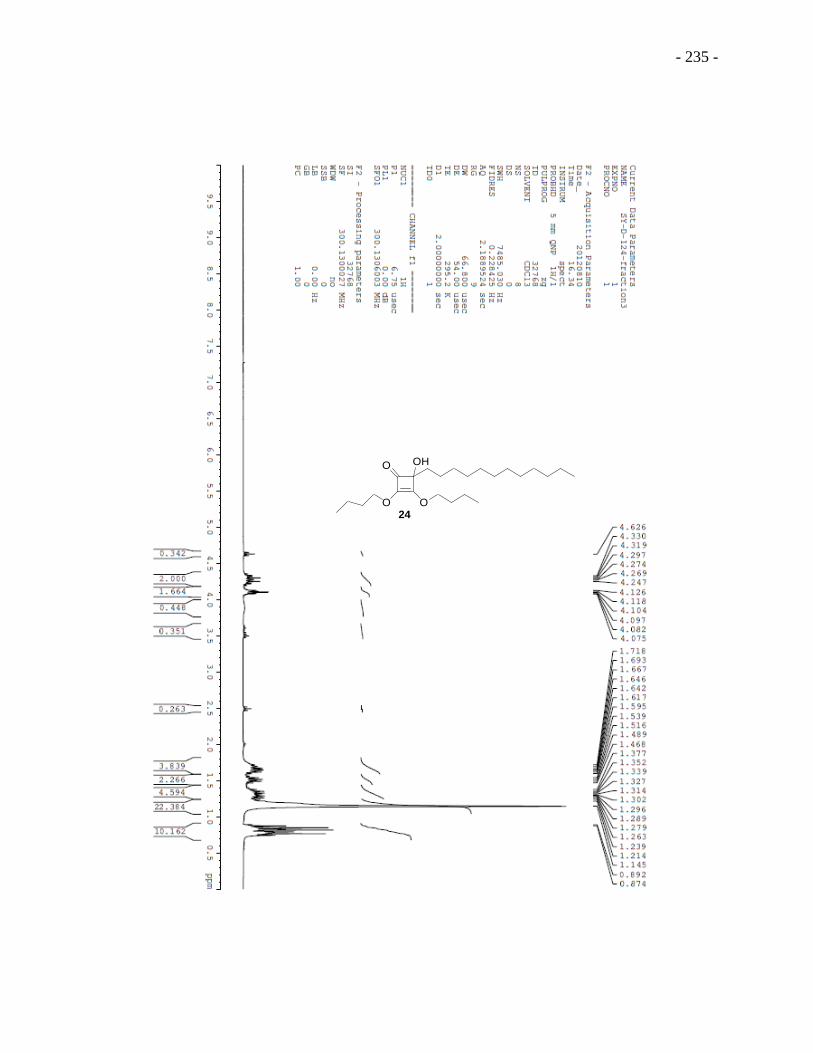
- 235 -
O
O O
OH
24

- 236 -
O O
O
28

- 237 -
O O
O
28

- 238 -
NH
O O
O
O20

- 239 -
NH
O O
O
O20

- 240 -
O
O O
OH
S
25

- 241 -
O O
O
S29

- 242 -
NH
O O
O
OS
18
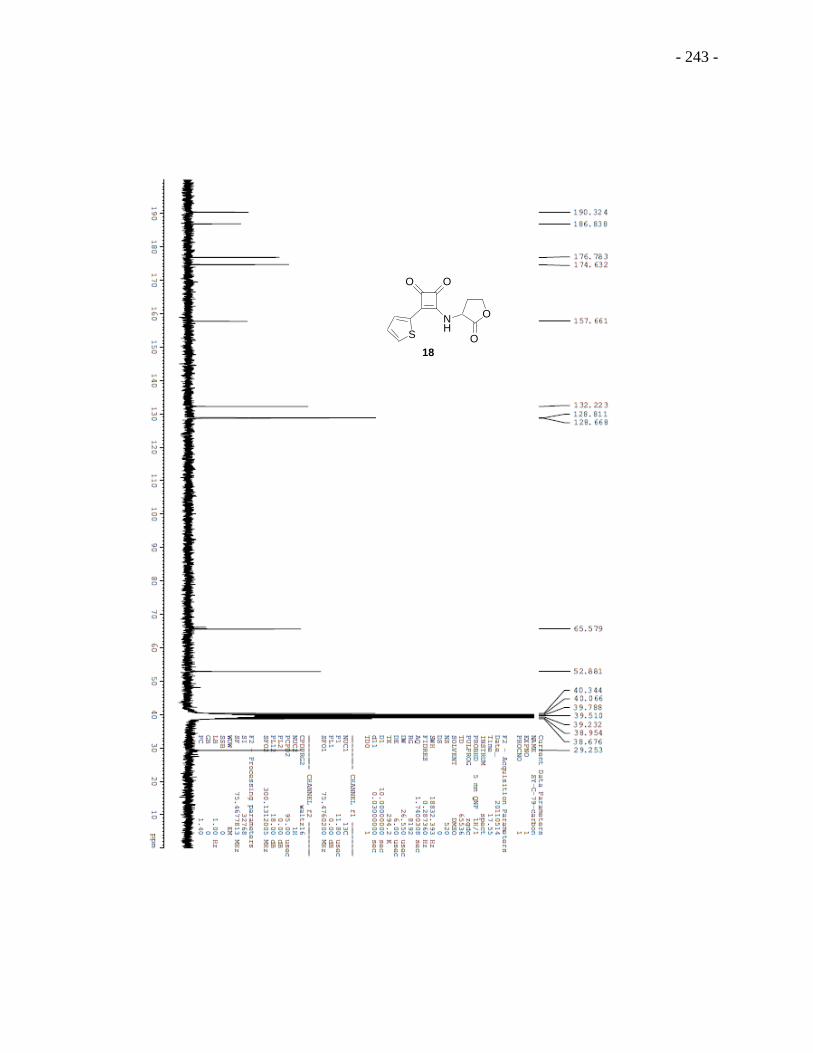
- 243 -
NH
O O
O
OS
18

- 244 -
O O
O
30

- 245 -
O O
O
30
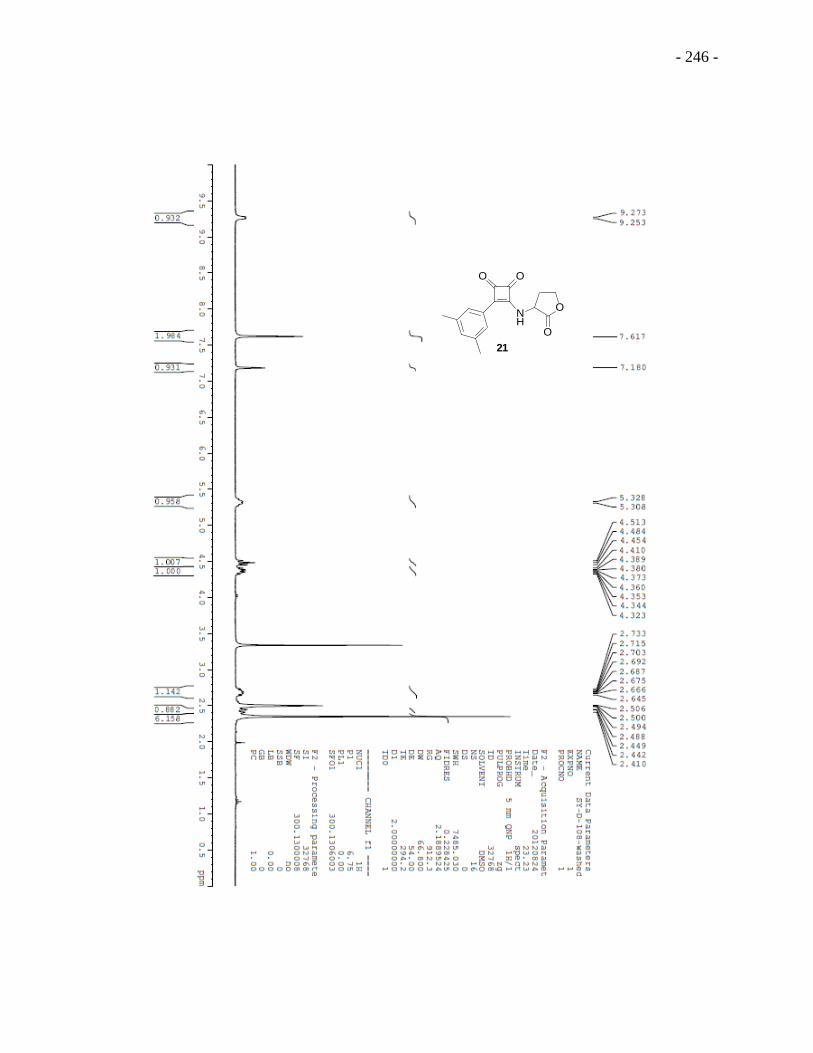
- 246 -
NH
O O
O
O
21

- 247 -
O O
NH
O
O

- 248 -
References
(1) Collings, P. J. H., Michael Introduction to Liquid Crystals: Chemistry and Physics Taylor
and Francis: Bristiol, PA, 1997.
(2) Lydon, J. Chromonic review. J. Mater. Chem. 2010, 20, 10071-10099.
(3) Cox, J. S. G. Disodium cromoglycate (FPL 670) ("Intal"). Specific inhibitor of reaginic
antibody-antigen mechanisms. Nature 1967, 216, 1328-1329.
(4) Attwood, T. K.; Lydon, J. E. Lyotropic mesophase formation by anti-asthmatic drugs. Mol.
Cryst. Liq. Cryst. 1984, 108, 349-357.
(5) Sadler, D. E.; Shannon, M. D.; Tollin, P.; Young, D. W.; Edmondson, M.; Rainsford, P.
Lyotropic liquid-crystalline mesophases and a novel, solid physical form of some water-
soluble, reactive dyes. Liq. Cryst. 1986, 1, 509-520.
(6) Tiddy, G. J. T.; Mateer, D. L.; Ormerod, A. P.; Harrison, W. J.; Edwards, D. J. Highly
ordered aggregates in dilute dye-water systems. Langmuir 1995, 11, 390-393.
(7) Harrison, W. J.; Mateer, D. L.; Tiddy, G. J. T. Liquid-Crystalline J-Aggregates Formed by
Aqueous Ionic Cyanine Dyes. J. Phys. Chem. 1996, 100, 2310-2321.
(8) von Berlepsch, H.; Boettcher, C.; Daehne, L. Structure of J-aggregates of pseudoisocyanine
dye in aqueous solution. J. Phys. Chem. B 2000, 104, 8792-8799.
(9) von Berlepsch, H.; Boettcher, C. Network superstructure of pseudoisocyanine J-aggregates
in aqueous sodium chloride solution revealed by cryo-transmission electron microscopy. J.
Phys. Chem. B 2002, 106, 3146-3150.
(10) Ruslim, C.; Matsunaga, D.; Hashimoto, M.; Tamaki, T.; Ichimura, K. Structural
characteristics of the chromonic mesophases of C.I. Direct Blue 67. Langmuir 2003, 19,
3686-3691.

- 249 -
(11) Horowitz Viva, R.; Janowitz Lauren, A.; Modic Aaron, L.; Heiney Paul, A.; Collings Peter,
J. Aggregation behavior and chromonic liquid crystal properties of an anionic monoazo
dye. Phys. Rev. E 2005, 72, 041710.
(12) Nastishin, Y. A.; Liu, H.; Schneider, T.; Nazarenko, V.; Vasyuta, R.; Shiyanovskii, S. V.;
Lavrentovich, O. D. Optical characterization of the nematic lyotropic chromonic liquid
crystals: Light absorption, birefringence, and scalar order parameter. Phys. Rev. E 2005, 72,
041711.
(13) Mariani, P.; Mazabard, C.; Garbesi, A.; Spada, G. P. A study of the structure of the
lyomesophases formed by the dinucleoside phosphate d(GpG). An approach by x-ray
diffraction and optical microscopy. J. Am. Chem. Soc. 1989, 111, 6369-6373.
(14) Mariani, P.; Spinozzi, F.; Federiconi, F.; Amenitsch, H.; Spindler, L.; Drevensek-Olenik, I.
Small Angle X-ray Scattering Analysis of Deoxyguanosine 5'-Monophosphate Self-
Assembling in Solution: Nucleation and Growth of G-Quadruplexes. J. Phys. Chem. B
2009, 113, 7934-7944.
(15) Lydon, J. A personal history of the early days of chromonics. Liq. Cryst. Today 2007, 16,
13-27.
(16) Sandqvist, H. Anisotropic aqueous solution. Ber. Dtsch. Chem. Ges. 1915, 48, 2054-2055.
(17) Cox, J. S. G.; Woodard, G. D.; McCrone, W. C. Solid-state chemistry of cromolyn sodium
(disodium cromoglycate). J. Pharm. Sci. 1971, 60, 1458-1465.
(18) Hartshorne, N. H.; Woodard, G. D. Mesomorphism in the system disodium chromoglycate-
water. Mol. Cryst. Liquid Cryst. 1973, 23, 343-368.
(19) Lydon, J. E. New models for the mesophases of disodium cromoglycate (INTAL). Mol.
Cryst. Liq. Cryst. 1980, 64, 19-24.

- 250 -
(20) Turner, J. E.; Lydon, J. E. Chromonic mesomorphism: the range of lyotropic discotic
phases. Mol. Cryst. Liq. Cryst., Lett. Sect. 1988, 5, 93-99.
(21) Goldfarb, D.; Labes, M. M.; Luz, Z.; Poupko, R. Orientational order in the lyomesophases
of the disodium cromoglycate-water system by deuterium, oxygen-17, and sodium-23
NMR. Mol. Cryst. Liq. Cryst. 1982, 87, 259-279.
(22) Lee, H.; Labes, M. M. Lyotropic cholesteric and nematic phases of disodium cromoglycate
in magnetic fields. Mol. Cryst. Liq. Cryst. 1982, 84, 137-157.
(23) Goldfarb, D.; Moseley, M. E.; Labes, M. M.; Luz, M. Determination of pitch in a
cholesteric DSCG-water lyomesophase by NMR techniques. Mol. Cryst. Liq. Cryst. 1982,
89, 119-135.
(24) Perahia, D.; Goldfarb, D.; Luz, Z. Sodium-23 NMR in the lyomesophases of disodium
cromoglycate. Mol. Cryst. Liq. Cryst. 1984, 108, 107-123.
(25) Goldfarb, D.; Luz, Z.; Spielberg, N.; Zimmermann, H. Structural and orientational
characteristics of the disodium/cromoglycate-water mesophases by deuterium NMR and x-
ray diffraction. Mol. Cryst. Liq. Cryst. 1985, 126, 225-246.
(26) Hui, Y. W.; Labes, M. M. Structure and order parameter of a nematic lyotropic liquid
crystal studied by FTIR spectroscopy. J. Phys. Chem. 1986, 90, 4064-4067.
(27) Nastishin Yu, A.; Liu, H.; Shiyanovskii, S. V.; Lavrentovich, O. D.; Kostko, A. F.;
Anisimov, M. A. Pretransitional fluctuations in the isotropic phase of a lyotropic chromonic
liquid crystal. Phys. Rev. E 2004, 70, 051706.
(28) Kostko, A. F.; Cipriano, B. H.; Pinchuk, O. A.; Ziserman, L.; Anisimov, M. A.; Danino, D.;
Raghavan, S. R. Salt Effects on the Phase Behavior, Structure, and Rheology of Chromonic
Liquid Crystals. J. Phys. Chem. B 2005, 109, 19126-19133.
- 251 -
(29) Sergan, T.; Schneider, T.; Kelly, J.; Lavrentovich, O. D. Polarizing-alignment layers for
twisted nematic cells. Liq. Cryst. 2000, 27, 567-572.
(30) Shiyanovskii, S. V.; Schneider, T.; Smalyukh, I. I.; Ishikawa, T.; Niehaus, G. D.; Doane, K.
J.; Woolverton, C. J.; Lavrentovich, O. D. Real-time microbe detection based on director
distortions around growing immune complexes in lyotropic chromonic liquid crystals. Phys.
Rev. E 2005, 71, 020702.
(31) Tam-Chang, S.-W.; Helbley, J.; Carson, T. D.; Seo, W.; Iverson, I. K. Template-guided
organization of chromonic liquid crystals into micropatterned anisotropic organic solids.
Chem. Commun. 2006, 503-505.
(32) Park, H.-S.; Agarwal, A.; Kotov, N. A.; Lavrentovich, O. D. Controllable side-by-side and
end-to-end assembly of Au nanorods by lyotropic chromonic materials. Langmuir 2008, 24,
13833-13837.
(33) Tam-Chang, S.-W.; Iverson, I. K.; Helbley, J. Study of the Chromonic Liquid-Crystalline
Phases of Bis-(N,N-diethylaminoethyl)perylene-3,4,9,10-tetracarboxylic Diimide
Dihydrochloride by Polarized Optical Microscopy and 2H NMR Spectroscopy. Langmuir
2004, 20, 342-347.
(34) Park, H.-S.; Kang, S.-W.; Tortora, L.; Nastishin, Y.; Finotello, D.; Kumar, S.; Lavrentovich,
O. D. Self-Assembly of Lyotropic Chromonic Liquid Crystal Sunset Yellow and Effects of
Ionic Additives. J. Phys. Chem. B 2008, 112, 16307-16319.
(35) Maiti, P. K.; Lansac, Y.; Glaser, M. A.; Clark, N. A. Isodesmic self-assembly in lyotropic
chromonic systems. Liq. Cryst. 2002, 29, 619-626.

- 252 -
(36) Prasad, S. K.; Nair, G. G.; Hegde, G.; Jayalakshmi, V. Evidence of Wormlike Micellar
Behavior in Chromonic Liquid Crystals: Rheological, X-ray, and Dielectric Studies. J. Phys.
Chem. B 2007, 111, 9741-9746.
(37) Edwards, D. J.; Jones, J. W.; Lozman, O.; Ormerod, A. P.; Sintyureva, M.; Tiddy, G. J. T.
Chromonic liquid crystal formation by Edicol Sunset Yellow. J. Phys. Chem. B 2008, 112,
14628-14636.
(38) Lydon, J. Chromonic mesophases. Curr. Opin. Colloid Interface Sci. 2004, 8, 480-490.
(39) Eckhardt, H.; Bose, A.; Krongauz, V. A. Formation of molecular H- and J-stacks by the
spiropyran-merocyanine transformation in a polymer matrix. Polymer 1987, 28, 1959-1964.
(40) Merino, G.; Heine, T.; Seifert, G. The induced magnetic field in cyclic molecules. Chem.--
Eur. J. 2004, 10, 4367-4371.
(41) Gonzalez-Rodriguez, D.; Janssen, P. G. A.; Martin-Rapun, R.; De Cat, I.; De Feyter, S.;
Schenning, A. P. H. J.; Meijer, E. W. Persistent, Well-Defined, Monodisperse, pi-
Conjugated Organic Nanoparticles via G-Quadruplex Self-Assembly. J. Am. Chem. Soc.
2010, 132, 4710-4719.
(42) Wu, L.; Lal, J.; Simon, K. A.; Burton, E. A.; Luk, Y.-Y. Nonamphiphilic Assembly in
Water: Polymorphic Nature, Thread Structure, and Thermodynamic Incompatibility. J. Am.
Chem. Soc. 2009, 131, 7430-7443.
(43) Simon, K. A.; Burton, E. A.; Cheng, F.; Varghese, N.; Falcone, E. R.; Wu, L.; Luk, Y.-Y.
Controlling Thread Assemblies of Pharmaceutical Compounds in Liquid Crystal Phase by
Using Functionalized Nanotopography. Chem. Mater. 2010, 22, 2434-2441.
(44) Kerker, M.; Editor Colloid and Interface Science, Vol. 2: Aerosols, Emulsions, and
Surfactants, 1976.
- 253 -
(45) Poulin, P.; Stark, H.; Lubensky, T. C.; Weitz, D. A. Novel colloidal interactions in
anisotropic fluids. Science 1997, 275, 1770-1773.
(46) Brake, J. M.; Daschner, M. K.; Luk, Y.-Y.; Abbott, N. L. Biomolecular Interactions at
Phospholipid-Decorated Surfaces of Liquid Crystals. Science 2003, 302, 2094-2098.
(47) Han, Y.; Cheng, K.; Simon, K. A.; Lan, Y.; Sejwal, P.; Luk, Y.-Y. A Biocompatible
Surfactant with Folded Hydrophilic Head Group: Enhancing the Stability of Self-Inclusion
Complexes of Ferrocenyl in a beta -Cyclodextrin Unit by Bond Rigidity. J. Am. Chem. Soc.
2006, 128, 13913-13920.
(48) Tolstoguzov, V. Foods as dispersed systems. Thermodynamic aspects of composition-
property relationships in formulated food. J. Therm. Anal. Calorim. 2000, 61, 397-409.
(49) Clark, A. H.; Gidley, M. J.; Richardson, R. K.; Ross-Murphy, S. B. Rheological studies of
aqueous amylose gels: the effect of chain length and concentration on gel modulus.
Macromolecules 1989, 22, 346-351.
(50) Kasapis, S.; Morris, E. R.; Norton, I. T.; Gidley, M. J. Phase equilibria and gelation in
gelatin/maltodextrin systems - Part II: Polymer incompatibility in solution. Carbohydr.
Polym. 1993, 21, 249-259.
(51) Simon, K. A.; Sejwal, P.; Falcone, E. R.; Burton, E. A.; Yang, S.; Prashar, D.;
Bandyopadhyay, D.; Narasimhan, S. K.; Varghese, N.; Gobalasingham, N. S.; Reese, J. B.;
Luk, Y.-Y. Noncovalent Polymerization and Assembly in Water Promoted by
Thermodynamic Incompatibility. J. Phys. Chem. B 2010, 114, 10357-10367.
(52) Karplus, M. Vicinal proton coupling in nuclear magnetic resonance. J. Am. Chem. Soc.
1963, 85, 2870-2871.

- 254 -
(53) Minch, M. J. Orientational dependence of vicinal proton-proton NMR coupling constants:
The Karplus relationship. Concepts Magn. Reson. 1994, 6, 41-56.
(54) Gottlieb, H. E.; Kotlyar, V.; Nudelman, A. NMR chemical shifts of common laboratory
solvents as trace impurities. J. Org. Chem. 1997, 62, 7512-7515.
(55) Martin, R. B. Comparisons of Indefinite Self-Association Models. Chem. Rev. 1996, 96,
3043-3064.
(56) Smulders, M. M. J.; Nieuwenhuizen, M. M. L.; de Greef, T. F. A.; van der Schoot, P.;
Schenning, A. P. H. J.; Meijer, E. W. How to Distinguish Isodesmic from Cooperative
Supramolecular Polymerisation. Chem.--Eur. J. 2010, 16, 362-367.
(57) Ponnuswamy, N.; Pantos, G. D.; Smulders, M. M. J.; Sanders, J. K. M. Thermodynamics of
Supramolecular Naphthalenediimide Nanotube Formation: The Influence of Solvents, Side
Chains, and Guest Templates. J. Am. Chem. Soc. 2012, 134, 566-573.
(58) Chami, F.; Wilson, M. R. Molecular Order in a Chromonic Liquid Crystal: A Molecular
Simulation Study of the Anionic Azo Dye Sunset Yellow. J. Am. Chem. Soc. 2010, 132,
7794-7802.
(59) Renshaw, M. P.; Day, I. J. NMR Characterization of the Aggregation State of the Azo Dye
Sunset Yellow in the Isotropic Phase. J. Phys. Chem. B 2010, 114, 10032-10038.
(60) Hiltrop, K. In Chirality in Liquid Crystals; Kitzerow, H.-S., Bahr, C., Eds.; Springer:
Seacaucus, N. J., 2001; Ch 14.
(61) Tseng, S.-L.; Valente, A.; Gray, D. G. Cholesteric liquid crystalline phases based on
(acetoxypropyl)cellulose. Macromolecules 1981, 14, 715-719.
(62) Kasuya, S.; Sasaki, S.; Watanabe, J.; Fukuda, Y.; Uematsu, I. Thermotropic cholesteric
mesophases in copoly(γ-n-alkyl L-glutamate)s. Polym. Bull. 1982, 7, 241-248.

- 255 -
(63) Watanabe, J.; Krigbaum, W. R. Copolyesters exhibiting a thermotropic cholesteric phase. J.
Polym. Sci., Polym. Phys. Ed. 1985, 23, 565-574.
(64) Lee, H.; Labes, M. M. Helical twisting power of amino acids in a nematic lyophase. Mol.
Cryst. Liq. Cryst. 1984, 108, 125-132.
(65) Dorfler, H. D.; Gopfert, A. Comparison of structures and properties of lyotropic cholesteric
phases induced by center and axial chiral compounds. Colloid Polym. Sci. 2000, 278, 1085-
1096.
(66) Van Winkle, D. H.; Davidson, M. W.; Chen, W. X.; Rill, R. L. Cholesteric helical pitch of
near persistence length DNA. Macromolecules 1990, 23, 4140-4148.
(67) Do Aido, T. M. H.; Alcantara, M. R.; Felippe, O., Jr.; Pereira, A. M. G.; Vanin, J. A.
Carbohydrates as inducers in cholesteric lyotropic mesophases. Mol. Cryst. Liq. Cryst. 1990,
185, 61-66.
(68) Reinitzer, F. Beiträge zur Kenntniss des Cholesterins. Monatshefte für Chemie 1888, 9,
421-441.
(69) Werbowyj, R. S.; Gray, D. G. Ordered phase formation in concentrated
hydroxypropylcellulose solutions. Macromolecules 1980, 13, 69-73.
(70) Tombolato, F.; Ferrarini, A.; Grelet, E. Chiral nematic phase of suspensions of rodlike
viruses: left-handed phase helicity from a right-handed molecular helix. Phys Rev Lett 2006,
96, 258302.
(71) Buckingham, A. D.; Ceasar, G. P.; Dunn, M. B. Addition of optically active compounds to
nematic liquid crystals. Chem. Phys. Lett. 1969, 3, 540-541.
- 256 -
(72) Dorfler, H.-D. Chirality, twist and structures of micellar lyotropic cholesteric liquid crystals
in comparison to the properties of chiralic thermotropic phases. Adv. Colloid Interface Sci.
2002, 98, 285-340.
(73) Pieraccini, S.; Ferrarini, A.; Spada Gian, P. Chiral doping of nematic phases and its
application to the determination of absolute configuration. Chirality 2008, 20, 749-759.
(74) Pieraccini, S.; Masiero, S.; Ferrarini, A.; Piero Spada, G. Chirality transfer across length-
scales in nematic liquid crystals: fundamentals and applications. Chem. Soc. Rev. 2011, 40,
258-271.
(75) Krigbaum, W. R.; Ciferri, A.; Asrar, J.; Toriumi, H.; Preston, J. A polyester forming a
thermotropic cholesteric phase. Mol. Cryst. Liq. Cryst. 1981, 76, 79-91.
(76) Billard, J.; Blumstein, A.; Vilasagar, S. Phase diagrams of cholesteric and nematic
thermotropic liquid-crystalline polymers. Mol. Cryst. Liq. Cryst. 1982, 72, 163-169.
(77) Chiellini, E.; Galli, G. Chiral liquid crystal polymers. 6. Preparation and properties in
solution and in bulk of optically active thermotropic copolyesters. Macromolecules 1985,
18, 1652-1658.
(78) Dorset, D. L. Thermotropic mesomorphism of cholesteryl myristate. An electron diffraction
study. J. Lipid Res. 1985, 26, 1142-1150.
(79) Hara, H.; Satoh, T.; Toya, T.; Iida, S.; Orii, S.; Watanabe, J. Cholesteric liquid-crystalline
polyesters. 1. Cholesteric liquid-crystalline copolyesters based on poly(chloro-1,4-
phenylene trans-1,4-cyclohexanedicarboxylate). Macromolecules 1988, 21, 14-19.
(80) Bartusch, G.; Doerfler, H. D.; Hoffmann, H. Behavior and properties of lyotropic-nematic
and lyotropic-cholesteric phases. Prog. Colloid Polym. Sci. 1992, 89, 307-314.

- 257 -
(81) Toledano, P.; Figueiredo Neto, A. M.; de Sant'Ana, Z. A. Phase diagrams of lyotropic
cholesteric fluids. Phys. Rev. E 2000, 61, 486-492.
(82) Dorfler, H.-D.; Gopfert, A.; Gorgens, C. Structures and properties of induced lyotropic
cholesteric phases. Mol. Cryst. Liq. Cryst. Sci. Technol., Sect. A 2001, 367, 517-527.
(83) Yu, L. J.; Saupe, A. Liquid crystalline phases of the sodium decylsulfate/decanol/water
system. Nematic-nematic and cholesteric-cholesteric phase transitions. J. Am. Chem. Soc.
1980, 102, 4879-4883.
(84) von Minden, H. M.; Vill, V.; Pape, M.; Hiltrop, K. Sugar Amphiphiles as Revealing
Dopants for Induced Chiral Nematic Lyotropic Liquid Crystals. J. Colloid Interface Sci.
2001, 236, 108-115.
(85) Dawin, U. C.; Dilger, H.; Roduner, E.; Scheuermann, R.; Stoykov, A.; Giesselmann, F.
Chiral Induction in Lyotropic Liquid Crystals: Insights into the Role of Dopant Location
and Dopant Dynamics. Angew. Chem., Int. Ed. 2010, 49, 2427-2430.
(86) Lavrentovich, M.; Sergan, T.; Kelly, J. Planar and twisted lyotropic chromonic liquid
crystal cells as optical compensators for twisted nematic displays. Liq. Cryst. 2003, 30, 851-
859.
(87) Walba, D. M.; Korblova, E.; Shao, R.; Maclennan, J. E.; Link, D. R.; Glaser, M. A.; Clark,
N. A. A ferroelectric liquid crystal conglomerate composed of racemic molecules. Science
2000, 288, 2181-2184.
(88) Takezoe, H. Spontaneous achiral symmetry breaking in liquid crystalline phases. Top.
Curr. Chem. 2012, 318, 303-330.
- 258 -
(89) Linclau, B.; Boydell, A. J.; Clarke, P. J.; Horan, R.; Jacquet, C. Efficient De-
Symmetrization of "Pseudo"-C2-Symmetric Substrates: Illustration in the Synthesis of a
Disubstituted Butenolide from Arabitol. J. Org. Chem. 2003, 68, 1821-1826.
(90) Fiori, K. W.; Puchlopek, A. L. A.; Miller, S. J. Enantioselective sulfonylation reactions
mediated by a tetrapeptide catalyst. Nat. Chem. 2009, 1, 630-634.
(91) Walenzyk, T.; Carola, C.; Buchholz, H.; Koenig, B. Chromone derivatives which bind to
human hair. Tetrahedron 2005, 61, 7366-7377.
(92) Terauchi, T.; Terauchi, T.; Sato, I.; Tsukada, T.; Kanoh, N.; Nakata, M. Synthetic studies
on altohyrtins (spongistatins): synthesis of the C15-C28 (CD) spiroacetal portion.
Tetrahedron Lett. 2000, 41, 2649-2653.
(93) Rychnovsky, S. D.; Griesgraber, G.; Zeller, S.; Skalitzky, D. J. Optically pure 1,3-diols
from (2R,4R)- and (2S,4S)-1,2:4,5-diepoxypentane. J. Org. Chem. 1991, 56, 5161-5169.
(94) Bauer, C. J.; Frenkiel, T. A.; Lane, A. N. A comparison of the ROESY and NOESY
experiments for large molecules, with application to nucleic acids. J. Magn. Reson. 1990,
87, 144-152.
(95) Langeveld-Voss, B. M. W.; Beljonne, D.; Shuai, Z.; Janssen, R. A. J.; Meskers, S. C. J.;
Meijer, E. W.; Bredas, J.-L. Investigation of exciton coupling in oligothiophenes by circular
dichroism spectroscopy. Adv. Mater. 1998, 10, 1343-1348.
(96) Besenius, P.; Portale, G.; Bomans, P. H. H.; Janssen, H. M.; Palmans, A. R. A.; Meijer, E.
W. Controlling the growth and shape of chiral supramolecular polymers in water. Proc.
Natl. Acad. Sci. U. S. A. 2010, 107, 17888-17893, S17888/17881-S17888/17819.

- 259 -
(97) Zhong, S.; Pochan, D. J. Cryogenic Transmission Electron Microscopy for Direct
Observation of Polymer and Small-Molecule Materials and Structures in Solution. Polym.
Rev. 2010, 50, 287-320.
(98) Okoshi, K.; Sakajiri, K.; Kumaki, J.; Yashima, E. Well-Defined Lyotropic Liquid
Crystalline Properties of Rigid-Rod Helical Polyacetylenes. Macromolecules 2005, 38,
4061-4064.
(99) Gupta, V. K.; Abbott, N. L. Design of surfaces for patterned alignment of liquid crystals on
planar and curved substrates. Science 1997, 276, 1533-1536.
(100) Luk, Y.-Y.; Tingey, M. L.; Hall, D. J.; Israel, B. A.; Murphy, C. J.; Bertics, P. J.; Abbott,
N. L. Using liquid crystals to amplify protein-receptor interactions: Design of surfaces
with nanometer-scale topography that present histidine-tagged protein receptors. Langmuir
2003, 19, 1671-1680.
(101) Gottarelli, G.; Hibert, M.; Samori, B.; Solladie, G.; Spada, G. P.; Zimmermann, R.
Induction of the cholesteric mesophase in nematic liquid crystals: mechanism and
application to the determination of bridged biaryl configurations. J. Am. Chem. Soc. 1983,
105, 7318-7321.
(102) Green, M. M.; Zanella, S.; Gu, H.; Sato, T.; Gottarelli, G.; Jha, S. K.; Spada, G. P.;
Schoevaars, A. M.; Feringa, B.; Teramoto, A. Mechanism of the Transformation of a Stiff
Polymer Lyotropic Nematic Liquid Crystal to the Cholesteric State by Dopant-Mediated
Chiral Information Transfer. J. Am. Chem. Soc. 1998, 120, 9810-9817.
(103) Brakke, M. K. Density gradient centrifugation: a new separation technique. J. Am. Chem.
Soc. 1951, 73, 1847-1848.

- 260 -
(104) Svensson, H.; Valmet, E. Large-scale density-gradient electrophoresis. II. A simple
experimental technique for securing perfectly stable zones and full utilization of the
separation capacity of a density-gradient column. Sci. Tools 1959, 6, 13-17.
(105) Seraydarian, K.; Mommaerts, W. F. Density gradient separation of sarcotubular vesicles
and other particulate constituents of rabbit muscle. J. Cell. Biol. 1965, 26, 641-656.
(106) Sarfati, M.; Lesot, P.; Merlet, D.; Courtieu, J. Theoretical and experimental aspects of
enantiomeric differentiation using natural abundance multinuclear NMR spectroscopy in
chiral polypeptide liquid crystals. Chem. Commun. 2000, 2069-2081.
(107) Ebbinghaus, S.; Kim, S. J.; Heyden, M.; Yu, X.; Heugen, U.; Gruebele, M.; Leitner, D. M.;
Havenith, M. An extended dynamical hydration shell around proteins. Proc. Natl. Acad.
Sci. U. S. A. 2007, 104, 20749-20752.
(108) Lesot, P.; Lafon, O.; Zimmermann, H.; Luz, Z. Enantiodiscrimination in Deuterium NMR
Spectra of Flexible Chiral Molecules with Average Axial Symmetry Dissolved in Chiral
Liquid Crystals: The Case of Tridioxyethylenetriphenylene. J. Am. Chem. Soc. 2008, 130,
8754-8761.
(109) Bandyopadhyay, D.; Prashar, D.; Luk, Y.-Y. Anti-Fouling Chemistry of Chiral
Monolayers: Enhancing Biofilm Resistance on Racemic Surface. Langmuir 2011, 27,
6124-6131.
(110) Feldman, K.; Haehner, G.; Spencer, N. D.; Harder, P.; Grunze, M. Probing Resistance to
Protein Adsorption of Oligo(ethylene glycol)-Terminated Self-Assembled Monolayers by
Scanning Force Microscopy. J. Am. Chem. Soc. 1999, 121, 10134-10141.

- 261 -
(111) Skoda, M. W. A.; Schreiber, F.; Jacobs, R. M. J.; Webster, J. R. P.; Wolff, M.; Dahint, R.;
Schwendel, D.; Grunze, M. Protein Density Profile at the Interface of Water with
Oligo(ethylene glycol) Self-Assembled Monolayers. Langmuir 2009, 25, 4056-4064.
(112) Wulf, A. Distribution function theory of nematic liquid crystals. J. Chem. Phys. 1971, 55,
4512-4519.
(113) Poulin, P.; Stark, H.; Lubensky, T. C.; Weitz, D. A. Novel colloidal interactions in
anisotropic fluids. Science 1997, 275, 1770-1773.
(114) Bax, A.; Davis, D. G. Practical aspects of two-dimensional transverse NOE spectroscopy.
J. Magn. Reson. 1985, 63, 207-213.
(115) Gupta, V. K.; Abbott, N. L. Azimuthal anchoring transition of nematic liquid crystals on
self-assembled monolayers formed from odd and even alkanethiols. Phys. Rev. E 1996, 54,
R4540-R4543.
(116) Francisco, C. G.; Leon, E. I.; Martin, A.; Moreno, P.; Rodriguez, M. S.; Suarez, E.
Reductive Fragmentation of Carbohydrate Anomeric Alkoxy Radicals. Synthesis of
Alditols with Potential Utility as Chiral Synthons. J. Org. Chem. 2001, 66, 6967-6976.
(117) Attwood, S. V.; Barrett, A. G. M. A convenient procedure for the deoxygenation and
homologation of D-ribose derivatives. J. Chem. Soc., Perkin Trans. 1 1984, 1315-1322.
(118) Xie, Z. F.; Sakai, K. Preparation of a chiral building block based on 1,3-syn-diol using
Pseudomonas fluorescens lipase and its application to the synthesis of a hunger modulator.
Chem. Pharm. Bull. 1989, 37, 1650-1652.
(119) Fuqua, W. C.; Winans, S. C.; Greenberg, E. P. Quorum sensing in bacteria: the LuxR-LuxI
family of cell density-responsive transcriptional regulators. J. Bacteriol. 1994, 176, 269-
275.

- 262 -
(120) Bassler, B. L.; Losick, R. Bacterially speaking. Cell 2006, 125, 237-246.
(121) Camilli, A.; Bassler, B. L. Bacterial Small-Molecule Signaling Pathways. Science 2006,
311, 1113-1116.
(122) Eberhard, A.; Burlingame, A. L.; Eberhard, C.; Kenyon, G. L.; Nealson, K. H.;
Oppenheimer, N. J. Structural identification of autoinducer of Photobacterium fischeri
luciferase. Biochemistry 1981, 20, 2444-2449.
(123) Bassler, B. L. Small talk: Cell-to-cell communication in bacteria. Cell 2002, 109, 421-424.
(124) Waters, C. M.; Bassler, B. L. Quorum sensing: Cell-to-cell communication in bacteria.
Annu. Rev. Cell Dev. Biol. 2005, 21, 319-346.
(125) Pesci, E. C.; Milbank, J. B.; Pearson, J. P.; McKnight, S.; Kende, A. S.; Greenberg, E. P.;
Iglewski, B. H. Quinolone signaling in the cell-to-cell communication system of
Pseudomonas aeruginosa. Proc. Natl. Acad. Sci. U. S. A. 1999, 96, 11229-11234.
(126) Deziel, E.; Lepine, F.; Milot, S.; He, J.; Mindrinos, M. N.; Tompkins, R. G.; Rahme, L. G.
Analysis of Pseudomonas aeruginosa 4-hydroxy-2-alkylquinolines (HAQs) reveals a role
for 4-hydroxy-2-heptylquinoline in cell-to-cell communication. Proc. Natl. Acad. Sci. U. S.
A. 2004, 101, 1339-1344.
(127) Zhang, L.; Murphy, P. J.; Kerr, A.; Tate, M. E. Agrobacterium conjugation and gene
regulation by N-acyl-L-homoserine lactones. Nature 1993, 362, 446-448.
(128) Bainton, N. J.; Bycroft, B. W.; Chhabra, S. R.; Stead, P.; Gledhill, L.; Hill, P. J.; Rees, C.
E.; Winson, M. K.; Salmond, G. P.; Stewart, G. S.; et al. A general role for the lux
autoinducer in bacterial cell signalling: control of antibiotic biosynthesis in Erwinia. Gene
1992, 116, 87-91.

- 263 -
(129) Pearson, J. P.; Gray, K. M.; Passador, L.; Tucker, K. D.; Eberhard, A.; Iglewski, B. H.;
Greenberg, E. P. Structure of the autoinducer required for expression of Pseudomonas
aeruginosa virulence genes. Proc. Natl. Acad. Sci. U. S. A. 1994, 91, 197-201.
(130) Pearson, J. P.; Passador, L.; Iglewski, B. H.; Greenberg, E. P. A second N-acylhomoserine
lactone signal produced by Pseudomonas aeruginosa. Proc. Natl. Acad. Sci. U. S. A. 1995,
92, 1490-1494.
(131) Galloway, W. R. J. D.; Hodgkinson, J. T.; Bowden, S. D.; Welch, M.; Spring, D. R.
Quorum sensing in Gram-negative bacteria: Small molecule modulation of AHL and AI-2
quorum sensing pathways. Chem. Rev. 2011, 111, 28-67.
(132) Davies, D. Understanding biofilm resistance to antibacterial agents. Nat. Rev. Drug
Discovery 2003, 2, 114-122.
(133) Costerton, J. W.; Stewart, P. S.; Greenberg, E. P. Bacterial biofilms: a common cause of
persistent infections. Science 1999, 284, 1318-1322.
(134) Parsek, M. R.; Singh, P. K. Bacterial biofilms: An emerging link to disease pathogenesis.
Annu. Rev. Microbiol. 2003, 57, 677-701.
(135) Musk, D. J., Jr.; Hergenrother, P. J. Chemical countermeasures for the control of bacterial
biofilms: effective compounds and promising targets. Curr. Med. Chem. 2006, 13, 2163-
2177.
(136) Costerton, J. W.; Lewandowski, Z.; Caldwell, D. E.; Korber, D. R.; Lappin-Scott, H. M.
Microbial biofilms. Annu. Rev. Microbiol. 1995, 49, 711-745.
(137) Donlan, R. M. Biofilm formation: A clinically relevant microbiological process. Clin.
Infect. Dis. 2001, 33, 1387-1392.

- 264 -
(138) Smith, K.; Hunter, I. S. Efficacy of common hospital biocides with biofilms of multi-drug
resistant clinical isolates. J. Med. Microbiol. 2008, 57, 966-973.
(139) Davies, D. G.; Parsek, M. R.; Pearson, J. P.; Iglewski, B. H.; Costerton, J. W.; Greenberg,
E. P. The involvement of cell-to-cell signals in the development of a bacterial biofilm.
Science 1998, 280, 295-298.
(140) Stoodley, P.; Sauer, K.; Davies, D. G.; Costerton, J. W. Biofilms as complex differentiated
communities. Annu. Rev. Microbiol. 2002, 56, 187-209.
(141) Hunt, J. A. A short history of soap. The Pharmaceutical Journal 1999, 263, 985-989.
(142) Allison, C.; Lai, H. C.; Gygi, D.; Hughes, C. Cell differentiation of Proteus mirabilis is
initiated by glutamine, a specific chemoattractant for swarming cells. Mol. Microbiol.
1993, 8, 53-60.
(143) Anwar, H.; Dasgupta, M. K.; Costerton, J. W. Testing the susceptibility of bacteria in
biofilms to antibacterial agents. Antimicrob. Agents Chemother. 1990, 34, 2043-2046.
(144) Mah, T.-F. C.; O'Toole, G. A. Mechanisms of biofilm resistance to antimicrobial agents.
Trends Microbiol. 2001, 9, 34-39.
(145) Monroe, D. Looking for chinks in the armor of bacterial biofilms. PLoS Biol. 2007, 5,
e307.
(146) Hoyle, B. D.; Alcantara, J.; Costerton, J. W. Pseudomonas aeruginosa biofilm as a
diffusion barrier to piperacillin. Antimicrob. Agents Chemother. 1992, 36, 2054-2056.
(147) Nguyen, D.; Joshi-Datar, A.; Lepine, F.; Bauerle, E.; Olakanmi, O.; Beer, K.; McKay, G.;
Siehnel, R.; Schafhauser, J.; Wang, Y.; Britigan, B. E.; Singh, P. K. Active starvation
responses mediate antibiotic tolerance in biofilms and nutrient-limited bacteria. Science
2011, 334, 982-986.

- 265 -
(148) Brown, M. R.; Barker, J. Unexplored reservoirs of pathogenic bacteria: protozoa and
biofilms. Trends Microbiol. 1999, 7, 46-50.
(149) Brown, M. R.; Allison, D. G.; Gilbert, P. Resistance of bacterial biofilms to antibiotics: a
growth-rate related effect?, The Journal of Antimicrobial Chemotherapy 1988, 22, 777-
780.
(150) Evans, D. J.; Allison, D. G.; Brown, M. R.; Gilbert, P. Susceptibility of Pseudomonas
aeruginosa and Escherichia coli biofilms towards ciprofloxacin: effect of specific growth
rate. J. Antimicrob. Chemother. 1991, 27, 177-184.
(151) Hannedouche, S.; Zhang, J.; Yi, T.; Shen, W.; Nguyen, D.; Pereira, J. P.; Guerini, D.;
Baumgarten, B. U.; Roggo, S.; Wen, B.; Knochenmuss, R.; Noel, S.; Gessier, F.; Kelly, L.
M.; Vanek, M.; Laurent, S.; Preuss, I.; Miault, C.; Christen, I.; Karuna, R.; Li, W.; Koo, D.
I.; Suply, T.; Schmedt, C.; Peters, E. C.; Falchetto, R.; Katopodis, A.; Spanka, C.; Roy, M.
O.; Detheux, M.; Chen, Y. A.; Schultz, P. G.; Cho, C. Y.; Seuwen, K.; Cyster, J. G.; Sailer,
A. W. Oxysterols direct immune cell migration via EBI2. Nature 2011, 475, 524-527.
(152) Bjarnsholt, T.; Jensen, P. O.; Burmolle, M.; Hentzer, M.; Haagensen, J. A.; Hougen, H. P.;
Calum, H.; Madsen, K. G.; Moser, C.; Molin, S.; Hoiby, N.; Givskov, M. Pseudomonas
aeruginosa tolerance to tobramycin, hydrogen peroxide and polymorphonuclear leukocytes
is quorum-sensing dependent. Microbiology 2005, 151, 373-383.
(153) Jensen, E. T.; Kharazmi, A.; Garred, P.; Kronborg, G.; Fomsgaard, A.; Mollnes, T. E.;
Hoiby, N. Complement activation by Pseudomonas aeruginosa biofilms. Microb. Pathog.
1993, 15, 377-388.
(154) Kaplan, J. B. Biofilm dispersal: mechanisms, clinical implications, and potential
therapeutic uses. J. Dent. Res. 2010, 89, 205-218.

- 266 -
(155) von Nussbaum, F.; Brands, M.; Hinzen, B.; Weigand, S.; Haebich, D. Antibacterial natural
products in medicinal chemistry - exodus or revival?, Angew. Chem., Int. Ed. 2006, 45,
5072-5129.
(156) Rasmussen, T. B.; Givskov, M. Quorum-sensing inhibitors as anti-pathogenic drugs. Int. J.
Med. Microbiol. 2006, 296, 149-161.
(157) Engebrecht, J.; Nealson, K.; Silverman, M. Bacterial bioluminescence: isolation and
genetic analysis of functions from Vibrio fischeri. Cell 1983, 32, 773-781.
(158) Engebrecht, J.; Silverman, M. Identification of genes and gene products necessary for
bacterial bioluminescence. Proc. Natl. Acad. Sci. U. S. A. 1984, 81, 4154-4158.
(159) Engebrecht, J.; Silverman, M. Nucleotide sequence of the regulatory locus controlling
expression of bacterial genes for bioluminescence. Nucleic Acids Res. 1987, 15, 10455-
10467.
(160) Smith, K. M.; Bu, Y.; Suga, H. Induction and Inhibition of Pseudomonas aeruginosa
Quorum Sensing by Synthetic Autoinducer Analogs. Chem. Biol. 2003, 10, 81-89.
(161) Smith, K. M.; Bu, Y.; Suga, H. Library screening for synthetic agonists and antagonists of
a Pseudomonas aeruginosa autoinducer. Chem. Biol. 2003, 10, 563-571.
(162) Geske, G. D.; Wezeman, R. J.; Siegel, A. P.; Blackwell, H. E. Small Molecule Inhibitors
of Bacterial Quorum Sensing and Biofilm Formation. J. Am. Chem. Soc. 2005, 127, 12762-
12763.
(163) Geske, G. D.; O'Neill, J. C.; Miller, D. M.; Mattmann, M. E.; Blackwell, H. E. Modulation
of bacterial quorum sensing with synthetic ligands: systematic evaluation of N-acylated
homoserine lactones in multiple species and new insights into their mechanisms of action.
J. Am. Chem. Soc. 2007, 129, 13613-13625.

- 267 -
(164) Praneenararat, T.; Geske, G. D.; Blackwell, H. E. Efficient Synthesis and Evaluation of
Quorum-Sensing Modulators Using Small Molecule Macroarrays. Org. Lett. 2009, 11,
4600-4603.
(165) McInnis, C. E.; Blackwell, H. E. Design, synthesis, and biological evaluation of abiotic,
non-lactone modulators of LuxR-type quorum sensing. Bioorg. Med. Chem. 2011, 19,
4812-4819.
(166) Geske, G. D.; Mattmann, M. E.; Blackwell, H. E. Evaluation of a focused library of N-aryl
L-homoserine lactones reveals a new set of potent quorum sensing modulators. Bioorg.
Med. Chem. Lett. 2008, 18, 5978-5981.
(167) Frei, R.; Breitbach, A. S.; Blackwell, H. E. 2-Aminobenzimidazole derivatives strongly
inhibit and disperse Pseudomonas aeruginosa biofilms. Angew. Chem. Int. Ed. 2012, 51,
5226-5229.
(168) Reed, C. S.; Huigens, R. W., III; Rogers, S. A.; Melander, C. Modulating the development
of E. coli biofilms with 2-aminoimidazoles. Bioorg. Med. Chem. Lett. 2010, 20, 6310-6312.
(169) Bunders, C. A.; Richards, J. J.; Melander, C. Identification of aryl 2-aminoimidazoles as
biofilm inhibitors in Gram-negative bacteria. Bioorg. Med. Chem. Lett. 2010, 20, 3797-
3800.
(170) Huigens, R. W., III; Richards, J. J.; Parise, G.; Ballard, T. E.; Zeng, W.; Deora, R.;
Melander, C. Inhibition of Pseudomonas aeruginosa Biofilm Formation with
Bromoageliferin Analogues. J. Am. Chem. Soc. 2007, 129, 6966-6967.
(171) Richards, J. J.; Melander, C. Small molecule approaches toward the non-microbicidal
modulation of bacterial biofilm growth and maintenance. Anti-Infect. Agents Med. Chem.
2009, 8, 295-314.

- 268 -
(172) Liu, C.; Worthington, R. J.; Melander, C.; Wu, H. A new small molecule specifically
inhibits the cariogenic bacterium Streptococcus mutans in multispecies biofilms.
Antimicrob. Agents Chemother. 2011, 55, 2679-2687.
(173) Rogers, S. A.; Huigens, R. W., III; Cavanagh, J.; Melander, C. Synergistic effects between
conventional antibiotics and 2-aminoimidazole-derived antibiofilm agents. Antimicrob.
Agents Chemother. 2010, 54, 2112-2118.
(174) Davies, D. G.; Marques, C. N. H. A fatty acid messenger is responsible for inducing
dispersion in microbial biofilms. Journal of Bacteriology 2009, 191, 1393-1403.
(175) Ren, D.; Zuo, R.; Gonzalez Barrios, A. F.; Bedzyk, L. A.; Eldridge, G. R.; Pasmore, M. E.;
Wood, T. K. Differential gene expression for investigation of Escherichia coli biofilm
inhibition by plant extract ursolic acid. Appl. Environ. Microbiol. 2005, 71, 4022-4034.
(176) Musk, D. J.; Banko, D. A.; Hergenrother, P. J. Iron Salts Perturb Biofilm Formation and
Disrupt Existing Biofilms of Pseudomonas aeruginosa. Chem. Biol. 2005, 12, 789-796.
(177) Junker, L. M.; Clardy, J. High-throughput screens for small-molecule inhibitors of
Pseudomonas aeruginosa biofilm development. Antimicrob. Agents Chemother. 2007, 51,
3582-3590.
(178) Musk, D. J., Jr.; Hergenrother, P. J. Chelated iron sources are inhibitors of Pseudomonas
aeruginosa biofilms and distribute efficiently in an in vitro model of drug delivery to the
human lung. J. Appl. Microbiol. 2008, 105, 380-388.
(179) Kazlauskas, R.; Murphy, P. T.; Quinn, R. J.; Wells, R. J. A new class of halogenated
lactones from the red alga Delisea fimbriata (Bonnemaisoniaceae). Tetrahedron Lett. 1977,
37-40.
- 269 -
(180) de Nys, R.; Wright, A. D.; Konig, G. M.; Sticher, O. New halogenated furanones from the
marine alga Delisea pulchra (cf. fimbriata). Tetrahedron 1993, 49, 11213-11220.
(181) Maximilien, R.; de Nys, R.; Holmström, C.; Gram, L.; Givskov, M.; Crass, K.; Kjelleberg,
S.; Steinberg, P. D. Chemical mediation of bacterial surface colonisation by secondary
metabolites from the red alga Delisea pulchra. Aquat. Microb. Ecol. 1998, 15, 233-246.
(182) Dworjanyn, S. A.; De Nys, R.; Steinberg, P. D. Localisation and surface quantification of
secondary metabolites in the red alga Delisea pulchra. Mar. Biol. (Berlin) 1999, 133, 727-
736.
(183) Ren, D.; Sims, J. J.; Wood, T. K. Inhibition of biofilm formation and swarming of Bacillus
subtilis by (5Z)-4-bromo-5-(bromomethylene)-3-butyl-2(5H)-furanone. Lett. Appl.
Microbiol. 2002, 34, 293-299.
(184) Ren, D.; Sims, J. J.; Wood, T. K. Inhibition of biofilm formation and swarming of
Escherichia coli by (5Z)-4-bromo-5-(bromomethylene)-3-butyl-2(5H)-furanone. Environ.
Microbiol. 2001, 3, 731-736.
(185) Manefield, M.; Rasmussen, T. B.; Henzter, M.; Andersen, J. B.; Steinberg, P.; Kjelleberg,
S.; Givskov, M. Halogenated furanones inhibit quorum sensing through accelerated LuxR
turnover. Microbiology 2002, 148, 1119-1127.
(186) Givskov, M.; de Nys, R.; Manefield, M.; Gram, L.; Maximilien, R.; Eberl, L.; Molin, S.;
Steinberg, P. D.; Kjelleberg, S. Eukaryotic interference with homoserine lactone-mediated
prokaryotic signalling. J. Bacteriol. 1996, 178, 6618-6622.
(187) Defoirdt, T.; Crab, R.; Wood, T. K.; Sorgeloos, P.; Verstraete, W.; Bossier, P. Quorum
sensing-disrupting brominated furanones protect the gnotobiotic brine shrimp Artemia

- 270 -
franciscana from pathogenic Vibrio harveyi, Vibrio campbellii, and Vibrio
parahaemolyticus isolates. Appl. Environ. Microbiol. 2006, 72, 6419-6423.
(188) Estephane, J.; Dauvergne, J.; Soulere, L.; Reverchon, S.; Queneau, Y.; Doutheau, A. N-
Acyl-3-amino-5H-furanone derivatives as new inhibitors of LuxR-dependent quorum
sensing: Synthesis, biological evaluation and binding mode study. Bioorg. Med. Chem.
Lett. 2008, 18, 4321-4324.
(189) Wang, W.; Morohoshi, T.; Ikeda, T.; Chen, L. Inhibition of Lux quorum-sensing system
by synthetic N-acyl-L-homoserine lactone analogous. Acta Biochim. Biophys. Sin. 2008,
40, 1023-1028.
(190) Gram, L.; De Nys, R.; Maximilien, R.; Givskov, M.; Steinberg, P.; Kjelleberg, S.
Inhibitory effects of secondary metabolites from the red alga Delisea pulchra on swarming
motility of Proteus mirabilis. Appl. Environ. Microbiol. 1996, 62, 4284-4287.
(191) Rasmussen, T. B.; Manefield, M.; Andersen, J. B.; Eberl, L.; Anthoni, U.; Christophersen,
C.; Steinberg, P.; Kjelleberg, S.; Givskov, M. How Delisea pulchra furanones affect
quorum sensing and swarming motility in Serratia liquefaciens MG1. Microbiology 2000,
146, 3237-3244.
(192) Ren, D.; Sims, J. J.; Wood, T. K. Inhibition of biofilm formation and swarming of
Escherichia coli by (5Z)-4-bromo-5-(bromomethylene)-3-butyl-2(5H)-furanone. Environ.
Microbiol. 2001, 3, 731-736.
(193) Tao, Y.; Morohoshi, T.; Kato, N.; Ikeda, T.; Zhuang, H. The function of SpnR and the
inhibitory effects by halogenated furanone on quorum sensing in Serratia marcescens AS-1.
Weishengwu Xuebao 2008, 48, 391-397.

- 271 -
(194) Guo, J.; Li, B.; Liu, W.; Chen, W. Inhibitory effects of brominated 2(5H)-furanones on
biofilms of Pseudomonas aeruginosa. Shengming Kexue Yanjiu 2009, 13, 38-41.
(195) Hentzer, M.; Riedel, K.; Rasmussen, T. B.; Heydorn, A.; Andersen, J. B.; Parsek, M. R.;
Rice, S. A.; Eberl, L.; Molin, S.; Hoiby, N.; Kjelleberg, S.; Givskov, M. Inhibition of
quorum sensing in Pseudomonas aeruginosa biofilm bacteria by a halogenated furanone
compound. Microbiology 2002, 148, 87-102.
(196) Hume, E. B. H.; Baveja, J.; Muir, B.; Schubert, T. L.; Kumar, N.; Kjelleberg, S.; Griesser,
H. J.; Thissen, H.; Read, R.; Poole-Warren, L. A.; Schindhelm, K.; Willcox, M. D. P. The
control of Staphylococcus epidermidis biofilm formation and in vivo infection rates by
covalently bound furanones. Biomaterials 2004, 25, 5023-5030.
(197) Lonn-Stensrud, J.; Petersen, F. C.; Benneche, T.; Schele, A. A. Synthetic bromated
furanone inhibits autoinducer-2-mediated communication and biofilm formation in oral
streptococci. Oral Microbiol. Immunol. 2007, 22, 340-346.
(198) Han, Y.; Hou, S.; Simon, K. A.; Ren, D.; Luk, Y.-Y. Identifying the important structural
elements of brominated furanones for inhibiting biofilm formation by Escherichia coli.
Bioorg. Med. Chem. Lett. 2008, 18, 1006-1010.
(199) Janssens, J. C. A.; Steenackers, H.; Robijns, S.; Gellens, E.; Levin, J.; Zhao, H.; Hermans,
K.; De Coster, D.; Verhoeven, T. L.; Marchal, K.; Vanderleyden, J.; De Vos, D. E.; De
Keersmaecker, S. C. J. Brominated furanones inhibit biofilm formation by Salmonella
enterica serovar typhimurium. Appl. Environ. Microbiol. 2008, 74, 6639-6648.
(200) Vestby, L. K.; Lonn-Stensrud, J.; Moeretroe, T.; Langsrud, S.; Aamdal-Scheie, A.;
Benneche, T.; Nesse, L. L. A synthetic furanone potentiates the effect of disinfectants on
Salmonella in biofilm. J. Appl. Microbiol. 2010, 108, 771-778.

- 272 -
(201) Zhang, L.; Wang, S.; Zhou, X.; Xu, Y. Effect of quorum sensing inhibitor brominated
furanone on formation of Porphyromonas gingivalis biofilm. Huaxi Kouqiang Yixue Zazhi
2011, 29, 469-472.
(202) Morohoshi, T.; Shiono, T.; Takidouchi, K.; Kato, M.; Kato, N.; Kato, J.; Ikeda, T.
Inhibition of quorum sensing in Serratia marcescens AS-1 by synthetic analogs of N-
acylhomoserine lactone. Appl. Environ. Microbiol. 2007, 73, 6339-6344.
(203) Manefield, M.; Welch, M.; Givskov, M.; Salmond, G. P. C.; Kjelleberg, S. Halogenated
furanones from the red alga, Delisea pulchra, inhibit carbapenem antibiotic synthesis and
exoenzyme virulence factor production in the phytopathogen Erwinia carotovora. FEMS
Microbiol. Lett. 2001, 205, 131-138.
(204) Jones, M. B.; Jani, R.; Ren, D.; Wood, T. K.; Blaser, M. J. Inhibition of Bacillus anthracis
growth and virulence gene expression by inhibitors of quorum-sensing. J. Infect. Dis. 2005,
191, 1881-1888.
(205) Tinh, N. T. N.; Linh, N. D.; Wood, T. K.; Dierckens, K.; Sorgeloos, P.; Bossier, P.
Interference with the quorum sensing systems in a Vibrio harveyi strain alters the growth
rate of gnotobiotically cultured rotifer Brachionus plicatilis. J. Appl. Microbiol. 2007, 103,
194-203.
(206) Liu, H.-B.; Lee, J.-H.; Kim Jung, S.; Park, S. Inhibitors of the Pseudomonas aeruginosa
quorum-sensing regulator, QscR. Biotechnol. Bioeng. 2010, 106, 119-126.
(207) Pan, J.; Bahar, A. A.; Syed, H.; Ren, D. Reverting antibiotic tolerance of Pseudomonas
aeruginosa PAO1 persister cells by (Z)-4-bromo-5-(bromomethylene)-3-methylfuran-
2(5H)-one. PLoS One 2012, 7, e45778.

- 273 -
(208) Hentzer, M.; Wu, H.; Andersen, J. B.; Riedel, K.; Rasmussen, T. B.; Bagge, N.; Kumar, N.;
Schembri, M. A.; Song, Z.; Kristoffersen, P.; Manefield, M.; Costerton, J. W.; Molin, S.;
Eberl, L.; Steinberg, P.; Kjelleberg, S.; Hoiby, N.; Givskov, M. Attenuation of
Pseudomonas aeruginosa virulence by quorum sensing inhibitors. Embo J. 2003, 22, 3803-
3815.
(209) Wu, H.; Song, Z.; Hentzer, M.; Andersen, J. B.; Molin, S.; Givskov, M.; Hoiby, N.
Synthetic furanones inhibit quorum-sensing and enhance bacterial clearance in
Pseudomonas aeruginosa lung infection in mice. J. Antimicrob. Chemother. 2004, 53,
1054-1061.
(210) Janssens, J. C. A.; Steenackers, H.; Robijns, S.; Gellens, E.; Levin, J.; Zhao, H.; Hermans,
K.; De, C. D.; Verhoeven, T. L.; Marchal, K.; Vanderleyden, J.; De, V. D. E.; De, K. S. C.
J. Brominated furanones inhibit biofilm formation by Salmonella enterica serovar
typhimurium. Appl. Environ. Microbiol. 2008, 74, 6639-6648.
(211) Bandyopadhyay, D. Controlling biofouling by surface engineering and molecular
inhibition, Ph. D. Dissertation, Syracuse University, Syracuse, 2011.
(212) Defoirdt, T.; Miyamoto, C. M.; Wood, T. K.; Meighen, E. A.; Sorgeloos, P.; Verstraete,
W.; Bossier, P. The natural furanone (5Z)-4-bromo-5-(bromomethylene)-3-butyl-2(5H)-
furanone disrupts quorum sensing-regulated gene expression in Vibrio harveyi by
decreasing the DNA-binding activity of the transcriptional regulator protein luxR. Environ.
Microbiol. 2007, 9, 2486-2495.
(213) Manefield, M.; De Nys, R.; Kumar, N.; Read, R.; Givskov, M.; Steinberg, P.; Kjelleberg,
S. Evidence that halogenated furanones from Delisea pulchra inhibit acylated homoserine
- 274 -
lactone (AHL)-mediated gene expression by displacing the AHL signal from its receptor
protein. Microbiology 1999, 145, 283-291.
(214) Hentzer, M.; Givskov, M. Pharmacological inhibition of quorum sensing for the treatment
of chronic bacterial infections. J. Clin. Invest. 2003, 112, 1300-1307.
(215) Kjelleberg, S. S., P.; Givskov, M.; Gram, L.; Manefield, M.; de Nys R. Do marine natural
products interfere with prokaryotic AHL regulatory systems?, Aquat. Microb. Ecol. 1997,
13, 85-93.
(216) Ren, D.; Bedzyk, L. A.; Ye, R. W.; Thomas, S. M.; Wood, T. K. Differential gene
expression shows natural brominated furanones interfere with the autoinducer-2 bacterial
signaling system of Escherichia coli. Biotechnol. Bioeng. 2004, 88, 630-642.
(217) Trost, B. M.; Ferreira, E. M.; Gutierrez, A. C. Ruthenium- and Palladium-Catalyzed Enyne
Cycloisomerizations: Differentially Stereoselective Syntheses of Bicyclic Structures. J. Am.
Chem. Soc. 2008, 130, 16176-16177.
(218) Holloway, C. A.; Muratore, M. E.; Storer, R. l.; Dixon, D. J. Direct Enantioselective
Bronsted Acid Catalyzed N-Acyliminium Cyclization Cascades of Tryptamines and
Ketoacids. Org. Lett. 2010, 12, 4720-4723.
(219) Sorg, A.; Brueckner, R. Total synthesis of xerulinic acid. Angew. Chem., Int. Ed. 2004, 43,
4523-4526.
(220) Sorg, A.; Siegel, K.; Brueckner, R. Stereoselective syntheses of dihydroxerulin and
xerulinic acid, anti-hypocholesterolemic dyes from the fungus Xerula melanotricha. Chem.-
-Eur. J. 2005, 11, 1610-1624.
(221) Sorg, A.; Siegel, K.; Brueckner, R. A novel access to γ-alkylidenebutenolides: Sequential
Stille couplings of dibromomethylenebutenolides. Synlett 2004, 321-325.

- 275 -
(222) Heydorn, A.; Nielsen, A. T.; Hentzer, M.; Sternberg, C.; Givskov, M.; Ersboll, B. K.;
Molin, S. Quantification of biofilm structures by the novel computer program COMSTAT.
Microbiology 2000, 146, 2395-2407.
(223) Campana, S.; Taccetti, G.; Ravenni, N.; Masi, I.; Audino, S.; Sisi, B.; Repetto, T.; Doring,
G.; de Martino, M. Molecular epidemiology of Pseudomonas aeruginosa, Burkholderia
cepacia complex and methicillin-resistant Staphylococcus aureus in a cystic fibrosis center.
J. Cystic Fibrosis 2004, 3, 159-163.
(224) Van Delden, C.; Iglewski, B. H. Cell-to-cell signaling and Pseudomonas aeruginosa
infections. Emerg. Infect. Dis. 1998, 4, 551-560.
(225) Afessa, B.; Green, B. Bacterial pneumonia in hospitalized patients with HIV infection: the
Pulmonary Complications, ICU Support, and Prognostic Factors of Hospitalized Patients
with HIV (PIP) Study. Chest 2000, 117, 1017-1022.
(226) Burns, J. L.; Gibson, R. L.; McNamara, S.; Yim, D.; Emerson, J.; Rosenfeld, M.; Hiatt, P.;
McCoy, K.; Castile, R.; Smith, A. L.; Ramsey, B. W. Longitudinal assessment of
Pseudomonas aeruginosa in young children with cystic fibrosis. The Journal of infectious
diseases 2001, 183, 444-452.
(227) Garo, E.; Eldridge, G. R.; Goering, M. G.; Pulcini, E. D.; Hamilton, M. A.; Costerton, J.
W.; James, G. A. Asiatic acid and corosolic acid enhance the susceptibility of
Pseudomonas aeruginosa biofilms to tobramycin. Antimicrob. Agents Chemother. 2007, 51,
1813-1817.
(228) Bloemberg, G. V.; O'Toole, G. A.; Lugtenberg, B. J. J.; Kolter, R. Green fluorescent
protein as a marker for Pseudomonas spp. Appl. Environ. Microbiol. 1997, 63, 4543-4551.

- 276 -
(229) Wright, A. D.; de Nys, R.; Angerhofer, C. K.; Pezzuto, J. M.; Gurrath, M. Biological
activities and 3D QSAR studies of a series of Delisea pulchra (cf. fimbriata) derived natural
products. J. Nat. Prod. 2006, 69, 1180-1187.
(230) Kuehl, R.; Al-Bataineh, S.; Gordon, O.; Luginbuehl, R.; Otto, M.; Textor, M.; Landmann,
R. Furanone at subinhibitory concentrations enhances staphylococcal biofilm formation by
luxS repression. Antimicrob. Agents Chemother. 2009, 53, 4159-4166.
(231) Karney, W.; Holmes, K. K.; Turck, M. Comparison of five aminocyclitol antibiotics in
vitro against Enterobacteriaceae and Pseudomonas. Antimicrob. Agents Chemother. 1973,
3, 338-342.
(232) Brackman, G.; Cos, P.; Maes, L.; Nelis, H. J.; Coenye, T. Quorum sensing inhibitors
increase the susceptibility of bacterial biofilms to antibiotics in vitro and in vivo.
Antimicrob. Agents Chemother. 2011, 55, 2655-2661.
(233) VanDevanter, D. R.; Geller, D. E. Tobramycin administered by the TOBI® Podhaler® for
persons with cystic fibrosis: a review. Medical Devices: Evidence and Research 2011, 4,
179-188.
(234) Moker, N.; Dean, C. R.; Tao, J. Pseudomonas aeruginosa increases formation of
multidrug-tolerant persister cells in response to quorum sensing signaling molecules. J.
Bacteriol. 2010, 192, 1946-1955.
(235) Lewis, K. Persister cells. Annu. Rev. Microbiol. 2010, 64, 357-372.
(236) Pesci, E.; Pearson, J. P.; Seed, P. C.; Iglewski, B. H. Regulation of las and rhl quorum
sensing in Pseudomonas aeruginosa. J. Bacteriol. 1997, 179, 3127-3132.

- 277 -
(237) De Kievit, T. R.; Gillis, R.; Marx, S.; Brown, C.; Iglewski, B. H. Quorum-sensing genes in
Pseudomonas aeruginosa biofilms: their role and expression patterns. Appl. Environ.
Microbiol. 2001, 67, 1865-1873.
(238) Gambello, M. J.; Iglewski, B. H. Cloning and characterization of the Pseudomonas
aeruginosa lasR gene, a transcriptional activator of elastase expression. Journal of
Bacteriology 1991, 173, 3000-3009.
(239) Tamura, Y.; Suzuki, S.; Kijima, M.; Takahashi, T.; Nakamura, M. Effect of proteolytic
enzyme on experimental infection of mice with Pseudomonas aeruginosa. The Journal of
veterinary medical science / the Japanese Society of Veterinary Science 1992, 54, 597-599.
(240) Kon, Y.; Tsukada, H.; Hasegawa, T.; Igarashi, K.; Wada, K.; Suzuki, E.; Arakawa, M.;
Gejyo, F. The role of Pseudomonas aeruginosa elastase as a potent inflammatory factor in
a rat air pouch inflammation model. FEMS Immunol. Med. Microbiol. 1999, 25, 313-321.
(241) Kamath, S.; Kapatral, V.; Chakrabarty, A. M. Cellular function of elastase in
Pseudomonas aeruginosa: role in the cleavage of nucleoside diphosphate kinase and in
alginate synthesis. Mol. Microbiol. 1998, 30, 933-941.
(242) Travis, J.; Potempa, J. Bacterial proteinases as targets for the development of second-
generation antibiotics. Biochim. Biophys. Acta 2000, 1477, 35-50.
(243) Rasmussen, T. B.; Givskov, M. Quorum sensing inhibitors: A bargain of effects.
Microbiology 2006, 152, 895-904.
(244) Hawgood, S.; Ochs, M.; Jung, A.; Akiyama, J.; Allen, L.; Brown, C.; Edmondson, J.;
Levitt, S.; Carlson, E.; Gillespie Anne, M.; Villar, A.; Epstein Charles, J.; Poulain Francis,
R. Sequential targeted deficiency of SP-A and -D leads to progressive alveolar

- 278 -
lipoproteinosis and emphysema. Am. J. Physiol. Lung Cell. Mol. Physiol. 2002, 283,
L1002-1010.
(245) Smith, A. W. Bacterial resistance to antibiotics. Hugo Russell's Pharm. Microbiol. (8th
Ed.) 2011, 217-229.
(246) Neu, H. C. The crisis in antibiotic resistance. Science 1992, 257, 1064-1072.
(247) Lowery, C. A.; Abe, T.; Park, J.; Eubanks, L. M.; Sawada, D.; Kaufmann, G. F.; Janda, K.
D. Revisiting AI-2 Quorum Sensing Inhibitors: Direct Comparison of Alkyl-DPD
Analogues and a Natural Product Fimbrolide. J. Am. Chem. Soc. 2009, 131, 15584-15585.
(248) Ishiyama, M.; Tominaga, H.; Shiga, M.; Sasamoto, K.; Ohkura, Y.; Ueno, K. A combined
assay of cell viability and in vitro cytotoxicity with a highly water-soluble tetrazolium salt,
neutral red and crystal violet. Biol. Pharm. Bull. 1996, 19, 1518-1520.
(249) De Kievit, T. R.; Gillis, R.; Marx, S.; Brown, C.; Iglewski, B. H. Quorum-sensing genes in
Pseudomonas aeruginosa biofilms: their role and expression patterns. Appl. Environ.
Microbiol. 2001, 67, 1865-1873.
(250) Parkinson, J. S.; Houts, S. E. Isolation and behavior of Escherichia coli deletion mutants
lacking chemotaxis functions. J. Bacteriol. 1982, 151, 106-113.
(251) Bevis, B. J.; Glick, B. S. Rapidly maturing variants of the Discosoma red fluorescent
protein (DsRed). Nat. Biotechnol. 2002, 20, 83-87.
(252) Hou, S.; Liu, Z.; Young, A. W.; Mark, S. L.; Kallenbach, N. R.; Ren, D. Effects of Trp-
and Arg-containing antimicrobial-peptide structure on inhibition of Escherichia coli
planktonic growth and biofilm formation. Appl. Environ. Microbiol. 2010, 76, 1967-1974.
- 279 -
(253) Calfee, M. W.; Coleman, J. P.; Pesci, E. C. Interference with Pseudomonas quinolone
signal synthesis inhibits virulence factor expression by Pseudomonas aeruginosa. Proc.
Natl. Acad. Sci. U. S. A. 2001, 98, 11633-11637.
(254) Churchill, M. E. A.; Chen, L. Structural basis of acyl-homoserine lactone-dependent
signaling. Chem. Rev. 2011, 111, 68-85.
(255) Thiel, V.; Kunze, B.; Verma, P.; Wagner-Doebler, I.; Schulz, S. New Structural Variants
of Homoserine Lactones in Bacteria. ChemBioChem 2009, 10, 1861-1868.
(256) Eberhard, A.; Widrig, C. A.; McBath, P.; Schineller, J. B. Analogs of the autoinducer of
bioluminescence in Vibrio fischeri. Arch. Microbiol. 1986, 146, 35-40.
(257) Schaefer, A. L.; Hanzelka, B. L.; Eberhard, A.; Greenberg, E. P. Quorum sensing in Vibrio
fischeri: probing autoinducer-LuxR interactions with autoinducer analogs. J. Bacteriol.
1996, 178, 2897-2901.
(258) Passador, L.; Tucker, K. D.; Guertin, K. R.; Journet, M. P.; Kende, A. S.; Iglewski, B. H.
Functional analysis of the Pseudomonas aeruginosa autoinducer PAI. J. Bacteriol. 1996,
178, 5995-6000.
(259) Reverchon, S.; Chantegrel, B.; Deshayes, C.; Doutheau, A.; Cotte-Pattat, N. New synthetic
analogues of N-acyl homoserine lactones as agonists or antagonists of transcriptional
regulators involved in bacterial quorum sensing. Bioorg. Med. Chem. Lett. 2002, 12, 1153-
1157.
(260) Castang, S.; Chantegrel, B.; Deshayes, C.; Dolmazon, R.; Gouet, P.; Haser, R.; Reverchon,
S.; Nasser, W.; Hugouvieux-Cotte-Pattat, N.; Doutheau, A. N-Sulfonyl homoserine
lactones as antagonists of bacterial quorum sensing. Bioorg. Med. Chem. Lett. 2004, 14,
5145-5149.

- 280 -
(261) Frezza, M.; Castang, S.; Estephane, J.; Soulere, L.; Deshayes, C.; Chantegrel, B.; Nasser,
W.; Queneau, Y.; Reverchon, S.; Doutheau, A. Synthesis and biological evaluation of
homoserine lactone derived ureas as antagonists of bacterial quorum sensing. Bioorg. Med.
Chem. 2006, 14, 4781-4791.
(262) Whitehead, N. A.; Barnard, A. M. L.; Slater, H.; Simpson, N. J. L.; Salmond, G. P. C.
Quorum-sensing in Gram-negative bacteria. FEMS Microbiol. Rev. 2001, 25, 365-404.
(263) Geske, G. D.; O'Neill, J. C.; Blackwell, H. E. Expanding dialogues: From natural
autoinducers to non-natural analogs that modulate quorum sensing in Gram-negative
bacteria. Chem. Soc. Rev. 2008, 37, 1432-1447.
(264) Geske, G. D.; O'Neill, J. C.; Blackwell, H. E. N-Phenylacetanoyl-L-homoserine lactones
can strongly antagonize or superagonize quorum sensing in Vibrio fischeri. ACS Chem.
Biol. 2007, 2, 315-319.
(265) Wang, Y.-J.; Leadbetter, J. R. Rapid acyl-homoserine lactone quorum signal
biodegradation in diverse soils. Appl. Environ. Microbiol. 2005, 71, 1291-1299.
(266) Narasimhan, S. K. Structured unnatural molecules: Inducing molecular folding, enabling
matured mammalian cell adhesion and inhibiting bacterial biofilm formation, Ph. D.
Dissertation, Syracuse University, Syracuse, NY, 2010.
(267) Lindsay, A.; Ahmer, B. M. M. Effect of sdiA on biosensors of N-acylhomoserine lactones.
J. Bacteriol. 2005, 187, 5054-5058.
(268) Van Houdt, R.; Aertsen, A.; Moons, P.; Vanoirbeek, K.; Michiels, C. W. N-acyl-L-
homoserine lactone signal interception by Escherichia coli. FEMS Microbiol. Lett. 2006,
256, 83-89.

- 281 -
(269) Lupp, C.; Urbanowski, M.; Greenberg, E. P.; Ruby, E. G. The Vibrio fischeri quorum-
sensing systems ain and lux sequentially induce luminescence gene expression and are
important for persistence in the squid host. Mol. Microbiol. 2003, 50, 319-331.

- 282 -
CURRICULUM VITAE
Name of Author: Sijie Yang
Place of Birth: Wuhan, Hubei, China
Date of Birth: November 13, 1983
Education
Ph. D. in Chemistry, Department of Chemistry, Syracuse University, Syracuse, NY (Degree
expected May, 2013)
M. Phil. in Chemistry, Department of Chemistry, Syracuse University, Syracuse, NY. 2008
B. S. in Chemistry, Department of Chemistry, Wuhan University, Wuhan, Hubei, China 2005
Awards
Outstanding Teaching Assistant: William D. Johnson Award, Syracuse University, 2009.
People’s Scholarship, Wuhan University, 2002-2004
Teaching Experience
Teaching assistant, Department of Chemistry, Syracuse University, Syracuse NY, 2006-2011.
Recitation Instructor of Organic Chemistry I (Fall 2010)
- Developed question-centered lessons with worksheet to create student involvement.
- Aided lecture professor in proctoring and grading exams.
Laboratory Instructor of Organic Chemistry I and II (Spring 2007 – Spring 2010)
- Assisted students during laboratory experiments, demonstrating laboratory techniques
and developing their problem-solving skills.
- Evaluated students’ success by grading laboratory reports.
Laboratory Instructor of General Chemistry I (Fall 2006)
- Assisted students during laboratory experiments, demonstrating laboratory techniques
and developing their problem-solving skills.
- Evaluated students’ success by grading laboratory reports.
Research Experience

- 283 -
Research assistant, Department of Chemistry, Syracuse University, Syracuse NY, 2007-2013.
Publications
Simon, K. A., Sejwal, P., Falcone, E. R., Burton, E. A., Yang, S., Prashar, D.,
Bandyopadhyay, D., Narasimhan, S. K., Varghese, N., Gobalasingham, N. S., Reese, J. B.,
and Luk, Y.-Y. Noncovalent polymerization and assembly in water promoted by
thermodynamic incompatibility. J. Phys. Chem. B, 2010, 114, 10357–10367.
Yang, S.; Wang, B.; Cui, D.; Kerwood, D.; Wilkens, S.; Han, J.; and Luk, Y.-Y.
Stereochemical Control of Nonamphiphilic Lyotropic Liquid Crystals: Interactions between
Assemblies Separated by Six Nanometers of Aqueous Solvents. In preparation.
Yang, S.; Abdel-Razek, O. A.; Cheng, F.; Bandyopadhyay, D.; Sheth, G.; Wang, G.; and
Luk, Y.-Y. Bicyclic Brominated Furanones: A new Class of Biofilm Inhibitors with Reduced
Toxicity and Improved Bacterial Clearance in vivo. In preparation.
Presentations
Yang, S., Cheng, Fei., and Luk, Y.-Y. Controlling bacterial behavior by bicyclic brominated
furanones with reduced toxicity. 243rd ACS National Meeting & Exposition, San Diego, CA,
2012.
Yang, S., Bandyopadhyay, D., Kerwood, D., Wang, B., and Luk, Y.-Y. Direct evidences and
structural characterizations of the thread assembly formed by nonamphiphilic lyotropic liquid
crystals. 243rd ACS National Meeting & Exposition, San Diego, CA, 2012.
Yang, S., Cui, D., Kerwood, D., Wilkens, S., Simon, K., Han, J., and Luk, Y.-Y.
Stereochemistry of mesogens controls the formation of nonamphiphilic lyotropic Liquid
crystals. 243rd ACS National Meeting & Exposition, San Diego, CA, 2012.
Yang, S., Totah, N. I. Total synthesis of neoliacinic acid: approaches toward the construction
of the bicyclic core. Alliance for Graduate Education and the Professoriate. 2nd Annual
Academic Excellence Symposium. Syracuse University, Syracuse, NY, 2008.