Separate and combined effects of 21-day bed rest and hypoxic confinement on body composition
15
1 3 Eur J Appl Physiol DOI 10.1007/s00421-014-2963-1 ORIGINAL ARTICLE Separate and combined effects of 21‑day bed rest and hypoxic confinement on body composition Tadej Debevec · Tarsi C. Bali · Elizabeth J. Simpson · Ian A. Macdonald · Ola Eiken · Igor B. Mekjavic Received: 23 May 2014 / Accepted: 18 July 2014 © Springer-Verlag Berlin Heidelberg 2014 energy intakes were estimated individually using the Har- ris–Benedict equation taking into account whether the sub- jects were bedridden or ambulatory. Body mass and water balance were assessed throughout the campaigns. Whole body and regional body composition was determined before and after the campaigns using dual-energy X-ray absorptiometry. Before and during the campaigns, indirect calorimetry and visual analogue scores were employed to assess the resting energy expenditure (REE) and perceived appetite sensations, respectively. Results Energy intakes were lower than targeted in all campaigns (NBR: −5 %; HAMB: −14 %; HBR: −6 %; P < 0.01). Body mass significantly decreased following all campaigns (NBR: −3 %; HAMB: −4 %; HBR: −5 %; P < 0.01). While fat mass was not significantly altered, the whole body fat free mass was reduced (NBR: −4 %; HAMB: −5 %; HBR: −5 %; P < 0.01), secondary to lower limb fat-free mass reduction. Water balance was compara- ble between the campaigns. No changes were observed in REE and perceived appetite. Conclusions Exposure to simulated altitude of ~4,000 m does not seem to worsen the whole body mass and fat-free mass reductions or alter resting energy expenditure and appetite during a 21-day simulated microgravity. Keywords Normobaric hypoxia · Simulated microgravity · Fat-free mass · Energy expenditure · Appetite Abbreviations AMS Acute mountain sickness BMI Body mass index DXA Dual-energy X-ray absorptiometry FFM Fat-free mass F i O 2 Fraction of inspired O 2 Abstract Purpose This study tested the hypothesis that hypoxia exacerbates reductions in body mass observed during unloading. Methods To discern the separate and combined effects of simulated microgravity and hypoxia, 11 healthy males underwent three 21-day campaigns in a coun- terbalanced fashion: (1) normoxic bed rest (NBR; F i O 2 = 0.209; P i O 2 = 133.1 ± 0.3); (2) hypoxic ambu- latory confinement (HAMB; F i O 2 = 0.141 ± 0.004; P i O 2 = 90.0 ± 0.4; ~4,000 m); and (3) hypoxic bed rest (HBR; F i O 2 = 0.141 ± 0.004; P i O 2 = 90.0 ± 0.4). The same dietary menu was applied in all campaigns. Targeted Communicated by Klaas R Westerterp. Electronic supplementary material The online version of this article (doi:10.1007/s00421-014-2963-1) contains supplementary material, which is available to authorized users. T. Debevec (*) · T. C. Bali · I. B. Mekjavic Department of Automation, Biocybernetics and Robotics, Jozef Stefan Institute, Jamova 39, 1000 Ljubljana, Slovenia e-mail: [email protected] T. Debevec UCT/MRC Research Unit for Exercise Science and Sports Medicine, Department of Human Biology, University of Cape Town, Cape Town, South Africa E. J. Simpson · I. A. Macdonald MRC/Arthritis Research UK Centre for Musculoskeletal Ageing Research, Queen’s Medical Centre, School of Life Sciences, University of Nottingham Medical School, Nottingham, UK O. Eiken Department of Environmental Physiology, Swedish Aerospace Physiology Centre, Royal Institute of Technology, Stockholm, Sweden
-
Upload
independent -
Category
Documents
-
view
3 -
download
0
Transcript of Separate and combined effects of 21-day bed rest and hypoxic confinement on body composition

1 3
Eur J Appl PhysiolDOI 10.1007/s00421-014-2963-1
OrIgInAl ArtIclE
Separate and combined effects of 21‑day bed rest and hypoxic confinement on body composition
Tadej Debevec · Tarsi C. Bali · Elizabeth J. Simpson · Ian A. Macdonald · Ola Eiken · Igor B. Mekjavic
received: 23 May 2014 / Accepted: 18 July 2014 © Springer-Verlag Berlin Heidelberg 2014
energy intakes were estimated individually using the Har-ris–Benedict equation taking into account whether the sub-jects were bedridden or ambulatory. Body mass and water balance were assessed throughout the campaigns. Whole body and regional body composition was determined before and after the campaigns using dual-energy X-ray absorptiometry. Before and during the campaigns, indirect calorimetry and visual analogue scores were employed to assess the resting energy expenditure (rEE) and perceived appetite sensations, respectively.Results Energy intakes were lower than targeted in all campaigns (nBr: −5 %; HAMB: −14 %; HBr: −6 %; P < 0.01). Body mass significantly decreased following all campaigns (nBr: −3 %; HAMB: −4 %; HBr: −5 %; P < 0.01). While fat mass was not significantly altered, the whole body fat free mass was reduced (nBr: −4 %; HAMB: −5 %; HBr: −5 %; P < 0.01), secondary to lower limb fat-free mass reduction. Water balance was compara-ble between the campaigns. no changes were observed in rEE and perceived appetite.Conclusions Exposure to simulated altitude of ~4,000 m does not seem to worsen the whole body mass and fat-free mass reductions or alter resting energy expenditure and appetite during a 21-day simulated microgravity.
Keywords normobaric hypoxia · Simulated microgravity · Fat-free mass · Energy expenditure · Appetite
AbbreviationsAMS Acute mountain sicknessBMI Body mass indexDXA Dual-energy X-ray absorptiometryFFM Fat-free massFiO2 Fraction of inspired O2
Abstract Purpose this study tested the hypothesis that hypoxia exacerbates reductions in body mass observed during unloading.Methods to discern the separate and combined effects of simulated microgravity and hypoxia, 11 healthy males underwent three 21-day campaigns in a coun-terbalanced fashion: (1) normoxic bed rest (nBr; FiO2 = 0.209; PiO2 = 133.1 ± 0.3); (2) hypoxic ambu-latory confinement (HAMB; FiO2 = 0.141 ± 0.004; PiO2 = 90.0 ± 0.4; ~4,000 m); and (3) hypoxic bed rest (HBr; FiO2 = 0.141 ± 0.004; PiO2 = 90.0 ± 0.4). the same dietary menu was applied in all campaigns. targeted
communicated by Klaas r Westerterp.
Electronic supplementary material the online version of this article (doi:10.1007/s00421-014-2963-1) contains supplementary material, which is available to authorized users.
t. Debevec (*) · t. c. Bali · I. B. Mekjavic Department of Automation, Biocybernetics and robotics, Jozef Stefan Institute, Jamova 39, 1000 ljubljana, Sloveniae-mail: [email protected]
t. Debevec Uct/Mrc research Unit for Exercise Science and Sports Medicine, Department of Human Biology, University of cape town, cape town, South Africa
E. J. Simpson · I. A. Macdonald Mrc/Arthritis research UK centre for Musculoskeletal Ageing research, Queen’s Medical centre, School of life Sciences, University of nottingham Medical School, nottingham, UK
O. Eiken Department of Environmental Physiology, Swedish Aerospace Physiology centre, royal Institute of technology, Stockholm, Sweden
Eur J Appl Physiol
1 3
HAMB Hypoxic ambulatory confinementHBr Hypoxic bed restHr Heart ratellS lake louise scorenBr normoxic bed restPAl Physical activity level factorPFc Prospective food consumptionPiO2 Partial pressure of inspired O2
PPO Peak power outputrEE resting energy expenditurerEr respiratory exchange ratioSpO2 capillary oxyhemoglobin saturationVAS Visual analogue scoreV̇E Minute ventilation
Introduction
Spaceflight-induced unloading triggers significant alterations in nutritional status (Smith et al. 2005; Smith and Zwart 2008) and results in decreased body mass, predominantly due to reduced postural muscle volume (leBlanc et al. 2000; tesch et al. 2005). During prolonged space explorations, proper die-tary support and mitigation of body composition changes are crucial to maintain the operational capacity and well-being of the astronauts (lane and Feeback 2002). Future long-term space explorations will undoubtedly assess the potential for a permanent residence on the Moon or Mars. to minimize the risk of decompression sickness of astronauts preparing for sorties on the Moon or Mars surface, the envisaged habitats will be hypobaric and hypoxic (David et al. 2006).
Similarly to space travel, high altitude sojourns are often associated with substantial weight loss (Pugh and Ward 1956; tschop and Morrison 2001; Quintero et al. 2010). these altitude-related whole body mass reductions were attributed to both muscle mass (Boyer and Blume 1984) and fat tissue losses (Westerterp-Plantenga et al. 1999; reynolds et al. 1999). While the underlying mechanisms of “altitude anorexia” are not completely understood, changes in energy expenditure and dietary intake as well as appetite reduction might be among the main potential factors (Westerterp-Plan-tenga et al. 1999; Kayser and Verges 2013). High altitude sojourns can result in increased energy expenditure (reyn-olds et al. 1999). In field settings, it is, however, difficult to disentangle the effects of energy intake and activity pattern from the influence of environmental factors on resting and total energy expenditure (Westerterp and Kayser 2006). While controlled laboratory studies indicate that hypoxia per se decreases resting energy expenditure (Westerterp et al. 2000; Oltmanns et al. 2006), evidence from well-con-trolled field studies show that rEE might increase as a result of prolonged (≥1 week) high-altitude exposures (≥3,500 m) (Butterfield et al. 1992; Mawson et al. 2000; lippl et al.
2010). reductions in appetite are also often reported dur-ing and following high altitude sojourns. Although initially linked to acute mountain sickness (AMS) and lack of palat-able food, the persistence of decreased appetite after AMS symptoms abate (tschop and Morrison 2001), and the appe-tite reductions observed in laboratory settings with palatable food readily available (rose et al. 1988; Wasse et al. 2012; Westerterp-Plantenga et al. 1999) imply that hypoxia per se might reduce appetite. Based on the above, we reasoned that the addition of hypoxia to reduced gravity, as envisaged during the Moon or Mars habitation, might affect nutritional status, modulate body composition and potentially compro-mise the astronauts’ well-being.
Studies investigating combined effects of unloading and hypoxia are scarce (Stevens et al. 1966; loeppky et al. 1993; Debevec et al. 2014). While Stevens et al. (1966) reported that participants were mildly anorectic and needed encouragement to maintain their food intake during a 4-week hypoxic bed rest, loeppky et al. (1993) observed more pronounced changes in water balance during a 7-day bed rest in hypoxia than normoxia. the lack of significant body mass changes in both aforementioned studies could be attributed to the shortage of proper nutritional con-trol and the ad libitum feeding strategy. Our recent study (Debevec et al. 2014), also failed to identify any specific effect of hypoxia on body composition following a 10-day bed rest. We speculated that the duration of confinement was insufficient to induce significant body composition alterations as these are typically reported following alti-tude exposures lasting ≥3 weeks (Boyer and Blume 1984; tschop and Morrison 2001; Quintero et al. 2010).
the aims of this study were to determine: (1) the effects of hypoxia and unloading on body composition; (2) whether adding hypoxia to unloading alters water balance, rEE or modulates appetite and (3) if the targeted intake levels and macronutrient composition used would be adequate to main-tain a stable body mass. the participants underwent three 21-day confinements in a cross-over designed and counter-balanced manner: (1) normoxic bed rest to determine the effects of unloading per se; (2) hypoxic ambulatory con-finement to determine the effect of hypoxia per se and (3) hypoxic bed rest to determine the combined effects of both factors. Our hypothesis was that hypoxia would exacerbate reductions in body mass observed during unloading through changes in energy expenditure and appetite reduction. We additionally hypothesized that the addition of hypoxia to unloading would significantly alter water balance.
Methods
the data presented in this paper were collected as part of a larger research programme investigating the physiological
Eur J Appl Physiol
1 3
and psychological effects of simulated planetary habitation on healthy humans (PlanHab: Planetary Habitat simulation study). the study protocol was approved by the national committee for Medical Ethics at the Ministry of Health of the republic of Slovenia. All experimental procedures were conducted according to the European Space Agency recom-mendations for bed rest protocols (Standardization of bed rest study conditions 1.5, August 2009) and conformed to the principles of the Declaration of Helsinki.
Participants
A total of 65 healthy males were initially screened for participation in the study. Besides the inclusion/exclusion criteria outlined in the standardization of bed rest condi-tions, individuals recently (<2 months) exposed to altitudes above 2,000 m were also ineligible to participate. Follow-ing preliminary testing 14 participants were selected and gave written informed consent after receiving detailed information regarding the study protocol and all experi-mental procedures. two participants did not return for the last campaign due to personal reasons and one participant had to be withdrawn from the study during the last cam-paign as a result of gastrointestinal health problems. Ulti-mately, 11 participants finished all three campaigns and only their data are reported in the paper. All were healthy, near sea level residents (<500 m) with the following base-line characteristics: age = 27 ± 6 years (mean ± SD); body mass = 76.7 ± 11.8 kg; stature = 179 ± 3 cm; BMI = 23.7 ± 3.0 kg m−2; body fat = 21 ± 5 %; maximal oxygen uptake = 44.3 ± 6.1 ml kg−1 min−1.
Study design
this prospective trial aimed to discern the separate and combined effects of simulated microgravity and hypoxia. the participants underwent three experimental campaigns in a counterbalanced fashion: (1) normobaric normoxic bed rest (nBr; fraction of inspired O2 (FiO2) = 0.209; PiO2 = 133.1 ± 0.3); (2) normobaric hypoxic ambu-latory confinement (HAMB; FiO2 = 0.141 ± 0.004; PiO2 = 90.0 ± 0.4; ~4,000 m simulated altitude); and (3) normobaric hypoxic bed rest (HBr; FiO2 = 0.141 ± 0.004; PiO2 = 90.0 ± 0.4; ~4,000 m simulated altitude). the experimental campaigns were conducted at the Olym-pic Sport centre Planica, Slovenia (situated at an altitude of 940 m). the participants entered each campaign in a sequential and fixed order with two participants entering each day. campaigns lasted 32 days for each individual participant and had three distinct phases. First, the initial testing phase (Pre) that comprised the first 7 days upon arrival to the facility. this phase allowed the participants to acclimate to the facility, diet and circadian cycles. All
baseline (Pre) measures were obtained during this period. Second was the 21-day confinement phase (day 1–day 21) during which the participants were exposed to their designated condition (nBr, HAMB and HBr). this was followed by a 4-day recovery phase that enabled the researchers to obtain the post-confinement measurements (Post) and allowed for cautious re-ambulation of the par-ticipants. Additional tests were also performed 14 days after the end of each confinement period (rec). to enable sufficient physiological and psychological recovery of the participants, a 4-month wash-out period was implemented between the campaigns.
Bed rest and hypoxic procedures
the environmental conditions within the hypoxic facil-ity were carefully controlled and remained stable through-out all experimental campaigns (ambient tempera-ture = 24.4 ± 0.7 °c; relative humidity = 53.5 ± 5.4 % and ambient pressure = 684 ± 4 mm Hg). the participants were accommodated in rooms with two single beds (i.e., two participants per room). to standardize the circadian rhythm, the participants were awakened daily at 7:00 am and room lights were turned off at 11:00 pm. napping was not allowed during the day hours. Morning resting heart rate (Hr) and capillary oxyhemoglobin saturation (SpO2) were measured daily using short-range telemetry (iBody, Wahoo Fitness, Atlanta, USA) and finger oximetry (3100 WristOx, nonin Medicals, Minnesota, USA), respectively. to assess the potential presence, as well as severity, of AMS the par-ticipants filled out the self-assessment part of the lake lou-ise AMS questionnaire every evening at 08:00 pm through-out the confinement period (roach et al. 1993). the lake louise score (llS: 0–15) was subsequently calculated by summing the values of the individual questionnaire items. Both of the following criteria had to be fulfilled to diagnose AMS: (1) llS ≥3 and (2) presence of headache.
During the nBr and HBr campaigns, the participants were confined to strict horizontal bed rest, a valid ground-based model to simulate microgravity-induced metabolic and cardiovascular alterations. All daily activities (i.e., reading, watching television, showering, lavatory) were carried out in the horizontal position. the participants were allowed to use one pillow for head support. no physi-cal activity, apart from changing positions from supine, prone and lateral, was permitted during the bed rest con-finement phase. compliance to the bed rest protocol was ensured using continuous closed-circuit television monitor-ing as well as permanent medical staff supervision. to ease the neck- or backache that often occurs during the initial 2–3 days of the bed rest the participants were provided, on request, with mild analgesic (paracetamol) and/or passive stretching performed by a certified physiotherapist.

Eur J Appl Physiol
1 3
During the HAMB confinement the participants were encouraged to engage in their habitual routines and allowed to move freely in the common hypoxic area (110 m2 sur-face). throughout the HAMB confinement the participants also performed low-intensity exercise sessions to mimic their habitual physical activity. two 30-min sessions were performed daily, one in the morning and one in the after-noon. the exercise mode (stepping, cycling or dancing) was rotated to avoid monotony. During all exercise sessions, short-range telemetry (iBody, Wahoo Fitness, Atlanta, USA) and finger oximetry (3100 WristOx, nonin Medicals, Minnesota, USA) were employed to ensure individual’s Hr was within the targeted values (123 ± 4 beats min−1) and monitor the SpO2 levels, respectively. Assessment of the targeted exercise intensity, and thus energy expendi-ture levels, was based on the daily physical activity ques-tionnaires filled out by the participants before the study. On average the prescribed exercise aimed to induce a Hr corresponding to that achieved at 50 % of the peak power output (PPO), determined during a hypoxic graded exer-cise test. the graded test was performed before the HAMB confinement on a cycle ergometer under hypoxic condition (FiO2 = 0.144) using 25 W min−1 workload increments until task failure (inability to maintain cycling cadence >60 rpm). PPO was calculated according to the following formula: PPO = Wcomp + (t·(60 × 30)−1) (W).
Wcompl = last completed workload; t = seconds during the final uncompleted workload.
the normobaric hypoxic environment was provided and maintained using a vacuum pressure swing adsorp-tion system (b-cat, tiel, the netherlands) that delivered the O2-depleted gas to the designated rooms and common hypoxic area. the ambient air in each room was sampled and analyzed for O2 and cO2 content at 15-min intervals. Prior to the analysis of the air samples, the O2 and cO2 analyzers were automatically calibrated using precision calibration gases (Messer, ljubljana, Slovenia). Immediate adjustments were made in the event of a more than 0.5 % variation in the level of O2. the cO2 level in the confine-ment area did not exceed 0.45 % at any time, with the aver-age concentration of 0.23 ± 0.07 % during all confinement periods. the participants had portable ambient O2 concen-tration analyzers (rae PgM-1100, california, USA) in close proximity at all times during the hypoxic campaigns. the analyzers activated a safety audible alarm if the O2 level decreased below the pre-set level.
Diet
the participants received an individually tailored, strictly controlled and standardized diet throughout all three phases of each campaign. Individualized caloric require-ments were estimated using the modified Harris–Benedict
resting metabolic rate equation (Hasson et al. 2011) and subsequently multiplied by a physical activity level fac-tor (PAl) of 1.4 for the ambulatory (Pre phase, Post phase and HAMB confinement) and of 1.2 for the bed rest phases (nBr and HBr confinement). the targeted daily compo-sition for dietary fat intake was 30 % of the total energy intake, whereas protein intake was aimed at 1.2 g kg−1. Accordingly, the targeted baseline macronutrient compo-sition (expressed as a percentage of total dietary energy intake) was ~55 % of carbohydrates, ~30 % of fat and ~15 % of protein. the intake of sodium was targeted to be <3,500 mg day−1. the participants were encouraged to maintain their minimal daily fluid intake at 28.5 ml kg−1, but were allowed to drink water and unsweetened fruit tea ad libitum. they were supplemented with vitamin D3 (1,000 IU day−1) throughout all campaigns and were not allowed to eat or drink anything outside of the provided menu including alcohol or caffeine-containing beverages.
A 14-day menu (detailed in Online resource 1) was prepared before the first campaign and rotated throughout the campaign duration. the same daily menu was used during the subsequent two campaigns to ensure the partici-pants consumed identical meals on the same days of each respective campaign. the menu was designed using the web-based application Open Platform for clinical nutri-tion (OPKP, Jozef Stefan Institute, ljubljana, Slovenia). Five daily meals (breakfast, morning snack, lunch, after-noon snack and dinner) were always served at the same time of the day throughout the campaigns. the participants were encouraged to consume all the food provided. they could consume less than provided, but did not receive any additional food. Every effort was made to make the pro-vided food as palatable as possible. the dietary items used were based on the standard Slovenian diet. All meals were prepared in the facility kitchen by the staff of the Olym-pic Sport centre. Each food item was weighed on a preci-sion (±0.1 g) scale (tPt 6c, libela ElSI, celje, Slovenia) connected to a custom-developed, computer-based food recording and analysis system (Piki 2.0, Faculty of com-puter science, University of ljubljana, ljubljana, Slove-nia). In case of any leftovers, the unconsumed food items were re-weighed and the value was deducted from the ini-tial weight to provide the actual food intake. the Piki 2.0 system enabled real-time monitoring of the daily energy, macronutrient and fluid intake for each individual.
Water balance
Water balance was calculated daily during the initial and final 4 days of each confinement and every second day throughout the rest of the confinement period by deduct-ing the total daily water output from the total daily water input. the total daily water input comprised ad libitum
Eur J Appl Physiol
1 3
fluid intake, the daily food–water content and metabolic water production. the ad libitum water intakes were meas-ured daily throughout all campaigns. the daily food–water content was derived from the dietary intake analysis. Meta-bolic water production was estimated from the individual’s macronutrient intakes. It was assumed that for every 100 g of consumed carbohydrate, protein and fat, the resulting metabolic water production is 55, 41, and 107 g, respec-tively (Bossingham et al. 2005). the total daily water out-put included urinary output and insensible water loss. Urine was collected daily to obtain 24-h pools. Each urine collec-tion started at 07:00 am and was performed for the ensuing 24 h. Insensible water loss was estimated by assuming that for every 1,000 kcal of energy consumed, 430 ml of water is lost as a consequence of respiration and skin perspiration (Bossingham et al. 2005).
Body mass and composition
Body mass was assessed daily, immediately upon awaken-ing in the supine position using a calibrated, custom-made gurney incorporating load cells (Sigma 6c, libela ElSI, celje, Slovenia).
Whole body and regional body composition was determined before (Pre), immediately after (Post) and 14 days following each confinement period (rec) using a fan-beam dual-energy X-ray absorptiometer (DXA; Discovery W—QDr series, Hologic, Bedford USA). the device was calibrated on a daily bases prior to the first scanning according to the manufacturer’s instruc-tions. to optimize the reproducibility of the DXA measures, the participants were always scanned fasted and well rested. they maintained supine position on the DXA table throughout the scanning procedure. the hands were separated from the trunk and the legs were distanced using a standard ankle holder. two scans were performed at each testing period and the average of the duplicate measures was used for subsequent analysis. the same researcher analyzed all scans using the Hol-ogic APEX System Software (version 3.1.2) to deter-mine the whole body and regional values of fat free mass (FFM), fat mass and % fat mass.
the regions of interest used for the analysis were defined as detailed in Debevec et al. (2014). Briefly, the following regions were used: (1) upper arm (elbow joint center–gleno-humeral joint center; lower–upper boundary); (2) thigh (knee joint center–acetabulo-femoral joint center); and (3) lower leg: (ankle joint center–knee joint center). to calculate the android to gynoid fat ratio, used as an index of visceral to subcutaneous fat ratio (Snijder et al. 2002), the fat mass was also estimated from android: (pelvis cut–lumbar vertebrae) and gynoid: (middle of femur–acetabulo-femoral joint center) areas.
Indirect calorimetry
Indirect calorimetry was performed before (Pre) and after 16 days of each confinement (day 17) using a metabolic cart (Quark cPEt, cosmed, rome, Italy). the turbine flowmeter and gas analyzers were calibrated before each measurement using a 3-l syringe and two different ref-erence gas mixtures, respectively. the mask collection method (Vmask, 7500 series, Hans rudolph Inc., Shawnee, USA; 41 ml deadspace) was used for all measurements. the Pre tests were performed in normoxia, whereas Post tests were performed in normoxia during the nBr and hypoxia (FiO2 = 0.141 ± 0.004) during the HAMB and HBr campaigns. the measurements were always per-formed in the morning in a quiet and thermally temperate (ambient temperature = 22.9 ± 1.3 °c; relative humid-ity = 46.9 ± 5.8 %) laboratory with participants fasted and supine throughout the test. resting energy expenditure (rEE), respiratory exchange ratio (rEr) and minute venti-lation (V̇E) were recorded throughout the 15-min measure-ment. the first and last 3 min of each recording were dis-carded and the average of each variable during the middle 9 min of the measurement was used for subsequent analy-sis. the estimated coefficients of variation for rEE, rEr and V̇E were 12, 5 and 14 %, respectively.
Energy balance
Estimation of the average daily energy balance through-out the campaigns was performed by deducting the total daily energy expenditure from the total daily energy input (Elia et al. 2003). the total energy input included the daily dietary energy intake and energy provided by fat and lean tissue breakdown (estimated from the DXA Pre–Post measures). the employed caloric equivalents for changes in body composition were 1.1 and 9.5 kcal g−1 for lean and fat mass, respectively (Weir 1949). the total energy expenditure comprised of rEE, energy expenditure due to the thermic effect of food and estimated activity-related energy expenditure. We used the rEE values obtained on day 17 by indirect calorimetry as detailed above. the thermic effect of food was estimated at 10 % of the total energy intake (Elia et al. 2003). PAl values employed for the energy balance calculation were 1.2 for nBr and HBr and 1.4 PAl for HAMB. the actual PAl value estimations were also calculated for all campaigns by dividing the indi-viduals total energy intake minus the thermic effect of food by the measured rEE values.
ratings of perceived appetite
Subjective sensations of hunger, fullness and prospective food consumption (PFc) were obtained before (Pre) and

Eur J Appl Physiol
1 3
on day 1, day 7, day 14 and day 21 of the confinement from visual analogue scales (VAS). the VAS ratings were obtained through a custom-designed application on an iPad tablet (Apple, cupertino, USA). An electronic VAS collec-tion method using a handheld device has been validated previously (gibbons et al. 2011). the sensation ratings were obtained in the mornings with participants fasted. the scales were 100-mm digital lines, anchored to the left with ‘sensation not felt at all’ and to the right with ‘sensation felt the greatest’.
Statistical analysis
All analyses were performed using Statistica 12.0 (Statsoft, tulsa, USA). Data are expressed as mean ± SD. two-factor (campaign × time) repeated-measures AnOVA was used to define the differences in the average daily Hr, SpO2, llS, energy and fluid intake, body mass, water output, water and energy balance and appetite sensations as well as changes in body composition, rEE, V̇E and rEr assessed before and during or after the confinement. tukey’s HSD post hoc test was employed to define the specific differences when AnOVA analysis revealed a significant F-ratio for the main effect or an interaction. Pearson’s correlation analysis was used to define the relationships between the initial whole body mass, FFM and fat mass values (measured at Pre) and subsequent Pre to Post changes in these variables as well as between the individual normalized protein intakes [g body mass (kg)−1 day−1] and Pre to Post changes in FFM. the alpha level of significance was set a priori at 0.05.
Results
general confinement adaptation
All 11 participants underwent the campaigns without any significant adverse health-related issues except for transient headaches and backaches. One participant experienced severe hypoxemia (SpO2 <75 %) combined with dizzi-ness upon entry to the HBr and was relocated to a sepa-rate room with the simulated altitude reduced to ~3,000 m during the first day and ~3,500 m throughout the following day. He commenced his exposure to 4,000 m on day 3 with no further difficulties. the same protocol was repeated dur-ing his HAMB confinement.
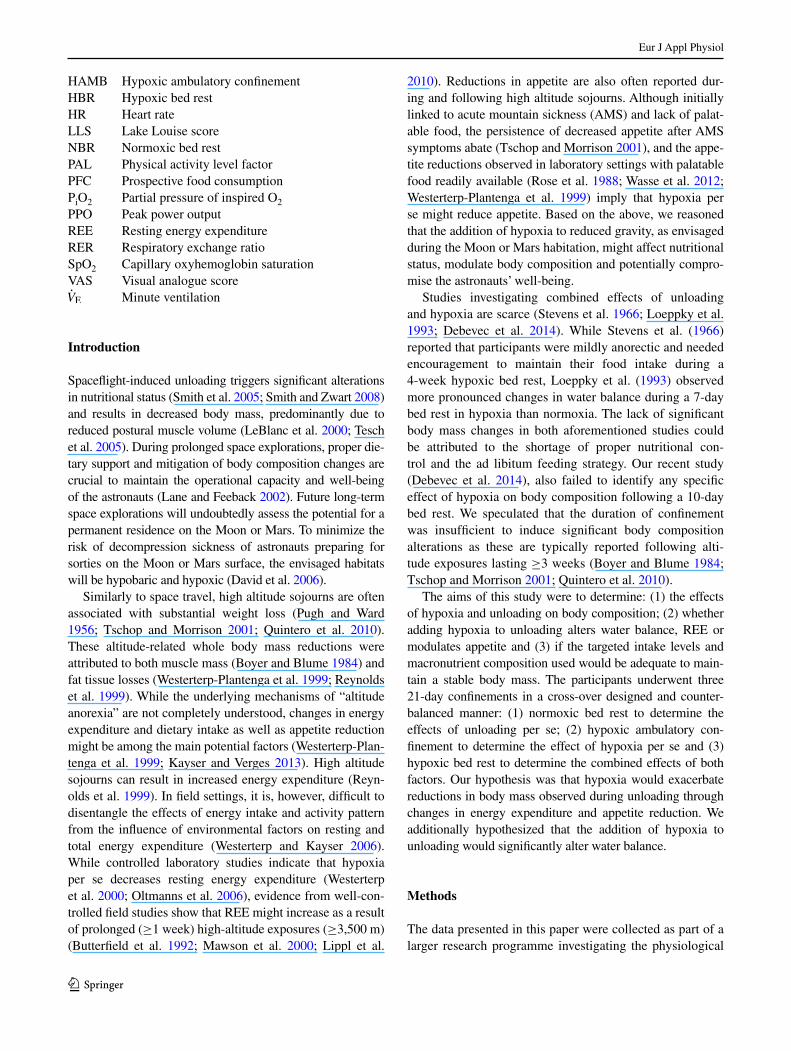
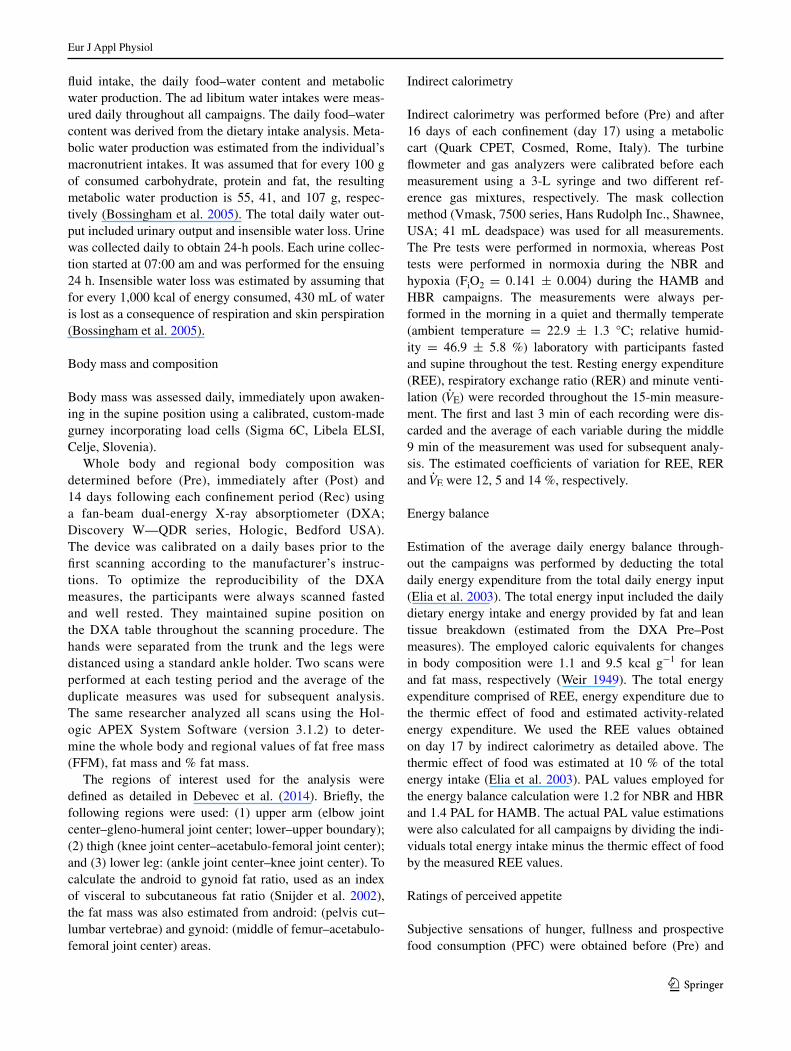
For daily Hr, there was a main effect of campaign (P < 0.05), a tendency for a campaign × time interaction (P = 0.08) and no main effect for time (P = 0.28). the Hr was higher in the HAMB than nBr on day 3 and on day 7 and was higher in HBr than in nBr during the last 8 days of the confinement (P < 0.05; Fig. 1). there was a main effect of campaign (P < 0.01), time (P < 0.01) and
a campaign × time interaction (P < 0.01) for SpO2. In both the HAMB and HBr campaigns the SpO2 was lower than in nBr during all 21 days of confinement (P < 0.01; Fig. 1). compared to day 1, the SpO2 was higher in the HBr from day 3 onwards whereas during the HAMB the SpO2 was only higher during the last five confinement days (P < 0.05). A main effect for time was noted for llS (P < 0.01) with no main effect of campaign or any inter-action (P = 0.12). the post hoc analysis revealed that the llS was only increased during the first 4 days of the HBr campaign (P < 0.05; Fig. 1). After the first 24 h of confine-ment (day 2), AMS was diagnosed in three participants during the HAMB and five participants during the HBr campaign.
the average Hr and SpO2 responses during the low-intensity exercise sessions, performed by the participants during the HAMB confinement, were 124 ± 9 beats min−1 and 87 ± 3 %, respectively.
Dietary intake
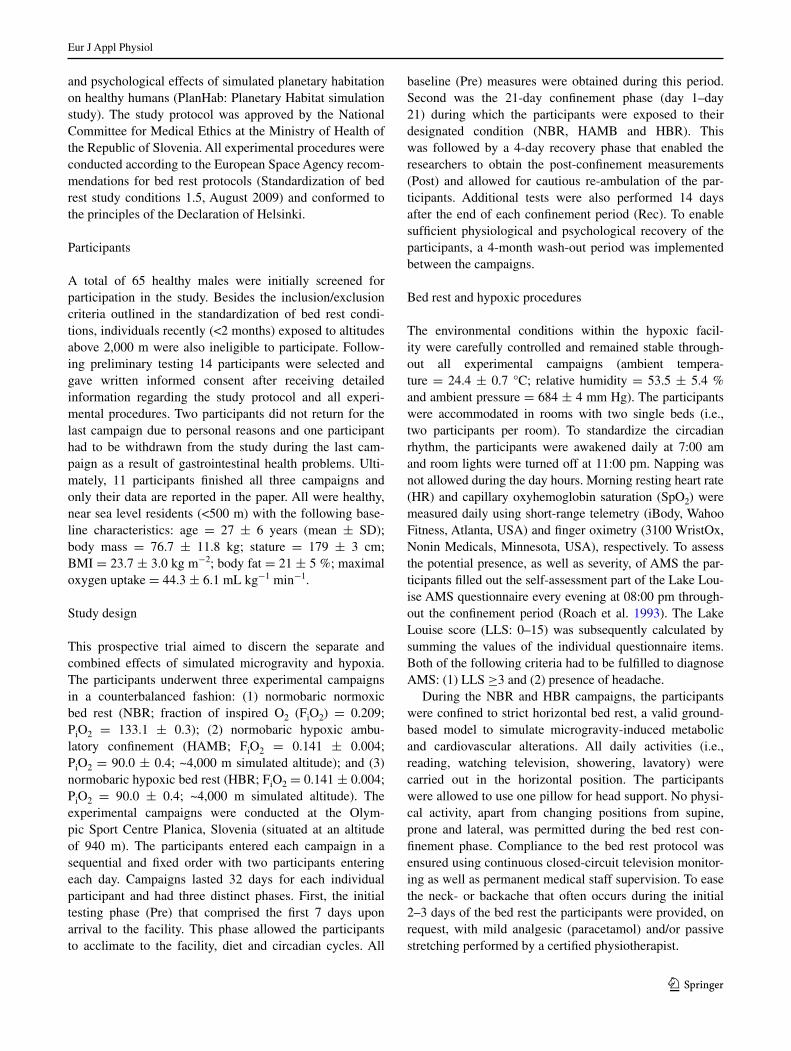
the targeted energy intakes were 2,139 ± 193 kcal for the nBr and HBr campaigns and 2,558 ± 226 kcal for the HAMB campaign. the actual energy intakes were lower than targeted in all campaigns (nBr: −5 %; HAMB: −14 %; HBr: −6 %; P < 0.01), but were higher during the HAMB compared to nBr and HBr campaign (table 1; Fig. 2). Since the energy intake was lower during the nBr and HBr compared to HAMB the intakes of all macronu-trients as well as iron and calcium were accordingly less (table 1). the average water and sodium intakes were com-parable between the campaigns.
Water balance
no main effect or interaction was observed in water input (P = 0.22; Fig. 3). For urinary output there was a main effect of time (P < 0.05) with no main effect of campaign (P = 0.57) or interaction (P = 0.59). Main effect of time was noted for water balance (P < 0.05), but not for cam-paign (P = 0.34) or interaction (P = 0.34). Post hoc anal-ysis did not reveal any significant differences between or within groups in neither water input, water output or water balance.
Body mass and composition
Body mass was decreased following all campaigns (P < 0.01; Fig. 4). A main effect for time (P < 0.01) and a campaign × time interaction (P < 0.05) were noted for daily changes in body mass with no main effect for cam-paign (P = 0.82). Post hoc analysis revealed no differences in reduction profiles between the campaigns.
Eur J Appl Physiol
1 3
A main effect of time (P < 0.01) and a campaign × time interaction (P < 0.01) was noted for whole body FFM. Whole body FFM was reduced at Post following all three campaigns (nBr = −4 %, HAMB = −5 %, HBr = −5 %; P < 0.01) and remained reduced at rec following the nBr (P < 0.01) and HAMB (P < 0.01) campaigns only (Fig. 4). no main effect was observed for changes in whole body fat mass (P = 0.19) and whole body % fat mass (P = 0.12) during and after the campaigns (Fig. 4).
there was a main effect of time on FFM in the lower leg (P < 0.01), thigh (P < 0.01) and upper arm (P < 0.05) regions. the post hoc analysis revealed that FFM was reduced in both the lower leg (P < 0.01) and thigh (P < 0.01) at Post and returned to baseline at rec in all three campaigns (table 2). the FFM of the upper arm region was only reduced at Post in the HAMB campaign. no main effect or an interaction was noted in either region for fat mass (P = 0.08) and % fat mass changes (P = 0.16).
the android to gynoid fat ratio was unchanged fol-lowing all three campaigns (nBr: Pre = 0.94 ± 0.10, Post = 0.97 ± 0.15; HAMB: Pre = 0.97 ± 0.12,
Fig. 1 Daily measurements of a heart rate (Hr), b capillary oxyhemoglobin saturation (SpO2) and c lake louise score (llS), before and during the normoxic bed rest (NBR; open circles), hypoxic ambulatory confinement (HAMB; closed squares) and hypoxic bed rest (HBR; open squares) campaigns (mean ± SD). Significant effects (P < 0.05): a main effect campaign; b main effect time; c interaction (campaign × time). Significant post hoc differences (P < 0.05): *vs. nBr; #vs. day 1; ##vs. Pre
Table 1 Average dietary intakes during the normoxic bed rest (nBr), hypoxic ambulatory confinement (HAMB) and hypoxic bed rest (HBr) campaigns
Values are mean ± SD
Significant differences (P < 0.05): * vs. targeted values, # vs. nBr and HBr
nBr HAMB HBr
Energy intake (kcal) 2,027 ± 188* 2,197 ± 193*# 2,018 ± 202*
Protein (g) 83 ± 9 93 ± 8# 83 ± 8
Protein (% daily intake)
16 ± 0.7 17 ± 0.5 17 ± 0.5
Fat (g) 66 ± 7 73 ± 8# 66 ± 7
Fat (% daily intake) 30 ± 1.0 30 ± 1.2 29 ± 1.0
carbohydrate (g) 274 ± 23 292 ± 24# 273 ± 26
carbohydrate (% daily intake)
54 ± 1.3 53 ± 1.4 54 ± 1.1
Water (l) 3.54 ± 0.93 3.58 ± 1.14 3.61 ± 0.96
Sodium (mg) 2,374 ± 335 2,630 ± 360 2,357 ± 321
Iron (mg) 14.2 ± 1.5 15.5 ± 1.7# 14.1 ± 1.7
calcium (mg) 825 ± 188 887 ± 193# 823 ± 189

Eur J Appl Physiol
1 3
Post = 0.96 ± 0.14; HBr: Pre = 0.95 ± 0.14, Post = 0.96 ± 0.13; P = 0.11).
resting energy expenditure
compared to Pre, neither fasting rEE nor rEr val-ues were altered in either campaign following 16 days
of confinement (P = 0.13; table 3). there was a main effect of time (P < 0.01) and a campaign × time interac-tion (P < 0.01) for V̇E. the post hoc test revealed that V̇E was increased on day 17 in both hypoxic confinements (P < 0.01), but remained unchanged during the nBr cam-paign (table 3). V̇E was also higher at Post in the HAMB and HBr than in the nBr campaign (P < 0.01).
Fig. 2 Daily energy intake values before and during the normoxic bed rest (NBR; open circles), hypoxic ambulatory confinement (HAMB; closed squares) and hypoxic bed rest (HBR; open squares) campaigns (mean ± SD). Significant effects (P < 0.05): a main effect time; b interaction (cam-paign × time)
Fig. 3 Daily values of a water input, b water output, and c calculated water balance, before and during the normoxic bed rest (NBR; open circles), hypoxic ambulatory confine-ment (HAMB; closed squares) and hypoxic bed rest (HBR; open squares) campaigns (mean ± SD). Significant effects (P < 0.05): a main effect time

Eur J Appl Physiol
1 3
Energy balance
the estimated energy balance was negative in all three campaigns (nBr: −177 ± 334 kcal day−1; HAMB: −255 ± 266 kcal day−1; HBr: −244 ± 341 kcal day−1) and did not differ between the campaigns (P = 0.51). the estimated average PAl values were higher in the HAMB (1.3 ± 0.1) than in the nBr (1.1 ± 0.2) and HBr (1.1 ± 0.2; P < 0.05).
Perceived appetite ratings
no main effect of time or campaign was noted in perceived ratings of hunger (P = 0.82), fullness (P = 0.13) or PFc
(P = 0.24) during and between the nBr, HAMB and HBr campaigns. Also, no significant interaction was noted for these variables (P = 0.27).
correlations and statistical power
no significant correlations were observed between the Pre values and Pre to Post changes in whole body mass (r = 0.12, P = 0.24), FFM (r = 0.20, P = 0.13) or fat mass (r = 0.06, P = 0.36) when data were pooled for all campaigns. If the data were analyzed for each campaign separately, significant correlations between the Pre values and Pre to Post changes were only observed in whole body mass (r = 0.62, P < 0.05) and FFM (r = 0.61, P < 0.05) during the nBr. no correlations between the individual normalized protein intakes and Pre to Post changes in FFM were noted in either campaign (nBr: r = 0.17, P = 0.31; HAMB: r = −0.28, P = 0.19; HBr: r = −0.23, P = 0.24).
For parameters with significant main effects or interac-tions, AnOVA revealed the following observed statisti-cal analysis power: 0.96 for Hr (campaign effect), 1.0 for SpO2 (time × campaign effect), 0.97 for llS (time effect), 0.68 for urinary output (time effect), 0.90 for water bal-ance (time effect), 0.97 for body mass (time effect), 0.83 for FFM (time effect) and 0.86 for V̇E (time × campaign effect).
Discussion
this study aimed to discern the effects of a 3-week expo-sure to unloading and hypoxia on body mass, body com-position and water balance. contrary to our initial hypoth-esis, hypoxia did not additively reduce body weight or alter body composition following 21 days of unloading. neither did hypoxia alter resting energy expenditure or blunt par-ticipants’ appetite sensations. Water balance was unaltered when unloading was complemented by hypoxia. Interest-ingly, reductions in body mass following hypoxic ambu-latory confinement were similar to those observed after both bed rest confinements. Potential explanations for this observation include insufficient energy intakes secondary to appetite reduction, low activity levels and/or effects of confinement per se.
Body composition modulation under hypoxia and bed rest
Both unloading (leBlanc et al. 2000; tesch et al. 2005) and hypoxia (Westerterp-Plantenga et al. 1999; tschop and Morrison 2001) can alter body mass and composition. In the present study the participants’ body mass was signifi-cantly reduced following all three experimental campaigns with similar temporal changes. thus, no specific effects of
Fig. 4 Individual and group values of a body mass, b whole body fat free mass, and c whole body fat mass, before (Pre), immediately after (Post) and 14 days after (Rec) the normoxic bed rest (NBR), hypoxic ambulatory confinement (HAMB) and hypoxic bed rest (HBR) cam-paigns (mean ± SD). Significant effects (P < 0.05): a main effect time. Significant post hoc differences: *(P < 0.01) vs. Pre

Eur J Appl Physiol
1 3
unloading or hypoxia per se could be identified based on the body mass outcomes.
Under appropriate nutritional support, unloading results in muscle volume reductions (Pavy-le traon et al. 2007), whereas hypoxia seems to affect both muscle and fat tis-sue (Quintero et al. 2010). However, when comparing both the whole and regional body composition results follow-ing the nBr and HBr confinements, no additive effect of hypoxia could be elucidated. this is also confirmed by the unchanged android to gynoid ratio indicating the lack of any specific regional fat tissue re-distribution. the only difference between the two bed rest confinements was that the FFM remained reduced at rec only following the nBr (Fig. 4). the faster regain of the FFM following the HBr campaign might suggest that hypoxia-induced water shifts
between the extracellular and intracellular compartments (Westerterp et al. 1996) have contributed to the observed FFM changes after hypoxic confinements (a similar trend was noted for HAMB). However, given that no significant difference in water balance were observed between the cam-paigns, these observations are most likely the result of dif-ferent dietary patterns and/or unsupervised activity during the recovery period. We also could not elucidate any specific effect of hypoxia during unloading when analyzing individ-ual responses. While correlation between initial body mass and FFM and subsequent changes in these two parameters was noted in the nBr, no correlations in body composition measures were observed following the HAMB and HBr.
the magnitude of the FFM reduction observed following the nBr campaign is in line with that previously observed
Table 2 DXA-estimated regional fat-free mass, fat mass and % fat mass before (Pre), immediately after (Post) and 14 days after (After) the nor-moxic bed rest (nBr), hypoxic ambulatory confinement (HAMB) and hypoxic bed rest (HBr) campaigns
Values are mean ± SD
Significant effects (P < 0.05): a main effect time
Significant post hoc differences: * (P < 0.01) vs. Pre
nBr HAMB HBr
Pre Post After Pre Post After Pre Post After
Upper arm
Fat free mass (kg)a
2.15 ± 0.48 2.15 ± 0.43 2.11 ± 0.38 2.19 ± 0.47 2.06 ± 0.48* 2.10 ± 0.49 2.09 ± 0.34 2.09 ± 0.31 2.16 ± 0.33
Fat mass (kg) 0.53 ± 0.25 0.48 ± 0.20 0.52 ± 0.23 0.59 ± 0.35 0.59 ± 0.36 0.60 ± 0.36 0.55 ± 0.29 0.53 ± 0.29 0.58 ± 0.33
Fat mass (%) 19.1 ± 5.7 17.8 ± 4.6 19.2 ± 5.3 20.1 ± 7.1 21.2 ± 7.2 20.9 ± 7.3 20.0 ± 7.4 19.3 ± 7.5 20.2 ± 7.8
thigh
Fat-free mass (kg)a
7.15 ± 1.17 6.79 ± 1.09* 6.98 ± 1.08 7.31 ± 1.15 6.86 ± 1.15* 7.09 ± 1.12 7.06 ± 1.03 6.57 ± 0.89* 6.94 ± 0.87
Fat mass (kg) 2.06 ± 0.72 1.91 ± 0.63 2.07 ± 0.65 2.35 ± 1.11 2.31 ± 1.07 2.34 ± 1.13 2.17 ± 0.94 2.09 ± 0.94 2.33 ± 0.99
Fat mass (%) 22.1 ± 5.9 21.7 ± 5.5 22.6 ± 5.6 22.7 ± 7.9 23.3 ± 9.1 22.9 ± 8.3 23.0 ± 7.6 23.4 ± 7.6 23.5 ± 7.3
lower leg
Fat-free mass (kg)a
2.54 ± 0.37 2.41 ± 0.33* 2.48 ± 0.30 2.58 ± 0.36 2.45 ± 0.33* 2.46 ± 0.33 2.53 ± 0.32 2.34 ± 0.27* 2.49 ± 0.30
Fat mass (kg) 0.68 ± 0.21 0.62 ± 0.18 0.69 ± 0.18 0.72 ± 0.26 0.75 ± 0.29 0.75 ± 0.27 0.67 ± 0.21 0.65 ± 0.22 0.69 ± 0.24
Fat mass (%) 21.2 ± 6.7 20.4 ± 5.4 21.7 ± 5.1 21.5 ± 6.6 23.1 ± 8.5 23.1 ± 7.4 20.9 ± 6.1 21.4 ± 6.3 21.6 ± 6.9
Table 3 resting energy expenditure (rEE), minute ventilation (V̇E) and respiratory exchange ratio (rEr) measured before (Pre) and after 16 days (day 17) of the normoxic bed rest (nBr), hypoxic ambulatory confinement (HAMB) and hypoxic bed rest (HBr) campaigns
Values are mean ± SD
Significant effects (P < 0.05): a main effect time; b interaction (campaign × time)
Significant post hoc differences (P < 0.01): * vs. Pre; # vs. nBr
nBr HAMB HBr
Pre Day 17 Pre Day 17 Pre Day 17
rEE (kcal) 2,195 ± 247 2,061 ± 235 2,185 ± 287 2,130 ± 269 2,121 ± 327 2,106 ± 240
V̇E (l min−1)a, b 9.1 ± 0.9 8.8 ± 0.9 9.1 ± 1.6 10.7 ± 1.2*# 9.0 ± 1.3 10.7 ± 1.0*#
rEr 0.80 ± 0.03 0.84 ± 0.06 0.82 ± 0.07 0.77 ± 0.03 0.84 ± 0.09 0.79 ± 0.04

Eur J Appl Physiol
1 3
following medium-term bed rest studies; i.e., a ~10 % reduction in the lower limb postural muscles (Pavy-le traon et al. 2007). Profound reduction of SpO2 throughout the HAMB and HBr confinements confirms the hypoxic nature of these interventions. However, sustained systemic hypoxia did not significantly affect body mass or compo-sition. this, rather surprising finding, contradicts numer-ous studies indicating that exposure to altitude/hypoxia per se will reduce muscle and fat tissue mass (reynolds et al. 1999; Westerterp et al. 1994). Although other environmen-tal factors than hypoxia could have confounded the initial field studies, the controlled laboratory trials confirmed that hypoxia per se may alter body mass and composition (rose et al. 1988). A viable explanation for the lack of any dis-cernible effect of hypoxia in this study could be the dose of hypoxia. Indeed, high/extreme altitude (>5,000 m) sojourns have been utilized in the majority of studies reporting hypoxia-induced body mass reductions in healthy individu-als (Westerterp et al. 1994; rose et al. 1988; reynolds et al. 1999). On the other hand, reductions in body mass follow-ing lower altitude sojourns or simulated altitudes have pre-dominantly been observed in overweight/obese populations (lippl et al. 2010; Kayser and Verges 2013). As noted ear-lier by Westerterp and Kayser (2006) it seems that, at least in healthy humans, hypoxia significantly affects body mass and composition, secondary to perturbed energy balance beyond a threshold altitude of ~5,000 m. nevertheless, our findings indicate that a sustained hypoxic stimulus equiva-lent to ~4,000 m altitude, more severe than that envisaged within the Moon and Mars habitats, does not significantly affect body mass modulation during unloading.
Surprisingly, FFM reductions following the HAMB were similar to those observed during the nBr and HBr. Fur-thermore, significant reduction in the upper arm FFM was only observed following the HAMB. While the latter obser-vation might not be of significant physiological relevance, the HAMB did induce significant reduction of whole body FFM. the potential factors underlying these FFM reduc-tions include insufficient energy and macronutrient intakes, water content shifts between extracellular and intracellular compartments, reduced physical activity levels and effects of confinement per se. In addition, exercise-related protein synthesis suppression during chronic (narici and Kayser 1995) and acute (Etheridge et al. 2011) hypoxic exposure might have played a role in the FFM modulation follow-ing the HAMB. However, since the exercise sessions were performed at a low intensity the contribution of this mecha-nism would be limited.
resting energy expenditure and appetite
no differences in rEE observed during the nBr cam-paign is in line with previous reports showing unaltered or
slightly reduced rEE during unloading (Stein et al. 1999). Interestingly, the rEE was also unchanged during both hypoxic campaigns. this is in contrast with our hypoth-esis and previous reports showing increased rEE during exposures to environmental hypoxia in humans (Butter-field et al. 1992; Mawson et al. 2000; lippl et al. 2010). this increase in basal metabolic rate has been attributed to the altitude-induced beta-sympathetic activation (Moore et al. 1987). On the other hand, the studies by nair et al. (1971) and Westerterp et al. (2000) demonstrated decreased rEE as a result of hypobaric hypoxia. the discrepancies between the study outcomes might result from different experimental settings (field vs. laboratory), environmental factors (cold, confinement) and different activity levels. the only significant difference observed during the indirect calorimetry measurements was the increased V̇E values dur-ing both HAMB and HBr, reflecting the well-established augmented hypoxic ventilatory response.
Similarly to rEE, the measured appetite markers did not significantly differ between groups and/or between differ-ent time periods (Fig. 5). this is surprising given the fact that the majority of previous studies reported significant decreases in appetite as a result of hypoxia per se (rose et al. 1988; Westerterp-Plantenga et al. 1999). It could be argued that the simulated altitude (~4,000 m) in this study was insufficient to significantly alter appetite. However, a recent study demonstrated that even relatively short (7 h) normobaric hypoxic exposures to (~4,000 m) suppress hunger and dietary intake (Wasse et al. 2012). the fact that the perceived appetite sensations were unchanged and the energy intakes were reduced suggest, that the participants were eating according to their feelings. nevertheless, dur-ing the HAMB campaign, hypoxia might have modulated their appetite/satiety, since the intakes were reduced signifi-cantly more than during both bed rest campaigns. confine-ment per se could have additionally influenced the appetite outcomes, and thereby mask the effects of hypoxia per se, since monotony secondary to confinement has previously been implicated in appetite and intake alterations (Wester-terp et al. 1988).
Diet and physical activity levels
the purpose of the standardized diet was to minimize the potential confounding effects of different energy and macronutrient intakes. the actual energy intakes of the participants were insufficient to prevent a significant body mass decrease in all three experimental campaigns. Inter-estingly, the participants in all campaigns maintained their fat mass even though their energy intakes were consider-ably lower than targeted. the Harris–Benedict equation for calculating basal metabolic rate is often employed for deter-mining energy demands during simulated microgravity and

Eur J Appl Physiol
1 3
seems to accurately reflect the energy requirements during such conditions (Smith et al. 2005). It is of note, that the calculated rEE were lower (~15 %) than those determined by indirect calorimetry. However, even though the calcula-tion-based targeted intakes might have been slightly under-estimated, the participants in all campaigns consumed sig-nificantly less food than they were provided with.
the macronutrient diet composition used in this study was similar to that of other recent studies scrutinizing micrograv-ity effects on nutritional status. these studies mostly employ ratios of 55 % for carbohydrate, 30 % for fat and 15 % for protein intakes, which is in line with the present study. this is important since alterations of the macronutrient composition can significantly affect the body composition modulation. the protein intake might be particularly important during unloading periods as it has been documented that a higher protein intake can lessen the inactivity-induced reduction of
muscle protein synthesis and consequently reduce muscle mass wasting (Stuart et al. 1990). nevertheless, in our pre-vious study (Debevec et al. 2014) a higher protein intake (20 % of total intake) did not prevent FFM reductions fol-lowing both normoxic and hypoxic bed rest. Furthermore, no significant correlation was noted between the participants’ protein intakes and subsequent changes and lean mass fol-lowing all campaigns. the potential contribution of the high sodium intake-related exacerbation of inactivity-induced muscle loss (Frings-Meuthen et al. 2011) was minimized in the present study as the sodium intakes were well below the targeted levels (<3,500 mg day−1).
the used PAl factors of 1.4 and 1.2 for the HAMB and both bed rest campaigns, respectively, are in line with other studies investigating the effects of simulated microgravity on healthy humans (Smith et al. 2001; lane and Feeback 2002; Zwart et al. 2009). While the results of the nBr and
Fig. 5 Perceived ratings of a hunger, b fullness, and c prospective food consumption (PFC) obtained before (Pre), during the first day (D1) and after each week (D7, D14, D21) of the normoxic bed rest (NBR), hypoxic ambulatory confine-ment (HAMB) and hypoxic bed rest (HBR) campaigns (mean ± SD)

Eur J Appl Physiol
1 3
HBr campaigns do not indicate that a PAl higher than 1.2 should be employed when unloading is combined with hypoxia the 1.4 PAl used for the HAMB might have been insufficient to maintain energy balance and consequently body composition. As reviewed by Melzer et al. (2005), reducing physical activity below 1.8 PAl does not allow for compensatory appetite and energy intake adaptation. Although the participants performed two low-intensity exer-cise sessions daily to simulate their daily physical activity throughout the HAMB campaign, their activity levels might have been below their habitual ones. the low estimated PAl (1.3) values during the HAMB campaign (obtained from the energy balance data) support this notion and also suggest that the participants were not underfed. these data collec-tively indicate that, besides hypoxia, reduced activity during the HAMB contributed to the observed FFM reduction.
Water balance
Hypoxia-induced water retention, closely related to AMS (Bartsch et al. 1991), can alter water balance especially dur-ing the initial acclimatization period (Westerterp et al. 1996). Similarly to hypoxia, microgravity has been shown to influ-ence water balance (Drummer et al. 2001). to date only two studies investigated the combined effects of hypoxia and unloading (loeppky et al. 1993; Debevec et al. 2014). the first study by loeppky et al. (1993) reported greater altera-tions in balance during 7-day hypoxic than normoxic bed rest. In particular, the urinary output was comparable during the first few days but was significantly higher during the lat-ter stage of the experiment in the HBr group only (loep-pky et al. 1993). In contrast, our recent study (Debevec et al. 2014) noted decreased urinary output during the latter stages of both 10-day hypoxic ambulatory and hypoxic bed rest conditions. this finding could be explained by the reported reduction of urinary output following altitude acclimatization (Hildebrandt et al. 2000). Although both above-mentioned studies reported significant changes in water balance the data from this study do not suggest any major alteration in water balance. the water intakes were comparable between and throughout the campaigns. given that altitude-related water retention is tightly associated to AMS (Bartsch et al. 1991) the low incidence and severity of AMS in the present study, might at least partly, explain the lack of significant changes observed as a result of hypoxic exposure. Furthermore, the fact that the water balance was not assessed on a daily basis could have masked potential differences.
Methodological considerations
the main strengths of the present investigation include the cross-over, intra-individual design and carefully con-trolled environmental conditions. the strictly controlled and
monitored dietary intakes as well as duplicate DXA scans performed at each testing period further reinforce our find-ings. A few limitations also need to be addressed. First, since the precise operational parameters of future Moon or Mars habitats are as yet not settled, the present study was not conducted as a high-fidelity analogue simulation. By con-trast, the stimulus conditions (i.e., the level of hypoxia as well as the bed rest-induced musculoskeletal unloading and cardiovascular adjustments) were exaggerated compared to those anticipated in such habitats. Second, to simulate alti-tude (hypobaric) exposure, continuous normobaric hypoxia was employed in the present study. Even though there are no known effects of pressure per se on nutritional status or body composition, recent reports suggest that, for certain physiological responses, normobaric and hypobaric hypoxia induce slightly different responses (Faiss et al. 2013). third, the feeding strategy used in the current study (i.e., pre-scribed energy intakes and standardized menu) might have influenced the energy intake and appetite-related outcomes. Had the participants had ad libitum access to varied food, the outcomes might have been different. Fourth, the indirect calorimetry measurements were performed using a mask as opposed to the hood (canopy) system, usually employed in similar experimental settings. the hood measurement is difficult to perform under hypoxic conditions due to FiO2 fluctuations in the sampling area (within the hood). We thus opted for the mask system that avoids this problem and makes it possible to perform breath-by-breath analysis of the FiO2. recent evidence suggests that both the canopy and the mask mode measures give somewhat comparable estimates of rEE, rEr and V̇E (graf et al. 2013). Fifth, the urinary gravity measures were not performed in this study, even though they would provide valuable additional information regarding the fluid balance alterations. Finally, confinement per se has previously been shown to have significant effects on body mass and nutritional status (custaud et al. 2004). Although confinement will also be a feature of the envisaged Moon and Mars habitation, its relative contribution should be elucidated in the forthcoming investigations.
the employed experimental model (i.e., combined hypoxia and unloading) is not only applicable to future space habitation, but also relates to nutritional status and body composition modulation of clinical populations (pulmonary disease patients, cardiac insufficiency, etc.). Disease-induced relative hypoxia, often combined with inactivity, has already been shown to affect appetite and nutritional status (Schols 1997).
Conclusions
Our data suggest that exposure to simulated altitude of ~4,000 m does not exacerbate the whole body mass and

Eur J Appl Physiol
1 3
fat-free mass reductions during a 21-day simulated micrograv-ity. the hypoxic dose used in the present study does not seem to exert any significant effect on resting energy expenditure, perceived appetite or water balance. Finally, higher levels of energy intakes, than those targeted in the present study are not warranted when unloading is combined with hypoxic exposure up to simulated altitudes of 4,000 m. this study provides novel insight into the combined effects of unloading and continuous hypoxia on body composition modulation in healthy humans.
Acknowledgments the study was funded by the European Union Programme FP7 (PlanHab project; grant no. 284438), the Euro-pean Space Agency (ESA) Programme for European cooperating States (EStEc/contract no. 40001043721/11/nl/KMl: Planetary Habitat Simulation), and the Slovene research Agency (contract no. l3-3654: Zero and reduced gravity simulation: the effect on the car-diovascular and musculoskeletal systems). the authors are indebted to Iva Kumprej, Elaine Woods and Seodhna Murphy for their excel-lent assistance with the data collection. last but definitely not least, we would like to acknowledge the devoted participants without whom this study would not have been possible.
Conflict of interest the authors declare that they have no conflict of interest.
References
Bartsch P, Pfluger n, Audetat M, Shaw S, Weidmann P, Vock P, Vetter W, rennie D, Oelz O (1991) Effects of slow ascent to 4559 M on fluid homeostasis. Aviat Space Environ Med 62(2):105–110
Bossingham MJ, carnell nS, campbell WW (2005) Water balance, hydration status, and fat-free mass hydration in younger and older adults. Am J clin nutr 81(6):1342–1350
Boyer SJ, Blume FD (1984) Weight loss and changes in body compo-sition at high altitude. J Appl Physiol 57(5):1580–1585
Butterfield gE, gates J, Fleming S, Brooks gA, Sutton Jr, reeves Jt (1992) Increased energy intake minimizes weight loss in men at high altitude. J Appl Physiol 72(5):1741–1748
custaud MA, Belin de chantemele E, larina IM, nichiporuk IA, grigoriev A, Duvareille M, gharib c, gauquelin-Koch g (2004) Hormonal changes during long-term isolation. Eur J Appl Physiol 91(5–6):508–515
David B, Paul E, Kenneth B (2006) A human lunar surface base and infrastructure solution. In: Space 2006 (ed) SPAcE conferences and exposition. American Institute of Aeronautics and Astronau-tics, USA. doi:10.2514/6.2006-7336
Debevec t, McDonnell Ac, Macdonald IA, Eiken O, Mekjavic IB (2014) Whole body and regional body composition changes fol-lowing 10-day hypoxic confinement and unloading-inactivity. Appl Physiol nutr Metab 39(3):386–395
Drummer c, norsk P, Heer M (2001) Water and sodium balance in space. Am J Kidney Dis 38(3):684–690
Elia M, Stratton r, Stubbs J (2003) techniques for the study of energy balance in man. Proc nutr Soc 62(2):529–537
Etheridge t, Atherton PJ, Wilkinson D, Selby A, rankin D, Webborn n, Smith K, Watt PW (2011) Effects of hypoxia on muscle pro-tein synthesis and anabolic signaling at rest and in response to acute resistance exercise. Am J Physiol 301(4):E697–E702
Faiss r, Pialoux V, Sartori c, Faes c, Deriaz O, Millet gP (2013) Ventilation, oxidative stress and nitric oxide in hypobaric vs. nor-mobaric hypoxia. Med Sci Sports Exerc 45(2):253–260
Frings-Meuthen P, Buehlmeier J, Baecker n, Stehle P, Fimmers r, May F, Kluge g, Heer M (2011) High sodium chloride intake exacerbates immobilization-induced bone resorption and protein losses. J Appl Physiol 111(2):537–542
gibbons c, caudwell P, Finlayson g, King n, Blundell J (2011) Validation of a new hand-held electronic data capture method for continuous monitoring of subjective appetite sensations. Int J Behav nutr Phy 8:57
graf S, Karsegard Vl, Viatte V, Maisonneuve n, Pichard c, genton l (2013) comparison of three indirect calorimetry devices and three methods of gas collection: a prospective observational study. clin nutr 32(6):1067–1072
Hasson rE, Howe cA, Jones Bl, Freedson PS (2011) Accuracy of four resting metabolic rate prediction equations: effects of sex, body mass index, age, and race/ethnicity. J Sci Med Sport 14(4):344–351
Hildebrandt W, Ottenbacher A, Schuster M, Swenson Er, Bartsch P (2000) Diuretic effect of hypoxia, hypocapnia, and hyperpnea in humans: relation to hormones and O(2) chemosensitivity. J Appl Physiol 88(2):599–610
Kayser B, Verges S (2013) Hypoxia, energy balance and obesity: from pathophysiological mechanisms to new treatment strategies. Obes rev 14(7):579–592
lane HW, Feeback Dl (2002) Water and energy dietary require-ments and endocrinology of human space flight. nutrition 18(10):820–828
leBlanc A, lin c, Shackelford l, Sinitsyn V, Evans H, Belichenko O, Schenkman B, Kozlovskaya I, Oganov V, Bakulin A, Hedrick t, Feeback D (2000) Muscle volume, MrI relaxation times (t2), and body composition after spaceflight. J Appl Physiol 89(6):2158–2164
lippl FJ, neubauer S, Schipfer S, lichter n, tufman A, Otto B, Fis-cher r (2010) Hypobaric hypoxia causes body weight reduction in obese subjects. Obesity 18(4):675–681
loeppky JA, roach rc, Selland MA, Scotto P, luft Fc, luft Uc (1993) Body fluid alterations during head-down bed rest in men at moderate altitude. Aviat Space Environ Med 64(4):265–274
Mawson Jt, Braun B, rock PB, Moore lg, Mazzeo r, Butterfield gE (2000) Women at altitude: energy requirement at 4,300 m. J Appl Physiol 88(1):272–281
Melzer K, Kayser B, Saris WH, Pichard c (2005) Effects of physical activity on food intake. clin nutr 24(6):885–895
Moore lg, cymerman A, Huang SY, Mccullough rE, Mccullough rg, rock PB, Young A, Young P, Weil JV, reeves Jt (1987) Pro-pranolol blocks metabolic rate increase but not ventilatory accli-matization to 4,300 m. respir Physiol 70(2):195–204
nair cS, Malhotra MS, gopinath PM, Mathew l (1971) Effect of acclimatization to altitude and cold on basal heart rate, blood pressure, respiration and breath-holding in man. Aerosp Med 42(8):851–855
narici MV, Kayser B (1995) Hypertrophic response of human skeletal muscle to strength training in hypoxia and normoxia. Eur J Appl Physiol Occup Physiol 70(3):213–219
Oltmanns KM, gehring H, rudolf S, Schultes B, Schweiger U, Born J, Fehm Hl, Peters A (2006) Persistent suppression of rest-ing energy expenditure after acute hypoxia. Metab clin Exp 55(5):669–675
Pavy-le traon A, Heer M, narici MV, rittweger J, Vernikos J (2007) From space to Earth: advances in human physiology from 20 years of bed rest studies (1986–2006). Eur J Appl Physiol 101(2):143–194
Pugh lgc, Ward MP (1956) Some effects of high altitude on man. lancet 268(6953):1115–1121
Quintero P, Milagro FI, campion J, Martinez JA (2010) Impact of oxygen availability on body weight management. Med Hypoth-eses 74(5):901–907

Eur J Appl Physiol
1 3
reynolds rD, lickteig JA, Deuster PA, Howard MP, conway JM, Pietersma A, deStoppelaar J, Deurenberg P (1999) Energy metab-olism increases and regional body fat decreases while regional muscle mass is spared in humans climbing Mt. Everest. J nutr 129(7):1307–1314
roach rc, Bartsch P, Hackett PH, Oelz O (1993) the lake louise AMS Scoring consensus committee. the lake louise acute mountain sickness scoring system. In: Sutton Jr, Houston cS, coates g, Burlington Vt (eds) Hypoxia and molecular medicine. Queen city Printers, USA, pp 272–274
rose MS, Houston cS, Fulco cS, coates g, Sutton Jr, cymerman A (1988) Operation Everest. II: nutrition and body composition. J Appl Physiol 65(6):2545–2551
Schols AM (1997) nutrition and outcome in chronic respiratory dis-ease. nutrition 13(2):161–163
Smith SM, Zwart Sr (2008) nutritional biochemistry of spaceflight. Adv clin chem 46:87–130
Smith SM, Davis-Street JE, rice Bl, nillen Jl, gillman Pl, Block g (2001) nutritional status assessment in semiclosed environ-ments: ground-based and space flight studies in humans. J nutr 131(7):2053–2061
Smith SM, Zwart Sr, Block g, rice Bl, Davis-Street JE (2005) the nutritional status of astronauts is altered after long-term space flight aboard the International Space Station. J nutr 135(3):437–443
Snijder MB, Visser M, Dekker JM, Seidell Jc, Fuerst t, tylavsky F, cauley J, lang t, nevitt M, Harris tB (2002) the prediction of visceral fat by dual-energy X-ray absorptiometry in the elderly: a comparison with computed tomography and anthropometry. Int J Obes relat Metab Disord 26(7):984–993
Stein tP, leskiw MJ, Schluter MD, Hoyt rW, lane HW, grete-beck rE, leBlanc AD (1999) Energy expenditure and balance during spaceflight on the space shuttle. Am J Physiol 276(6 Pt 2):r1739–r1748
Stevens PM, Miller PB, lynch tn, gilbert cA, Johnson rl, lamb lE (1966) Effects of lower body negative pressure on physiologic changes due to four weeks of hypoxic bed rest. Aerosp Med 37(5):466–474
Stuart cA, Shangraw rE, Peters EJ, Wolfe rr (1990) Effect of die-tary protein on bed-rest-related changes in whole-body-protein synthesis. Am J clin nutr 52(3):509–514
tesch PA, Berg HE, Bring D, Evans HJ, leBlanc AD (2005) Effects of 17-day spaceflight on knee extensor muscle function and size. Eur J Appl Physiol 93(4):463–468
tschop M, Morrison KM (2001) Weight loss at high altitude. Adv Exp Med Biol 502:237–247
Wasse lK, Sunderland c, King JA, Batterham rl, Stensel DJ (2012) Influence of rest and exercise at a simulated altitude of 4,000 m on appetite, energy intake, and plasma concentrations of acylated ghrelin and peptide YY. J Appl Physiol 112(4):552–559
Weir JB (1949) new methods for calculating metabolic rate with spe-cial reference to protein metabolism. J Physiol 109(1–2):1–9
Westerterp Kr, Kayser B (2006) Body mass regulation at altitude. Eur J gastroenterol Hepatol 18(1):1–3
Westerterp Kr, Brouns F, Saris WH, ten Hoor F (1988) comparison of doubly labeled water with respirometry at low- and high-activ-ity levels. J Appl Physiol 65(1):53–56
Westerterp Kr, Kayser B, Wouters l, le trong Jl, richalet JP (1994) Energy balance at high altitude of 6,542 m. J Appl Physiol 77(2):862–866
Westerterp Kr, robach P, Wouters l, richalet JP (1996) Water bal-ance and acute mountain sickness before and after arrival at high altitude of 4,350 m. J Appl Physiol 80(6):1968–1972
Westerterp Kr, Meijer EP, rubbens M, robach P, richalet JP (2000) Operation Everest III: energy and water balance. Pflugers Arch 439(4):483–488
Westerterp-Plantenga MS, Westerterp Kr, rubbens M, Verwegen cr, richelet JP, gardette B (1999) Appetite at “high altitude” [Opera-tion Everest III (comex-’97)]: a simulated ascent of Mount Ever-est. J Appl Physiol 87(1):391–399
Zwart Sr, crawford gE, gillman Pl, Kala g, rodgers AS, rogers A, Inniss AM, rice Bl, Ericson K, coburn S, Bourbeau Y, Hud-son E, Mathew g, Dekerlegand DE, Sams cF, Heer MA, Paloski WH, Smith SM (2009) Effects of 21 days of bed rest, with or without artificial gravity, on nutritional status of humans. J Appl Physiol 107(1):54–62