
Effects of High Pressure on Texture and Microstructure of Sea Bass (Dicentrarchus labrax L.) Fillets
Upload
independentCategory
view
2download
0
Food Chemistry 114 (2009) 237–245
Contents lists available at ScienceDirect
Food Chemistry
journal homepage: www.elsevier .com/locate / foodchem
Sensory, physical, chemical and microbiological changes in aquaculturedmeagre (Argyrosomus regius) fillets during ice storage
M.D. Hernández a,*, M.B. López b, A. Álvarez a, E. Ferrandini b, B. García García a, M.D. Garrido b
a IMIDA Acuicultura, Consejería de Agricultura y Agua de la Región de Murcia, P.O. Box 65, 30740 San Pedro del Pinatar, Murcia, Spainb Tecnología de los Alimentos, Facultad de Veterinaria, Universidad de Murcia, Campus de Espinardo, 30071 Murcia, Spain
a r t i c l e i n f o
Article history:Received 14 June 2008Received in revised form 31 July 2008Accepted 17 September 2008
Keywords:MeagreArgyrosomus regiusFilletsIce storageFish qualityShelf-life
0308-8146/$ - see front matter � 2008 Elsevier Ltd. Adoi:10.1016/j.foodchem.2008.09.045
* Corresponding author. Tel./fax: +34 968 184518.E-mail address: [email protected] (M
a b s t r a c t
Commercial-sized meagre fillets were stored on ice at 4 �C for 18 days, in order to evaluate the loss ofquality and freshness that occurs over this period of time. Physicochemical (pH, thiobarbituric acid(TBA), total volatile basic nitrogen (TVBN), trimethylamine (TMA), water activity, water-holding capacity,colour, texture and fatty acid profile), sensory and microbiological analyses were carried out at 0, 4, 7, 11,14 and 18 days of storage. As part of the sensory analysis, attributes associated with fillet appearance,odour and texture were examined. Variations in pH, TBA, TVBN and TMA were observed throughoutthe storage period, although only TBA displayed a significant correlation with time (r = 0.96). L* and b*
values increased, and the chroma and hue values decreased, reflecting the colour changes experiencedby the fillets over time. With regards to the texture profile, hardness was significantly correlated withtime (�0.68). All the sensory analysis attributes exhibited significant variations and correlations closeto 1.00 with storage time, which is a reflection of the fillets’ loss of freshness. The correlation coefficientsbetween aerobic mesophilic and psychrophilic bacteria, enterobacteria and coliform counts on the onehand and storage time on the other were also very high (0.99–1.00). A regression analysis using theacceptability limit set by the ICMSF standard (1986) for total aerobic mesophilic counts (7 log cfu/g)yielded a shelf-life for meagre fillets of 9 days. The TBA, sensory and microbiological analyses displayedvery strong correlations with storage time, and they may be considered suitable indicators for evaluatingmeagre fillet spoilage during refrigerated storage.
� 2008 Elsevier Ltd. All rights reserved.
1. Introduction
The introduction of new cultured species over the last decadehas contributed to making aquaculture more profitable in Spain.In this sense, meagre has been shown to be an interesting speciesfor commercial production, aiding in the diversification of marineaquaculture. Endowed with excellent biological characteristicsfor rearing, its farming in Europe is currently increasing. Meagreis a species commonly found throughout the Mediterranean andthe Black Sea, as well as on the Atlantic European and East Africancoasts. It is a coastal species that can be found both close to thebottom of the continental shelf and near the surface, within adepth range of 15–200 m. It may also be found in estuaries andcoastal lakes (Griffiths & Heemstra, 1995). It can reach a weightof more than 50 kg in the wild. Being a euryhaline species, it canadapt to very diverse environments, making even land based culti-vation possible in brackish water media. It withstands tank captiv-ity perfectly well, reaching high growth rates during on-growing,with good feed conversion rates (Jiménez et al., 2005; Pastor, Grau,
ll rights reserved.
.D. Hernández).
Massutí, & Sánchez-Madrid, 2002). Furthermore, it exhibits highfertility rates, and so far it has not shown any significant patholog-ical manifestations.
Many fish species have been consumed for quite some time in theform of fillets (salmon, perch, sole, cod, trout, halibut, ling, hake andswordfish), whilst others, such as sea bass and sea bream, have beenconsumed whole up until now, but are starting to be marketed as fil-lets. Specifically in the case of Spain, the format with the greatest fu-ture seems to be filleted fish. According to professionals in fish sales,the consumption of fillets will continue to increase in the future, dueto new lifestyle habits as people have less time to cook, and theyounger generations’ increasing habit of consuming prepared prod-ucts (GIAUC, 2006). In this sense, meagre shows good marketingpotential, as both its size and its body shape allow for optimal fillet-ing. Some studies have shown that the shelf-life of filleted fish isshorter than that of whole fish (Chytiri, Chouliara, Savvaidis, &Kontominas, 2004; Paleologos, Savvaidis, & Kontominas, 2004;Taliadourou, Papadopoulos, Domvridou, Savvaidis, & Kontominas,2003). Whilst this may be true, meagre raised in captivity developlower amounts of muscular fat than other aquacultural species,which permits their preservation under refrigeration for longerperiods of time (Poli et al., 2003).

238 M.D. Hernández et al. / Food Chemistry 114 (2009) 237–245
The high levels of moisture, nutrient content, and high pH ren-der fish an easily perishable product, often going bad within a shortperiod of time under refrigerated conditions. Microbial activity isthe main culprit behind the changes that occur in fish during thelast stages of spoilage. The extension of its shelf-life by means ofrefrigeration is essential due to a reduction in the growth rateand metabolic activity of the microorganisms that cause the dete-rioration (Cakli, Kilinc, Cadun, Dincer, & Tolasa, 2007). Freshness isthe most important attribute when evaluating the quality of fish,depending mainly on the procedures followed during handling,processing and storage, from the moment it is caught until itreaches the consumer. Both the processes of filleting and gutting,as well as cross-contamination amongst fish and/or a large surfacearea exposed to environmental microbial contamination reducethe shelf-life of fish (Poli et al., 2006).
Microbiological, biochemical and sensory methods are used toevaluate the freshness and quality of fish during handling and stor-age, with appearance, odour, taste and texture being the mainattributes of freshness (Koutsoumanis, Giannakourou, Taoukis, &Nychas, 2002). Given the fact that the results of these analysesdo not always correlate well, it is important to use all three meth-ods when the purpose is to adequately define the freshness of aparticular species of fish (Paleologos et al., 2004).
For these reasons, the objective of our study was to estimate theshelf-life of commercial-sized meagre fillets held in ice storage.Fish fillet spoilage was evaluated by means of sensory, microbio-logical and physicochemical analyses over a period of 18 days.All evaluated parameters were used to identify those factors thatare the most sensitive to postmortem changes, in order to usethem as indicators of fillet deterioration.
2. Materials and methods
2.1. Preparation of fish samples and storage conditions
The fish (2370 ± 129 g) were obtained from a fish farm locatedin south-eastern Spain, where they had been raised in floatingcages, feeding on a commercial feed (44–50% protein, 20–22% lip-ids, 8.5–11% ash, and 0.4–1.5% fibre). Twenty-four hours afterslaughter (by immersion in a water/ice mixture), they arrivedpackaged in polystyrene boxes, covered with a layer of flake ice,at the Marine Aquaculture Station at San Pedro del Pinatar, whichforms part of the Instituto Murciano de Investigación y DesarrolloAgrario y Alimentario (IMIDA). Once in the laboratory, they werefilleted with their skin left on. The fillets (925 ± 69 g) werewrapped in a thin polyethylene film and placed in polystyreneboxes, then covered with flake ice. The polystyrene boxes, provided
Fig. 1. Diagram of the fillet distribution on the meagre used for physicochemical anddifferent analyses: (1) microbiological count; (2) texture; (3) fatty acid profile, pH, TVBNielsen, & Tortonese (1986)).
with holes for water drainage, were stored refrigerated at 4 ± 0.5 �Cfor 18 days. The ice/fish ratio (2/1) was held constant throughoutthe entire experiment.
Samples were taken on day 0, 4, 7, 11, 14 and 18 of storage, cor-responding to day 2, 6, 9, 13, 16 and 20 postmortem. The filletswere divided into four lots, and four fillets from each lot were ta-ken on each sampling day to perform the different analyses. Twowere used for physicochemical and microbiological analyses, andthe other two for the sensory analysis. The sample collection foreach analysis was carried out as shown in Fig. 1.
2.2. Physicochemical analyses
2.2.1. Proximate compositionA proximate analysis was performed on 8 fish on day 0 of stor-
age. Proximate analyses of the filleted fish were based on the pro-cedures set by the AOAC (1997). The skinless muscle was groundand homogenised. The muscle composition from individual fishwas determined as follows: crude protein, using the Kjeldahlmethod with a 6.25 nitrogen–to–protein conversion factor; crudefat, by petroleum ether extraction using the Soxhlet method anda SOXTEC System HT6 extractor; moisture by drying to constantweight at 105 ± 1 �C; and total ash by incineration to constantweight at 450 ± 2 �C in a muffle furnace.
2.2.2. Fatty acidsIn order to determine the fatty acid profile during storage, the
fat from each sample was extracted using the method describedby Folch, Lees, and Sloane-Stanley (1957). Fatty acids were methyl-ated using the method of Stoffel, Chu, and Ahrens (1959), and thenanalysed using a Varian 3900 gas chromatograph (Varian Inc., PaloAlto, CA) equipped with a flame ionisation detector, and a CP-Sil 88(50 m � 0.25 mm id) column (Varian). Chromatographic peakswere identified by comparison with a commercial 37 FAME Mixstandard (Supelco, Bellafonte, PA).
2.2.3. pH, thiobarbituric acid, total volatile basic nitrogen,trimethylamine, water activity and water-holding capacity
Each portion of the two fillets designated for each analysis washomogenised separately. Five grams of each sample were blendedwith 10 ml distilled water. The pH of the fish homogenate wasmeasured using a digital pH metre (Orion, Beverly, MA), standard-ised at pH 4.01 and 7.00. Thiobarbituric acid (TBA, mg malonalde-hyde/kg fish flesh) was determined according to the methoddescribed by Botsoglou et al. (1994). Total volatile basic nitrogen(TVBN, mg N/100 g fish flesh) was measured using the modifiedmethod of Malle and Tao (1987), whilst the method used by Malle
microbiological analyses. Each number indicates the part of the fillet used for theN and TMA; (4) TBA, WHC and aw. (Modification by Whitehead, Bauchot, Hureau,

M.D. Hernández et al. / Food Chemistry 114 (2009) 237–245 239
and Poumeyrol (1989) was followed for trimethylamine measure-ments (TMA, mg N/100 g fish flesh). Water activity (aw) valueswere determined at 25 �C using a Novasina TH 200 instrument(Axair A6, Novasina, Pfäffikon, Switzerland). The water-holdingcapacity (WHC) analysis was based on the method described byGrau and Hamm (1953). pH, aw and WHC measurements weretaken from fresh samples, and the rest from frozen samples.
2.2.4. Colour measurementsA Minolta Chroma Meter CR400 (Minolta, Osaka, Japan) was
used for colour measurements. Colours were expressed as CIELabcoordinates. In this system, L* represents the colour lightness ona 0–100 point scale from black to white; a* is the position betweenred (+) and green (�); and b* is the position between yellow (+) andblue (�). The colour intensity is expressed by a chroma value ðC�abÞ,whilst hue ðH0
abÞ corresponds to the name of the colour as found inits pure state on the spectrum. These values were calculatedaccording to the formulae:
C�ab ¼ ða�2 þ b�2Þ1=2 andH0ab ¼ arctanðb�=a�Þ:
Four measurements were taken for each fillet: three on the dorsalsection, at an equal distance from one another, with the middlepoint being located at the level of the cut made in the dorsal fingroove, and the fourth one on the ventral part of the fillet next tothe belly, at a point corresponding to the anus on a whole fish.
2.2.5. Texture measurementsTexture profile analyses (TPA) were performed using a QTS-25
texture analyser (Brookfield CNS Farnell, Borehamwood, Hertford-shire, UK) equipped with a 25 kg load cell and Texture Pro V. 2.1software. The samples, measuring 3.5 � 3.5 � 0.7 cm, were com-pressed perpendicularly using a 20 mm diameter cylindrical probe.The testing conditions were two consecutive cycles at 25% com-pression, cross-head movement at a constant speed of 50 mm/min, and a trigger point of 0.05 N. Texture variables (hardness,gumminess, adhesiveness, cohesiveness, chewiness and springi-ness) were calculated as described by Bourne (1978).
2.3. Sensory evaluation
Whole, raw fillets with their skin were used for the sensoryanalysis, evaluated on both sides. A panel of seven judges weretrained according to standard ISO 8586-1 (1993), to evaluate theappearance of the flesh and the skin, the odour and the textureof the fish. A total of 11 attributes were evaluated, each one receiv-ing a score on a continuous scale of demerit points from 1–5, aschanges occurred during storage (Table 1).
Table 1Attributes assessed during the sensory evaluation of meagre fresh fillets
Parameter being assessed Score
Skin appearance Colour 1: Intense 5: WeakShine 1: Very shiny 5: Matte
Flesh appearance Colour 1: Intense 5: WeakShine 1: Very shiny 5: MatteMuscle 1: Hydrated, adhered
myotomes5: Dry, separatedmyotomes
Odour Fresh fish 1: Strong 5: WeakAcidic 1: Strong 5: NDRancid 1: Strong 5: NDAmmoniacal 1: Strong 5: ND
Texture Springness 1: Very elastic 5: Not elasticAdhesiveness 1: Very adhesive 5: Not adhesive
ND, not detected.
2.4. Microbiological analysis
Microbiological counts were determined by placing a 10 g sam-ple in 90 ml of 0.1% peptone–water (Oxoid code CM 9), and homog-enising it with a stomacher (IUL-Instruments, Barcelona, Spain).From this dilution, other decimal dilutions were prepared and pla-ted on the appropriate media. Total viable aerobic bacterial countswere determined by the pour plate method, using plate count agar(PCA, Oxoid code CM 325). The inoculated plates were incubated at30 �C for 72 h for total viable mesophilic counts, and at 15 �C for 5days for psychrophilic counts. For enterobacteria counts, the sam-ple was inoculated into 10 ml of molten (45 �C) violet red bile glu-cose agar (VRBGA, Oxoid code CM 485). After setting, a 10 mloverlay of molten medium was added, and the plates incubated at37 �C for 24 h. Large colonies with purple haloes were counted. Achromogenic medium (Oxoid code CM 956) was used for culturingcoliform/Escherichia coli bacteria, with incubation at 37 �C for 24 h.
In order to determine the presence of Salmonella and Shigella, apre-enrichment process was performed. To that end, 25 g of sam-ple were homogenised with 225 ml of nutrient broth in the stom-acher, and then incubated for 18 h at 37 �C. Following this firstincubation, an aliquot of 0.1 ml was taken and incubated in10 ml of Rappaport Vassiliadis medium (RV, Oxoid code CM 669)for 24 h at 41.5 �C. A second aliquot of 1 ml was also incubatedin selenite broth (Oxoid code CM 395) for 24 h at 37 �C. Samplesfrom each of these broths were then isolated on plates, using anXLD medium (Oxoid code CM 469), incubating them at 37 �C for24 h. This was then confirmed using API 20 (Oxoid code 20100).
Listeria monocytogenes counts were taken from two incubations:a pre-enrichment in half-Fraser broth at 37 �C for 24 h, and anenrichment in Fraser broth (Oxoid code CM 895) at 37 �C for24 h, using a miniVidas system to confirm the presence/absenceof these bacteria. Cetrimide fusidin cephaloridine agar (CFC, Oxoidcode CM 559, supplemented with SR 102) incubated at 20 �C for 2days was used to detect the presence of Pseudomonas.
The presence of Shewanella was determined by means of threeseparate cultures, each using a different medium. It was consideredto be present only if the growth proved to be positive in all threecases. The conditions for each incubation were: MacConkey agarmedium (Oxoid code CM 7) at 30 �C for 24 h; iron agar (IA, Oxoidcode CM 867) at 20 �C for 4 days; and blood agar medium (Oxoidcode CM 55) at 25 �C for 3 days.
Microbiological data were transformed into logarithms of thenumber of colony-forming units (cfu g�1). All plates were visuallyexamined for the typical colony types and morphological charac-teristics associated with each growth medium. All counts wereperformed in duplicate.
2.5. Statistical analysis
In order to detect statistically significant differences, experi-mental values were compared using a one-way analysis of varianceand a correlation analysis, to evaluate the influence of storage timeon the parameters measured. The significance level was set atp < 0.05. Values throughout the text are expressed as mean ± stan-dard deviation. A regression analysis was used to determine theshelf-life of meagre fillets; the data were fitted by a linear model,Y = a + bX, where Y represents the mesophilic count and X is thetime in storage. A factor analysis was used to determine whichvariables, independent as well as dependent, had greater factorloadings or weights, with those having a value greater than 0.7being considered significant (Hair, Anderson, Tatham, & Black,1999). All data were normalised (Zi = (Xi � Si)/Xi), and the factorswere extracted using the principal components method. To facili-tate the interpretation of the results, the axes were rotated accord-ing to the Varimax method.

240 M.D. Hernández et al. / Food Chemistry 114 (2009) 237–245
3. Results
3.1. Physicochemical analyses
3.1.1. Proximate analysisThe macronutrient composition of meagre fillets was 19.8% pro-
tein, 2.49% fat, 76.3% moisture and 1.26% ash.
3.1.2. Fatty acidsFig. 2 shows the total saturated, monounsaturated and unsatu-
rated fatty acids found in meagre fillets on the different samplingdays. The percentage of saturated fatty acids fell within a rangeof 31.1–33.0%, whereas the range for monounsaturated was25.7–30.7% and for polyunsaturated 38.1–43.2%. No statisticallysignificant differences were found in SFA, MUFA or PUFA over the18 day storage period.
3.1.3. pH, TBA, TVBN, TMA, aw and WHCTable 2 summarises the average values and standard deviations
for the physicochemical parameters analysed on each samplingday. Of all the parameters measured, only TBA exhibited a signifi-cant correlation with storage time (r = 0.96), gradually increasingwith each sampling day. The initial TBA value was 0.10 mg MDA/kg (day 0), and the final value was 2.55 mg MDA/kg (day 18), thedifferences being statistically significant (p < 0.05) from day 7 on.
The pH varied between 6.43 and 6.71, with significant differ-ences between days 4 and 11, which corresponded to the mini-mum and maximum value, respectively. However, they did notcorrelate significantly with time. The average TVBN (16.7–20.4 mg N/100 g) and TMA (12.7–14.9 mg N/100 g) values re-mained relatively constant throughout the storage period, in spite
Saturated Monounsa
0
5
10
15
20
25
30
35
40
45
0 4 7
Storage
Fatty
aci
ds (
%)
Fig. 2. Comparative evolution of fatty acid con
Table 2Meagre muscle chemical and physical parameter changes during ice storage
Days of storage 0 4 7
pH 6.49 ± 0.10ab 6.43 ± 0.04a 6.57 ± 0.TBA (mg MDA/kg muscle) 0.10 ± 0.04a 0.24 ± 0.04a 0.86 ± 0.TVB-N (mg N/100 g muscle) 20.4 ± 0.97a 18.2 ± 0.68bc 17.3 ± 0.TMA (mg N/100 g muscle) 14.3 ± 0.23ab 14.4 ± 0.40ab 12.7 ± 0.aw 0.94 ± 0.005 0.94 ± 0.002 0.94 ± 0.WHC 13.8 ± 1.99 13.0 ± 2.61 14.8 ± 4.
Means ± standard deviation.Data within the same row with different letters are significantly (p < 0.05) different.r, Correlation value.* Indicates a significant correlation (p < 0.05).
of showing significant differences between certain days of theexperiment. The aw and WHC values showed no significantchanges over the 18 days of storage (Table 2).
3.1.4. Colour measurementsWith the exception of a*, all parameters defining meagre fillet
colour showed a significant correlation with storage time (Table3). The minimum value for L* (43.95) occurred on day 0, and themaximum on day 18 (47.08); this parameter increased throughoutthe storage time (r = �0.49), with significant differences being ob-served as of day 7. With regards to chromaticity parameters, onlyb* showed significant changes, oscillating between �5.48 (day 0)and �4.08 (day 11) (r = 0.59) with a gradual increase. The chromavalue decreased with time in storage (r = �0.61), varying between5.58 (day 0) and 4.23 (day 11). No significant changes were seenfor hue over storage time, but it did show a significant correlation(r = �0.38).
3.1.5. Texture measurementsThe average values for hardness, cohesiveness and elasticity
(Table 4) displayed significant variations (p < 0.05) on the differentsampling days; however, only hardness correlated significantlywith storage time (r = �0.68). This parameter decreased duringstorage, with values close to 27 up until day 7, and varying be-tween 23 and 25 afterwards.
3.2. Sensory analysis
Table 5 shows the average scores given by the panelists to eachof the attributes examined on each sampling day. All sensoryparameters correlated with time. According to the scale used,
turated Polyunsaturated
11 14 18
time (days)
tent in meagre fillets during ice storage.
11 14 18 r
10ab 6.71 ± 0.13b 6.49 ± 0.10ab 6.63 ± 0.14ab 0.2910b 0.82 ± 0.69c 1.77 ± 0.57c 2.55 ± 0.24d 0.96*
61bc 16.7 ± 0.76c 18.7 ± 0.82ab 20.0 ± 0.48a 0.2647a 12.7 ± 0.78a 14.3 ± 0.88ab 14.9 ± 1.23b 0.35002 0.94 ± 0.001 0.94 ± 0.002 0.95 ± 0.003 0.2536 13.1 ± 1.20 13.1 ± 5.49 11.8 ± 4.19 �0.14

Table 3Colour measurements during ice storage of meagre fillets
Days of storage 0 4 7 11 14 18 r
L* 44.0 ± 0.27a 46.1 ± 0.94ab 46.8 ± 1.09b 46.7 ± 1.09b 45.8 ± 0.48ab 47.1 ± 1.31b 0.49*
a* �1.01 ± 0.25 �0.99 ± 0.24 �1.33 ± 0.31 �1.04 ± 0.38 �1.00 ± 0.22 �1.17 ± 0.31 �0.23b* �5.48 ± 0.57a �5.14 ± 0.45ab �4.51 ± 0.38ab �4.08 ± 0.59b �4.86 ± 0.47ab �4.17 ± 0.75b 0.59*
ðC�abÞ 5.58 ± 0.56a 5.23 ± 0.46ab 4.72 ± 0.30ab 4.23 ± ± 0.51b 4.97 ± 0.42ab 4.35 ± 0.65b �0.61*
ðH0abÞ 1.39 ± 0.05 1.38 ± 0.04 1.28 ± 0.08 1.31 ± 0.11 1.36 ± 0.06 1.29 ± 0.12 �0.38*
Means ± standard deviation.Data within the same row with different letters are significantly (p < 0.05) different.r, Correlation value.* Indicates a significant correlation (p < 0.05).
Table 4Instrumental texture analyses during ice storage for meagre fillets
Days of storage 0 4 7 11 14 18 r
Hardness (N) 26.9 ± 1.86a 27.0 ± 0.24a 27.2 ± 0.82a 23.2 ± 1.75a 23.0 ± 1.75a 25.0 ± 0.15a �0.68*
Gumminess (N) 9.90 ± 0.61 9.78 ± 0.67 8.45 ± 0.87 8.95 ± 1.10 9.03 ± 1.23 9.00 ± 0.33 �0.42Adhesiveness (Ns) �1.40 ± 0.33 �1.26 ± 0.18 �1.47 ± 0.47 �1.09 ± 0.26 �1.33 ± 0.59 �1.07 ± 0.14 0.41Cohesiveness 0.39 ± 0.02a 0.37 ± 0.02ab 0.31 ± 0.04b 0.39 ± 0.03a 0.38 ± 0.01a 0.36 ± 0.01ab 0.10Chewiness (N mm) 42.3 ± 6.04 51.3 ± 6.48 48.0 ± 5.90 43.9 ± 6.38 47.4 ± 6.14 48.5 ± 3.22 0.00Springiness (mm) 4.25 ± 0.38a 4.87 ± 0.16ab 5.67 ± 0.24c 4.91 ± 0.10ab 5.19 ± 0.25bc 5.40 ± 0.48bc 0.39
Means ± standard deviation.Data within the same row with different letters are significantly (p < 0.05) different.r, Correlation value.* Indicates a significant correlation (p < 0.05).
Table 5Sensory evaluations of meagre fillets during the ice storage period
Days of storage 0 4 7 11 14 18 r
Skin colour 1.21 ± 0.42a 1.15 ± 0.37a 1.94 ± 0.58b 2.14 ± 0.87b 2.93 ± 0.56c 3.20 ± 0.50c 0.95*
Skin shine 1.14 ± 0.36a 1.45 ± 0.46a 2.17 ± 0.95bc 2.13 ± 0.72b 2.82 ± 0.66d 2.68 ± 0.71c 0.87*
Flesh colour 1.07 ± 0.26a 1.00 ± 0.00a 2.15 ± 1.02b 2.52 ± 0.65bc 2.86 ± 0.61c 3.55 ± 0.63d 0.93*
Flesh shine 1.09 ± 0.39a 1.20 ± 0.41a 1.48 ± 0.62a 2.14 ± 1.24b 2.57 ± 0.69b 3.43 ± 0.73c 0.96*
Muscle appearance 1.04 ± 0.19a 1.08 ± 0.24ab 1.54 ± 0.44b 2.25 ± 0.79c 2.61 ± 0.55c 3.20 ± 0.70d 0.97*
Fresh odour 1.00 ± 0.00a 1.10 ± 0.31ab 1.58 ± 0.73b 2.59 ± 0.64c 3.25 ± 1.00d 4.25 ± 0.87e 0.97*
Acidic odour 5.00 ± 0.00a 5.00 ± 0.00a 4.92 ± 0.32a 4.71 ± 0.81a 4.68 ± 0.72a 4.13 ± 0.94b �0.85*
Rancid odour 5.00 ± 0.00a 5.00 ± 0.00a 5.00 ± 0.00a 4.75 ± 0.75a 4.77 ± 0.65a 4.04 ± 0.95b �0.79*
Ammoniacal odour 5.00 ± 0.00a 5.00 ± 0.00a 5.00 ± 0.00a 4.89 ± 0.31a 4.91 ± 0.27a 3.71 ± 1.37b �0.82*
Springiness 1.11 ± 0.28a 1.20 ± 0.41a 1.69 ± 0.55b 2.52 ± 0.74c 2.68 ± 0.55c 3.27 ± 0.63d 0.98*
Adhesiveness 4.95 ± 0.21a 4.48 ± 0.41ab 3.92 ± 0.90c 3.98 ± 0.75bc 3.23 ± 0.71d 2.32 ± 0.46e �0.97*
Means ± standard deviation.Data within the same row with different letters are significantly (p < 0.05) different.r, Correlation value.* Indicates a significant correlation (p < 0.05).
M.D. Hernández et al. / Food Chemistry 114 (2009) 237–245 241
acidic, rancid and ammoniacal odours were not detected until day18. By contrast, the fresh odour, which was quite prominent on day0, became increasingly weaker. The rest of the attributes showedsignificant differences after day 7, except for fillet shine, which be-gan to fade after day 11 of storage.
Table 6Microbiological evaluation (log ufc/g muscle) of meagre muscle during ice storage
Days of storage 0 4 7
Total aerobic mesophilic 3.11 ± 0.27a 4.87 ± 0.27b 5.77 ± 0.Total aerobic psycrophilic 2.82 ± 0.41a 4.69 ± 0.30b 5.53 ± 0.Enterobacteria 1.69 ± 0.21a 4.80 ± 0.06b 6.70 ± 0.Coliforms 1.95 ± 0.38a 4.78 ± 0.11b 6.45 ± 0.
Pseudomonas, E. coli and Shewanella: <10; Listeria an
Means ± standard deviation.Data within the same row with different letters are significantly (p < 0.05) different.r, Correlation value.<10, negative counts; ABS: absence.* Indicates a significant correlation (p < 0.05).
3.3. Microbiological analysis
The mesophilic and psychrophilic aerobic, enterobacteria andcoliform counts for the meagre fillets during the ice storage periodcorrelated with time, yielding very high coefficients (0.99–1.00).
11 14 18 r
26c 7.10 ± 0.19d 9.06 ± 0.18e 11.2 ± 0.64f 0.99*
32c 7.07 ± 0.17d 8.85 ± 0.18e 10.8 ± 0.30f 0.99*
06c 8.74 ± 0.26d 11.3 ± 0.19e 14.3 ± 0.07f 1.00*
08c 8.58 ± 0.22d 11.2 ± 0.18e 14.2 ± 0.16f 1.00*
d Salmonella/Shigella: ABS
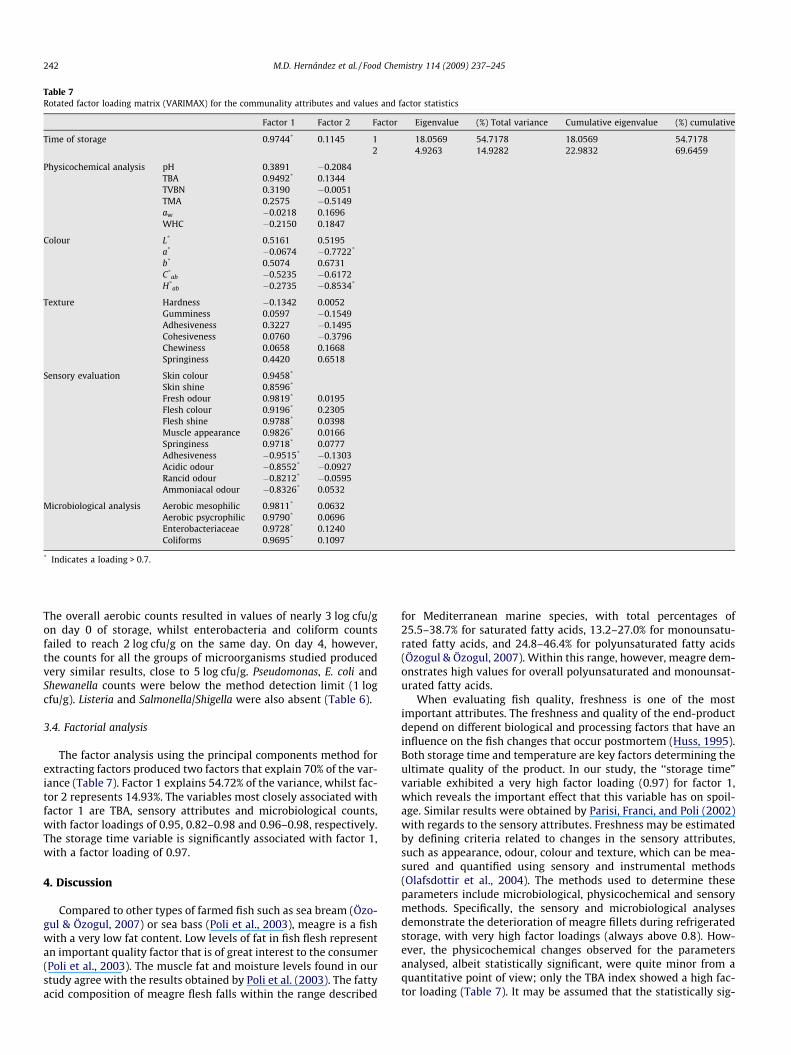
Table 7Rotated factor loading matrix (VARIMAX) for the communality attributes and values and factor statistics
Factor 1 Factor 2 Factor Eigenvalue (%) Total variance Cumulative eigenvalue (%) cumulative
Time of storage 0.9744* 0.1145 1 18.0569 54.7178 18.0569 54.71782 4.9263 14.9282 22.9832 69.6459
Physicochemical analysis pH 0.3891 �0.2084TBA 0.9492* 0.1344TVBN 0.3190 �0.0051TMA 0.2575 �0.5149aw �0.0218 0.1696WHC �0.2150 0.1847
Colour L* 0.5161 0.5195a* �0.0674 �0.7722*
b* 0.5074 0.6731C*
ab �0.5235 �0.6172H*
ab �0.2735 �0.8534*
Texture Hardness �0.1342 0.0052Gumminess 0.0597 �0.1549Adhesiveness 0.3227 �0.1495Cohesiveness 0.0760 �0.3796Chewiness 0.0658 0.1668Springiness 0.4420 0.6518
Sensory evaluation Skin colour 0.9458*
Skin shine 0.8596*
Fresh odour 0.9819* 0.0195Flesh colour 0.9196* 0.2305Flesh shine 0.9788* 0.0398Muscle appearance 0.9826* 0.0166Springiness 0.9718* 0.0777Adhesiveness �0.9515* �0.1303Acidic odour �0.8552* �0.0927Rancid odour �0.8212* �0.0595Ammoniacal odour �0.8326* 0.0532
Microbiological analysis Aerobic mesophilic 0.9811* 0.0632Aerobic psycrophilic 0.9790* 0.0696Enterobacteriaceae 0.9728* 0.1240Coliforms 0.9695* 0.1097
* Indicates a loading > 0.7.
242 M.D. Hernández et al. / Food Chemistry 114 (2009) 237–245
The overall aerobic counts resulted in values of nearly 3 log cfu/gon day 0 of storage, whilst enterobacteria and coliform countsfailed to reach 2 log cfu/g on the same day. On day 4, however,the counts for all the groups of microorganisms studied producedvery similar results, close to 5 log cfu/g. Pseudomonas, E. coli andShewanella counts were below the method detection limit (1 logcfu/g). Listeria and Salmonella/Shigella were also absent (Table 6).
3.4. Factorial analysis
The factor analysis using the principal components method forextracting factors produced two factors that explain 70% of the var-iance (Table 7). Factor 1 explains 54.72% of the variance, whilst fac-tor 2 represents 14.93%. The variables most closely associated withfactor 1 are TBA, sensory attributes and microbiological counts,with factor loadings of 0.95, 0.82–0.98 and 0.96–0.98, respectively.The storage time variable is significantly associated with factor 1,with a factor loading of 0.97.
4. Discussion
Compared to other types of farmed fish such as sea bream (Özo-gul & Özogul, 2007) or sea bass (Poli et al., 2003), meagre is a fishwith a very low fat content. Low levels of fat in fish flesh representan important quality factor that is of great interest to the consumer(Poli et al., 2003). The muscle fat and moisture levels found in ourstudy agree with the results obtained by Poli et al. (2003). The fattyacid composition of meagre flesh falls within the range described
for Mediterranean marine species, with total percentages of25.5–38.7% for saturated fatty acids, 13.2–27.0% for monounsatu-rated fatty acids, and 24.8–46.4% for polyunsaturated fatty acids(Özogul & Özogul, 2007). Within this range, however, meagre dem-onstrates high values for overall polyunsaturated and monounsat-urated fatty acids.
When evaluating fish quality, freshness is one of the mostimportant attributes. The freshness and quality of the end-productdepend on different biological and processing factors that have aninfluence on the fish changes that occur postmortem (Huss, 1995).Both storage time and temperature are key factors determining theultimate quality of the product. In our study, the ‘‘storage time”variable exhibited a very high factor loading (0.97) for factor 1,which reveals the important effect that this variable has on spoil-age. Similar results were obtained by Parisi, Franci, and Poli (2002)with regards to the sensory attributes. Freshness may be estimatedby defining criteria related to changes in the sensory attributes,such as appearance, odour, colour and texture, which can be mea-sured and quantified using sensory and instrumental methods(Olafsdottir et al., 2004). The methods used to determine theseparameters include microbiological, physicochemical and sensorymethods. Specifically, the sensory and microbiological analysesdemonstrate the deterioration of meagre fillets during refrigeratedstorage, with very high factor loadings (always above 0.8). How-ever, the physicochemical changes observed for the parametersanalysed, albeit statistically significant, were quite minor from aquantitative point of view; only the TBA index showed a high fac-tor loading (Table 7). It may be assumed that the statistically sig-

M.D. Hernández et al. / Food Chemistry 114 (2009) 237–245 243
nificant differences observed for pH, TVBN and TMA average valuesamongst different sampling points are the result of variabilitywithin the parameters themselves.
The glycogenolysis that occurs after death in fish causes areduction in pH. Although the pH value may vary depending onthe species, a lower pH limit of 6.2 has been established for speciesin a state of rest prior to sacrifice (Love, 1988). During later post-mortem stages, there is a pH increase, due to decomposition ofnitrogenated compounds, caused primarily by microbial activity.The intensity of this pH change depends mainly on the storagetemperature, with pH values above 7.1 being indicative of decom-position. The average pH values we have obtained (6.43–6.71) fallwithin the typical range for fish and agree with those observed byPoli et al. (2003) for whole meagre stored under similar conditions.The pH values observed in this study failed to exhibit majorchanges. However, a pH increase has been observed for other mar-ine species stored under similar conditions, such as Sardina pilchar-dus (Rodríguez-Casado et al., 2007), Sparus aurata (Kilinc, Cakli,Cadun, Dincer, & Tolasa, 2007), Psetta maxima (Rodríguez, Barros-Velázquez, Piñeiro, Gallardo, & Aubourg, 2006), Dicentrarchus lab-rax (Kilinc et al., 2007; Özden, Inagur, & Erkan, 2007), and Soleasenegalensis (Tejada, De las Heras, & Kent, 2007).
Lipid oxidation in fish depends on numerous factors (the spe-cies, storage temperature, fat composition, etc.). TBA values inmeagre fillets are strongly correlated with storage time (r = 0.96).Our values are lower than those reported for fillets from fish withhigher fat contents than meagre stored under similar conditions,such as sea bass (Taliadourou et al., 2003) and trout (Chytiriet al., 2004), indicating lower oxidative rancidity, probably due tothe low fat content of meagre. In addition to fat content, oxidativerancidity may be affected by other factors, such as filleting. Since afillet has a larger surface area exposed to oxygen, it is more proneto oxidation than whole fish. Based on the TBA differences ob-served throughout storage, we may consider this parameter as agood index of meagre fillet deterioration when the fish is kept inice storage.
Lipid oxidation produces a number of substances, some ofwhich have unpleasant flavours and odours. Some may also con-tribute to texture changes, by forming covalent bonds with muscu-lar proteins (Huss, 1995). The TBA variations in our study showed avery significant correlation with both fillet hardness (r = �0.61)and all the attributes evaluated in the sensory analysis (r = 0.82–0.98). According to Connell (1995), TBA values of 1–2 mg MDA/kg in fish muscle are associated with the development of question-able flavours and odours. In our study, acidic, rancid and ammoni-acal odours were not detected until day 18, when the TBA valuewas 2.55 mg MDA/kg fish muscle. A significant positive correlationwas also observed for microbiological counts (r = 0.94�0.96), asthe oxidative reactions can be catalysed not only by the digestiveenzymes of the fish itself, but also by bacterial enzymes (Huss,1995).
Both TVBN and TMA failed to demonstrate a clear tendency toincrease over the storage period. Generally, these analyses only re-flect advanced spoilage, and are not considered very reliable formeasuring the deterioration of certain species (Castro, Penedo Pad-rón, Caballero Cansino, Sanjuán Velázquez, & Millán De Larriva,2006; Tejada et al., 2007; Özogul, Kuley, & Özogul, 2007). Castroet al. (2006) did not observe any increase in volatile bases untilafter 20–22 days of storage, when the fish was already consideredunfit for human consumption. However, increases in these param-eters during storage have been observed in many studies (Cakliet al., 2007; Kilinc et al., 2007; Özden et al., 2007). Levels of 30–35 mg TVBN/100 g in muscle are generally considered to be theacceptable limit for cold-water fish stored on ice (Connell, 1995).The TMA level for fresh fish, above which it is rejected by a sensorypanel, varies depending on the fish species. Dalgaard (2003) has
noted that even in TMAO-containing seafood, little TMA is pro-duced until the specific spoilage organisms reach high numbers.Therefore, TMA can only be used as an index of spoilage, not asan index of freshness. The increase in nitrogenated bases (TVBNand TMA) produced by the activity of proteolytic bacteria wouldbe accompanied by a pH increase (Rodríguez, Losada, Aubourg, &Barros-Velázquez, 2004). In our study, no statistically significantchanges were observed for any of the three parameters.
A large percentage of TVBNs are the product of microbial catab-olism, an example of which is the reduction of trimethylamineoxide (TMAO) to TMA. Trimethylamine oxide is an important osm-oregulator that can be found in concentrations of up to 1% in someteleosts, such as salmon and cod (Fraser & Sumar, 1998). TMA val-ues for meagre fillets are above those reported for other marinespecies (Kilinc et al., 2007; Rodríguez et al., 2004; Rodríguezet al., 2006; Tejada et al., 2007; Özden et al., 2007), possibly dueto the high levels of TMAO in meagre muscle. TMAO reduction toTMA is a reaction typical of certain bacteria (Aeromonas spp., psy-chrotolerant enterobacteria, S. putrefaciens and Vibrio spp.) that arepresent in spoiling fish. S. putrefaciens has been identified as thespecific bacteria responsible for the spoilage of warm-water fishstored aerobically on ice (Huss, 1995). In our study, the Shewanellacount yielded negative results. Even though their correlation withTMA was not significant (r = 0.27), enterobacteria counts reachedup to 14.3 log cfu/g of flesh. However, no further analyses wereperformed on other TMAO-reducing bacteria that could be respon-sible for TMA production in meagre fillets.
In our study, colour changes occurred in meagre fillets on asearly as day four. Lightness (L*) showed a slight increase as thestorage time progressed, possibly due to greater water depositson the fish surface, as the result of melting ice and liquid retentionbetween the polyethylene film covering the fillets. The value of b*
displayed a significant correlation (r = 0.59) with storage time,reflecting an evolution toward grey–blue tones as the muscle aged.ðC�abÞ decreased with days spent on ice, indicating a reduction incolour intensity. Several authors have attributed colour loss in fishmuscle during storage to the oxidation of proteins with haemogroups, such as haemoglobin and myoglobin (Chaijan, Benjakul,Visessanguan, & Faustman, 2005; Richards, Modra, & Li, 2002). Fur-thermore, TBA values were significantly correlated with b* (0.63)and ðC�abÞ (�0.64). According to Richards et al. (2002), haemoglobinis a possible catalyst of lipid oxidation, due to its auto-oxidativecapacity.
Fish muscle texture depends on a number of intrinsic biologicalfactors that are related to muscle fibre density, and involving bothfat and collagen content. The fish death triggers autolytic andmicrobiological processes that make the muscle softer and lesselastic (Olafsdottir et al., 2004). In our study, hardness was signif-icantly correlated with storage time (r = �0.68), and with all micro-biological counts (r between �0.63 and �0.65). Whilst colour andtexture measurements were not good indicators of deterioration,they may be used at certain times to support data obtained byphysicochemical, microbiological and sensory methods.
Freshness is the most important attribute when evaluating thequality of fish. The loss of freshness changes the sensory parame-ters, which have a direct effect upon the product acceptance onthe part of the consumer. The first sensory changes to occur instored fish are related to appearance and texture (Huss, 1995). Inagreement with this author’s findings, the first change we observedin fresh meagre fillets was a deterioration in muscle appearanceand adhesiveness on day 4 of storage. A slight reduction in freshodour was also noticed on this day, as fish began to lose the typicalsea odour that they give off as fresh fish products. In fact, this wasone of the attributes that was most affected during storage. On thefollowing sampling day, a reduction in colour intensity for both theflesh and the skin began to be noticeable, and the skin was less

244 M.D. Hernández et al. / Food Chemistry 114 (2009) 237–245
shiny. Poli et al. (2006) obtained similar results for sea bass filletsprepared from whole fish stored in ice. However, no unpleasantacidic, rancid or ammoniacal odours were noted (p < 0.05) untilthe end of the storage period (day 18), although off odours beganto be detected on day 11 of storage.
The results of the sensory analysis demonstrate that the attri-butes selected are good indicators of meagre fillet deteriorationduring storage on ice, all of them showing a correlation with timeof greater than 0.79. Similar results have been obtained for othermarine species (Paleologos et al., 2004; Poli et al., 2006; Taliadou-rou et al., 2003). If we consider the midpoint of the scale (3) asacceptable, the results indicate that ice storage maintains the qual-ity of fillets until the end of the storage period. However, as is to beexpected, a progressive loss of quality is observed as time passes.Nevertheless, the results of the sensory analysis must be confirmedby the microbiological analysis. This ultimately determines the fishshelf-life, which is based on microbiological standards specificallydeveloped for fish and aquaculture products.
The microbiological analysis also showed a very strong signifi-cant correlation with storage time, above 0.99 for all counts. Theinitial (day 0) mesophilic count (3.11 log cfu/g) indicates that themeagre fillets were of a good quality. Paleologos et al. (2004) andTaliadourou et al. (2003) found similar initial mesophilic countsfor whole sea bass (3.5 log cfu/g in both studies), and higher countsfor fillets (4.9 and 5.2 log cfu/g, respectively) stored under thesame conditions, attributing the relatively lower quality of the fil-lets to contamination during the filleting process.
During aerobic storage, specific spoilage bacteria levels of 8 to9 log cfu/g must be present to produce significant amounts of thechemical compounds associated with spoilage (Huss, 1995). Inour study, these counts were not reached until days 11 (for enter-obacteria and coliforms) and 14 (for total aerobes). However, thespecific bacteria that cause the spoilage of meagre fillets havenot been identified. Pseudomonas spp. and Shewanella spp. arethe main microorganisms specifically responsible for the distinc-tive spoilage experienced by fish preserved aerobically on ice(Gram & Huss, 1996). In our study, the counts for both generayielded negative results.
The ICMSF (1986) has established an aerobic mesophilic countlimit of 7 log cfu/g for fish that is fit for human consumption. Thisvalue (7.10) was reached on day 11 of storage, and fillet shelf-lifewas subsequently determined using a regression analysis (logcfu/g = 2.9009 + 0.4396*day). Based on the regression equation,the mesophilic count limit would be reached on day 9 of stor-age. Similar results were obtained by Paleologos et al. (2004) andTaliadourou et al. (2003), estimating the shelf-life of sea bass filletsto be 8–9 days and 7 days, respectively.
5. Conclusions
The parameters that proved to be most sensitive to variationsover storage time were TBA concentration, aerobic mesophilic,psychrophilic, enterobacteria and coliform counts, and all attri-butes related to the sensory analysis. They may therefore be con-sidered as good indicators for evaluating spoilage in meagrefillets stored on ice for 18 days. The results of these analysesshowed optimal quality for meagre fillets stored under these con-ditions, and established a microbiological shelf-life of 9 days,although based on sensory criteria, the product’s shelf-life may ex-tend beyond this period.
Acknowledgement
This research was supported by grants from the ‘‘Planes Nacio-nales de Acuicultura (JACUMAR)”.
References
AOAC (1997). Official methods of analysis (16th ed.). Washington: Association ofOfficial Analytical Chemists.
Botsoglou, N. A., Fletouris, D. J., Papageorgiou, G. E., Vassilopoulos, V. N., Mantis, A. J.,& Trakatellis, A. G. (1994). Rapid, sensitive and specific thiobarbituric acidmethod for measuring peroxidation in animal tissue, food and feedstuffsamples. Journal of Agricultural and Food Chemistry, 42, 1931–1937.
Bourne, M. C. (1978). Texture profile analysis. Food Technology, 32(7), 62–66.Cakli, S., Kilinc, B., Cadun, A., Dincer, T., & Tolasa, S. (2007). Quality differences of
whole ungutted sea bream (S. aurata) and sea bass (D. labrax) while stored inice. Food Chemistry, 18, 391–397.
Castro, P., Penedo Padrón, J. C., Caballero Cansino, M. J., Sanjuán Velázquez, E., &Millán De Larriva, R. (2006). Total volatile base nitrogen and its use to assessfreshness in European sea bass stored in ice. Food Control, 17, 245–248.
Chaijan, M., Benjakul, S., Visessanguan, W., & Faustman, C. (2005). Changes ofpigments and colour in sardine (Sardinella gibbosa) and mackerel (Rastrelligerkanagurta) muscle during iced storage. Food Chemistry, 93, 607–617.
Chytiri, S., Chouliara, I., Savvaidis, I. N., & Kontominas, M. G. (2004). Microbiological,chemical and sensory assessment of iced whole and filleted aquaculturedrainbow trout. Food Microbiology, 21, 157–165.
Connell, J. J. (1995). Control of fish quality (4th ed.). London: Fishing News BooksLimited.
Dalgaard, P. (2003). Fish/spoilage of seafood. Encyclopedia of food science andnutrition. Elsevier Science. pp. 2462–2471.
Folch, J., Lees, M., & Sloane-Stanley, G. H. (1957). A simple method for the isolationand purification of total lipids from animal tissues. Journal of BiologicalChemistry, 226, 497–509.
Fraser, O. P., & Sumar, S. (1998). Compositional changes and spoilage in fish (partII)–microbiological induced deterioration. Nutrition and Food Science, 6,325–329.
GIAUC (Grupo de Investigación en Acuicultura en la Universidad de Cantabria)(2006). Estudio de mercado: Demanda de filete de dorada en el mercado español.Ministerio de Agricultura, Pesca y Alimentación. Madrid.
Gram, L., & Huss, H. H. (1996). Microbiological spoilage of fish and fish products.International Journal of Food Microbiology, 33, 121–137.
Grau, R., & Hamm, R. (1953). Eine einfache methode zur bestimmung der wasserbindung im muskes. Naturwissenschaften, 6, 29–30.
Griffiths, M. H., & Heemstra, P. C. (1995). A contribution to the taxonomy of themarine fish genus Argyrosomus (Perciformes: Sciaenidae), with description oftwo new species from Southern Africa. Ichthyological Bulletin, 65, 1–40.
Hair, J. F., Jr., Anderson, R. E., Tatham, R. L., & Black, W. C. (1999). AnalisisMultivariante (fifth ed.). Madrid, Spain: Prentice Hall Iberia. 832 pp.
Huss, H. H. (1995). Quality and quality changes in fresh fish. FAO fisheries technicalpaper (Vol. 348). Rome: FAO.
ICMSF (1986). International Commission on Microbiological Specifications forFoods. Sampling plans for fish and shellfish. In: ICMSF, Microorganisms in foods.Sampling for microbiological analysis: Principles and scientific applications, (2nded., vol. 2, pp. 181–196). University of Toronto Press: Toronto, Canada.
ISO 8586-1 (1993). Sensory analysis. General guidance for the selection, training andmonitoring of assessors. Part 1: Selected assessors.
Jiménez, M. T., Pastor, E., Grau, A., Alconchel, J. I., Sánchez, R., & Cárdenas, S. (2005).Revisión del cultivo de esciénidos en el mundo, con especial atención a lacorvina A. regius (Asso, 1801). Boletín del Instituto Español de Oceanografía, 21,1–4.
Kilinc, B., Cakli, S., Cadun, A., Dincer, T., & Tolasa, S. (2007). Comparison of effects ofslurry ice and flake ice pretreatments on the quality of aquacultured sea bream(S. aurata) and sea bass (D. labrax) stored at 4 �C. Food Chemistry, 104,1611–1617.
Koutsoumanis, K., Giannakourou, M. C., Taoukis, P. S., & Nychas, G. J. E. (2002).Application of shelf-life decision system (SLDS) to marine cultured fish quality.International Journal of Food Microbiology, 73, 375–382.
Love, R. M. (1988). The food fishes. Their intrinsic variation and practical implications.London: Farrand Press.
Malle, P., & Tao, S. H. (1987). Rapid quantitative determination of trimethylamineusing steam distillation. Journal of Food Protection, 50, 756–760.
Malle, P., & Poumeyrol, M. (1989). A new chemical criterion for the quality controlof fish: trimethylamine/total volatile basic nitrogen (%). Journal of FoodProtection, 52, 419–423.
Olafsdottir, G., Nesvadba, P., Di Natale, C., Careche, M., Oehlenschlager, J.,Tryggvadottir, S. V., et al. (2004). Multisensors for fish quality determination.Trends in Food Science and Technology, 15, 86–93.
Özden, Ö., Inagur, M., & Erkan, N. (2007). Effect of different dose gamma radiationand refrigeration on the chemical and sensory properties and microbiologicalstatus of aquacultured sea bass (D. labrax). Radiation Physics and Chemistry, 76,1169–1178.
Özogul, F., Kuley, E., & Özogul, Y. (2007). Sensory, chemical and microbiologicalquality parameters in sea bream (S. aurata) stored in ice or wrapped in clingfilm or in aluminium foil at 2 ± 1 �C. International Journal of Food Science andTechnology, 42, 903–909.
Özogul, Y., & Özogul, F. (2007). Fatty acid profiles of commercially important fishspecies from the Mediterranean, Aegean and Black seas. Food Chemistry, 100,1634–1638.
Paleologos, E. K., Savvaidis, I. N., & Kontominas, M. G. (2004). Biogenic aminesformation and its relation to microbiological and sensory attributes in ice-

M.D. Hernández et al. / Food Chemistry 114 (2009) 237–245 245
stored whole, gutted and filleted Mediterranean Sea bass (D. labrax). FoodMicrobiology, 21, 549–557.
Parisi, G., Franci, O., & Poli, B. M. (2002). Application of multivariate analysis tosensorial and instrumental parameters of freshness in refrigerated sea bass (D.labrax) during shelf-life. Aquaculture, 214, 153–167.
Pastor, E., Grau, A., Massutí, E., & Sánchez-Madrid, A. (2002). Preliminary results ongrowth of meagre, A. regius (Asso, 1801) in sea cages and indoor tanks. EASEspecial Publication, 32, 422–423.
Poli, B. M., Parisi, G., Zampacavallo, G., Iurzan, F., Mecatti, M., & Lupi, P. (2003).Preliminary results on quality and quality changes in reared meagre (A. regius):body and fillet traits and freshness changes in refrigerated commercial-size fish.Aquaculture International, 11, 301–311.
Poli, B. M., Messini, A., Parisi, G., Scappini, F., Vigiani, V., & Giorgi, G. (2006). Sensory,physical, chemical and microbiological changes in European sea bass (D. labrax)fillets packed under modified atmosphere/air or prepared from whole fishstored in ice. International Journal of Food Science and Technology, 41, 444–454.
Richards, M. P., Modra, A. M., & Li, R. (2002). Role of deoxyhemoglobin in lipidoxidation of washed cod muscle mediated by trout, poultry and beefhemoglobins. Meat Science, 62, 157–163.
Rodríguez, O., Losada, V., Aubourg, S. P., & Barros-Velázquez, J. (2004). Enhancedshelf-life of chilled European hake (Merluccius merluccius) stored in slurry ice as
determined by sensory analysis and assessment of microbiological activity.Food Research International, 37, 749–757.
Rodríguez, O., Barros-Velázquez, J., Piñeiro, C., Gallardo, J. M., & Aubourg, P. (2006).Effects of storage in slurry ice on the microbial, chemical and sensory qualityand on the shelf-life of farmed turbot (P. maxima). Food Chemistry, 95, 270–278.
Rodríguez-Casado, A., Carmona, P., Moreno, P., Sánchez-González, I., Macagnano, A.,Di Natale, C., et al. (2007). Structural changes in sardine (S. pilchardus) muscleduring iced storage: Investigation by DRIFT spectroscopy. Food Chemistry, 103,1024–1030.
Stoffel, W., Chu, F., & Ahrens, E. H. J. R. (1959). Analysis of long chain fatty acids bygas–liquid chromatography. Analytical Chemistry, 31, 307–308.
Taliadourou, D., Papadopoulos, V., Domvridou, E., Savvaidis, I. N., & Kontominas, K.G. (2003). Microbiological, chemical and sensory changes of whole and filletedMediterranean aquacultured sea bass (D. labrax) stored in ice. Journal of theScience of Food and Agriculture, 83, 1373–1379.
Tejada, M., De las Heras, C., & Kent, M. (2007). Changes in the quality indices duringice storage of farmed Senegalese sole (S. senegalensis). European Food Researchand Technology, 225, 225–232.
Whitehead, P. J. P., Bauchot, M. L., Hureau, J. C., Nielsen, J., & Tortonese, E. (1986).Fishes of the North-eastern Atlantic and the Mediterranean. United Kingdom:UNESCO.
Copyright © 2022 FDOKUMEN