Effect of smoking processes on the contents of 10 major phenolic compounds in smoked fillets of...
25
eb site at this is an author-produced PDF of an article accepted for publication following peer review. The definitive publisher-authenticated version is available on the publisher W Food Chemistry March 2004; 85(01) : 111-120 http://dx.doi.org/10.1016/j.foodchem.2003.06.011 © 2003 Elsevier Ltd. All rights reserved Archimer http://www.ifremer.fr/docelec/ Archive Institutionnelle de l’Ifremer Effect of smoking processes on the contents of 10 major phenolic compounds in smoked fillets of herring (Cuplea harengus) Thierry Sérot*, Régis Baron, Camille Knockaert and Jean Luc Vallet Laboratoire de Génie Alimentaire. IFREMER Centre de Nantes, 3 Rue de l'Ile d'Yeu, BP 21105, 44311 Nantes, Cedex 3, France *[email protected] Tel.: +33-02-4037-4252; fax: +33-02-4037-4001 Abstract: This study evaluated the effects of five smoking processes on the contents of 10 major phenolic compounds in fillets of herring (Cuplea harengus), namely two traditional processes, involving smoke production by smouldering or friction, one process using liquid smoke atomisation, and two electrostatic smoking processes, also involving smouldering or friction. The effects of several parameters, such as smoking time, smokehouse temperature, electrode voltage, and fish fillet temperature before smoking were assessed for each process. The results indicate that the content of phenolic compounds are strongly affected by the process applied. The percentages of phenolic compounds in fish flesh remained constant and discriminant for a given process, regardless of the parameters studied, which implies that the smoking process used can be identified by determination of phenolic compounds in fish. Keywords: Smoking process; Phenolic compounds; Herring Please note th 1
-
Upload
independent -
Category
Documents
-
view
2 -
download
0
Transcript of Effect of smoking processes on the contents of 10 major phenolic compounds in smoked fillets of...

eb s
ite
at th
is is
an
auth
or-p
rodu
ced
PD
F of
an
artic
le a
ccep
ted
for p
ublic
atio
n fo
llow
ing
peer
revi
ew. T
he d
efin
itive
pub
lishe
r-aut
hent
icat
ed v
ersi
on is
ava
ilabl
e on
the
publ
ishe
r W Food Chemistry March 2004; 85(01) : 111-120 http://dx.doi.org/10.1016/j.foodchem.2003.06.011© 2003 Elsevier Ltd. All rights reserved
Archimer http://www.ifremer.fr/docelec/Archive Institutionnelle de l’Ifremer
Effect of smoking processes on the contents of 10 major phenolic
compounds in smoked fillets of herring (Cuplea harengus)
Thierry Sérot*, Régis Baron, Camille Knockaert and Jean Luc Vallet
Laboratoire de Génie Alimentaire. IFREMER Centre de Nantes, 3 Rue de l'Ile d'Yeu, BP 21105, 44311 Nantes, Cedex 3, France *[email protected] Tel.: +33-02-4037-4252; fax: +33-02-4037-4001
Abstract: This study evaluated the effects of five smoking processes on the contents of 10 major phenolic compounds in fillets of herring (Cuplea harengus), namely two traditional processes, involving smoke production by smouldering or friction, one process using liquid smoke atomisation, and two electrostatic smoking processes, also involving smouldering or friction. The effects of several parameters, such as smoking time, smokehouse temperature, electrode voltage, and fish fillet temperature before smoking were assessed for each process. The results indicate that the content of phenolic compounds are strongly affected by the process applied. The percentages of phenolic compounds in fish flesh remained constant and discriminant for a given process, regardless of the parameters studied, which implies that the smoking process used can be identified by determination of phenolic compounds in fish. Keywords: Smoking process; Phenolic compounds; Herring
Ple
ase
note
th
1

Introduction In the traditional technique of smoking to preserve fish, phenolic compounds are of
considerable importance for the preservation and organoleptic properties of smoked products
(Kjallstrand & Petersson, 2001). The relative concentration of phenolic compounds in these
products depends on the nature of the wood used in the smoking process (Guillen &
Marzanos, 1999; Guillen & Iibargotra 1996). The method of smoke generation and the
smoking process used (Cardinal, M., Berdagué, J.L., Dinel, V., Knockaert, C., & Vallet J.L.
1997) have a considerable influence on the sensory characteristics of smoked salmon. The
chemical features of meat smoking have been investigated (Girard, Talon, & Sirami, 1982;
Borys, 1995), and the composition of dry or liquid smoke has been assessed in several studies
(Guillen &. Manzanos, 1996; Guillen & Ibargoitia, 1998; Kjällstrand, & Petersson, 2001).
However, few data are available on the composition of phenolic compounds in smoked fish.
In fact, different methods and types of equipment are used for smoke production and
deposition, but their impact on the content of phenolic compounds in fish muscle has not been
extensively evaluated. According to Girard & Talon (1982), electrostatic smoking, as
compared to the traditional smokehouse process, increased the content of phenolic
compounds in bacon. A study by Chan & Toledo (1975) concerning smokehouse production
of smoked mackerel, using smoke production from moist hickory sawdust, showed that
concentrations of phenolic compounds in fish muscle increased up to 75°C and then
decreased. According to these authors, maximum smoke deposition was achieved at 60%
relative humidity.
A good understanding of the fish smoking process is required to define the best conditions for
obtaining good product quality. The present study investigated the effects of five smoking
processes on the content of ten phenolic compounds in herring fillets. The ten compounds
(phenol, p-cresol, o-cresol, guaiacol, 4-methyl guaiacol, 4-ethyl guaiacol, syringol, eugenol,
2

4-propyl guaiacol, and isoeugenol) had previously been identified as major components of
smoked fish (Sérot & Lafficher 2003). The processes studied were the traditional smokehouse
method in which smoke is produced by pyrolysis of sawdust or by friction, atomisation of
liquid smoke in a smokehouse, and continuous electrostatic smoking (Collignan, Knockaert,
Raoult-Wack and Vallet,1992) in which smoke is also produced by pyrolysis of sawdust or by
friction. The effects on the deposition of phenolic compounds were evaluated for smoking
time, smokehouse temperature, smoke residence time in the smokehouse, initial temperature
of fish fillets, and the difference in electrode potential (for the electrostatic smoking process).
The same hardwood (beech) was used for all comparisons.
3

Materials and methods
Reagents
Phenol compounds (phenol, p-cresol, o-cresol, guaiacol, 4-methyl guaiacol, 4-ethyl guaiacol,
syringol, eugenol, 4-propyl guaiacol, isoeugenol and 2-chlorophenol; purity >99%) were
purchased from Sigma-Aldrich (l’Ile d’Abeau, France). Stock standard solutions of phenolic
compounds were prepared by dissolution in HPLC grade methanol from Carlo Erba (Val de
Reuil, France). All solutions were stored in brown glass bottles at –20°C.
Processing equipment.
All processes and parameters used for this study are summarised in table 1.
The smokehouse was an HMI Thirode (PC90 Model) device (Thirode, France), 1.500 x 1.300
x 2.250 mm with a capacity of 380 kg, mounted on a trolley with 28 grids. The air/smoke
circulation was horizontal. The electrostatic smoking method (Collignan, A., Knockaert, C.,
Raoult–Wack, A.L., & Vallet, J.L. (1992); Bardin, Desportes, Knockaert & Vallet, 1997) was
performed using an experimental tunnel 4.000 x 100 x 150 mm. This facility allowed
continuous smoking of 125 Kg/h. The tension applied between the discharge electrode
(corona effect)) and the collecting electrode (conveyor belt) was set by an HT14B high
voltage supply (Sefelec, France). Air speed above the fillet was around 0.5 m.s-1.
A generator (Thirode, France) produced smoke by pyrolysis (450°C) of beech wood sawdust
using the smouldering method, and another generator (Muvero, the Netherlands) produced
smoke by friction at 350°C, using a beech wood beam at 350°C.
Liquid smoke, used for atomisation (vaporisation) in the smokehouse, as previously
described, was referenced by the code 1165 (Lutetia, France). It is a purified condensate of
beech smoke associated with aromatic additives. Tests beforehand determined that this smoke
was similar to that produced in “traditional fish smoking” with beech wood in a smokehouse.
4
Beech wood was used for all processes to minimise the influence of this parameter in the
study.
Fish samples
Frozen herring fillets were obtained from a local fish and seafood wholesaler (Nantes,
France). After thawing in a refrigerated room at +4°C for 6 h, fillets were hand-salted with
refined salt (Salins du Midi, France), left sit for 20 min at 12°C, and then rapidly rinsed with
water (15°C) before being stored in a cold room at +2°C for approximately 14 h until
smoking.
Just before extraction, fish fillets (50 g) were minced in a Waring blender and then
homogenised (Ultraturax T25 IKA, 7,500 rpm) in 100 ml of a 30% NaCl solution acidified to
pH 2.
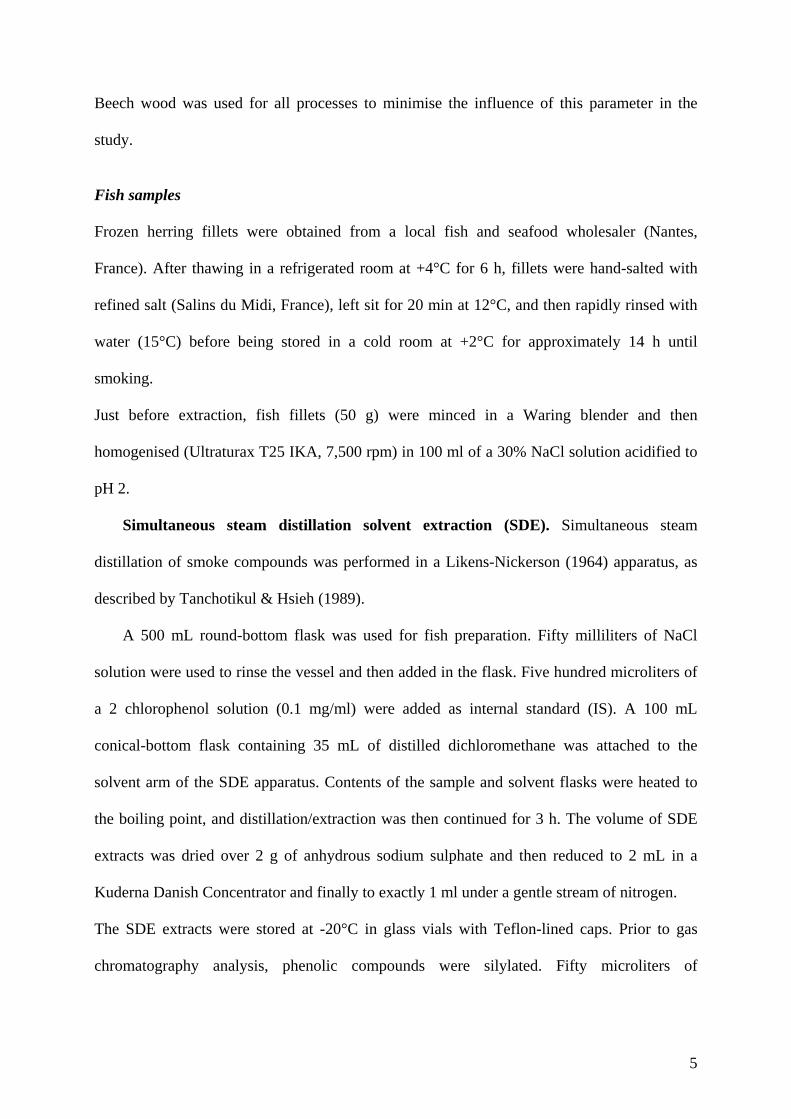
Simultaneous steam distillation solvent extraction (SDE). Simultaneous steam
distillation of smoke compounds was performed in a Likens-Nickerson (1964) apparatus, as
described by Tanchotikul & Hsieh (1989).
A 500 mL round-bottom flask was used for fish preparation. Fifty milliliters of NaCl
solution were used to rinse the vessel and then added in the flask. Five hundred microliters of
a 2 chlorophenol solution (0.1 mg/ml) were added as internal standard (IS). A 100 mL
conical-bottom flask containing 35 mL of distilled dichloromethane was attached to the
solvent arm of the SDE apparatus. Contents of the sample and solvent flasks were heated to
the boiling point, and distillation/extraction was then continued for 3 h. The volume of SDE
extracts was dried over 2 g of anhydrous sodium sulphate and then reduced to 2 mL in a
Kuderna Danish Concentrator and finally to exactly 1 ml under a gentle stream of nitrogen.
The SDE extracts were stored at -20°C in glass vials with Teflon-lined caps. Prior to gas
chromatography analysis, phenolic compounds were silylated. Fifty microliters of
5

BSTFA+TMS reagent were added to 250 µl of extract placed in a vial. Derivatization was
then performed at room temperature for 2 h.
Gas chromatography
Gas chromatography analysis was performed on a Trace GC 2000 apparatus
(ThermoFinnigan, Les Ulis, France) equipped with a split/splitless injector and FID detector.
A capillary column (DB1, J&W Scientific, Folsom, CA, USA; 30m x 0.25 mm I.D. df=0.25
µm) was used to separate phenolic compounds. Sample volumes of 1 µL were injected.
Injector and detector temperatures were 280°C, the flow rate of carrier gas (helium) was 1.5
mL/min, and oven temperature was programmed from 50°C (1 min) to 80°C (1 min) at
4°C/min, then to 150°C at 2°C/min, and finally to 280°C (10 min) at 10°C/min.
Chromatographic data acquisition and processing were carried out using ChromCard software
version 1.07 (Thermoquest, Milan, Italy). The content of phenolic compounds, expressed in
mg/100 g of fish muscle, was obtained by calculations from calibration curves.
Statistical analysis
All statistical tests were performed using Statgraphics plus software, version 4.0
(Manugistics, Rockville, MD, USA).
Results and discussion
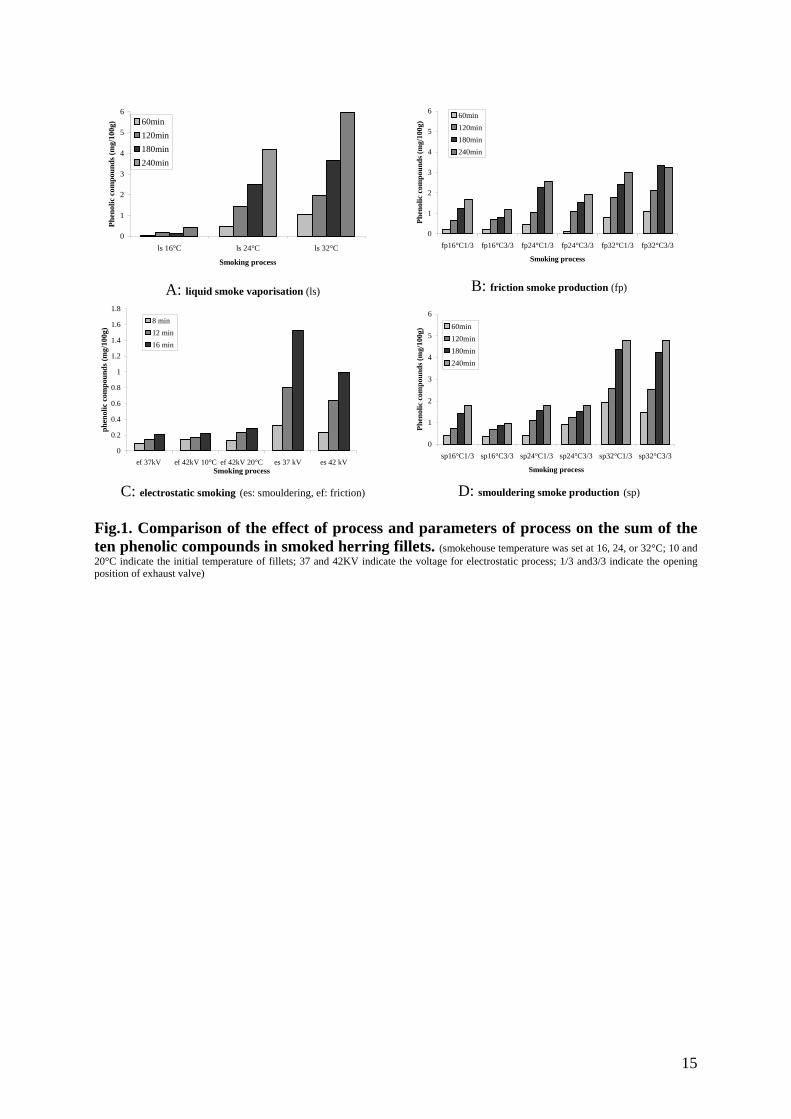
Figure 1 shows the effects of the smoking process on the content of the ten studied phenolic
compounds in smoked herring fillets. Smoking at 24°C and 32°C with liquid smoke
vaporization (ls) allowed the deposition of a high quantity of phenolic compounds (Figure
1A). However, when smokehouse temperature was set at 16°C, few compounds were
deposited, probably because of low vaporisation of the liquid smoke at this temperature. For
the traditional smoking process, smoke production by pyrolysis of sawdust (sp) (Figure 1D)
allowed deposition of more important quantities of phenolic compounds than smoke
6

production by friction (fp) (Figure 1B). The content of phenolic compounds in fillets smoked
by the electrostatic smoking process was low (Figure 1C). However, it can be note that smoke
production by pyrolysis of sawdust (es) was more efficient than by friction (ef). Talon et al.
(1982) have shown that the rate of phenolic compounds adsorption for bacon was higher with
electrostatic than traditional smoking. However, the smoking process was not continuous in
their study, and processing time was set at 1 and 2 h. In the case of traditional processes in our
study, initial absorption of phenolic compounds was relatively rapid, followed by a reduction
of absorption until a saturation level was reached (Figure 2). The shape of the phenolic
compounds deposition curve could have been due to drying out of the fish fillet surface
during smoking and to more gradual smoke deposition on dry surfaces (Chan & Toledo,
1975). For the liquid smoke process, the kinetic curve of phenolic compounds deposition
resembles an exponential curve, with a rapid increase of deposition after 180 min. This curve
shape could have been due to a progressive increase of smoke vapour in the smokehouse.
Figure 3 shows that guaiacol and 4-methylguaiacol were the main compounds in fish fillets
smoked according to traditional and liquid smoke atomisation processes. When electrostatic
smoking process was used, with smoke production by friction, syringol was the second
leading compound after guaiacol The content of syringol and 4-methylguaiacol was not
significantly different for electrostatic smoking with smoke production by sawdust pyrolysis.
Figure 3A,B,C shows that the third leading compound was syringol for the traditional process
and phenol for liquid smoke atomisation. This difference could have been due to the low
vapour tension of syringol, which is deposited in smaller amounts than phenol when liquid
smoke is used. Regardless of the process used, the least deposited compounds (in descending
order) were eugenol, 4-ethylguaiacol, o-cresol, p-cresol, and 4-propylguaiacol. This order
could relate to the chemical structure of these compounds and the possibility of establishing
7

bonds with fish flesh components. However, this hypothesis requires further investigation.
The various parameters of the smoking process studied had no effect on this order.
A one-way analysis of variance (ANOVA) showed that the mean of content from one level of
process for all studied phenolic compounds was significantly different to another at the 95%
level of confidence (P-value <0.05). A Fischer’s least significant difference (LSD) test was
used to determine which mean contents were significantly different from which others. The
results of the LSD procedure indicated that the phenol content of fillets smoked by “sp” and
“lp” processes was significantly different from that of fillets smoked by the other processes
(Figure 4A). The phenol content of fillet smoked by the “fp” process was significantly
different from that of fillets smoked by the “ef” process, but not from that of fillets smoked by
the “es” process. No significant differences were observed between the phenol content of
fillets smoked by both electrostatic processes. Analysis of guaiacol content identified two
homogeneous groups (Figure 4B), one consisting of samples smoked by “sp”, “ls”, and “fp”
processes and showing a high level of guaiacol, and the other consisting of samples smoked
by both electrostatic processes and showing lower guaiacol content. Analysis of syringol
content distinguished four homogeneous groups (Figure 4C) consisting, respectively, of fillets
smoked by the “sp” process, “ls” and “es” processes, “es” and “fp” processes, and “fp” and
“ef” processes. The LSD procedure performed on the content of 4-methylguaiacol, o-cresol,
p-cresol, and 4-ethylguaiacol distinguished three groups consisting of samples smoked by
“sp” and “ls” processes, the “fp” process, and the two electrostatic processes. This analysis
indicated the great variability in phenolic compounds content for the different smoking
processes, independently of the parameters studied. These results are consistent with those of
Grondin & Guillard (2000), who showed that the content of phenolic compounds is
characteristic of a given smoking process.
8

To determine which phenolic compounds contribute most to the characterisation of the
smoking processes, factorial discriminant analysis (FDA) was performed for the percentages
of the ten phenolic compounds in fillets smoked by the five processes. The use of percentages
allowed us to disregard the effect of smoking parameters, particularly smoking time. In any
case, the percentages for phenolic compounds were constant for a given smoking process
independently of the parameters (Table 2) while their content increased with smoking time or
temperature. Figure 5 shows the factorial plane of the two first canonical factors of the
discriminant analysis. Five groups corresponding to the five processes were discriminated.
Discrimination of the smoking processes was very good, because 98.8% of the observations
were correctly assigned to their original group after re-substitution. Only one observation
from the “ls” group was assigned to the “sp” group. The equation for the first standardised
discriminating function,
0.615 phenol + 0.853 o-cresol – 0.868 p-cresol – 1.082 guaiacol + 0.801 4-methylguaiacol –
0.103 4-ethylguaiacol – 0.729 syringol – 0.950 eugenol + 0.114 4- propylguaiacol – 0.184
isoeugenol,
shows that guaiacol, eugenol, p-cresol, o-cresol and 4-methylguaiacol (in decreasing order)
strongly contribute to the discrimination of the five groups. These results confirm that the
composition of the phenolic compounds differs according to the smoking process used
(Borys, 1996; Grondin & Guillard, 2001) and suggest that this factor could be useful for
analysis and identification of the particular smoking process applied to fish fillets.
Multifactoral ANOVA was performed relative to the content of the ten phenolic compounds
in herring fillets subjected to smouldering, friction and liquid smoke processes. The results
indicate that smoking time, smokehouse temperature, the process involved, and interaction
among these factors had significant effects on the deposition of phenolic compounds in fish
fillets (P value <0.05). In particular, the increased deposition of all phenolic compounds with
9

time was greater when temperature increased (Figure 6A for guaiacol content). This could
have been due to an increase of phenolic compounds in the vapour phase at high temperature
or to modifications of the physical state of matrix components, particularly higher fluidity of
the lipid phase, which could have contributed to the solubilisation of the phenolic compounds.
Analysis of smoking time and process interactions (Figure 6B) confirms the previous
observations, this phenomenon could have been due to the drying out of the fillet surface.
When smoke production involving smouldering and friction, a saturation level for deposition
was reached after 3 h, whereas an exponential increase of deposition was observed for liquid
smoke. Vaporisation of liquid smoke probably prevents drying out of the fillet surface. A
study of the interaction between temperature and the process indicated that the deposition rate
was very rapid for liquid smoke vaporisation, with an approximately linear increase between
16 and 32°C, whereas the increase of deposition was very gradual for the smouldering smoke
production between 16 and 24°C and then more rapid from 24 to 32°C (Figure 6C). The same
type of curve was apparent (though less marked) when friction smoke production was used.
The effect of the opening of the exhaust valve of smokehouse was only tested for smouldering
and friction processes, as the exhaust valve remained closed for liquid smoke. ANOVA
results indicated that the effect of exhaust valve position was highly significant. Analyses of
the interaction between smoking time and exhaust valve position and between smoking
temperature and exhaust valve position showed that the content of phenolic compounds in
fillets was significantly higher when the exhaust valve was one-third open, smokehouse
temperature was low (16°C), and smoking time was at least 240 min. This observation, which
was valid for all studied compounds, implies that for low temperature, the level of deposited
compounds is greater to the extent that residence time is longer. Chan & Toledo (1975) have
shown that the rate of smoke deposition was faster and a higher concentration was obtained
when air is circulated through the smokehouse (10 volume changes/min).
10

Multifactoral ANOVA was performed to evaluate the effect of smoking time, tension, and
smoke production on the deposition of phenolic compounds when the electrostatic process
was used. With respect to the content of the ten phenolic compounds, Fischer’s LSD
procedure identified two homogeneous groups corresponding to two smoke production
processes. The interaction between smoking time and the process (Figure 8A) shows that the
content of phenolic compounds in herring fillets obtained with smouldering smoke production
was significantly higher than that obtained with friction smoke production. The kinetics for
the deposition of phenolic compounds was approximately linear. This is quite surprising, as
some studies have shown that friction smoke contains more phenolic compounds than
sawdust smoke (Husaini & Cooper, 1957). However, the greater moisture of sawdust smoke
could have increase the individual particulate charge (correlated with greater conductivity).
On the other hand, the smoke generation temperature affects the phenolic compounds of
smoke (Toth 1980). If the temperature of sawdust pyrolysis is set at 450°C and that of beam
pyrolysis at 350°C, the content of phenolic compounds would be higher for the former than
the latter. Analysis of the interactions between voltage and the process (Figure 8A) shows that
the deposited amounts of the ten phenolic compounds were significantly higher with
smouldering when voltage was set at 37kV than at 42kV, whereas no difference between the
two voltages was apparent with friction. It is not easy to explain these results, and further
investigations are needed to determine smoke composition before and after electrostatic
precipitation at different voltages and to analyse the reproducibility of electrostatic
precipitation of smoke compounds.
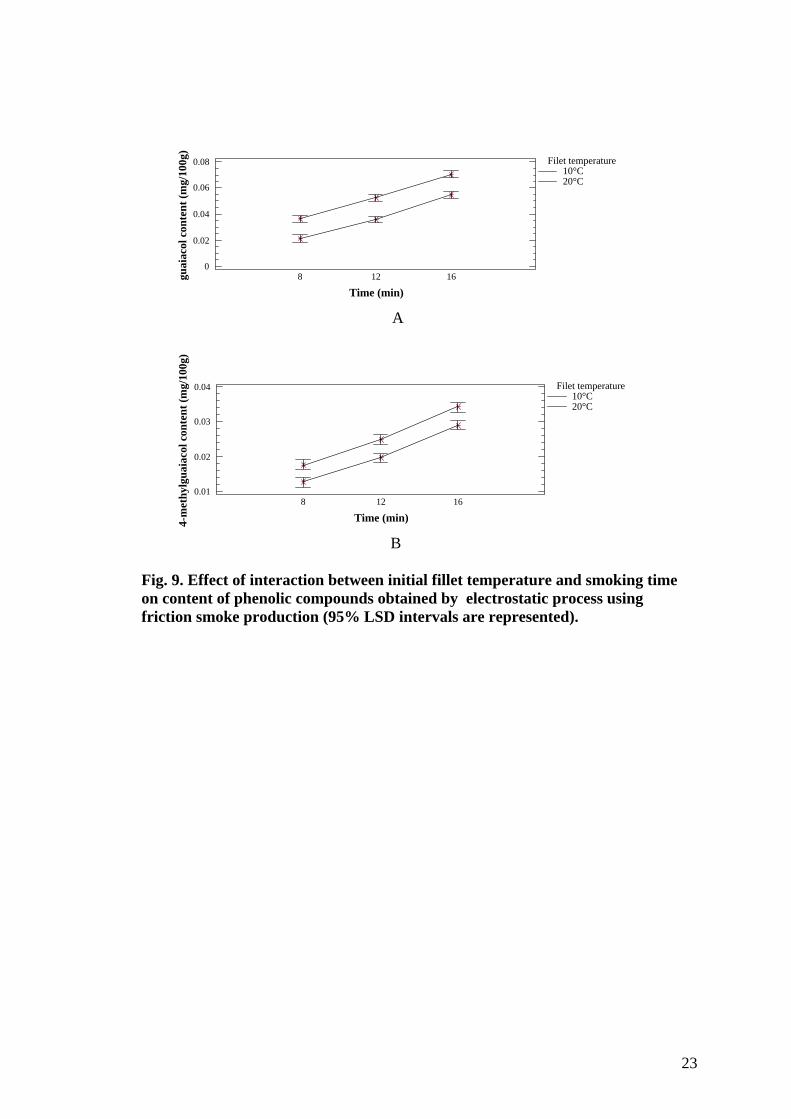
The effect of the initial temperature of fish fillets on the deposition of phenolic compounds
was only tested for the electrostatic process with smoke production by friction. The results of
multifactoral ANOVA show that smoking time, initial fillet temperature, and the interaction
between time and temperature had a significant effect on the content of all phenolic
11

compounds. When fish fillet temperature was set at 20°C, content was higher than when the
temperature was set at 10°C, regardless of smoking time (Figure 9A,B). The lower level of
deposited phenolic compounds obtained at 10°C may have been due to condensation of water
vapour on the surface of cold fillets, resulting in the washing out of deposited smoke
compounds (Chan & Toledo, 1975). A higher temperature would have prevented this
condensation.
12

Conclusion
Deposition kinetics and the amount of phenolic compounds deposited are in close relation to
the smoking process used. Liquid vaporisation allows the deposition of a large amount of
compounds at 32°C. Guaiacol and 4-methylguaiacol exhibit some of the highest contents in
smoked flesh fish, regardless of the process used. The content of the ten studied phenolic
compounds differed significantly according to the process used and the parameters of the
smoking process. The effects of interactions between these parameters are highly significant,
however the impact of the parameters differs from one process to another. In particular, the
effect of interaction between smoking time and temperature is very important when traditional
and liquid smoke vaporisation processes are used. The electrostatic process, in our conditions,
did not allow high deposit levels for phenolic compounds. As in the traditional process, the
method of smoke production seemed to a have a decisive effect on the deposition of phenolic
compounds. Other parameters, particularly voltage setting, require further investigation
This study also showed that phenolic compounds composition of smoked fish fillets depends
on the smoking process used but is independent of the parameters studied. Discriminant
analysis applied to percentages of the ten phenolic compounds found in fillets would appear
to be a particularly suitable method for identifying the smoking process used to smoke fish
fillets.
Specific study will be necessary to evaluate the effects of the content of phenolic compounds
on organoleptic properties and shelf life of smoked herring fillets.
13

Borys, A. (1995). Content of smoke components in some meat products. Roczniki-Instytutu-Przemyslu-Miesnego-i-Tluszczowego, 32/33, 203-212.
Bardin, J.C., Desportes G., Knockaert, C., & Vallet, J.L. (1997) Améliorations du procédé de fumage électrostatique de produits carnés – French patent 9708177.
Cardinal, M., Berdagué, J.L., Dinel, V., Knockaert, C., & Vallet J.L. (1997). Effet de differentes techniques de fumage sur la nature des composes volatiles et les caractéristiques sensorielles de la chair de saumon. Sciences des Aliments, 17, 680-696.
Collignan, A., Knockaert, C., Raoult–Wack, A.L., & Vallet, J.L. (1992) Procédé et dispositif de salage-séchage et de fumage à froid de produits alimentaires carnés. French patent 9208958, European extension 93430009.6.
Girard, J.P., Talon, R., & Sirami, J. (1982). Le fumage électrostatique: son efficacité relativement à deux parameters. Sciences des Aliments, 2, 1-15.
Guillen, M.D., & Ibargoitia, M.L. New components with potential antioxidant and organoleptic properties, detected for the first time in liquid smoke-flavoring preparations. Journal of Agricultural and Food Chemistry, 46 (1998) 1276-1285.
Guillen, M.D., &. Manzanos, M.J. (1996) Study of the components of a solid smoke flavouring preparation. Food-Chemistry, 55 (3), 251-257.
Husaini, S.A. and Cooper, G.E. (1957). Fractionation of wood smoke and the comparison of chemical composition of sawdust and friction smokes. Food technology, 11, 499-502.
Kjällstrand, J., & Petersson, G. (2001). Phenolic antioxidants in wood smoke. The Science of the Total Environment, 27, 69-75.
Chan, W.S., Toledo, R. (1975). Effect of smokehouse temperature, humidity and air flow on smoke penetration into fish muscle. Journal of Food Science, 40, 240-243.
Likens, S.T.; Nickerson, G.B. (1964). Detection of certain hop oil constituents in brewing products. Am. Soc. Brew. Chem. Proc., 5-13.
Tanchotikul, U.; Hsieh, T. C.Y. (1989). Volatile flavor components in crayfish waste. J. Food Sci., 54, No. 6, 1515-1520.
Toth, L. (1980). Separation and analysis of phenol fractions from smokehouse smoke. II. Separation, purification and analysis of phenol fractions. Fleischwirftschaft, 60, 728-732.
14
0
1
2
3
4
5
6
fp16°C1/3 fp16°C3/3 fp24°C1/3 fp24°C3/3 fp32°C1/3 fp32°C3/3
Smoking process
Phen
olic
com
poun
ds (m
g/10
0g)
60min120min180min
0
1
2
3
4
5
6
ls 16°C ls 24°C ls 32°C
Smoking process
Phen
olic
com
poun
ds (m
g/10
0g) 60min
120min180min 240min240min
B: friction smoke production (fp) A: liquid smoke vaporisation (ls)
0
0.2
0.4
0.6
0.8
1
1.2
1.4
1.6
1.8
ef 37kV ef 42kV 10°C ef 42kV 20°C es 37 kV es 42 kVSmoking process
phen
olic
com
poun
ds (m
g/10
0g)
8 min12 min16 min
0
1
2
3
4
5
6
sp16°C1/3 sp16°C3/3 sp24°C1/3 sp24°C3/3 sp32°C1/3 sp32°C3/3
Smoking process
Phen
olic
com
poun
ds (m
g/10
0g) 60min
120min180min240min
D: smouldering smoke production (sp) C: electrostatic smoking (es: smouldering, ef: friction) Fig.1. Comparison of the effect of process and parameters of process on the sum of the ten phenolic compounds in smoked herring fillets. (smokehouse temperature was set at 16, 24, or 32°C; 10 and 20°C indicate the initial temperature of fillets; 37 and 42KV indicate the voltage for electrostatic process; 1/3 and3/3 indicate the opening position of exhaust valve)
15

0
1
2
3
4
5
60 120 180 240 Time (min)
Phen
olic
com
poun
ds c
onte
nt
(mg/
100g
) ls 24°C fp24°C sp24°C
Fig. 2. Effect of smoke generation on the sum of the ten major phenolic compounds content of smoked herring fillets.
16

A
0.0
0.1
0.2
0.3
0.4
0.5
8 12 16Time (min)
Phen
olic
com
poun
ds c
onte
nt
(mg/
10g)
B
C
D
E Fig.3. Comparison of the effect of smoking time on content of phenolic compounds in herring fillets obtained by the five studied smoking processes (A: sp (θ°: 32°C, exhaust valve: 3/3) B: fp (θ°: 32°C, exhaust valve: 3/3) C: ls (θ°: 32°C) D: es (θ° fillet: 10°C, U=37KV) E: ef (θ° fillet: 20°C, U=37KV).
0.0
0.5
1.0
1.5
2.0
60 120 180 240Time (min)
Phen
olic
com
poun
ds c
onte
nt
(mg/
100g
)
0.0
0.5
1.0
1.5
2.0
60 120 180 240Time (min)
Phen
olic
com
poun
ds c
onte
nt
(mg/
100g
)
0.0
0.5
1.0
1.5
2.0
60 120 180 240Time (min)
Phen
olic
com
poun
ds c
onte
nt
(mg/
100g
)
phénol
o-cresol
p-cresol
gaiacol
4-methylgaiacol
4-ethylgaiacol
syringol
eugenol
4-propylgaiacol
isoeugenol
0.00
0.01
0.02
0.03
0.04
0.05
0.06
0.07
8 12 16Time ( min)
Phen
olic
com
poun
ds
cont
ent
(mg/
100g
)
17

A B
C D
s
Process
Phen
ol c
onte
nt (m
g/10
0g)
sp ls fp ef es-0.01
0.09
0.19
0.29
Process
Syri
ngol
con
tent
(mg/
100g
)
sp ls fp ef es0
0.05 0.1
0.15 0.2
0.25 0.3
Process
Gua
iaco
l con
tent
(mg/
100g
)
sp ls fp ef es0
0.2
0.4
0.6
0.8
P r o c e ss4-
met
hyl g
uaia
col c
onte
nt
(mg/
100g
) s p ls fp e f e s
0
0 .1
0 .2
0 .3
0 .4
0 .5
0 .6
Fig.4. Comparison of phenolic compounds content means obtained by using the five smoking processes, for all tested parameters. 95.0 percent LSD intervals are plotted.
18

Factor 1
Fact
or2
Processsp fp es ef ls
-11 -8 -5 -2 1 4 7 -4.6
-2.6
-0.6
1.4
3.4
5.4
Fig. 5. Projection o the 84 samples on the plane of both first canonical factors of the discriminant analysis.
19

A Time (min)
Gua
iaco
l con
tent
(mg/
100g
)
Temperature16°C24°C32°C
0
0.1
0.2
0.3
0.4
0.5
0.6
60 120 180 240
B Time (min)
Phen
ol c
onte
nt (m
g/10
0g)
Processsplsfp
0
0.1
0.2
0.3
0.4
0.5
60 120 180 240
C Temperature (°C)
Phen
ol c
onte
nt (m
g/10
0g)
Processsplsfp
0
0.1
0.2
0.3
0.4
0.5
16 24 32
Fig. 6. Effect of smoking time and temperature and smoke production method on content of phenolic compounds in smoked herring filets. (A: plot of interaction temperature-time, B: plot of interaction process-time, C: plot of interaction process-temperature).
20

A
Temperature (°C)
Gua
iaco
l con
tent
(mg/
100g
)
Exhaust valve1/33/3
0.25
0.45
0.65
0.85
1.05
16 24 32
B
Time (min)
Gua
iaco
l con
tent
(mg/
100g
)
Exhaust valve1/33/3
0
0.2
0.4
0.6
0.8
1
60 120 180 240
Fig.7. Effect of smoke resident time in smokehouse on phenolic compounds content of herring fillets. A: effect of valve position-temperature interaction. B: effect of exhaust valve position-smoking time interaction.(95% LSD interval are represented).
21

A
Time (min)
guai
acol
con
tent
(mg/
100g
)
Processesef
0
0.1
0.2
0.3
0.4
8 12 16
B
Process
guai
acol
con
tent
(mg/
100g
) Voltage37 kV42 kV
0
0.05
0.1
0.15
0.2
0.25
es ef
Fig. 8 Representation of significant parameters interactions in electrostatic processes (A: effect of interaction between process and time on guaiacol content, B: effect of interaction between process and voltage on guaiacol content)
22
A
Time (min)
guai
acol
con
tent
(mg/
100g
)
Filet temperature10°C20°C
0
0.02
0.04
0.06
0.08
8 12 16
B
Time (min)4-m
ethy
lgua
iaco
l con
tent
(mg/
100g
)
Filet temperature10°C20°C
0.01
0.02
0.03
0.04
8 12 16
Fig. 9. Effect of interaction between initial fillet temperature and smoking time on content of phenolic compounds obtained by electrostatic process using friction smoke production (95% LSD intervals are represented).
23

Table 1 Process and experimental conditions used to measured kinetic deposition of phenolic compounds into fish muscle.
Traditional smoking(Smouldering (sp) and friction(fp))
Liquid smoke atomisation(ls)
Electrostatic smoking (Smouldering (es) and friction( ef))
Initial product temperature (°C) 10 10 10-20 Smokehouse temperature (°C) 16 - 24 - 32 16 - 24 - 32 Smoking duration (min) 60-120-180-240 60-120-180-240 4-8-12-16 Exhaust valve opening 1/3 3/3 closed Tension polarity Positive Tension value (KV) 37 - 42 -
24

Table 2 Average and standard deviation of phenolic compounds percentages for each studied process
smouldering liquid smoke friction electrostatic friction electrostatic smouldering
Percentage mean
Standard deviation
Percentage mean
Standard deviation
Percentage mean
Standard deviation
Percentage mean
Standard deviation
Percentage mean
Standard deviation
phenol 10.2 1.2 8.7 1.2 8.7 0.7 4.9 1.7 13.6 1.5 o-cresol 4.2 0.45 2.7 0.4 3.0 0.5 2.8 2.3 4.4 0.7 p-cresol 2.2 0.3 2.2 0.6 2.8 0.3 2.1 1.3 3.0 0.5 guaiacol 33.7 2.9 39.2 4.9 26.2 1.4 26.3 7.1 33.1 3.9 4-methylguaiacol 24.0 2.0 24.4 1.6 21.2 1.9 16.2 5.2 23.0 3.1 4-ethylguaiacol 4.8 0.6 4.3 0.7 4.2 0.5 2.9 1.2 5.1 0.6 syringol 13.0 3.9 8.6 3.1 19.6 2.2 27.6 3.2 22.2 2.8 eugenol 3.5 1.1 8.2 1.7 4.0 1.0 9.3 2.5 2.2 1.8 4-propylguaiacol 0.8 0.1 1.0 0.3 0.8 0.2 0.6 0.4 0.6 0.4 isoeugenol 3.5 1.9 1.8 0.7 8.8 4.3 6.9 2.1 0.6 0.4
25