Sensing Technologies For Precision Irrigation - ChercheInfo
102
SPRINGER BRIEFS IN ELECTRICAL AND COMPUTER ENGINEERING Dubravko Ćulibrk · Dejan Vukobratovic Vladan Minic · Marta Alonso Fernandez Javier Alvarez Osuna · Vladimir Crnojevic Sensing Technologies For Precision Irrigation
-
Upload
khangminh22 -
Category
Documents
-
view
6 -
download
0
Transcript of Sensing Technologies For Precision Irrigation - ChercheInfo

S P R I N G E R B R I E F S I NE L E C T R I C A L A N D CO M P U T E R E N G I N E E R I N G
Dubravko Ćulibrk · Dejan VukobratovicVladan Minic · Marta Alonso FernandezJavier Alvarez Osuna · Vladimir Crnojevic
Sensing Technologies For Precision Irrigation

SpringerBriefs in Electrical and ComputerEngineering
For further volumes:http://www.springer.com/series/10059

Dubravko Culibrk • Dejan VukobratovicVladan Minic • Marta Alonso FernandezJavier Alvarez Osuna • Vladimir Crnojevic
Sensing TechnologiesFor Precision Irrigation
123

Dubravko CulibrkDejan VukobratovicVladan MinicVladimir CrnojevicFaculty of Technical SciencesUniversity of Novi SadNovi SadSerbia
Marta Alonso FernandezJavier Alvarez OsunaIMAXDI Real InnovationVigoSpain
ISSN 2191-8112 ISSN 2191-8120 (electronic)ISBN 978-1-4614-8328-1 ISBN 978-1-4614-8329-8 (eBook)DOI 10.1007/978-1-4614-8329-8Springer New York Heidelberg Dordrecht London
Library of Congress Control Number: 2013943574
� The Author(s) 2014This work is subject to copyright. All rights are reserved by the Publisher, whether the whole or part ofthe material is concerned, specifically the rights of translation, reprinting, reuse of illustrations,recitation, broadcasting, reproduction on microfilms or in any other physical way, and transmission orinformation storage and retrieval, electronic adaptation, computer software, or by similar or dissimilarmethodology now known or hereafter developed. Exempted from this legal reservation are briefexcerpts in connection with reviews or scholarly analysis or material supplied specifically for thepurpose of being entered and executed on a computer system, for exclusive use by the purchaser of thework. Duplication of this publication or parts thereof is permitted only under the provisions ofthe Copyright Law of the Publisher’s location, in its current version, and permission for use mustalways be obtained from Springer. Permissions for use may be obtained through RightsLink at theCopyright Clearance Center. Violations are liable to prosecution under the respective Copyright Law.The use of general descriptive names, registered names, trademarks, service marks, etc. in thispublication does not imply, even in the absence of a specific statement, that such names are exemptfrom the relevant protective laws and regulations and therefore free for general use.While the advice and information in this book are believed to be true and accurate at the date ofpublication, neither the authors nor the editors nor the publisher can accept any legal responsibility forany errors or omissions that may be made. The publisher makes no warranty, express or implied, withrespect to the material contained herein.
Printed on acid-free paper
Springer is part of Springer Science+Business Media (www.springer.com)
Preface
This text aims to obtain a snapshot of the situation in the multidisciplinary, vibrant,and rapidly evolving space of precision irrigation and obtain valuable insights withtechnologies that can be employed and leveraged in the pursuit of the developmentof effective precision irrigation systems.
This book provides an overview of state-of-the-art sensing technologies rele-vant to the problem of precision irrigation, an emerging field within the domain ofprecision agriculture. Applications of wireless sensor networks, satellite data andgeographic information systems in the domain are covered in the text. In additionto discussing the basic concepts of the technologies surveyed, an emphasis isplaced on the practical aspects that enable the implementation of intelligent irri-gation systems using the technology commercially available. As such, we hopethat it will be of use to the broader audience interested in this theme. The text isorganized in five chapters, each concerned with specific technology form thediverse set of ICT used to address the problem of optimal crop irrigation.
Chapter 1 is concerned with the application of wireless sensor networks, whichcan be used to monitor the microclimatic environment at an unprecedented scale.The discussion within this chapter starts with the aspects of sensor node hardwareand the solutions provided by different manufacturers. An overview communica-tion protocols (both high- and low-level) is provided next. Finally, we take a lookat the available sensor networks solutions designed specifically for smartirrigation.
Chapter 2 will provide an overview of remote sensing data that can be used toassist precision irrigation. Aspects of different satellite data that can be used arediscussed: satellite missions designed to assist irrigation, different products pro-vided, data format and, in particular, ways to access the data for use in your ownsystem.
Chapter 3 deals with the aspects of Geographical Information Systems (GIS)that are an inherent part of any precision irrigation system, as the data collectedand processed needs to be stored, processed, and visualized. We will provideoverview of most-commonly-used GIS, both open-source and proprietary. GISapplications, designed specifically for precision agriculture, are discussed in somedetail.
Chapter 4 is dedicated to concluding remarks and some best-practicerecommendations.
v

Acknowledgments
The authors would like to thank the consortium of the FP7-Project ENORASIS fortheir kind support, and the valuable contributions of Jérôme Donnadille andPanagiotis Symeonidis.
vii

Contents
1 Wireless Sensor Network Technology for Precision Agriculture . . . 1Sensor Node Hardware. . . . . . . . . . . . . . . . . . . . . . . . . . . . . . . . . . 1
Hardware Architecture . . . . . . . . . . . . . . . . . . . . . . . . . . . . . . . . 1Processing Power and Memory . . . . . . . . . . . . . . . . . . . . . . . . . . 3
Radio Circuitry and Antennas . . . . . . . . . . . . . . . . . . . . . . . . . . . . . 3Power Supply Sources . . . . . . . . . . . . . . . . . . . . . . . . . . . . . . . . 4Sensors for Precision Agriculture . . . . . . . . . . . . . . . . . . . . . . . . 7
Sensor Node Protocols: Lower Layers . . . . . . . . . . . . . . . . . . . . . . . 8IEEE 802.15.4TM Physical Layer. . . . . . . . . . . . . . . . . . . . . . . . . . . 9
IEEE 802.15.4TM Medium Access Control Layer . . . . . . . . . . . . . 16Sensor Node Protocols: Upper Layers . . . . . . . . . . . . . . . . . . . . . . . 23
ZigBee� . . . . . . . . . . . . . . . . . . . . . . . . . . . . . . . . . . . . . . . . . . 236LoWPAN . . . . . . . . . . . . . . . . . . . . . . . . . . . . . . . . . . . . . . . . 32Data Management and Storage Architectures . . . . . . . . . . . . . . . . 41Programming and Applications Development . . . . . . . . . . . . . . . . 43
Wireless Sensor Networks Solutions for Smart Irrigation . . . . . . . . . . 47References . . . . . . . . . . . . . . . . . . . . . . . . . . . . . . . . . . . . . . . . . . 50
2 Sources of Remote Sensing Data for Precision Irrigation . . . . . . . . 53Satellite Data . . . . . . . . . . . . . . . . . . . . . . . . . . . . . . . . . . . . . . . . 53Operational Readily Available Satellite Missionsfor Precision Irrigation . . . . . . . . . . . . . . . . . . . . . . . . . . . . . . . . . . 53Satellite Based Products for Irrigation . . . . . . . . . . . . . . . . . . . . . . . 57
Surface Radiation Budget Parameters. . . . . . . . . . . . . . . . . . . . . . 57Surface Water Balance Parameters . . . . . . . . . . . . . . . . . . . . . . . 59Wind-Related Products. . . . . . . . . . . . . . . . . . . . . . . . . . . . . . . . 62Precipitation Products . . . . . . . . . . . . . . . . . . . . . . . . . . . . . . . . 63Atmospheric Weather Parameters . . . . . . . . . . . . . . . . . . . . . . . . 64Biogeophysical Measurements. . . . . . . . . . . . . . . . . . . . . . . . . . . 64
Data Accessibility . . . . . . . . . . . . . . . . . . . . . . . . . . . . . . . . . . . . . 67References . . . . . . . . . . . . . . . . . . . . . . . . . . . . . . . . . . . . . . . . . . 67
ix
3 GIS Applications for Irrigation Management . . . . . . . . . . . . . . . . 69Proprietary GIS Software . . . . . . . . . . . . . . . . . . . . . . . . . . . . . . . . 71ESRI ArcGIS . . . . . . . . . . . . . . . . . . . . . . . . . . . . . . . . . . . . . . . . 71Desktop GIS Products . . . . . . . . . . . . . . . . . . . . . . . . . . . . . . . . . . 72Server GIS Products . . . . . . . . . . . . . . . . . . . . . . . . . . . . . . . . . . . 72Mobile GIS Products . . . . . . . . . . . . . . . . . . . . . . . . . . . . . . . . . . . 74Developer GIS Products . . . . . . . . . . . . . . . . . . . . . . . . . . . . . . . . . 74Online GIS (ArcGIS Online). . . . . . . . . . . . . . . . . . . . . . . . . . . . . . 74Autocad Map 3D. . . . . . . . . . . . . . . . . . . . . . . . . . . . . . . . . . . . . . 75Intergraph GEOMEDIA . . . . . . . . . . . . . . . . . . . . . . . . . . . . . . . . . 75Open Source Software . . . . . . . . . . . . . . . . . . . . . . . . . . . . . . . . . . 77GRASS . . . . . . . . . . . . . . . . . . . . . . . . . . . . . . . . . . . . . . . . . . . . 77Quantum GIS . . . . . . . . . . . . . . . . . . . . . . . . . . . . . . . . . . . . . . . . 78uDIG . . . . . . . . . . . . . . . . . . . . . . . . . . . . . . . . . . . . . . . . . . . . . . 79gvSIG . . . . . . . . . . . . . . . . . . . . . . . . . . . . . . . . . . . . . . . . . . . . . 80GIS Software for Precision Agriculture . . . . . . . . . . . . . . . . . . . . . . 81SSToolBox . . . . . . . . . . . . . . . . . . . . . . . . . . . . . . . . . . . . . . . . . . 82SSToolKit . . . . . . . . . . . . . . . . . . . . . . . . . . . . . . . . . . . . . . . . . . 82Farm Works Office Desktop . . . . . . . . . . . . . . . . . . . . . . . . . . . . . . 83Agvance Mapping . . . . . . . . . . . . . . . . . . . . . . . . . . . . . . . . . . . . . 83Achieving Interoperability in Precision Irrigation Support Systems . . . 84Standards . . . . . . . . . . . . . . . . . . . . . . . . . . . . . . . . . . . . . . . . . . . 84
The OpenGIS� Web Map Service Interface Standard . . . . . . . . . . 85The OpenGIS� Web Feature Service Interface Standard . . . . . . . . 85The OpenGIS� Web Coverage Service Interface Standard . . . . . . . 86
Internet Services Interoperability . . . . . . . . . . . . . . . . . . . . . . . . . . . 86The OpenGIS� Web Processing Service Interface Standard . . . . . . 86
The OpenGIS� Sensor Observation Service . . . . . . . . . . . . . . . . . . . 87Observations and Measurements: XML Implementation . . . . . . . . . . . 87OpenGIS� Sensor Model Language (SensorML) . . . . . . . . . . . . . . . . 87OpenGIS� Sensor Planning Service Implementation Standard. . . . . . . 88OpenGIS� SWE Service Model Implementation Standard . . . . . . . . . 88OpenGIS� Web Coverage Processing Service (WCPS)Language Interface Standard. . . . . . . . . . . . . . . . . . . . . . . . . . . . . . 89Impact of Latest European Directives and Projects . . . . . . . . . . . . . . 89
INSPIRE . . . . . . . . . . . . . . . . . . . . . . . . . . . . . . . . . . . . . . . . . 89GEOSS . . . . . . . . . . . . . . . . . . . . . . . . . . . . . . . . . . . . . . . . . . 90GIGAS. . . . . . . . . . . . . . . . . . . . . . . . . . . . . . . . . . . . . . . . . . . 91EuroGEOSS . . . . . . . . . . . . . . . . . . . . . . . . . . . . . . . . . . . . . . . 92
References . . . . . . . . . . . . . . . . . . . . . . . . . . . . . . . . . . . . . . . . . . 93
4 Concluding Remarks . . . . . . . . . . . . . . . . . . . . . . . . . . . . . . . . . . 95
x Contents
Chapter 1Wireless Sensor Network Technologyfor Precision Agriculture
Precision agriculture demands intensive field data acquisition. One of the keys tounderstanding productivity variability lays in frequent data acquisition and inter-pretation. Wireless sensor networks (WSN) are a relatively new and rapidlydeveloping class of wireless communication networks which can provide pro-cessed real time field data from sensors distributed in the field. The sensor nodesdeployed on the field measure various atmospheric and soil parameters. Thesemeasurements can help in making decision on irrigation (automating, semi auto-mating), fertilizer and pesticide applications, intruder detection, pest detection,yield prediction, plant disease prediction, fire detection, etc. The first part of thisbrief is devoted to Wireless Sensor Network technology with particular focus onits application in precision agriculture.
Sensor Node Hardware
Development of sensor nodes and associated hardware is currently an activeresearch area carried out in universities and companies around the world. Thepossibilities in this field are enormous because of the increasing need to look fornew sensors for different applications, the advances in miniaturization, compo-nents to be integrated, or new features to save energy. The aim of this section is topresent the sensor node hardware architecture of WSN nodes and to provide thepreview of some typical characteristics of commercially available nodes.
Hardware Architecture
The design of the system architecture is crucial to the longevity of the sensornetworks. Sample rates, precision, synchronization accuracy etc. are factors thatalso have a significant impact upon power consumption. The system architectureof a typical WSN node is depicted in Fig. 1.1. The node, usually called the mote, iscomprised of six architectural components:
D. Culibrk et al., Sensing Technologies For Precision Irrigation,SpringerBriefs in Electrical and Computer Engineering,DOI: 10.1007/978-1-4614-8329-8_1, � The Author(s) 2014
1
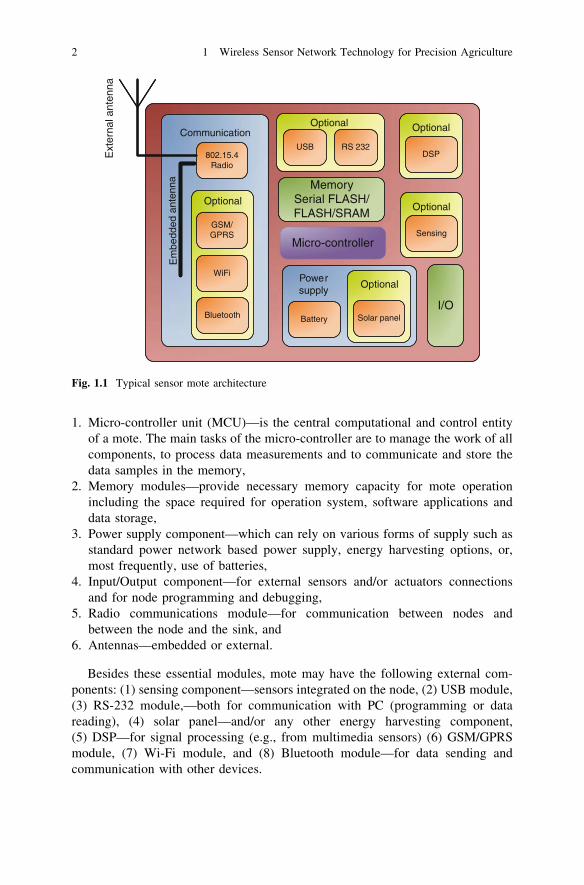
1. Micro-controller unit (MCU)—is the central computational and control entityof a mote. The main tasks of the micro-controller are to manage the work of allcomponents, to process data measurements and to communicate and store thedata samples in the memory,
2. Memory modules—provide necessary memory capacity for mote operationincluding the space required for operation system, software applications anddata storage,
3. Power supply component—which can rely on various forms of supply such asstandard power network based power supply, energy harvesting options, or,most frequently, use of batteries,
4. Input/Output component—for external sensors and/or actuators connectionsand for node programming and debugging,
5. Radio communications module—for communication between nodes andbetween the node and the sink, and
6. Antennas—embedded or external.
Besides these essential modules, mote may have the following external com-ponents: (1) sensing component—sensors integrated on the node, (2) USB module,(3) RS-232 module,—both for communication with PC (programming or datareading), (4) solar panel—and/or any other energy harvesting component,(5) DSP—for signal processing (e.g., from multimedia sensors) (6) GSM/GPRSmodule, (7) Wi-Fi module, and (8) Bluetooth module—for data sending andcommunication with other devices.
802.15.4Radio
Communication
Optional
GSM/GPRS
WiFi
Bluetooth
Optional
Micro-controller
MemorySerial FLASH/FLASH/SRAM
Solar panel
OptionalPowersupply
Battery
I/O
DSP
Optional
Sensing
Optional
Em
bedd
edan
tenn
a
USB RS 232
Ext
erna
l ant
enna
Fig. 1.1 Typical sensor mote architecture
2 1 Wireless Sensor Network Technology for Precision Agriculture

Processing Power and Memory
Microcontroller represents the low-capacity processor which usually operates atlow processor clock rates using computing architecture that ranges from 4 to 32-bitwords. The central processing unit (CPU) is usually based on Reduced InstructionSet Computing (RISC) architecture with clock rates of several megahertz (MHz).It contains read-only (ROM) and random access (RAM) memory elements ofseveral tens or hundreds of kilobytes (KB). Different ‘‘clocks’’ are used in order toprovide local synchronization and Analog/Digital Converter (ADC) functionality.A low-energy operation mode and ability to wake power up, and return to sleepmode efficiently is a key factor in extending the lifetime of the network.Depending on the specific processor, power consumption in sleep mode rangesbetween 1 and 50 lW, while in active mode, it changes from 8 to 500 mW [1]. Itshould be noted that the trade-off between processing speed and power con-sumption is a key concern when selecting a processor for WSNs because higherprocessing power means higher energy consumption. The trend in the manufactureof microcontrollers for WSNs includes reducing power consumption while keep-ing or increasing their speed.
Memory is an external chip device with higher capacity than the internal ROM/RAM memories, designed to store temporal data provided by different sources,e.g., sensors, network, etc. It should be noted that the flash writing/erasing isexpensive, unlike the reading. Writing/reading ratio of energy consumption isabout 80:1. Typical storage capacity of external chips ranges from 256 to 512 KBto several MBs or in extreme cases GBs.
Radio Circuitry and Antennas
The radio device provides wireless communication to the mote and supports theWSN-specific communication requirements such as low energy, sleep state, datarate and short distances. To extend battery lifetime, motes periodically wake up toacquire and transmit data by powering on the radio on and, upon completedcommunication task, powering it back off to conserve energy. The WSN radiomust efficiently transmit signals and allow the system to go back to sleep modewith minimal power use. The main radio chips characteristics are:
• Capabilities: interface-type (bit, byte, packet level), data rates, distance range,frequency range (typical values include 315, 433, 868, 915 MHz and 2.4 GHz,ISM (Industrial, Scientific and Medical) band, number of channels, etc.
• Energy characteristics: power consumption to send/receive data, power effi-ciency, transmission power control, time and energy consumption to changestates, etc.
• Radio performance: modulation, voltage range, gain (signal amplification), noisefigure, receiver sensitivity, blocking performance (achieved BER in presence of
Sensor Node Hardware 3
frequency-offset interferer), out of band emissions, carrier sensing, ReceivedSignal Strength Indicator (RSSI) characteristics, frequency stability (e.g.,towards temperature changes), etc.
Antennas for WSN applications need to satisfy a number of additional prop-erties, besides the standard ones such as the antenna efficiency. Low cost of theantenna represents the fundamental constraint. That is the one of the reasons whysome nodes have Printed Circuit Board (PCB) antennas. WSN motes are (rela-tively) small, which means that antennas must also be small. It is reasonable toassume that the antenna can be committed to narrow-band at one of the most-frequently used ISM-frequencies 434, 868 MHz or 2.4 GHz.
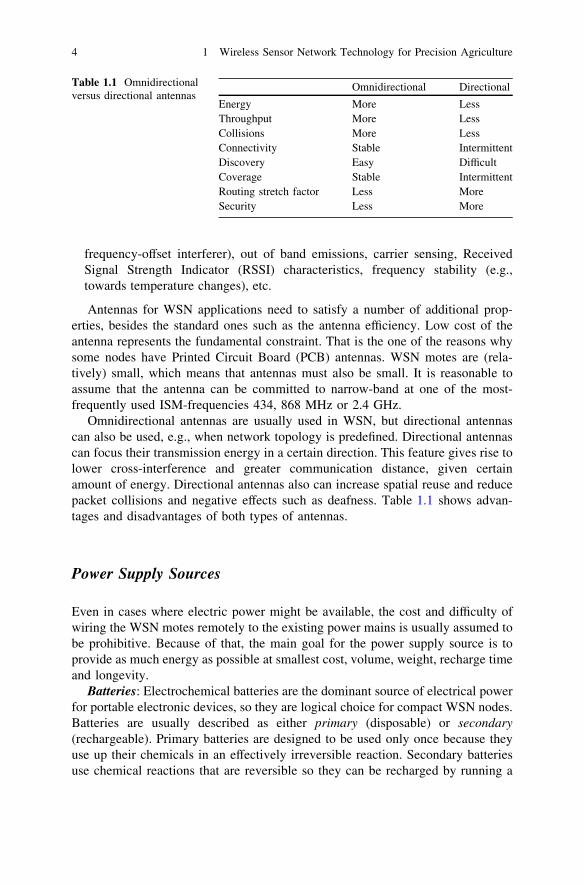
Omnidirectional antennas are usually used in WSN, but directional antennascan also be used, e.g., when network topology is predefined. Directional antennascan focus their transmission energy in a certain direction. This feature gives rise tolower cross-interference and greater communication distance, given certainamount of energy. Directional antennas also can increase spatial reuse and reducepacket collisions and negative effects such as deafness. Table 1.1 shows advan-tages and disadvantages of both types of antennas.
Power Supply Sources
Even in cases where electric power might be available, the cost and difficulty ofwiring the WSN motes remotely to the existing power mains is usually assumed tobe prohibitive. Because of that, the main goal for the power supply source is toprovide as much energy as possible at smallest cost, volume, weight, recharge timeand longevity.
Batteries: Electrochemical batteries are the dominant source of electrical powerfor portable electronic devices, so they are logical choice for compact WSN nodes.Batteries are usually described as either primary (disposable) or secondary(rechargeable). Primary batteries are designed to be used only once because theyuse up their chemicals in an effectively irreversible reaction. Secondary batteriesuse chemical reactions that are reversible so they can be recharged by running a
Table 1.1 Omnidirectionalversus directional antennas
Omnidirectional Directional
Energy More LessThroughput More LessCollisions More LessConnectivity Stable IntermittentDiscovery Easy DifficultCoverage Stable IntermittentRouting stretch factor Less MoreSecurity Less More
4 1 Wireless Sensor Network Technology for Precision Agriculture

charging current in the opposite direction through the battery. Electrochemicalbatteries offer a relatively high energy density at low cost with no moving parts.The most important factor that affects battery lifetime is the discharge rate or theamount of current drawn from the battery. To avoid battery life degradation, theamount of current drawn from the battery should be kept under tight control [2].
There are four rechargeable battery technologies mainly used: Lead-Acid,Ni-Cad, Nickel-Metal Hydride (NiMH) and Li-Ion. As with every technology,each has advantages and disadvantages. Lead-Acid and Ni-Cad are reasonablypriced, easily available and time-tested but are becoming increasingly unattractivebecause of environmental problems with their Lead and Cadmium content. Thatleaves Nickel-Metal Hydride and Li-Ion. Of those two, Li-Ion has the majoradvantage of operating at 3.6 V versus 1.2 V for the NiMH. Usually, one Li-Ionbattery will suffice to directly power most WSN electronics whereas it would take3 of the NiMH in series to do the same. The usage of secondary batteries is usuallycombined with some form of energy harvesting.
WSN motes on market are usually equipped with alkaline type of batteries e.g.,AA (1.5 V, 1,800–2,600 mAh), CR123A (3 V, 1,500 mAh), C (1.5 V, 8,000 mAh)or with their rechargeable pairwise NiMH AA (1.2 V, 800–2,700 mAh), NiMH Cbatteries (1.2 V, 6,000 mAh) etc. For example, a node supplied with 2 AA batteriescan last approximately 5 days if it is active all the time (20 mA consumption) andup to several years with power down (10 lA).
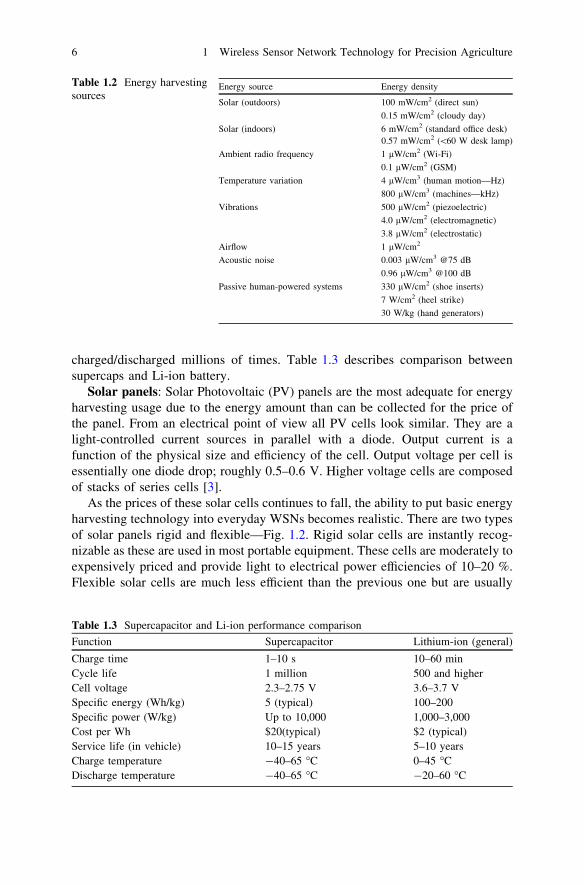
Energy harvesting: Portable energy reservoirs like batteries usually experiencecurrent leakages that drain the resource even when they are not used. A WSN thatis dependent only on batteries has finite lifetime. Energy harvesting holds greatpromise for solving the problem of limited battery life and subsequent replacementespecially where batteries are hard (or impossible) to replace/recharge. The har-vester can be used as a lifetime extender for primary batteries or to rechargesecondary batteries, because of its unlimited energy. Many interesting techniquesto harvest ambient energy have been suggested over the past few years such astemperature differential, vibration, light and RF energy. Table 1.2 describesamount of energy that can be collected from different sources.
The harvesting circuits must have some type of energy storage to maintainpower (e.g., throughout the night and during the cloudy days for solar-basedsources). There are two options for power storage: rechargeable (secondary) bat-teries and supercapacitors.
Supercapacitor, or simply supercaps (also known as ultracapacitor or double-layer capacitor), are very large value capacitors with capacity up to 50 F. Workingvoltages are usually limited to 2.8 V so supercaps are stacked in series to handlethe voltages needed to power the WSN device circuitry (3.3–5.0 V). Mostimportant advantage of supercaps is the number of charge cycles. The energystorage device in a solar powered WSN will be charged and discharged daily(or more often) because of day/night cycles. Three years of operation will result inover 1,000 charge/discharge cycles. This can cause problems for many batteryfamilies because they are limited to 500–1,000 charge/discharge cycles beforesignificantly reducing their capacity. Supercaps have no such limitation and can be
Radio Circuitry and Antennas 5
charged/discharged millions of times. Table 1.3 describes comparison betweensupercaps and Li-ion battery.
Solar panels: Solar Photovoltaic (PV) panels are the most adequate for energyharvesting usage due to the energy amount than can be collected for the price ofthe panel. From an electrical point of view all PV cells look similar. They are alight-controlled current sources in parallel with a diode. Output current is afunction of the physical size and efficiency of the cell. Output voltage per cell isessentially one diode drop; roughly 0.5–0.6 V. Higher voltage cells are composedof stacks of series cells [3].
As the prices of these solar cells continues to fall, the ability to put basic energyharvesting technology into everyday WSNs becomes realistic. There are two typesof solar panels rigid and flexible—Fig. 1.2. Rigid solar cells are instantly recog-nizable as these are used in most portable equipment. These cells are moderately toexpensively priced and provide light to electrical power efficiencies of 10–20 %.Flexible solar cells are much less efficient than the previous one but are usually
Table 1.2 Energy harvestingsources
Energy source Energy density
Solar (outdoors) 100 mW/cm2 (direct sun)
0.15 mW/cm2 (cloudy day)
Solar (indoors) 6 mW/cm2 (standard office desk)0.57 mW/cm2 (\60 W desk lamp)
Ambient radio frequency 1 lW/cm2 (Wi-Fi)
0.1 lW/cm2 (GSM)
Temperature variation 4 lW/cm3 (human motion—Hz)
800 lW/cm3 (machines—kHz)
Vibrations 500 lW/cm2 (piezoelectric)
4.0 lW/cm2 (electromagnetic)
3.8 lW/cm2 (electrostatic)
Airflow 1 lW/cm2
Acoustic noise 0.003 lW/cm3 @75 dB
0.96 lW/cm3 @100 dB
Passive human-powered systems 330 lW/cm2 (shoe inserts)
7 W/cm2 (heel strike)
30 W/kg (hand generators)
Table 1.3 Supercapacitor and Li-ion performance comparison
Function Supercapacitor Lithium-ion (general)
Charge time 1–10 s 10–60 minCycle life 1 million 500 and higherCell voltage 2.3–2.75 V 3.6–3.7 VSpecific energy (Wh/kg) 5 (typical) 100–200Specific power (W/kg) Up to 10,000 1,000–3,000Cost per Wh $20(typical) $2 (typical)Service life (in vehicle) 10–15 years 5–10 yearsCharge temperature -40–65 �C 0–45 �CDischarge temperature -40–65 �C -20–60 �C
6 1 Wireless Sensor Network Technology for Precision Agriculture
cheaper and offer some mechanical flexibility. The latter feature can be very usefulfor applications requiring the cells to cover a curved surface. Efficiencies for thesecells is in the 3–5 % range which is very low percentage of utilization but it can bea decent tradeoff versus the lower price. Typical solar panels available on themarket provide 0.5–5 W, efficiency of *15 %, output voltage of 5.5 V and are ofdimensions of 10–20 cm of width/length.
Sensors for Precision Agriculture
There are two types of sensors, according to their power consumption, passive andactive. A passive sensor does not require an electrical power source to generate anoutput, while an active one does. Typical examples of passive sensors suitable forprecision agriculture applications include: temperature, humidity, atmosphericpressure, anemometers, pluviometers, motion (e.g., accelerometers or gyroscopes),soil moisture, soil water content, leaf wetness, solar radiation, piezoelectricmicrophones, etc., while active sensors include: gas detectors, radar, ultrasonicsensors and video cameras. In order to produce healthy/organic food the followingsensors can also be very useful for agriculture purposes: Carbon Monoxide—CO,Geiger tube [b, c] (Beta and Gamma), Carbon Dioxide—CO2, Oxygen—O2,Methane—CH4, Hydrogen—H2, Ammonia—NH3, Isobutene—C4H10, Ethanol—CH3CH2OH, Toluene—C6H5CH3, Hydrogen Sulfide—H2S, Nitrogen Dioxide—NO2, Ozone—O3, Hydrocarbons—VOC, etc.
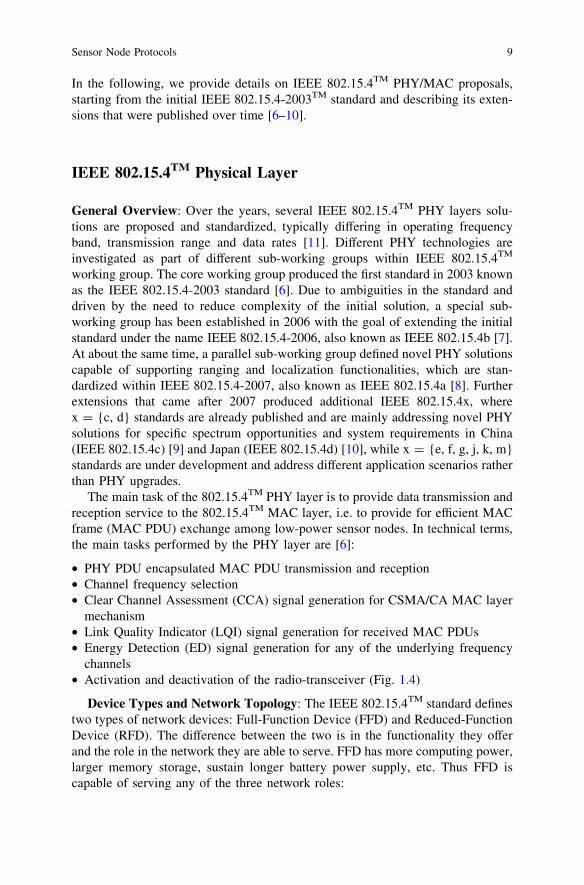
Typical look of sensor mote boards with various attached sensors for precisionagriculture applications is illustrated in Fig. 1.3.
Fig. 1.2 Rigid end flexiblesolar panel
Fig. 1.3 Agriculture board, gases board, radiation board
Radio Circuitry and Antennas 7

Sensor Node Protocols: Lower Layers
Sensor node hardware itself is only a necessary but not sufficient condition forefficient exploitation of WSN technology. Equally important part is represented bycommunication protocols designed to handle complex interconnection of wirelesssensor nodes and maintain reliable and flexible data delivery process from eachsensor node to the sensor network gateway towards the external networks. Giventhat communication, i.e. packet transmissions and receptions, represent the mostintensive process in terms of energy consumption that is performed within thesensor node, its efficient and careful design is the main priority for establishmentof the WSN technology as a reliable solution for environmental and in particularagricultural monitoring applications.
Communication protocols running within the sensor nodes could be roughlydivided into two classes: (1) lower-layer protocols and (2) upper-layer protocols[4, 5]. This division corresponds to rough outlook of usual OSI model architecture,where lower-layer protocols are typically responsible for the communication andchannel access functionality across a single link, whereas upper-layer protocolssolve the problem of end-to-end data delivery between application-layer processesacross the entire network. In the world of WSNs, the division between the lower andupper layer protocols is further accentuated due to the fact that the two protocolclasses are developed and standardized by different standardization bodies. Inparticular, lower-layer protocols are part of responsibility of IEEE, more precisely,its 802.15.4TM working group devoted exclusively to development of solutions forlow-power wireless personal area networking solutions [6–10]. On the other hand,upper layer protocols typically build upon the IEEE 802.15.4TM solution withdifferent possibilities for provision of seamless and efficient IP connectivity ofWSN nodes into the global Internet infrastructure. With IP connectivity, WSNnodes represent major components of the emerging framework of Internet of Things(IoT). However, unlike lower-layer protocols for which a single, IEEE proposedsolution is widely accepted, for upper-layer protocols there are several possibilitiessuch as ZigBee, 6LoWPAN and many others protocol stack solutions.
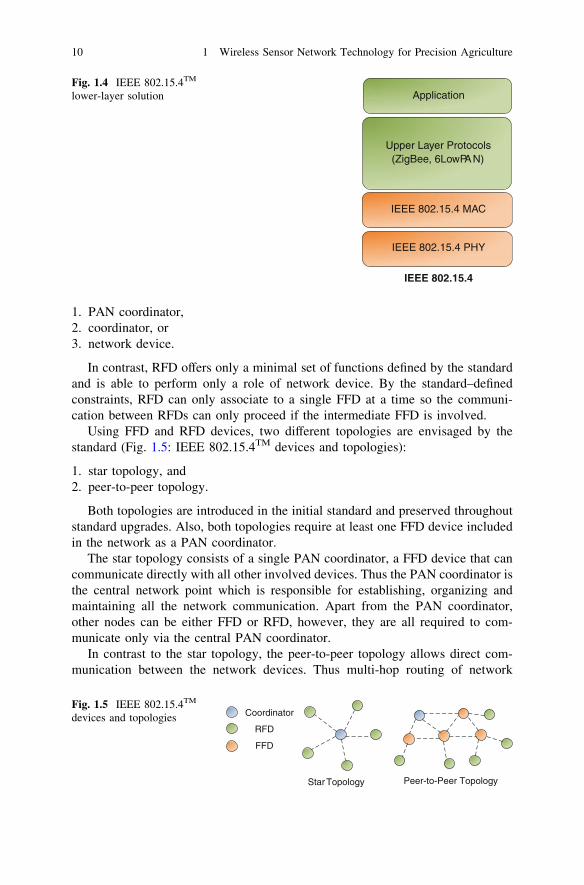
In this section, we provide a detailed description of the lower-layer part of thetypical WSN protocol stack which is usually represented by one of the versions ofthe IEEE 802.15.4TM standard. In the following, we will provide evolution of IEEE802.15.4TM standards on both OSI layers that comprise the lower-layer WSNprotocols: the physical (PHY) layer and the medium access control (MAC) layer.The work on lowermost protocol layers: PHY and MAC layer, for WSN applica-tions is almost exclusively the result of IEEE 802.15.4TM working group effort(Fig. 1.18). The overall goal of IEEE 802.15.4TM standards is to provide theWireless Personal Area Networking (WPAN) solution for simple, low-cost and lowdata rate connectivity among widely spread devices, typically autonomous andwithout direct involvement of end-users. This kind of description includes differentforms of sensor nodes in WSN, thus most of the available commercial WSNsolutions use IEEE 802.15.4TM standards as a basis for their MAC/PHY realization.
8 1 Wireless Sensor Network Technology for Precision Agriculture
In the following, we provide details on IEEE 802.15.4TM PHY/MAC proposals,starting from the initial IEEE 802.15.4-2003TM standard and describing its exten-sions that were published over time [6–10].
IEEE 802.15.4TM Physical Layer
General Overview: Over the years, several IEEE 802.15.4TM PHY layers solu-tions are proposed and standardized, typically differing in operating frequencyband, transmission range and data rates [11]. Different PHY technologies areinvestigated as part of different sub-working groups within IEEE 802.15.4TM
working group. The core working group produced the first standard in 2003 knownas the IEEE 802.15.4-2003 standard [6]. Due to ambiguities in the standard anddriven by the need to reduce complexity of the initial solution, a special sub-working group has been established in 2006 with the goal of extending the initialstandard under the name IEEE 802.15.4-2006, also known as IEEE 802.15.4b [7].At about the same time, a parallel sub-working group defined novel PHY solutionscapable of supporting ranging and localization functionalities, which are stan-dardized within IEEE 802.15.4-2007, also known as IEEE 802.15.4a [8]. Furtherextensions that came after 2007 produced additional IEEE 802.15.4x, wherex = {c, d} standards are already published and are mainly addressing novel PHYsolutions for specific spectrum opportunities and system requirements in China(IEEE 802.15.4c) [9] and Japan (IEEE 802.15.4d) [10], while x = {e, f, g, j, k, m}standards are under development and address different application scenarios ratherthan PHY upgrades.
The main task of the 802.15.4TM PHY layer is to provide data transmission andreception service to the 802.15.4TM MAC layer, i.e. to provide for efficient MACframe (MAC PDU) exchange among low-power sensor nodes. In technical terms,the main tasks performed by the PHY layer are [6]:
• PHY PDU encapsulated MAC PDU transmission and reception• Channel frequency selection• Clear Channel Assessment (CCA) signal generation for CSMA/CA MAC layer
mechanism• Link Quality Indicator (LQI) signal generation for received MAC PDUs• Energy Detection (ED) signal generation for any of the underlying frequency
channels• Activation and deactivation of the radio-transceiver (Fig. 1.4)
Device Types and Network Topology: The IEEE 802.15.4TM standard definestwo types of network devices: Full-Function Device (FFD) and Reduced-FunctionDevice (RFD). The difference between the two is in the functionality they offerand the role in the network they are able to serve. FFD has more computing power,larger memory storage, sustain longer battery power supply, etc. Thus FFD iscapable of serving any of the three network roles:
Sensor Node Protocols 9
1. PAN coordinator,2. coordinator, or3. network device.
In contrast, RFD offers only a minimal set of functions defined by the standardand is able to perform only a role of network device. By the standard–definedconstraints, RFD can only associate to a single FFD at a time so the communi-cation between RFDs can only proceed if the intermediate FFD is involved.
Using FFD and RFD devices, two different topologies are envisaged by thestandard (Fig. 1.5: IEEE 802.15.4TM devices and topologies):
1. star topology, and2. peer-to-peer topology.
Both topologies are introduced in the initial standard and preserved throughoutstandard upgrades. Also, both topologies require at least one FFD device includedin the network as a PAN coordinator.
The star topology consists of a single PAN coordinator, a FFD device that cancommunicate directly with all other involved devices. Thus the PAN coordinator isthe central network point which is responsible for establishing, organizing andmaintaining all the network communication. Apart from the PAN coordinator,other nodes can be either FFD or RFD, however, they are all required to com-municate only via the central PAN coordinator.
In contrast to the star topology, the peer-to-peer topology allows direct com-munication between the network devices. Thus multi-hop routing of network
Upper Layer Protocols(ZigBee, 6LowPAN)
Application
IEEE 802.15.4
IEEE 802.15.4 MAC
IEEE 802.15.4 PHY
Fig. 1.4 IEEE 802.15.4TM
lower-layer solution
Coordinator
RFD
FFD
Peer-to-Peer TopologyStar Topology
Fig. 1.5 IEEE 802.15.4TM
devices and topologies
10 1 Wireless Sensor Network Technology for Precision Agriculture
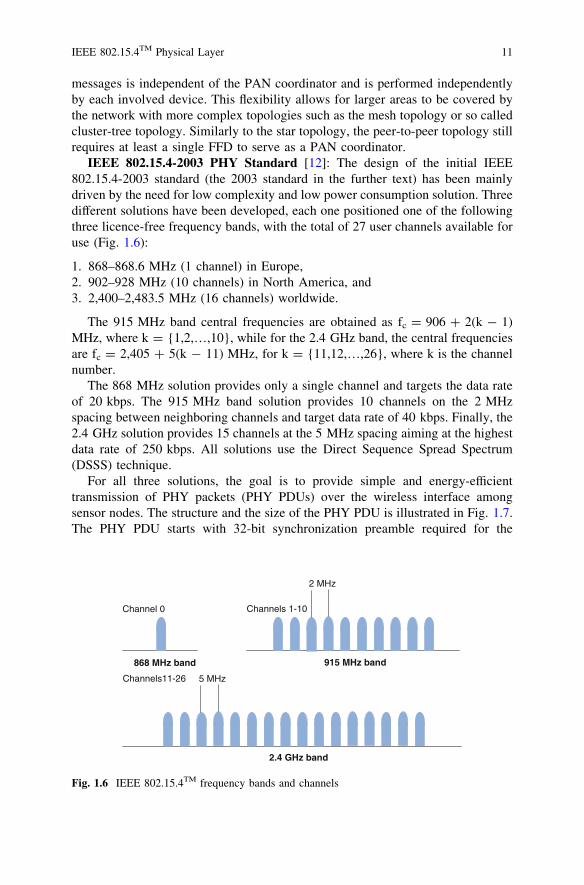
messages is independent of the PAN coordinator and is performed independentlyby each involved device. This flexibility allows for larger areas to be covered bythe network with more complex topologies such as the mesh topology or so calledcluster-tree topology. Similarly to the star topology, the peer-to-peer topology stillrequires at least a single FFD to serve as a PAN coordinator.
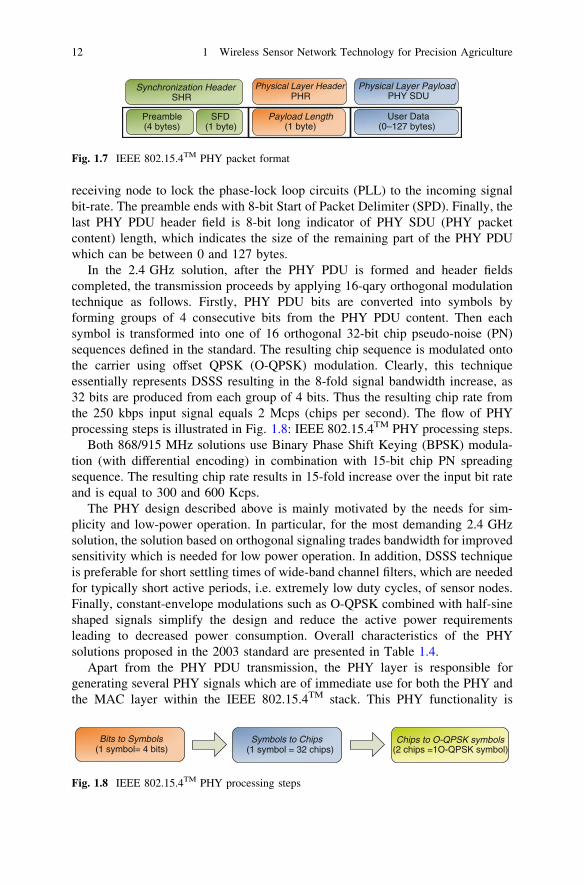
IEEE 802.15.4-2003 PHY Standard [12]: The design of the initial IEEE802.15.4-2003 standard (the 2003 standard in the further text) has been mainlydriven by the need for low complexity and low power consumption solution. Threedifferent solutions have been developed, each one positioned one of the followingthree licence-free frequency bands, with the total of 27 user channels available foruse (Fig. 1.6):
1. 868–868.6 MHz (1 channel) in Europe,2. 902–928 MHz (10 channels) in North America, and3. 2,400–2,483.5 MHz (16 channels) worldwide.
The 915 MHz band central frequencies are obtained as fc = 906 ? 2(k - 1)MHz, where k = {1,2,…,10}, while for the 2.4 GHz band, the central frequenciesare fc = 2,405 ? 5(k - 11) MHz, for k = {11,12,…,26}, where k is the channelnumber.
The 868 MHz solution provides only a single channel and targets the data rateof 20 kbps. The 915 MHz band solution provides 10 channels on the 2 MHzspacing between neighboring channels and target data rate of 40 kbps. Finally, the2.4 GHz solution provides 15 channels at the 5 MHz spacing aiming at the highestdata rate of 250 kbps. All solutions use the Direct Sequence Spread Spectrum(DSSS) technique.
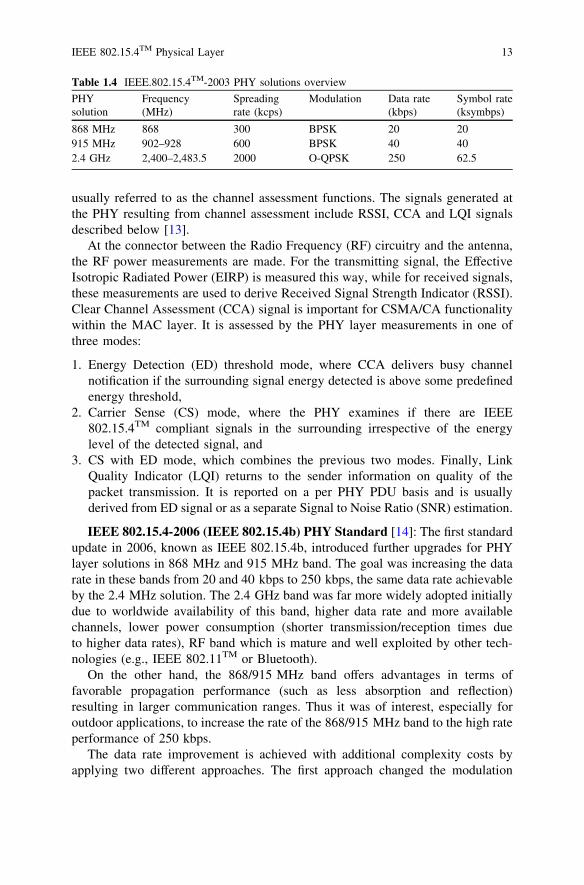
For all three solutions, the goal is to provide simple and energy-efficienttransmission of PHY packets (PHY PDUs) over the wireless interface amongsensor nodes. The structure and the size of the PHY PDU is illustrated in Fig. 1.7.The PHY PDU starts with 32-bit synchronization preamble required for the
2 MHz
915 MHz band868 MHz band
Channel 0 Channels 1-10
5 MHz
2.4 GHz band
Channels11-26
Fig. 1.6 IEEE 802.15.4TM frequency bands and channels
IEEE 802.15.4TM Physical Layer 11
receiving node to lock the phase-lock loop circuits (PLL) to the incoming signalbit-rate. The preamble ends with 8-bit Start of Packet Delimiter (SPD). Finally, thelast PHY PDU header field is 8-bit long indicator of PHY SDU (PHY packetcontent) length, which indicates the size of the remaining part of the PHY PDUwhich can be between 0 and 127 bytes.
In the 2.4 GHz solution, after the PHY PDU is formed and header fieldscompleted, the transmission proceeds by applying 16-qary orthogonal modulationtechnique as follows. Firstly, PHY PDU bits are converted into symbols byforming groups of 4 consecutive bits from the PHY PDU content. Then eachsymbol is transformed into one of 16 orthogonal 32-bit chip pseudo-noise (PN)sequences defined in the standard. The resulting chip sequence is modulated ontothe carrier using offset QPSK (O-QPSK) modulation. Clearly, this techniqueessentially represents DSSS resulting in the 8-fold signal bandwidth increase, as32 bits are produced from each group of 4 bits. Thus the resulting chip rate fromthe 250 kbps input signal equals 2 Mcps (chips per second). The flow of PHYprocessing steps is illustrated in Fig. 1.8: IEEE 802.15.4TM PHY processing steps.
Both 868/915 MHz solutions use Binary Phase Shift Keying (BPSK) modula-tion (with differential encoding) in combination with 15-bit chip PN spreadingsequence. The resulting chip rate results in 15-fold increase over the input bit rateand is equal to 300 and 600 Kcps.
The PHY design described above is mainly motivated by the needs for sim-plicity and low-power operation. In particular, for the most demanding 2.4 GHzsolution, the solution based on orthogonal signaling trades bandwidth for improvedsensitivity which is needed for low power operation. In addition, DSSS techniqueis preferable for short settling times of wide-band channel filters, which are neededfor typically short active periods, i.e. extremely low duty cycles, of sensor nodes.Finally, constant-envelope modulations such as O-QPSK combined with half-sineshaped signals simplify the design and reduce the active power requirementsleading to decreased power consumption. Overall characteristics of the PHYsolutions proposed in the 2003 standard are presented in Table 1.4.
Apart from the PHY PDU transmission, the PHY layer is responsible forgenerating several PHY signals which are of immediate use for both the PHY andthe MAC layer within the IEEE 802.15.4TM stack. This PHY functionality is
Synchronization HeaderSHR
Physical Layer PayloadPHY SDU
Physical Layer HeaderPHR
Preamble(4 bytes)
SFD(1 byte)
Payload Length(1 byte)
User Data(0–127 bytes)
Fig. 1.7 IEEE 802.15.4TM PHY packet format
Chips to O-QPSK symbols(2 chips =1O-QPSK symbol)
Symbols to Chips(1 symbol = 32 chips)
Bits to Symbols(1 symbol= 4 bits)
Fig. 1.8 IEEE 802.15.4TM PHY processing steps
12 1 Wireless Sensor Network Technology for Precision Agriculture
usually referred to as the channel assessment functions. The signals generated atthe PHY resulting from channel assessment include RSSI, CCA and LQI signalsdescribed below [13].
At the connector between the Radio Frequency (RF) circuitry and the antenna,the RF power measurements are made. For the transmitting signal, the EffectiveIsotropic Radiated Power (EIRP) is measured this way, while for received signals,these measurements are used to derive Received Signal Strength Indicator (RSSI).Clear Channel Assessment (CCA) signal is important for CSMA/CA functionalitywithin the MAC layer. It is assessed by the PHY layer measurements in one ofthree modes:
1. Energy Detection (ED) threshold mode, where CCA delivers busy channelnotification if the surrounding signal energy detected is above some predefinedenergy threshold,
2. Carrier Sense (CS) mode, where the PHY examines if there are IEEE802.15.4TM compliant signals in the surrounding irrespective of the energylevel of the detected signal, and
3. CS with ED mode, which combines the previous two modes. Finally, LinkQuality Indicator (LQI) returns to the sender information on quality of thepacket transmission. It is reported on a per PHY PDU basis and is usuallyderived from ED signal or as a separate Signal to Noise Ratio (SNR) estimation.
IEEE 802.15.4-2006 (IEEE 802.15.4b) PHY Standard [14]: The first standardupdate in 2006, known as IEEE 802.15.4b, introduced further upgrades for PHYlayer solutions in 868 MHz and 915 MHz band. The goal was increasing the datarate in these bands from 20 and 40 kbps to 250 kbps, the same data rate achievableby the 2.4 MHz solution. The 2.4 GHz band was far more widely adopted initiallydue to worldwide availability of this band, higher data rate and more availablechannels, lower power consumption (shorter transmission/reception times dueto higher data rates), RF band which is mature and well exploited by other tech-nologies (e.g., IEEE 802.11TM or Bluetooth).
On the other hand, the 868/915 MHz band offers advantages in terms offavorable propagation performance (such as less absorption and reflection)resulting in larger communication ranges. Thus it was of interest, especially foroutdoor applications, to increase the rate of the 868/915 MHz band to the high rateperformance of 250 kbps.
The data rate improvement is achieved with additional complexity costs byapplying two different approaches. The first approach changed the modulation
Table 1.4 IEEE.802.15.4TM-2003 PHY solutions overview
PHYsolution
Frequency(MHz)
Spreadingrate (kcps)
Modulation Data rate(kbps)
Symbol rate(ksymbps)
868 MHz 868 300 BPSK 20 20915 MHz 902–928 600 BPSK 40 402.4 GHz 2,400–2,483.5 2000 O-QPSK 250 62.5
IEEE 802.15.4TM Physical Layer 13
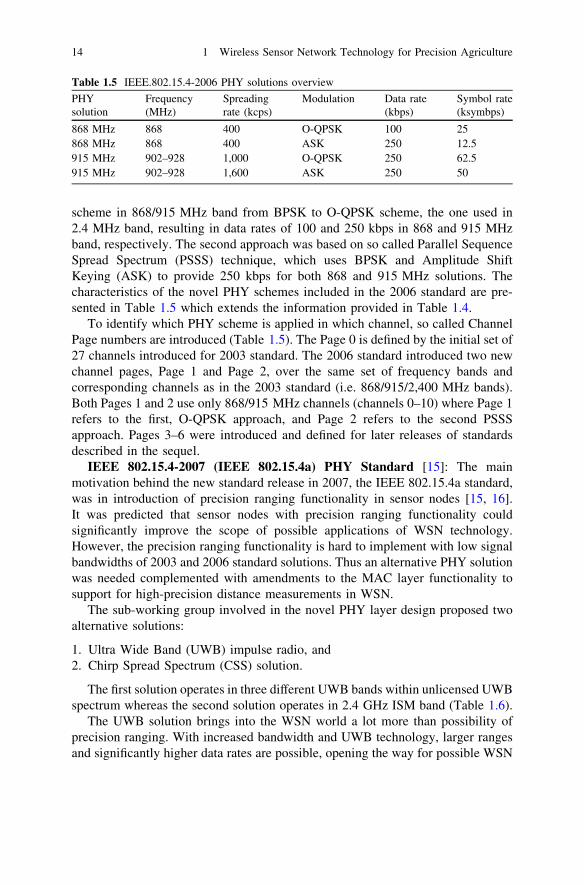
scheme in 868/915 MHz band from BPSK to O-QPSK scheme, the one used in2.4 MHz band, resulting in data rates of 100 and 250 kbps in 868 and 915 MHzband, respectively. The second approach was based on so called Parallel SequenceSpread Spectrum (PSSS) technique, which uses BPSK and Amplitude ShiftKeying (ASK) to provide 250 kbps for both 868 and 915 MHz solutions. Thecharacteristics of the novel PHY schemes included in the 2006 standard are pre-sented in Table 1.5 which extends the information provided in Table 1.4.
To identify which PHY scheme is applied in which channel, so called ChannelPage numbers are introduced (Table 1.5). The Page 0 is defined by the initial set of27 channels introduced for 2003 standard. The 2006 standard introduced two newchannel pages, Page 1 and Page 2, over the same set of frequency bands andcorresponding channels as in the 2003 standard (i.e. 868/915/2,400 MHz bands).Both Pages 1 and 2 use only 868/915 MHz channels (channels 0–10) where Page 1refers to the first, O-QPSK approach, and Page 2 refers to the second PSSSapproach. Pages 3–6 were introduced and defined for later releases of standardsdescribed in the sequel.
IEEE 802.15.4-2007 (IEEE 802.15.4a) PHY Standard [15]: The mainmotivation behind the new standard release in 2007, the IEEE 802.15.4a standard,was in introduction of precision ranging functionality in sensor nodes [15, 16].It was predicted that sensor nodes with precision ranging functionality couldsignificantly improve the scope of possible applications of WSN technology.However, the precision ranging functionality is hard to implement with low signalbandwidths of 2003 and 2006 standard solutions. Thus an alternative PHY solutionwas needed complemented with amendments to the MAC layer functionality tosupport for high-precision distance measurements in WSN.
The sub-working group involved in the novel PHY layer design proposed twoalternative solutions:
1. Ultra Wide Band (UWB) impulse radio, and2. Chirp Spread Spectrum (CSS) solution.
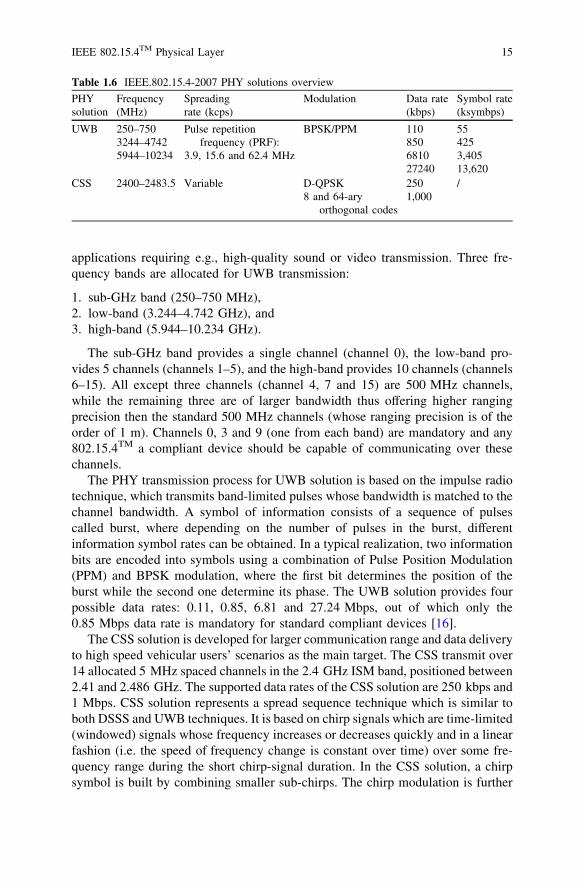
The first solution operates in three different UWB bands within unlicensed UWBspectrum whereas the second solution operates in 2.4 GHz ISM band (Table 1.6).
The UWB solution brings into the WSN world a lot more than possibility ofprecision ranging. With increased bandwidth and UWB technology, larger rangesand significantly higher data rates are possible, opening the way for possible WSN
Table 1.5 IEEE.802.15.4-2006 PHY solutions overview
PHYsolution
Frequency(MHz)
Spreadingrate (kcps)
Modulation Data rate(kbps)
Symbol rate(ksymbps)
868 MHz 868 400 O-QPSK 100 25868 MHz 868 400 ASK 250 12.5915 MHz 902–928 1,000 O-QPSK 250 62.5915 MHz 902–928 1,600 ASK 250 50
14 1 Wireless Sensor Network Technology for Precision Agriculture
applications requiring e.g., high-quality sound or video transmission. Three fre-quency bands are allocated for UWB transmission:
1. sub-GHz band (250–750 MHz),2. low-band (3.244–4.742 GHz), and3. high-band (5.944–10.234 GHz).
The sub-GHz band provides a single channel (channel 0), the low-band pro-vides 5 channels (channels 1–5), and the high-band provides 10 channels (channels6–15). All except three channels (channel 4, 7 and 15) are 500 MHz channels,while the remaining three are of larger bandwidth thus offering higher rangingprecision then the standard 500 MHz channels (whose ranging precision is of theorder of 1 m). Channels 0, 3 and 9 (one from each band) are mandatory and any802.15.4TM a compliant device should be capable of communicating over thesechannels.
The PHY transmission process for UWB solution is based on the impulse radiotechnique, which transmits band-limited pulses whose bandwidth is matched to thechannel bandwidth. A symbol of information consists of a sequence of pulsescalled burst, where depending on the number of pulses in the burst, differentinformation symbol rates can be obtained. In a typical realization, two informationbits are encoded into symbols using a combination of Pulse Position Modulation(PPM) and BPSK modulation, where the first bit determines the position of theburst while the second one determine its phase. The UWB solution provides fourpossible data rates: 0.11, 0.85, 6.81 and 27.24 Mbps, out of which only the0.85 Mbps data rate is mandatory for standard compliant devices [16].
The CSS solution is developed for larger communication range and data deliveryto high speed vehicular users’ scenarios as the main target. The CSS transmit over14 allocated 5 MHz spaced channels in the 2.4 GHz ISM band, positioned between2.41 and 2.486 GHz. The supported data rates of the CSS solution are 250 kbps and1 Mbps. CSS solution represents a spread sequence technique which is similar toboth DSSS and UWB techniques. It is based on chirp signals which are time-limited(windowed) signals whose frequency increases or decreases quickly and in a linearfashion (i.e. the speed of frequency change is constant over time) over some fre-quency range during the short chirp-signal duration. In the CSS solution, a chirpsymbol is built by combining smaller sub-chirps. The chirp modulation is further
Table 1.6 IEEE.802.15.4-2007 PHY solutions overview
PHYsolution
Frequency(MHz)
Spreadingrate (kcps)
Modulation Data rate(kbps)
Symbol rate(ksymbps)
UWB 250–7503244–47425944–10234
Pulse repetitionfrequency (PRF):
3.9, 15.6 and 62.4 MHz
BPSK/PPM 110850681027240
554253,40513,620
CSS 2400–2483.5 Variable D-QPSK8 and 64-ary
orthogonal codes
2501,000
/
IEEE 802.15.4TM Physical Layer 15
combined with differential QPSK (DQPSK) modulation and 8-ary or 64-ary bi-orthogonal coding resulting in the 1 Mbps and 250 kbps data rate solutions.Overall, the CSS solution results in a solution favorable for long-range and high-speed mobile users WSN communications [17].
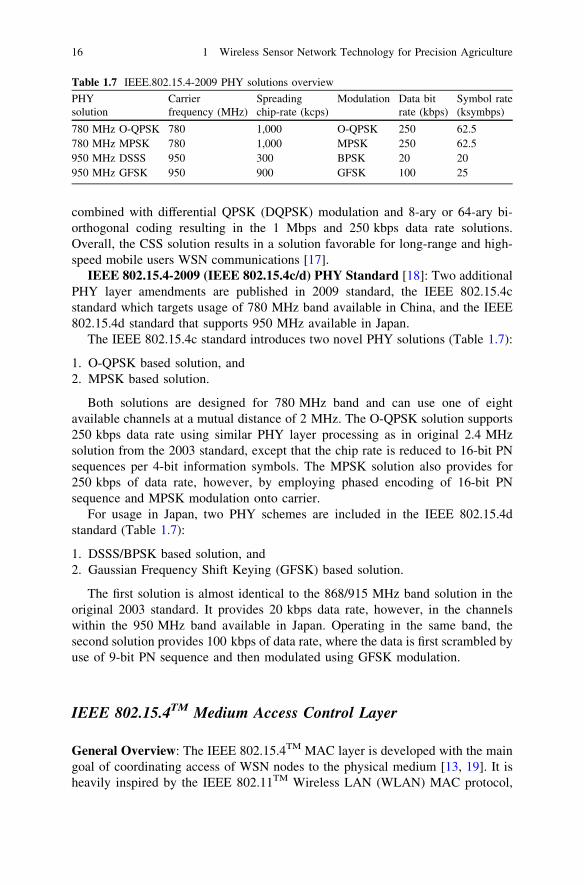
IEEE 802.15.4-2009 (IEEE 802.15.4c/d) PHY Standard [18]: Two additionalPHY layer amendments are published in 2009 standard, the IEEE 802.15.4cstandard which targets usage of 780 MHz band available in China, and the IEEE802.15.4d standard that supports 950 MHz available in Japan.
The IEEE 802.15.4c standard introduces two novel PHY solutions (Table 1.7):
1. O-QPSK based solution, and2. MPSK based solution.
Both solutions are designed for 780 MHz band and can use one of eightavailable channels at a mutual distance of 2 MHz. The O-QPSK solution supports250 kbps data rate using similar PHY layer processing as in original 2.4 MHzsolution from the 2003 standard, except that the chip rate is reduced to 16-bit PNsequences per 4-bit information symbols. The MPSK solution also provides for250 kbps of data rate, however, by employing phased encoding of 16-bit PNsequence and MPSK modulation onto carrier.
For usage in Japan, two PHY schemes are included in the IEEE 802.15.4dstandard (Table 1.7):
1. DSSS/BPSK based solution, and2. Gaussian Frequency Shift Keying (GFSK) based solution.
The first solution is almost identical to the 868/915 MHz band solution in theoriginal 2003 standard. It provides 20 kbps data rate, however, in the channelswithin the 950 MHz band available in Japan. Operating in the same band, thesecond solution provides 100 kbps of data rate, where the data is first scrambled byuse of 9-bit PN sequence and then modulated using GFSK modulation.
IEEE 802.15.4TM Medium Access Control Layer
General Overview: The IEEE 802.15.4TM MAC layer is developed with the maingoal of coordinating access of WSN nodes to the physical medium [13, 19]. It isheavily inspired by the IEEE 802.11TM Wireless LAN (WLAN) MAC protocol,
Table 1.7 IEEE.802.15.4-2009 PHY solutions overview
PHYsolution
Carrierfrequency (MHz)
Spreadingchip-rate (kcps)
Modulation Data bitrate (kbps)
Symbol rate(ksymbps)
780 MHz O-QPSK 780 1,000 O-QPSK 250 62.5780 MHz MPSK 780 1,000 MPSK 250 62.5950 MHz DSSS 950 300 BPSK 20 20950 MHz GFSK 950 900 GFSK 100 25
16 1 Wireless Sensor Network Technology for Precision Agriculture

however, with additional simplifications introduced wherever possible. The mainset of tasks the MAC layer in 802.15.4TM takes care of is listed as follows [18]:
• Generating network Beacons if the device is a Coordinator,• Synchronization to the Beacon,• Support for PAN association and de-association,• Support for sensor node security,• Application of CSMA/CA algorithm for PHY channel access,• Handling and maintaining Guaranteed Time Slot (GTS) mechanism, and• Providing a reliable MAC to MAC entity communication between devices.
The above tasks are described in the following text within the process of datacommunication between network devices using different possible channel accessmodes and, where applicable, applying CSMA/CA algorithm for random channelaccess.
MAC Frame Format: The data transmission among MAC entities of WSNdevices assumes exchange of MAC PDUs, usually called MAC frames. Thestructure of a MAC frame is illustrated in Figure and, similarly to all data linklayer protocol frames, it consists of three major parts:
1. MAC frame header (MHR),2. MAC payload (MAC SDU, i.e. user data), and3. MAC footer (MFR).
The above MAC PDU format is general and applies to all four types of MACframes. These are:
1. Beacon frames,2. Data frames,3. Acknowledgement (ACK) frames, and4. MAC Command frames.
The type of the MAC frame is indicated in the first field of the MHR, within theFrame Type subfield of the Frame Control field. Clearly, the most importantframes are data frames which transmit upper layer messages, however, theremaining frame types are crucial for MAC protocol operation.
MHR part contains three header fields: Frame Control field, Sequence Numberfield, and Address Fields, whose details can be found in the standard. There aretwo options for device addressing within the network:
1. 64-bit IEEE (MAC) Address, and2. 16-bit Short Address.
IEEE address is represented in standard 64-bits IEEE MAC layer format forLAN physical interfaces. It is assigned by device manufacturer according to globalIEEE addressing rules and no two devices can have the same MAC address. InWSN applications, it is frequently called extended address. In contrast, the shortaddress is 16-bit address which is local to the network, which means that two
IEEE 802.15.4TM Physical Layer 17
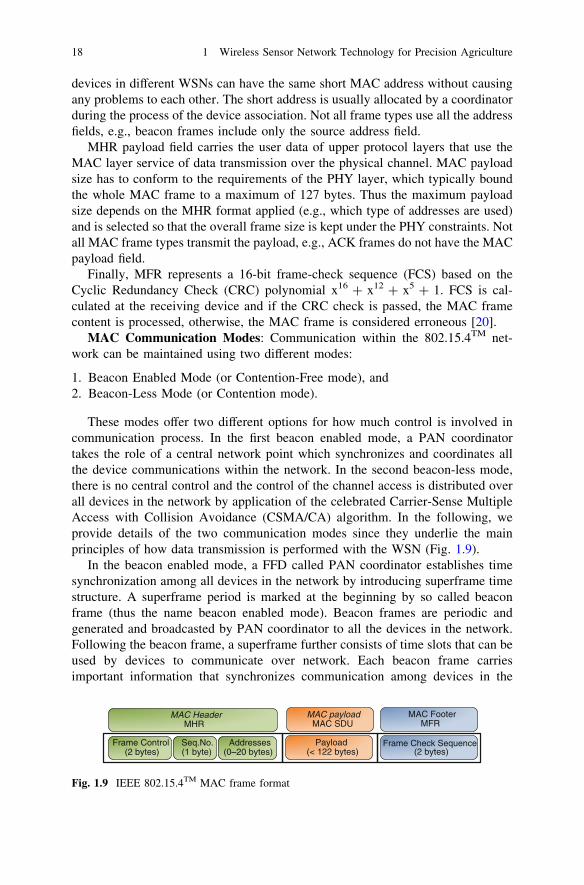
devices in different WSNs can have the same short MAC address without causingany problems to each other. The short address is usually allocated by a coordinatorduring the process of the device association. Not all frame types use all the addressfields, e.g., beacon frames include only the source address field.
MHR payload field carries the user data of upper protocol layers that use theMAC layer service of data transmission over the physical channel. MAC payloadsize has to conform to the requirements of the PHY layer, which typically boundthe whole MAC frame to a maximum of 127 bytes. Thus the maximum payloadsize depends on the MHR format applied (e.g., which type of addresses are used)and is selected so that the overall frame size is kept under the PHY constraints. Notall MAC frame types transmit the payload, e.g., ACK frames do not have the MACpayload field.
Finally, MFR represents a 16-bit frame-check sequence (FCS) based on theCyclic Redundancy Check (CRC) polynomial x16 ? x12 ? x5 ? 1. FCS is cal-culated at the receiving device and if the CRC check is passed, the MAC framecontent is processed, otherwise, the MAC frame is considered erroneous [20].
MAC Communication Modes: Communication within the 802.15.4TM net-work can be maintained using two different modes:
1. Beacon Enabled Mode (or Contention-Free mode), and2. Beacon-Less Mode (or Contention mode).
These modes offer two different options for how much control is involved incommunication process. In the first beacon enabled mode, a PAN coordinatortakes the role of a central network point which synchronizes and coordinates allthe device communications within the network. In the second beacon-less mode,there is no central control and the control of the channel access is distributed overall devices in the network by application of the celebrated Carrier-Sense MultipleAccess with Collision Avoidance (CSMA/CA) algorithm. In the following, weprovide details of the two communication modes since they underlie the mainprinciples of how data transmission is performed with the WSN (Fig. 1.9).
In the beacon enabled mode, a FFD called PAN coordinator establishes timesynchronization among all devices in the network by introducing superframe timestructure. A superframe period is marked at the beginning by so called beaconframe (thus the name beacon enabled mode). Beacon frames are periodic andgenerated and broadcasted by PAN coordinator to all the devices in the network.Following the beacon frame, a superframe further consists of time slots that can beused by devices to communicate over network. Each beacon frame carriesimportant information that synchronizes communication among devices in the
MAC HeaderMHR
MAC FooterMFR
MAC payloadMAC SDU
Frame Control(2 bytes)
Seq.No.(1 byte)
Payload(< 122 bytes)
Frame Check Sequence(2 bytes)
Addresses(0–20 bytes)
Fig. 1.9 IEEE 802.15.4TM MAC frame format
18 1 Wireless Sensor Network Technology for Precision Agriculture
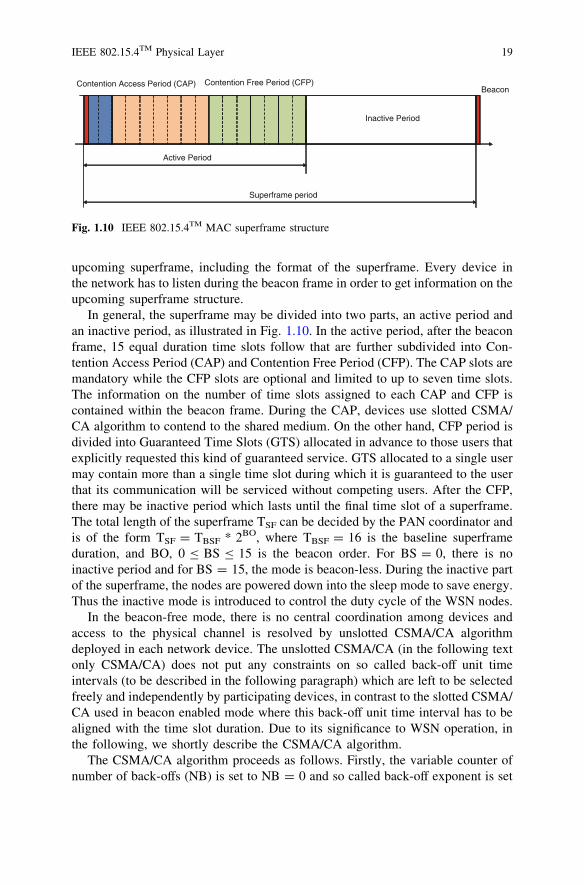
upcoming superframe, including the format of the superframe. Every device inthe network has to listen during the beacon frame in order to get information on theupcoming superframe structure.
In general, the superframe may be divided into two parts, an active period andan inactive period, as illustrated in Fig. 1.10. In the active period, after the beaconframe, 15 equal duration time slots follow that are further subdivided into Con-tention Access Period (CAP) and Contention Free Period (CFP). The CAP slots aremandatory while the CFP slots are optional and limited to up to seven time slots.The information on the number of time slots assigned to each CAP and CFP iscontained within the beacon frame. During the CAP, devices use slotted CSMA/CA algorithm to contend to the shared medium. On the other hand, CFP period isdivided into Guaranteed Time Slots (GTS) allocated in advance to those users thatexplicitly requested this kind of guaranteed service. GTS allocated to a single usermay contain more than a single time slot during which it is guaranteed to the userthat its communication will be serviced without competing users. After the CFP,there may be inactive period which lasts until the final time slot of a superframe.The total length of the superframe TSF can be decided by the PAN coordinator andis of the form TSF = TBSF * 2BO, where TBSF = 16 is the baseline superframeduration, and BO, 0 B BS B 15 is the beacon order. For BS = 0, there is noinactive period and for BS = 15, the mode is beacon-less. During the inactive partof the superframe, the nodes are powered down into the sleep mode to save energy.Thus the inactive mode is introduced to control the duty cycle of the WSN nodes.
In the beacon-free mode, there is no central coordination among devices andaccess to the physical channel is resolved by unslotted CSMA/CA algorithmdeployed in each network device. The unslotted CSMA/CA (in the following textonly CSMA/CA) does not put any constraints on so called back-off unit timeintervals (to be described in the following paragraph) which are left to be selectedfreely and independently by participating devices, in contrast to the slotted CSMA/CA used in beacon enabled mode where this back-off unit time interval has to bealigned with the time slot duration. Due to its significance to WSN operation, inthe following, we shortly describe the CSMA/CA algorithm.
The CSMA/CA algorithm proceeds as follows. Firstly, the variable counter ofnumber of back-offs (NB) is set to NB = 0 and so called back-off exponent is set
Contention Access Period (CAP) Contention Free Period (CFP)
Active Period
Inactive Period
Superframe period
Beacon
Fig. 1.10 IEEE 802.15.4TM MAC superframe structure
IEEE 802.15.4TM Physical Layer 19
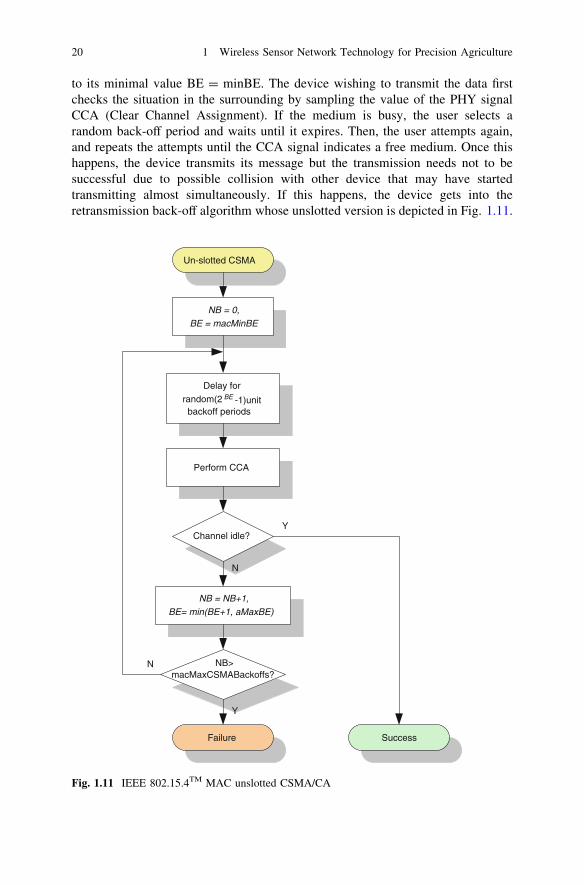
to its minimal value BE = minBE. The device wishing to transmit the data firstchecks the situation in the surrounding by sampling the value of the PHY signalCCA (Clear Channel Assignment). If the medium is busy, the user selects arandom back-off period and waits until it expires. Then, the user attempts again,and repeats the attempts until the CCA signal indicates a free medium. Once thishappens, the device transmits its message but the transmission needs not to besuccessful due to possible collision with other device that may have startedtransmitting almost simultaneously. If this happens, the device gets into theretransmission back-off algorithm whose unslotted version is depicted in Fig. 1.11.
NB = 0,BE = macMinBE
Delay forrandom(2 BE -1)unitbackoff periods
Perform CCA
Channel idle?
NB = NB+1,BE= min(BE+1, aMaxBE)
NB>macMaxCSMABackoffs?
Failure Success
Un-slotted CSMA
Y
Y
N
N
Fig. 1.11 IEEE 802.15.4TM MAC unslotted CSMA/CA
20 1 Wireless Sensor Network Technology for Precision Agriculture
During the back-off stage, the device selects a random waiting period from theinterval [0, 2BE - 1]. After this period expires, the device will perform CCAagain, and if the channel is free, it will start transmission, otherwise, the variablecounters NB and BE will be incremented. This procedure will be repeated until thesuccessful transmission or until the maximum number of back-offs is reachedwhen the data message is simply dropped.
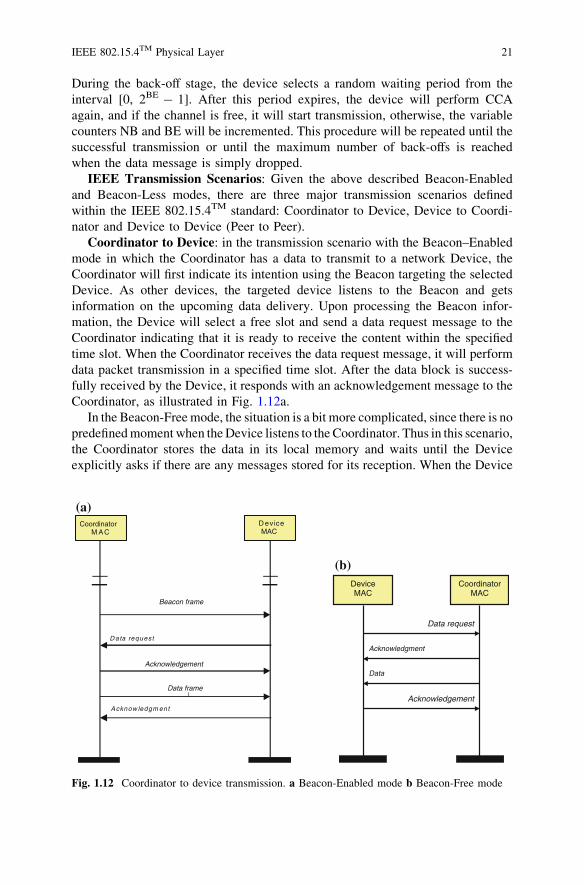
IEEE Transmission Scenarios: Given the above described Beacon-Enabledand Beacon-Less modes, there are three major transmission scenarios definedwithin the IEEE 802.15.4TM standard: Coordinator to Device, Device to Coordi-nator and Device to Device (Peer to Peer).
Coordinator to Device: in the transmission scenario with the Beacon–Enabledmode in which the Coordinator has a data to transmit to a network Device, theCoordinator will first indicate its intention using the Beacon targeting the selectedDevice. As other devices, the targeted device listens to the Beacon and getsinformation on the upcoming data delivery. Upon processing the Beacon infor-mation, the Device will select a free slot and send a data request message to theCoordinator indicating that it is ready to receive the content within the specifiedtime slot. When the Coordinator receives the data request message, it will performdata packet transmission in a specified time slot. After the data block is success-fully received by the Device, it responds with an acknowledgement message to theCoordinator, as illustrated in Fig. 1.12a.
In the Beacon-Free mode, the situation is a bit more complicated, since there is nopredefined moment when the Device listens to the Coordinator. Thus in this scenario,the Coordinator stores the data in its local memory and waits until the Deviceexplicitly asks if there are any messages stored for its reception. When the Device
Coordinator CAM
eciveDMAC
Data frame
tnemgdelwonkcA
Beacon frame
tseuqerataD
Acknowledgement
DeviceMAC
Coordinator MAC
Data request
Acknowledgment
Data
Acknowledgement
(a)
(b)
Fig. 1.12 Coordinator to device transmission. a Beacon-Enabled mode b Beacon-Free mode
IEEE 802.15.4TM Physical Layer 21
asks the Coordinator if there are any messages targeting the Device, the Coordinatorchecks its storage buffer, and if the answer is ‘yes’ it will send ACK message to theDevice. Immediately after the ACK message, the Coordinator sends data to theDevice which responses back with its own ACK message, as presented in Fig. 1.12b.
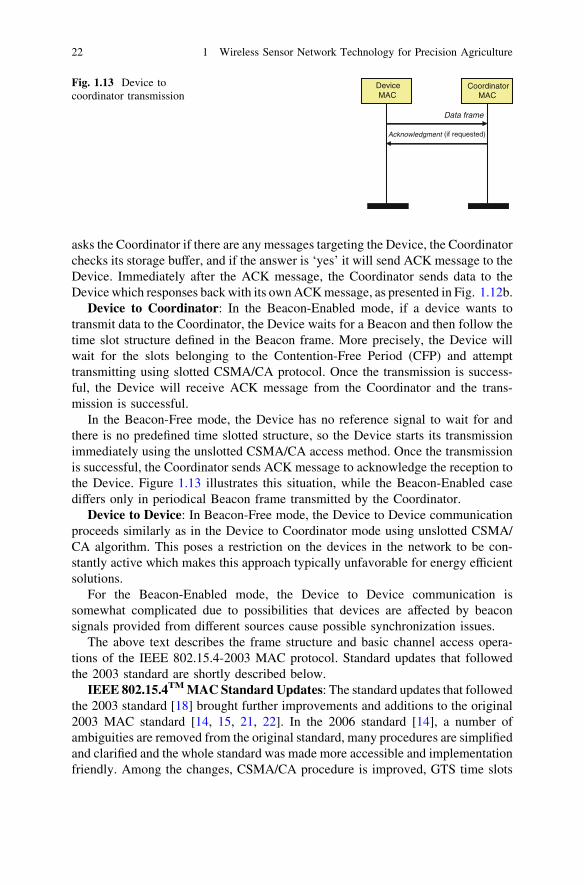
Device to Coordinator: In the Beacon-Enabled mode, if a device wants totransmit data to the Coordinator, the Device waits for a Beacon and then follow thetime slot structure defined in the Beacon frame. More precisely, the Device willwait for the slots belonging to the Contention-Free Period (CFP) and attempttransmitting using slotted CSMA/CA protocol. Once the transmission is success-ful, the Device will receive ACK message from the Coordinator and the trans-mission is successful.
In the Beacon-Free mode, the Device has no reference signal to wait for andthere is no predefined time slotted structure, so the Device starts its transmissionimmediately using the unslotted CSMA/CA access method. Once the transmissionis successful, the Coordinator sends ACK message to acknowledge the reception tothe Device. Figure 1.13 illustrates this situation, while the Beacon-Enabled casediffers only in periodical Beacon frame transmitted by the Coordinator.
Device to Device: In Beacon-Free mode, the Device to Device communicationproceeds similarly as in the Device to Coordinator mode using unslotted CSMA/CA algorithm. This poses a restriction on the devices in the network to be con-stantly active which makes this approach typically unfavorable for energy efficientsolutions.
For the Beacon-Enabled mode, the Device to Device communication issomewhat complicated due to possibilities that devices are affected by beaconsignals provided from different sources cause possible synchronization issues.
The above text describes the frame structure and basic channel access opera-tions of the IEEE 802.15.4-2003 MAC protocol. Standard updates that followedthe 2003 standard are shortly described below.
IEEE 802.15.4TM MAC Standard Updates: The standard updates that followedthe 2003 standard [18] brought further improvements and additions to the original2003 MAC standard [14, 15, 21, 22]. In the 2006 standard [14], a number ofambiguities are removed from the original standard, many procedures are simplifiedand clarified and the whole standard was made more accessible and implementationfriendly. Among the changes, CSMA/CA procedure is improved, GTS time slots
DeviceMAC
CoordinatorMAC
Data frame
Acknowledgment (if requested)
Fig. 1.13 Device tocoordinator transmission
22 1 Wireless Sensor Network Technology for Precision Agriculture
within the superframe are left optional for use and further enhancements in securitymechanisms are introduced.
Due to significant changes in PHY layer technology in the 2007 standard [15],where UWB PHY solution is introduced, it was necessary to change the MAClayer functionality. In particular, UWB solution is not the standard PHY tech-nology that applies carrier signals in a usual sense, thus CSMA/CA algorithm isnot the most suitable one for this scenario. Instead, it has been shown that ALOHAmedium access protocol works satisfactory and is able to achieve considerablylarger throughput, which is the reason why ALOHA is included in the standard asa basis for a MAC solution in the 2007 UWB standard version. However, as theALOHA solution works well only for small to medium network density, theCSMA/CA solution is still included as optional for dense network scenarios.
Finally, both 2009 versions of the standard [13, 21] do not effectively changeany of the fundamental properties of the CSMA/CA based access scheme of theoriginal 2003 standard.
Sensor Node Protocols: Upper Layers
There are, nowadays, two main specifications for implementing the communica-tion upper layers in wireless sensor networks: ZigBeeTM and 6LoWPAN.
ZigBee�
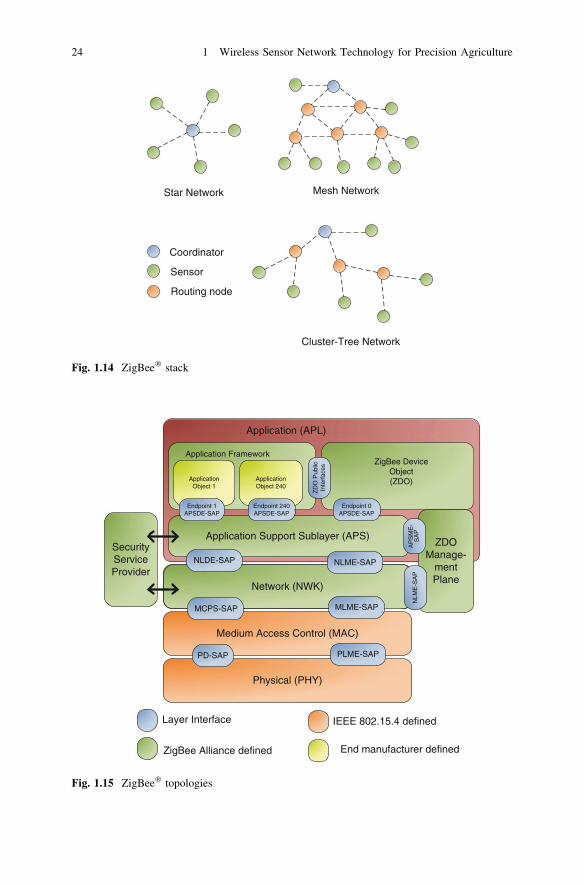
ZigBee� is a bidirectional wireless communication standard, developed by theZigBee� Alliance [23] and designed for low-cost and low-power consumptioncommunication. It is built on the foundation of the IEEE 802.15.4TM standard,which defines the two lower layers: the physical (PHY) layer and the mediumaccess control (MAC) sub-layer. The ZigBee� Alliance provides the network(NWK) layer and the framework for the application layer, Fig. 1.14 represents theZigBee� layers and its interactions.
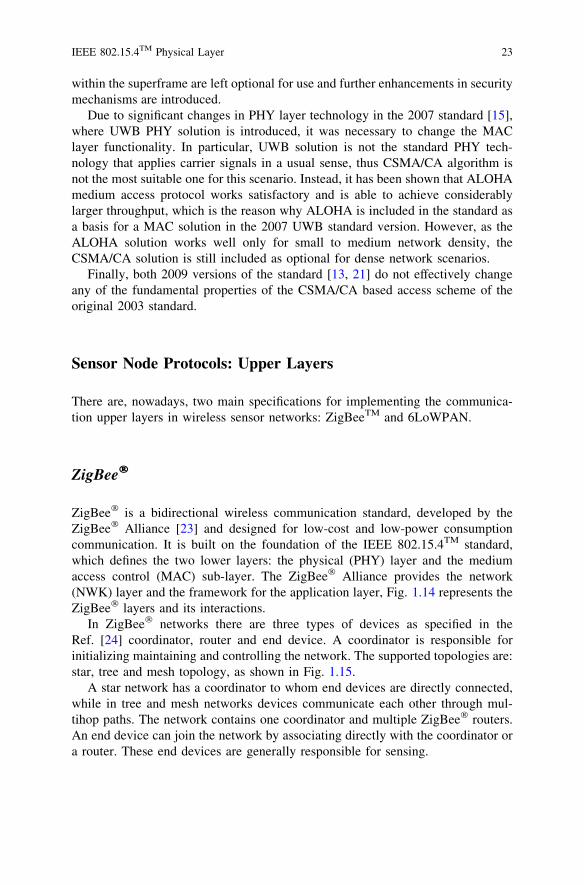
In ZigBee� networks there are three types of devices as specified in theRef. [24] coordinator, router and end device. A coordinator is responsible forinitializing maintaining and controlling the network. The supported topologies are:star, tree and mesh topology, as shown in Fig. 1.15.
A star network has a coordinator to whom end devices are directly connected,while in tree and mesh networks devices communicate each other through mul-tihop paths. The network contains one coordinator and multiple ZigBee� routers.An end device can join the network by associating directly with the coordinator ora router. These end devices are generally responsible for sensing.
IEEE 802.15.4TM Physical Layer 23
Coordinator
Sensor
Routing node
Cluster-Tree Network
Mesh NetworkStar Network
Fig. 1.14 ZigBee� stack
Physical (PHY)
Medium Access Control (MAC)
Network (NWK)
PD-SAP PLME-SAP
MCPS-SAP MLME-SAP
Application (APL)
Application Support Sublayer (APS)
NLDE-SAP NLME-SAP
Application FrameworkZigBee Device
Object(ZDO)Application
Object 1ApplicationObject 240
Endpoint 240APSDE-SAP
Endpoint 1APSDE-SAP
Endpoint 0APSDE-SAP
ZD
OP
ublic
Inte
rfac
e s
IEEE 802.15.4 defined
ZigBee Alliance defined
SecurityServiceProvider
ZDOManage-
mentPlane
NLM
E-S
AP
AP
SM
E-
SA
P
End manufacturer defined
Layer Interface
Fig. 1.15 ZigBee� topologies
24 1 Wireless Sensor Network Technology for Precision Agriculture
ZigBee� Network Layer
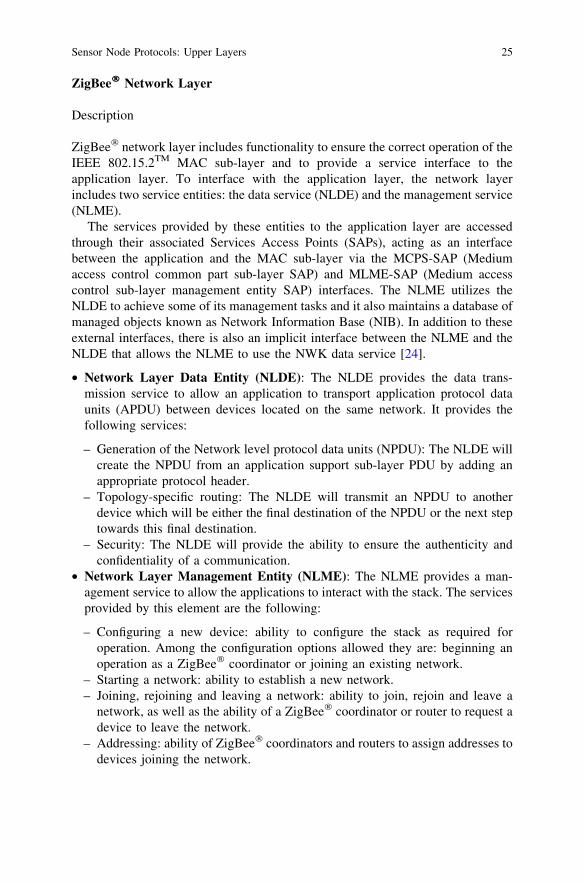
Description
ZigBee� network layer includes functionality to ensure the correct operation of theIEEE 802.15.2TM MAC sub-layer and to provide a service interface to theapplication layer. To interface with the application layer, the network layerincludes two service entities: the data service (NLDE) and the management service(NLME).
The services provided by these entities to the application layer are accessedthrough their associated Services Access Points (SAPs), acting as an interfacebetween the application and the MAC sub-layer via the MCPS-SAP (Mediumaccess control common part sub-layer SAP) and MLME-SAP (Medium accesscontrol sub-layer management entity SAP) interfaces. The NLME utilizes theNLDE to achieve some of its management tasks and it also maintains a database ofmanaged objects known as Network Information Base (NIB). In addition to theseexternal interfaces, there is also an implicit interface between the NLME and theNLDE that allows the NLME to use the NWK data service [24].
• Network Layer Data Entity (NLDE): The NLDE provides the data trans-mission service to allow an application to transport application protocol dataunits (APDU) between devices located on the same network. It provides thefollowing services:
– Generation of the Network level protocol data units (NPDU): The NLDE willcreate the NPDU from an application support sub-layer PDU by adding anappropriate protocol header.
– Topology-specific routing: The NLDE will transmit an NPDU to anotherdevice which will be either the final destination of the NPDU or the next steptowards this final destination.
– Security: The NLDE will provide the ability to ensure the authenticity andconfidentiality of a communication.
• Network Layer Management Entity (NLME): The NLME provides a man-agement service to allow the applications to interact with the stack. The servicesprovided by this element are the following:
– Configuring a new device: ability to configure the stack as required foroperation. Among the configuration options allowed they are: beginning anoperation as a ZigBee� coordinator or joining an existing network.
– Starting a network: ability to establish a new network.– Joining, rejoining and leaving a network: ability to join, rejoin and leave a
network, as well as the ability of a ZigBee� coordinator or router to request adevice to leave the network.
– Addressing: ability of ZigBee� coordinators and routers to assign addresses todevices joining the network.
Sensor Node Protocols: Upper Layers 25
– Neighbor discovery: ability to discover, record and report information aboutthe one-hop neighbors of a device.
– Route discovery: ability to discover and record paths through the network bymeans of which messages will be routed.
– Reception control: ability for a device to control when the receiver is acti-vated and for how long, enabling MAC sub-layer synchronization or directreception.
– Routing: ability to use different routing mechanisms such as unicast, broad-cast, multicast or many to one to efficiently exchange data in the network.
Routing Algorithms
ZigBee� routing protocol combines Cluster-Tree with AODVjr algorithms [25],which are explained in the following paragraphs.
• AODVjr Routing algorithm:
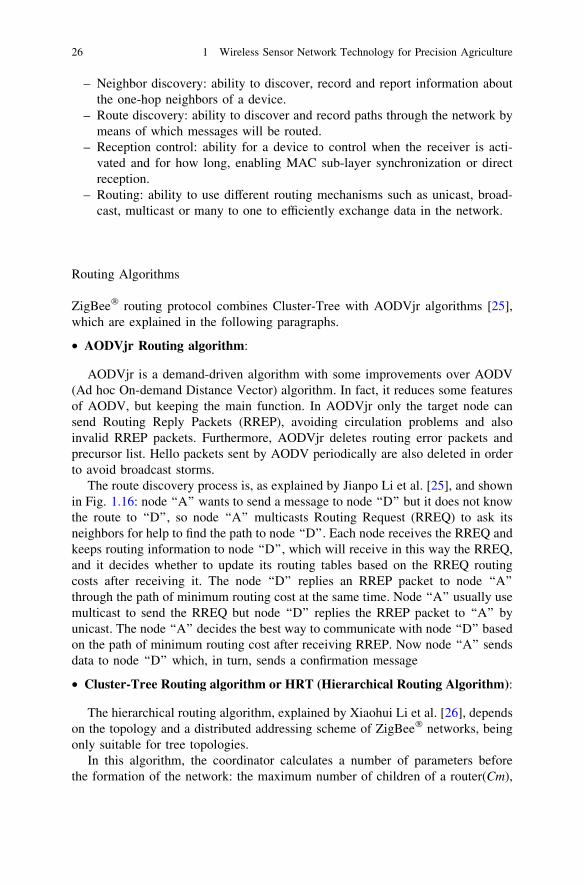
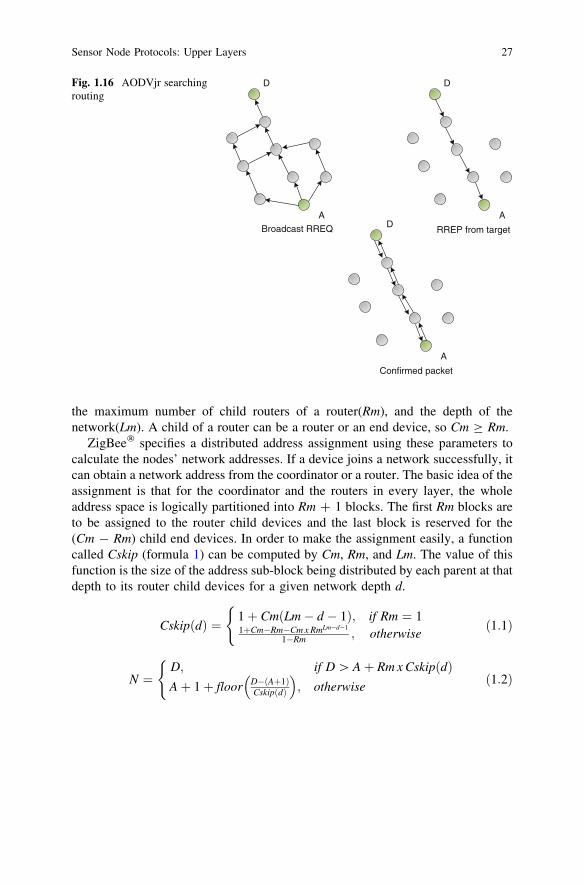
AODVjr is a demand-driven algorithm with some improvements over AODV(Ad hoc On-demand Distance Vector) algorithm. In fact, it reduces some featuresof AODV, but keeping the main function. In AODVjr only the target node cansend Routing Reply Packets (RREP), avoiding circulation problems and alsoinvalid RREP packets. Furthermore, AODVjr deletes routing error packets andprecursor list. Hello packets sent by AODV periodically are also deleted in orderto avoid broadcast storms.
The route discovery process is, as explained by Jianpo Li et al. [25], and shownin Fig. 1.16: node ‘‘A’’ wants to send a message to node ‘‘D’’ but it does not knowthe route to ‘‘D’’, so node ‘‘A’’ multicasts Routing Request (RREQ) to ask itsneighbors for help to find the path to node ‘‘D’’. Each node receives the RREQ andkeeps routing information to node ‘‘D’’, which will receive in this way the RREQ,and it decides whether to update its routing tables based on the RREQ routingcosts after receiving it. The node ‘‘D’’ replies an RREP packet to node ‘‘A’’through the path of minimum routing cost at the same time. Node ‘‘A’’ usually usemulticast to send the RREQ but node ‘‘D’’ replies the RREP packet to ‘‘A’’ byunicast. The node ‘‘A’’ decides the best way to communicate with node ‘‘D’’ basedon the path of minimum routing cost after receiving RREP. Now node ‘‘A’’ sendsdata to node ‘‘D’’ which, in turn, sends a confirmation message
• Cluster-Tree Routing algorithm or HRT (Hierarchical Routing Algorithm):
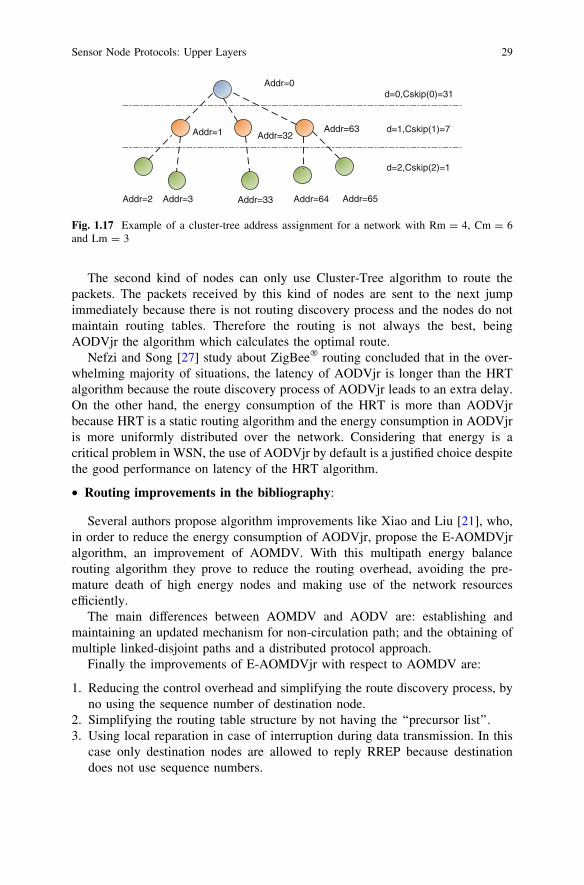
The hierarchical routing algorithm, explained by Xiaohui Li et al. [26], dependson the topology and a distributed addressing scheme of ZigBee� networks, beingonly suitable for tree topologies.
In this algorithm, the coordinator calculates a number of parameters beforethe formation of the network: the maximum number of children of a router(Cm),
26 1 Wireless Sensor Network Technology for Precision Agriculture
the maximum number of child routers of a router(Rm), and the depth of thenetwork(Lm). A child of a router can be a router or an end device, so Cm C Rm.
ZigBee� specifies a distributed address assignment using these parameters tocalculate the nodes’ network addresses. If a device joins a network successfully, itcan obtain a network address from the coordinator or a router. The basic idea of theassignment is that for the coordinator and the routers in every layer, the wholeaddress space is logically partitioned into Rm ? 1 blocks. The first Rm blocks areto be assigned to the router child devices and the last block is reserved for the(Cm - Rm) child end devices. In order to make the assignment easily, a functioncalled Cskip (formula 1) can be computed by Cm, Rm, and Lm. The value of thisfunction is the size of the address sub-block being distributed by each parent at thatdepth to its router child devices for a given network depth d.
CskipðdÞ ¼(
1þ CmðLm� d � 1Þ; if Rm ¼ 11þCm�Rm�Cm x RmLm�d�1
1�Rm ; otherwiseð1:1Þ
N ¼(
D; if D [ Aþ Rm x CskipðdÞAþ 1þ floor D�ðAþ1Þ
CskipðdÞ
� �; otherwise
ð1:2Þ
Broadcast RREQ
D
A
D
A
RREP from targetD
A
Confirmed packet
Fig. 1.16 AODVjr searchingrouting
Sensor Node Protocols: Upper Layers 27
The address assignment algorithm is as follows (shown in Fig. 1.17):
Input: Cm,Rm, Lm, dOutput: A is the node’s address
if d = 0 then
A = 0;else if 0 \ d B Lm then
if the child is a router then
if the router is the first served then
A = its parent address ? 1;Else
A = previous router child device address+Cskip(d-1);
endelse
A = An;end
When ZigBee� adopted the hierarchical routing algorithm and a device called‘‘X’’ with address ‘‘A’’ and depth ‘‘d’’ received a packet, the device extracted thedestination address called ‘‘D’’. The routing procedure of the packet is described as:
Input: A,D, dOutput: N is the next hop address
if D = A then
the upper layer of X processes the packet;else
if D in interval (A,A + Cskip(d - 1) then
N computed by formula 2;Else
N=the parent’s address;end
end
ZigBee� Default routing strategy:
Applications based on ZigBee� stack often adopt the default routing strategy. Ituses AODVjr by default and the hierarchical routing algorithm as last resort in theNWK layer. Generally, the nodes can be divided into two categories: nodes thathave enough storage space and capacity to carry out AODVjr protocol and nodeswith limited storage space which does not have this capacity.
28 1 Wireless Sensor Network Technology for Precision Agriculture
The second kind of nodes can only use Cluster-Tree algorithm to route thepackets. The packets received by this kind of nodes are sent to the next jumpimmediately because there is not routing discovery process and the nodes do notmaintain routing tables. Therefore the routing is not always the best, beingAODVjr the algorithm which calculates the optimal route.
Nefzi and Song [27] study about ZigBee� routing concluded that in the over-whelming majority of situations, the latency of AODVjr is longer than the HRTalgorithm because the route discovery process of AODVjr leads to an extra delay.On the other hand, the energy consumption of the HRT is more than AODVjrbecause HRT is a static routing algorithm and the energy consumption in AODVjris more uniformly distributed over the network. Considering that energy is acritical problem in WSN, the use of AODVjr by default is a justified choice despitethe good performance on latency of the HRT algorithm.
• Routing improvements in the bibliography:
Several authors propose algorithm improvements like Xiao and Liu [21], who,in order to reduce the energy consumption of AODVjr, propose the E-AOMDVjralgorithm, an improvement of AOMDV. With this multipath energy balancerouting algorithm they prove to reduce the routing overhead, avoiding the pre-mature death of high energy nodes and making use of the network resourcesefficiently.
The main differences between AOMDV and AODV are: establishing andmaintaining an updated mechanism for non-circulation path; and the obtaining ofmultiple linked-disjoint paths and a distributed protocol approach.
Finally the improvements of E-AOMDVjr with respect to AOMDV are:
1. Reducing the control overhead and simplifying the route discovery process, byno using the sequence number of destination node.
2. Simplifying the routing table structure by not having the ‘‘precursor list’’.3. Using local reparation in case of interruption during data transmission. In this
case only destination nodes are allowed to reply RREP because destinationdoes not use sequence numbers.
Addr=0d=0,Cskip(0)=31
Addr=1 Addr=32Addr=63 d=1,Cskip(1)=7
d=2,Cskip(2)=1
Addr=2 Addr=3 Addr=33 Addr=64 Addr=65
Fig. 1.17 Example of a cluster-tree address assignment for a network with Rm = 4, Cm = 6and Lm = 3
Sensor Node Protocols: Upper Layers 29
4. Not sending HELLO packets periodically (as done in AOMDV), instead, theyupdate neighbor node list only according to the received packet or the infor-mation from MAC layer, thus saving part of control overhead.
Furthermore, an energy balance algorithm is adopted to reduce the possibilitiesthat some key nodes or low energy nodes to die during information transmitting,which could cause some paths to be out of date or even the whole network to stopworking.
ZigBee� Application Layer
Description
The ZigBee� application layer, as explained in its specification [24], consistsof several components like the APS (application support sub-layer), the ZDO(ZigBee� device objects, containing the ZDO management plane), and themanufacturer defined application objects, hosting by the Application Framework(see Fig. 1.14).4">1.14).
• Application Support Sub-Layer
The application support sub-layer (APS) provides an interface between thenetwork layer (NWK) and the application layer (APL) through a general set ofservices that are used by both the ZDO and the manufacturer-defined applicationobjects. The services are provided by two entities:
1. The APS data entity (APSDE) through the APSDE service access point(APSDE-SAP): provides the data transmission service between two or moreapplication entities located on the same network.
2. The APS management entity (APSME) through the APSME service accesspoint (APSME-SAP): provides a variety of services to application objectsincluding security services and binding of devices. It also maintains a databaseof managed objects, known as the APS information base (AIB).
• Application Framework
The application framework in ZigBee� is the environment in which applicationobjects are hosted on ZigBee� devices. Up to 240 distinct application objects can bedefined, each identified by an endpoint address from 1 to 240. Two additional end-points are defined for APSDE-SAP usage: endpoint 0 is reserved for the data interfaceto the ZDO, and endpoint 255 is reserved for the data interface function to broadcastdata to all application objects. Endpoints 241–254 are reserved for future use.
• Application profiles: Application profiles are agreements for messages, messageformats, and processing actions that enable developers to create an interopera-ble, distributed application. These application profiles enable applications tosend commands, request data, and process commands and requests.
30 1 Wireless Sensor Network Technology for Precision Agriculture
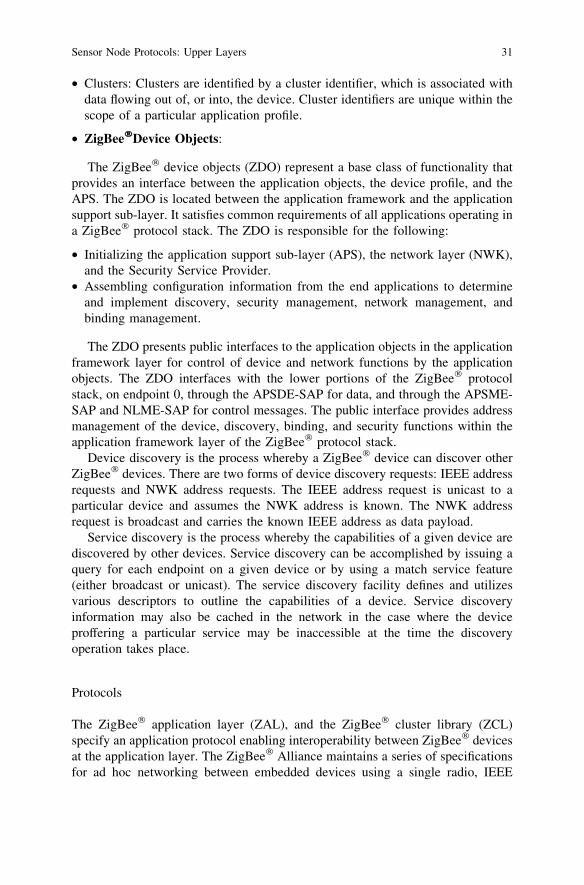
• Clusters: Clusters are identified by a cluster identifier, which is associated withdata flowing out of, or into, the device. Cluster identifiers are unique within thescope of a particular application profile.
• ZigBee�Device Objects:
The ZigBee� device objects (ZDO) represent a base class of functionality thatprovides an interface between the application objects, the device profile, and theAPS. The ZDO is located between the application framework and the applicationsupport sub-layer. It satisfies common requirements of all applications operating ina ZigBee� protocol stack. The ZDO is responsible for the following:
• Initializing the application support sub-layer (APS), the network layer (NWK),and the Security Service Provider.
• Assembling configuration information from the end applications to determineand implement discovery, security management, network management, andbinding management.
The ZDO presents public interfaces to the application objects in the applicationframework layer for control of device and network functions by the applicationobjects. The ZDO interfaces with the lower portions of the ZigBee� protocolstack, on endpoint 0, through the APSDE-SAP for data, and through the APSME-SAP and NLME-SAP for control messages. The public interface provides addressmanagement of the device, discovery, binding, and security functions within theapplication framework layer of the ZigBee� protocol stack.
Device discovery is the process whereby a ZigBee� device can discover otherZigBee� devices. There are two forms of device discovery requests: IEEE addressrequests and NWK address requests. The IEEE address request is unicast to aparticular device and assumes the NWK address is known. The NWK addressrequest is broadcast and carries the known IEEE address as data payload.
Service discovery is the process whereby the capabilities of a given device arediscovered by other devices. Service discovery can be accomplished by issuing aquery for each endpoint on a given device or by using a match service feature(either broadcast or unicast). The service discovery facility defines and utilizesvarious descriptors to outline the capabilities of a device. Service discoveryinformation may also be cached in the network in the case where the deviceproffering a particular service may be inaccessible at the time the discoveryoperation takes place.
Protocols
The ZigBee� application layer (ZAL), and the ZigBee� cluster library (ZCL)specify an application protocol enabling interoperability between ZigBee� devicesat the application layer. The ZigBee� Alliance maintains a series of specificationsfor ad hoc networking between embedded devices using a single radio, IEEE
Sensor Node Protocols: Upper Layers 31
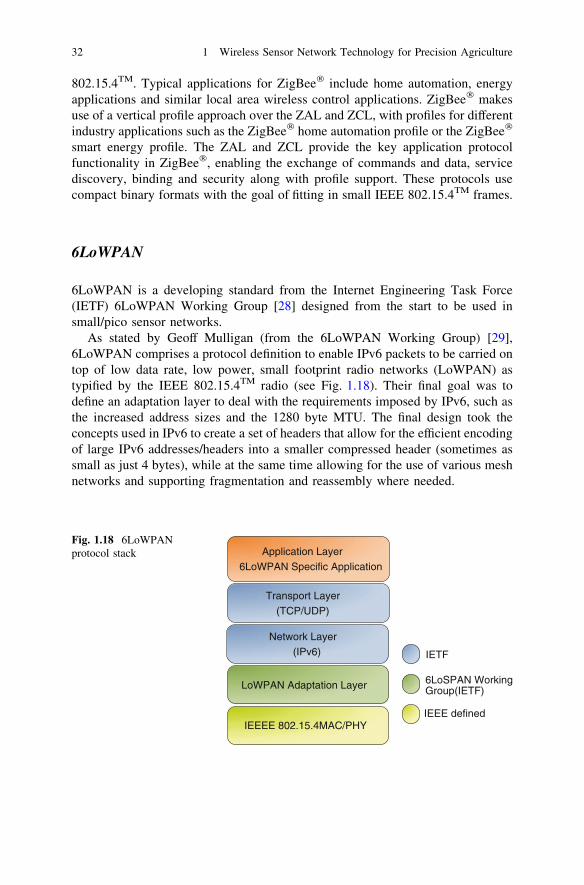
802.15.4TM. Typical applications for ZigBee� include home automation, energyapplications and similar local area wireless control applications. ZigBee� makesuse of a vertical profile approach over the ZAL and ZCL, with profiles for differentindustry applications such as the ZigBee� home automation profile or the ZigBee�
smart energy profile. The ZAL and ZCL provide the key application protocolfunctionality in ZigBee�, enabling the exchange of commands and data, servicediscovery, binding and security along with profile support. These protocols usecompact binary formats with the goal of fitting in small IEEE 802.15.4TM frames.
6LoWPAN
6LoWPAN is a developing standard from the Internet Engineering Task Force(IETF) 6LoWPAN Working Group [28] designed from the start to be used insmall/pico sensor networks.
As stated by Geoff Mulligan (from the 6LoWPAN Working Group) [29],6LoWPAN comprises a protocol definition to enable IPv6 packets to be carried ontop of low data rate, low power, small footprint radio networks (LoWPAN) astypified by the IEEE 802.15.4TM radio (see Fig. 1.18). Their final goal was todefine an adaptation layer to deal with the requirements imposed by IPv6, such asthe increased address sizes and the 1280 byte MTU. The final design took theconcepts used in IPv6 to create a set of headers that allow for the efficient encodingof large IPv6 addresses/headers into a smaller compressed header (sometimes assmall as just 4 bytes), while at the same time allowing for the use of various meshnetworks and supporting fragmentation and reassembly where needed.
IEEEE 802.15.4MAC/PHY
LoWPAN Adaptation Layer
Network Layer(IPv6)
Transport Layer(TCP/UDP)
Application Layer6LoWPAN Specific Application
IETF
6LoSPAN WorkingGroup(IETF)
IEEE defined
Fig. 1.18 6LoWPANprotocol stack
32 1 Wireless Sensor Network Technology for Precision Agriculture
6LoWPAN Network Layer
Description
6LoWPAN incorporates a new layer between IPv6 network layer and 802.15.4TM
MAC layer, called Adaptation Layer, whose main tasks are header compression,packet fragmentation, and layer two forwarding.
An IPv6 packet is too big regarding to the Maximum Transmission Unit (MTU)size of 802.15.4TM standard thus it has to be fragmented. Breaking up a big packetto number of small fragments and attaching new headers to each fragment mayaffect the energy level.
The Adaptation Layer must be provided to comply with the IPv6 requirementsof a minimum MTU. However, it is expected that most applications of IEEE802.15.4TM will not use such large packets, and small application payloads inconjunction with the proper header compression will produce packets that fitwithin a single IEEE 802.15.4TM frame.
As observed in the RFC 4944 [18], the reason of this adaptation layer is not justfor IPv6 compliance, as it is quite likely that the packet sizes produced by certainapplication exchanges (e.g., configuration or provisioning) may require a smallnumber of fragments.
Rather than defining a single monolithic header, as was done for IPv4 andZigBee�, the working group [29] decided to use the same techniques that are usedin IPv6 (stacked headers). Therefore, if a device is sending short packets directly toanother node, it does not need to use header fields for mesh networking or frag-mentation, it only requires sending the minimum encoding headers.
There are currently four basic header types defined in the standard:
• Dispatch Header (1 byte): define the type of header to follow• Mesh Header (4 bytes) is used to standardize how to encode the hop limit and
the link layer source and destination of the packet. Since 802.15.4TM allows forthe use of 16 bit short addresses in addition to the standard 64 bit addresses, theMesh Header includes two single bit fields to indicate if the originating or finaladdress is a short or long address.
• Fragmentation Header (4 bytes for the first fragment and 5 bytes for sub-sequent fragments) supports the fragmentation and reassembly of payloadslarger than the size of the 802.15.4TM frame (102 bytes of payload) and includesfields to specify the size of the original datagram as well as a sequence numberfor ordering the received packets. Even though for most sensor networks theapplication would be aware of the underlying link layer frame size limitation, inorder to be compatible with the IPv6 specification the protocol was required tobe able to support a minimum MTU of 1280 bytes. Therefore it was necessary toinclude a fragmentation and reassembly mechanism.
• HC1 Header (IPv6 Header Compression Header) This HC1 header allows forthe stateless header compression of the IPv6 header. To accomplish this goal theprotocol uses a combination of the following facts:
Sensor Node Protocols: Upper Layers 33
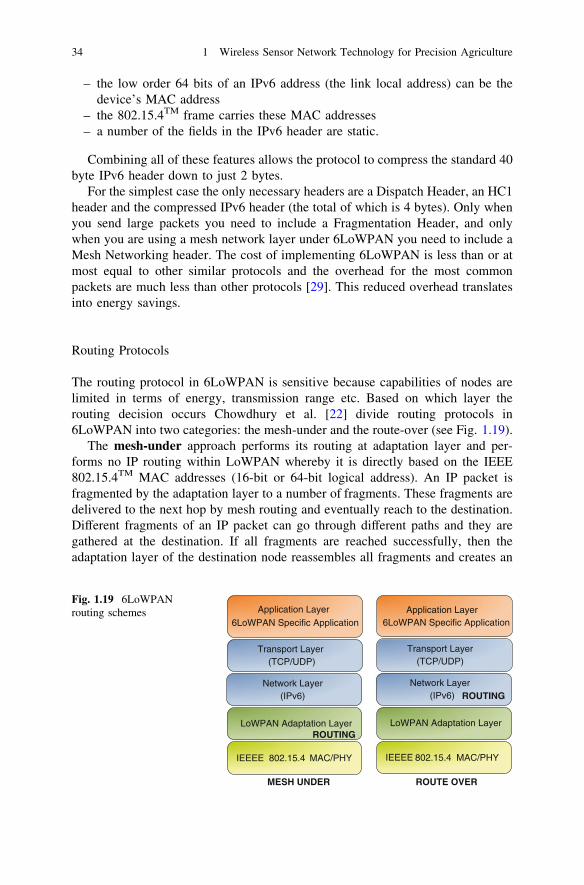
– the low order 64 bits of an IPv6 address (the link local address) can be thedevice’s MAC address
– the 802.15.4TM frame carries these MAC addresses– a number of the fields in the IPv6 header are static.
Combining all of these features allows the protocol to compress the standard 40byte IPv6 header down to just 2 bytes.
For the simplest case the only necessary headers are a Dispatch Header, an HC1header and the compressed IPv6 header (the total of which is 4 bytes). Only whenyou send large packets you need to include a Fragmentation Header, and onlywhen you are using a mesh network layer under 6LoWPAN you need to include aMesh Networking header. The cost of implementing 6LoWPAN is less than or atmost equal to other similar protocols and the overhead for the most commonpackets are much less than other protocols [29]. This reduced overhead translatesinto energy savings.
Routing Protocols
The routing protocol in 6LoWPAN is sensitive because capabilities of nodes arelimited in terms of energy, transmission range etc. Based on which layer therouting decision occurs Chowdhury et al. [22] divide routing protocols in6LoWPAN into two categories: the mesh-under and the route-over (see Fig. 1.19).
The mesh-under approach performs its routing at adaptation layer and per-forms no IP routing within LoWPAN whereby it is directly based on the IEEE802.15.4TM MAC addresses (16-bit or 64-bit logical address). An IP packet isfragmented by the adaptation layer to a number of fragments. These fragments aredelivered to the next hop by mesh routing and eventually reach to the destination.Different fragments of an IP packet can go through different paths and they aregathered at the destination. If all fragments are reached successfully, then theadaptation layer of the destination node reassembles all fragments and creates an
IEEEE 802.15.4 MAC/PHY
LoWPAN Adaptation Layer
Network Layer (IPv6)
Transport Layer (TCP/UDP)
Application Layer6LoWPAN Specific Application
IEEEE 802.15.4 MAC/PHY
LoWPAN Adaptation Layer
Network Layer (IPv6)
Transport Layer (TCP/UDP)
Application Layer6LoWPAN Specific Application
ROUTING
ROUTING
MESH UNDER ROUTE OVER
Fig. 1.19 6LoWPANrouting schemes
34 1 Wireless Sensor Network Technology for Precision Agriculture
IP packet. In case of any fragment missing in the forwarding process the entire IPpacket i.e. all fragments for this IP packet are retransmitted to the destination forrecovery.
On the other hand, the route-over approach performs its routing at networklayer and performs IP routing with each node serving as an IP router. The globallyunique IP address of each node is created automatically by appending its interfaceidentifier (either 16 bits or 64 bits) to the IPv6 prefix that received via routeradvertisement (RA). This is known as stateless auto-configuration method which isone of the 6LoWPAN features. For routing and forwarding processes the networklayer takes decision using the additional encapsulated IP header. The adaptationlayer of 6LoWPAN establishes a direct mapping between the frame and the IPheaders. When an IP packet is fragmented by the adaptation layer, fragments aresent to the next hop based on the routing table information. The adaptation layer ofthe next hop checks received fragments. If all fragments are received successfully,the adaptation layer creates an IP packet from fragments and sends it to thenetwork layer. If the packet is destined for itself, the network layer sends the IPpacket to the transport layer, otherwise forwards the packet to the next hop basedon the routing table information. If there are one or more fragments missing, thenall fragments are retransmitted to one hop distance. After receiving all fragmentssuccessfully the adaptation layer creates an IP packet from these fragments andpasses it to the network layer. The network layer then forwards or processes the IPpacket based on the destination of the packet and the routing table information.
Chowdhury et al. analysis [22] over the probabilistic model of route-over andmesh-under routing schemes, concluded that route-over scheme is more reliableto deliver fragments from the source to the destination than mesh-under scheme.Furthermore, adopting selective retransmission in both route-over and mesh-underschemes resulted in route-over scheme to perform better than mesh-under schemein terms of the total number of transmission. However, in case of total delay,mesh-under scheme performed better than route-over scheme.
Gee Keng Ee et al. [14] reviewed and compare some of the options for routingprotocols in 6LoWPAN environments; the pool of routing schemes in this case isvery limited due to the constrained resources of 6LowPAN devices. Some of theseprotocols are:
• LOAD (6LoWPAN Ad-Hoc On-demand Distance Vector Routing): it is asimplified on-demand routing protocol based on AODV. It is defined to beoperating on top of the adaptation layer instead of the transport layer. It creates amesh network topology underneath and without the knowledge of IPv6. IPv6sees a 6LoWPAN as a single link. One of the differences with AODV is that itdoes not use destination sequence number, for ensure loop freedom, only des-tination generates RREP. The attributes to make a route preferable are: havingthe minimum number of weak links along the way, i.e., links whose LQI (LinkQuality Indication) is worse than a certain threshold value, and also the mini-mum number of hops from source to destination. Another difference to AODV isthe use of LLN (Link Layer Notification) instead of Hello messages.
Sensor Node Protocols: Upper Layers 35
• DYMO-low (Dynamic MANET On-demand for 6LoWPAN Routing): DYMOprotocol is also based in AODV but unlike it, the DYMO protocol does not uselocal repair although it uses Hello messages to keep track of the link connec-tivity. DYMO is positioned on top of IP, using User Datagram Protocol (UDP)as the underlying protocol. However, it cannot be directly applied in 6LoWPANrouting due to its increased memory and power consumption. Thus, DYMO-lowwas proposed to suit DYMO into the 6LoWPAN environment. Instead of usingthe IP layer, DYMO-low operates on the link layer directly to create a meshnetwork topology of 6LoWPAN devices without the knowledge of IP, such thatIP sees the WPAN as a single link. All the 6LoWPAN devices on that WPANare on the same IPv6 link, sharing the same IPv6 prefix. DYMO-low uses 16-bitlink layer short address or IEEE 64-bit extended address (EUI-64). All of thefeatures that discussed in LOAD above are used in DYMO-low except that ituses 16-bits sequence numbers to ensure loop freedom. Besides that, LOAD’slocal repair and route cost accumulation are no used in DYMO-low, but it doesuse 16-bit destination sequence number.
• HiLow (Hierarchical routing): it is proposed for 6LoWPAN to increase thenetwork scalability. Unlike AODV and LOAD that use IEEE 64-bit identifier,HiLow use 16-bit unique short address as interface identifier for memory savingand larger scalability. In HiLow, when an IEEE 802.15.4TM device (or child)wants to join a 6LoWPAN, it first tries to discover an existing 6LoWPAN byscanning procedures. If there is no 6LoWPAN in its personal operating space(POS), the child device becomes the initiator (or coordinator) of a new6LoWPAN and assigns its short address by 0. Otherwise, the child device canfind an existing neighbor device (or parent) of the existing 6LoWPAN and triesto associate with the parent at the MAC layer to receive a 16-bit short address.Every child node receives a short address by the following equation:
Achild ¼ Cm � Aparent þ N ð0 \ N£MCÞ
In the equation, Achild is the child node address, Cm is the maximum number ofchildren a parent can have, Aparent is the address of the parent, and N is the nthchild node.
For the routing operation, in HiLow, it is assumed that every node knows itsown depth. When a node receives an IPv6 packet, it is called the current node. Thecurrent node determines first whether it is either the ascendant or descendant nodesof the destination by using the given equation. After that, the current nodedetermines the next hop node to forward the packet by using the algorithm in [13].However, when there is a link break in a route, HiLow does not support anyrecovery path mechanism like AODV and LOAD does.
Each routing protocol (compared Table 1.8 has its own advantages dependingon the application it involves. There are some tradeoffs in the respective routingprotocols such as routing protocol that uses Hello message may give a morereliable but higher delay in the packet routing. Although HiLow gives an advan-tage of memory saving to provide a larger scalability, its convergence to network
36 1 Wireless Sensor Network Technology for Precision Agriculture
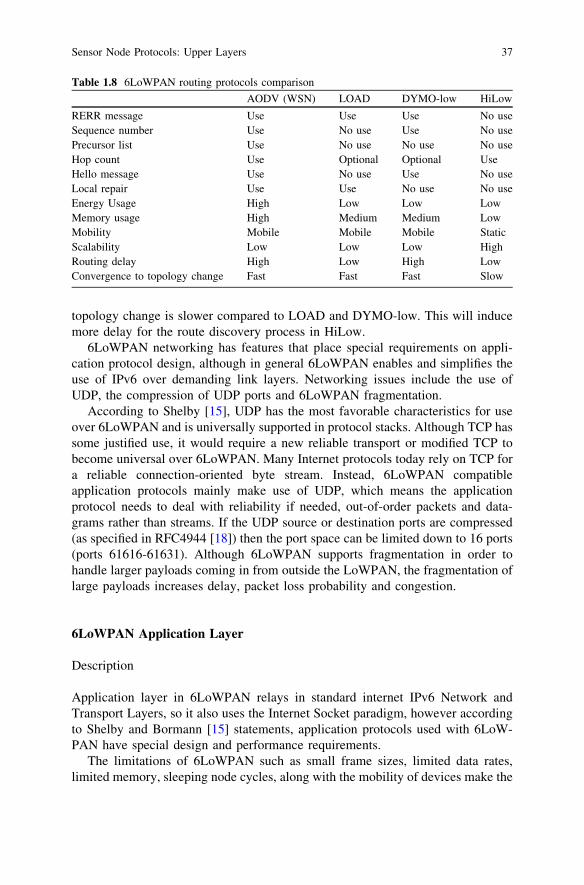
topology change is slower compared to LOAD and DYMO-low. This will inducemore delay for the route discovery process in HiLow.
6LoWPAN networking has features that place special requirements on appli-cation protocol design, although in general 6LoWPAN enables and simplifies theuse of IPv6 over demanding link layers. Networking issues include the use ofUDP, the compression of UDP ports and 6LoWPAN fragmentation.
According to Shelby [15], UDP has the most favorable characteristics for useover 6LoWPAN and is universally supported in protocol stacks. Although TCP hassome justified use, it would require a new reliable transport or modified TCP tobecome universal over 6LoWPAN. Many Internet protocols today rely on TCP fora reliable connection-oriented byte stream. Instead, 6LoWPAN compatibleapplication protocols mainly make use of UDP, which means the applicationprotocol needs to deal with reliability if needed, out-of-order packets and data-grams rather than streams. If the UDP source or destination ports are compressed(as specified in RFC4944 [18]) then the port space can be limited down to 16 ports(ports 61616-61631). Although 6LoWPAN supports fragmentation in order tohandle larger payloads coming in from outside the LoWPAN, the fragmentation oflarge payloads increases delay, packet loss probability and congestion.
6LoWPAN Application Layer
Description
Application layer in 6LoWPAN relays in standard internet IPv6 Network andTransport Layers, so it also uses the Internet Socket paradigm, however accordingto Shelby and Bormann [15] statements, application protocols used with 6LoW-PAN have special design and performance requirements.
The limitations of 6LoWPAN such as small frame sizes, limited data rates,limited memory, sleeping node cycles, along with the mobility of devices make the
Table 1.8 6LoWPAN routing protocols comparison
AODV (WSN) LOAD DYMO-low HiLow
RERR message Use Use Use No useSequence number Use No use Use No usePrecursor list Use No use No use No useHop count Use Optional Optional UseHello message Use No use Use No useLocal repair Use Use No use No useEnergy Usage High Low Low LowMemory usage High Medium Medium LowMobility Mobile Mobile Mobile StaticScalability Low Low Low HighRouting delay High Low High LowConvergence to topology change Fast Fast Fast Slow
Sensor Node Protocols: Upper Layers 37
design of new application protocols and the adaptation of existing ones difficult.Furthermore, the autonomous nature of simple embedded devices makes auto-configuration, security and manageability the most important issues.
Application protocols used over 6LoWPAN need to take a number ofrequirements into account which are typically not an issue over general IP net-works. These issues include:
Link layer: asymmetrical links prone to loose packages, typical payload sizesof 70–100 bytes, limited bandwidth, and no native multicast support.
Networking: the use of UDP, limited compressed UDP port space and per-formance issues regarding the use of fragmentation.
Host issues: unlike typical Internet hosts, 6LoWPAN hosts and networks areoften mobile in nature during operation. Furthermore, battery-powered nodes usesleep periods with duty cycles often between 1–5 percent. A node may be iden-tified in many ways, e.g., using its EUI-64, its IPv6 address or by a domain name,which should be taken into account.
Compression: header and payload compression to be used on existing proto-cols, and where to apply this compression, end-to-end or by an intermediate proxy.
Security: 6LoWPAN makes use of link-layer encryption which protects asingle hop. Intermediate nodes are susceptible to attack, requiring sensitiveapplication to employ end-to-end application level security. Edge routers need toimplement firewalls in order to control the flow of application protocols in and outof LoWPANs.
Protocols
Shelby and Bormann also analyze in [15] protocols that are commonly used orhave potential for use over 6LoWPAN.
1. Web service protocols
It is expected that 6LoWPAN will be integrated into the web service archi-tecture, but the use of XML, HTTP and TCP makes the adaptation of web serviceschallenging for LoWPAN nodes and networks.
All web services have the same basic problems for 6LoWPAN use. XML istypically too large for marking up content in the payload space available, HTTPheaders have high overhead and are difficult to parse, and finally TCP has limi-tations of its own. There are two fundamental ways to integrate 6LoWPAN into aweb service architecture: using a gateway approach or a compression approach.
• Gateway approach: A web service gateway is implemented at the edge ofthe LoWPAN, often on a local server or the edge router. The gateway makes thecontent and control of the devices available through a web service interface. Inthis approach web services actually end at the gateway. A proprietary or6LoWPAN-specific protocol is needed between nodes and the gateway. Anotherdisadvantage of this approach is that the gateway is dependent on the content of
38 1 Wireless Sensor Network Technology for Precision Agriculture
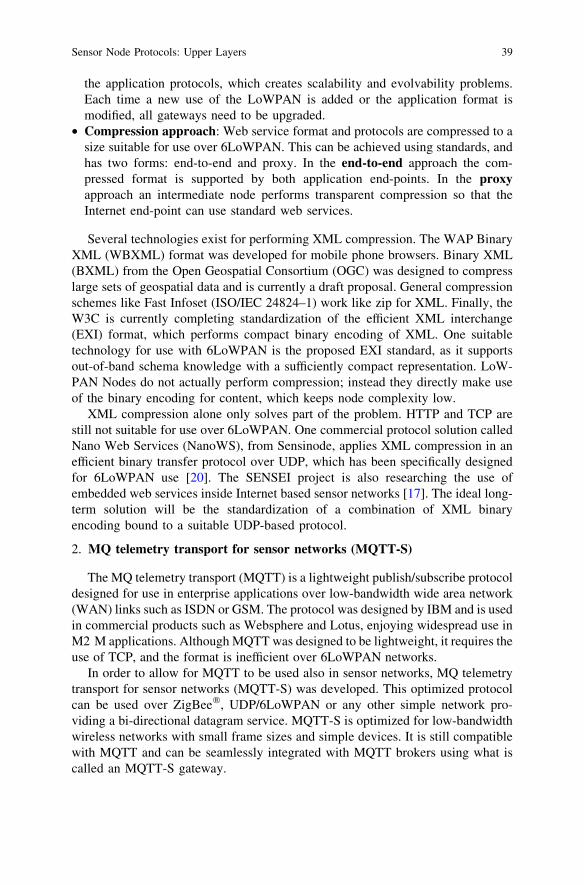
the application protocols, which creates scalability and evolvability problems.Each time a new use of the LoWPAN is added or the application format ismodified, all gateways need to be upgraded.
• Compression approach: Web service format and protocols are compressed to asize suitable for use over 6LoWPAN. This can be achieved using standards, andhas two forms: end-to-end and proxy. In the end-to-end approach the com-pressed format is supported by both application end-points. In the proxyapproach an intermediate node performs transparent compression so that theInternet end-point can use standard web services.
Several technologies exist for performing XML compression. The WAP BinaryXML (WBXML) format was developed for mobile phone browsers. Binary XML(BXML) from the Open Geospatial Consortium (OGC) was designed to compresslarge sets of geospatial data and is currently a draft proposal. General compressionschemes like Fast Infoset (ISO/IEC 24824–1) work like zip for XML. Finally, theW3C is currently completing standardization of the efficient XML interchange(EXI) format, which performs compact binary encoding of XML. One suitabletechnology for use with 6LoWPAN is the proposed EXI standard, as it supportsout-of-band schema knowledge with a sufficiently compact representation. LoW-PAN Nodes do not actually perform compression; instead they directly make useof the binary encoding for content, which keeps node complexity low.
XML compression alone only solves part of the problem. HTTP and TCP arestill not suitable for use over 6LoWPAN. One commercial protocol solution calledNano Web Services (NanoWS), from Sensinode, applies XML compression in anefficient binary transfer protocol over UDP, which has been specifically designedfor 6LoWPAN use [20]. The SENSEI project is also researching the use ofembedded web services inside Internet based sensor networks [17]. The ideal long-term solution will be the standardization of a combination of XML binaryencoding bound to a suitable UDP-based protocol.
2. MQ telemetry transport for sensor networks (MQTT-S)
The MQ telemetry transport (MQTT) is a lightweight publish/subscribe protocoldesigned for use in enterprise applications over low-bandwidth wide area network(WAN) links such as ISDN or GSM. The protocol was designed by IBM and is usedin commercial products such as Websphere and Lotus, enjoying widespread use inM2 M applications. Although MQTT was designed to be lightweight, it requires theuse of TCP, and the format is inefficient over 6LoWPAN networks.
In order to allow for MQTT to be used also in sensor networks, MQ telemetrytransport for sensor networks (MQTT-S) was developed. This optimized protocolcan be used over ZigBee�, UDP/6LoWPAN or any other simple network pro-viding a bi-directional datagram service. MQTT-S is optimized for low-bandwidthwireless networks with small frame sizes and simple devices. It is still compatiblewith MQTT and can be seamlessly integrated with MQTT brokers using what iscalled an MQTT-S gateway.
Sensor Node Protocols: Upper Layers 39
3. ZigBee� compact application protocol (CAP)
The ZigBee� application protocol solution would have benefits used overstandard UDP/IP communications as well, especially over 6LoWPAN, as theZigBee� application protocol has been designed with similar requirements.A solution for using ZigBee� application protocols and profiles over UDP/IP hasbeen proposed in [7], which is an IETF Internet draft. This specification defineshow the ZAL (ZigBee� Application Layer) is mapped to standard UDP/IPprimitives, enabling the use of any ZigBee� profile over 6LoWPAN or standard IPstacks. This adaptation of the ZAL for use with UDP/IP is called the compactapplication protocol (CAP). The function of the ZAL and ZCL (ZigBee� ClusterLibrary) are implemented by the CAP. The data protocol corresponds to theZigBee� cluster library. The management protocol corresponds to the ZigBee�
device profile handling binding and discovery. Finally the security protocolimplements ZigBee� application sublayer (APS) security. Any ZigBee� public orprivate application profile can be implemented over CAP in the same way that itwould use the native ZigBee� ZAL/ZCL. This allows for ZigBee� applicationprofiles to directly be applied to IP networks.
4. Service discovery
Service discovery is used to find which services are offered, what applicationprotocol settings they use, and at what IP address they are located. Typical pro-tocols used for service discovery on embedded devices includes the servicelocation protocol (SLP) described in RFC2608 [30], universal plug-n-play (UPnP)and devices profile for web services (DPWS).
For SLP to be used with 6LoWPAN, it needs optimizations because of the sizeof typical messages. There has been a proposal for a simple service locationprotocol (SSLP) [31], which provides a simple, lightweight protocol for servicediscovery in 6LoWPAN networks by an SSLP translation agent located on an edgerouter, allowing services to be discovered outside the LoWPAN network and viceversa.
5. Simple network management protocol (SNMP)
SNMP is a standard for the management of the network infrastructure anddevices in IP networks. It includes an application protocol, a database schema anddata objects. The current version is SNMPv3 exposes variables to a managementsystem which can be GET or in some cases SET in order to configure or control adevice. The variables exposed by SNMP are organized in hierarchies calledmanagement information bases (MIBs).
The polling approach used by SNMP is the biggest drawback of the approach.Polling approaches do not work for battery-powered LoWPAN nodes which usesleep schedules, and blindly polling for statistics (which may not have changed)creates unnecessary overhead. An event-based approach would need to be added toSNMP for applicability to 6LoWPAN management.
40 1 Wireless Sensor Network Technology for Precision Agriculture
The suitability of using SNMPv3 with 6LoWPAN has also been analyzed in[32], which found that optimizations are needed to reduce the packet size andmemory cost. Furthermore a MIB has been specified for 6LoWPAN in [33].
Jen-NET extension to 6LoWPAN
JenNet-IP is an IP-based networking solution enabling the ‘‘Internet of Things’’[16]. It uses an enhanced 6LoWPAN network layer based in IEEE 802.15.4TM
wireless networking, with a ‘‘mesh-under’’ approach, offering a self-healing, self-forming, scalable and robust networking layer. It is an implementation optimizedto the Jennic JN5148 wireless microcontroller.
JenNet-IP is architectured to support the requirements of low-power, low-costwireless devices for a wide range of applications. Using open standard componentssuch as IEEE802.15.4TM MAC and PHY, 6LoWPAN, IP and UDP it enablesdevelopers to work with readily understood technologies.
The Jennic 6LoWPAN software includes [34]:
• C APIs (Application Programming Interfaces) to provide easy access to thelayers of the 6LoWPAN software stack from the user application
• The required stack software to implement a 6LoWPAN system• Jennic’s proprietary JenNet wireless network protocol which is used on top of
IEEE 802.15.4TM
Application development tools are also provided as part of the Jennic SoftwareDeveloper’s Kit (SDK)
Features of Jennic 6LoWPAN software include:
• Support for wireless Star and Tree networks using JenNet (with IEEE802.15.4TM)
• Socket formation and data transfer services via an IPv6 UDP socket interface• Packet fragmentation and re-assembly (when an IP packet is too large, it must be
broken up and transported in multiple IEEE 802.15.4TM frames)• IP level translation between 6LoWPAN wireless network and the Ethernet, via a
wired-wireless router (Border-Router)
But it does not currently support broadcast/multicast addressing.The Jennic 6LoWPAN software provides a complete package of the necessary
components to easily and efficiently develop wireless IP network solutions.
Data Management and Storage Architectures
According to the classification made by Li et al. [35] there are several strategiesfor the storage of the measured data by the nodes of a wireless sensor network.
Sensor Node Protocols: Upper Layers 41
• Centralized storage: one of the simplest strategies. Each node transmits thecollected data to a base station where it is stored for the user to request it. Withthis model, the inquiries for data proceeds directly to the base station withefficiency and low time-delay, as long as we can provide unrestricted energy andenough storage space to the centralized repository. But on the other hand datatransmission from all the nodes to the base station means a lot of energy con-sumption and increases the risk of base station neighbors to become a bottleneckin a large scale network.
• Local storage: the data is stored in the internal memory of the nodes so theaccess requests must be routed to all nodes to obtain the measures. The con-sumption of energy in the nodes is very low, but the space limitation of thenodes causes data volatility (only the latest data is stored). Furthermore, therequest broadcast to gather all the data from each node wastes a lot of energyand results in high delays and inefficiencies.
• Distributed storage: is a data-centric strategy. The measures data is not storedin local but in other nodes using distributed technology. Data storage andaccess is coordinated by an effective information mechanism, taking care of dataaccess requirements. This strategy suits the distributed characteristics of wire-less sensor network, but need intermediary information that means extraresources consumption.
Attending to the cost comparison between access and storage (computationalcost could be neglected compared to communication cost), centralized storage hasan access cost near to zero while the data storage cost is proportional to theproduction rate of data. Similarly, the storage cost of local storage is nearly zeroand the access cost is proportional to the query frequency of data. In those caseswhere query frequency is significantly greater than production frequency, cen-tralized storage would be the appropriated strategy while local storage would bepreferable the other way round.
Distributed storage is consistent with the distributed characteristics of wirelesssensor network but there are still some random and dynamic characteristics, inwireless sensor network, which limit the application scope of the distributedstorage.
Regarding the query-processing methods in wireless sensor networks, Li et al.[35] identify two of them: centralized method and net-in processing method. Inthe centralized one, all the queries processing is completed in the base station,while on the net-in processing, it is extended from the base station to the sensornodes. Compared to the centralized method, net-in processing method is limited byresources and, in addition, the distributed computing increases processing diffi-culty, making centralized processing the preferable option.
When designing a data storage management system, there is no need to concernabout which kind of routing protocol the network uses, but the data storagestrategy will be affected by the network architecture and topology (which some-times is intimately related to the routing protocol). Li et al. [35] designed in theirstudies a data management system based on clustering system architecture using
42 1 Wireless Sensor Network Technology for Precision Agriculture
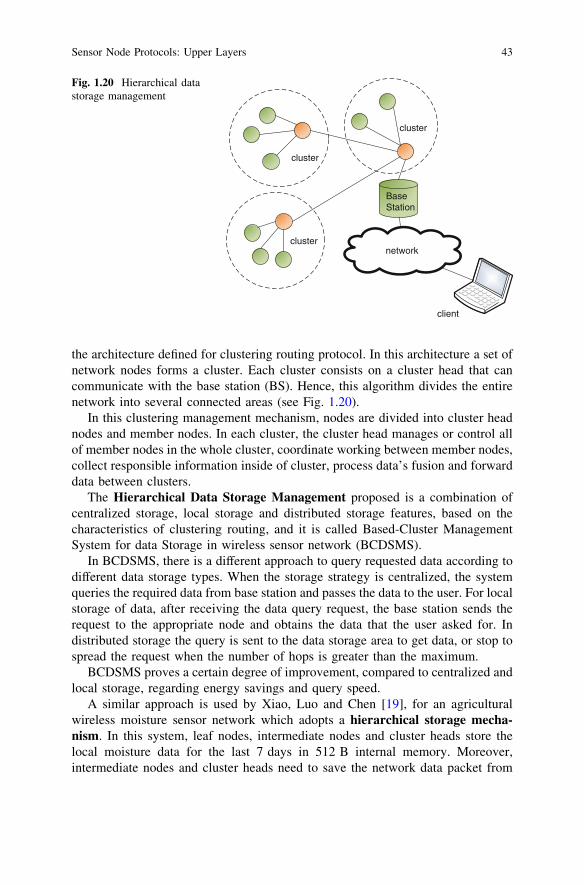
the architecture defined for clustering routing protocol. In this architecture a set ofnetwork nodes forms a cluster. Each cluster consists on a cluster head that cancommunicate with the base station (BS). Hence, this algorithm divides the entirenetwork into several connected areas (see Fig. 1.20).
In this clustering management mechanism, nodes are divided into cluster headnodes and member nodes. In each cluster, the cluster head manages or control allof member nodes in the whole cluster, coordinate working between member nodes,collect responsible information inside of cluster, process data’s fusion and forwarddata between clusters.
The Hierarchical Data Storage Management proposed is a combination ofcentralized storage, local storage and distributed storage features, based on thecharacteristics of clustering routing, and it is called Based-Cluster ManagementSystem for data Storage in wireless sensor network (BCDSMS).
In BCDSMS, there is a different approach to query requested data according todifferent data storage types. When the storage strategy is centralized, the systemqueries the required data from base station and passes the data to the user. For localstorage of data, after receiving the data query request, the base station sends therequest to the appropriate node and obtains the data that the user asked for. Indistributed storage the query is sent to the data storage area to get data, or stop tospread the request when the number of hops is greater than the maximum.
BCDSMS proves a certain degree of improvement, compared to centralized andlocal storage, regarding energy savings and query speed.
A similar approach is used by Xiao, Luo and Chen [19], for an agriculturalwireless moisture sensor network which adopts a hierarchical storage mecha-nism. In this system, leaf nodes, intermediate nodes and cluster heads store thelocal moisture data for the last 7 days in 512 B internal memory. Moreover,intermediate nodes and cluster heads need to save the network data packet from
BaseStation
cluster
cluster
cluster
network
client
Fig. 1.20 Hierarchical datastorage management
Sensor Node Protocols: Upper Layers 43
child nodes during the last period. Repeaters store the network data packet fromcluster heads for the last 15 days in 16 KB internal programmable flash, and basestation stores the moisture data in the growth period of crops such as 4 months alsoin flash memories. Finally data server stores all moisture data for data manage-ment, mining, and analysis and decision support.
Programming and Applications Development
Application characteristics
Embedded wireless nodes usually have a special purpose, therefore most ofapplications developed for wireless sensor networks will be specialized. Embed-ded application uses a protocol stack to configure the network and to send andreceive packets. There are a number of practical issues that should be taken intoaccount when designing an embedded application for these kinds of sensors [15].
Commissioning: In order for commissioning the link-layer used by the stack, itmay be necessary for the application to configure the radio with basic parameterssuch as the radio channel, data rate, MAC mode and security key to enable basicconnectivity with other nodes.
Device role: The node needs to configure the protocol stack for the proper typeof network role, which is either a host, or a router or an edge router.
Addressing: When using the socket API of a protocol stack, the applicationmay make use of full IPv6 addresses or just MAC addresses depending on thedesign. Furthermore, if the use of compressed UDP ports is desired, this requiresrestriction of the port space used by the application.
Mobility: The application may need to deal with some aspects of mobility, forexample when the node moves from one LoWPAN to another, causing the addressof the node to change.
Data reliabilitybIn case of using UDP as a transport protocol, it provides noguarantee of packet delivery order or reliability. The application must use orimplement a protocol that provides sufficient reliability for its purposes.
Security: Security in 6LoWPAN networks is typically supported by the linklayer as in IEEE 802.15.4TM, which provides hop-by-hop encryption. However, ateach router the content of the packet is vulnerable as it is decrypted at each hop.Applications that require tight security should implement end-to-end encryption ofapplication data. Regarding ZigBee�, it provides a standardized toolbox ofsecurity specifications based on a 128-bit AES algorithm and incorporates thestrong security elements of 802.15.4TM. ZigBee� stack profiles define security forthe MAC, network and application layers. Its security services include methods forkey establishment and transport, device management and frame protection.Developers must also decide where to apply security: at the MAC, network orapplication layer. If the application needs the strongest security possible, secure itat the application layer. Security implemented here uses a unique session key that
44 1 Wireless Sensor Network Technology for Precision Agriculture
can only be authenticated and decrypted by another device possessing the key.This approach protects against both internal and external attacks, but it requiresmore memory to implement.
Power limitations: It is common in this kind of sensor networks to have apower limitation in the sensor devices. It would be interesting to consider any kindof deep low power mode in which the sensor could enter periodically. In case ofsolar power sensors it could be useful to consider adjustable operation modes forday and night
Development
Several platforms can be found nowadays to develop and implement wirelesssensor networks (WSN) applications, each of them having its own requirements,execution and programming environments and software tools.
There are two points of view when developing WSN applications, one is theapplication domain expert view (oceanographers, engineers, etc.) and the second isthe network experts. Application developers need to know several network spec-ificities to build programs either by using the low-level abstractions provided bythe sensor OS or directly over the hardware.
Operating Systems (OS) developed specifically for sensor nodes constitute thebackbone of its architecture. Literature on embedded devices reveals the event-based paradigm as the prevailing model, as opposed to the thread-based model [1] .
The event-based model consists of a program which is implemented as a set ofindependent functions or event handlers. Every event handler is triggered as aresponse to one external or internal event (e.g., hardware interruption).
In a thread-based system, the set of actions is performed by execution entitiescalled threads, which allocate its own stack. Therefore, context switching and raceconditions could happen while a thread is running, which means that inter-threadsynchronization and scheduling mechanisms must be provided by the OS.
TinyOS [36] was the first open source OS specifically designed for wirelesssensor devices, developed in the laboratories of the University of Berkeley byPhillip Levis under the supervision of David Culler in 2002. Soon it becomes thede facto standard operating system for writing sensor applications. It is also thetiniest of all existing WSN operating systems (a minimum application can occupyaround 250 bytes of ROM and 16 bytes of RAM of footprint). TinyOS is written innesC, a component-based programming language based on C that allows pro-gramming interfaces and components. Its execution model is event-based and itsprogramming model is component-based.
Among the main disadvantages that TinyOS presents, it is worth mentioning thedifficulty of maintaining or updating the application, since it is statically linked tothe whole kernel.
Sensor Node Protocols: Upper Layers 45
The second version of TinyOS was released in November of 2006, and besidessupporting new hardware platforms, it incorporates multiple improvements overthe earlier versions and combines a thread-programming model with an event-based execution model.
Contiki [37] is a complete operating system designed for memory constrainedsystems, developed in Europe in the Swedish Institute of Computer Science (SICS)by Adam Dunkels as the leader of the project in 2003. It has been written in the Cprogramming language, and allows WSN applications to be written whose typicalsize is around kilobytes (due to the fact that it incorporates new services). It meansa bigger footprint than the applications developed in TinyOS. In spite of this, itcould be considered the second most extended operating system for programmingsensor nodes because it presents some contributions with respect to TinyOS:
• Applications can be more easily updated, due to the fact that Contiki supportsdynamic load of programs on the top of the operating system kernel. In this way,code updates can be remotely downloaded into the network. This feature is oneof the main advantages of Contiki, given that most operating systems generatean inseparable image of the system.
• Unlike most WSN operating systems, which use an event-driven programmingmodel in order to reduce the overhead of the system, Contiki uses very light-weight threads, called protothreads, which can be viewed as blocking eventhandlers.
• It also supports a preemptive multi-thread library in the top of an event-drivenkernel. This library can be included on demand by the application.
However, the most relevant contribution has been the use of protothreads insideContiki.
Karpinski and Cahill [38] grouped the programming models for WSN differentapproaches of the literature in two categories: macroprogramming, where theoperation of the whole network is defined as a single program, and node-centricprogramming, a more traditional approach where the focus is on the behavior of asingle sensor node.
Node-centric programming allows the behavior of individual nodes to bedefined, considering them as a whole. WSN operating systems have been designedto write applications on top of them, using the hardware abstractions provided.Although it is possible to obtain a certain hardware independence, operating-system independence has not been completely achieved.
Macroprogramming or network-level abstractions have the goal to realizeprogramming from a macroscopic viewpoint that every node and data can beaccessed without considering low-level communications among nodes. The termcan be described as follows: ‘‘programming methodologies for sensor networksthat allow the direct specification of aggregate behaviors’’ [1].
46 1 Wireless Sensor Network Technology for Precision Agriculture
Wireless Sensor Networks Solutions for Smart Irrigation
In the previous part of the brief, we have elaborated in detail on various aspects ofthe state-of-the-art WSN solutions including major hardware solutions and mainprotocol stack solutions. However, the specific nature of WSN solutions requiredfor smart irrigation calls for additional considerations. In this section, we brieflyoverview the major problems and solutions related to applications of WSN tech-nology to smart irrigation systems.
Water irrigation is one of the major consumers of freshwater resourcesworldwide with various studies indicating as high as 70–80 % of fresh waterconsumption devoted only to needs of irrigation systems. Given that the worldwidereserves of fresh water are valuable resource of the mankind and are crucial forits sustainability and development, the efficient use of fresh water in irrigationsystems is one of the major problems faced by water management authoritiesnowadays. The need for better and more efficient irrigation systems is furtheraggravated by the rising problem of climate changes and increased unpredictabilityof climate events, increased concentration of pollution due to intensive use ofpesticides and herbicides, and increased agricultural production driven by needs ofglobal population increase.
Introduction of latest technological advances is one of the most promising waysto tackle the problem of irrigation system efficiency. In this sense, WSN tech-nology clearly represents the most promising candidate to significantly improvecurrent irrigation systems. Soil moisture sensors are constantly improving andbecoming less and less expensive and appropriate for massive deployment in WSNapplications [39–40]. In combination with low-cost communication modules insensor motes, the overall costs of WSN solution for smart irrigation application isdriving the possibility for its widespread applications. However, without smartcore of this system: the data analysis and decision support system, the optimal useof WSN technology is not possible. Thus the complete WSN solution for smartirrigation system represents much more than the WSN itself and strongly dependson the complex and interdisciplinary interplay of various research fields.
In general, to deploy effective WSN solution for smart irrigation system, the twomain challenges exist: (1) how to deploy WSN so that it captures relevant data forsmart irrigation system, and (2) how to exploit collected data within properly designeddecision support system [40]. Since this brief is devoted to underlying technologicalenablers, we focus only on the first problem. However, it is important to note that noneof these challenges can be observed independently, and the proper design ofsmart irrigation solution requires collaboration of different phases, from nodedeployment and calibration, over sensor node programming, design of data gatheringphase, data collection and analysis all over to the decision support system design.
There are number of challenges identified towards the goal of deployingeffective WSN solution for smart irrigation applications. These challenges lead toidentification of the set of requirements WSN solution should provide, and onesuch exhaustive list is presented below:
Wireless Sensor Networks Solutions for Smart Irrigation 47
• Sensitivity: WSN output should sensitive, i.e. susceptible to small changes interms of soil moisture or plant demand,
• Responsiveness: WSN should be responsive; it should be able to providecontinuous monitoring and respond rapidly (in real-time) to detected changes inorder to maintain optimal water levels,
• Universality: WSN should be adaptable to different types of crops and differentgrowth stages,
• Robustness: WSN should be robust against failures and serve as a reliablesource of irrigation data,
• Scalability: WSN solution should be scalable and allow for initial smalldeployment and simple further extension towards middle-scale or large-scaledeployments where necessary,
• User-Friendly: WSN interface towards the end-user should be intuitive, easy touse and should not require significant user training. Recent developments insmartphone applications and operative systems should serve as an excellentbasis for user-friendly interface between the end-user and the WSN,
• Actuator Powered: WSN should represent not only sensing but acting solutionas well (WSAN—Wireless Sensor and Actuator Network). WSAN is able todeliver fully automated solution, non-dependable on human labor which isexpensive and potentially unreliable,
• Energy Efficient: Sensor nodes should be either battery-powered or preferable,should use some of the recently emerging energy harvesting solutions,
• Reliable Communication: WSN should provide reliable communicationbetween sensor motes and a mote and the base station for a distances of theorder of 1 km which are relevant in agricultural large-field environment,
• Low-Cost: WSN solution should be inexpensive and cheap to maintain andoperate. Sensor nodes should be easy to deploy and replace.
Apart from WSN solution satisfying above requirements, the complete systemrequires appropriate use of soil humidity sensors suitable for a given application.Measuring soil moisture is typically performed either directly or via so calledwater balance calculations and these two approaches are the most frequent forautomated irrigation applications [41].
The first approach, based on direct soil moisture measurements is the mostcommon approach and may use various types of soil moisture sensors whichmeasure either soil water potential (using so called tensiometers), or soil watercontent (using so called capacitance sensors or sensors based on time-domainreflectometry—TDR sensors). Sensors that measure water content are typicallymore accurate than sensors that measure water potential. Both approaches are veryfrequent in practice as they are easy to deploy and can be sufficiently accurate, thusjustifying availability of a number of commercial solutions based on this type ofsensors. However, any soil moisture sensor technology available today suffersfrom locality of measurements, whereas the real situation around the plant root istypically much more heterogeneous. This drives the need for sensor array thatcould successfully capture the variable soil moisture nature for the price of
48 1 Wireless Sensor Network Technology for Precision Agriculture
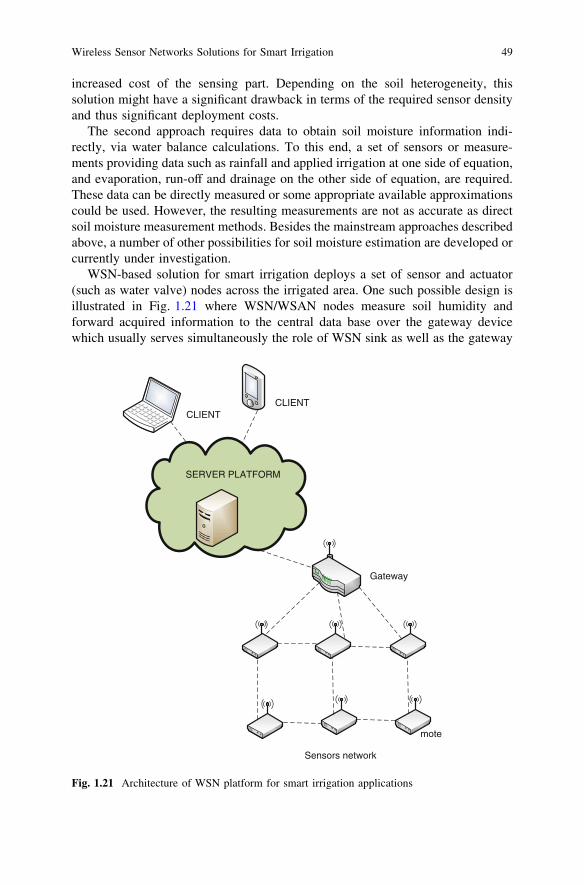
increased cost of the sensing part. Depending on the soil heterogeneity, thissolution might have a significant drawback in terms of the required sensor densityand thus significant deployment costs.
The second approach requires data to obtain soil moisture information indi-rectly, via water balance calculations. To this end, a set of sensors or measure-ments providing data such as rainfall and applied irrigation at one side of equation,and evaporation, run-off and drainage on the other side of equation, are required.These data can be directly measured or some appropriate available approximationscould be used. However, the resulting measurements are not as accurate as directsoil moisture measurement methods. Besides the mainstream approaches describedabove, a number of other possibilities for soil moisture estimation are developed orcurrently under investigation.
WSN-based solution for smart irrigation deploys a set of sensor and actuator(such as water valve) nodes across the irrigated area. One such possible design isillustrated in Fig. 1.21 where WSN/WSAN nodes measure soil humidity andforward acquired information to the central data base over the gateway devicewhich usually serves simultaneously the role of WSN sink as well as the gateway
Sensors network
Gateway
mote
SERVER PLATFORM
CLIENTCLIENT
Fig. 1.21 Architecture of WSN platform for smart irrigation applications
Wireless Sensor Networks Solutions for Smart Irrigation 49
towards the external network, most frequently mobile cellular network enabledpacket services such as GPRS/EDGE. The topology of sensor network is mostfrequently the simplest star/tree topology, although more involved mash config-urations are also possible, as depicted in the figure. Data from sensors are usuallycollected periodically in a push manner, i.e. the sensor node is programmed to sendsensor measurements after expiration of each time period. Usually, the period ofdata acquisition and reporting is controllable by end user and may allow change intime-resolution of measured data. Also, data acquisition period at sensor nodes anddata reporting period may differ, where typically, sensor node send averagedvalues of recent measurements due to the fact that communication costs signifi-cantly exceed sensing and data acquisition costs. Usual sensing period is of theorder of one minute, which can be collected and reported with the same frequencyor averaged to reduce the reporting frequency to periods of the order of duration ofone hour. Clearly, reducing reporting period duration drastically increases batterylife, but affects the time resolution of measurements which calls for carefullyselected reporting period. It is highly desirable to select the operating parametersso as to extend battery life to a time span of at least one year, if not several years.Apart from soil moisture sensors, sensor nodes are typically equipped by a mul-titude of other sensors such as soil conductivity sensors, soil and air temperaturesensors, air humidity sensors, anemometers to include effects of wind on evapo-ration, sunlight intensity sensors, etc.
Although the focus of this brief is on technical issues and capabilities of WSN-based smart irrigation solution, it is important to note that one of the major impacts onthe successful deployment of WSN solution comes from the experts in the field of soilcharacteristics. In other words, the question of adequate temporal and spatial reso-lution of acquired data is not the question to be answered by communication engineersdeploying WSN solution: what they should provide is simple and cheap possibility fordeployment of additional sensor nodes (i.e. scalability feature) and easy re-pro-grammability that would enable quick change in sampling and reporting frequencieseither on all or on individual sensor nodes. On top of this, experts in soil engineeringare required to provide optimal sensor densities, particular sensor locations andtemporal resolution of sensor measurements and reporting. There is no need toemphasize that this task is location-specific and this kind of analysis is required to bedone prior to WSN deployment, during the initial soil analysis procedure.
References
1. María Soledad Escolar Díaz ‘‘A generic software architecture for portable applications inheterogeneous wireless sensor networks’’, Doctoral Thesis 2010, Universidad Carlos III deMadrid. http://e-archivo.uc3m.es/bitstream/10016/9188/1/tesis-SoledadEscolar-Marzo2010.pdf (accessed March 28, 2013).
2. Costis Kompis and Simon Aliwell, Energy Harvesting Technologies to Enable Remoteand Wireless Sensing, http://cmapspublic.ihmc.us/rid=1J3DN487K-21D3XZZ-1597/energyharvesting08.pdf (accessed March 28, 2013).
50 1 Wireless Sensor Network Technology for Precision Agriculture

3. Sizing Solar Energy Harvesters for Wireless Sensor Networks, http://www.rfm.com/products/apnotes/anm1002.pdf (accessed March 28, 2013).
4. I. Stojmenovic (Ed.): ‘‘Handbook of Sensor Networks: Algorithms and Architectures,’’ Wiley,2005.
5. J. A. Gutierrez, E. H. Callaway, R. H. Barret, ‘‘IEEE 802.15.4TM Low-Rate WirelessPersonal Area Networks: Enabling Wireless Sensor Networks,’’ IEEE, 2003.
6. IEEE 802.15.4TM-2003 Standard, 2003.7. IEEE 802.15.4TM-2006 (802.15.4TMb) Standard, 2006.8. IEEE 802.15.4TM-2007 (802.15.4TMa) Standard, 2007.9. IEEE 802.15.4TMc Standard, 2007.
10. IEEE 802.15.4TMd Standard, 2009.11. N. Salman, I. Rasool and A. H. Kemp, ‘‘Overview of the IEEE 802.15.4TM standards family
for Low Rate Wireless Personal Area Networks,’’ IEEE ISWCS 2010, pp. 701-705, York,UK, Sept. 2010.
12. Memsic, http://www.memsic.com/wireless-sensor-networks/ (accessed March 28, 2013).13. K. Kim, S. Yoo, S. Daniel Park, J. Lee, G. Mulligan ‘‘Hierarchical Routing over 6LoWPAN
(HiLow) draft-daniel-6lowpan-hilow-hierarchical-routing-01.txt’’, http://tools.ietf.org/html/draft-daniel-6lowpan-hilow-hierarchical-routing-01 (accessed March 28, 2013).
14. Gee Keng Ee, Chee Kyun Ng, Nor Kamariah Noordin and Borhanuddin Mohd. Ali’’AReview of 6LoWPAN Routing Protocols’’ University Putra Malaysia, 2010
15. Zach Shelby, Carsten Bormann’’6LoWPAN The wireless embedded internet’’ Ed Wiley,2011
16. JenNet-IP wireless networking for the ‘Internet of Things’, http://www.jennic.com/products/protocol_stacks/jennet-ip (accessed March 28, 2013).
17. EU FP7 SENSEI Project. http://www.sensei-project.eu/ (accessed March 28, 2013).18. RFC4944: ‘‘Transmission of IPv6 Packets over IEEE 802.15.4TM Networks’’,2007 https://
datatracker.ietf.org/doc/rfc4944/ (accessed March 28, 2013).19. Kehui Xiao, Xiwen Luo, Deqin Xiao, Jian Chen’’Hierarchical Mechanism of Storage and
Error Control for Wireless Moisture Sensor Network’’, 201120. Sensinode Oy. http://www.sensinode.com/ (accessed March 28, 2013).21. Jun Xiao and Xiaojun Liu ‘‘The Research of E-AOMDVjr Routing Algorithm in ZigBee�
Network’’, 201122. Aminul Haque Chowdhury, Muhammad Ikram, Hyon-Soo Cha, Hassen Redwan, S.M. Saif
Shams, Ki-Hyung Kim, Seung-Wha Yoo ‘‘Route-over vs Mesh-under Routing in6LoWPAN’’ Ajou University (Rep. of Korea) 2009
23. ZigBee� Alliance: http://www.ZigBee�.org/ (accessed March 28, 2013).24. ZigBee� Specification, document 053474r17, 2011, http://people.ece.cornell.edu/land/
courses/ece4760/FinalProjects/s2011/kjb79_ajm232/pmeter/ZigBee�%20Specification.pdf(accessed March 28, 2013).
25. Jianpo Li, Xuning Zhu, Ning Tang, Jisheng Sui. ‘‘Study on ZigBee� Network Architectureand Routing Algorithm’’ 2010
26. Xiaohui Li, Kangling Fang, Jinguang Gu, Liang Zhang ‘‘An Improved ZigBee� RoutingStrategy for Monitoring System’’ 2008
27. Bilel NEFZI Ye-Qiong Song ‘‘Performance Analysis and Improvement of ZigBee� RoutingProtocol’’ Nancy University, LORIA-INPL, 2007
28. 6LoWPAN Working Group: http://tools.ietf.org/wg/6lowpan29. Geoff Mulligan ‘‘The 6LoWPAN Architecture’’ 6LoWPAN Working Group, 200730. RFC2608 http://www.ietf.org/rfc/rfc2608.txt (accessed March 28, 2013).31. Simple Service Location Protocol (SSLP) for 6LoWPAN (draft), http://ebookbrowse.com/
draft-daniel-6lowpan-sslp-00-pdf-d272992854 (accessed March 28, 2013).32. SNMP optimizations for 6LoWPAN (draft), http://ebookbrowse.com/draft-hamid-6lowpan-
snmp-optimizations-03-pdf-d119263899 (accessed March 28, 2013).33. 6LoWPAN Management Information Base (draft), http://tools.ietf.org/html/draft-daniel-
6lowpan-mib-01 (accessed March 28, 2013).
References 51

34. Jennic 6LoWPAN APIs User Guide 2010, http://www.jennic.com/files/support_files/JN-UG-3054-6LoWPAN-APIs-1v1.pdf (accessed March 28, 2013).
35. MA Li, TANG Changmao, WANG Chunlei, XUE Fenye ‘‘A Kind of Hierarchical DataStorage Management System Design for Wireless Sensor Network’’, 2011
36. TinyOs http://www.tinyos.net/ (accessed March 28, 2013).37. Contiki http://www.contiki-os.org (accessed March 28, 2013).38. Marcin Karpin’ski and Vinny Cahill ‘‘High-Level Application Development is Realistic for
Wireless Sensor Networks’’, 200739. L. Ruiz-Garcia, L. Lunadei, P. Barreiro and J. I. Robla: ‘‘A Review of Wireless Sensor
Technologies and Applications in Agriculture and Food Industry: State of the Art and CurrentTrends,’’ Sensors, Vol. 9, pp. 4728-4750, 2009.
40. J. D. Lea-Cox, ‘‘Using Wireless Sensor Networks for Precision Irrigation Scheduling,’’ inProblems, Perspectives and Challenges of Agricultural Water Management, book chapter,InTech Press.
41. Vellidis, G., V. Garrick, S. Pocknee, C. Perry, C. Kvien, M. Tucker, ‘‘How wireless willchange agriculture,’’ Stafford, J.V. (Ed.), Precision Agriculture ‘07 – Proceedings of the SixthEuropean Conference on Precision Agriculture (6ECPA), Skiathos, Greece, pp. 57-67, 2007.
52 1 Wireless Sensor Network Technology for Precision Agriculture
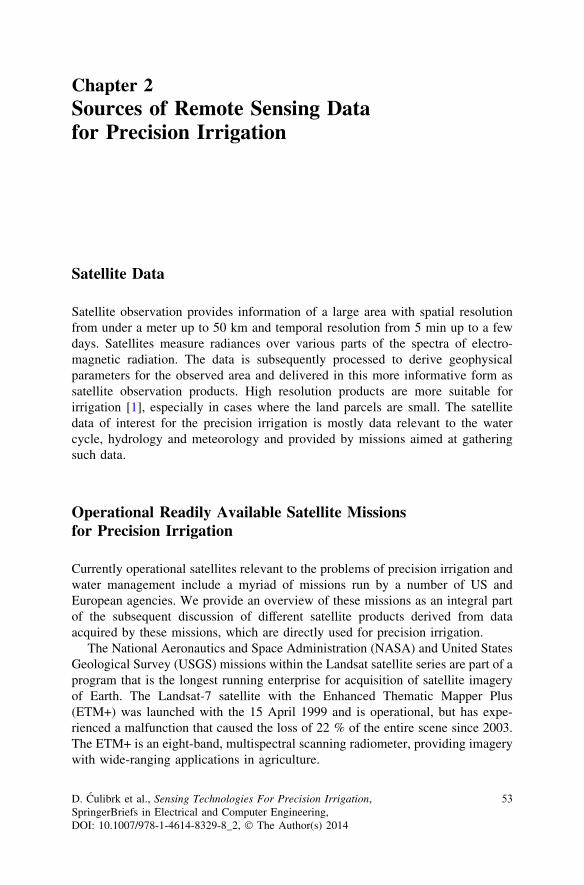
Chapter 2Sources of Remote Sensing Datafor Precision Irrigation
Satellite Data
Satellite observation provides information of a large area with spatial resolutionfrom under a meter up to 50 km and temporal resolution from 5 min up to a fewdays. Satellites measure radiances over various parts of the spectra of electro-magnetic radiation. The data is subsequently processed to derive geophysicalparameters for the observed area and delivered in this more informative form assatellite observation products. High resolution products are more suitable forirrigation [1], especially in cases where the land parcels are small. The satellitedata of interest for the precision irrigation is mostly data relevant to the watercycle, hydrology and meteorology and provided by missions aimed at gatheringsuch data.
Operational Readily Available Satellite Missionsfor Precision Irrigation
Currently operational satellites relevant to the problems of precision irrigation andwater management include a myriad of missions run by a number of US andEuropean agencies. We provide an overview of these missions as an integral partof the subsequent discussion of different satellite products derived from dataacquired by these missions, which are directly used for precision irrigation.
The National Aeronautics and Space Administration (NASA) and United StatesGeological Survey (USGS) missions within the Landsat satellite series are part of aprogram that is the longest running enterprise for acquisition of satellite imageryof Earth. The Landsat-7 satellite with the Enhanced Thematic Mapper Plus(ETM+) was launched with the 15 April 1999 and is operational, but has expe-rienced a malfunction that caused the loss of 22 % of the entire scene since 2003.The ETM+ is an eight-band, multispectral scanning radiometer, providing imagerywith wide-ranging applications in agriculture.
D. Culibrk et al., Sensing Technologies For Precision Irrigation,SpringerBriefs in Electrical and Computer Engineering,DOI: 10.1007/978-1-4614-8329-8_2, � The Author(s) 2014
53
Another NASA mission, Earth Observing System (EOS), includes two satel-lites: Terra (EOS AM) and Aqua (EOS PM). Terra’s orbit around the Earth istimed so that it passes from north to south across the equator in the morning, whileAqua passes south to north over the equator in the afternoon. MODIS (or ModerateResolution Imaging Spectroradiometer) is a key instrument aboard these satellites.Terra MODIS and Aqua MODIS are viewing the entire Earth’s surface every1–2 days, acquiring data in 36 spectral bands, or groups of wavelengths. Thesedata is aimed at improving our understanding of global dynamics and processesoccurring on the land, in the oceans, and in the lower atmosphere.
In addition to MODIS, the EOS satellites have a number of other instruments ofinterest:
• Aqua, launched on May 4, 2002, has different instruments such as the Atmo-spheric Infra-red Sounder (AIRS), he Advanced Microwave Sounding Unit-A(AMSU-A) and the Cloud and the Earth’s Radiant Energy System (CERES).
• Terra, launched on December 18, 1999, sports the Advanced SpaceborneThermal Emission and Reflection Radiometer (ASTER), CERES and the Multi-angle Imaging Spectroradiometer (MISR).
AIRS and AMSU-A are aimed at deriving temperature and humidity in thelower parts of the atmosphere, while CERES is aimed at cloud monitoring,ASTER data is used to create detailed maps of land surface temperature, reflec-tance, and elevation. MISR is designed to measure the intensity of solar radiationreflected by the Earth system (planetary surface and atmosphere) in variousdirections and spectral bands.
In addition to NASA’s missions, the US National Oceanic and AtmosphericAdministration (NOAA) operates a series of polar-orbiting environmentalsatellites:
• NOAA-15 to NOAA-17 satellites (the last launched on June 24, 2002) representa series of NOAA satellites, which carry the Advanced TIROS OperationalVertical Sounder (ATOVS), an instrument that combines High ResolutionInfrared Radiation Sounder Version 3 (HIRS/3), AMSU-A and AMSU-B. Inaddition to ATOVS these satellites carry the Advanced Very High ResolutionRadiometer (AVHRR).
• The NOAA-18 and NOAA-19, launched on May 20, 2005 and February 4, 2009are equipped with new instruments, including the Microwave Humidity Sounder(MHS), developed by EUMETSAT, which replaced AMSU-B as part of theATOVS on NOAA-18 and the European MetOp satellites. NOAA-19 is part ofthe Polar Operational Environmental Satellite (POES) system, consisting of twosatellites, together with the European organization for the Exploitation ofMeteorological Satellites (EUMETSAT) METOP. The system consists of amorning and afternoon satellite, in order to ensure that every part of the Earth isobserved at least twice every 12 h.
Currently the ATOVS is generating products from the NOAA-15, 16, 18 andMETOP-A satellites. This instrument package provides information on
54 2 Sources of Remote Sensing Data
temperature and humidity profiles, total ozone, clouds and radiation on a globalscale. The AVHRR is also a radiation-detection imager that can be used forremotely determining cloud cover and the surface temperature.
The Defense Meteorological Satellite Program (DMSP) collects and dissemi-nates cloud cover and precipitation data acquired using a set of polar orbitingsatellites. DMSP-F15, launched on December 12, 1999, carries the Special SensorMicrowave Imager (SSM/I), the Special Sensor Microwave Temperature Sounder(SSM/T-1) and the Special Sensor Microwave Water Vapour Sounder (SSM/T-2).DMSP-F15 is still operational. Subsequent missions (DMSP-F16, DMSP-F17 andDMSP-F18) are equipped with the Special Sensor Microwave Imager/Sounder(SSMIS) which replaces and improves upon the two previously used instruments.The SSMIS is able to estimate atmospheric temperature, moisture, and surfaceparameters from data collected at frequencies ranging from 19 to 183 GHz. Allsatellites are operational at the time of writing.
Suomi National Polar-orbiting Partnership, formerly known as the NationalPolar-orbiting Operational Environmental Satellite System (NPOESS) PreparatoryProject assures a bridge between the EOS satellites and the forthcoming series ofJoint Polar Satellite System (JPSS) satellites. The JPSS satellites, previously calledthe NPOESS are developed jointly by NASA for the NOAA. The system currentlyconsists of a single satellite. It is equipped with several instruments relevant toirrigation. The Advanced Technology Microwave Sounder (ATMS) is a passivemicrowave radiometer with 22 channels dedicated to the measure of temperatureand moisture profiles for weather prediction. The Cross-track Infrared Sounder(CrIS), which is a Michelson interferometer, intended for atmospheric temperatureand moisture observations. The Visible Infrared Imaging Radiometer Suite (VIIRS)provide imagery of clouds under sunlit conditions in a dozen bands, and also pro-vides coverage in a number of infrared bands for night and day cloud imagingapplications. It collects visible and infrared views of Earth’s dynamic and surfaceprocesses. In addition VIIRS measures atmospheric and oceanic properties,including cloud and sea-surface temperature. The Clouds and the Earth’s RadiantEnergy System (CERES) is a 3-channels radiometer measuring reflected solarradiation, emitted terrestrial radiation, and total radiation to monitor the Earth’s totalthermal radiation budget. The first satellite was launched on October 28, 2011.
The satellite missions of European organization for the Exploitation of Mete-orological Satellites (EUMETSAT) of interest to the subject of this book are:
• The spin-stabilized Meteosat Second Generation (MSG) that images the fullearth every 15 min and consists of a series of four geostationary meteorologicalsatellites, which are designed to operate consecutively. This platform isequipped with the Spinning Enhanced Visible and Infrared Imager (SEVIRI)that provides imagery with a 3 km resolution at nadir and in 12 spectral bands[2]. The instrument provides data about the temperatures of clouds, land and seasurfaces, as well as allowing for the analysis of the characteristics of atmo-spheric air masses. The last in the series, Meteosat-10 (MSG-3) was successfullylaunched, on July 5th, 2012.
Operational Readily Available Satellite Missions for Precision Irrigation 55
• The EUMETSAT Polar System (EPS) is the polar orbiting operational meteo-rological satellite system for the morning orbit, consisting of Meteorological-Operational (METOP) satellites, the first of which was successfully launched onOctober 19, 2006. The sensors on-board METOP are the Advanced Very HighResolution Radiometer (AVHRR), the Advanced Scatterometer (ASCAT), theInfrared Atmospheric Sounding Interferometer (IASI), the Advanced Micro-wave Sounding Unit A1 and A2 (AMSU-A), the Microwave Humidity Sounder(MHS) and the Global Navigation Satellite System Receiver for AtmosphericSounding (GRAS). AVHRR is a visible/infrared imaging radiometer using 6channels for global measurement of cloud cover, sea surface temperature, ice,snow and vegetation cover and characteristics. ASCAT is a real-aperture radarin C-band using vertically polarized antennas for global sea surface wind vectormeasurement. The main objective of IASI is to derive temperature and humidityprofiles with high vertical resolution and accuracy. HIRS is an atmosphericsounder using 19 infrared channels (3.8–15 lm) and one visible channel todesigned to provide temperature and humidity profiles, surface temperature,cloud parameters and total ozone. MHS is a self-calibrating, cross-track scan-ning, five-channel microwave, full-power radiometer operating in the89–190 GHz range, designed to provide information on atmospheric watervapor. The GRAS sensor uses the radio-occultation technique to retrieve tem-perature and humidity profiles.
The European Space Agency (ESA) main earth observation mission—theEnvironmental Satellite (ENVISAT), ended on May 9, 2012. It is supposed to bereplaced by the new Sentinel satellites, to be launched during 2013. At the time ofwriting the only operational ESA mission of interest is the Soil Moisture OceanSalinity (SMOS) Earth Explorer mission dedicated in particular to the measure-ment of soil moisture for hydrology applications. SMOS mission uses theMicrowave Imaging Radiometer using Aperture Synthesis (MIRAS) sensor andwas launched on November 2, 2009.
The French space agency, the Centre National d’Etudes Spatiales (CNES)developed and runs the Satellite Pour l’Observation de la Terre (SPOT) satelliteseries, which provides a very-high resolution earth observation data, appropriatefor irrigation and agriculture applications. The two operational satellites in thismission are SPOT-4 and SPOT-5. SPOT-4 is equipped with the High ResolutionVisible and Infra-red (HRVIR) and VEGETATION sensors. SPOT-5, launched onMay 4, 2002, is equipped with High Resolution Geometric (HRG), High-Reso-lution Stereoscopic (HRS) and VEGETATION sensors. HRVIR and HRG are 5-band multispectral imaging sensors. The aim of the VEGETATION instrument isto provide accurate measurements of the main characteristics of the Earth’s plantcover. Practically daily global coverage and a resolution of 1 km make this sensoran ideal tool for observing long-term regional and global environmental changes.HRS provides a 3D representation of the area.
56 2 Sources of Remote Sensing Data
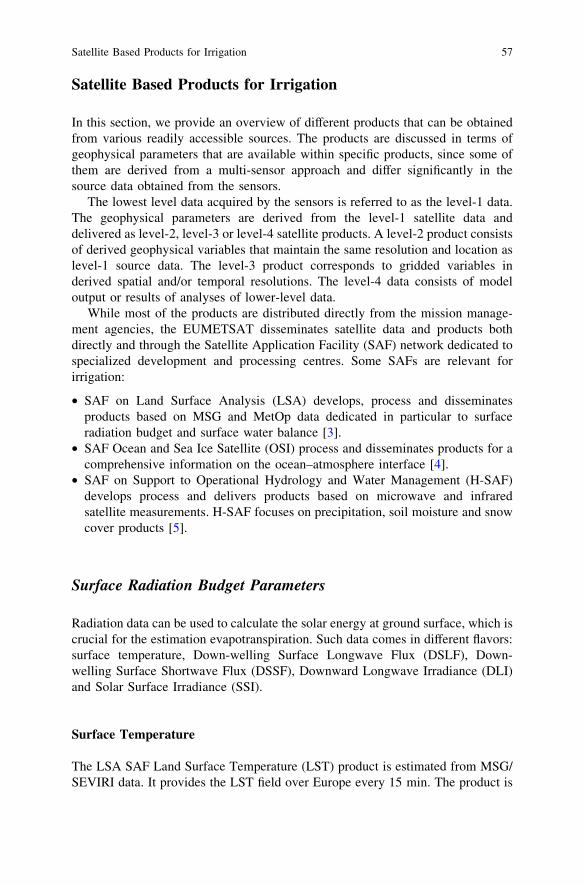
Satellite Based Products for Irrigation
In this section, we provide an overview of different products that can be obtainedfrom various readily accessible sources. The products are discussed in terms ofgeophysical parameters that are available within specific products, since some ofthem are derived from a multi-sensor approach and differ significantly in thesource data obtained from the sensors.
The lowest level data acquired by the sensors is referred to as the level-1 data.The geophysical parameters are derived from the level-1 satellite data anddelivered as level-2, level-3 or level-4 satellite products. A level-2 product consistsof derived geophysical variables that maintain the same resolution and location aslevel-1 source data. The level-3 product corresponds to gridded variables inderived spatial and/or temporal resolutions. The level-4 data consists of modeloutput or results of analyses of lower-level data.
While most of the products are distributed directly from the mission manage-ment agencies, the EUMETSAT disseminates satellite data and products bothdirectly and through the Satellite Application Facility (SAF) network dedicated tospecialized development and processing centres. Some SAFs are relevant forirrigation:
• SAF on Land Surface Analysis (LSA) develops, process and disseminatesproducts based on MSG and MetOp data dedicated in particular to surfaceradiation budget and surface water balance [3].
• SAF Ocean and Sea Ice Satellite (OSI) process and disseminates products for acomprehensive information on the ocean–atmosphere interface [4].
• SAF on Support to Operational Hydrology and Water Management (H-SAF)develops process and delivers products based on microwave and infraredsatellite measurements. H-SAF focuses on precipitation, soil moisture and snowcover products [5].
Surface Radiation Budget Parameters
Radiation data can be used to calculate the solar energy at ground surface, which iscrucial for the estimation evapotranspiration. Such data comes in different flavors:surface temperature, Down-welling Surface Longwave Flux (DSLF), Down-welling Surface Shortwave Flux (DSSF), Downward Longwave Irradiance (DLI)and Solar Surface Irradiance (SSI).
Surface Temperature
The LSA SAF Land Surface Temperature (LST) product is estimated from MSG/SEVIRI data. It provides the LST field over Europe every 15 min. The product is
Satellite Based Products for Irrigation 57
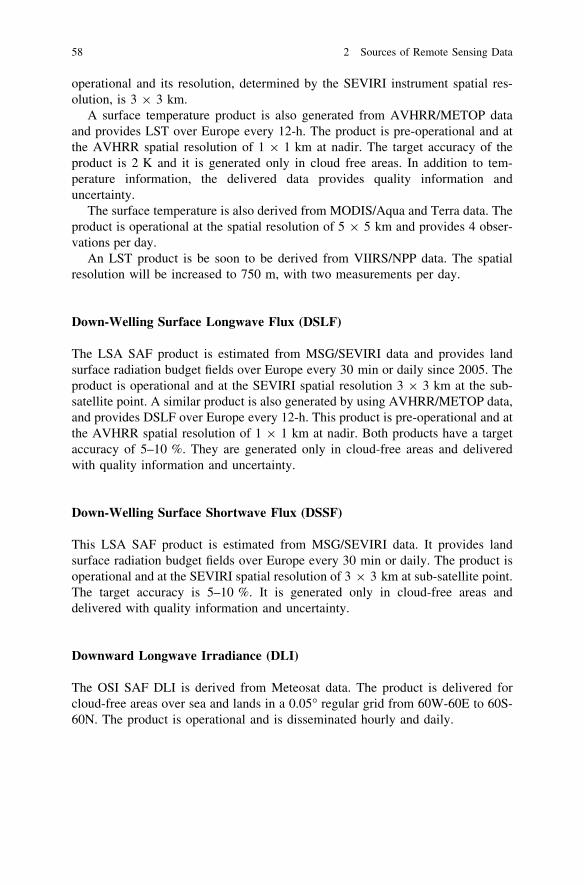
operational and its resolution, determined by the SEVIRI instrument spatial res-olution, is 3 9 3 km.
A surface temperature product is also generated from AVHRR/METOP dataand provides LST over Europe every 12-h. The product is pre-operational and atthe AVHRR spatial resolution of 1 9 1 km at nadir. The target accuracy of theproduct is 2 K and it is generated only in cloud free areas. In addition to tem-perature information, the delivered data provides quality information anduncertainty.
The surface temperature is also derived from MODIS/Aqua and Terra data. Theproduct is operational at the spatial resolution of 5 9 5 km and provides 4 obser-vations per day.
An LST product is be soon to be derived from VIIRS/NPP data. The spatialresolution will be increased to 750 m, with two measurements per day.
Down-Welling Surface Longwave Flux (DSLF)
The LSA SAF product is estimated from MSG/SEVIRI data and provides landsurface radiation budget fields over Europe every 30 min or daily since 2005. Theproduct is operational and at the SEVIRI spatial resolution 3 9 3 km at the sub-satellite point. A similar product is also generated by using AVHRR/METOP data,and provides DSLF over Europe every 12-h. This product is pre-operational and atthe AVHRR spatial resolution of 1 9 1 km at nadir. Both products have a targetaccuracy of 5–10 %. They are generated only in cloud-free areas and deliveredwith quality information and uncertainty.
Down-Welling Surface Shortwave Flux (DSSF)
This LSA SAF product is estimated from MSG/SEVIRI data. It provides landsurface radiation budget fields over Europe every 30 min or daily. The product isoperational and at the SEVIRI spatial resolution of 3 9 3 km at sub-satellite point.The target accuracy is 5–10 %. It is generated only in cloud-free areas anddelivered with quality information and uncertainty.
Downward Longwave Irradiance (DLI)
The OSI SAF DLI is derived from Meteosat data. The product is delivered forcloud-free areas over sea and lands in a 0.05� regular grid from 60W-60E to 60S-60N. The product is operational and is disseminated hourly and daily.
58 2 Sources of Remote Sensing Data
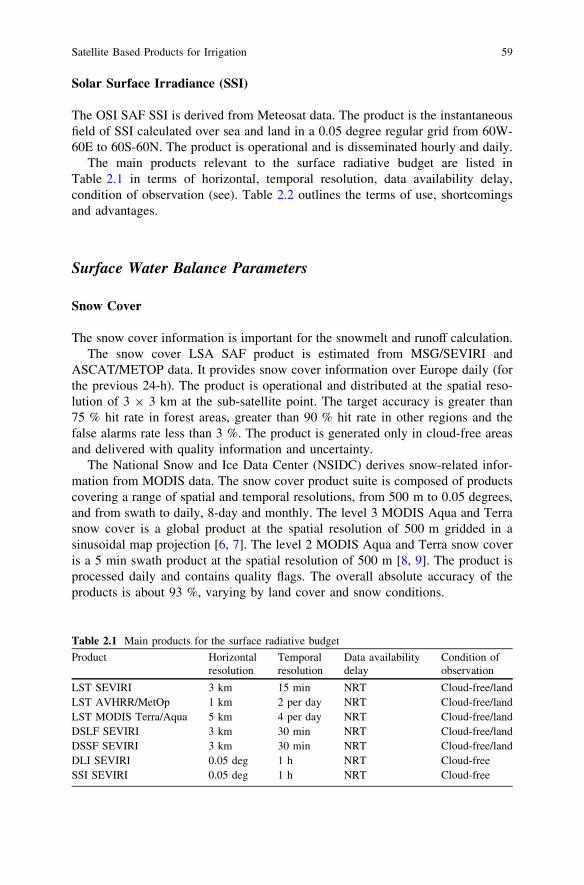
Solar Surface Irradiance (SSI)
The OSI SAF SSI is derived from Meteosat data. The product is the instantaneousfield of SSI calculated over sea and land in a 0.05 degree regular grid from 60W-60E to 60S-60N. The product is operational and is disseminated hourly and daily.
The main products relevant to the surface radiative budget are listed inTable 2.1 in terms of horizontal, temporal resolution, data availability delay,condition of observation (see). Table 2.2 outlines the terms of use, shortcomingsand advantages.
Surface Water Balance Parameters
Snow Cover
The snow cover information is important for the snowmelt and runoff calculation.The snow cover LSA SAF product is estimated from MSG/SEVIRI and
ASCAT/METOP data. It provides snow cover information over Europe daily (forthe previous 24-h). The product is operational and distributed at the spatial reso-lution of 3 9 3 km at the sub-satellite point. The target accuracy is greater than75 % hit rate in forest areas, greater than 90 % hit rate in other regions and thefalse alarms rate less than 3 %. The product is generated only in cloud-free areasand delivered with quality information and uncertainty.
The National Snow and Ice Data Center (NSIDC) derives snow-related infor-mation from MODIS data. The snow cover product suite is composed of productscovering a range of spatial and temporal resolutions, from 500 m to 0.05 degrees,and from swath to daily, 8-day and monthly. The level 3 MODIS Aqua and Terrasnow cover is a global product at the spatial resolution of 500 m gridded in asinusoidal map projection [6, 7]. The level 2 MODIS Aqua and Terra snow coveris a 5 min swath product at the spatial resolution of 500 m [8, 9]. The product isprocessed daily and contains quality flags. The overall absolute accuracy of theproducts is about 93 %, varying by land cover and snow conditions.
Table 2.1 Main products for the surface radiative budget
Product Horizontalresolution
Temporalresolution
Data availabilitydelay
Condition ofobservation
LST SEVIRI 3 km 15 min NRT Cloud-free/landLST AVHRR/MetOp 1 km 2 per day NRT Cloud-free/landLST MODIS Terra/Aqua 5 km 4 per day NRT Cloud-free/landDSLF SEVIRI 3 km 30 min NRT Cloud-free/landDSSF SEVIRI 3 km 30 min NRT Cloud-free/landDLI SEVIRI 0.05 deg 1 h NRT Cloud-freeSSI SEVIRI 0.05 deg 1 h NRT Cloud-free
Satellite Based Products for Irrigation 59

Evapotranspiration
The LSA SAF EV product is estimated from MSG/SEVIRI data. It provides theevapotranspiration field over Europe, either every 30 min or daily. The product isin its pre-operational phase and distributed at the SEVIRI spatial resolution of3 9 3 km at sub-satellite point. The Evapotranspiration (EV) field quantifies thewater vapour flux from the ground surface (soil and canopy).The target accuracy is25 % if evapotranspiration is greater than 0.4 mm/h and 0.1 mm/h otherwise.
The EV filed is calculated based on the reference evapotranspiration, which isthe evapotranspiration from the grass reference surface as defined by the Food andAgriculture Organization (FAO). A coefficient is applied for each crop get the finalEV data.
The level 4 EV is also derived from MODIS/Aqua and Terra data. The productis operational at the spatial resolution of 1 9 1 km and provides 2 observations perday in cloud-free areas. The product is disseminated with quality flags and stan-dard deviation data.
Soil Moisture
EUMETSAT calculates the level 2 surface soil moisture index product by usingASCAT data. The product is operational and disseminated in near real time. Thesoil moisture index represents the degree of saturation of first layers of the soil(\5 cm) and is given in %, ranging from 0 (dry) to 100 (wet). The nominal spatialresolution is 50 9 50 km or 25 9 25 km on double swath of 550 km with a gap inbetween of about 700 km. A global coverage is achieved over Europe in 1.5 days.Root mean square error of 25 km resolution soil moisture index is about0.03–0.07 m3 of water per m3 of the soil, depending on the soil type.
The H-SAF small-scale surface soil moisture by radar scatterometer is based onthe METOP/ASCAT data. The 25 km soil moisture product is disaggregated and
Table 2.2 Licensing, advantages and shortcomings of main products for the surface radiativebudget
Product Terms of use Shortcomings Advantages
LST SEVIRI License Horizontal resolutionover Europe
Temporal resolution
LST AVHRR/MetOp License Temporal resolutionpre-operational
Horizontal resolution
LST MODIS Terra/Aqua Free of charge Temporal resolution Horizontal resolutionDSLF SEVIRI License Horizontal resolution
over EuropeTemporal resolution
DSSF SEVIRI License Horizontal resolutionover Europe
Temporal resolution
DLI SEVIRI License Temporal resolutionSSI SEVIRI License Temporal resolution
60 2 Sources of Remote Sensing Data
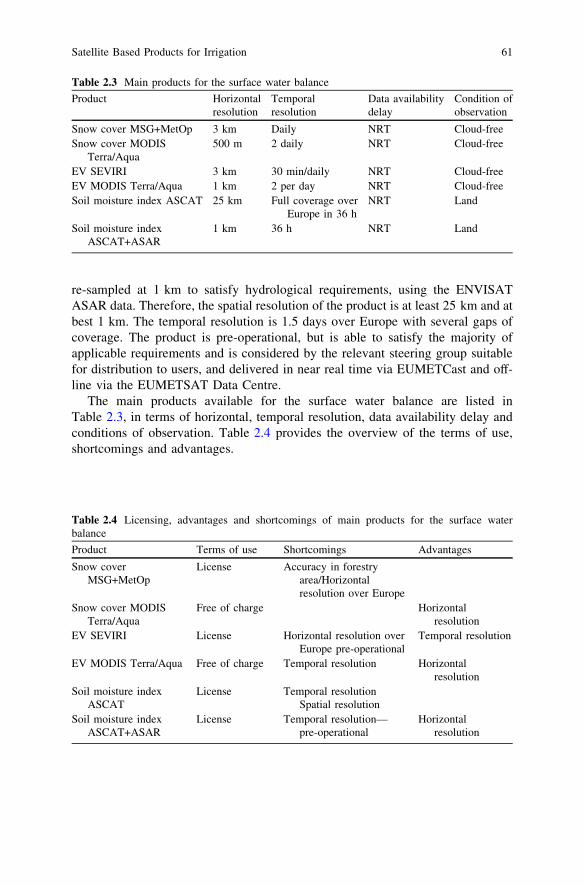
re-sampled at 1 km to satisfy hydrological requirements, using the ENVISATASAR data. Therefore, the spatial resolution of the product is at least 25 km and atbest 1 km. The temporal resolution is 1.5 days over Europe with several gaps ofcoverage. The product is pre-operational, but is able to satisfy the majority ofapplicable requirements and is considered by the relevant steering group suitablefor distribution to users, and delivered in near real time via EUMETCast and off-line via the EUMETSAT Data Centre.
The main products available for the surface water balance are listed inTable 2.3, in terms of horizontal, temporal resolution, data availability delay andconditions of observation. Table 2.4 provides the overview of the terms of use,shortcomings and advantages.
Table 2.3 Main products for the surface water balance
Product Horizontalresolution
Temporalresolution
Data availabilitydelay
Condition ofobservation
Snow cover MSG+MetOp 3 km Daily NRT Cloud-freeSnow cover MODIS
Terra/Aqua500 m 2 daily NRT Cloud-free
EV SEVIRI 3 km 30 min/daily NRT Cloud-freeEV MODIS Terra/Aqua 1 km 2 per day NRT Cloud-freeSoil moisture index ASCAT 25 km Full coverage over
Europe in 36 hNRT Land
Soil moisture indexASCAT+ASAR
1 km 36 h NRT Land
Table 2.4 Licensing, advantages and shortcomings of main products for the surface waterbalance
Product Terms of use Shortcomings Advantages
Snow coverMSG+MetOp
License Accuracy in forestryarea/Horizontalresolution over Europe
Snow cover MODISTerra/Aqua
Free of charge Horizontalresolution
EV SEVIRI License Horizontal resolution overEurope pre-operational
Temporal resolution
EV MODIS Terra/Aqua Free of charge Temporal resolution Horizontalresolution
Soil moisture indexASCAT
License Temporal resolutionSpatial resolution
Soil moisture indexASCAT+ASAR
License Temporal resolution—pre-operational
Horizontalresolution
Satellite Based Products for Irrigation 61
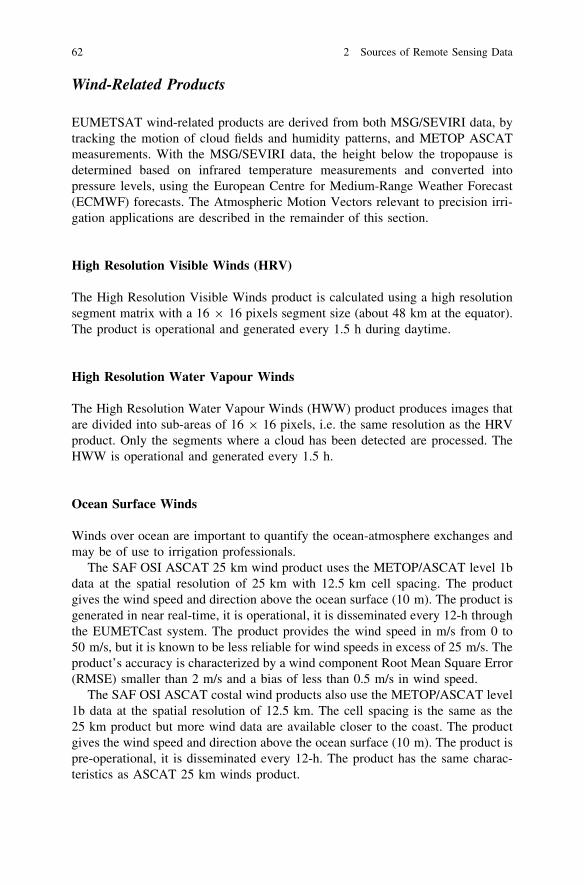
Wind-Related Products
EUMETSAT wind-related products are derived from both MSG/SEVIRI data, bytracking the motion of cloud fields and humidity patterns, and METOP ASCATmeasurements. With the MSG/SEVIRI data, the height below the tropopause isdetermined based on infrared temperature measurements and converted intopressure levels, using the European Centre for Medium-Range Weather Forecast(ECMWF) forecasts. The Atmospheric Motion Vectors relevant to precision irri-gation applications are described in the remainder of this section.
High Resolution Visible Winds (HRV)
The High Resolution Visible Winds product is calculated using a high resolutionsegment matrix with a 16 9 16 pixels segment size (about 48 km at the equator).The product is operational and generated every 1.5 h during daytime.
High Resolution Water Vapour Winds
The High Resolution Water Vapour Winds (HWW) product produces images thatare divided into sub-areas of 16 9 16 pixels, i.e. the same resolution as the HRVproduct. Only the segments where a cloud has been detected are processed. TheHWW is operational and generated every 1.5 h.
Ocean Surface Winds
Winds over ocean are important to quantify the ocean-atmosphere exchanges andmay be of use to irrigation professionals.
The SAF OSI ASCAT 25 km wind product uses the METOP/ASCAT level 1bdata at the spatial resolution of 25 km with 12.5 km cell spacing. The productgives the wind speed and direction above the ocean surface (10 m). The product isgenerated in near real-time, it is operational, it is disseminated every 12-h throughthe EUMETCast system. The product provides the wind speed in m/s from 0 to50 m/s, but it is known to be less reliable for wind speeds in excess of 25 m/s. Theproduct’s accuracy is characterized by a wind component Root Mean Square Error(RMSE) smaller than 2 m/s and a bias of less than 0.5 m/s in wind speed.
The SAF OSI ASCAT costal wind products also use the METOP/ASCAT level1b data at the spatial resolution of 12.5 km. The cell spacing is the same as the25 km product but more wind data are available closer to the coast. The productgives the wind speed and direction above the ocean surface (10 m). The product ispre-operational, it is disseminated every 12-h. The product has the same charac-teristics as ASCAT 25 km winds product.
62 2 Sources of Remote Sensing Data
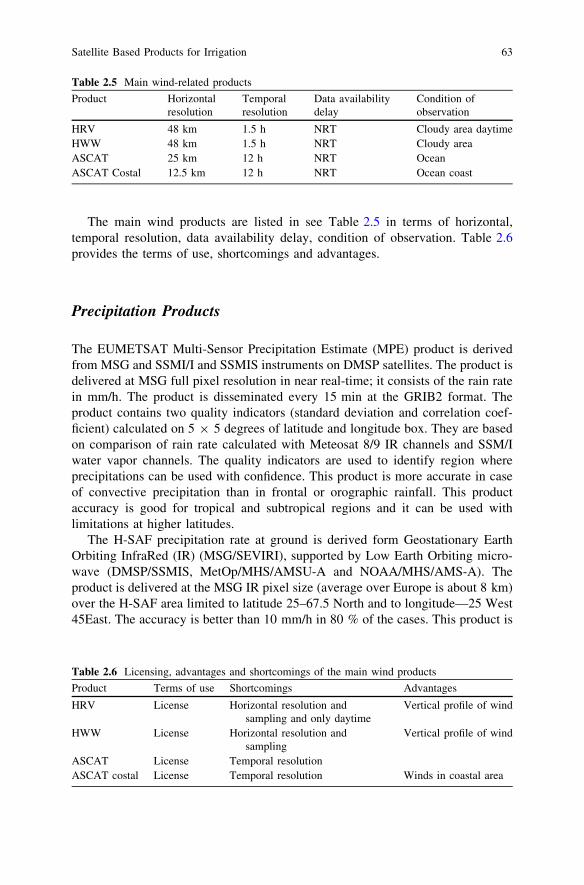
The main wind products are listed in see Table 2.5 in terms of horizontal,temporal resolution, data availability delay, condition of observation. Table 2.6provides the terms of use, shortcomings and advantages.
Precipitation Products
The EUMETSAT Multi-Sensor Precipitation Estimate (MPE) product is derivedfrom MSG and SSMI/I and SSMIS instruments on DMSP satellites. The product isdelivered at MSG full pixel resolution in near real-time; it consists of the rain ratein mm/h. The product is disseminated every 15 min at the GRIB2 format. Theproduct contains two quality indicators (standard deviation and correlation coef-ficient) calculated on 5 9 5 degrees of latitude and longitude box. They are basedon comparison of rain rate calculated with Meteosat 8/9 IR channels and SSM/Iwater vapor channels. The quality indicators are used to identify region whereprecipitations can be used with confidence. This product is more accurate in caseof convective precipitation than in frontal or orographic rainfall. This productaccuracy is good for tropical and subtropical regions and it can be used withlimitations at higher latitudes.
The H-SAF precipitation rate at ground is derived form Geostationary EarthOrbiting InfraRed (IR) (MSG/SEVIRI), supported by Low Earth Orbiting micro-wave (DMSP/SSMIS, MetOp/MHS/AMSU-A and NOAA/MHS/AMS-A). Theproduct is delivered at the MSG IR pixel size (average over Europe is about 8 km)over the H-SAF area limited to latitude 25–67.5 North and to longitude—25 West45East. The accuracy is better than 10 mm/h in 80 % of the cases. This product is
Table 2.5 Main wind-related products
Product Horizontalresolution
Temporalresolution
Data availabilitydelay
Condition ofobservation
HRV 48 km 1.5 h NRT Cloudy area daytimeHWW 48 km 1.5 h NRT Cloudy areaASCAT 25 km 12 h NRT OceanASCAT Costal 12.5 km 12 h NRT Ocean coast
Table 2.6 Licensing, advantages and shortcomings of the main wind products
Product Terms of use Shortcomings Advantages
HRV License Horizontal resolution andsampling and only daytime
Vertical profile of wind
HWW License Horizontal resolution andsampling
Vertical profile of wind
ASCAT License Temporal resolutionASCAT costal License Temporal resolution Winds in coastal area
Satellite Based Products for Irrigation 63
not applicable for low rate (more suitable for convective precipitation). Theproduct is pre-operational and delivered in near real-time every 15 via EUMET-Cast and EUMETSAT Data Centre.
Atmospheric Weather Parameters
Temperature, Humidity and Surface Temperature
The EUMETSAT IASI level 2 Atmospheric Water Vapour and Surface SkinTemperature (TWT) product is derived from IASI level1c, AMSU-A and MHSdata. The product provides vertical profiles of temperature and humidity on 90pressure levels, and surface skin temperature. The sampling is about 25 km atnadir. The quality of the vertical profiles is strongly related to the cloud propertiesavailable in the IASI CLP product. The accuracy of the product is 1 K for thetemperature profile in the troposphere and 10 % for the relative humidity profile.The product is operational and disseminated in near real-time on GTS (The WorldMeteorological Organisation’s Global Telecommunication System) or EUMET-cast with a timeliness of 3 h. Moreover the product is delivered through theEUMETSAT DATA Centre in HDF5 format with a timeliness of 8–9 h. theproduct is delivered twice per day.
The temperature and humidity profiles are derived from MODIS/Aqua andTerra data. The product provides vertical profiles on 20 pressure levels. Theproduct is operational at the spatial resolution of 5 9 5 km and it provides 4observations per day in cloud-free areas.
Surface Pressure
The Surface Pressure (SP) is derived from MODIS/Aqua and Terra data. Theproduct is operational at the spatial resolution of 5 9 5 km and it provides 4observations per day. The product is disseminated in HDF format.
The main atmospheric weather products are listed below (see Tables 2.7 and 2.8)in terms of horizontal, vertical, temporal resolution, data availability delay, conditionof observation, terms of use, shortcomings and advantages.
Biogeophysical Measurements
These products are used to depict the spatial and temporal change of the vegetationcover. They are useful to initiate and update the land use variable of atmosphericmodels.
64 2 Sources of Remote Sensing Data
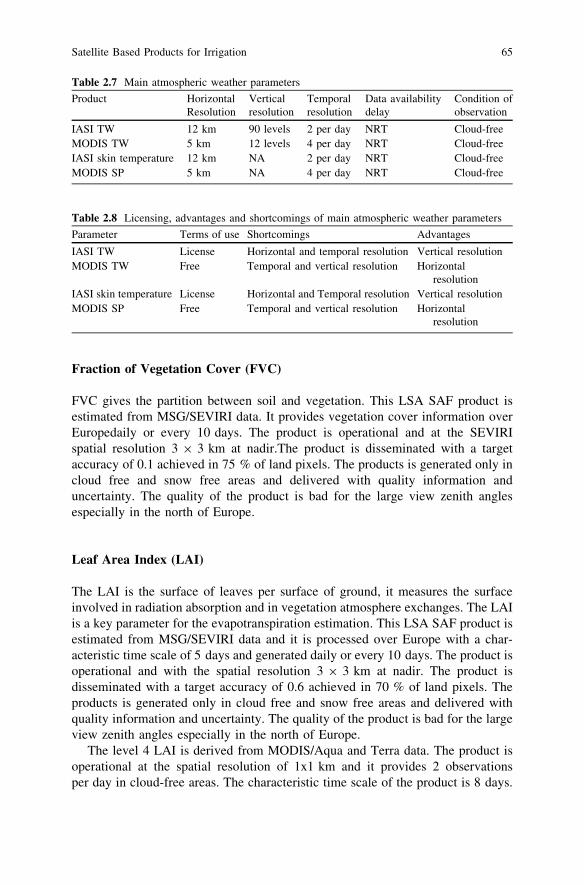
Fraction of Vegetation Cover (FVC)
FVC gives the partition between soil and vegetation. This LSA SAF product isestimated from MSG/SEVIRI data. It provides vegetation cover information overEuropedaily or every 10 days. The product is operational and at the SEVIRIspatial resolution 3 9 3 km at nadir.The product is disseminated with a targetaccuracy of 0.1 achieved in 75 % of land pixels. The products is generated only incloud free and snow free areas and delivered with quality information anduncertainty. The quality of the product is bad for the large view zenith anglesespecially in the north of Europe.
Leaf Area Index (LAI)
The LAI is the surface of leaves per surface of ground, it measures the surfaceinvolved in radiation absorption and in vegetation atmosphere exchanges. The LAIis a key parameter for the evapotranspiration estimation. This LSA SAF product isestimated from MSG/SEVIRI data and it is processed over Europe with a char-acteristic time scale of 5 days and generated daily or every 10 days. The product isoperational and with the spatial resolution 3 9 3 km at nadir. The product isdisseminated with a target accuracy of 0.6 achieved in 70 % of land pixels. Theproducts is generated only in cloud free and snow free areas and delivered withquality information and uncertainty. The quality of the product is bad for the largeview zenith angles especially in the north of Europe.
The level 4 LAI is derived from MODIS/Aqua and Terra data. The product isoperational at the spatial resolution of 1x1 km and it provides 2 observationsper day in cloud-free areas. The characteristic time scale of the product is 8 days.
Table 2.7 Main atmospheric weather parameters
Product HorizontalResolution
Verticalresolution
Temporalresolution
Data availabilitydelay
Condition ofobservation
IASI TW 12 km 90 levels 2 per day NRT Cloud-freeMODIS TW 5 km 12 levels 4 per day NRT Cloud-freeIASI skin temperature 12 km NA 2 per day NRT Cloud-freeMODIS SP 5 km NA 4 per day NRT Cloud-free
Table 2.8 Licensing, advantages and shortcomings of main atmospheric weather parameters
Parameter Terms of use Shortcomings Advantages
IASI TW License Horizontal and temporal resolution Vertical resolutionMODIS TW Free Temporal and vertical resolution Horizontal
resolutionIASI skin temperature License Horizontal and Temporal resolution Vertical resolutionMODIS SP Free Temporal and vertical resolution Horizontal
resolution
Satellite Based Products for Irrigation 65
The product is disseminated with quality flags and standard deviation. The accu-racy is 0.5 LAI units RMSE globally.
Fraction of Absorbed Photosynthetic Active Radiation
Fraction of Absorbed Photosynthetic Active Radiation (FAPAR) is the PARabsorbed by the green part of the vegetation of the canopy. It is an essentialparameter for the calculation of the photosynthesis and water exchange betweenthe vegetation and the lower part of the boundary layer. This LSA SAF product isestimated from MSG/SEVIRI data and it is processed over Europe with a char-acteristic time scale of 5 days and generated daily or every 10 days. The product isoperational and at the SEVIRI spatial resolution 3 9 3 km at nadir. The product isdisseminated with a target accuracy of 0.1 achieved in 70 % of land pixels. Theproducts is generated only in cloud free and snow free areas and delivered withquality information and uncertainty. The quality of the product is bad for the largeview zenith angles especially in the north of Europe.
The level 4 FPAR is derived from MODIS/Aqua and Terra data. The product isoperational at the spatial resolution of 1 9 1 km and it provides 2 observations perday in cloud-free areas. The characteristic time scale of the product is 8 days. Theproduct is disseminated with quality flags and standard deviation. The accuracy is0.12 FPAR units RMSE globally.
The main biogeophysical parameters are listed below (see Table 2.9) in termsof horizontal, temporal resolution, data availability delay, condition of observa-tion, terms of use, shortcomings and advantages (Table 2.10).
Table 2.9 Main biogeophysical parameters
Product Horizontalresolution
Temporalresolution
Data availabilitydelay
Condition ofobservation
LSA FVC 3 km Daily NRT Cloud-free snow-freeLSA LAI 3 km Daily (5 days) NRT Cloud-free snow-freeMODIS LAI 1 km 2 per day (8 days) NRT Cloud-free snow-freeLSA FPAR 3 km Daily (5 days) NRT Cloud-free snow-freeMODIS FPAR 1 km 2 per day (8 days) NRT Cloud-free snow-free
Table 2.10 Licensing, advantages and shortcomings of main biogeophysical parameters
Product Terms of use Shortcomings Advantages
LSA FVC License Horizontal resolutionLSA LAI License Horizontal resolutionMODIS LAI Free Horizontal resolutionLSA FPAR License Horizontal resolutionMODIS FPAR Free Horizontal resolution
66 2 Sources of Remote Sensing Data
Data Accessibility
All MODIS level1 and Atmosphere data products are available to the public (at nocharge) through the Level 1 and Atmosphere Archive and Distribution System(LAADS).
Selected MODIS level 4 land data are available at Land Processes DistributedActive Archive Center (LP DAAC) Data Pool. Data are downloadable via directFTP access and at no cost to the user. The operational data are not included in thisData Pool.
The NASA’s Earth Observing System Data and Information System (EOSDIS)provides access to near-real time products from the MODIS and AIRS instrumentsin less than 2.5 h from observation by using the Land and Atmosphere Near-realtime Capability for EOS (LANCE). Data are freely available after self-registration.
The MODIS snow cover data are available from the NSIDC Data Poolwebserver or by subscription for automated requests.
All data including near real-time METEOSAT, MetOp data and productsdelivered via EUMETCast, Direct Dissemination and FTP over the internet requirea registration on the Earth Observation Portal (EO Portal). The EO Portal allowsusers to access and manage their subscriptions to data, products and servicesprovided by EUMETSAT. EUMETCast is EUMETSAT’s primary disseminationmechanism for the near real-time delivery of satellite data and products generatedby the EUMETSAT Application Ground Segment and SAFs.
For the delivery of products, the EUMETSAT Data Policy applies. Data aresubject to a set of licensing terms and conditions. The type of licence required willdepend upon the Data Usage and the set of data you wish to receive. Theseconditions may involve the payment of fees. Council may waive such fees on acase by case basis for specific applications.
References
1. IEEE 802.15.4TM-2003 Standard, 2003.2. IEEE 802.15.4TM-2006 (802.15.4TMb) Standard, 2006.3. IEEE 802.15.4TM-2007 (802.15.4TMa) Standard, 2007.4. IEEE 802.15.4TMc Standard, 2007.5. IEEE 802.15.4TMd Standard, 2009.6. María Soledad Escolar Díaz ‘‘A generic software architecture for portable applications in
heterogeneous wireless sensor networks’’, Doctoral Thesis 2010, Universidad Carlos III deMadrid. http://e-archivo.uc3m.es/bitstream/10016/9188/1/tesis-SoledadEscolar-Marzo2010.pdf (Accessed March 28, 2013).
7. Sizing Solar Energy Harvesters for Wireless Sensor Networks, http://www.rfm.com/products/apnotes/anm1002.pdf (Accessed March 28, 2013).
8. Costis Kompis and Simon Aliwell, Energy Harvesting Technologies to Enable Remoteand Wireless Sensing, http://cmapspublic.ihmc.us/rid=1J3DN487K-21D3XZZ-1597/energy-harvesting08.pdf (Accessed March 28, 2013).
9. Memsic, http://www.memsic.com/wireless-sensor-networks/ (Accessed March 28, 2013).
Data Accessibility 67
Chapter 3GIS Applications for IrrigationManagement
Although there are, as of yet, no specific GIS applications for irrigation man-agement, there are several products related to precision agriculture which offertools to monitor the water use in order to improve land/crop performance andoffers several GIS functionalities. These precision agriculture software packagescan be used to identify strategies for improved land/crop management. Precisionagriculture software provides a link between crop production records and spatial(map) data, including site-specific or land management units. Precision agriculturesoftware is required for field data collection (spatial and non-spatial), data man-agement and data analysis.
Usually a tremendous amount of information is generated by precision agri-culture, depending on the level of adoption by the farm manager or agribusinessretailer. Management changes that occur due to adoption of various precisionagriculture practices must be based on accurate knowledge derived through theanalysis of information. Computer software, in combination with the knowledge offarmers and specialists, will assist in determining trends and making wisedecisions.
Software used in precision agriculture ranges from introductory low-endrecord-keeping software, to full-fledged geographic information systems (GIS),with relational database tables and full statistical analysis capabilities. Precision-agriculture software can currently be grouped into the following categories:
• farm record keeping• yield mapping• agricultural enhanced geographic information systems (GIS)• geographic information systems (GIS)
People working in agribusiness can use GIS software for precision farming,land management, business operations, and much more. GIS provides the means tospatially view variables that affect crop yields, erosion and drought risk, andbusiness opportunities. GIS has the capabilities to collect, manage, analyze, report,and share vast amounts of agricultural data to aid in discovering and establishingsustainable agriculture practices.
D. Culibrk et al., Sensing Technologies For Precision Irrigation,SpringerBriefs in Electrical and Computer Engineering,DOI: 10.1007/978-1-4614-8329-8_3, � The Author(s) 2014
69
Most available software packages provide extended GIS functionalities andstore spatial data, with attribute (description) data associated with each point, lineor polygon. Usually this data includes the following information:
1. Accounting data
• debits and credits• balance sheet• net return• asset inventory
2. Cropping data
• cropping history (seeding dates, harvest information)• field history (spraying, cultivating, water use)• crop inputs, (herbicides, insecticides, fertilizer)• weather (rainfall, temperatures, hail, snow)
3. Physical land information
• soil type (organic matter, texture, pH, topsoil depth, parent material,classification)
• topography (slope, aspect, curvature, position, drainage)
4. Yield-monitor data
• volume per area• moisture content
5. Global positioning system (GPS) data
• field boundary locations• soil sample locations• digital elevation information
6. Remotely sensed data
• aerial photographs• satellite images
Any GIS software can usually be extended to cope with the requirements ofprecision irrigation solution. We provide an overview of widely used GIS solu-tions, both commercial and open-source.
70 3 GIS Applications for Irrigation Management
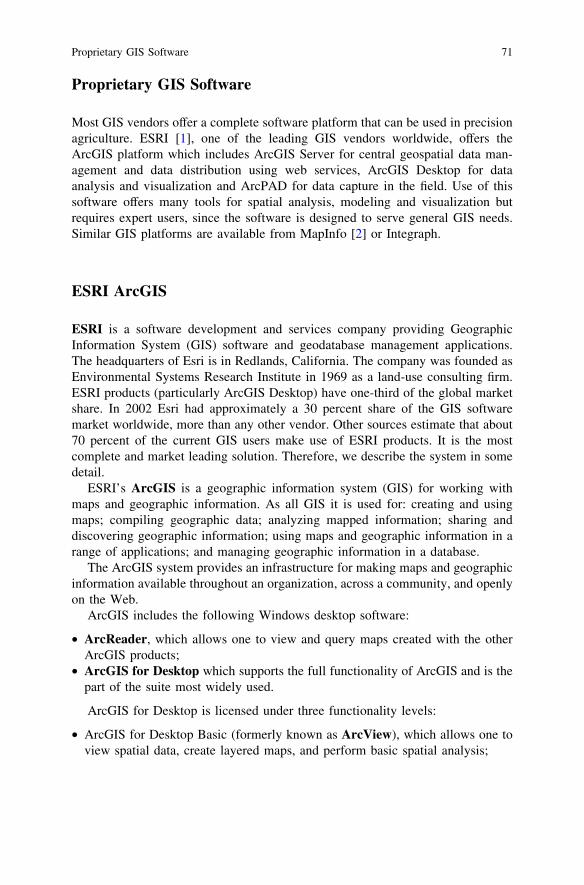
Proprietary GIS Software
Most GIS vendors offer a complete software platform that can be used in precisionagriculture. ESRI [1], one of the leading GIS vendors worldwide, offers theArcGIS platform which includes ArcGIS Server for central geospatial data man-agement and data distribution using web services, ArcGIS Desktop for dataanalysis and visualization and ArcPAD for data capture in the field. Use of thissoftware offers many tools for spatial analysis, modeling and visualization butrequires expert users, since the software is designed to serve general GIS needs.Similar GIS platforms are available from MapInfo [2] or Integraph.
ESRI ArcGIS
ESRI is a software development and services company providing GeographicInformation System (GIS) software and geodatabase management applications.The headquarters of Esri is in Redlands, California. The company was founded asEnvironmental Systems Research Institute in 1969 as a land-use consulting firm.ESRI products (particularly ArcGIS Desktop) have one-third of the global marketshare. In 2002 Esri had approximately a 30 percent share of the GIS softwaremarket worldwide, more than any other vendor. Other sources estimate that about70 percent of the current GIS users make use of ESRI products. It is the mostcomplete and market leading solution. Therefore, we describe the system in somedetail.
ESRI’s ArcGIS is a geographic information system (GIS) for working withmaps and geographic information. As all GIS it is used for: creating and usingmaps; compiling geographic data; analyzing mapped information; sharing anddiscovering geographic information; using maps and geographic information in arange of applications; and managing geographic information in a database.
The ArcGIS system provides an infrastructure for making maps and geographicinformation available throughout an organization, across a community, and openlyon the Web.
ArcGIS includes the following Windows desktop software:
• ArcReader, which allows one to view and query maps created with the otherArcGIS products;
• ArcGIS for Desktop which supports the full functionality of ArcGIS and is thepart of the suite most widely used.
ArcGIS for Desktop is licensed under three functionality levels:
• ArcGIS for Desktop Basic (formerly known as ArcView), which allows one toview spatial data, create layered maps, and perform basic spatial analysis;
Proprietary GIS Software 71
• ArcGIS for Desktop Standard (formerly known as ArcEditor), which in addi-tion to the functionality of ArcView, includes more advanced tools formanipulation of shapefiles and geodatabases; or
• ArcGIS for Desktop Advanced (formerly known as ArcInfo), which includescapabilities for data manipulation, editing, and analysis.
There are also server-based ArcGIS products, as well as ArcGIS products forPDAs. Such extensions can be purchased separately to increase the functionality ofArcGIS.
Desktop GIS Products
As of September 2010 Esri’s current desktop GIS suite is version 10.1. ArcGIS forDesktop software products allow users to author, analyze, map, manage, share, andpublish geographic information. ArcGIS for Desktop ships in three levels oflicensing: ArcView, ArcEditor and ArcInfo. ArcView provides a robust set of GIScapabilities suitable for many GIS applications. ArcEditor, at added cost, expandsthe desktop capabilities to allow more extensive data editing and manipulation,including server geodatabase editing. ArcInfo is at the high end and provides full,advanced analysis and data management capabilities, including geostatistical andtopological analysis tools. At all levels of licensing, ArcMap, ArcCatalog andArcToolbox are the names of the applications comprising the desktop package.
ArcGIS Explorer, ArcReader, and ArcExplorer are basic freeware applica-tions for viewing GIS data.
Many ArcGIS for Desktop Extensions are available, including Spatial Analystwhich allows raster analysis and 3D Analyst which allows terrain mapping andanalysis. Other more specialized extensions are available from Esri and thirdparties for specific GIS needs.
Esri’s original product, ARC/INFO, was a command line GIS product availableinitially on minicomputers, then on UNIX workstations. In 1992, a GUI GIS,ArcView GIS, was introduced. Over time, both of those products were offered inWindows versions and ArcView was offered as a Macintosh product. The namesArcView and ArcInfo are now used to name different levels of licensing in ArcGISfor Desktop, and less often refer to these original software products. The Windowsversion of ArcGIS is now the only ArcGIS for Desktop platform that is undergoingnew development for future product releases.
Server GIS Products
Server GIS products allow GIS functionality and data to be deployed from acentral environment. ArcIMS (Internet Mapping Server) provides browser basedaccess to GIS. ArcSDE (Spatial Database Engine) is used as an RDBMS
72 3 GIS Applications for Irrigation Management
connector for other Esri software to store and retrieve GIS data within a com-mercially available RDBMS. Currently ArcSDE can be used with Oracle, DB2,Informix, Postgresql and Microsoft SQL Server databases. It supports its nativeSDE binary data format, Oracle Spatial, and ST_geometry.
ArcGIS Server is the core server geographic information system (GIS) soft-ware made by Esri. ArcGIS Server is used for creating and managing GIS Webservices, applications, and data. ArcGIS Server is typically deployed on-premiseswithin the organization’s service-oriented architecture (SOA) or off-premises in acloud computing environment.
ArcGIS Server services supply mapping and GIS capabilities via ArcGISOnline for Esri Web and client applications, such as ArcGIS Desktop, ArcLo-gistics, the ArcGIS.com Viewer, ArcGIS Explorer, ArcGIS Explorer Online,ArcGIS Viewer for Flex, ArcGIS Mapping for SharePoint, Esri Business AnalystOnline (BAO), and applications built with ArcGIS for iOS or BAO for iOS.Numerous third-party applications are licensed to use ArcGIS Server services, aswell.
ArcGIS Server extensions allow GIS functionality available within a subset ofArcGIS Desktop extensions to be deployed as Web Services. ArcGIS Serverextensions include 3D, Spatial, Geostatistical, Network, Geoportal, Image, DataInteroperability, Workflow Manager, and Schematics.
ArcGIS Server is available for the Microsoft Windows.NET Framework and theJava Platform. ArcGIS Server ships in three functional editions, Basic, Standard,and Advanced, with the Advanced edition providing the most functionality.ArcGIS Server Basic edition is used primarily to manage multiuser geodatabasesand geodata services. Both ArcGIS Server Standard and Advanced editions sup-port the following types of Web services: Feature (for Web editing), Geodata (forgeodatabase replication), Geocode (for finding and displaying addresses/locationson a map), Geometry (for geometric calculations such as calculating areas andlengths), Geoprocessing (for scientific modeling and spatial data analysis), Globe(for 3D and globe rendering), Image (for serving raster data and providing controlover imagery delivery, such as satellite imagery or orthophotos), Keyhole MarkupLanguage (KML), Map (for cached and optimized map services), Mobile (forrunning services on field devices), Network Analyst (for routing, closest facilitylocation, or service area analysis), Search (for enterprise search of GIS assets),Web Coverage Service (WCS), Web Feature Service (WFS) and TransactionalWeb Feature Service (WFS-T), and Web Map Service (WMS).
In addition, ArcGIS Server editions are available at two levels, scaled accordingto capacity: Workgroup and Enterprise. ArcGIS Server Workgroup can bedeployed on a single machine to support a maximum of 10 simultaneous con-nections to a multiuser geodatabase. With Workgroup, the multiuser geodatabasestorage capacity cannot exceed ten gigabytes. ArcGIS Server Enterprise supportsdistributed deployment of ArcGIS Server components, unlimited simultaneousconnections to a multiuser geodatabase, and unlimited multiuser geodatabasestorage capacity.
Server GIS Products 73

ArcGIS Server is also used to manage multiuser geodatabases. Multiusergeodatabases leverage ArcSDE technology, implemented on a relational databasemanagement system (RDBMS). ArcGIS Server Enterprise supports IBM DB2,IBM Informix Dynamic Server, Microsoft SQL Server, Oracle, and PostgreSQL.ArcGIS Server Workgroup supports Microsoft SQL Server Express R1 and R2.
ArcGIS Server is used by the software developers and Web developers to createWeb, desktop, and mobile applications. Esri provides developers with applicationdevelopment framework (ADF) and application programming interface (API)including, ArcGIS API for JavaScript, ArcGIS API for Flex, ArcGIS API forMicrosoft Silverlight/WPF, ArcGIS API for iOS, BAO API, BAO for iOS [3] aswell as the ArcGIS Mobile software development kit (SDK), and ArcGIS ServerREST and SOAP APIs.
Other server based products include Geoportal Extension, ArcGIS Image Serverand Tracking Server, as well as several others.
Mobile GIS Products
Mobile GIS integrates GIS, GPS, location-based services, handheld computing,and the growing availability of geographic data. ArcGIS technology can bedeployed on a range of mobile systems from lightweight devices to PDAs, laptops,and Tablet PCs. This suite of products: ArcPad, ArcGIS for Mobile, ArcGIS forServer (Server-oriented APIs), ArcWeb Services (Web-oriented APIs), hostedgeographic databases and ArcGIS mobile.
Developer GIS Products
Developer GIS products enable building custom desktop or server GIS applica-tions or embed GIS functionality in existing applications. These focused solutionscan then be easily deployed throughout an organization. Such products include:Esri Developer Network or EDN, ArcEngine (Desktop-oriented APIs), ArcGIS forServer (Server-oriented APIs and a web development ADF which is part ofArcGIS for Server), ArcWeb Services (Web-oriented APIs)
Online GIS (ArcGIS Online)
ArcGIS includes online, Internet-based capabilities in all Esri software products.Online capabilities are centrally located at www.arcgis.com. These include webAPI’s, hosted map and geoprocessing services, and a user sharing program. Avariety of proprietary basemaps is a signature feature of arcgis.com. The Esri
74 3 GIS Applications for Irrigation Management
Community Maps program compiles detailed user basemap information into acommon cartographic format called Topographic Basemap.
Autocad Map 3D
AutoCAD� Map 3D is a mapping software from Autodesk, which is the marketleader in the domain of Computer Aided Design (CAD) tools. The solution isintended for model-based infrastructure planning and management that helps usersintegrate CAD and GIS data to inform GIS, planning, and engineering decisions.
AutoCAD� Map 3D GIS software includes a rich set of survey tools to enableusers to more easily import, compute, manage, and utilize field measurementsacquired from GPS and terrestrial sources. The survey functionality includes theability to consume custom field codes that can be mapped to database attributes,making asset collection more efficient using any device.
Using open-source Feature Data Object (FDO) technology, AutoCAD�
Map 3D provides direct access to GIS data from a variety of spatial data sources,including ESRI� files and managed geo-databases, Oracle�, Microsoft� SQLServer�, PostGIS, PostgreSQL, SQLite, and MySQL�. It is also able to accessaerial and satellite imagery and connecting to the web mapping and web featureservices to take advantage of publicly available data. The open, standards-baseddatabase support enables users to join CAD objects easily to commonly useddatabases and spreadsheets, and to store CAD and geospatial data in relationaldatabase management and GIS systems.
Improved spatial database tools enable users to store and use multiple geo-metric representations of their infrastructure assets, providing with the flexibilityto choose the geometry that best suits their deliverable requirements.
Analysis tools within the system help users answer questions and make deci-sions based on their data. The system supports: linking information in vector andtabular formats, performing data queries, creating thematic maps, buildingtopologies, creating reports and performing buffer, tracing, and overlay analysis.
Autocad Map supports the distribution of geospatial data, maps, and designs onthe web. They users can create drawings, designs, and maps, and publish them tothe Internet using the Autodesk� Infrastructure Map Server application or, dis-tribute them as individual georeferenced DWFTM files, multisheet DWF MapBooks, or paper plots.
Intergraph GEOMEDIA
The GeoMedia� product suite is a set of integrated applications that provideusers with geospatial processing capabilities. It is worth noting that the systemdoes not rely on proprietary data, but rather accesses and uses data sources directly
Online GIS (ArcGIS Online) 75
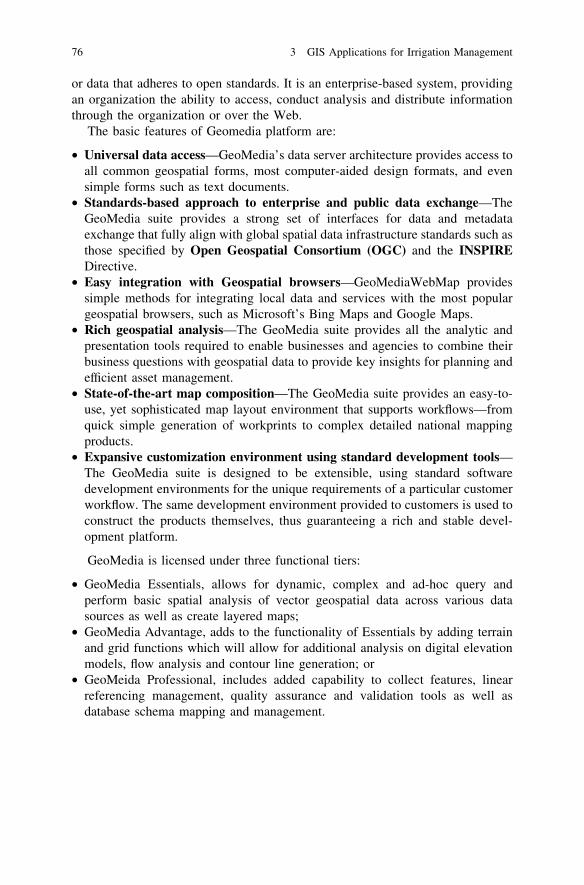
or data that adheres to open standards. It is an enterprise-based system, providingan organization the ability to access, conduct analysis and distribute informationthrough the organization or over the Web.
The basic features of Geomedia platform are:
• Universal data access—GeoMedia’s data server architecture provides access toall common geospatial forms, most computer-aided design formats, and evensimple forms such as text documents.
• Standards-based approach to enterprise and public data exchange—TheGeoMedia suite provides a strong set of interfaces for data and metadataexchange that fully align with global spatial data infrastructure standards such asthose specified by Open Geospatial Consortium (OGC) and the INSPIREDirective.
• Easy integration with Geospatial browsers—GeoMediaWebMap providessimple methods for integrating local data and services with the most populargeospatial browsers, such as Microsoft’s Bing Maps and Google Maps.
• Rich geospatial analysis—The GeoMedia suite provides all the analytic andpresentation tools required to enable businesses and agencies to combine theirbusiness questions with geospatial data to provide key insights for planning andefficient asset management.
• State-of-the-art map composition—The GeoMedia suite provides an easy-to-use, yet sophisticated map layout environment that supports workflows—fromquick simple generation of workprints to complex detailed national mappingproducts.
• Expansive customization environment using standard development tools—The GeoMedia suite is designed to be extensible, using standard softwaredevelopment environments for the unique requirements of a particular customerworkflow. The same development environment provided to customers is used toconstruct the products themselves, thus guaranteeing a rich and stable devel-opment platform.
GeoMedia is licensed under three functional tiers:
• GeoMedia Essentials, allows for dynamic, complex and ad-hoc query andperform basic spatial analysis of vector geospatial data across various datasources as well as create layered maps;
• GeoMedia Advantage, adds to the functionality of Essentials by adding terrainand grid functions which will allow for additional analysis on digital elevationmodels, flow analysis and contour line generation; or
• GeoMeida Professional, includes added capability to collect features, linearreferencing management, quality assurance and validation tools as well asdatabase schema mapping and management.
76 3 GIS Applications for Irrigation Management
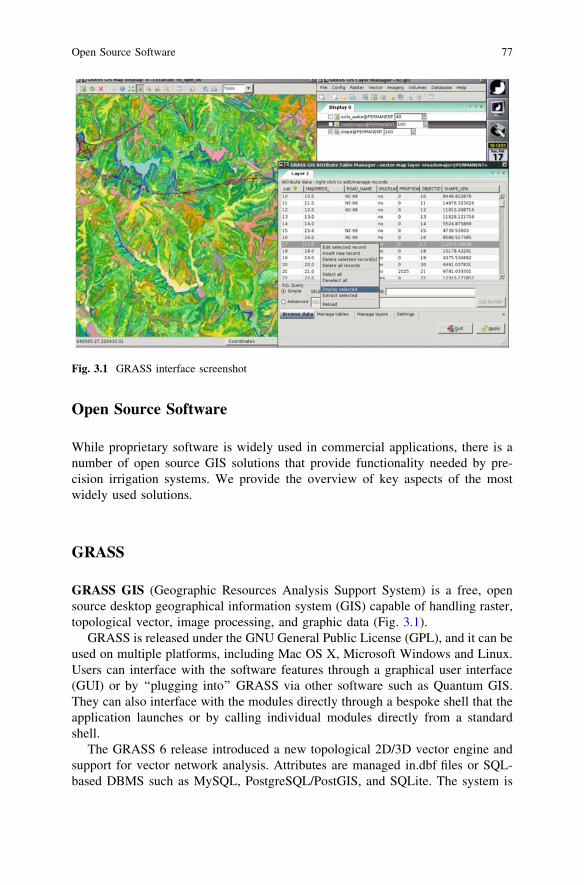
Open Source Software
While proprietary software is widely used in commercial applications, there is anumber of open source GIS solutions that provide functionality needed by pre-cision irrigation systems. We provide the overview of key aspects of the mostwidely used solutions.
GRASS
GRASS GIS (Geographic Resources Analysis Support System) is a free, opensource desktop geographical information system (GIS) capable of handling raster,topological vector, image processing, and graphic data (Fig. 3.1).
GRASS is released under the GNU General Public License (GPL), and it can beused on multiple platforms, including Mac OS X, Microsoft Windows and Linux.Users can interface with the software features through a graphical user interface(GUI) or by ‘‘plugging into’’ GRASS via other software such as Quantum GIS.They can also interface with the modules directly through a bespoke shell that theapplication launches or by calling individual modules directly from a standardshell.
The GRASS 6 release introduced a new topological 2D/3D vector engine andsupport for vector network analysis. Attributes are managed in.dbf files or SQL-based DBMS such as MySQL, PostgreSQL/PostGIS, and SQLite. The system is
Fig. 3.1 GRASS interface screenshot
Open Source Software 77
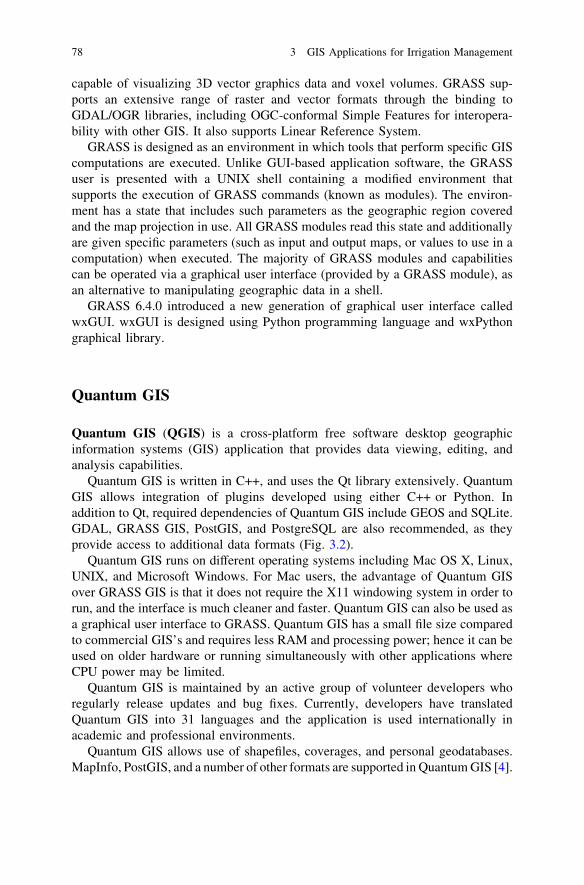
capable of visualizing 3D vector graphics data and voxel volumes. GRASS sup-ports an extensive range of raster and vector formats through the binding toGDAL/OGR libraries, including OGC-conformal Simple Features for interopera-bility with other GIS. It also supports Linear Reference System.
GRASS is designed as an environment in which tools that perform specific GIScomputations are executed. Unlike GUI-based application software, the GRASSuser is presented with a UNIX shell containing a modified environment thatsupports the execution of GRASS commands (known as modules). The environ-ment has a state that includes such parameters as the geographic region coveredand the map projection in use. All GRASS modules read this state and additionallyare given specific parameters (such as input and output maps, or values to use in acomputation) when executed. The majority of GRASS modules and capabilitiescan be operated via a graphical user interface (provided by a GRASS module), asan alternative to manipulating geographic data in a shell.
GRASS 6.4.0 introduced a new generation of graphical user interface calledwxGUI. wxGUI is designed using Python programming language and wxPythongraphical library.
Quantum GIS
Quantum GIS (QGIS) is a cross-platform free software desktop geographicinformation systems (GIS) application that provides data viewing, editing, andanalysis capabilities.
Quantum GIS is written in C++, and uses the Qt library extensively. QuantumGIS allows integration of plugins developed using either C++ or Python. Inaddition to Qt, required dependencies of Quantum GIS include GEOS and SQLite.GDAL, GRASS GIS, PostGIS, and PostgreSQL are also recommended, as theyprovide access to additional data formats (Fig. 3.2).
Quantum GIS runs on different operating systems including Mac OS X, Linux,UNIX, and Microsoft Windows. For Mac users, the advantage of Quantum GISover GRASS GIS is that it does not require the X11 windowing system in order torun, and the interface is much cleaner and faster. Quantum GIS can also be used asa graphical user interface to GRASS. Quantum GIS has a small file size comparedto commercial GIS’s and requires less RAM and processing power; hence it can beused on older hardware or running simultaneously with other applications whereCPU power may be limited.
Quantum GIS is maintained by an active group of volunteer developers whoregularly release updates and bug fixes. Currently, developers have translatedQuantum GIS into 31 languages and the application is used internationally inacademic and professional environments.
Quantum GIS allows use of shapefiles, coverages, and personal geodatabases.MapInfo, PostGIS, and a number of other formats are supported in Quantum GIS [4].
78 3 GIS Applications for Irrigation Management
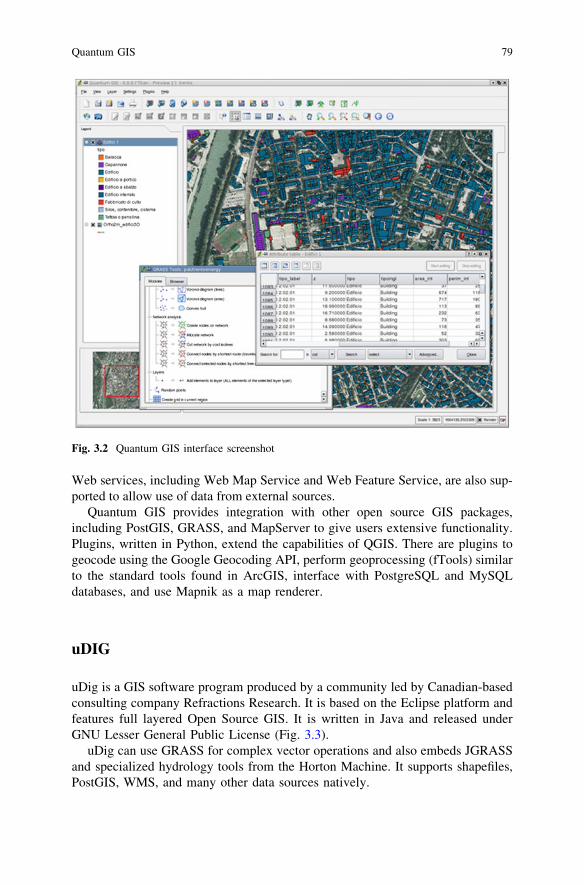
Web services, including Web Map Service and Web Feature Service, are also sup-ported to allow use of data from external sources.
Quantum GIS provides integration with other open source GIS packages,including PostGIS, GRASS, and MapServer to give users extensive functionality.Plugins, written in Python, extend the capabilities of QGIS. There are plugins togeocode using the Google Geocoding API, perform geoprocessing (fTools) similarto the standard tools found in ArcGIS, interface with PostgreSQL and MySQLdatabases, and use Mapnik as a map renderer.
uDIG
uDig is a GIS software program produced by a community led by Canadian-basedconsulting company Refractions Research. It is based on the Eclipse platform andfeatures full layered Open Source GIS. It is written in Java and released underGNU Lesser General Public License (Fig. 3.3).
uDig can use GRASS for complex vector operations and also embeds JGRASSand specialized hydrology tools from the Horton Machine. It supports shapefiles,PostGIS, WMS, and many other data sources natively.
Fig. 3.2 Quantum GIS interface screenshot
Quantum GIS 79
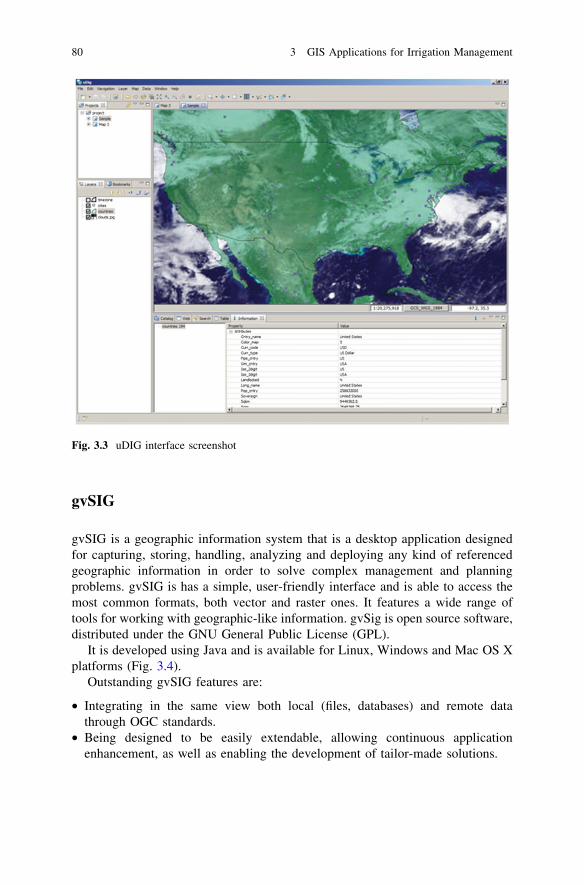
gvSIG
gvSIG is a geographic information system that is a desktop application designedfor capturing, storing, handling, analyzing and deploying any kind of referencedgeographic information in order to solve complex management and planningproblems. gvSIG is has a simple, user-friendly interface and is able to access themost common formats, both vector and raster ones. It features a wide range oftools for working with geographic-like information. gvSig is open source software,distributed under the GNU General Public License (GPL).
It is developed using Java and is available for Linux, Windows and Mac OS Xplatforms (Fig. 3.4).
Outstanding gvSIG features are:
• Integrating in the same view both local (files, databases) and remote datathrough OGC standards.
• Being designed to be easily extendable, allowing continuous applicationenhancement, as well as enabling the development of tailor-made solutions.
Fig. 3.3 uDIG interface screenshot
80 3 GIS Applications for Irrigation Management
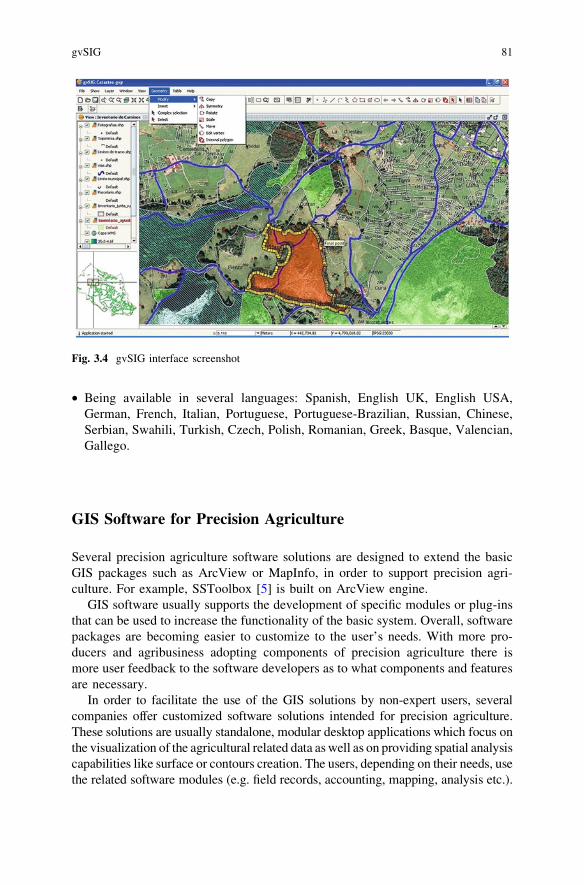
• Being available in several languages: Spanish, English UK, English USA,German, French, Italian, Portuguese, Portuguese-Brazilian, Russian, Chinese,Serbian, Swahili, Turkish, Czech, Polish, Romanian, Greek, Basque, Valencian,Gallego.
GIS Software for Precision Agriculture
Several precision agriculture software solutions are designed to extend the basicGIS packages such as ArcView or MapInfo, in order to support precision agri-culture. For example, SSToolbox [5] is built on ArcView engine.
GIS software usually supports the development of specific modules or plug-insthat can be used to increase the functionality of the basic system. Overall, softwarepackages are becoming easier to customize to the user’s needs. With more pro-ducers and agribusiness adopting components of precision agriculture there ismore user feedback to the software developers as to what components and featuresare necessary.
In order to facilitate the use of the GIS solutions by non-expert users, severalcompanies offer customized software solutions intended for precision agriculture.These solutions are usually standalone, modular desktop applications which focus onthe visualization of the agricultural related data as well as on providing spatial analysiscapabilities like surface or contours creation. The users, depending on their needs, usethe related software modules (e.g. field records, accounting, mapping, analysis etc.).
Fig. 3.4 gvSIG interface screenshot
gvSIG 81
In order to acquire data from sensors they provide import utilities so there is no realtime connection to the field information. Recently some systems started providingaccess to external databases such as weather prediction or soil databases. Collabo-ration with mobile devices for in-field mapping and information collection is alsoavailable in some platforms. Farm Works office solutions [6] include field records,farm accounting, herd management, mapping, and water management. A similarsolution is available from Agvance [7].
Recently a few solutions have come about that are Internet-based. Such anapproach is followed by SST Software. SST Software offers FarmRite [8], anintegrated platform that can facilitate the precision agriculture needs by providingaccess to several web based services. The company offers to the users, desktop andmobile interfaces in order to collect data, a cloud-based platform to store, visualizeand analyze data, as well as expert services in order to provide more complexproducts on demand. These are provided as a result of advanced spatial analysis.
An approach similar to that of the SST has been adopted by AgriCon [9]. TheAgriCon precision farming data portal offers an online platform for farmers to saveand manage all of their data in a portal independent of individual service providers,software providers and manufacturers of agricultural technology.
SSToolBox
Developed by the SST Software, SSToolbox is a GIS for crop consultants, fer-tilizer/chemical dealers, educators, researchers, and farm managers. SSToolboxuses the farm field boundary to organize all pertinent information relating to thefield, such as soil types, soil fertility, yield results, hybrid/variety selections,remotely-sensed imagery, aerial photos, chemical applications, field scouting, andmore.
The solution provides analysis for decision support, yield data processing toolsand creates fertility recommendations.
SSToolKit
Also provided by SST Software, SSToolkit is an economical GIS designed forfarmers who have access to the more comprehensive analytical services providedby their local input supplier or crop consultant. Similar to the SSToolBox, theSSToolkit uses the farm field boundary to organize all pertinent informationrelating to the field and supports functionality similar to that of the SSToolBox.
82 3 GIS Applications for Irrigation Management
Farm Works Office Desktop
Farm Works Software company, provides a suite of tools for farmers:
• Farm WorksTM View software is a tool for reading and writing job data topopular precision farming devices.
• Farm WorksTM Mapping software is a mapping and field record keepingsolution.
• Farm WorksTM Accounting software provides a general ledger and enterprisingsolution while maintaining a complete field record keeping system.
• Farm WorksTM Surface software is an analysis and design tool for use with theTrimble� WM-DrainTM farm drainage solution. Surface ensures the optimalplacement of tile and surface drains in both surface and sub-surface drainagewater management projects, helping to drain fields adequately and increase cropyields.
The system provides support for keeping track of information relevant to:planting, application, harvest, soil analysis, field records, satellite imagery, etc.
Agvance Mapping
Provided by SSI, Agvance Mapping is a GIS solution intended for analysis andsite-specific mapping, aimed at agricultural retailers. It can generate industry filesto facilitate precision agriculture applications while integrating the use of mapsthroughout the entire farming operation.
The functionality provided by the Agvance Mapping includes:
• A mapping interface for the creation of boundaries and related map layers.• Interactive tree navigation to facilitate switching between farm, grower and field
level data.• Customizable surface maps and thematic layers that can be automatically
generated from spatial data stored in Agvance or dynamically from importeddata.
• Soil types and related label attributes can be imported to create soil layerpolygons within the current selected field or farm.
• Harvest data can be imported for historical analysis and to influence futurerecommendations
• Soil tests and recommendations can easily be imported from labs, consultants,and/or in industry supported formats.
• Flexible grower map books can be generated to include soil types, test levels,surface maps, yield maps and as-applied data with several printing options.
Farm Works Office Desktop 83
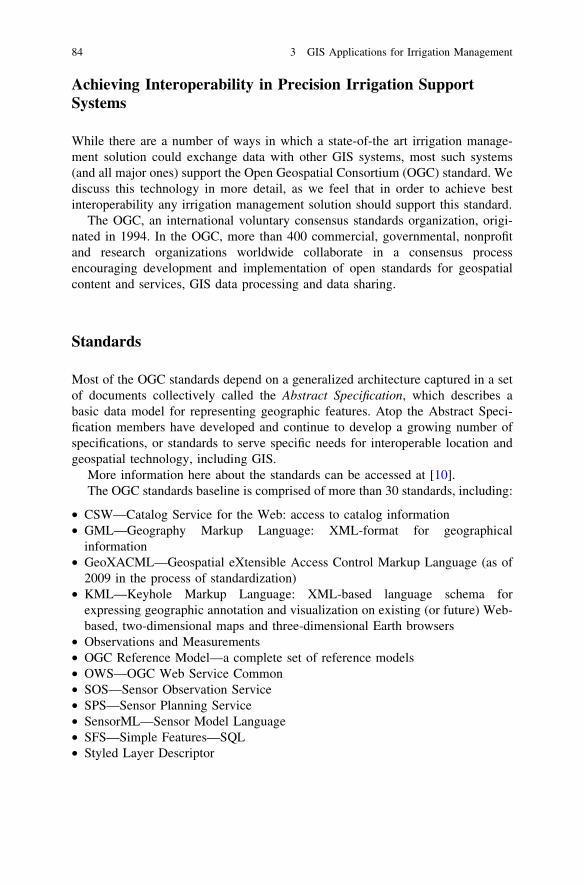
Achieving Interoperability in Precision Irrigation SupportSystems
While there are a number of ways in which a state-of-the art irrigation manage-ment solution could exchange data with other GIS systems, most such systems(and all major ones) support the Open Geospatial Consortium (OGC) standard. Wediscuss this technology in more detail, as we feel that in order to achieve bestinteroperability any irrigation management solution should support this standard.
The OGC, an international voluntary consensus standards organization, origi-nated in 1994. In the OGC, more than 400 commercial, governmental, nonprofitand research organizations worldwide collaborate in a consensus processencouraging development and implementation of open standards for geospatialcontent and services, GIS data processing and data sharing.
Standards
Most of the OGC standards depend on a generalized architecture captured in a setof documents collectively called the Abstract Specification, which describes abasic data model for representing geographic features. Atop the Abstract Speci-fication members have developed and continue to develop a growing number ofspecifications, or standards to serve specific needs for interoperable location andgeospatial technology, including GIS.
More information here about the standards can be accessed at [10].The OGC standards baseline is comprised of more than 30 standards, including:
• CSW—Catalog Service for the Web: access to catalog information• GML—Geography Markup Language: XML-format for geographical
information• GeoXACML—Geospatial eXtensible Access Control Markup Language (as of
2009 in the process of standardization)• KML—Keyhole Markup Language: XML-based language schema for
expressing geographic annotation and visualization on existing (or future) Web-based, two-dimensional maps and three-dimensional Earth browsers
• Observations and Measurements• OGC Reference Model—a complete set of reference models• OWS—OGC Web Service Common• SOS—Sensor Observation Service• SPS—Sensor Planning Service• SensorML—Sensor Model Language• SFS—Simple Features—SQL• Styled Layer Descriptor
84 3 GIS Applications for Irrigation Management
• WCS—Web Coverage Service: provides coverage objects from a specifiedregion
• WFS—Web Feature Service: for retrieving or altering feature descriptions• WMS—Web Map Service: provides map images• WMTS—Web Map Tile Service: provides map image tiles• WPS—Web Processing Service: remote processing service
These standards were originally built on the HTTP web services paradigm formessage-based interactions in web-based systems. However, in the last year themembers have started working on defining a common approach for SOAPprotocol and WSDL bindings. Considerable progress has been made in definingRepresentational State Transfer (REST) web services.
The OpenGIS� Web Map Service Interface Standard
The OpenGIS� Web Map Service Interface Standard (WMS) provides a simpleHTTP interface for requesting geo-registered map images from one or more dis-tributed geospatial databases. A WMS request defines the geographic layer(s) andarea of interest to be processed. The response to the request is one or more geo-registered map images (returned as JPEG, PNG, etc.) that can be displayed in abrowser application. The interface also supports the ability to specify whether thereturned images should be transparent so that layers from multiple servers can becombined or not.
The OpenGIS� Web Feature Service Interface Standard
The OpenGIS� Web Feature Service Interface Standard (WFS) provides aninterface allowing requests for geographical features across the web using plat-form-independent calls. One can think of geographical features as the ‘‘sourcecode’’ behind a map, whereas the WMS interface or online mapping portals likeGoogle Maps return only an image, which end-users cannot edit or spatiallyanalyze. The XML-based GML furnishes the default payload-encoding fortransporting the geographic features, but other formats like shapefiles can alsoserve for transport. In early 2006, the OGC members approved the OpenGIS GMLSimple Features Profile. This profile is designed to both increase interoperabilitybetween WFS servers and to improve the ease of implementation of the WFSstandard.
The WFS specification defines interfaces for describing data manipulationoperations of geographic features. Data manipulation operations include theability to:
Standards 85
• Get or query features based on spatial and non-spatial constraints.• Create a new feature instance.• Delete a feature instance.• Update a feature instance.
The OpenGIS� Web Coverage Service Interface Standard
The OpenGIS� Web Coverage Service Interface Standard (WCS) provides aninterface allowing requests for geographical coverages across the web usingplatform-independent calls. The coverages are objects (or images) in a geo-graphical area. The basic Web Coverage Service allows querying and retrieval ofcoverages.
A WCS describes discovery, query, or data transformation operations. Theclient generates the request and posts it to a web feature server using HTTP. Theweb feature server then executes the request. The WCS specification uses HTTP asthe distributed computing platform, although this is not a hard requirement.
There are two encodings defined for WCS operations:
• XML (amenable to HTTP POST/SOAP).• Keyword-Value pairs (amenable to HTTP GET/Remote procedure call).
Internet Services Interoperability
The OpenGIS� Web Processing Service Interface Standard
The OpenGIS� Web Processing Service (WPS) Interface Standard provides rulesfor standardizing how inputs and outputs (requests and responses) for invokinggeospatial processing services, such as polygon overlay, as a Web service. TheWPS standard defines how a client can request the execution of a process, and howthe output from the process is handled. It defines an interface that facilitates thepublishing of geospatial processes and clients’ discovery of and binding to thoseprocesses. The data required by the WPS can be delivered across a network or theycan be available at the server. WPS can describe any calculation (i.e. process)including all of its inputs and outputs, and trigger its execution as a Web service.WPS supports simultaneous exposure of processes via HTTP GET, HTTP POST,and SOAP, thus allowing the client to choose the most appropriate interfacemechanism. The specific processes served up by a WPS implementation aredefined by the owner of that implementation. Although WPS was designed to workwith spatially referenced data, it can be used with any kind of data.
86 3 GIS Applications for Irrigation Management
WPS makes it possible to publish, find, and bind to processes in a standardizedand thus interoperable fashion. Theoretically, it is transport/platform neutral (likeSOAP), but in practice it has only been specified for HTTP.
The OpenGIS� Sensor Observation Service
The OpenGIS� Sensor Observation Service (SOS) standard is applicable to usecases in which sensor data needs to be managed in an interoperable way. Thisstandard defines a Web service interface which allows querying observations,sensor metadata, as well as representations of observed features. Further, thisstandard defines means to register new sensors and to remove existing ones. Also,it defines operations to insert new sensor observations. This standard defines thisfunctionality in a binding independent way; two bindings are specified in thisdocument: a KVP binding and a SOAP binding.
Observations and Measurements: XML Implementation
This standard specifies an XML implementation for the OGC and ISO Observa-tions and Measurements (O&M) conceptual model (OGC Observations andMeasurements v2.0 also published as ISO/DIS 19156), including a schema forSampling Features. This encoding is an essential dependency for the OGC SensorObservation Service (SOS) Interface Standard. More specifically, this standarddefines XML schemas for observations, and for features involved in samplingwhen making observations. These provide document models for the exchange ofinformation describing observation acts and their results, both within and betweendifferent scientific and technical communities.
OpenGIS� Sensor Model Language (SensorML)
The OpenGIS� Sensor Model Language Encoding Standard (SensorML) specifiesmodels and XML encoding that provide a framework within which the geometric,dynamic, and observational characteristics of sensors and sensor systems can bedefined. There are many different sensor types, from simple visual thermometers tocomplex electron microscopes and earth observing satellites. These can all besupported through the definition of atomic process models and process chains.Within SensorML, all processes and components are encoded as applicationschema of the Feature model in the Geographic Markup Language (GML) Version3.1.1. This is one of the OGC Sensor Web Enablement (SWE) [11] suite ofstandards. For additional information on SensorML [12].
Internet Services Interoperability 87

OpenGIS� Sensor Planning Service ImplementationStandard
The OpenGIS� Sensor Planning Service Interface Standard (SPS) defines inter-faces for queries that provide information about the capabilities of a sensor andhow to task the sensor. The standard is designed to support queries that have thefollowing purposes: to determine the feasibility of a sensor planning request; tosubmit and reserve/commit such a request; to inquire about the status of such arequest; to update or cancel such a request; and to request information about otherOGC Web services that provide access to the data collected by the requested task.This is one of the OGC Sensor Web Enablement (SWE) [11] suite of standards.
OpenGIS� SWE Service Model Implementation Standard
This standard currently defines eight packages with data types for common useacross OGC Sensor Web Enablement (SWE) services. Five of these packagesdefine operation request and response types. The packages are:
1) Contents—Defines data types that can be used in specific services that provide(access to) sensors;
2) Notification—Defines the data types that support provision of metadata aboutthe notification capabilities of a service as well as the definition and encodingof SWES events;
3) Common—Defines data types common to other packages;4) Common Codes—Defines commonly used lists of codes with special
semantics;5) DescribeSensor—Defines the request and response types of an operation used
to retrieve metadata about a given sensor;6) UpdateSensorDescription—Defines the request and response types of an
operation used to modify the description of a given sensor;7) InsertSensor—Defines the request and response types of an operation used to
insert a new sensor instance at a service;8) DeleteSensor—Defines the request and response types of an operation used to
remove a sensor from a service.
These packages use data types specified in other standards.
88 3 GIS Applications for Irrigation Management

OpenGIS� Web Coverage Processing Service (WCPS)Language Interface Standard
The OpenGIS� Web Coverage Service Interface Standard (WCS) defines a protocol-independent language for the extraction, processing, and analysis of multi-dimen-sional gridded coverages (see: http://www.opengeospatial.org/ogc/glossary/c)representing sensor, image, or statistics data. Services implementing this languageprovide access to original or derived sets of geospatial coverage information, informs that are useful for client-side rendering, input into scientific models, and otherclient applications. Further information about WPCS can be found at the WCPSService page of the OGC Network [13].
Impact of Latest European Directives and Projects
The precision irrigation and agriculture systems are intimately connected andshould be synced with several recent global and EU directives, initiatives andprojects. These initiatives deal mostly with the agriculture and water managementas an integral part of environment and Earth observation topic. In particular, thereis a global push to make earth observation systems interoperable. We discussbriefly the most prominent of these initiatives and projects.
INSPIRE
The EU INSPIRE Directive [14], which entered into force in May 2007, estab-lishes an infrastructure for spatial information in Europe to support Communityenvironmental policies, and policies or activities which may have an impact on theenvironment. Its goal is to ensure cross-border interoperability.
INSPIRE is based on the infrastructures for spatial information established andoperated by the 27 Member States of the European Union. The Directive addresses34 spatial data themes needed for environmental applications, with key compo-nents specified through technical implementing rules. This makes INSPIRE aunique example of a legislative ‘‘regional’’ approach.
Legislation
Directive 2007/2/EC of the European Parliament and of the Council of 14 March2007 establishing an Infrastructure for Spatial Information in the EuropeanCommunity (INSPIRE) was published in the official Journal on the 25th April2007. The INSPIRE Directive entered into force on the 15th May 2007.
OpenGIS� Web Coverage Processing Service 89

To ensure that the spatial data infrastructures of the Member States are com-patible and usable in a Community and transboundary context, the Directiverequires that common Implementing Rules (IR) are adopted in a number of specificareas (Metadata, Data Specifications, Network Services, Data and Service Sharingand Monitoring and Reporting). These IRs are adopted as Commission Decisionsor Regulations, and are binding in their entirety. The Commission is assisted in theprocess of adopting such rules by a regulatory committee composed of repre-sentatives of the Member States and chaired by a representative of the Commission(this is known as the Comitology procedure).
Legal acta relevant to INSPIRE (and, therefore, precision irrigation) include:
• Directive 2007/2/EC of the European Parliament and of the Council of 14 March2007 establishing an Infrastructure for Spatial Information in the EuropeanCommunity (INSPIRE) 14.03.2007
• INSPIRE Metadata Regulation 03.12.2008• Commission Decision regarding INSPIRE monitoring and reporting 05.06.2009• Commission Regulation (EC) No 976/2009 of 19 October 2009 implementing
Directive 2007/2/EC of the European Parliament and of the Council as regardsthe Network Services 19.10.2009
• Corrigendum to INSPIRE Metadata Regulation 15.12.2009• Regulation on INSPIRE Data and Service Sharing 29.03.2010• Commission Regulation amending Regulation (EC) No 976/2009 as regards
download services and transformation service 10.12.2010• COMMISSION REGULATION implementing Directive 2007/2/EC of the
European Parliament and of the Council as regards interoperability of spatialdata sets and services 10.12.2010
• COMMISSION REGULATION amending Regulation 1089/2010 as regardsinteroperability of spatial data sets and services 05.02.2011
GEOSS
The Global Earth Observation System of Systems (GEOSS) is in many ways aglobal initiative equivalent/complementary to INSPIRE, where the intention is tobuild a global data-sharing system. This is an initiative by the Group on EarthObservations (GEO) and the system is being developed on the basis of a 10-YearImplementation Plan running from 2005 to 2015.
GEOSS seeks to connect the producers of environmental data and decision-support tools with the end users of these products, with the aim of enhancing therelevance of Earth observations to global issues. The result is to be a global publicinfrastructure that generates comprehensive, near-real-time environmental data,information and analyses for a wide range of users.
Agriculture is stated as the first of GEOSS societal benefits. The GEOSS is beingconstructed to help farmers, fishers and policymakers maximize productivity and
90 3 GIS Applications for Irrigation Management

food security while preserving ecosystems and biodiversity. GEO also aims tosupport the sustainable management of agriculture by disseminating weather fore-casts, early warnings of storms and other extreme events, water pollution, long-termforecasts of likely climate change impacts, and information on water supplies. Theseand other data are being integrated so that they can be used in models for simulatingand predicting agricultural trends. Related activities include mapping the changingdistribution of croplands around the world, advancing the accuracy of measurementsof biomass (the total amount of living material in a given habitat or population),reporting agricultural statistics in a more timely manner, and improving forecasts ofshortfalls in crop production and food supplies.
GIGAS
GIGAS (GEOSS, INSPIRE and Global Monitoring for Environment and Security(GMES) an Action in Support) was a European project co-funded by the EuropeanCommission as a Support Action under Grant Agreement number 224274 in theperiod June 2008 to May 2010 [15].
The initiative of GIGAS continues to promote the coherent and interoperabledevelopment of the GMES, INSPIRE and GEOSS initiatives through their con-certed adoption of standards, protocols, and open architectures. Given the com-plexity and dynamics of each initiative and the large number of stakeholdersinvolved, the key added value of GIGAS has been on bringing together the leadingorganizations in Europe who are able to make a difference and achieve a trulysynergistic convergence of the initiatives. Among them, the Joint Research Centreis the technical coordinator of INSPIRE, the European Space Agency is respon-sible for the GMES space component, and both organizations together with a thirdpartner, the Open Geospatial Consortium play a leading role in the development ofthe GEOSS architecture and components. This core group is supported by keyindustrial players in the space and geographic information sectors, with the sci-entific leadership of the Fraunhofer Institute.
This consortium followed the project objectives set through an iterative andconsensus-based approach which includes: in-depth analysis of the requirementsand barriers to interoperability in each of the three initiatives and strategic FP 6/FP 7projects; comparative evaluation of this activity as input to a forum of key stake-holders at a European level; consensus building in the forum on how to update andintegrate the architectures of GMES, INSPIRE and GEOSS, and influence standardsdevelopment and adoption. From these recommendations followed actions to shapethe direction of the initiatives and to define a roadmap for future development,including the key research topics to be addressed to sustain the convergence of theinitiatives. GIGAS results and recommendations contributed to the emergence of acollaborative information space for accessing and sharing distributed environmentalresources in Europe. This represents a milestone towards building a Single Infor-mation Space in Europe for the Environment.
Impact of Latest European Directives and Projects 91
EuroGEOSS
EuroGEOSS is a large scale integrated project in the Seventh Framework pro-gramme of the European Commission [4]. It is part of the thematic area:‘‘ENV.2008.4.1.1.1: European environment Earth observation system supportingINSPIRE and compatible with GEOSS’’. EuroGEOSS demonstrates the addedvalue to the scientific community and society of making existing systems andapplications interoperable and used within the GEOSS and INSPIRE frameworks.
e project builds an initial operating capacity for a European Environment EarthObservation System in the three strategic areas of Drought, Forestry and Biodi-versity. It then undertakes the research necessary to develop this further into anadvanced operating capacity that provides access not just to data but also toanalytical models made understandable and useable by scientists from differentdisciplinary domains.
This concept of inter-disciplinary interoperability requires research in advancedmodelling from multi-scale heterogeneous data sources, expressing models asworkflows of geo-processing components reusable by other communities, andability to use natural language to interface with the models. The extension ofINSPIRE and GEOSS components with concepts emerging in the Web 2.0 com-munities in respect to user interactions and resource discovery, also supports thewider engagement of the scientific community with GEOSS as a powerful meansto improve the scientific understanding of the complex mechanisms driving thechanges that affect our planet. Ultimately, EuroGEOSS outcomes will be extendedto issues on a global scale through our sustainability initiative to support userunderstanding and applications for improving societal conditions.
Of specific interest to precision irrigation is the European Drought Observatorythat EuroGEOSS will develop within the framework of INSPIRE specificationsand GEOSS interoperability arrangements. The project will establish a droughtmetadata catalog to allow access to resources for drought monitoring. It will befully integrated with local and national systems in Europe and internationaldrought early warning systems as a European contribution to a Global DroughtEarly Warning System.
References
1. Pitney-Bowes, MapInfo Suite, http://www.pb.com/software/Location-Intelligence/MapInfo-Suite/ (Accessed March 27, 2013).
2. SSTsoftware, SSToolBox, http://www.sstsoftware.com/sstoolbox.htm (Accessed March 27,2013).
3. María Soledad Escolar Díaz ‘‘A generic software architecture for portable applications inheterogeneous wireless sensor networks’’, Doctoral Thesis 2010, Universidad Carlos III deMadrid. http://e-archivo.uc3m.es/bitstream/10016/9188/1/tesis-SoledadEscolar-Marzo2010.pdf (Accessed March 28, 2013).
92 3 GIS Applications for Irrigation Management

4. OGC, Sensor Web Enablement (SWE), http://www.opengeospatial.org/ogc/markets-technologies/swe (Accessed March 27, 2013).
5. SSTsoftware, FarmRite, http://www.sstsoftware.com/farmrite.htm (Accessed March 27,2013).
6. Agvance, Agvance Mapping, http://www.agvance.net/mapping.html (Accessed March 27,2013).
7. Agricon, More than technology: Precision Farming is agriculture, http://www.agricon.de/en/products/ (Accessed March 27, 2013).
8. FarmWorks, Information management systems, http://www.farmworks.com/products/office(Accessed March 27, 2013).
9. OGC, OGC� Standards and Supporting Documents, http://www.opengeospatial.org/standards (Accessed March 27, 2013).
10. OGC, SensorML, http://www.ogcnetwork.net/SensorML (Accessed March 27, 2013).11. QuantumGIS, http://www.qgis.org/ (Accessed March 27, 2013).12. OGC, Glossary of Terms - C, http://www.opengeospatial.org/ogc/glossary/c (Accessed
March 27, 2013).13. Infrastructure for Spatial Information in the European Community (INSPIRE), http://
inspire.jrc.ec.europa.eu/ (Accessed March 27, 2013).14. GIGAS, http://www.thegigasforum.eu (Accessed March 27, 2013).15. EuroGEOSS, http://www.eurogeoss.eu (Accessed March 27, 2013).
References 93
Chapter 4Concluding Remarks
Within this text an overview of the state-of-the-art in terms of applications ofinformation and communication technology (ICT) for irrigation management hasbeen provided. The applications of ICT to precision agriculture and emerging field ofprecision irrigation management draw mainly from three domains: wireless sensornetworks, remote sensing and geographic information systems. Wireless sensornetworks and remote sensing provide data that can be used to assess the water needsof crops and predict precipitation and soil moisture dynamics in the near future,while the GISs are needed to store data and present it to the shareholders.
Wireless sensor networks and their application to precision agriculture aredescribed as a technology that promises to deliver unparalleled spatial and tem-poral resolution, when monitoring of agricultural crops is concerned. Differentsensors can be used, as well as different communication protocols. This reportprovides a survey of the major solutions available and discusses their advantagesand shortcomings.
Remote sensing in agriculture is a field that traditionally relies on the use ofsatellite images to assess the health and the needs of crops. When irrigation isconcerned satellite imagery can be used to derive myriad geophysical and bio-physical parameters, which can be useful in monitoring a large part of the watercycle, as well as crop health and water requirements at any given point in time.The overview of available and upcoming satellite products, provided in this report,is intended as a succinct repository of knowledge regarding the state-of-the-artsatellite products that can be of interest for irrigation management. In addition tocomparing different products in terms of their potential, availability and precision,special care was given to state the ways in which a practitioner can obtain thisdata, as well as the format in which one can expect to get it. While higher spatialand temporal resolution is, naturally, favorable, these requirements can be relaxedwhen the data is combined with that acquired by the WSNs. On the otherhand satellite data can and should be used to derive the optimal placement andarchitecture of the WSN. While there is clear potential in combining the twotechnologies, this subject should be explored further in terms of irrigationmanagement.
D. Culibrk et al., Sensing Technologies For Precision Irrigation,SpringerBriefs in Electrical and Computer Engineering,DOI: 10.1007/978-1-4614-8329-8_4, � The Author(s) 2014
95

GIS is a mature field with numerous commercial and open-source solutionsavailable. The report discusses those most commonly used and provides anoverview of their functionality. Although the technology has been around for quitesome time, systems intended for precision agriculture are a novel development andnone exist which specialize in precision irrigation management.
When designing or purchasing precision agriculture systems, one should bemindful of initiatives such as GEOSS, EuroGEOSS and the INSPIRE directive ofthe EU, which deal with ways to share spatial information and promise widerapplicability of systems that support them. The integration will also enable useof data shared by other agencies to aid irrigation management. The precisionirrigation systems should strive towards compatibility and interoperability with aswide a number of other solutions.
96 4 Concluding Remarks