Self-assembly of thiolated cyanine aggregates on Au(111) and Au nanoparticle surfaces
12
Nanoscale c1nr11039j PAPER 1 Self-assembly of thiolated cyanine aggregates on Au(111) and Au nanoparticle surfaces Guillermo O. Men endez, Emiliano Cort es, Doris Grumelli, * Lucila P. M endez De Leo, Federico J. Williams, Nicol as G. Tognalli, Alejandro Fainstein, Mar ıa Elena Vela, Elizabeth A. Jares-Erijman and Roberto C. Salvarezza J-Aggregates of CNN molecules in solution are preferentially adsorbed on the Au(111) surface but adsorbed CNN monomers cannot organize into aggregates on the substrate surface: S–Au interaction is not able to disorganize the large J-aggregates stabilized by p–p stacking but it is strong enough to hinder the p–p stacking when CNNs are chemisorbed as monomers. 9 ART C1NR11039J_GRABS 1 5 10 15 20 25 30 35 40 45 50 1 5 10 15 20 25 30 35 40 45 50
-
Upload
independent -
Category
Documents
-
view
2 -
download
0
Transcript of Self-assembly of thiolated cyanine aggregates on Au(111) and Au nanoparticle surfaces

9
1
5
10
15
20
25
30
35
40
45
50
Nanoscale c1nr11039j
PAPER
1
Self-assembly of thiolated cyanine aggregates on Au(111)
and Au nanoparticle surfaces
Guillermo O. Men�endez, Emiliano Cort�es, Doris Grumelli,*
Lucila P. M�endez De Leo, Federico J. Williams,Nicol�as G. Tognalli, Alejandro Fainstein, Mar�ıa Elena Vela,Elizabeth A. Jares-Erijman and Roberto C. Salvarezza
J-Aggregates of CNN molecules in solution are preferentiallyadsorbed on the Au(111) surface but adsorbed CNN monomerscannot organize into aggregates on the substrate surface: S–Auinteraction is not able to disorganize the large J-aggregatesstabilized by p–p stacking but it is strong enough to hinder the
1
5
10
15
20
25
30
35
40
45
p–p stacking when CNNs are chemisorbed as monomers.
ART � C1NR11039J_GRABS
50

11
5
10
15
20
25
30
35
40
45
50
Dynamic Article LinksC<Nanoscale
Cite this: DOI: 10.1039/c1nr11039j
www.rsc.org/nanoscale PAPER
1
5
Self-assembly of thiolated cyanine aggregates on Au(111) and Aunanoparticle surfaces†
Guillermo O.Men�endez,a Emiliano Cort�es,bDoris Grumelli,*b Lucila P. M�endez De Leo,c Federico J. Williams,c
Nicol�as G. Tognalli,d Alejandro Fainstein,d Mar�ıa Elena Vela,b Elizabeth A. Jares-Erijman‡a
and Roberto C. Salvarezzab
Received 6th August 2011, Accepted 26th October 2011
DOI: 10.1039/c1nr11039j
1015
20
25
Heptamethinecyanine J-aggregates display sharp, intense fluorescence emission making them attractive
candidates for developing a variety of chem-bio-sensing applications. They have been immobilized on
planar thiol-covered Au surfaces and thiol-capped Au nanoparticles by weak molecular interactions. In
this work the self-assembly of novel thiolated cyanine (CNN) on Au(111) and citrate-capped AuNPs
from solutions containing monomers and J-aggregates has been studied by using STM, XPS, PM-
IRRAS, electrochemical techniques and Raman spectroscopy. Data show that CNN species adsorb on
the Au surfaces by forming thiolate–Au bonds. We found that the J-aggregates are preferentially
adsorbed on the Au(111) surface directly from the solution while adsorbed CNN monomers cannot
organize into aggregates on the substrate surface. These results indicate that the CNN–Au interaction is
not able to disorganize the large J-aggregates stabilized by p–p stacking to optimize the S–Au binding
site but it is strong enough to hinder the p–p stacking when CNNs are chemisorbed as monomers. The
optical properties of the J-aggregates remain active after adsorption. The possibility of covalently
bonding CNN J-aggregates to Au planar surfaces and Au nanoparticles controlling the J-aggregate/Au
distance opens a new path regarding their improved stability and the wide range of biological
applications of both CNN and AuNP biocompatible systems.
30
35
1. Introduction
Cyanine (CNN) is a family of cationic dyes typically consisting of
two nitrogen containing heterocyclic ring systems, which include
a chain of conjugated double bonds. These dyes have found
widespread use as sensitizers for color photography,1 as fluo-
rescent labels for biomolecules (proteins and nucleic acids) either
through covalent or noncovalent bonding,2 photoinitiators in
photopolymerization,3 DNA sequencing,4 determination of
nucleic acids5 and proteins,6 flow cytometry,7 near laser dyes,8
aCHIDECAR, Departamento de Qu�ımica Org�anica, FCEN, UBA, CiudadUniversitaria, Pabell�on II, Buenos Aires, 1428, ArgentinabInstituto de Investigaciones Fisicoqu�ımicas Te�oricas y Aplicadas(INIFTA), Universidad Nacional de La Plata-CONICET, Sucursal 4Casilla de Correo 16 La Plata, 1900 Buenos Aires, Argentina. E-mail:[email protected], CONICET, Departamento de Qu�ımica Inorg�anica,Anal�ıtica y Qu�ımica F�ısica FCEN, UBA, Ciudad Universitaria, Pabell�onII, Buenos Aires, 1428, ArgentinadCentro At�omico Bariloche and Instituto Balseiro, Comisi�on Nacional deEnerg�ıa At�omica and Universidad Nacional de Cuyo, San Carlos deBariloche, 8400, R�ıo Negro, Argentina
† Electronic supplementary information (ESI) available. See DOI:10.1039/c1nr11039j
‡ In memory of Prof. Elizabeth A. Jares-Erijman.
ART � C1NR
This journal is ª The Royal Society of Chemistry 2011
40
45
50
optical recording and storage media,1,9 as well as ultra-trace
determinations.10 CNNs are environmentally sensitive probes for
reporting on local properties such as viscosity, polarity, and pH-
sensitive fluorescent probes for intracellular studies11 due to the
fact that near infrared dyes absorption is poorly adsorbed by
biomolecules, so it can penetrate deeply into tissues avoiding cell
autofluorescence. These dyes exhibit very high extinction coeffi-
cients so it is possible to conceive their detection at extremely low
levels such as in monolayers on metal surfaces using absorption
spectroscopy.
One peculiar and interesting property of cyanines is the ability
to form spontaneously aggregates in solution, and at liquid/solid
and liquid/air interfaces.12 The self-assembly of these amphiphilic
dyes into aggregates is determined by the sensitive balance
between different intermolecular forces: the dispersion force of
the cyanine backbone, the entropic forces of the alkyl chains, the
electrostatic forces and H-bonding of the ionic groups, and
the general van der Waals forces.13,14 It has been estimated that
the free energy of aggregation for one dimer is high, in the order
of 20 kcal mol�1.15 The aggregation behavior of cyanine dyes is
important because it markedly influences the photophysical and
photochemical properties. In fact, the absorption maxima are
shifted to shorter wavelengths (H-aggregation) or sharply shifted
to longer wavelengths (J-aggregation). It is commonly accepted
11039J
Nanoscale, 2011, xx, 1–11 | 1

2
Fig. 1 Chemical structure of the novel thiolated heptamethinecyanine
dye used in this work.
1
5
10
15
20
25
30
35
40
45
50
55
1
5
10
15
20
25
30
35
40
45
50
55
that a J-aggregate is a polymolecular state in which planar dye
molecules are packed together in a plane-to-plane fashion
stabilized by p–p stacking. The shift angle (a) in a slipped deck
of molecules determines the spectral absorption of the aggregate.
Calculations demonstrated that a ¼ 60� corresponds to H-
aggregates, whereas a ¼ 30� and a ¼ 19� correspond to J-
aggregates. The J-aggregation process is most typical of poly-
methine dyes. J-Aggregates display sharp, intense fluorescence
emission. Spectral properties of J- and H-aggregates make them
attractive candidates for developing a variety of chem-bio-
sensing applications.
The possibility of immobilizing cyanine species at solid
surfaces has been explored on different substrates.16,17 In
particular, adsorption of cyanine on gold has attracted consid-
erable attention because of the remarkable stability of Au to
oxidation and its well-defined optical and electronic properties.
In this way it has been reported that cyanine dyes can organize as
J-aggregates on a self-assembled monolayer of 11-mercaptoun-
decanoic acid (HS–(CH2)10–COOH)18 and cysteamine19 on Au
surfaces. In this case 1.3 � 1014 molecules cm�2 dye molecules are
individually anchored to the surface amino groups in the form of
ammonium sulfonates. Formation of J-aggregates on gold
nanoparticle assemblies has also been reported during self-
assembly of cyanine on negatively charged Au nanoparticles
(AuNPs).20 From the optical point of view, J-aggregates assem-
bled on plasmonic substrates have recently become the focus of
strong attention due to the interaction of the aggregate localized
excitations with the intense near field of surface plasmons. This
results in the formation of mixed states, as a consequence of the
coupling between excitons and plasmons (plexcitons). These
artificial-new states have important implications in optoelec-
tronics and nonlinear optical devices, functional metamaterials
and surface-enhanced molecular sensing, among others.21
However, in the examples discussed above the J-aggregates are
only weakly bonded by van der Waals forces to the thiol SAM-
covered Au surface and charged nanoparticles. In this context
a thiolated CNN molecule should provide a more effective
anchor to the Au surface. However, the question is if the S–Au
bond, that dictates optimal 0.5 nm nearest neighbor distances in
thiols, is strong enough to effectively compete with the p–p
stacking of the CNN molecules in the J-aggregates (0.33 nm)
leading to aggregate disorganization. Also the thiolated CNN–
Au interaction is expected to be stronger on the surface of
AuNPs.22
Therefore, the survival or not of the aggregates on these Au
surfaces is an interesting point that deserves special attention.
Besides, the structure of self-assembled chromophores on Au
surfaces is not well understood because the chromophore
component is usually much larger than alkyl chains, thus
avoiding long-range order in the SAMs. In fact, it is well known
that the surface order in SAMs of aromatic thiols is more difficult
than aliphatic thiols.23 In many cases diluted phases coexist with
aggregates whose structure and origin are under debate.24 It has
been reported that SAMs of large aromatic thiols can form
disordered aggregates, ordered SAMs with molecules at
distances compatible with p–p stacking, or 5 � O3 surface
structures depending on the molecule.25
In this work we study the self-assembly of a new water-soluble
thiolated heptamethinecyanine (Fig. 1) on Au(111) and Au
ART � C1NR
2 | Nanoscale, 2011, xx, 1–11
nanoparticle (AuNP) surfaces. The new cyanine has very
attractive photophysical properties such as near IR fluorescence,
high absorption coefficients, relatively high fluorescence
quantum yields, stability against photodegradation, and envi-
ronment sensitivity. In contrast to other works on CNN immo-
bilization on Au by weak interactions26 our CNN has been
designed to self-assemble on the Au surface by a thiol group on
one side of the molecule. In the opposite side, specific sites for
functionalization comprising two hydrocarbon chains ending in
carboxylate groups have been inserted, in order to allow further
conjugation to biotin, nitriloacetic acid, or binding to metallic
cations.
STM images, Raman spectra, XPS and surface coverage
derived from the reductive desorption curves indicate that the
CNN SAMs on Au(111) consist mainly of J-aggregates with the
CNN molecules chemisorbed on the Au surfaces by forming
thiolate–Au bonds. The optical properties of the thiolated CNN
remain active after adsorption on the Au surface. The fact that J-
aggregates survive on the Au(111) surface indicates that the
interaction forces resulting from p–p stacking between large
numbers of CNN molecules introduce an energy barrier that
cannot be overcome to optimize the S–Au bond distance (0.5 nm)
on the substrate, i.e. they are too stable to be disorganized by the
interaction with the Au surface. Similar results are obtained for
J-aggregate adsorption on citrate-capped AuNPs 12 nm in size
despite the fact that stronger CNN–Au interactions are expected
in this type of defective surfaces.27 The possibility to covalently
bond CNN J-aggregates to Au surfaces opens new paths
regarding their improved stability and the wide range of appli-
cations combining both abilities of physiological friendly
compatible CNN dyes and the low toxicity of AuNPs compared
with other nanosystems.
2. Results and discussion
2.1. CNN on Au(111) characterization
2.1.1. STM. STM images taken after Au(111) immersion in
the CNN containing solution show Au(111) terraces (Fig. 2a)
covered by a large number of randomly distributed nanometre
sized spots that correspond to adsorbed CNN species. In some
places the spots seem to follow some preferred orientation
forming parallel rows (center of the large terrace in Fig. 2a) as
already described for other aromatic compounds on Au(111).24b
Short-range order is visible in Fig. 2b where an ordered array of
spots (2–3 nm in size) are separated by 3.5 nm distances on the
Au(111) surface. However, other spots are placed completely at
11039J
This journal is ª The Royal Society of Chemistry 2011

Fig. 2 (a) 200 � 200 nm2 top view STM image (raw data) of the CNN
covered Au substrate. Randomly distributed CNN species (bright spots)
are observed on the Au surface. (b) 75 � 200 nm2 STM image showing
short-range ordered domains of CNN adsorbates. (c) 50 � 50 nm2 3D
STM image of randomly distributed CNN adsorbates. (d) Power spectral
density showing a broad size distribution of species. The green line
indicates the average size of the CNN adsorbates (2.6 nm).
Fig. 3 High resolution XPS spectra of the CNN SAMs: (a) S 2p and (b)
N 1s.
1
5
10
15
20
25
30
35
40
45
50
55
1
5
10
15
20
25
30
35
40
45
50
55
random as seen in Fig. 2c. These spots, which cover almost all the
Au surface, exhibit different contrast, some are bright while
others appear darker, more diffuse in the background. Bright
spots following step edges are shown in Fig. 2b at the right-hand
lower corner. The power spectral density analysis of the
randomly distributed spots shows a broad size distribution with
an average mean size of 2.6 nm. This figure is slightly higher than
the longer axis dimension of the CNNmolecules (2.1 nm, Fig. 1).
The broad size distribution (Fig. 2d) with a long tail shifted to
larger wavelength values suggests the presence of a fraction of
CNN aggregates, as already described for cyanine molecules in
solution and surfaces.14 Disordered assemblies of molecular
aggregates have also been observed in 1-(11-mercaptoundecyl)
pyrene SAMs on Au(111) surfaces.25 The structure of the CNN
SAM differs completely from that observed in spin coating
heptamethinecyanine films that exhibit 50 nm grains.28 Cross-
section analysis of the bright spots shows values between 0.2 nm
and 0.37 nm that are far from the height of the molecule (1.61
nm, Fig. 1). This is reasonable taking into account that the spots
are so close together that the cross-section does not represent the
real height of the CNN aggregates. Also, the STM images
contain electronic and topographic components. The scatter in
the cross-section values (z-direction) could reflect the lack of
preferential orientation in the aggregates with respect to the
substrate normal and/or disorder in the long outmost hydro-
carbon tails (Fig. 1).
At this stage we cannot decide if the 2.6 nm spots correspond
to a single CNN molecule or to an aggregate. In fact, if an iso-
lated molecule rotates freely it could bring about a spot similar to
those shown in the images. On the other hand, in a 2.6 nm spot
we can assemble �7 CNN elongated molecules stabilized by
robust p–p stacking. The nature of the 2.6 nm elements will be
clarified by using combined electrochemical techniques and
Raman spectroscopy as discussed in detail in Section 2.1.5.
Despite this drawback the power spectral density indicates the
presence of large elements that clearly correspond to aggregates.
ART � C1NR
This journal is ª The Royal Society of Chemistry 2011
However, there are also many other questions related to the
adsorbed CNN molecules that can be answered. (i) How are the
molecules bound to the Au(111) surface: chemisorption or
physisorption? (ii) Are the CNN molecules intact after adsorp-
tion? (iii) What is the surface coverage of thiolate bonds (that
gives a direct measure of the number of chemisorbed CNN
molecules)? In the next section we will address all these points by
using XPS, PM-IRRAS, electrochemistry and Raman
spectroscopy.
2.1.2. XPS. The XPS S 2p signal of the CNN SAM (Fig. 3a)
can be fitted by considering two main components corresponding
to chemisorbed thiols (162 eV) and unbounded thiols (163 eV)29
with a 162 eV/163 eV ratio 3 : 1. The main component at 162 eV
confirms that a significant amount of the CNN molecules are
bonded to the Au substrate by the S atom (Fig. 1) forming
a thiolate bond. The presence of the adsorbed CNN molecules is
also consistent with the N 1s spectra shown in Fig. 3b. The main
peak at 399 eV has been assigned to the N in the CNN rings30 and
amine groups.31 The analysis of the XPS data yields a S 2p 162
eV/N 1S ratio z3, i.e. a value expected for the CNN molecule
(Fig. 1). We also obtain from the XPS data a quantitative rela-
tionship C : O : N : S (162 eV component) ¼ 42 : 11 : 3 : 1 very
close to 44 : 4 : 3 : 1 expected for the molecules shown in Fig. 1,
with the exception of O, which is often present as physisorbed
water in hydrophilic SAMs.31
As mentioned above, the XPS data indicate that most of the
CNN molecules are chemisorbed on the Au(111) surface by
11039J
Nanoscale, 2011, xx, 1–11 | 3

Table 1 IR assignment of the CNN on Au(111)
Assignment Wavelength/cm�1
KBr pelletMonolayeron Au(111)
naCH22918 2926
nsCH22850 2855
naC]O 1735 1730nC]C (coupled) and/orcollected ring modes
1566 1585
nC]N and/orcollected ring modes
1464 1456
DC–H 1384 1393nC–C 1134 (broad) 1206 (broad)In-plane CH bending + ringvibration � orthodi-substituted benzene
1067
1
5
10
15
20
25
30
35
40
45
50
55
1
5
10
15
20
25
30
35
40
a thiolate bond (S 2p 162 eV component). However, the XPS
data also show that about 1/4 of the CNN molecules are phys-
isorbed as the SH group remains intact (S 2p 163 eV component).
This component could be assigned to a fraction of CNN mole-
cules intercalated in the SAM or in a second layer that cannot
interact directly with the Au surface but remain trapped by
intermolecular forces.32
2.1.3. PM-IRRAS. PM-IRRAS was also used to confirm the
presence of the intact CNNmolecule and further characterize the
orientation and degree of order of these molecules on the Au
(111) surface. An infrared transmission spectrum of a KBr pellet
of the CNN was taken and compared to the spectrum of the
monolayer on the surface. Fig. 4 shows these results: the presence
of the stretching mode associated with the carboxylic acid group
in both systems, naC]O at 1735–1730 cm�1. The bands corre-
sponding to collective ring modes are also observed at �1566 to
1585 cm�1 and �1464 to 1456 cm�1.33 These two bands can be
also assigned to resonant C]C and C]N groups34 and are
probably the sum of both contributions. The band observed at
1384–1393 cm�1 can be assigned to the C–H deformation mode
(dC–H) and the broad band below 1200 cm�1 can be assigned both
to alkyl chain C–C stretching modes and to ortho di-substituted
aromatic ring vibrations. In the high frequencies region, the
peaks corresponding to naCH2and nsCH2
are observed and can be
attributed to the carboxylated methylene chain.26a,b In the KBr
pellet, these peaks appear at 2918 and 2850 cm�1 respectively,
indicating that the alkyl tails are fully extended with all-trans
conformation while in the monolayer on the Au(111) surface
there is a shift to higher wavenumbers (2926 and 2855 cm�1)
indicating that these chains are curled. Table 1 summarizes these
assignments.
In general terms, Fig. 4 shows the same bands at the same
position and with the same relative intensities for the KBr
pellet and the CNN SAM, implying that there is no preferential
orientation of the molecule on the surface. The shift of the
naCH2and nsCH2
peaks implies that on the monolayer the alkyl
tails (Fig. 1) are more disordered than in the pellet. By these
results we can follow the derivatization process and confirm
that the CNN is intact on the surface. Also these results
confirm the lack of preferential orientation of the aggregates
and disorder in the long outmost hydrocarbon tails as sug-
gested by the STM data.
Fig. 4 (Black line) PMIRRAS spectra of the CNN SAM on Au(111). Res
Transmission FTIR spectra of CNN in KBr pellets. Resolution was set to 4
ART � C1NR
4 | Nanoscale, 2011, xx, 1–11
2.1.4. Electrochemical data. It is well-known that reductive
desorption of thiol-containing monolayers gives voltammetric
cathodic peaks in aqueous solutions due to the cleavage of S–Au
thiolate bonds. We have used the reductive desorption curves to
estimate the coverage and the electrochemical stability of the
CNN SAM. In fact, the peak potential reflects the strength of the
S–Au bond while the charge density of the peak allows an esti-
mation of the thiolate coverage.
In Fig. 5 we compare the reductive desorption of our CNN
with the well-known desorption behavior of hexanethiol (HT)
SAMs used here as a reference. The reductive desorption for
SAMs of HT and CNN shows defined cathodic current peaks
preceding the hydrogen evolution (HER) reaction. Results
shown in this figure are typical of a series of 10 reductive
desorption measurements. The curves reveal that CNN SAMs
are desorbed from the Au substrate at a peak potential of
Ep ¼ �0.92 V while HT SAMs are desorbed at Ep ¼ �0.99 V, in
agreement with previous results.26c The HT and CNN SAMs
exhibit a difference in peak potentials of 0.07 eV (assuming one
electron per thiolate bond for the reductive desorption). Thus,
HT seems to be a good dilution agent for the CNN molecules in
order to form mixed SAMs.
The charge density involved in the HT desorption peak is q ¼75 � 7 mC cm�2, i.e. a figure that leads to a thiolate surface
coverage 1/3 in agreement with the c(4 � 2) structure usually
found in the STM images of this SAM.35 In contrast, the
olution was set to 4 cm�1 and 1500 scans were accumulated. (Red line)
cm�1 and 200 scans were accumulated.
11039J
This journal is ª The Royal Society of Chemistry 2011
45
50
55

3
Fig. 5 Reductive desorption curve of CNN (red line), and HT (blue line)
SAMs on Au(111) recorded at 0.05 V s�1 in 0.1 M NaOH. Inset: similar
desorption curves recorded for SAMs of CNN monomers (green line)
and CNN J-aggregates + monomers (red).
1
5
10
15
20
25
30
35
40
45
50
55
1
5
10
15
20
25
30
35
40
desorption peak of CNN SAMs involves q ¼ 22 � 5 mC cm�2,
a figure consistent with the larger size of the CNN molecule.
On the other hand, the slight decrease in the CNN monolayer
electrochemical stability in relation to the HT SAM shown in
Fig. 5 could be assigned to the greater solubility of the CNN
in aqueous electrolyte that could assist desorption. In fact, in
aqueous solution hydrophobic forces contribute to stabilize the
HT molecule in the Au surface.
As we have mentioned before, CNN-containing solutions are
usually formed by CNNmonomers and CNN aggregates. In this
way, two mechanisms could contribute to the presence of the
aggregates on the Au(111) surface: (i) aggregate formation in
the methanolic solution followed by preferential adsorption of
the aggregates on the Au(111) surface and (ii) monomer
adsorption from solution followed by aggregation on the
substrate surface. Also both mechanisms could operate simul-
taneously. In the next section we will elucidate the self-assembly
of the thiolate CNN dye on Au(111) by Raman spectroscopy, an
efficient characterization technique to study the presence of J-
aggregates in metal surfaces.26e,36
2.1.5. UV-vis in solution and Raman scattering spectra of
CNN SAMs on Au(111). The UV-vis spectrum recorded in 50
mM CNN methanolic solutions after 24 h of preparation, the
time used for the CNN self-assembly, exhibits a large maximum
Fig. 6 (a) UV-visible spectra of 50 mM thiolated-CNN methanolic solutions.
(111) at 647.1 nm excitation line and (c) at 775 nm excitation line. Black (red
ART � C1NR
This journal is ª The Royal Society of Chemistry 2011
at 650 nm corresponding to individual solvated molecules
(monomeric form), which do not interact with each other; a red-
shifted small maximum at 800 nm that corresponds to J-aggre-
gates; and an additional minor blue-shifted (400–500 nm)
shoulder that can be ascribed to H-aggregates (Fig. 6a, black
curve).
The Raman measurements of CNN SAM on the Au(111)
surface taken with two specific laser lines: 647.1 nm, where the
monomers have their maximum absorption in the UV-visible
spectra and 775 nm where J-aggregates absorb, are shown in
Fig. 6b and c. Important to note for our study is that the Raman
spectra show the low-frequency bands (450–800 cm�1) typical of
J-aggregates physisorbed on metal surfaces.37 These Raman
modes have been detected and theoretically predicted when the
aggregation process takes place (i.e. they are not present or
nearly visible in CNN monomers)38 and have previously been
assigned to a vibration out of plane in similar CNN dyes.39
Notably, we also observe an intensity increase and split of the 558
cm�1 band (at 647.1 nm) to 523 cm�1 and 558 cm�1 (at 775 nm),
see Fig. 6c. The fact that the low-frequency bands are enhanced
when the incident laser line is 775 nm could be related to
a resonant Raman process related to the laser excitation of the J-
aggregate electronic states, where they have an intense absorp-
tion, as shown in the UV-visible spectrum.26e
Therefore, the presence of the low-frequency bands and their
modification with the incident-energy laser line is clear evidence
of the presence of J-aggregates on Au(111) as suggested from the
analysis of the previously reported data.
Raman spectroscopy can also help us to determine which
mechanism takes place at the liquid–solid interface and the origin
of the J-aggregates at the Au(111) surface. In order to answer the
question if the aggregation process occurs after monomer
adsorption or if selective adsorption of aggregates from solution
takes place, we have prepared a new solution containing only
thiolate CNN monomers. This has been possible just by heating
the solution in order to disaggregate the molecules, as it has been
already reported.14 The UV-visible spectra of the monomeric
thiolated CNN dye are also shown in Fig. 6a (red curve).
Raman spectra of both samples show a band centered at 310
cm�1 that has been previously assigned to the Au–S bond,40
indicating that the thiolated-CNNs have been self-assembled by
forming thiolate bonds. By comparing the low-frequency bands
(b) Low frequency bands in the Raman spectra of thiolated-CNN on Au
) lines correspond to CNN with (without) J-aggregates.
11039J
Nanoscale, 2011, xx, 1–11 | 5
45
50
55
4
5
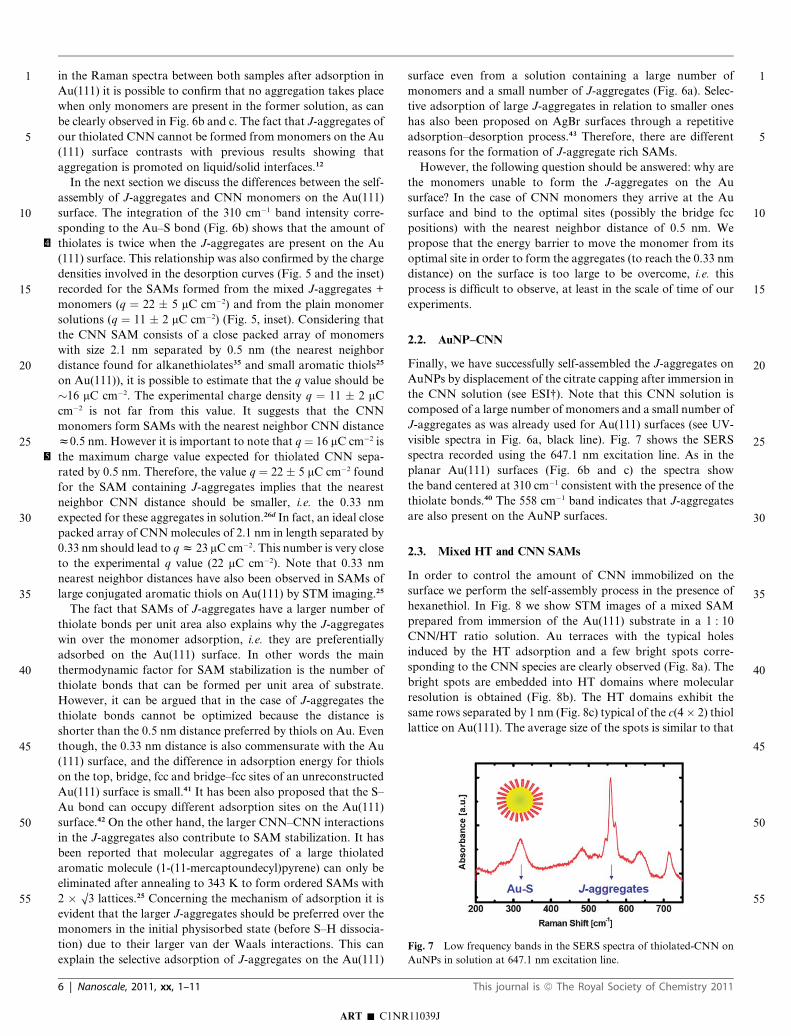
Fig. 7 Low frequency bands in the SERS spectra of thiolated-CNN on
AuNPs in solution at 647.1 nm excitation line.
1
5
10
15
20
25
30
35
40
45
50
55
1
5
10
15
20
25
30
35
40
45
50
55
in the Raman spectra between both samples after adsorption in
Au(111) it is possible to confirm that no aggregation takes place
when only monomers are present in the former solution, as can
be clearly observed in Fig. 6b and c. The fact that J-aggregates of
our thiolated CNN cannot be formed from monomers on the Au
(111) surface contrasts with previous results showing that
aggregation is promoted on liquid/solid interfaces.12
In the next section we discuss the differences between the self-
assembly of J-aggregates and CNN monomers on the Au(111)
surface. The integration of the 310 cm�1 band intensity corre-
sponding to the Au–S bond (Fig. 6b) shows that the amount of
thiolates is twice when the J-aggregates are present on the Au
(111) surface. This relationship was also confirmed by the charge
densities involved in the desorption curves (Fig. 5 and the inset)
recorded for the SAMs formed from the mixed J-aggregates +
monomers (q ¼ 22 � 5 mC cm�2) and from the plain monomer
solutions (q ¼ 11 � 2 mC cm�2) (Fig. 5, inset). Considering that
the CNN SAM consists of a close packed array of monomers
with size 2.1 nm separated by 0.5 nm (the nearest neighbor
distance found for alkanethiolates35 and small aromatic thiols25
on Au(111)), it is possible to estimate that the q value should be
�16 mC cm�2. The experimental charge density q ¼ 11 � 2 mC
cm�2 is not far from this value. It suggests that the CNN
monomers form SAMs with the nearest neighbor CNN distance
z0.5 nm. However it is important to note that q ¼ 16 mC cm�2 is
the maximum charge value expected for thiolated CNN sepa-
rated by 0.5 nm. Therefore, the value q ¼ 22 � 5 mC cm�2 found
for the SAM containing J-aggregates implies that the nearest
neighbor CNN distance should be smaller, i.e. the 0.33 nm
expected for these aggregates in solution.26d In fact, an ideal close
packed array of CNNmolecules of 2.1 nm in length separated by
0.33 nm should lead to qz 23 mC cm�2. This number is very close
to the experimental q value (22 mC cm�2). Note that 0.33 nm
nearest neighbor distances have also been observed in SAMs of
large conjugated aromatic thiols on Au(111) by STM imaging.25
The fact that SAMs of J-aggregates have a larger number of
thiolate bonds per unit area also explains why the J-aggregates
win over the monomer adsorption, i.e. they are preferentially
adsorbed on the Au(111) surface. In other words the main
thermodynamic factor for SAM stabilization is the number of
thiolate bonds that can be formed per unit area of substrate.
However, it can be argued that in the case of J-aggregates the
thiolate bonds cannot be optimized because the distance is
shorter than the 0.5 nm distance preferred by thiols on Au. Even
though, the 0.33 nm distance is also commensurate with the Au
(111) surface, and the difference in adsorption energy for thiols
on the top, bridge, fcc and bridge–fcc sites of an unreconstructed
Au(111) surface is small.41 It has been also proposed that the S–
Au bond can occupy different adsorption sites on the Au(111)
surface.42 On the other hand, the larger CNN–CNN interactions
in the J-aggregates also contribute to SAM stabilization. It has
been reported that molecular aggregates of a large thiolated
aromatic molecule (1-(11-mercaptoundecyl)pyrene) can only be
eliminated after annealing to 343 K to form ordered SAMs with
2 � O3 lattices.25 Concerning the mechanism of adsorption it is
evident that the larger J-aggregates should be preferred over the
monomers in the initial physisorbed state (before S–H dissocia-
tion) due to their larger van der Waals interactions. This can
explain the selective adsorption of J-aggregates on the Au(111)
ART � C1NR
6 | Nanoscale, 2011, xx, 1–11
surface even from a solution containing a large number of
monomers and a small number of J-aggregates (Fig. 6a). Selec-
tive adsorption of large J-aggregates in relation to smaller ones
has also been proposed on AgBr surfaces through a repetitive
adsorption–desorption process.43 Therefore, there are different
reasons for the formation of J-aggregate rich SAMs.
However, the following question should be answered: why are
the monomers unable to form the J-aggregates on the Au
surface? In the case of CNN monomers they arrive at the Au
surface and bind to the optimal sites (possibly the bridge fcc
positions) with the nearest neighbor distance of 0.5 nm. We
propose that the energy barrier to move the monomer from its
optimal site in order to form the aggregates (to reach the 0.33 nm
distance) on the surface is too large to be overcome, i.e. this
process is difficult to observe, at least in the scale of time of our
experiments.
2.2. AuNP–CNN
Finally, we have successfully self-assembled the J-aggregates on
AuNPs by displacement of the citrate capping after immersion in
the CNN solution (see ESI†). Note that this CNN solution is
composed of a large number of monomers and a small number of
J-aggregates as was already used for Au(111) surfaces (see UV-
visible spectra in Fig. 6a, black line). Fig. 7 shows the SERS
spectra recorded using the 647.1 nm excitation line. As in the
planar Au(111) surfaces (Fig. 6b and c) the spectra show
the band centered at 310 cm�1 consistent with the presence of the
thiolate bonds.40 The 558 cm�1 band indicates that J-aggregates
are also present on the AuNP surfaces.
2.3. Mixed HT and CNN SAMs
In order to control the amount of CNN immobilized on the
surface we perform the self-assembly process in the presence of
hexanethiol. In Fig. 8 we show STM images of a mixed SAM
prepared from immersion of the Au(111) substrate in a 1 : 10
CNN/HT ratio solution. Au terraces with the typical holes
induced by the HT adsorption and a few bright spots corre-
sponding to the CNN species are clearly observed (Fig. 8a). The
bright spots are embedded into HT domains where molecular
resolution is obtained (Fig. 8b). The HT domains exhibit the
same rows separated by 1 nm (Fig. 8c) typical of the c(4� 2) thiol
lattice on Au(111). The average size of the spots is similar to that
11039J
This journal is ª The Royal Society of Chemistry 2011

1
5
10
15
20
25
30
35
40
45
50
55
1
5
10
reported for the self-assembly from the plain CNN solution also
suggesting the presence of aggregates. This finding is not
surprising as the UV-vis spectra of the self-assembly solution
show the presence of monomers and aggregates (Fig. 9). Even
more, the presence of HT seems to increase the J-aggregate/
monomer ratio, i.e. the surfactant induces the self-aggregation in
solution (Fig. 9a and b). In this case the cross-section analysis of
the isolated aggregates shows the height between 0.34 and 0.40
nm, i.e. the scatter in height is decreased with respect to the CNN
SAM. It could reflect that the near vertically arranged HT
molecules (tilt angle 30/50�) induce more order in the CNN
orientation on the surface. If one considers that the HT SAM in c
Fig. 8 STM images of mixed SAMs formed from 1 : 10 of cyanine
(CNN) : hexanethiol (HT) containing solution. (a) 200 � 200 nm2. Note
the small density of bright spots: (b) 50� 50 nm2 and (c) 30� 15 nm2 high
resolution images showing isolated CNN aggregates (bright spots)
embedded into the rows of the HT molecules.
ART � C1NR
This journal is ª The Royal Society of Chemistry 2011
15
(4 � 2) configuration has �0.7 nm height from the substrate and
the CNN molecules of the aggregates emerge �0.4 nm from the
HT outer plane (Fig. 8b and c) the total height of the aggregates
should be �1.1 nm, still smaller than the height of the CNN
molecules (1.6 nm, Fig. 1). This can be explained considering the
disorder of the outmost hydrocarbon chains revealed by the
PMIRRAS results. This estimation is made under the assump-
tion that the STM contrast is dominated by topography although
it should also involve electronic effects.
Note that the CNN aggregates seem to be preferentially
adsorbed at step edges or at the edges of the holes where HT
disorder exists as already reported for methylene blue molecules
intercalated on thiol SAMs.44 It is evident that the HT molecules
provide a favorable environment for the CNN aggregates at the
Au surfaces as it occurs in the methanolic HT/CNN solution
(Fig. 8b).
6
20
25
30
35
40
45
50
55
3. Conclusions and outlooks
In the next section we discuss the implications of our results.
First, we have demonstrated from XPS and Raman data that
most of the thiolated CNN molecules are linked to the Au(111)
and AuNP surfaces by a thiolate bond as takes place for HT and
other thiols on Au(111). Secondly, we have shown from the STM
images, Raman spectra and coverage estimation from desorption
curves that the most of the CNN molecules exist on the Au(111)
surface as J-aggregates when they are present (even in a small
proportion) in the initial solution. In contrast, we have also
found that when only CNN monomers are present in the initial
solution, they are self-assembled as they cannot be organized into
J-aggregates on the substrate, i.e. when the thiolate–Au inter-
action is optimized by the monomer it becomes strong enough to
hinder p–p stacking between adsorbed monomers. From these
results one can conclude that the J-aggregates are preferentially
adsorbed on the Au(111) surface from the methanolic solutions
containing monomers and aggregates even when the aggregates
are only a minor component of the solution. The fact that J-
aggregates survive on the Au surface indicates that the interac-
tion forces resulting from p–p stacking between large numbers
of molecules introduces an energy barrier that cannot be over-
come to optimize the thiolate–Au bond on the substrate. Also, J-
aggregate adsorption results in double the amount of thiolates on
the surface (compared to CNN monomers) and this should be
also an important driving force in the final energy of the self-
assembly process. We have demonstrated that the self-assembly
of J-aggregates takes place not only on atomically smooth Au
surfaces but also on more defective surfaces such as AuNP
surfaces where the molecule–Au interaction should be high-
er.26c,27 In other words the J-aggregate is too stable to be disor-
ganized even for stronger CNN–Au interactions.
We also show that aliphatic thiols are efficient diluting agents
for J-aggregates so that their concentration on the Au(111)
surface can be controlled from the CNN/alkanethiol ratio in
solution allowing imaging of isolated species.
Another point to be mentioned is the versatile-synthetic
method used in this work. As we have presented, this heptame-
thinecyanine dye was further modified by a cysteamine thiol to
obtain this novel thiolate cyanine molecule. In addition (as
shown in the ESI†) this thiolating procedure does not modify the
11039J
Nanoscale, 2011, xx, 1–11 | 7

Fig. 9 (a) UV-vis spectra of 50 mM CNN methanolic solutions after 24 h (black) and 1 : 10 CNN/HT methanolic solutions after 24 h (blue). (b)
Differential spectra (red) between [CNN/HT 1/10] � 10 mix and pure CNN dye.
1
5
10
15
20
25
30
35
40
45
50
55
1
5
10
15
20
25
optical properties of the heptamethinecyanine dye in solution,
differing from what has been proposed for other cyanine mole-
cules.45 As we can see, also some fluorescence from the thiolate–
CNN after adsorption in Au(111) can be evidenced from the
intense background in the Raman measurements. However, the
thiolating procedure can be performed with other amine thiols in
order to improve particular qualities depending on specific
applications. For example, for fluorescence biomarkers longer
distances from the Au surface are desirable in order to get higher
fluorescence intensities avoiding quenching processes due to the
surface.46 11-Aminoundecanethiol or longer amine thiols could
be useful for this purpose.
30
35
4. Experimental section
Synthesis of the thiolated cyanine
The thiolated cyanine was purified by HPLC and characterized
by spectroscopic methods such as Mass Spectroscopy and
Nuclear Magnetic Resonance. Details of the synthesis and
characterization can be found in the ESI†. UV-vis spectra of the
CNN solutions were acquired with a Lambda 35 double beam
spectrophotometer from Perkin Elmer (Waltham, MA, USA).
40
45
Gold substrates and chemicals
Gold evaporated on glass substrates were purchased from
Arrandee�, consisting of vapor deposited gold films (250� 50 nm
in thickness) on a thin layer of chromium supported on glass slides.
Substrates were prepared by annealing for 5 min in a butane–
propane flame until the film color turned to a dark red. After
annealing, these polycrystalline substrates exhibit large grainswith
atomically smooth (111) terraces separated by steps ofmonatomic
height. All of the chemicals used were of analytical reagent grade.
5055
SAMs preparation on the gold substrates
Self-assembled monolayers (SAMs) of hexanethiol (HT) and
thiolated cyanine (CNN) were prepared by immersing the Au
(111) substrates into freshly prepared 100 mM HT ethanolic
solution or 100 mM CNN methanolic solution for 24 h at room
temperature in the absence of light. A final and careful rinsing
was made with methanol before drying under N2. A 1 : 10
mixture of CNN and HT respectively was prepared by mixing
ART � C1NR
8 | Nanoscale, 2011, xx, 1–11
100 mMsolutions in the correct volume to reach the final relation.
In all cases the CNN solution containing a large number of
monomers and a small number of J-aggregates was used, except
when it is explicitly mentioned that another solution was used.
Gold nanoparticles: synthesis and characterization
Gold nanoparticle (AuNP) synthesis was done by the standard
method introduced by Turkevich et al.47 and refined by Frens.48
The AuNPs were characterized by UV-vis spectra and Trans-
mission ElectronMicroscopy (TEM) as it is described in the ESI†.
The AuNP–CNN functionalization was performed in the
following way: AuNPs stabilized in citrate buffer pH 7.5 and
a CNN solution in the same buffer were mixed in a 1 : 1000
molar ratio in order to replace the citrate capping by the CNN
molecules. The mix was left overnight at room temperature in the
dark. The AuNPs modified with the CNN SAM (AuNP–CNN)
were purified by repetitive centrifugation and characterized by
UV-vis, TEM (see ESI†) and Raman Spectroscopy.
SAMs characterization
The SAMs were characterized by XPS, PMIRRAS, STM,
Raman and electrochemical techniques. Measurements were
carried out at room temperature.
X-Ray Photoelectron Spectroscopy (XPS) measurements were
performed under UHV conditions (base pressure < 5 � 10�10
mbar) in a SPECS UHV spectrometer system equipped with
a 150 mm mean radius hemispherical electron energy analyzer
and a nine channeltron detector. XPS spectra were acquired at
a constant pass energy of 20 eV using an un-monochromated
MgKa (1253.6 eV) source operated at 12.5 kV and 20 mA and
a detection angle of 30 degrees with respect to the sample normal
on grounded conducting substrates. Quoted binding energies are
referred to the Au 4f 7/2 emission at 84 eV. Atomic ratios and
surface concentrations were calculated from the integrated
intensities of core levels after instrumental and photoionization
cross-section corrections.
Polarization Modulation InfraRed Reflection Absorption
Spectroscopy (PMIRRAS) experiments were made on a Thermo
Nicolet 8700 (Nicolet, Madison,WI) spectrometer equipped with
a custom made external tabletop optical mount, a MCT-A
detector (Nicolet), a photoelastic modulator, PEM (PM-90 with
II/Zs50 ZnSe 50 kHz optical head, Hinds Instrument, Hillsboro,
11039J
This journal is ª The Royal Society of Chemistry 2011

7
8
1
5
10
15
20
25
30
35
40
45
50
55
1
5
10
15
20
25
30
35
40
45
50
55
OR), and Synchronous Sampling Demodulator, SSD (GWC
Instruments, Madison, WI). The IR spectra were acquired with
the PEM set for a half wave retardation at 2900 cm�1 for the CH
stretching region and at 1500 cm�1 for the CH bending and
aromatic region. The angle of incidence was set at 80�, whichgives the maximum of mean square electric field strength for the
air/Au(111) interface. The demodulation technique developed in
Corn’s laboratory was used in this work. The signal was cor-
rected by the PEM response using a method described by Frey
et al.49 Typically 8000 and 1500 scans were performed and the
resolution was set for 2 and 4 cm�1, respectively.
Transmission spectra for solid cyanineweremeasuredusingKBr
pellets.Resolutionwas set to 4 cm�1 and 200 scanswere performed.
The Raman scattering experiments on Au(111) surfaces and
the SERS (Surface Enhanced Raman Scattering) measurements
on AuNPs were performed on a Jobin-Yvon T64000 triple
spectrometer operating in subtractive mode and equipped with
a liquid N2 cooled charge coupled device (CCD). The excitation
was done using an Ar–Kr laser (specifically 647.1 nm), and a Ti-
Sapph laser continuously tunable between 690 and 1080 nm
(specifically 775 nm). Spectra were acquired 3 times (accumula-
tive) for 300 s for Au(111) and 2 times (accumulative) for 10 s for
AuNPs using 40 mW of laser power with an incidence angle of 25
degrees, and focused on a circular spot of 30 mm diameter. The
collection numerical aperture was 0.2, aligned normal to the
surface for Au(111) surfaces. AuNPs were measured in solution.
Scanning Tunneling Microscopy (STM) images were obtained
in air using a Nanoscope IIIa microscope from Veeco Instru-
ments (Santa Barbara, CA). Commercial Pt–Ir tips were used.
Typical tunneling currents and bias voltages for imaging cyanine
were 300 pA and 800–1000 mV, respectively.
The electrochemicalmeasurementswere performedwith aTEQ
potentiostat under computer control for data acquisition. The Au
(111) substrates were mounted in a conventional three-electrode
cell. Solutions were purged with nitrogen. All potentials were
measured and reported with respect to a SCE reference electrode.
Solutions of 0.1 M NaOH were prepared using deionized H2O
from aMilli-Q purification system (Millipore Products, Bedford).
Reductive electrodesorption of thiols from the Au substrates was
performed by scanning the potential from�0.2 to�1.40 V at 0.05
V s�1 in 0.1MNaOHaqueous solution, at room temperature. The
charge density and the peak potential involved in the reductive
desorption process were taken as an indication of the surface
coverage by the CNN and HT molecules.
Acknowledgements
We acknowledge financial support from ANPCyT (Argentina,
PICT-2010-2554, PICT 2008-0332, PICT-CNPQ 08-019, PICT
06-01061). EC, DG, NGT, AF and RCS are members of CONI-
CET.MEVis amemberof the research career ofCICBsAs.EAJ-E
acknowledges the Max Planck Society, University of Buenos
Aires, CONICET (Argentina) and ANPCyT (Argentina) for
financial support.
References
1 D. M. Sturmer and D. Heseltine, in The Theory of PhotographicProcess, ed. T. H. James, Macmillan Publishing Co, New York, 4thedn, 1977.
ART � C1NR
This journal is ª The Royal Society of Chemistry 2011
2 G. Patonay, N. Narayanan, L. Strekowski, L. R. Middendorf andM.Lipowska, inEuropeanPatent,Vol. EP670374,United States, 1995.
3 S. H. Zhang, B. Li, L. M. Tang, X. G. Wang, D. S. Liu andQ. X. Zhou, Polymer, 2001, 42, 7575–7582.
4 (a) L. R. Middendorf, J. C. Bruce, R. C. Bruce, R. D. Eckles,D. L. Grone, S. C. Roemer, G. D. Sloniker, D. L. Steffens,S. L. Sutter, J. A. Brumbaugh and G. Patonay, Electrophoresis,1992, 13, 487–494; (b) D. B. Shealy, M. Lipowska, J. Lipowski,N. Narayanan, S. Sutter, L. Strekowski and G. Patonay, Anal.Chem., 1995, 67, 247–251.
5 I. Durrant and L. Gubba, in Fluorescence Microscopy and FluorescentProbes, ed. J. Slav�ık, Plenum Press, New York, 1996.
6 H. Zheng, Y. X. Mao, D. H. Li and C. Q. Zhu, Anal. Biochem., 2003,318, 86–90.
7 (a) R. B. Mujumdar, L. A. Ernst, S. R. Mujumdar, C. J. Lewis andA. S. Waggoner, Bioconjugate Chem., 1993, 4, 105–111; (b)R. B. Mujumdar, L. A. Ernst, S. R. Mujumdar andA. S. Waggoner, Cytometry, 1989, 10, 11–19.
8 R. Gray, D. Walton, J. Bickerton, P. Richards and J. Heptinstall,Dyes Pigm., 1996, 30, 321–332.
9 (a) Z. F. Dai, L. Qun and B. X. Peng, Dyes Pigm., 1998, 36, 243–248;(b) M. Matsuoka, Infrared Absorbing Dyes, Plenum Press, New York,1990.
10 (a) M. Lipowska, S. E. Patterson, G. Patonay and L. Strekowski, J.Heterocycl. Chem., 1993, 30, 1177–1180; (b) J. Sowell,K. A. Agnew-Heard, J. C. Mason, C. Mama, L. Strekowski andG. Patonay, J. Chromatogr., B, 2001, 755, 91–99.
11 M. E. Cooper, S. Gregory, E. Adie and S. Kalinka, J. Fluoresc., 2002,12, 425–429.
12 (a) A. H. Herz, Adv. Colloid Interface Sci., 1977, 8, 237–298; (b)G. Roberts, Langmuir–Blodgett Films, Plenum Press, New York,1990.
13 S. Kirstein and S. Daehne, Int. J. Photoenergy, 2006, 2006, Article ID20363.
14 B. I. Shapiro, Russ. Chem. Rev., 2006, 75, 433–456.15 J. Grad, G. Hernandez and S. Mukamel, Phys. Rev. A: At., Mol., Opt.
Phys., 1988, 37, 3835–3846.16 (a) O. Karthaus and Y. Kawatani, Jpn. J. Appl. Phys., Part 1, 2003,
42, 127–131; (b) H. Yao, Y. Morita and K. Kimura, J. ColloidInterface Sci., 2008, 318, 116–123.
17 (a) S. Blumentritt, M. Burghard, S. Roth and H. Nejo, Surf. Sci.,1998, 397, L280–L284; (b) U. C. Fischer, E. Bortchagovsky,J. Heimel and R. T. Hanke, Appl. Phys. Lett., 2002, 80, 3715–3717;(c) K. Saito, S. Honda, M. Watanabe and H. Yokoyama, Jpn. J.Appl. Phys., Part 1, 1994, 33, 6218–6219.
18 R. W. Owens and D. A. Smith, Langmuir, 2000, 16, 562–567.19 M. Kawasaki, T. Sato and T. Yoshimoto, Langmuir, 2000, 16, 5409–
5417.20 (a) I. I. S. Lim, F. Goroleski, D. Mott, N. Kariuki, W. Ip, J. Luo and
C. J. Zhong, J. Phys. Chem. B, 2006, 110, 6673–6682; (b) I. I. S. Limand C. J. Zhong, Gold Bull., 2007, 40, 59–66.
21 (a) N. T. Fofang, N. K. Grady, Z. Fan, A. O. Govorov andN. J. Halas, Nano Lett., 2011, 11, 1556–1560; (b) N. T. Fofang,T.-H. Park, O. Neumann, N. A. Mirin, P. Nordlander andN. J. Halas, Nano Lett., 2008, 8, 3481–3487; (c) D. G. Lidzey,D. D. C. Bradley, A. Armitage, S. Walker and M. S. Skolnick,Science, 2000, 288, 1620–1623; (d) G. A. Wurtz, P. R. Evans,W. Hendren, R. Atkinson, W. Dickson, R. J. Pollard, A. V. Zayats,W. Harrison and C. Bower, Nano Lett., 2007, 7, 1297–1303.
22 S. Link, C. Burda, Z. L. Wang and M. A. El-Sayed, J. Chem. Phys.,1999, 111, 1255–1264.
23 Q.M. Xu, H.Ma, H. Yip and A. K. Y. Jen,Nanotechnology, 2008, 19,135605–135611.
24 (a) Q. Jin, J. A. Rodriguez, C. Z. Li, Y. Darici and N. J. Tao, Surf.Sci., 1999, 425, 101–111; (b) E. Pensa, P. Carro, A. A. Rubert,G. Benitez, C. Vericat and R. C. Salvarezza, Langmuir, 2010, 26,17068–17074.
25 X. Qingmin, et al., Nanotechnology, 2008, 19, 135605.26 (a) R. G. Nuzzo, L. H. Dubois and D. L. Allara, J. Am. Chem. Soc.,
1990, 112, 558–569; (b) M. D. Porter, T. B. Bright, D. L. Allara andC. E. D. Chidsey, J. Am. Chem. Soc., 1987, 109, 3559–3568; (c)E. Cort�es, A. A. Rubert, G. Benitez, P. Carro, M. E. Vela andR. C. Salvarezza, Langmuir, 2009, 25, 5661–5666; (d)P. J. Wheatley, J. Chem. Soc., 1959, 3245–3250; (e) K. Kneippa,H. Kneippb and M. Rentschb, J. Mol. Struct., 1987, 156, 331–340.
11039J
Nanoscale, 2011, xx, 1–11 | 9

1
5
10
15
20
25
30
35
40
45
50
55
1
5
10
15
20
27 D. Grumelli, C. Vericat, G. Benitez, M. E. Vela, R. C. Salvarezza,L. J. Giovanetti, J. M. Ramallo-L�opez, F. G. Requejo,A. F. Craievich and Y. S. Shon, J. Phys. Chem. C, 2007, 111, 7179–7184.
28 Y. Y. Zhong, K. H. Feng, S. Z. Rong and W. Z. Geng, Chin. Sci.Bull., 2007, 52, 1897–1901.
29 C. J. Zhong, R. C. Brush, J. Anderegg and M. D. Porter, Langmuir,1999, 15, 518–525.
30 C. Malitesta, I. Losito, L. Sabbatini and P. G. Zambonin, J. ElectronSpectrosc. Relat. Phenom., 1995, 76, 629–634.
31 M. Wirde, U. Gelius and L. Nyholm, Langmuir, 1999, 15, 6370–6378.32 S. n. A. Su�arez, M. H. Fonticelli, A. A. Rubert, E. de la Llave,
D. n. Scherlis, R. C. Salvarezza, M. A. Mart�ı and F. Doctorovich,Inorg. Chem., 2010, 49, 6955–6966.
33 D. Lin-Vein, N. B. Colthup, W. G. Fateley and J. G. Grasselli, TheHandbook of InfraRed and Raman Characteristic Frequencies ofOrganic Molecules, Academic Press, Inc, San Diego, CA, USA, 1991.
34 A. Leifer, D. Bonis, M. Collins, P. Dougherty, A. J. Fusco, M. Koraland J. E. L. Valle, Spectrochim. Acta, 1964, 20, 909–923.
35 C. Vericat, M. E. Vela, G. Benitez, P. Carro and R. C. Salvarezza,Chem. Soc. Rev., 2010, 39, 1805–1834.
36 Y. Kitahama, A. Ogawa, Y. Tanaka, S. Obeidat, T. Itoh,M. Ishikawaand Y. Ozaki, Chem. Phys. Lett., 2010, 493, 309–313.
37 B. Gu and D. L. Akins, Chem. Phys. Lett., 1985, 113, 558–562.38 D. M. Coles, A. J. H. M. Meijer, W. C. Tsoi, M. D. B. Charlton,
J.-S. Kim and D. G. Lidzey, J. Phys. Chem. A, 2010, 114, 11920–11927.
ART � C1NR
10 | Nanoscale, 2011, xx, 1–11
39 (a) X. Wang, H. Wen, T. He, J. Zuo, C. Xu and F.-C. Liu,Spectrochim. Acta, Part A, 1997, 53, 2495–2504; (b) X. Li, B. Guand D. L. Akins, Chem. Phys. Lett., 1984, 105, 263–267.
40 P. G. Lustemberg, C. Vericat, G. A. Benitez, M. E. Vela, N. Tognalli,A. Fainstein, M. L. Martiarena and R. C. Salvarezza, J. Phys. Chem.C, 2008, 112, 11394–11402.
41 J. Gottschalck and B. Hammer, J. Chem. Phys., 2002, 116, 784–790.
42 (a) P. Jiang, A. Nion, A. Marchenko, L. Piot and D. Fichou, J. Am.Chem. Soc., 2006, 128, 12390–12391; (b) J. F. Kang, A. Ulman,S. Liao, R. Jordan, G. Yang and G.-y. Liu, Langmuir, 2000, 17, 95–106; (c) G. Yang, Y. Qian, C. Engtrakul, L. R. Sita and G.-y. Liu,J. Phys. Chem. B, 2000, 104, 9059–9062.
43 H. Asanuma and T. Tani, J. Phys. Chem. B, 1997, 101, 2149–2153.
44 D. Grumelli, L. P. M. De Leo, C. Bonazzola, V. Zamlynny,E. J. Calvo and R. C. Salvarezza, Langmuir, 2010, 26, 8226–8232.
45 G. T. Dempsey, M. Bates, W. E. Kowtoniuk, D. R. Liu, R. Y. Tsienand X. Zhuang, J. Am. Chem. Soc., 2009, 131, 18192–18193.
46 C. M. Galloway, P. G. Etchegoin and E. C. Le Ru, Phys. Rev. Lett.,2009, 103, 063003–063004.
47 J. Turkevich, P. C. Stevenson and J. Hillier, Faraday Discuss., 1951,11, 55–75.
48 G. Frens, Nature (London), Phys. Sci., 1973, 241, 20–22.49 B. L. Frey, R. M. Corn and S. C. Weibel, in Handbook of Vibrational
Spectroscopy, John Wiley & sons, 2001.
11039J
This journal is ª The Royal Society of Chemistry 2011
25
30
35
40
45
50
55

1
5
10
15
20
25
30
35
40
45
50
55
1
Authors Queries5
Journal: NRPaper: c1nr11039j
Title: Self-assembly of thiolated cyanine aggregates on Au(111) and Au nanoparticle surfaces
Editor’s queries are marked like this... 1 , and for your convenience line numbers are inserted like this... 5
10
Thi
Query
Reference
s journal is ª The Royal
Query
ART � C1NR11039J
Society of Chemistry 2011
Remarks
15
1For your information: You can cite this article
before you receive notification of the page numbers
by using the following format: (authors),Nanoscale, (year), DOI: 10.1039/c1nr11039j.
20
2 In the sentence beginning ‘In fact, it is well knownthat.’ should ‘difficult’ be changed to ‘complex’?3
The sentence beginning ‘‘Raman spectroscopycan.’’ has been altered for clarity, please checkthat the meaning is correct.
25
4In the sentence beginning ‘The integration of the.’
should ‘twice’ be changed to ‘doubled’?
5
30The sentence beginning ‘‘However it is important to
note.’’ has been altered for clarity, please check
that the meaning is correct.
6
The sentence beginning ‘‘In contrast, we have.’’
has been altered for clarity, please check that the
meaning is correct.
35
7Please check that ref. 2 has been displayed
correctly.
8
Ref. 13: Please provide the following details:starting page number.
409
45
Please check that the TOC text fits within the
allocated space indicated on the front page of the
proof. If the entry does not fit between the two
horizontal lines, then please trim the text and/or the
title.
Nanoscale, 2011, xx, 1–11 | 11
50
55