Selenium Status and Cardiovascular Risk Profile in Healthy Adult Saudi Males
19
Molecules 2009, 14, 141-159; doi:10.3390/molecules14010141 molecules ISSN 1420-3049 www.mdpi.com/journal/molecules Article Selenium Status and Cardiovascular Risk Profile in Healthy Adult Saudi Males Eman M. Alissa 1, *, Waqar H. Ahmed 1,3 , Nabeel Al-ama 1,4 and Gordon A. A. Ferns 2 1 Faculty of Medicine, King Abdul Aziz University, Jeddah, Kingdom of Saudi Arabia 2 Postgraduate Medical School, Faculty of Health & Medical Science, University of Surrey, Guildford, Surrey GU2 7WG, UK 3 Department of Cardiology, King Fahd Armed Forces Hospital, Jeddah, Kingdom of Saudi Arabia 4 Department of Medicine, King Abdul Aziz University Hospital, Jeddah, Kingdom of Saudi Arabia * Author to whom correspondence should be addressed; E-mail: [email protected]; Tel: +966-2 6644444 Ext. 23432; Fax: +966-2 66 434 99. Received: 28 October 2008; in revised form: 8 December 2008 / Accepted: 8 December 2008 / Published: 31 December 2008 Abstract: The purpose of this research was to investigate the relationship between selenium levels, thyroid function and other coronary risk factors in 140 Saudi subjects without overt coronary heart disease stratified by age. Demographic data and serum fasting lipid profile, glucose, thyroid function tests, selenium status and dietary intake was assessed. The relationships between selenium status, thyroid function and cardiovascular risk factors were assessed by univariate and multivariate analysis. The results showed that thyroid hormone levels did not differ with age. Erythrocyte glutathione peroxidase (GPx) levels were significantly higher in the youngest vs. oldest tertile (p<0.0001). Selenium and iodine intake did not differ significantly with age tertile, but the average intake for the population sample was below the estimated average requirements for both elements. Serum lipoprotein (a) concentrations correlated with selenium (r = 0.417, p<0.0001) and TSH (r = 0.172, p<0.05). After adjustment for confounding variables; serum fT 4 and erythrocytes GPx remained significant determinants of serum TSH levels, whilst serum selenium and TSH were determinants of serum fT 4 levels. Serum Lp(a), a coronary risk factor, was strongly related to measures of selenium status. A significant relationship between measures of selenium status and thyroid function was found. Serum Lp(a) a known risk factor for cardiovascular disease was also related to selenium status in our population. OPEN ACCESS
Transcript of Selenium Status and Cardiovascular Risk Profile in Healthy Adult Saudi Males

Molecules 2009, 14, 141-159; doi:10.3390/molecules14010141
molecules ISSN 1420-3049
www.mdpi.com/journal/molecules Article Selenium Status and Cardiovascular Risk Profile in Healthy Adult Saudi Males
Eman M. Alissa 1,*, Waqar H. Ahmed 1,3, Nabeel Al-ama 1,4 and Gordon A. A. Ferns 2 1 Faculty of Medicine, King Abdul Aziz University, Jeddah, Kingdom of Saudi Arabia 2 Postgraduate Medical School, Faculty of Health & Medical Science, University of Surrey, Guildford,
Surrey GU2 7WG, UK 3 Department of Cardiology, King Fahd Armed Forces Hospital, Jeddah, Kingdom of Saudi Arabia 4 Department of Medicine, King Abdul Aziz University Hospital, Jeddah, Kingdom of Saudi Arabia * Author to whom correspondence should be addressed; E-mail: [email protected]; Tel: +966-2
6644444 Ext. 23432; Fax: +966-2 66 434 99. Received: 28 October 2008; in revised form: 8 December 2008 / Accepted: 8 December 2008 / Published: 31 December 2008
Abstract: The purpose of this research was to investigate the relationship between selenium levels, thyroid function and other coronary risk factors in 140 Saudi subjects without overt coronary heart disease stratified by age. Demographic data and serum fasting lipid profile, glucose, thyroid function tests, selenium status and dietary intake was assessed. The relationships between selenium status, thyroid function and cardiovascular risk factors were assessed by univariate and multivariate analysis. The results showed that thyroid hormone levels did not differ with age. Erythrocyte glutathione peroxidase (GPx) levels were significantly higher in the youngest vs. oldest tertile (p<0.0001). Selenium and iodine intake did not differ significantly with age tertile, but the average intake for the population sample was below the estimated average requirements for both elements. Serum lipoprotein (a) concentrations correlated with selenium (r = 0.417, p<0.0001) and TSH (r = 0.172, p<0.05). After adjustment for confounding variables; serum fT4 and erythrocytes GPx remained significant determinants of serum TSH levels, whilst serum selenium and TSH were determinants of serum fT4 levels. Serum Lp(a), a coronary risk factor, was strongly related to measures of selenium status. A significant relationship between measures of selenium status and thyroid function was found. Serum Lp(a) a known risk factor for cardiovascular disease was also related to selenium status in our population.
OPEN ACCESS
Molecules 2009, 14
142
Keywords: Selenium; Iodine; Thyroid; Glutathione peroxidase; Subclinical hypothyroidism; Coronary risk factors; Lipoprotein (a); Saudi Arabia.
Introduction
Overt hypothyroidism is associated with dyslipidemia, hypertension, and an increased risk of
cardiovascular disease (CVD) [1, 2]. Lesser degrees of thyroid dysfunction may also be associated with increased coronary risk. Subclinical hypothyroidism, defined as an asymptomatic state characterized by normal serum concentrations of free thyroxine (fT4) and elevated serum concentrations of thyroid-stimulating hormone (TSH) [3], is found in high prevalence in elderly women [4]; its features include abnormal lipid metabolism [5-7], increased levels of plasma lipoprotein (a) (Lp (a)) [8-10], cardiac dysfunction [11], increased levels of oxidized LDL (ox-LDL) [12-13] and neurological and mental dysfunction [14]. Several cross-sectional studies have suggested that subclinical hypothyroidism confers an elevated risk of CVD [15-17], though this has been contested [18-20]. Possible atherogenic factors other than hyperlipidemia, such as elevated CRP, elevated tissue factor activities have been suggested [21,22]. Subclinical hypothyroidism itself has been identified as an independent risk factor for aortic atherosclerosis and myocardial infarction in elderly women [16] and variation of thyroid function within the normal range may influence the presence and severity of coronary atherosclerosis [23], even though the level of evidence is probably insufficient [24].
The importance of selenium for human health (reviewed in [25]) has been recognized for many years. One role of selenium is the formation of selenocysteine, located in the catalytic centre of all selenoenzymes, which are involved in the maintenance of redox balance in cellular and extracellular compartments. Selenium also plays a major role in T4 conversion to T3. The activity of all 3 known deiodinases, D1–D3, is dependent on selenium [26-28]. The importance of selenium in thyroid hormone metabolism is also reflected by the fact that the thyroid is the organ with the highest selenium content [29-30]; and the levels of selenium remain higher in the thyroid compared with other tissues even when deficiency occurs [31]. It has been shown that in critically ill patients, selenium supplementation leads to an earlier normalization of plasma T3 levels compared with controls [32] and that low plasma selenium levels correlate with low T3 levels [33]. From these studies, it has been concluded that the main cause of low T3 levels might be a reduced level of the selenoenzyme iodothyronine deiodinase (ID-I) activity.
Up to 80% of circulating T3 is produced by the activity of the selenium-containing enzyme ID-I. Thus, thyroid hormone metabolism may be affected by deficiencies of both selenium and iodine. In severe selenium deficiency hepatic ID-I activity decreases substantially, leading to an increase in plasma T4 concentrations. However plasma T3 concentrations are reported to be only slightly decreased in selenium deficiency due to several compensatory mechanisms including the maintenance or increase in thyroidal ID-I activity and decreased hepatic T3 degradation [34, 35].
Furthermore, the selenoprotein glutathione peroxidase (GPx) may protect the thyroid gland from oxidative damage due to any excess hydrogen peroxide (H2O2) produced during thyroid hormone synthesis [36]. Thus, selenium deficiency may exacerbate some effects of iodine deficiency and may

Molecules 2009, 14
143
have a role in the aetiology of iodine-deficiency disorders [37, 38]. Hence the combination of low selenium status and mild iodine deficiency may have a clinically significant impact. A number of human studies have shown alterations in the T3:T4 ratio is associated with low selenium and iodine status [39-41]. Therefore, it may be important to determine whether there are any detrimental effects within a population associated with the combination of marginal selenium and iodine status.
The interaction between iodine and selenium is of particular interest in some countries like New Zealand, whose inhabitants have relatively low intakes of both trace elements. The selenium status is lower than that of residents of many other countries [42], even though blood selenium of New Zealanders has increased in recent years due to changes in dietary patterns and increases in selenium concentrations of some foods [43]. Despite iodization of salt since the 1930s, there has been a decrease in iodine status of New Zealanders during the past two decades. We have recently demonstrated that low serum selenium concentrations were highly associated with atherosclerosis in a Saudi male population after adjusting for other risk factors, including erythrocyte GPx [44]. In the current study, we have examined whether thyroid function is related to indices of selenium status in Saudi males without overt CHD, and whether selenium status influences the levels of several established cardiovascular risk factors including serum Lp (a). Our underlying hypothesis was that selenium status may influence thyroid function and this may in turn affect coronary risk. Results and Discussion Demographic, anthropometric, biochemical and clinical characteristics
The demographic and anthropometric data of the subjects are shown in Table 1. The frequency of
coronary risk factors; hypertension, diabetes mellitus and obesity increased with age tertiles (p<0.05). There was no clear distinction between age groups for smoking habit and physical activity. However a significantly higher proportion of the young and middle aged group had a positive smoking habit compared to the older group of subjects (p<0.0001). A large proportion (approximately 30%) of the combined group of middle and older individuals had a history of diabetes mellitus. Fasting glucose levels rose with age, consistent with the high frequency of diabetes in the oldest group (p<0.0001).
Table 1: Demographic and anthropometric characteristics of the subjects investigated divided into tertiles by age.
Variable Age groups (years) p
≤ 30 31-48 ≥ 49 n= 46 47 47
Age (years) 23.4 (16-30) 38.3 (31-48) 61.5 (49-87) Height (cm) 169.9 ± 0.9 167.9 ± 1.2 168.2 ± 1.2 NS Weight (Kg) 75.8 ± 2.5 79.6 ± 2.3 81.3 ± 2.2 NS
Molecules 2009, 14
144
Table 1. Cont.
Body mass index (Kg/m2) 26.3 ± 0.8 28.1 ± 0.7 § 28.8 ± 0.8 * <0.05 Systolic blood pressure (mm Hg) 122.4 ± 1.5 127.9 ± 2.0 125.3 ± 3.2 NS Diastolic blood pressure (mm Hg) 78.8 ± 1.1 83.1 ± 1.3 §¶ 79.4 ± 1.6 <0.05 Hypertensive, n(%) 10 (22) 15 (32) 24 (51) <0.05 Dyslipidemia, n(%) 37 (80) 44 (94) 44 (94) NS Diabetics, n(%) 0 (0) 14 (30) 17 (36) <0.0001 Body mass index, n(%) Normal Overweight Obese
23 (50) 13 (28) 10 (22)
11 (23) 22 (47) 14 (30)
14 (30) 12 (25) 21 (45)
<0.05
Family History, n(%) Heart disease Diabetes mellitus
11 (24) 25 (54)
12 (26) 25 (53)
10 (21) 17 (36)
NS NS
Smoking status, n(%) Never Former Current (< 20 cigarette) Current (≥ 20 cigarette)
30 (65)
4 (9) 4 (9)
8 (17)
19 (40) 6 (13) 7 (15)
15 (32)
27 (57) 15 (32)
1 (2) 4 (9)
<0.001
Physical activity, n(%) < 3 times/week ≥ 3 times/week
13 (28) 33 (72)
14 (30) 33 (70)
12 (25) 35 (75)
NS
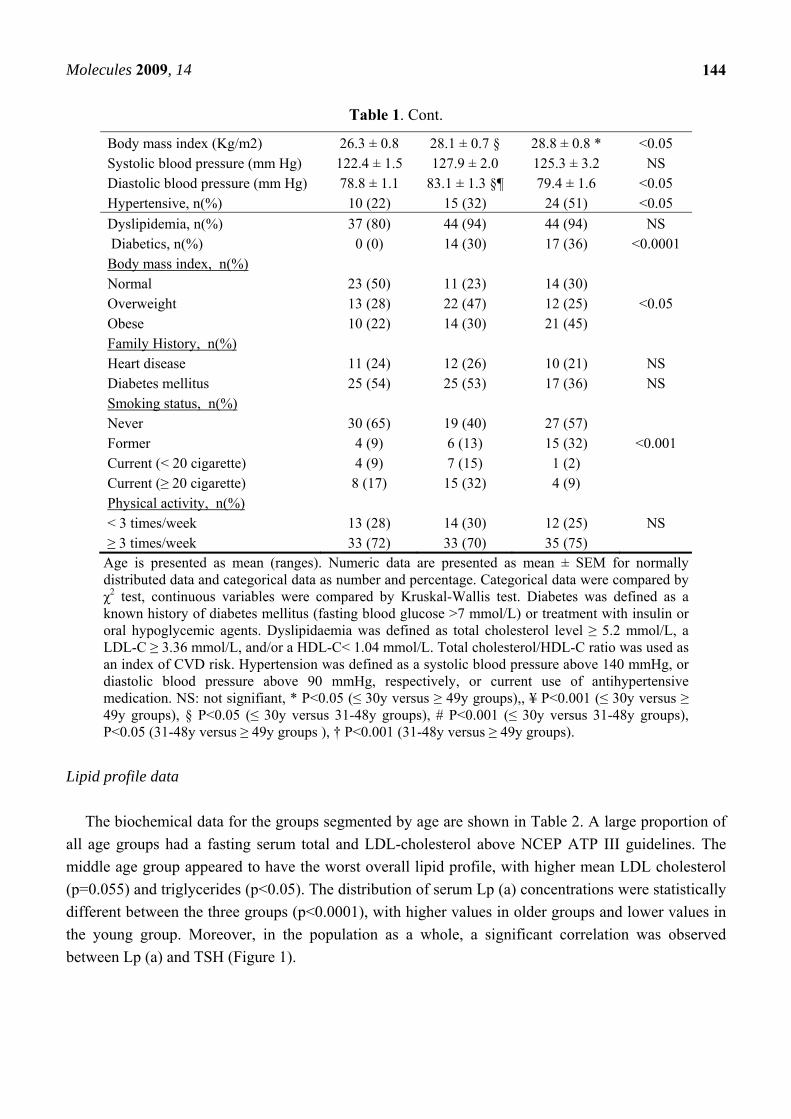
Age is presented as mean (ranges). Numeric data are presented as mean ± SEM for normally distributed data and categorical data as number and percentage. Categorical data were compared by χ2 test, continuous variables were compared by Kruskal-Wallis test. Diabetes was defined as a known history of diabetes mellitus (fasting blood glucose >7 mmol/L) or treatment with insulin or oral hypoglycemic agents. Dyslipidaemia was defined as total cholesterol level ≥ 5.2 mmol/L, a LDL-C ≥ 3.36 mmol/L, and/or a HDL-C< 1.04 mmol/L. Total cholesterol/HDL-C ratio was used as an index of CVD risk. Hypertension was defined as a systolic blood pressure above 140 mmHg, or diastolic blood pressure above 90 mmHg, respectively, or current use of antihypertensive medication. NS: not signifiant, * P<0.05 (≤ 30y versus ≥ 49y groups),, ¥ P<0.001 (≤ 30y versus ≥ 49y groups), § P<0.05 (≤ 30y versus 31-48y groups), # P<0.001 (≤ 30y versus 31-48y groups), P<0.05 (31-48y versus ≥ 49y groups ), † P<0.001 (31-48y versus ≥ 49y groups).
Lipid profile data
The biochemical data for the groups segmented by age are shown in Table 2. A large proportion of
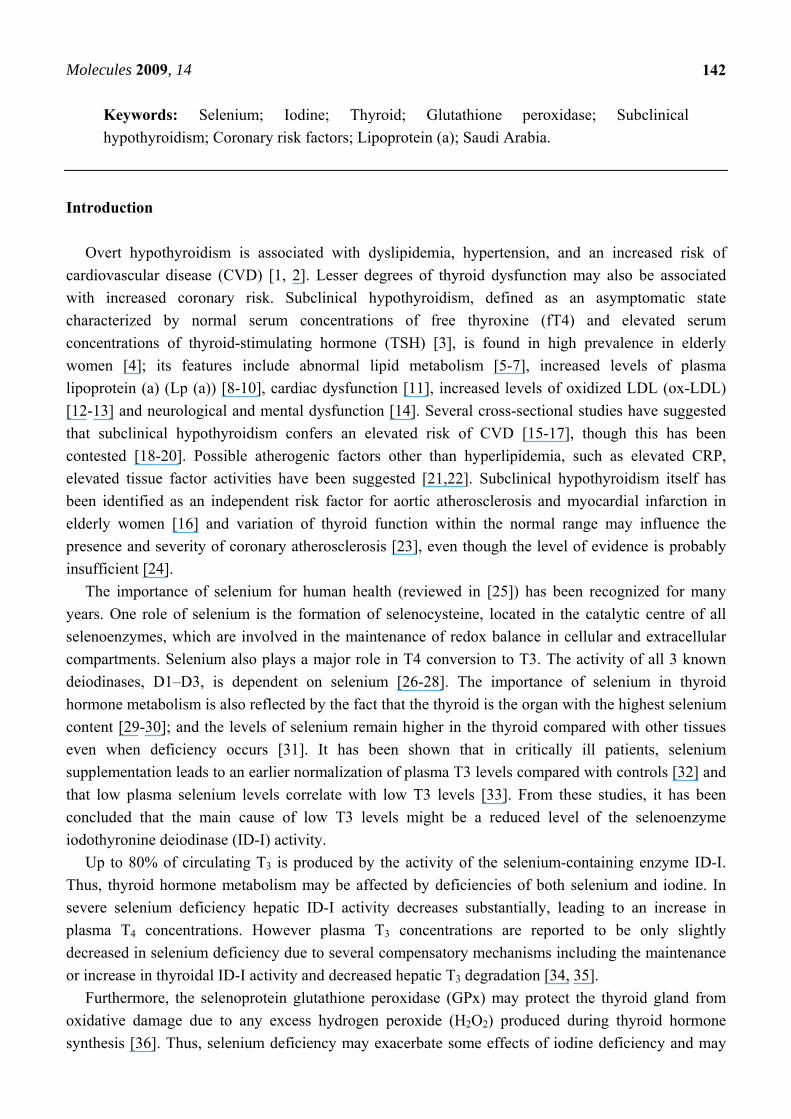
all age groups had a fasting serum total and LDL-cholesterol above NCEP ATP III guidelines. The middle age group appeared to have the worst overall lipid profile, with higher mean LDL cholesterol (p=0.055) and triglycerides (p<0.05). The distribution of serum Lp (a) concentrations were statistically different between the three groups (p<0.0001), with higher values in older groups and lower values in the young group. Moreover, in the population as a whole, a significant correlation was observed between Lp (a) and TSH (Figure 1).
Molecules 2009, 14
145
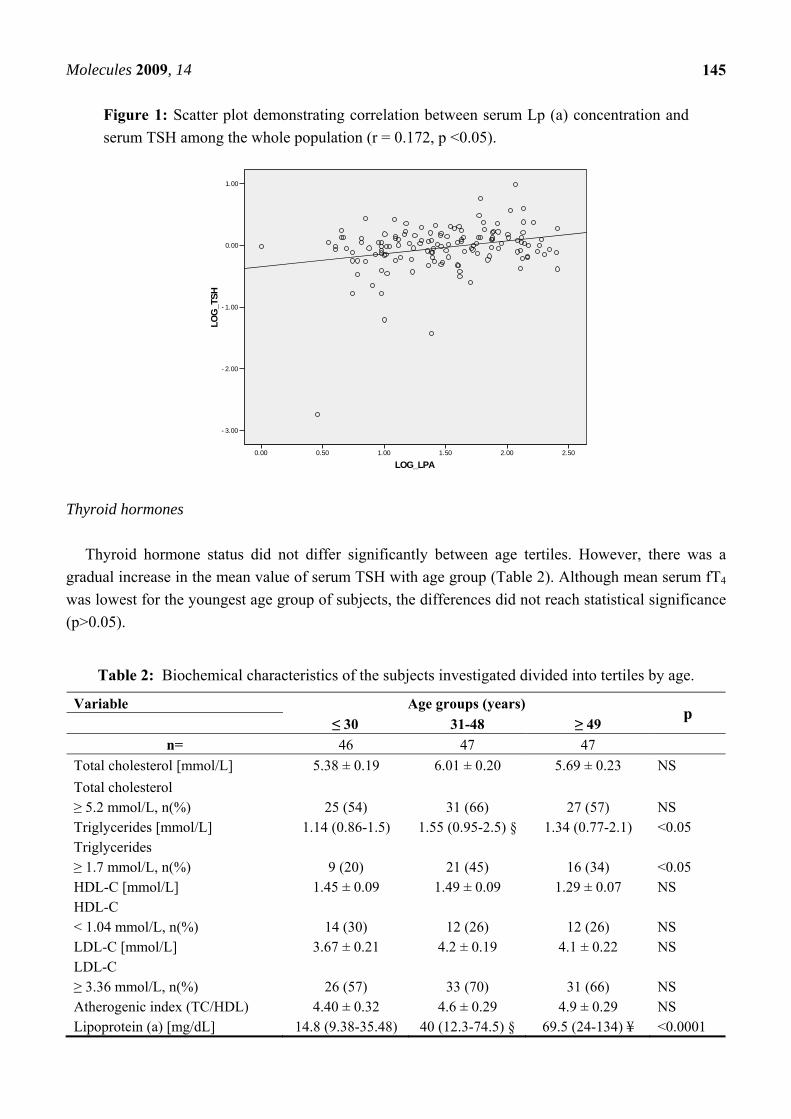
Figure 1: Scatter plot demonstrating correlation between serum Lp (a) concentration and serum TSH among the whole population (r = 0.172, p <0.05).
LOG_LPA2.502.001.501.000.500.00
LOG
_TS
H
1.00
0.00
-1.00
-2.00
-3.00
Thyroid hormones Thyroid hormone status did not differ significantly between age tertiles. However, there was a
gradual increase in the mean value of serum TSH with age group (Table 2). Although mean serum fT4 was lowest for the youngest age group of subjects, the differences did not reach statistical significance (p>0.05).
Table 2: Biochemical characteristics of the subjects investigated divided into tertiles by age.
Variable Age groups (years) p ≤ 30 31-48 ≥ 49
n= 46 47 47 Total cholesterol [mmol/L] 5.38 ± 0.19 6.01 ± 0.20 5.69 ± 0.23 NS Total cholesterol ≥ 5.2 mmol/L, n(%)
25 (54)
31 (66)
27 (57)
NS
Triglycerides [mmol/L] 1.14 (0.86-1.5) 1.55 (0.95-2.5) § 1.34 (0.77-2.1) <0.05 Triglycerides ≥ 1.7 mmol/L, n(%)
9 (20)
21 (45)
16 (34)
<0.05
HDL-C [mmol/L] 1.45 ± 0.09 1.49 ± 0.09 1.29 ± 0.07 NS HDL-C < 1.04 mmol/L, n(%)
14 (30)
12 (26)
12 (26)
NS
LDL-C [mmol/L] 3.67 ± 0.21 4.2 ± 0.19 4.1 ± 0.22 NS LDL-C ≥ 3.36 mmol/L, n(%)
26 (57)
33 (70)
31 (66)
NS
Atherogenic index (TC/HDL) 4.40 ± 0.32 4.6 ± 0.29 4.9 ± 0.29 NS Lipoprotein (a) [mg/dL] 14.8 (9.38-35.48) 40 (12.3-74.5) § 69.5 (24-134) ¥ <0.0001
Molecules 2009, 14
146
Table 2. Cont.
Glucose [mmol/L] (Whole group)
5.37 (4.9-5.8)
5.80 (5.2-7.2) #
6.10 (5.4-9.3) ¥
<0.0001
(Diabetics) - 9.2 (7.9-12.1) 10.2 (8.6-12.0) NS (Non-diabetics) 5.37 (4.9-5.8) 5.46 (5.2-5.9) 5.5 (5.2-6.0) NS TSH (mIU/L) 1.03 ± 0.08 1.2 ± 0.14 1.4 ± 0.21 NS fT4 (pmol/L) 23.9 ± 0.44 23.9 ± 0.56 25.1 ± 0.59 NS Subclinical hypothyroidism TSH> 4.2 mIU/L & normal fT4, n(%)
0 (0%)
1 (2%)
1 (2%)
NS
Serum Selenium (μmol/L) 0.40 ± 0.04 0.48 ± 0.06 0.51 ± 0.04 NS Urine Selenium (μmol/mol creatinine)
1.48 ± 0.21 1.29 ± 0.19 1.07 ± 0.12 NS
Erythrocytes GPx (IU/ gm Hb) 113.4 ± 8.6 ¥ 111.5 ± 13.6 72.5 ± 7.4 <0.05 Numeric data are presented as mean ± SEM for normally distributed data and as median (interquartile range) for non-normally distributed data. Continuous variables were compared by Kruskal-Wallis test. fT4: free thyroxine, GPx: glutathione peroxidase, HDL-C: high density lipoprotein cholesterol, LDL-C: low density lipoprotein cholesterol, NS: not significant, TSH: Thyroid Stimulating Hormone. ¥ P<0.001 (≤ 30 y versus ≥ 49 y groups), § P<0.05 (≤ 30 y versus 31-48 y groups), # P<0.001 (≤ 30 y versus 31-48 y groups).
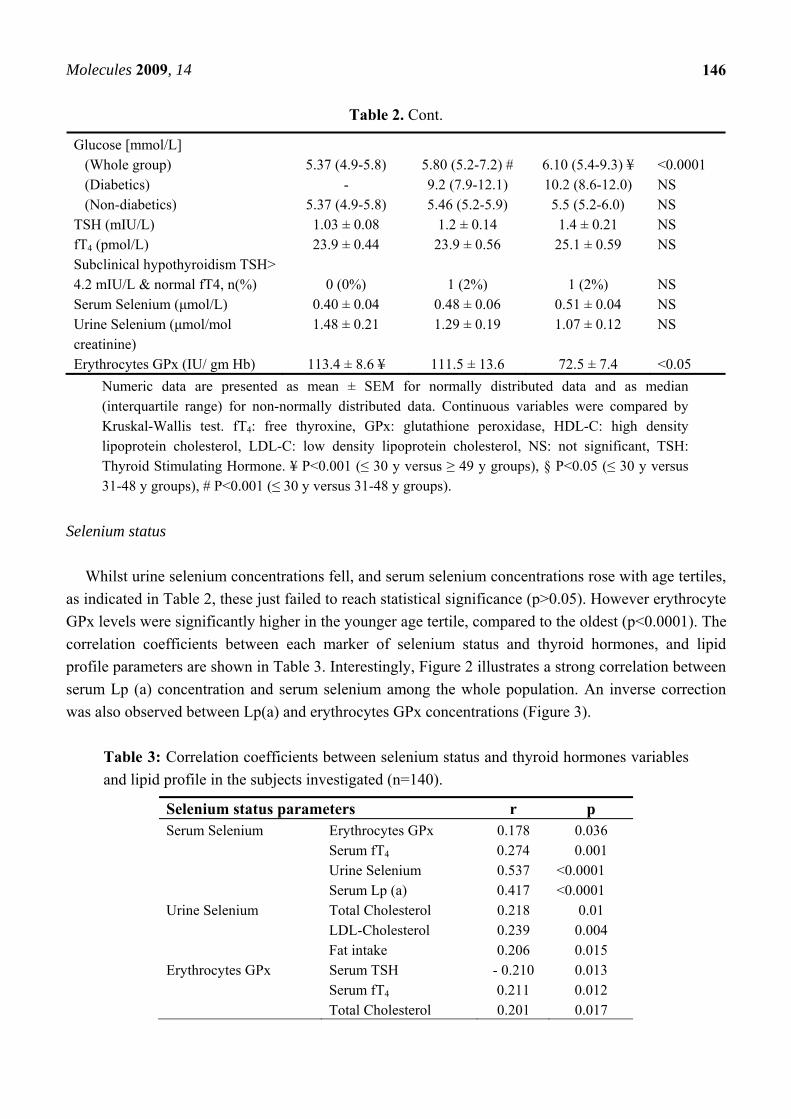
Selenium status Whilst urine selenium concentrations fell, and serum selenium concentrations rose with age tertiles,
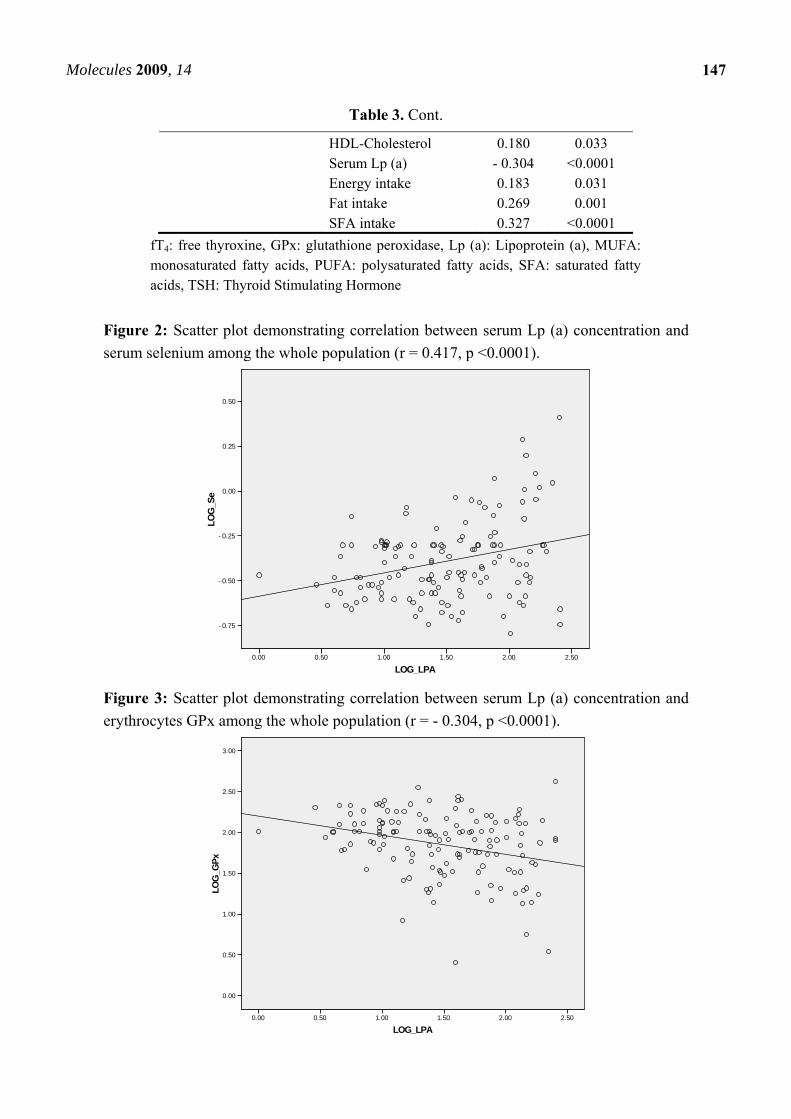
as indicated in Table 2, these just failed to reach statistical significance (p>0.05). However erythrocyte GPx levels were significantly higher in the younger age tertile, compared to the oldest (p<0.0001). The correlation coefficients between each marker of selenium status and thyroid hormones, and lipid profile parameters are shown in Table 3. Interestingly, Figure 2 illustrates a strong correlation between serum Lp (a) concentration and serum selenium among the whole population. An inverse correction was also observed between Lp(a) and erythrocytes GPx concentrations (Figure 3).
Table 3: Correlation coefficients between selenium status and thyroid hormones variables and lipid profile in the subjects investigated (n=140).
Selenium status parameters r p Serum Selenium Erythrocytes GPx 0.178 0.036 Serum fT4 0.274 0.001 Urine Selenium 0.537 <0.0001 Serum Lp (a) 0.417 <0.0001 Urine Selenium Total Cholesterol 0.218 0.01 LDL-Cholesterol 0.239 0.004 Fat intake 0.206 0.015 Erythrocytes GPx Serum TSH - 0.210 0.013 Serum fT4 0.211 0.012 Total Cholesterol 0.201 0.017
Molecules 2009, 14
147
Table 3. Cont.
HDL-Cholesterol 0.180 0.033 Serum Lp (a) - 0.304 <0.0001 Energy intake 0.183 0.031 Fat intake 0.269 0.001 SFA intake 0.327 <0.0001
fT4: free thyroxine, GPx: glutathione peroxidase, Lp (a): Lipoprotein (a), MUFA: monosaturated fatty acids, PUFA: polysaturated fatty acids, SFA: saturated fatty acids, TSH: Thyroid Stimulating Hormone
Figure 2: Scatter plot demonstrating correlation between serum Lp (a) concentration and serum selenium among the whole population (r = 0.417, p <0.0001).
LOG_LPA2.502.001.501.000.500.00
LOG
_Se
0.50
0.25
0.00
-0.25
-0.50
-0.75
Figure 3: Scatter plot demonstrating correlation between serum Lp (a) concentration and erythrocytes GPx among the whole population (r = - 0.304, p <0.0001).
LOG_LPA2.502.001.501.000.500.00
LOG
_GP
x
3.00
2.50
2.00
1.50
1.00
0.50
0.00

Molecules 2009, 14
148
Table 4: Dietary characteristics of the subjects investigated divided into tertiles by age.
Numeric data are presented as mean ± SEM and categorical data as number and percentage. Categorical data were compared by χ2 test, continuous variables were compared by Kruskal-Wallis test. EAR: estimated average requirements, MUFA: monounsaturated fatty acids, NS: not significant, P:S ratio: polyunsaturated fatty acids: saturated fatty acids ratio, PUFA: polyunsaturated fatty acids, RNI: reference nutrient intake, SFA: saturated fatty acids, * P<0.05 (≤ 30y versus ≥ 49y groups), ¥ P<0.001 (≤ 30y versus ≥ 49y groups), § P<0.05 (≤ 30y versus 31-48y groups)
Nutrient RNI Age groups (years) p ≤ 30 31-48 ≥ 49
n= 46 47 47 On a diet, n(%) 4 (9) 11 (23) 10 (21) NS Energy (Kcal) 2755 (15-18)
2550 (19-59) 2380 (60-74) 2100 (75+)
2188.7 ± 66.2 ¥
2010.6 ± 64.7
1840.0 ± 62.8
<0.001
Total fat (gm) % of energy
30 %
92.6 ± 3.01 *
38.3 ± 0.72
85.0 ± 3.69
38.1 ± 1.02
79.5 ± 3.59
38.5 ± 0.88
<0.05
NS Cholesterol (mg) Categories of cholesterol intake n(%)
< 200 mg ≥ 200 mg
313.2 ± 15.5 ¥
2 (4) 44 (96)
272.1 ± 18.6
15 (32) 32 (68)
238.1 ± 14.9
21 (45) 26 (55)
<0.05
<0.001
SFA (gm) % of energy
10%
32.7 ± 1.3 §¥
15.0 ± 0.40
27.8 ± 1.64
13.7 ± 0.55
26.0 ± 1.42
13.9 ± 0.51
<0.05
NS
MUFA (gm) % of energy
10%
31.8 ± 1.0
14.7 ± 0.34
30.1 ± 1.37
15.1 ± 0.48
28.0 ± 1.29
15.1 ± 0.38
NS
NS
PUFA (gm) % of energy
10%
18.4 ± 0.85
8.4 ± 0.32
18.2 ± 0.83
9.1 ± 0.32
17.2 ± 0.96
9.3 ± 0.40
NS
NS
P:S ratio
NA
0.58 ± 0.03
0.71 ± 0.04 §
0.72 ± 0.05 *
<0.05
Selenium (μg) Se intake <EAR
75 μg
< 57.7 μg
47.9 ± 2.2
40 (87)
46.1 ± 2.7
41 (87)
41.7 ± 1.8
40 (85)
NS
NS Iodine (μg) I2 intake <EAR
150 μg
<115.4 μg
133.8 ± 8.7
15 (33)
133.9 ± 8.7
25 (53)
115.8 ± 5.9
25 (53)
NS
NS
Molecules 2009, 14
149
Dietary intake
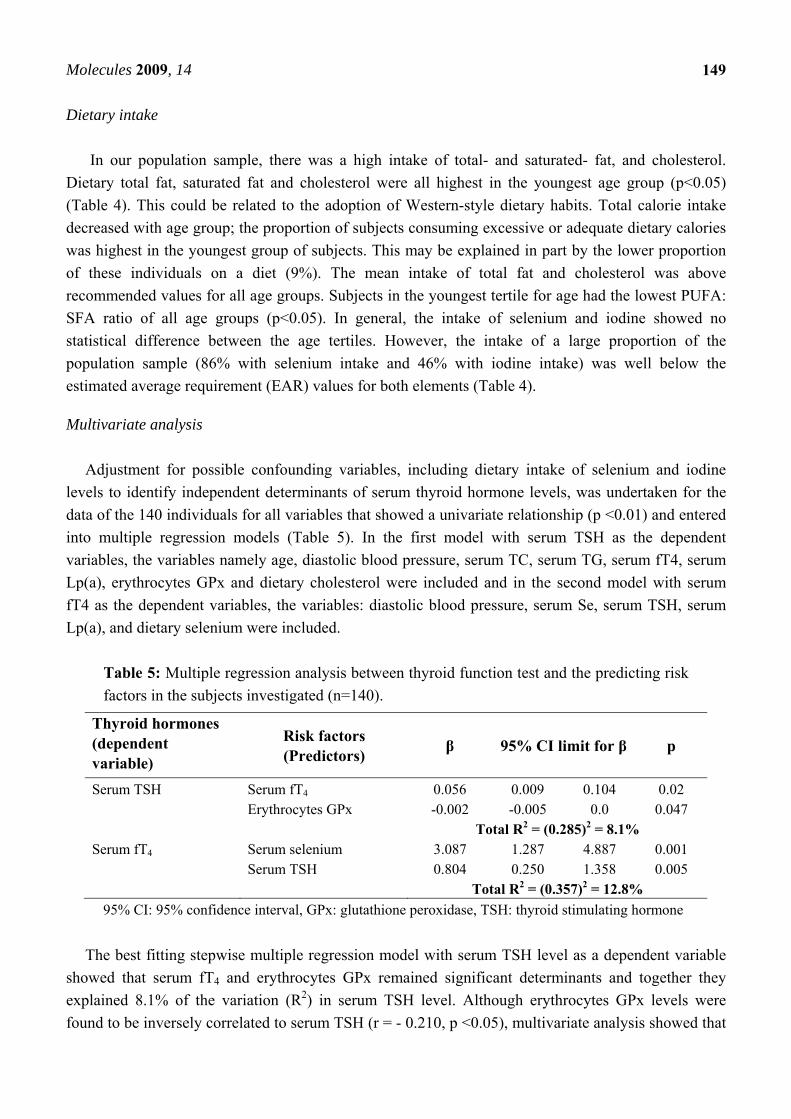
In our population sample, there was a high intake of total- and saturated- fat, and cholesterol. Dietary total fat, saturated fat and cholesterol were all highest in the youngest age group (p<0.05) (Table 4). This could be related to the adoption of Western-style dietary habits. Total calorie intake decreased with age group; the proportion of subjects consuming excessive or adequate dietary calories was highest in the youngest group of subjects. This may be explained in part by the lower proportion of these individuals on a diet (9%). The mean intake of total fat and cholesterol was above recommended values for all age groups. Subjects in the youngest tertile for age had the lowest PUFA: SFA ratio of all age groups (p<0.05). In general, the intake of selenium and iodine showed no statistical difference between the age tertiles. However, the intake of a large proportion of the population sample (86% with selenium intake and 46% with iodine intake) was well below the estimated average requirement (EAR) values for both elements (Table 4).
Multivariate analysis Adjustment for possible confounding variables, including dietary intake of selenium and iodine
levels to identify independent determinants of serum thyroid hormone levels, was undertaken for the data of the 140 individuals for all variables that showed a univariate relationship (p <0.01) and entered into multiple regression models (Table 5). In the first model with serum TSH as the dependent variables, the variables namely age, diastolic blood pressure, serum TC, serum TG, serum fT4, serum Lp(a), erythrocytes GPx and dietary cholesterol were included and in the second model with serum fT4 as the dependent variables, the variables: diastolic blood pressure, serum Se, serum TSH, serum Lp(a), and dietary selenium were included.
Table 5: Multiple regression analysis between thyroid function test and the predicting risk factors in the subjects investigated (n=140).
Thyroid hormones (dependent variable)
Risk factors (Predictors) β 95% CI limit for β p
Serum TSH Serum fT4 0.056 0.009 0.104 0.02 Erythrocytes GPx -0.002 -0.005 0.0 0.047 Total R2 = (0.285)2 = 8.1% Serum fT4 Serum selenium 3.087 1.287 4.887 0.001 Serum TSH 0.804 0.250 1.358 0.005 Total R2 = (0.357)2 = 12.8%
95% CI: 95% confidence interval, GPx: glutathione peroxidase, TSH: thyroid stimulating hormone
The best fitting stepwise multiple regression model with serum TSH level as a dependent variable showed that serum fT4 and erythrocytes GPx remained significant determinants and together they explained 8.1% of the variation (R2) in serum TSH level. Although erythrocytes GPx levels were found to be inversely correlated to serum TSH (r = - 0.210, p <0.05), multivariate analysis showed that
Molecules 2009, 14
150
the relationship was statistically independent of other factors entered into the model and alone predicting 2.7% of the variation in serum TSH level.
Using a similar approach for serum fT4 as a dependent variable in another stepwise multiple regression model that explained 12.8% of the variation (R2) in its concentration, serum selenium and TSH levels were found to be independent predictors in which serum selenium alone explained 5.3% of the variation. To the best of our knowledge, this is the first study reporting the association between measures of selenium status, including dietary intake, and indices of thyroid function and coronary risk. Demographic and Biochemical data
There have been previous reports of a high prevalence of coronary risk factors in Saudi Arabia [45],
and our findings in this study accord with this. In our sample of Saudi males, there was a high prevalence of classical coronary risk factors, including dyslipidaemia, diabetes mellitus, hypertension, obesity and a positive smoking habit. There were significant differences in the distribution of these risk factors between the age groups. Selenium and Thyroid hormone status
Previous case-control and cross-sectional studies on the association between subclinical
hypothyroidism, selenium status and CHD are inconsistent [15, 20, 46-50]. The overall prevalence of subclinical hypothyroidism in our sample was 4%, similar to the previously reported prevalence in the general population [51].
The higher risk of CVD associated with hypothyroidism may be because of its association with elevated serum LDL-C concentrations [52, 53]. It has also previously been reported that concentrations of serum Lp (a), another established CVD risk factor, are raised in subclinical hypothyroidism [10,54], and in this present study, serum selenium (r=0.417, p<0.0001) and erythrocyte GPx (r=- 0.304, p<0.0001) were both strongly associated with serum Lp (a) concentrations. Univariate analysis has shown that serum Lp (a) level was significantly correlated with both serum TSH and fT4 levels. However, multivariate analysis showed that the relationship was not totally independent of other factors entered into the model and therefore lost its statistical significance.
It has been postulated that diabetes may affect selenium status in hypothyroidism patients, compared to their pretreatment levels with hormone replacement therapy [18]. Our data were reanalyzed after excluding the diabetic subjects in order to check whether diabetes was indeed associated with selenium status in this population, but this factor was not found to be of significance (p>0.05) and therefore, it is unlikely that diabetes affected the validity of our results.
Overall, our population sample had low indices of selenium and iodine status. However, the indices we have measured may not reflect the total body selenium content, nor reflect the tissue specific distribution of the selenoenzymes [55]. For example the thyroid contains more selenium per gram of tissue than any other organ [56] and this may be less affected during dietary selenium insufficiency.
Molecules 2009, 14
151
Dietary intake data
Thyroid hormone metabolism is sensitive to the total dietary energy and carbohydrate content [57] and it may also be affected by other dietary components including iodine [58] and iron [59]. There is a possibility of synergistic effects of selenium and iodine deficiencies on thyroid function in our population sample given the high prevalence of individuals consuming both selenium and iodine below the EAR (86% and 46% respectively). High dietary iron content might also interfere with selenium bioavailability [60]. The strong associations between indices of selenium status and indices of thyroid function are consistent with the hypothesis that GPx may protect the thyroid follicular cells from oxidative damage following H2O2 release during thyroid hormone synthesis [38]. This might be illustrated by the positive association between erythrocyte GPx and the components of atherogenic diet: energy, total fat and saturated fat (Table 3). The effect of dietary fatty acids on concentrations of serum cholesterol and particularly LDL-C is well documented [61]. Previous studies have demonstrated positive correlation between high levels of lipid peroxidation and atherogenic lipid profile [62]. Multiple regression models
Multiple regression analysis was performed to adjust the data for the possible effects of
confounding factors, between markers of thyroid status and coronary risk factors in the whole population. Surprisingly, dietary selenium and iodine intake were no longer related to thyroid status in the population after this adjustment.
According to these models, serum TSH can be predicted by erythrocyte GPx concentration and serum fT4 can also be predicted by serum selenium level. This is consistent with previous reports on the protective effects of GPx against the oxidative damage of H2O2 [38]. Although GPx require selenium for its function and play an important role in thyroid hormone metabolism, available data suggest that the effect of selenium deficiency on thyroid function is relatively modest and the functional effects of low selenium status on thyroid function in humans have so far not been fully characterized [37]. Conclusions
Thyroid disorders are known to influence lipid metabolism and are common in dyslipidemic
patients. In our population sample of Saudi males without clinically overt CVD we found a significant relationship between measures of selenium status and tests of thyroid function. Although the mild perturbation of selenium status seen in our population sample may not be expected to affect thyroid function in isolation, the combination of low selenium status and mild iodine deficiency may indeed have a significant effect. The associations between selenium status and thyroid function may explain, in part, the inconsistent reports of an association between thyroid and selenium status and CVD. The impact of selenium deficiency on thyroid function is likely to be dependent on other factors such as iodine sufficiency that may vary with the population under investigation. Additional research should be done to determine whether this association can be confirmed in a prospective study.
Molecules 2009, 14
152
Experimental Subject recruitment
One hundred and forty male subjects without clinically evident coronary disease were recruited
from the Outpatients’ departments of King Abdul Aziz University Hospital and The King Fahad Armed Forces Hospital, Jeddah, Kingdom of Saudi Arabia based on their cardiologists’s decision. They were usually referred for risk factor modification, principally hyperlipidemia, hypertension, and diabetes mellitus, but were free from overt coronary disease. The absence of CVD was confirmed by medical measurements performed routinely and they include ECG recording and blood cardiac enzymes. Their age varied between 16 and 87 years. On direct questioning, the subjects reported no history of CHD symptoms, and had no personal history of acute coronary syndrome (including prior acute coronary events, percutaneous transluminal coronary angioplasty (PTCA) or bypass surgery), a history of heart failure, vascular disease (i.e. peripheral vascular disease, cerebrovascular disease) documented in their medical notes. We also excluded those patients who had co-morbidities (malignancy, hepatic, or renal failure). No patient received any medication such as amiodarone, thyroid hormones or iodine-containing agents that could alter thyroid function, or those on treatment with statins, antioxidants or aspirin. The local ethics committee of the hospital approved the study. Blood samples
Fasting venous blood samples were taken after an overnight fast and placed into plain, or
heparinized tubes. Tubes were centrifuged at 3000 x g for 10 min. The serum obtained was separated and frozen at -80oC until the time of analysis. Urine samples were collected in polyethylene containers and centrifuged at 3000 g for 10 minutes. The supernatant obtained was separated and frozen at -80oC until the time of analysis. Demographic, anthropometric, biochemical and clinical characteristics
Subjects were interviewed to complete a questionnaire, concerning their demographic
characteristics. These included: age, personal and family health history (premature heart disease, diabetes and dyslipidaemia), lifestyle habits (e.g. smoking habit and physical activity levels) and diet. Weight, body mass index (BMI), systolic and diastolic blood pressure were assessed for each subject using routine procedures.
Dyslipidaemia was defined as total cholesterol level ≥ 5.2 mmol/L, a LDL-C ≥ 3.36 mmol/L, and/or a HDL-C< 1.04 mmol/L. Total cholesterol/HDL-C ratio was used as an index of CVD risk [63].
Hypertension was defined as a systolic blood pressure above 140 mmHg, or diastolic blood pressure above 90 mmHg, respectively, or current use of antihypertensive medication.
Diabetes was defined as a known history of diabetes mellitus (fasting blood glucose >7 mmol/L) or treatment with insulin or oral hypoglycemic agents [64].
In subjects with negative history of consumption of thyroid or antithyroid drugs, lithium, estrogens or androgens during the previous month, “overt hypothyroidism” was defined as elevated TSH and
Molecules 2009, 14
153
low fT4, “subclinical hypothyroidism” as elevated TSH and normal fT4. The level of overt hypothyroidism was defined as both TSH>4.2 mIU/L and fT4<10.3 pmol/L, while that of subclinical hypothyroidism as both TSH>4.2 mIU/L and normal fT4 [65]. However, no case of overt hypothyroidism was observed in our study.
BMI was calculated as weight in kg/height2 in m2, and classified into normal; defined as BMI<25 kg/m2, overweight as BMI = 25–29.9 kg/m2, obese as BMI≥30 kg/m2.
Smoking habit was categorized as non-smoker, former smoker, and current smoker. Current smokers were further categorized into those who smoke <20 cigarettes/ day and those who smoke ≥20 cigarettes/day.
Physical activity was self-graded by the participant according to the number of episodes of exercise undertaken per week and were categorized as active (≥3 times/week) or inactive (<3 times/week) according to the recommendations of the American Heart Association consensus statement on primary prevention of coronary diseases and from the USA Surgeon General’s report. Routine analytical methods
Glucose was measured enzymatically by a routine glucose oxidase method. Total cholesterol and
triglycerides were measured enzymatically by a colorimetric end-point method. HDL cholesterol was measured using a phosphotungstate magnesium precipitation method. LDL was calculated using the Friedewald formula in samples where the triglycerides were <4 mmol/L [66].
Thyroid function test included only TSH and fT4 and were assayed using a competitive immunoassay commercial kit (BioKit, S.A., Spain). The following reference intervals were determined: TSH, 0.27–4.2 mIU/L; fT4, 0.84–1.42 ng/dl (12– 22 pmol/L). Intra- and inter-assay coefficients of variation were ≤5.6 and ≤9.1% for TSH, ≤3.8 and ≤5.6% for fT4, respectively. Serum Lipoprotein (a) Assay
Serum Lp (a) concentrations were measured in duplicate, using an ELISA assay kit (Biopool, CA,
USA) following the manufacturers recommended technique. Intra- and inter-assay coefficients of variation were <10% and <20% respectively. Erythrocyte glutathione peroxidase activity
GPx activity was measured in erythrocyte lysates as a functional assessment of selenium status,
using Randox kits (Randox Laboratories Ltd, UK). The red blood cell suspensions were prepared from phosphate buffered saline (PBS) washed red blood cells after removal of plasma. The red cells were washed thrice with PBS at 4oC. Cells were then re-suspended to their original volume with PBS. Erythrocyte hemolysates were obtained by adding 4 volumes of de-ionized distilled water to 1 volume of red blood cell suspension. The lysate was frozen at -80oC until the time of analysis.
Measurement of GPx activity was based on the method of Paglia and Valentine [67]. The activity was expressed in U/g of haemoglobin in erythrocytes. The intra-assay and inter-assay coefficients of variation for each variable was found to be < 8% and < 15% respectively.

Molecules 2009, 14
154
Trace element analysis All reagents were of at least analytical grade and supplied by Sigma-Aldrich chemicals (Sigma-
Aldrich Ltd, ON, Canada) unless indicated otherwise. All glass or plastic ware used for trace elements determination were cleaned by soaking overnight in 10% (v/v) hydrochloric acid, followed by thorough rinsing with de-ionized distilled water and drying. Aqueous solutions were made up in de-ionized distilled water.
Trace element content was measured by atomic absorption spectrophotometer on a SOLAAR M5 (Thermo Electron, Cambridge, UK) with a deuterium background corrector. Serum selenium was measured using a GF95 graphite furnace with auto-sampler. Argon gas was used as the purging gas. Urine selenium was measured using a VP90 continuous flow vapour system. Urine samples were used to prepare a standard curve in the standard addition method. To avoid matrix interference using the graphite furnace, the standard addition method for calibration was used. Serum samples were diluted (1:4) with 0.05% Triton-X 100 in 0.125% (v/v) nitric acid. Nickel in nitric acid was used as a matrix modifier in order to determine serum selenium content. For the hydride generation method, samples were digested with nitric, sulphuric, and perchloric acids to a final temperature of 310oC [68]. Hydride generation was carried out using a solution of 5% (w/v) of NaBH4 dissolved in 1% (w/v) NaOH solution and 1.5% (v/v) HCl. The urinary output of trace elements was expressed in mg/mol of creatinine. The intra-assay and inter-assay coefficients of variation for each variable was found to be < 8% and < 15% respectively. Assessment of dietary intake
Dietary intake over the previous year was assessed using a previously validated semi-quantitative
food frequency questionnaire (FFQ) [70]. The nutrient database used was based on UK food composition tables together with food composition tables for use in East Asia and the United States handbook of food composition. The estimated dietary intake of all nutrients was calculated in terms of percentage recommended nutritional intake (%RNI for UK adults) for each individual, as there are no published data for a Saudi population. Statistical analysis
Data are presented as mean and standard deviation for normally distributed data, or as median and
interquartile ranges for non-parametric data. Variables that showed a skewed distribution were log transformed before analyses and then back transformed to their natural units for presentation. Statistical analyses were performed using ANOVA test for normally distributed parameters or Kruskall-Wallis test for non-normally distributed parameters to compare mean values of repeated measures of non-normally distributed parameters. If a significant difference was found, a Bonferroni corrections were made for multiple comparisons to determine differences between each pair of groups. A χ2 test was used for comparison of categoric data.
Associations were also assessed using Pearson’s and Spearman’s correlation coefficients. Stepwise multiple regression analysis was used to model the association between each selenium status marker
Molecules 2009, 14
155
with all independent variables with p value up to 0.1 to demonstrate their contribution to subclinical hypothyroidism. A p <0.05 was considered statistically significant. All statistical analysis was carried out with SPSS, version 11.5 software. Acknowledgements
Eman Mokbel Alissa was supported by a scholarship from the joint supervision programme of the
King Abdul Aziz University. References and Notes 1. Klein, I.; Ojamaa, K. The cardiovascular system in hypothyroidism. In Werner and Ingbar’s the
Thyroid. 7th Ed.; Braverman L.E., Utiger R.D., Eds.; Lippincott–Raven: Philadelphia, USA, 1996. pp. 799-804.
2. Meier, C.; Staub, J.; Roth, C.; Guglielmetti, M.; Kunz, M.; Miserez, A.R.; Drewe, J.; Huber, P.; Herzog, R.; Müller, B. TSH-controlled L-thyroxine therapy reduces cholesterol leves and clinical symptoms in subclinical hypothyroidism: a double blind, placebo-controlled trial (Basel thyroid study). J. Clin. Endocrinol. Metab. 2001, 86, 4860-4866
3. Helfand, M.; Redfern, C.C. Clinical guideline, part 2. Screening for thyroid disease: an update. American College of Physicians. Ann. Intern. Med. 1998, 129, 144-158.
4. Sawin, C. Castelli, W.; Hershman, J.; Bacharach, P. The aging thyroid. Thyroid deficiency in the Framingham Study. Arch. Intern. Med. 1985, 145, 1386-1388.
5. Althaus, B.; Staub, J.; Ryff-De Leche, A.; Oberhänsli, A.; Stähelin, H.B. LDL/HDL-changes in subclinical hypothyroidism: possible risk factors for coronary heart disease. Clin. Endocrinol. 1988; 28, 157-163.
6. Caron, P.; Calazel, C.; Parra, H.; Hoff, M.; Louvet, J.P. Decreased HDL cholesterol in subclinical hypothyroidism: the effect of l-thyroxine therapy. Clin. Endocrinol. 1990, 33, 519-523
7. Pucci, E.; Chiovato, L.; Pinchera, A. Thyroid and lipid metabolism. Int. J. Obes. Relat. Metab. Disord. 2000, 24(Suppl 2), S109-S112.
8. Becerra, A.; Bellido, D.; Luengo, A.; Piédrola, G.; De Luis, D.A. Lipoprotein (a) and other lipoproteins in hypothyroid patients before and after thyroid replacement therapy. Clin. Nutr. 1999, 18, 319e322
9. Erem, C.; Deger, O.; Bostan, M.; Orem, A.; Sönmez, M.; Ulusoy, S.; Telatar, M. Plasma lipoprotein (a) concentrations in hypothyroid, euthyroid and hyperthyroid subjects. Acta Cardiol. 1999, 54, 77-81.
10. Kung, A.; Pang, R.; Janus, E. Elevated serum lipoprotein (a) in subclinical hypothyroidism. Clin. Endocrinol. 1995, 43, 445e449
11. Kahaly, G. Cardiovascular and atherogenic aspects of subclinical hypothyroidism. Thyroid 2000, 10, 665-679.
12. Duntas, L. Thyroid disease and lipids. Thyroid 2002, 12, 287-293. 13. Duntas, L.; Mantzou, E.; Koutras, D. Circulating levels of oxidized low-density lipoprotein in
overt and mild hypothyroidism. Thyroid 2002, 12, 1003-1007.
Molecules 2009, 14
156
14. Monzani, F.; Del Guerra, P.; Caraccio, N.; Pruneti, C.A.; Pucci, E.; Luisi, M.; Baschieri, L. Subclinical hypothyroidism: neurobehavioral features and beneficial effect of l-thyroxine treatment. Clin. Investig. 1993, 71, 367-371.
15. Dean, J.; Fowler, P. Exaggerated responsiveness to thyrotrophin releasing hormone: a risk factor in women with coronary artery disease. Br. Med. J. (Clin. Res. Ed.) 1985, 290, 1555-1561.
16. Hak, A.E.; Pols, H.A.; Visser, T.J.; Drexhage, H.A.; Hofman, A.; Witteman, J.C. Subclinical hypothyroidism is an independent risk factor for atherosclerosis and myocardial infarction in elderly women: the Rotterdam Study. Ann. Intern. Med. 2000, 132, 270-278.
17. Tièche, M.; Lupi, G.; Gutzwiller, F.; Grob, P.J. ; Studer, H.; Bürgi, H. Borderline low thyroid function and thyroid autoimmunity. Risk factors for CHD? Br. Heart J. 1981, 46, 202-206.
18. Erdal, M. ; Sahin, M. ; Hasimi, A.; Uckaya, G.; Kutlu, M.; Saglam, K. Trace element levels in hashimoto thyroiditis patients with subclinical hypothyroidism. Biol. Trace Elem. Res. 2008, 123, 1-7.
19. Tunbridge, W.; Evered, D.; Hall, R.; Appleton, D.; Brewis, M.; Clark, F.; Evans, J.G.; Young, E.; Bird, T.; Smith, P.A. The spectrum of thyroid disease in a community: the Wickham survey. Clin. Endocrinol. 1977, 7, 481-493.
20. Heinonen, O.; Gordón, A.; Aho, K.; Punsar, S.; Pyörälä, K.; Puro, K. Symptomless autoimmune thyroiditis in coronary heart-disease. Lancet 1972, 1, 785-786.
21. Tuzcu, A.; Bahceci, M.; Gokalp, D.; Tuzun, Y.; Gunes, K. Subclinical hypothyroidism may be associated with elevated high-sensitive c reactive protein (low grade inflammation) and fasting hyperinsulinemia. Endocr. J. 2005, 52, 89-94.
22. Alturfan, A.; Alturfan, E.; Dariyerli, N.; et al. Investigation of tissue factor and other hemostatic profiles in experimental hypothyroidism. Endocrine 2006, 30, 63-67
23. Auer, J.; Berent, R.; Weber, T.; Lassnig, E.; Eber, B. Thyroid function is associated with presence and severity of coronary atherosclerosis. Clin. Cardiol. 2003, 26, 569-573.
24. Helfand, M. Screening for subclinical thyroid dysfunction in nonpregnant adults: A summary of the evidence for the U.S. Preventive Services Task Force. Ann. Intern. Med. 2004, 140, 128-141.
25. Rayman, M.P. The importance of selenium to human health. Lancet 2000, 356, 233-241. 26. Behne, D.; Kyriakopoulos, A.; Meinhold, H.; Köhrle, J. Identification of type I iodothyronine 50-
deiodinase as a selenoenzyme. Biochem. Biophys. Res. Commun. 1990, 173, 1143-1149. 27. Berry, M.; Banu, L.; Larsen, P. Type I iodothyronine deiodinase is a selenocysteine- containing
enzyme. Nature 1991, 349, 438-440. 28. Bianco, A.; Salvatore, D.; Gereben, B.; Berry, M.J.; Larsen, P.R. Biochemistry, cellular and
molecular biology, and physiological roles of the iodothyronine selenodeiodinases. Endocr. Rev. 2002, 23, 38-89.
29. Koehrle, J. Local activation and inactivation of thyroid hormones: the deiodinase family. Mol. Cell Endocr. 1999, 151, 103-119.
30. Oster, O.; Schmiedel, G.; Prellwitz, W. The organ distribution of selenium in German adults. Biolog. Trace Elem. Res. 1988, 15, 23-45.
31. Bates, J.; Spate, V.; Morris, J.; St Germain, D.L.; Galton, V.A. Effects of selenium deficiency on tissue selenium content, deiodinase activity, and thyroid economy in the rat during development. Endocrinology 2000, 141, 2490-2500.
Molecules 2009, 14
157
32. Berger, M.; Reymond, M.; Shenkin, A.; Rey, F.; Wardle, C.; Cayeux, C.; Schindler, C.; Chioléro, R.L. Influence of selenium supplements on the post-traumatic alterations of the thyroid axis: a placebo-controlled trial. Intensive Care Med. 2001, 27, 91-100.
33. Forceville, X. Selenium and the ‘free’ electron, Selenium – a trace to be followed in septic or inflammatory ICU patients? Intensive Care Med. 2001, 27, 16-18.
34. Beckett, G.; Russell, A.; Nicol, F.; Sahu, P.; Wolf, C.R.; Arthur, J.R. Effect of selenium deficiency on hepatic type I 5-iodothyronine deiodinase activity and hepatic thyroid hormone levels in the rat. Biochem. J. 1992, 282, 483-486.
35. Chanoine, J.; Safran, M.; Farwell, A.; Dubord, S.; Alex, S.; Stone, S.; Arthur, J.R.; Braverman, L.E.; Leonard, J.L. Effects of selenium deficiency on thyroid hormone economy in rats. Endocrinology 1992, 131, 1787-1792
36. Arthur, J.R.; Beckett, G.J. Roles of selenium in type I iodothyronine 50-deiodinase and in thyroid hormone and iodine metabolism. In Selenium in Biology and Human Health, Ed.; Burk, R.F. Springer-Verlag: New York, USA, 1994; pp. 93-116.
37. Arthur, J.R.; Beckett, G.J. Thyroid function. Br. Med. Bull. 1999, 55, 658-668. 38. Arthur, J.R.; Beckett, G.J.; Mitchell, J.H. The interactions between selenium and iodine
deficiencies in man and animals. Nutr. Res. Rev. 1999, 12, 55-73. 39. Kvı´cala, J.; Zamrazil, V.; Soutorova´, M.; Tomíska, F. Correlations between parameters of body
selenium status and peripheral thyroid parameters in the low selenium region. Analyst 1995, 120, 959-965.
40. Olivieri, O.; Girelli, D.; Stanzial, A. Selenium, zinc, and thyroid hormones in healthy subjects. Biol. Trace Elem. Res. 1996, 51, 31-41.
41. Ravaglia, G.; Forti, P.; Maioli, F.; Nesi, B.; Pratelli, L.; Savarino, L.; Cucinotta, D.; Cavalli, G. Blood micronutrient and thyroid hormone concentrations in the oldest-old. J. Clin. Endocrinol. Metab. 2000, 85, 2260-2265.
42. Combs, G.F., Jr. Selenium in global food systems. Br. J. Nutr. 2001, 85, 517-547. 43. Thomson, C.D. Selenium and iodine intakes and status in New Zealand and Australia. Br. J. Nutr.
2004, 91, 661-672. 44. Alissa, E.M.; Bahjria, S.; Ahmed, W.; Al-Ama, N.; Ferns, G.A. Trace element status in Saudi
patients with established atherosclerosis. J. Trace Elem. Med. Bio. 2006, 20, 105-114. 45. Al-Nuaim, A.R. High prevalence of metabolic risk factors for cardiovascular diseases among
Saudi population, aged 30-64 years. Int. J. Cardiol. 1997, 62, 227-235. 46. Kok, F.; De Bruijn, A.; Vermeeren, R.; Hofman, A.; van Laar, A.; de Bruin, M.; Hermes, R.J.;
Valkenburg, H.A. Serum selenium, vitamin antioxidants, and cardiovascular mortality - A 9 year follow-up study in the Netherlands. Am. J. Clin. Nutr. 1987, 45, 462-468.
47. Miura, S.; Iitaka, M.; Suzuki, S.; Fukasawa, N.; Kitahama, S.; Kawakami, Y.; Sakatsume, Y.; Yamanaka, K.; Kawasaki, S.; Kinoshita, S.; Katayama, S.; Shibosawa, T.; Ishii, J. Decrease in serum levels of thyroid hormone in patients with coronary heart disease. Endocr. J. 1996, 43, 657-63.
48. Ringstad, J.; Jacobsen, B.; Thomassen, Y.; Thelle, D.S. The Tromso Heart-Study - serum selenium and risk of myocardial infarction a nested case control Study. J. Epidemiol. Commun. Health 1987, 41, 329-332
Molecules 2009, 14
158
49. Salonen, J.; Alfthan, G.; Huttunen, J.; Pikkarainen, J.; Puska, P. Association between cardiovascular death and myocardial infarction and serum selenium in a matched pair longitudinal study. Lancet 1982, 2, 175-179.
50. Suadicani, P.; Hein, H.; Gyntelberg, F. Serum selenium concentration and risk of ischemic heart disease in a prospective cohort study of 3000 males. Atherosclerosis 1992, 96, 33-42.
51. Vanderpump, M.; Tunbridge, W. The epidemiology of thyroid disease. In The Thyroid 9th Ed.; Braveman, L.E, Utiger, R.D., Eds.; Lippincott-Raven Publisher: Philadelphia, USA, 1996; pp. 474–482.
52. Kinlaw, W.B. Atherosclerosis and the thyroid. Thyroid Today 1991, 14, 1-8. 53. Morris, M.; Bostom, A.; Jacques, P.; Selhub, J.; Rosenberg, I.H. Hyperhomocystinemia and
hypercholesterolemia associated with hypothyroidism in the third US National Health and Nutrition Examination Study. Atherosclerosis 2001, 155, 195-200.
54. Yildirimkaya, M.; Ozata, M.; Yilmaz, K.; Kilinç, C.; Gündoğan, M.A.; Kutluay, T. Lipoprotein (a) concentration in subclinical hypothyroidism before and after levo-thyroxine therapy. Endocr. J. 1996, 43, 731-736.
55. Bermano, G. ; Nicol, F. ; Dyer, J. ; Sunde, R.A.; Beckett, G.J.; Arthur, J.R.; Hesketh, J.E. Tissue-specific regulation of selenoenzyme gene expression during selenium deficiency in rats. Biochem. J. 1995, 311, 425-430.
56. Dickson, R.C.; Tomlinson, R.H. Selenium in blood and human tissues. Clin. Chim. Acta 1967, 16, 311-321.
57. Danforth, E., Jr.; Burger, A. The impact of nutrition on thyroid hormone physiology and action. Annu. Rev. Nutr. 1989, 9, 201–207.
58. Clugston, G.; Hetzel, B. Iodine. In Modern Nutrition in Health and Disease, 8th Ed. Shils, M. E., Olson, J. A., Shike, M., Eds.; Lea & Febiger: Philadelphia, PA, USA, 1994.
59. Brigham, D.; Beard, J. Iron and thermoregulation: a review. Crit. Rev. Food. Sci. Nutr. 1996, 36, 747-763.
60. Kvicala, J.; Zamrazil, V. Effect of iodine and selenium upon thyroid function. Cent. Eur. J. Publ. Health 2003, 11, 107-113.
61. Anderson, K.; Odell, P.; Wilson, P.; Kannel, W. Cardiovascular diseases risk profiles. Am. Heart J. 1990, 121, 293-298
62. Ledwozyw, A.; Michalak, J.; Stepien, A.; Kadziołka, A. The relationship between plasma triglycerides, cholesterol, total lipids and lipid peroxidation products during human atherosclerosis. Clin. Chim. Acta 1986, 155, 275-284
63. The report of the expert committee on the diagnosis and classification of DM. Diabetes Care 1997, 20, 1183-1202
64. Bayliss, R.I.S.; Tunbridge, W.M.G. Thyroid Disease: The Facts 3rd Ed.; Oxford University Press: Oxford, UK, 1998.
65. Friedewald, W.; Levy, R.; Fredrickson, D. Estimation of the concentration of low-density lipoprotein cholesterol in plasma, without use of the preparative ultracentrifuge. Clin. Chem. 1972, 18, 499-502.
66. Anderson, J.; Jacobs, D.; Foster, N. Scoring system for evaluating dietary pattern effect on serum cholesterol. Prev. Med. 1979, 8, 525-537.

Molecules 2009, 14
159
67. Paglia, D.; Valentine, W. Studies on quantitative and qualitative characterization of erythrocyte GPx. J. Lab. Clin. Med. 1967, 70, 158-159.
68. Weltz, B.; Wolynetz, M.; Verlinden, M. Inter-laboratory trial on the determination of selenium in lyophilized human serum, blood and urine using HGAAS. Pure Appl. Chem. 1987, 59, 927-936.
69. Alissa, E.M.; Bahjri, S.; Al-ama, N.; Ahmed, W.H.; Starkey, B.; Ferns, G.A. Dietary vitamin A may be a cardiovascular risk factor in a Saudi population. Asia Pac. J. Clin. Nutr. 2005, 14, 137-134.
Sample Availability: Samples of the compounds are available from the authors. © 2009 by the authors; licensee Molecular Diversity Preservation International, Basel, Switzerland. This article is an open-access article distributed under the terms and conditions of the Creative Commons Attribution license (http://creativecommons.org/licenses/by/3.0/).