ระหว่าง Francis Fukuyama กับ Samuel Huntington : The End of ...

Selective striatal neuronal loss in a YAC128mouse model of Huntington disease
Elizabeth J. Slow1, Jeremy van Raamsdonk1, Daniel Rogers1, Sarah H. Coleman2,
Rona K. Graham1, Yu Deng1, Rosemary Oh1, Nagat Bissada1, Sazzad M. Hossain1,
Yu-Zhou Yang1, Xiao-Jiang Li3, Elizabeth M. Simpson1, Claire-Anne Gutekunst2,
Blair R. Leavitt1 and Michael R. Hayden1,*
1Centre for Molecular Medicine and Therapeutics, Department of Medical Genetics, University of British Columbia,
Vancouver, British Columbia, Canada V5Z 4H4, 2Department of Neurology, Emory University, Atlanta, GA 30322,
USA and 3Department of Human Genetics, Emory University, Atlanta, GA 30322, USA
Received March 4, 2003; Revised and Accepted May 5, 2003
An expanded CAG repeat is the underlying genetic defect in Huntington disease, a disorder characterized bymotor, psychiatric and cognitive deficits and striatal atrophy associated with neuronal loss. An accurateanimal model of this disease is crucial for elucidation of the underlying natural history of the illness and alsofor testing experimental therapeutics. We established a new yeast artificial chromosome (YAC) mouse modelof HD with the entire human HD gene containing 128 CAG repeats (YAC128) which develops motorabnormalities and age-dependent brain atrophy including cortical and striatal atrophy associated with striatalneuronal loss. YAC128 mice exhibit initial hyperactivity, followed by the onset of a motor deficit and finallyhypokinesis. The motor deficit in the YAC128 mice is highly correlated with striatal neuronal loss, providing astructural correlate for the behavioral changes. The natural history of HD-related changes in the YAC128 micehas been defined, demonstrating the presence of huntingtin inclusions after the onset of behavior andneuropathological changes. The HD-related phenotypes of the YAC128 mice show phenotypic uniformitywith low inter-animal variability present, which together with the age-dependent striatal neurodegenerationmake it an ideal mouse model for the assessment of neuroprotective and other therapeutic interventions.
INTRODUCTION
The discovery of the gene responsible for Huntington’s disease(HD) in 1993 facilitated the development of several geneticmouse models of this autosomal-dominant, neurodegenerativedisease (1). Transgenic mouse models that expressed (in mostcases) a truncated, N-terminal fragment of huntingtin under thecontrol of a variety of promoters were the first modelsdescribed (2–4). The replication of the underlying geneticdefect, a CAG expansion, by inserting an expanded repeat intothe murine huntingtin gene, led to the creation of ‘knock-in’models (5–8).
Although the knock-in models accurately replicate theunderlying genetic defect of HD, they do not present withrobust motor deficits or demonstrate the brain atrophy andneuronal loss that characterize the human disease (5–8).In contrast, the truncated, N-terminal mice exhibit striatal
atrophy and rapid onset of motor deficits (2,3). While a rapid-onset phenotype is beneficial for study, these truncated mice,by definition, lack the full-length huntingtin protein andtherefore imperfectly replicate the protein context of the humancondition.
We previously created a yeast artificial chromosome (YAC)mouse model of HD (9,10). Our goal was to establish a mousemodel that expressed a full-length form of huntingtin under thecontrol of the endogenous huntingtin promoter and regulatoryelements. The YAC fulfilled both of these requirements,spanning the entire genomic region of the human HD gene,including promoter, intronic, upstream and downstreamregulatory elements. The full-length, human huntingtin proteinis expressed in a developmental and tissue-specific manneridentical to the endogenous mouse protein (9,10).
We originally created YAC mice with 46 and 72 CAG repeats(mutant huntingtin mice) and YAC mice with 18 repeats in the
*To whom correspondence should be addressed at: Centre for Molecular Medicine and Therapeutics, 980 West 28th Avenue, Vancouver, BC, CanadaV5Z 4H4. Tel: þ1 6048753535; Fax: þ1 6048753819; Email: [email protected]
Human Molecular Genetics, 2003, Vol. 12, No. 13 1555–1567DOI: 10.1093/hmg/ddg169
Human Molecular Genetics, Vol. 12, No. 13 # Oxford University Press 2003; all rights reserved
by guest on Novem
ber 8, 2014http://hm
g.oxfordjournals.org/D
ownloaded from
HD gene (control mice) (10). These mice have helped elucidatedifferent pathways involved in the pathogenesis of HDincluding increased susceptibility to excitotoxic cell death ofneurons with mutant huntingtin (11–13), the discoveryof decreased BDNF production in HD (14), the presence ofmitochondrial dysfunction (15), and the anti-apoptotic role ofwild-type huntingtin (16). However, the hyperactivity andneuronal degeneration in the YAC72 mice manifested late inthe lifetime of the mouse (7 and 12 months, respectively) andthe initial assessment of the HD-related phenotypes in thesemice used predominantly qualitative measures (10). Inaddition, the presence of significant inter-animal variability inHD-related changes in the mice was a concern for assessinginterventions which altered the natural history of the illness.Assessment of therapeutic interventions using YAC72 micewould require the use of large numbers of animals to determinea significant effect of an intervention at a significant cost. In aneffort to create a YAC mouse with both an accelerated andquantifiable phenotype, and with the knowledge that increasingCAG repeat length leads to an earlier age of onset (17) anddecreases variability (R. Brinkman and M.R. Hayden, manu-script in preparation), we created several YAC mouse lines with128 CAG repeats (YAC128), and rigorously characterized oneof these lines.
Our analysis of the YAC128 mice reveals a hyperkineticphenotype first manifest at 3 months of age, followed by aprogressive motor deficit on the rotarod present at 6 monthswith eventual progression to hypokinesis by 12 months of age.These behavioral changes are followed by striatal atrophyclearly evident by 9 months of age, cortical atrophy at 12months and a progressive loss of striatal neurons accompaniedby a decrease in striatal cell surface area. The motor deficit inthe YAC128 mice is highly correlated with neuronal loss. Theaccurate replication of the human condition in the YAC128mouse model, coupled with low inter-animal variability, resultsin an HD mouse model that is now highly suited for theassessment of different interventions on the disease phenotype.
RESULTS
Establishment of YAC128 Mice
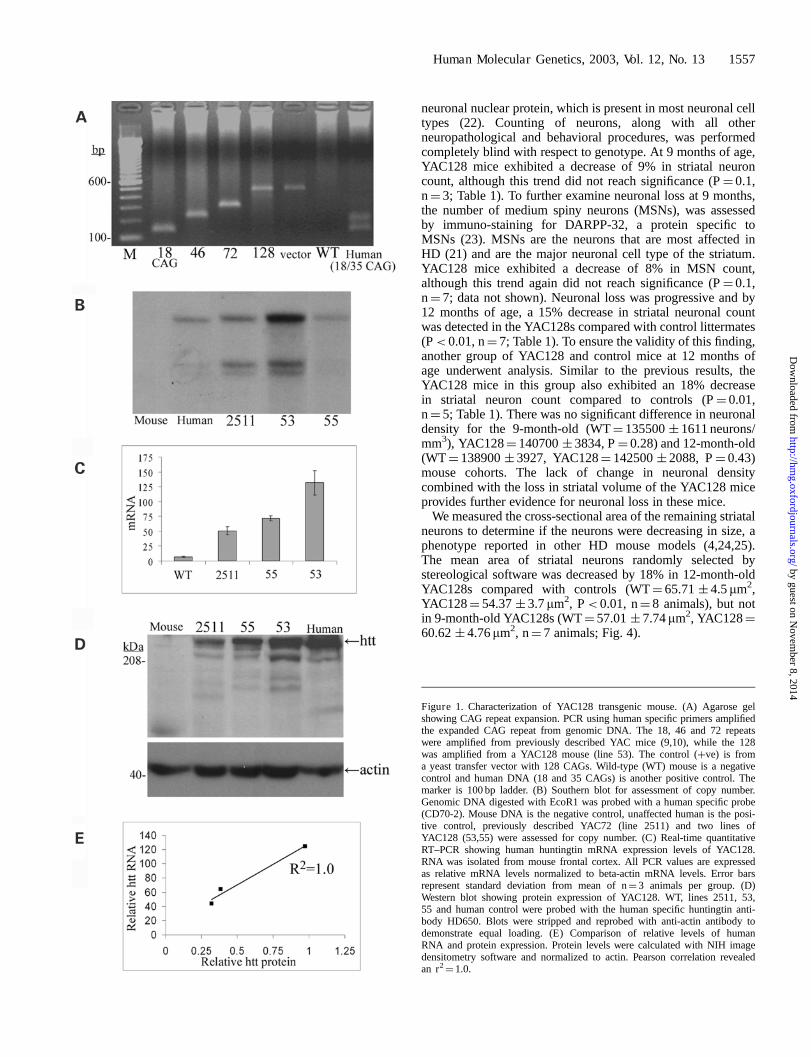
A well-characterized YAC (353G6) spanning the entire HDgene including the promoter region was used to create theYAC128s (10). Homologous recombination was used toincorporate 128 CAG repeats obtained from PCR amplified,juvenile-onset HD patient DNA into the YAC in a previouslydescribed strategy (18). All founders were extensively screenedby PCR and Southern blot as previously described (9). Twofounders integrated the complete YAC and were used toestablish two lines of YAC mice (lines 53 and 55) with 128CAG repeats (Fig. 1A). Southern blots from these micerevealed that line 53 integrated more copies of the transgenethan line 55 or line 2511, a previously described YAC72 mouse(10) (Fig. 1B). RNA analysis of the human huntingtin transcriptdemonstrated that line 53 had twice the RNA levels of line 55and three times the RNA levels of line 2511 (Fig. 1C). Proteinexpression detected with HD650, a human huntingtin specificantibody, correlated exactly with RNA levels (r2
¼ 1.0, Pearson
correlation; Fig. 1E). Line 53 had the highest level ofhuntingtin protein expression (Fig. 1D) by densitometricanalysis at approximately 75% of endogenous levels (data notshown). We further characterized line 53 due to the higher levelof huntingtin protein expression.
Brain weight decrease in YAC128, line 53
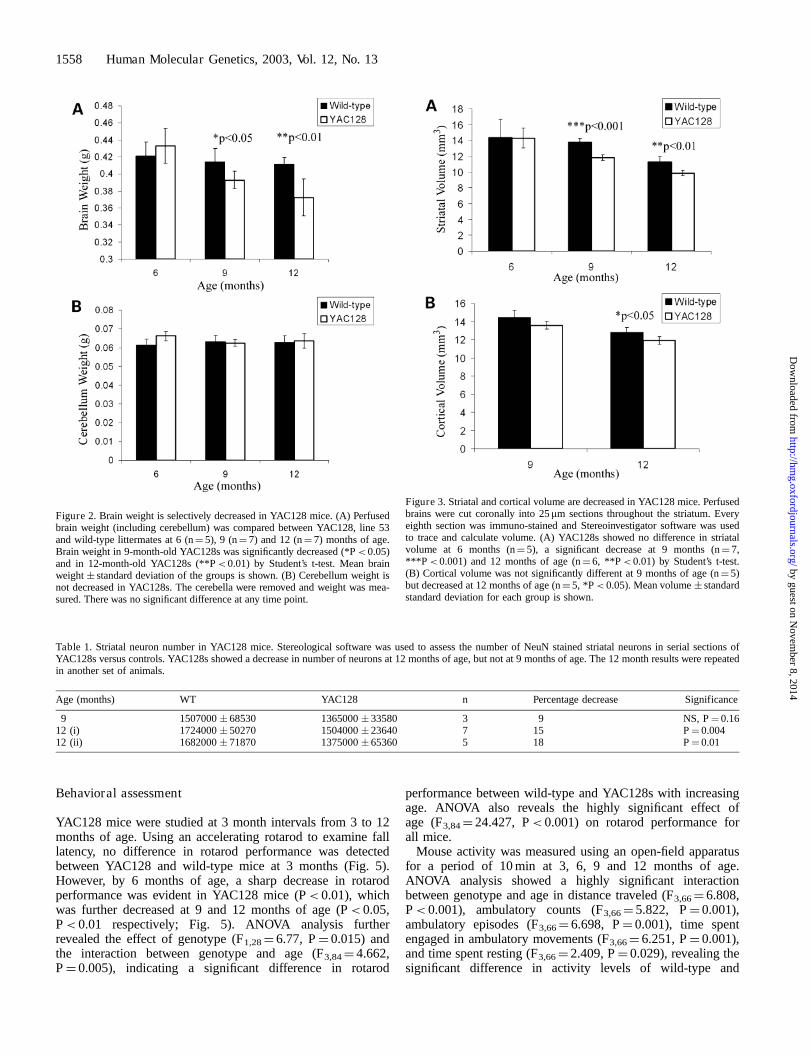
Cohorts of line 53 mice (hereafter referred to as YAC128) andwild-type (WT) littermates at 6, 9 and 12 months weresacrificed and perfused and brain weight was measured. Nodifference in brain weight was detected in 6-month-oldYAC128s (WT¼ 0.421 � 0.016 g, YAC128¼ 0.433 � 0.02 g,n¼ 5; Fig. 2A). However, by 9 months of age YAC128 micedemonstrated a 5% decrease in mean brain weight comparedwith wild-type littermates (WT¼ 0.414 � 0.016 g, YAC128¼0.393 � 0.01 g, P< 0.05; n¼ 7), progressing to a 10%decrease in 1-year-old YAC128s (WT¼ 0.411 � 0.009 g,YAC128¼ 0.373 � 0.022 g, P< 0.01, n¼ 7; Fig. 2A).ANOVA analysis further revealed the effect of genotype(F1,36¼ 6.169, P¼ 0.018), age (F2,36¼ 11.706, P¼ 0.0001)and the interaction of age and genotype (F2,36¼ 5.002,P¼ 0.012) on brain weight. The difference in brain weightdid not appear to be due to generalized atrophy, but rather aregion-specific effect. For example, no significant differencewas detected between YAC128s and wild-type littermates inthe weight of the cerebellum, a region not usually involved inHD pathology (19), at any of the ages examined (Fig. 2B).
Striatal and cortical volume is decreased inYAC128 mice
In order to determine whether the brain regions that aremost affected in HD patients, the striatum and cortex (19,20),were also affected in YAC128 mice, striatal and corticalvolume estimates of mice were calculated using stereologicalsoftware. There was no detectable difference in striatal volume at6 months of age in YAC128s compared with wild-type littermates(WT¼ 14.3 � 2.39 mm3, YAC128¼ 14.29 � 1.25 mm3, n¼ 5;Fig. 3A). However, by 9 months of age, a 15% decrease in striatalvolume was evident in YAC128 mice (WT¼ 13.76 � 0.5 mm3,YAC128¼ 11.81 � 0.36 mm3, P< 0.001, n¼ 7; Fig. 3A),which was also seen in 12-month-old YAC128 mice (WT¼
11.27 � 0.68 mm3, YAC128¼ 9.88 � 0.33 mm3, P< 0.01,n¼ 7; Fig. 3A). Cortex volume was estimated from theregion surrounding the crossing of the corpus callosum to thecrossing of the anterior commissure (i.e. region of brainencompassing the greatest volume of striatum). In contrast tothe striatum, there was no significant difference in cortical volumeat 9 months of age (WT¼ 14.43 � 0.79 mm3, YAC128¼13.57 � 0.41 mm3, n¼ 5) but a 7% decrease at 12 months ofage (WT¼ 12.83 � 0.50 mm3, YAC128¼ 11.88 � 0.43 mm3,P< 0.05, n¼ 5; Fig. 3B).
Neuronal loss and dysfunction in YAC128 mice
Striatal cell loss is a defining neuropathological characteristicof HD (21). Stereological software was used to estimate thestriatal neuron number in our mouse cohorts. Sections wereimmuno-stained with NeuN, an antibody specific for a
1556 Human Molecular Genetics, 2003, Vol. 12, No. 13
by guest on Novem
ber 8, 2014http://hm
g.oxfordjournals.org/D
ownloaded from
neuronal nuclear protein, which is present in most neuronal celltypes (22). Counting of neurons, along with all otherneuropathological and behavioral procedures, was performedcompletely blind with respect to genotype. At 9 months of age,YAC128 mice exhibited a decrease of 9% in striatal neuroncount, although this trend did not reach significance (P¼ 0.1,n¼ 3; Table 1). To further examine neuronal loss at 9 months,the number of medium spiny neurons (MSNs), was assessedby immuno-staining for DARPP-32, a protein specific toMSNs (23). MSNs are the neurons that are most affected inHD (21) and are the major neuronal cell type of the striatum.YAC128 mice exhibited a decrease of 8% in MSN count,although this trend again did not reach significance (P¼ 0.1,n¼ 7; data not shown). Neuronal loss was progressive and by12 months of age, a 15% decrease in striatal neuronal countwas detected in the YAC128s compared with control littermates(P< 0.01, n¼ 7; Table 1). To ensure the validity of this finding,another group of YAC128 and control mice at 12 months ofage underwent analysis. Similar to the previous results, theYAC128 mice in this group also exhibited an 18% decreasein striatal neuron count compared to controls (P¼ 0.01,n¼ 5; Table 1). There was no significant difference in neuronaldensity for the 9-month-old (WT¼ 135500 � 1611 neurons/mm3), YAC128¼ 140700 � 3834, P¼ 0.28) and 12-month-old(WT¼ 138900 � 3927, YAC128¼ 142500 � 2088, P¼ 0.43)mouse cohorts. The lack of change in neuronal densitycombined with the loss in striatal volume of the YAC128 miceprovides further evidence for neuronal loss in these mice.
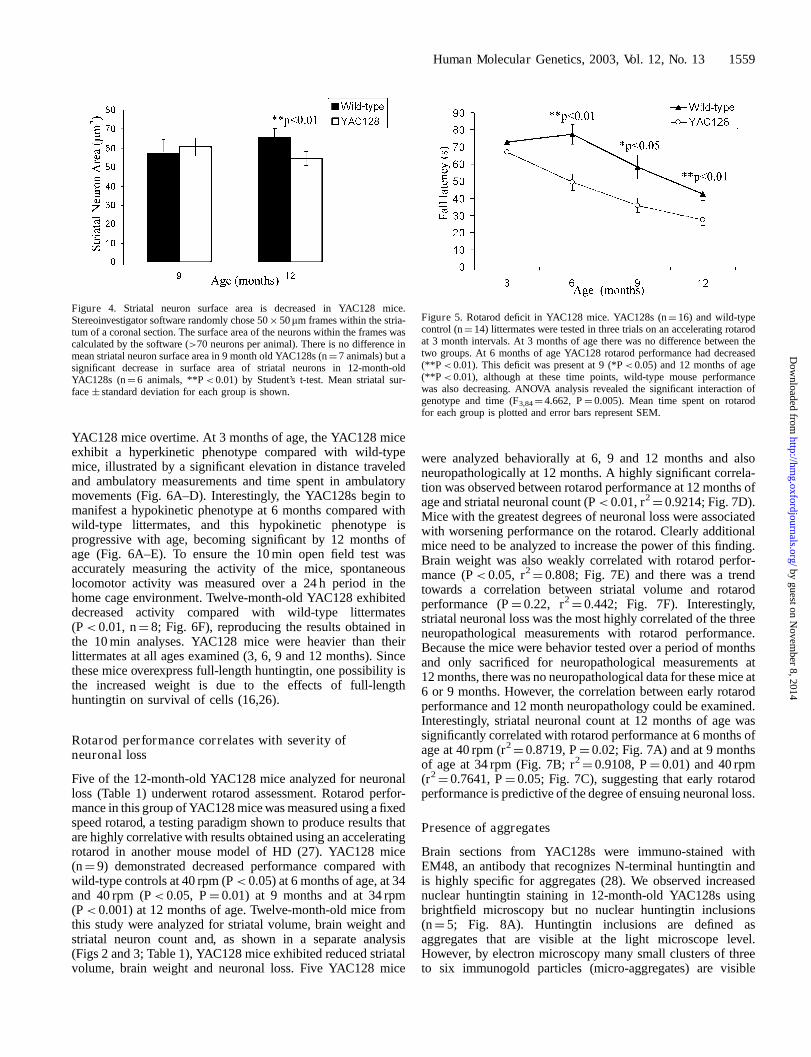
We measured the cross-sectional area of the remaining striatalneurons to determine if the neurons were decreasing in size, aphenotype reported in other HD mouse models (4,24,25).The mean area of striatal neurons randomly selected bystereological software was decreased by 18% in 12-month-oldYAC128s compared with controls (WT¼ 65.71 � 4.5 mm2,YAC128¼ 54.37 � 3.7 mm2, P< 0.01, n¼ 8 animals), but notin 9-month-old YAC128s (WT¼ 57.01 � 7.74 mm2, YAC128¼60.62 � 4.76 mm2, n¼ 7 animals; Fig. 4).
Figure 1. Characterization of YAC128 transgenic mouse. (A) Agarose gelshowing CAG repeat expansion. PCR using human specific primers amplifiedthe expanded CAG repeat from genomic DNA. The 18, 46 and 72 repeatswere amplified from previously described YAC mice (9,10), while the 128was amplified from a YAC128 mouse (line 53). The control (þve) is froma yeast transfer vector with 128 CAGs. Wild-type (WT) mouse is a negativecontrol and human DNA (18 and 35 CAGs) is another positive control. Themarker is 100 bp ladder. (B) Southern blot for assessment of copy number.Genomic DNA digested with EcoR1 was probed with a human specific probe(CD70-2). Mouse DNA is the negative control, unaffected human is the posi-tive control, previously described YAC72 (line 2511) and two lines ofYAC128 (53,55) were assessed for copy number. (C) Real-time quantitativeRT–PCR showing human huntingtin mRNA expression levels of YAC128.RNA was isolated from mouse frontal cortex. All PCR values are expressedas relative mRNA levels normalized to beta-actin mRNA levels. Error barsrepresent standard deviation from mean of n¼ 3 animals per group. (D)Western blot showing protein expression of YAC128. WT, lines 2511, 53,55 and human control were probed with the human specific huntingtin anti-body HD650. Blots were stripped and reprobed with anti-actin antibody todemonstrate equal loading. (E) Comparison of relative levels of humanRNA and protein expression. Protein levels were calculated with NIH imagedensitometry software and normalized to actin. Pearson correlation revealedan r2
¼ 1.0.
Human Molecular Genetics, 2003, Vol. 12, No. 13 1557
by guest on Novem
ber 8, 2014http://hm
g.oxfordjournals.org/D
ownloaded from
Behavioral assessment
YAC128 mice were studied at 3 month intervals from 3 to 12months of age. Using an accelerating rotarod to examine falllatency, no difference in rotarod performance was detectedbetween YAC128 and wild-type mice at 3 months (Fig. 5).However, by 6 months of age, a sharp decrease in rotarodperformance was evident in YAC128 mice (P< 0.01), whichwas further decreased at 9 and 12 months of age (P< 0.05,P< 0.01 respectively; Fig. 5). ANOVA analysis furtherrevealed the effect of genotype (F1,28¼ 6.77, P¼ 0.015) andthe interaction between genotype and age (F3,84¼ 4.662,P¼ 0.005), indicating a significant difference in rotarod
performance between wild-type and YAC128s with increasingage. ANOVA also reveals the highly significant effect ofage (F3,84¼ 24.427, P< 0.001) on rotarod performance forall mice.
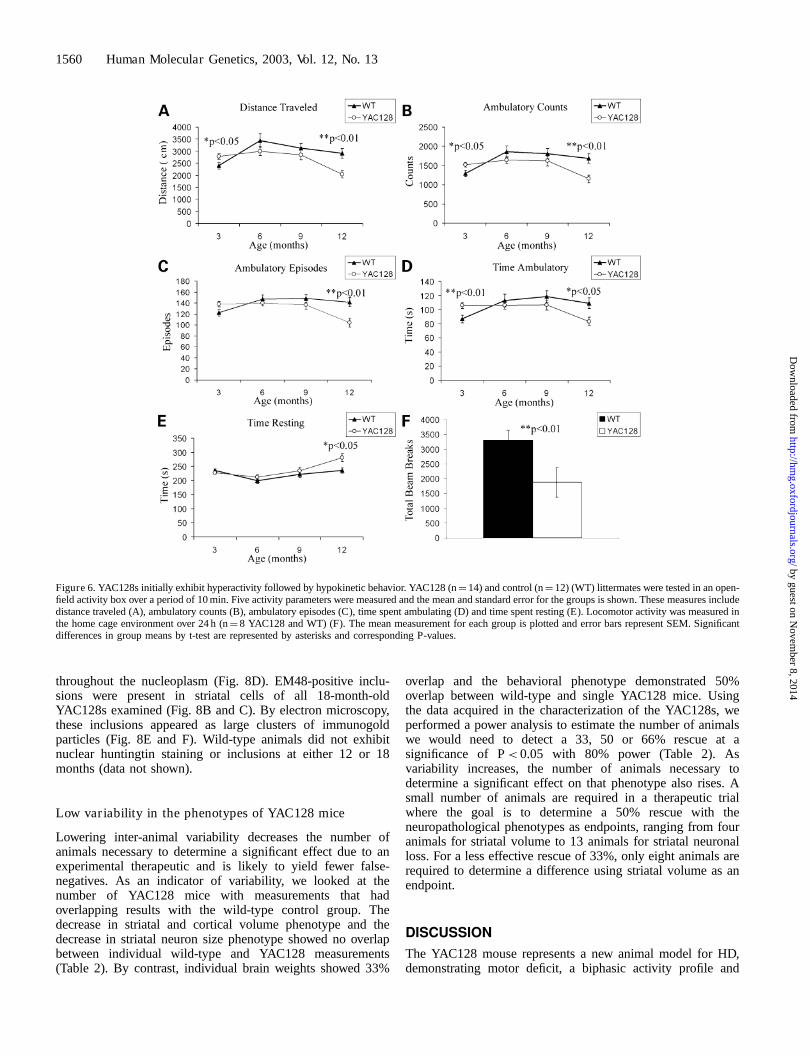
Mouse activity was measured using an open-field apparatusfor a period of 10 min at 3, 6, 9 and 12 months of age.ANOVA analysis showed a highly significant interactionbetween genotype and age in distance traveled (F3,66¼ 6.808,P< 0.001), ambulatory counts (F3,66¼ 5.822, P¼ 0.001),ambulatory episodes (F3,66¼ 6.698, P¼ 0.001), time spentengaged in ambulatory movements (F3,66¼ 6.251, P¼ 0.001),and time spent resting (F3,66 ¼ 2.409, P¼ 0.029), revealing thesignificant difference in activity levels of wild-type and
Table 1. Striatal neuron number in YAC128 mice. Stereological software was used to assess the number of NeuN stained striatal neurons in serial sections ofYAC128s versus controls. YAC128s showed a decrease in number of neurons at 12 months of age, but not at 9 months of age. The 12 month results were repeatedin another set of animals.
Age (months) WT YAC128 n Percentage decrease Significance
9 1507000 � 68530 1365000 � 33580 3 9 NS, P¼ 0.1612 (i) 1724000 � 50270 1504000 � 23640 7 15 P¼ 0.00412 (ii) 1682000 � 71870 1375000 � 65360 5 18 P¼ 0.01
Figure 2. Brain weight is selectively decreased in YAC128 mice. (A) Perfusedbrain weight (including cerebellum) was compared between YAC128, line 53and wild-type littermates at 6 (n¼ 5), 9 (n¼ 7) and 12 (n¼ 7) months of age.Brain weight in 9-month-old YAC128s was significantly decreased (*P< 0.05)and in 12-month-old YAC128s (**P< 0.01) by Student’s t-test. Mean brainweight � standard deviation of the groups is shown. (B) Cerebellum weight isnot decreased in YAC128s. The cerebella were removed and weight was mea-sured. There was no significant difference at any time point.
Figure 3. Striatal and cortical volume are decreased in YAC128 mice. Perfusedbrains were cut coronally into 25mm sections throughout the striatum. Everyeighth section was immuno-stained and Stereoinvestigator software was usedto trace and calculate volume. (A) YAC128s showed no difference in striatalvolume at 6 months (n¼ 5), a significant decrease at 9 months (n¼ 7,***P< 0.001) and 12 months of age (n¼ 6, **P< 0.01) by Student’s t-test.(B) Cortical volume was not significantly different at 9 months of age (n¼ 5)but decreased at 12 months of age (n¼ 5, *P< 0.05). Mean volume � standardstandard deviation for each group is shown.
1558 Human Molecular Genetics, 2003, Vol. 12, No. 13
by guest on Novem
ber 8, 2014http://hm
g.oxfordjournals.org/D
ownloaded from
YAC128 mice overtime. At 3 months of age, the YAC128 miceexhibit a hyperkinetic phenotype compared with wild-typemice, illustrated by a significant elevation in distance traveledand ambulatory measurements and time spent in ambulatorymovements (Fig. 6A–D). Interestingly, the YAC128s begin tomanifest a hypokinetic phenotype at 6 months compared withwild-type littermates, and this hypokinetic phenotype isprogressive with age, becoming significant by 12 months ofage (Fig. 6A–E). To ensure the 10 min open field test wasaccurately measuring the activity of the mice, spontaneouslocomotor activity was measured over a 24 h period in thehome cage environment. Twelve-month-old YAC128 exhibiteddecreased activity compared with wild-type littermates(P< 0.01, n¼ 8; Fig. 6F), reproducing the results obtained inthe 10 min analyses. YAC128 mice were heavier than theirlittermates at all ages examined (3, 6, 9 and 12 months). Sincethese mice overexpress full-length huntingtin, one possibility isthe increased weight is due to the effects of full-lengthhuntingtin on survival of cells (16,26).
Rotarod performance correlates with severity ofneuronal loss
Five of the 12-month-old YAC128 mice analyzed for neuronalloss (Table 1) underwent rotarod assessment. Rotarod perfor-mance in this group of YAC128 mice was measured using a fixedspeed rotarod, a testing paradigm shown to produce results thatare highly correlative with results obtained using an acceleratingrotarod in another mouse model of HD (27). YAC128 mice(n¼ 9) demonstrated decreased performance compared withwild-type controls at 40 rpm (P< 0.05) at 6 months of age, at 34and 40 rpm (P< 0.05, P¼ 0.01) at 9 months and at 34 rpm(P< 0.001) at 12 months of age. Twelve-month-old mice fromthis study were analyzed for striatal volume, brain weight andstriatal neuron count and, as shown in a separate analysis(Figs 2 and 3; Table 1), YAC128 mice exhibited reduced striatalvolume, brain weight and neuronal loss. Five YAC128 mice
were analyzed behaviorally at 6, 9 and 12 months and alsoneuropathologically at 12 months. A highly significant correla-tion was observed between rotarod performance at 12 months ofage and striatal neuronal count (P< 0.01, r2
¼ 0.9214; Fig. 7D).Mice with the greatest degrees of neuronal loss were associatedwith worsening performance on the rotarod. Clearly additionalmice need to be analyzed to increase the power of this finding.Brain weight was also weakly correlated with rotarod perfor-mance (P< 0.05, r2
¼ 0.808; Fig. 7E) and there was a trendtowards a correlation between striatal volume and rotarodperformance (P¼ 0.22, r2
¼ 0.442; Fig. 7F). Interestingly,striatal neuronal loss was the most highly correlated of the threeneuropathological measurements with rotarod performance.Because the mice were behavior tested over a period of monthsand only sacrificed for neuropathological measurements at12 months, there was no neuropathological data for these mice at6 or 9 months. However, the correlation between early rotarodperformance and 12 month neuropathology could be examined.Interestingly, striatal neuronal count at 12 months of age wassignificantly correlated with rotarod performance at 6 months ofage at 40 rpm (r2
¼ 0.8719, P¼ 0.02; Fig. 7A) and at 9 monthsof age at 34 rpm (Fig. 7B; r2
¼ 0.9108, P¼ 0.01) and 40 rpm(r2
¼ 0.7641, P¼ 0.05; Fig. 7C), suggesting that early rotarodperformance is predictive of the degree of ensuing neuronal loss.
Presence of aggregates
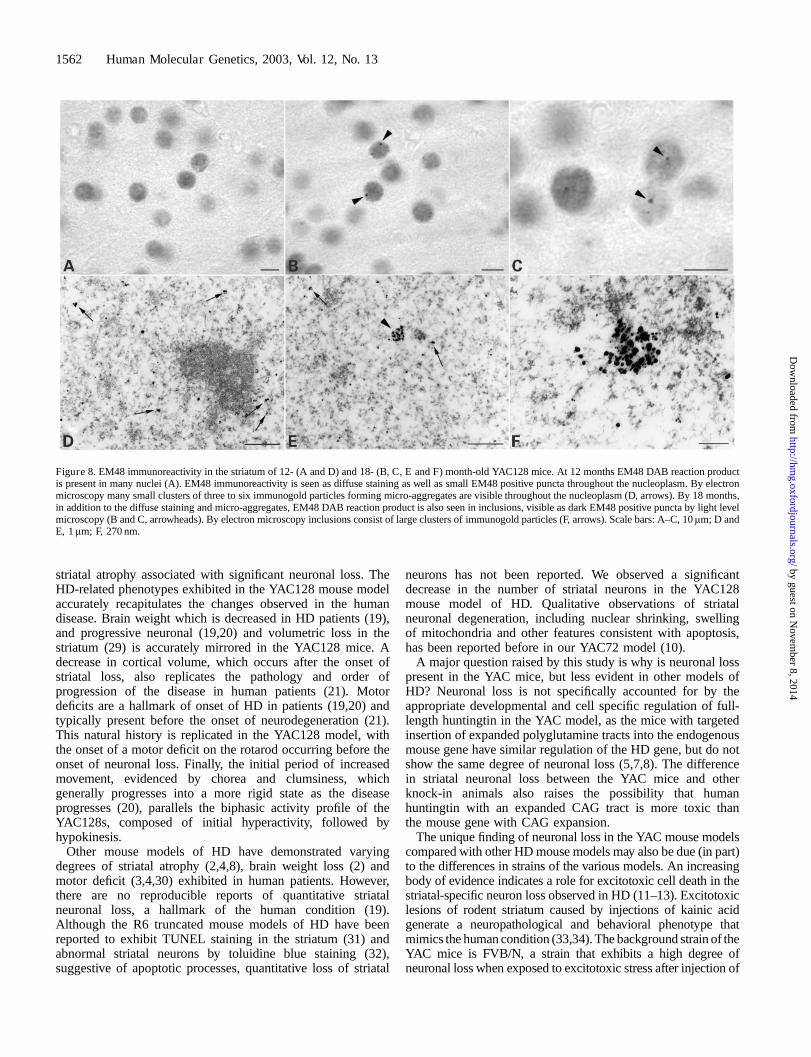
Brain sections from YAC128s were immuno-stained withEM48, an antibody that recognizes N-terminal huntingtin andis highly specific for aggregates (28). We observed increasednuclear huntingtin staining in 12-month-old YAC128s usingbrightfield microscopy but no nuclear huntingtin inclusions(n¼ 5; Fig. 8A). Huntingtin inclusions are defined asaggregates that are visible at the light microscope level.However, by electron microscopy many small clusters of threeto six immunogold particles (micro-aggregates) are visible
Figure 4. Striatal neuron surface area is decreased in YAC128 mice.Stereoinvestigator software randomly chose 50� 50mm frames within the stria-tum of a coronal section. The surface area of the neurons within the frames wascalculated by the software (>70 neurons per animal). There is no difference inmean striatal neuron surface area in 9 month old YAC128s (n¼ 7 animals) but asignificant decrease in surface area of striatal neurons in 12-month-oldYAC128s (n¼ 6 animals, **P< 0.01) by Student’s t-test. Mean striatal sur-face � standard deviation for each group is shown.
Figure 5. Rotarod deficit in YAC128 mice. YAC128s (n¼ 16) and wild-typecontrol (n¼ 14) littermates were tested in three trials on an accelerating rotarodat 3 month intervals. At 3 months of age there was no difference between thetwo groups. At 6 months of age YAC128 rotarod performance had decreased(**P< 0.01). This deficit was present at 9 (*P< 0.05) and 12 months of age(**P< 0.01), although at these time points, wild-type mouse performancewas also decreasing. ANOVA analysis revealed the significant interaction ofgenotype and time (F3,84¼ 4.662, P¼ 0.005). Mean time spent on rotarodfor each group is plotted and error bars represent SEM.
Human Molecular Genetics, 2003, Vol. 12, No. 13 1559
by guest on Novem
ber 8, 2014http://hm
g.oxfordjournals.org/D
ownloaded from
throughout the nucleoplasm (Fig. 8D). EM48-positive inclu-sions were present in striatal cells of all 18-month-oldYAC128s examined (Fig. 8B and C). By electron microscopy,these inclusions appeared as large clusters of immunogoldparticles (Fig. 8E and F). Wild-type animals did not exhibitnuclear huntingtin staining or inclusions at either 12 or 18months (data not shown).
Low variability in the phenotypes of YAC128 mice
Lowering inter-animal variability decreases the number ofanimals necessary to determine a significant effect due to anexperimental therapeutic and is likely to yield fewer false-negatives. As an indicator of variability, we looked at thenumber of YAC128 mice with measurements that hadoverlapping results with the wild-type control group. Thedecrease in striatal and cortical volume phenotype and thedecrease in striatal neuron size phenotype showed no overlapbetween individual wild-type and YAC128 measurements(Table 2). By contrast, individual brain weights showed 33%
overlap and the behavioral phenotype demonstrated 50%overlap between wild-type and single YAC128 mice. Usingthe data acquired in the characterization of the YAC128s, weperformed a power analysis to estimate the number of animalswe would need to detect a 33, 50 or 66% rescue at asignificance of P< 0.05 with 80% power (Table 2). Asvariability increases, the number of animals necessary todetermine a significant effect on that phenotype also rises. Asmall number of animals are required in a therapeutic trialwhere the goal is to determine a 50% rescue with theneuropathological phenotypes as endpoints, ranging from fouranimals for striatal volume to 13 animals for striatal neuronalloss. For a less effective rescue of 33%, only eight animals arerequired to determine a difference using striatal volume as anendpoint.
DISCUSSION
The YAC128 mouse represents a new animal model for HD,demonstrating motor deficit, a biphasic activity profile and
Figure 6. YAC128s initially exhibit hyperactivity followed by hypokinetic behavior. YAC128 (n¼ 14) and control (n¼ 12) (WT) littermates were tested in an open-field activity box over a period of 10 min. Five activity parameters were measured and the mean and standard error for the groups is shown. These measures includedistance traveled (A), ambulatory counts (B), ambulatory episodes (C), time spent ambulating (D) and time spent resting (E). Locomotor activity was measured inthe home cage environment over 24 h (n¼ 8 YAC128 and WT) (F). The mean measurement for each group is plotted and error bars represent SEM. Significantdifferences in group means by t-test are represented by asterisks and corresponding P-values.
1560 Human Molecular Genetics, 2003, Vol. 12, No. 13
by guest on Novem
ber 8, 2014http://hm
g.oxfordjournals.org/D
ownloaded from
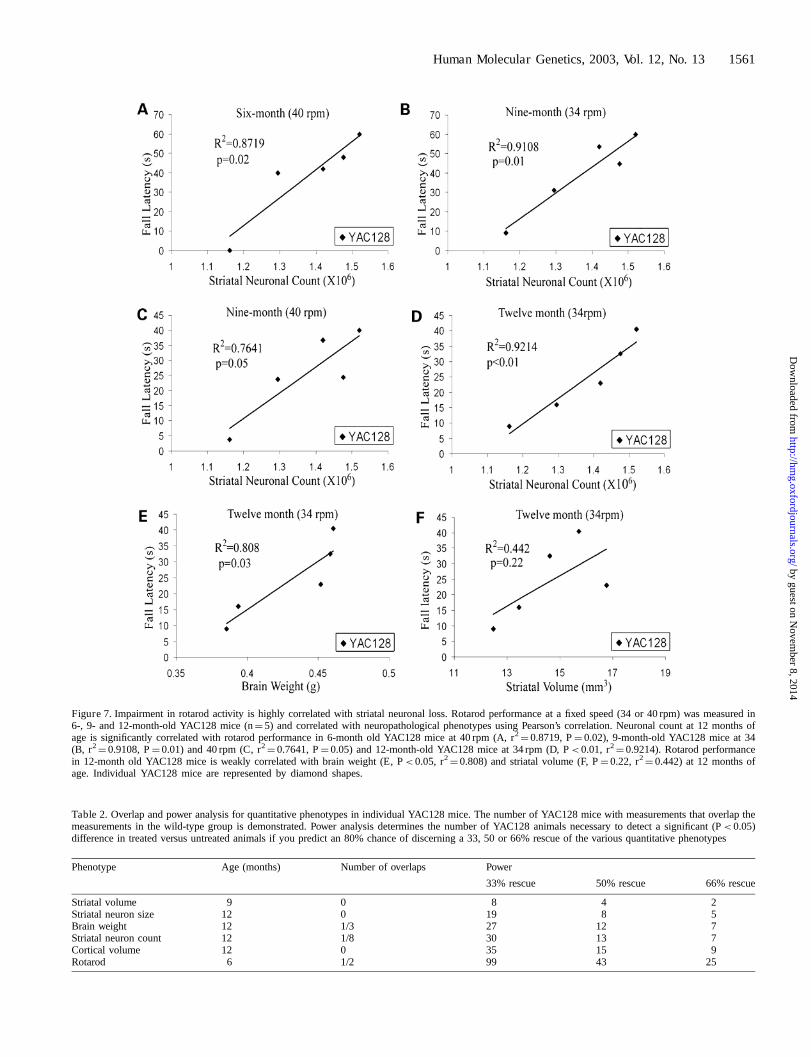
Figure 7. Impairment in rotarod activity is highly correlated with striatal neuronal loss. Rotarod performance at a fixed speed (34 or 40 rpm) was measured in6-, 9- and 12-month-old YAC128 mice (n¼ 5) and correlated with neuropathological phenotypes using Pearson’s correlation. Neuronal count at 12 months ofage is significantly correlated with rotarod performance in 6-month old YAC128 mice at 40 rpm (A, r2
¼ 0.8719, P¼ 0.02), 9-month-old YAC128 mice at 34(B, r2
¼ 0.9108, P¼ 0.01) and 40 rpm (C, r2¼ 0.7641, P¼ 0.05) and 12-month-old YAC128 mice at 34 rpm (D, P< 0.01, r2
¼ 0.9214). Rotarod performancein 12-month old YAC128 mice is weakly correlated with brain weight (E, P< 0.05, r2
¼ 0.808) and striatal volume (F, P¼ 0.22, r2¼ 0.442) at 12 months of
age. Individual YAC128 mice are represented by diamond shapes.
Table 2. Overlap and power analysis for quantitative phenotypes in individual YAC128 mice. The number of YAC128 mice with measurements that overlap themeasurements in the wild-type group is demonstrated. Power analysis determines the number of YAC128 animals necessary to detect a significant (P< 0.05)difference in treated versus untreated animals if you predict an 80% chance of discerning a 33, 50 or 66% rescue of the various quantitative phenotypes
Phenotype Age (months) Number of overlaps Power
33% rescue 50% rescue 66% rescue
Striatal volume 9 0 8 4 2Striatal neuron size 12 0 19 8 5Brain weight 12 1/3 27 12 7Striatal neuron count 12 1/8 30 13 7Cortical volume 12 0 35 15 9Rotarod 6 1/2 99 43 25
Human Molecular Genetics, 2003, Vol. 12, No. 13 1561
by guest on Novem
ber 8, 2014http://hm
g.oxfordjournals.org/D
ownloaded from
striatal atrophy associated with significant neuronal loss. TheHD-related phenotypes exhibited in the YAC128 mouse modelaccurately recapitulates the changes observed in the humandisease. Brain weight which is decreased in HD patients (19),and progressive neuronal (19,20) and volumetric loss in thestriatum (29) is accurately mirrored in the YAC128 mice. Adecrease in cortical volume, which occurs after the onset ofstriatal loss, also replicates the pathology and order ofprogression of the disease in human patients (21). Motordeficits are a hallmark of onset of HD in patients (19,20) andtypically present before the onset of neurodegeneration (21).This natural history is replicated in the YAC128 model, withthe onset of a motor deficit on the rotarod occurring before theonset of neuronal loss. Finally, the initial period of increasedmovement, evidenced by chorea and clumsiness, whichgenerally progresses into a more rigid state as the diseaseprogresses (20), parallels the biphasic activity profile of theYAC128s, composed of initial hyperactivity, followed byhypokinesis.
Other mouse models of HD have demonstrated varyingdegrees of striatal atrophy (2,4,8), brain weight loss (2) andmotor deficit (3,4,30) exhibited in human patients. However,there are no reproducible reports of quantitative striatalneuronal loss, a hallmark of the human condition (19).Although the R6 truncated mouse models of HD have beenreported to exhibit TUNEL staining in the striatum (31) andabnormal striatal neurons by toluidine blue staining (32),suggestive of apoptotic processes, quantitative loss of striatal
neurons has not been reported. We observed a significantdecrease in the number of striatal neurons in the YAC128mouse model of HD. Qualitative observations of striatalneuronal degeneration, including nuclear shrinking, swellingof mitochondria and other features consistent with apoptosis,has been reported before in our YAC72 model (10).
A major question raised by this study is why is neuronal losspresent in the YAC mice, but less evident in other models ofHD? Neuronal loss is not specifically accounted for by theappropriate developmental and cell specific regulation of full-length huntingtin in the YAC model, as the mice with targetedinsertion of expanded polyglutamine tracts into the endogenousmouse gene have similar regulation of the HD gene, but do notshow the same degree of neuronal loss (5,7,8). The differencein striatal neuronal loss between the YAC mice and otherknock-in animals also raises the possibility that humanhuntingtin with an expanded CAG tract is more toxic thanthe mouse gene with CAG expansion.
The unique finding of neuronal loss in the YAC mouse modelscompared with other HD mouse models may also be due (in part)to the differences in strains of the various models. An increasingbody of evidence indicates a role for excitotoxic cell death in thestriatal-specific neuron loss observed in HD (11–13). Excitotoxiclesions of rodent striatum caused by injections of kainic acidgenerate a neuropathological and behavioral phenotype thatmimics the human condition (33,34). The background strain of theYAC mice is FVB/N, a strain that exhibits a high degree ofneuronal loss when exposed to excitotoxic stress after injection of
Figure 8. EM48 immunoreactivity in the striatum of 12- (A and D) and 18- (B, C, E and F) month-old YAC128 mice. At 12 months EM48 DAB reaction productis present in many nuclei (A). EM48 immunoreactivity is seen as diffuse staining as well as small EM48 positive puncta throughout the nucleoplasm. By electronmicroscopy many small clusters of three to six immunogold particles forming micro-aggregates are visible throughout the nucleoplasm (D, arrows). By 18 months,in addition to the diffuse staining and micro-aggregates, EM48 DAB reaction product is also seen in inclusions, visible as dark EM48 positive puncta by light levelmicroscopy (B and C, arrowheads). By electron microscopy inclusions consist of large clusters of immunogold particles (F, arrows). Scale bars: A–C, 10mm; D andE, 1mm; F, 270 nm.
1562 Human Molecular Genetics, 2003, Vol. 12, No. 13
by guest on Novem
ber 8, 2014http://hm
g.oxfordjournals.org/D
ownloaded from
kainic acid or quinolinic acid (35,36). In contrast, injection ofexcitotoxins into C57BL/6, the background strain common tomost HD mouse models, results in a much lower degree of celldeath relative to other mouse stains, including FVB, especially atlow doses of kainic and quinolinic acid (35,36). Therefore, straindifferences could account for differences in susceptibility toneurotoxicity of polyglutamine expansion.
The striatal neuronal loss observed in YAC128 mice is linearlycorrelated with the motor deficit assayed by rotarod. Thisintriguing result provides the first link in an animal model of HDbetween behavior and neuronal loss, suggesting a structural basisfor the behavioral manifestations in the YAC128 mice.Interestingly, rotarod performance at 6 and 9 months of age iscorrelated with neuronal loss at 12 months of age. The degree ofearly motor dysfunction may therefore be an indicator of theseverity of the extent of dysfunction of neurons present in thestriatum; neurons that will eventually degenerate as the animalages. The emergence of rotarod deficits, therefore, represents atime when neuronal dysfunction already has phenotypic effects,demonstrating the importance of assessing the effect of therapeuticinterventions before and after this time point. The strongcorrelation between striatal neuronal loss and rotarod deficitsuggests that neuronal loss and dysfunction are at least majorcontributors to the behavioral abnormalities in the YAC128 mice.
The characterization of the natural history in the YAC128mice makes it an ideal model for defining the temporalrelationship of other changes with striatal neuronal loss.Nuclear huntingtin inclusions visible under light microscopyare a common neuropathological marker in both humanpatients (28,37) and HD mouse models (3,6,10,38). The roleof huntingtin inclusions in the pathogenesis of HD is stillcontroversial. The appearance of huntingtin inclusions prior tothe development of a neurologic phenotype in some transgenicmodels of HD suggested that the formation of these inclusionswas potentially causative in the disease (38). However, in vitroexperiments with mutant huntingtin demonstrated a distinctdissociation between the presence of huntingtin inclusions andhuntingtin-related cell death (39,40). Studies in human patientsshowed little overlap between those cells exhibiting nuclearinclusions and the cells that undergo neurodegeneration inHD (28), further supporting the lack of correlation betweeninclusions and neuronal loss. Huntingtin inclusions are presentin 18-month-old YAC128 mice, but not at 12 months of age, atime point when both behavioral and neuropathologicalchanges, including neuronal loss, are present, demonstratingthat inclusions are not involved in the initiation of neuronalloss. This finding corresponds with results previously observedin other mouse models of HD (8), demonstrating neuronaldysfunction before the onset of huntingtin inclusions. However,inclusion formation is believed to be the end stage of a processbeginning with huntingtin translocation to the nucleus andcontinuing with the formation of micro-aggregates (38,41)visible under electron microscopy. Nuclear translocation andhuntingtin micro-aggregates are present in 12-month-oldanimals, still leaving the question of the potential role ofnuclear translocation and oligomerization of huntingtin as aninitiating stimulus for HD earlier in the disease process.
The YAC mice will be useful for the assessment oftherapeutic interventions, as this model accurately replicatesthe human disease and displays phenotypes that can be
measured quantitatively with low inter-animal variability. TheYAC128 mice exhibit progressive, quantitative phenotypes thatparallel the human condition. The significance of low inter-animal variability in the use of a mouse model for therapeuticinterventions is illustrated by the power analysis estimations.The phenotype with the lowest variability, striatal volume,requires only four animals to determine a 50% rescue at9 months of age. Even the neuropathological phenotypeswith greater variability (e.g. neuron count) require at most13 animals to discern a 50% rescue. For a less robust thera-peutic effect (33%), only eight animals are needed forassessment of striatal volume. This result demonstrates thepotential usefulness of the YAC128 mice in therapeutic trialsand the crucial importance of phenotypic predictability in amodel used in experimental therapeutics.
The precise natural history of changes in the YAC128 mousemodel of HD allows for further investigation of the temporalsequence and inter-relationships of other HD-related changes inthe pathogenesis of the disease. The role of proteolytic cleavageof mutant huntingtin in the development of the disease is aquestion of particular interest. Increasing evidence implicatesproteolytic cleavage of huntingtin by caspases (42), and/orcalpains (43,44), and/or other unknown proteases (45) in thepathogenesis of HD. Caspase cleavage of mutant huntingtinleads to the formation of a toxic fragment of huntingtin (46) andthis cleavage event is known to precede neurodegeneration inhuman patient brains (42). The expression of a full-length formof mutant huntingtin makes the YAC mouse model uniquelysuited to test the efficacy of inhibition of these proteases on thedisease development, either through the use of compounds, orthrough genetic manipulation. We can also use the YAC128model to investigate the timing and effect of cortical dysfunc-tion in the natural history of the disease. Results from mousemodels (4) and other studies (14,42) implicate corticaldysfunction in striatal neuronal death in HD. Determining thetiming of atrophy and neuronal loss in different layers andsubsets of cortical tissue and the temporal relationship of thisatrophy to striatal neuronal loss will further elucidate the role thecortex plays in the development of this devastating disease.
The YAC128 mouse model accurately recapitulates thestriatal neuronal loss that characterizes the human disease,which allows the YAC128 mice to be useful in assessingexperimental therapeutics that provide protection againstneuronal loss. The defined natural history in YAC128 micepermits the accurate calculation of time points for commence-ment of therapeutic interventions, and endpoints for theassessment of the efficacy of those interventions. Using thedata reported in this manuscript, we can now designexperimental therapeutic trials with the YAC128 mice ensuringan adequate number of animals to properly assess the effect ofneuroprotective strategies on the pathogenesis of HD.
MATERIALS AND METHODS
YAC mutagenesis and generation of mice
YAC mutagenesis was performed as described previously (10)using a construct containing 128 CAG repeats. YAC DNA wasprepared for microinjection into FVB/N pronuclei, and founder
Human Molecular Genetics, 2003, Vol. 12, No. 13 1563
by guest on Novem
ber 8, 2014http://hm
g.oxfordjournals.org/D
ownloaded from
pups were screened (9). Mice were maintained on the FVB/N(Charles River, Wilmington, MA, USA) background strain andare congenic on this strain. Mice were genotyped by a PCRprocedure described previously (9). Mice were housed, testedand tissues were harvested according to the University ofBritish Columbia animal protocol A00-0254.
Copy number, RNA and protein analysis
Southern blotting to assess copy number was performed asdescribed previously using 12 mg DNA (9) and the humanspecific probe cD70-2 (10).
Protein analysis. Protein lysates were prepared from wholemouse brain in a procedure described previously (9) with a cas-pase inhibitor, 10 mM ZVAD (Calbiochem, San Diego, CA,USA) added to the lysis buffer. These lysates were run on7.5% polyacrylamide gels and blotted on PVDF membranes.Blots were probed with anti-actin (Chemicon, Temecula, CA,USA) and monoclonal antibody HD650. HD650 was producedagainst HD peptides 650–663 (VLRDEATEPGDQEN) andreacted specifically to human huntingtin. The HD peptides(VLRDEATEPGDNQEN) coupled to KLH carrier proteinwas used as an immunogen to inject Balb/C mice. The mousewas injected with 100 mg of the peptide-KLH protein inFreund’s complete adjuvant subcutaneously, followed by twoadditional injections of 100 mg of the peptides-KLH proteinin Freund’s incomplete adjuvant at 14 day intervals. Three daysbefore cell fusion, the mouse received an intravenous injectionof 100 mg of the peptides via the tail vein. Splenocytes werefused with NS-1 myeloma cell, and hybridomas were selectedand cloned in a procedure described previously (47).
RNA analysis. Total RNA was extracted from mouse cortexwith RNeasy Protect Mini Kit (Qiagen, Mississauga, ON,Canada). First-strand cDNA was prepared from 1 mg of totalRNA using SuperScript First-Strand Synthesis System forRT–PCR (Invitrogen, Burlington, ON, Canada) in a finalvolume of 20 ml. One in 100 of the RT reactions were usedas template in real-time PCR reactions. Real-time PCR wasperformed using the ABI GeneAmp 5700 SequenceDetection System instrument and SYBR Green Two-step RT–PCR (Applied Biosystems, Foster City, CA, USA) usingintron-spanning human specific primers. A dissociation curveconfirmed the absence of nonspecific amplification. Seriallydiluted cDNA samples were used for standard curve calibra-tion. All samples were run in quadruplicate. Expression levelswere normalized to beta-actin mRNA levels. Primary data ana-lysis was performed using system software from AppliedBiosystems.
Morphological analysis
Mice were terminally anesthetized by intraperitoneal injectionof 2.5% avertin and perfused with 3% paraformaldehyde/0.15% glutaraldehyde in PBS. The brains were left in the skullsfor 24 h in 3% paraformaldehyde at 4�C, then removed andstored in PBS. Brains which did not perfuse well (softer thanothers) were removed from the groups at this point. We alsoremoved two large brains from the analysis (n¼ 1 from the
9 month cohort, n¼ 1 from the 12 month cohort), whichweighed 50–75% more than the other brains in the cohort andwere significant outliers by Grubb’s test. The genotype of alloutliers was wild-type and the removal of these outliers did notaffect the significance of the findings. Coronal sections of 25and 50 mm thickness were cut throughout the striatum using avibratome. Transgenic and wild-type mice were matched basedon age and sex and littermates were used whenever possible.
Quantitative analysis
All quantitative analyses were performed blind with respect togenotype. Coronal sections (25 mm) spaced 200 mm apartthroughout the striatum were stained with NeuN (Chemicon)antibody at 1:100 dilution or DARPP-32 antibody (Chemicon)at 1:500 dilution. Biotinylated secondary antibodies (Vector,Burlington, ON, Canada), mouse or rabbit at 1 :200 were usedprior to signal amplification with an ABC Elite kit (Vector)and detection with diaminobenzidine (DAB, Pierce). Theperimeter of the striatum was traced in each of the serialsections using a 2.5� objective and Stereoinvestigator software(Microbrightfield, Williston, VT, USA). Subsequently, countsof neuronal profiles within 50� 50 mm counting frames spacedevenly throughout the striatum (striatal grid size was450� 450 mm) was obtained using a 20� objective. Serialreconstruction of the striatum by the Stereoinvestigatorsoftware allowed estimation of total neuronal profiles andvolume. Cortical volume was estimated in the region with thelargest percentage of striatal tissue (centered on the landmarksof the corpus callosum and the anterior commisure crossing)totaling six serial sections. All layers and regions of cortexpresent in the section were outlined as a whole and volume wasestimated using Neuroexplorer software (Microbrightfield,Williston, VT, USA). Cross-sectional area of striatal neuronalprofiles was determined by outlining the perimeter of all clearlydefined neurons within 50� 50 mm counting frames spacedevenly throughout the striatum (450� 450 mm grids). Neuronalprofiles were outlined using a 100� objective in anatomicallymatched coronal sections. Note: tissue from wild-type andYAC128 at the same time point (e.g. 9 months) was treatedidentically; however, there was some experimental variabilitybetween time points (e.g. variability between tissue from 6 and9 month time points), making volume comparisons betweentime points invalid.
Assessment of aggregates
Light microscopy. Brain sections of 25 mm thickness through-out the striatum were stained for the presence of aggregates.Sections were immuno-stained as described previously (28)using polyclonal EM48 antibody at 1:1000 and DAB as thechromogen (Vector).
Electron microscopy. For ultrastructural analysis, we usedpre-embedding immunogold labeling of EM48. Sections wererinsed in PBS and processed according to manufacturer’sinstructions using EM48 antibodies at 1:500. Ultrasmall colloi-dal conjugated secondary antibody (Aurion, Wageningen, TheNetherlands) was used to bind the primary antibody. Followinga post-fixation with 2.5% gluteraldehyde, gold particles in
1564 Human Molecular Genetics, 2003, Vol. 12, No. 13
by guest on Novem
ber 8, 2014http://hm
g.oxfordjournals.org/D
ownloaded from
sections were intensified using R-gent SE-EM silver enhance-ment kit (Aurion, Wageningen, The Netherlands). Sectionswere then further fixed with 0.5% osmium tetroxide in 0.1 M
PB for 15 min and processed for electron microscopy asdescribed elsewhere (48). Selected sections were then placedin 0.5% osmium tetroxide in 0.1 M phosphate buffer for30 min. Sections were then rinsed in PB, dehydrated in 25–100% EtOH followed by propylene oxide, infiltrated and flatembedded in Epon between sheets of Aclar and cured at60�C for 2–3 days.
Behavioral assessment
Mice were singly housed in microisolator cages under reverselighting (lights off at 11:00 a.m., lights on at 11:00 p.m.). Allmice in a testing group were cage changed on the same day andno testing was performed until 2 days after a cage change. Micewere semi-randomly number coded from 1 to 40 (first and lasthalf of testing group had an equal number of males/females,transgenic/wild-type). All behavioral testing was executedduring the mouse night cycle, when the mice are normallyactive, with testing carried out in a behavioral testing suiteunder red light. The same observer carried out all of the testsand was blinded to the genotype of the individual micethroughout the course of the testing.
Rotarod analysis. We used an accelerating rotarod procedurewhere the rotarod (San Diego Instuments, San Diego, CA,USA) accelerated from 0 to 45 rpm over a period of 120 s.Mice were trained for 3 days with two trials per day on anaccelerating rotarod. Following this training, the mice weretested for three consecutive trials in one day, with 1.5 h restbetween trials. The rotarod was wiped clean with ethanolbetween each test subject.
Open-field analysis. Mice were assessed using an open-fieldactivity monitor (Med Associates Inc., St Albans, VT, USA)for a period of 10 min. Testing began at least 1 h after the begin-ning of the mouse night cycle. The testing chamber was wipedclean with ethanol between each test subject. Ambulatory countwas defined as the number of beam breaks while the mouse isambulating, while ambulatory episodes are the number of timesthe mouse begins ambulating (from a resting position).Measurements were calculated by accompanying software(Med Associates). Mice who circled for the entirety of the10 min interval were removed from the analysis (n¼ 6 wild-type, n¼ 2 YAC128).
Locomotor activity. Locomoter activity was measured for24 h using a Cage Rack System (San Diego Instruments) witha uniformly spaced 8� 4 photobeam grid. The cages were28� 17� 12 cm and the mice provided with food and water.Locomotor activity was calculated from the total number ofbeam breaks over the 24 h testing period.
Rotarod analysis—fixed speed. Mice were housed in micro-isolator cages with siblings. All behavioral testing was exe-cuted in the light in a behavioral testing suite. Mice weretested on a fixed speed rotarod (Ugo-Basile, Norfolk, UK)
at 12, 24, 34 and 40 rpm and were initially trained at24 rpm for 3 days with three trials per day. Subsequent testingoccurred over a 3 day period, testing each speed once a daywith 1.5 h rest in between tests. Mice were tested every monthfrom 3 to 12 months of age.
Statistics
All statistics were carried out using an unpaired Student’s t-testor two-way ANOVA with repeated measures. P-values, SEM,means and standard deviations were calculated using GraphpadPrism version 3.0 or Microsoft1 Excel 2002. SPSS 11.5 wasused to calculate F and P-values for behavioral measures.Correlation calculations with r2 and P-values were calculatedby Pearson correlation using Graphpad Prism version 3.0.Power analysis numbers were calculated using the websitewww.health.ucalgary.ca/�rollin/stats/ssize/n2.html.
Note
These mice are available for investigators for ongoing studies.Interested investigators should contact M.R.H.
ACKNOWLEDGEMENTS
The authors thank Hong Yi and the Emory Electron MicroscopyCore at the Neurodegenerative Disease Center. We thank theHuntington Disease Society of America (HDSA), the HereditaryDisease Foundation (HDF) and Canadian Institutes of HealthResearch (CIHR) for support of this work to M.R.H. E.J.S.,J.V.R. and R.K.G. are supported by CIHR studentships and theMichael Smith Foundation for Health Research. C.-A.G. issupported by the National Science Foundation. B.R.L. issupported by the HDF, CIHR and the Huntington’s Society ofCanada. E.M.S. is supported by Canada Foundation forInnovation and is a holder of a Canada Research Chair inGenetics and Behavior. M.R.H. is supported by a Merck Frosstgrant to the CMMT, the CIHR, the Canadian Networks ofCenters of Excellence, and is a holder of a Canada ResearchChair in Human Genetics.
REFERENCES
1. Huntington’s Disease Collaborative Research Group (1993) A novelgene containing a trinucleotide repeat that is expanded and unstable onHuntington’s disease chromosomes. Cell, 72, 971–983.
2. Mangiarini, L., Sathasivam, K., Seller, M., Cozens, B., Harper, A.,Hetherington, C., Lawton, M., Trottier, Y., Lehrach, H., Davies, S.W. andBates, G.P. (1996) Exon 1 of the HD gene with an expanded CAG repeatis sufficient to cause a progressive neurological phenotype in transgenicmice. Cell, 87, 493–506.
3. Schilling, G., Becher, M.W., Sharp, A.H., Jinnah, H.A., Duan, K.,Kotzuk, J.A., Slunt, H.H., Ratovitski, T., Cooper, J.K., Jenkins, N.A. et al.(1999) Intranuclear inclusions and neuritic aggregates in transgenic miceexpressing a mutant N-terminal fragment of huntingtin. Hum. Mol. Genet.,8, 397–407.
4. Laforet, G.A., Sapp, E., Chase, K., McIntyre, C., Boyce, F.M.,Campbell, M., Cadigan, B.A., Warzecki, L., Tagle, D.A., Reddy, P.H.,Cepeda, C. et al. (2001) Changes in cortical and striatal neurons predictbehavioral and electrophysiological abnormalities in a transgenic murinemodel of Huntington’s disease. J. Neurosci., 21, 9112–9123.
Human Molecular Genetics, 2003, Vol. 12, No. 13 1565
by guest on Novem
ber 8, 2014http://hm
g.oxfordjournals.org/D
ownloaded from
5. Shelbourne, P.F., Killeen, N., Hevner, R.F., Johnston, H.M., Tecott, L.,Lewandoski, M., Ennis, M., Ramirez, L., Li, Z., Iannicola, C. et al. (1999)A Huntington’s disease CAG expansion at the murine Hdh locus is unstableand associated with behavioral abnormalities in mice. Hum. Mol. Genet., 8,763–774.
6. Wheeler, V.C., White, J.K., Gutekunst, C.A., Vrbanac, V., Weaver, M.,Li, X.J., Li, S.H., Yi, H., Vonsattel, J.P., Gusella, J.F. et al. (2000) Longglutamine tracts cause nuclear localization of a novel form of huntingtin inmedium spiny striatal neurons in HdhQ92 and HdhQ111 knock-in mice.Hum. Mol. Genet., 9, 503–513.
7. Lin, C.H., Tallaksen-Greene, S., Chien, W.M., Cearley, J.A., Jackson, W.S.,Crouse, A.B., Ren, S., Li, X.J., Albin, R.L. and Detloff, P.J. (2001)Neurological abnormalities in a knock-in mouse model of Huntington’sdisease. Hum. Mol. Genet., 10, 137–144.
8. Menalled, L.B., Sison, J.D., Wu, Y., Olivieri, M., Li, X.J., Li, H., Zeitlin, S.and Chesselet, M.F. (2002) Early motor dysfunction and striosomaldistribution of huntingtin microaggregates in Huntington’s disease knock-inmice. J. Neurosci., 22, 8266–8276.
9. Hodgson, J.G., Smith, D.J., McCutcheon, K., Koide, H.B., Nishiyama, K.,Dinulos, M.B., Stevens, M.E., Bissada, N., Nasir, J., Kanazawa, I. et al.(1996) Human huntingtin derived from YAC transgenes compensates forloss of murine huntingtin by rescue of the embryonic lethal phenotype.Hum. Mol. Genet., 5, 1875–1885.
10. Hodgson, J.G., Agopyan, N., Gutekunst, C.A., Leavitt, B.R., LePiane, F.,Singaraja, R., Smith, D.J., Bissada, N., McCutcheon, K., Nasir, J. et al.(1999) A YAC mouse model for Huntington’s disease with full-lengthmutant huntingtin, cytoplasmic toxicity, and selective striatalneurodegeneration. Neuron, 23, 181–192.
11. Cepeda, C., Ariano, M.A., Calvert, C.R., Flores-Hernandez, J.,Chandler, S.H., Leavitt, B.R., Hayden, M.R. and Levine, M.S. (2001)NMDA receptor function in mouse models of Huntington disease.J. Neurosci. Res., 66, 525–539.
12. Zeron, M.M., Chen, N., Moshaver, A., Lee, A.T., Wellington, C.L.,Hayden, M.R. and Raymond, L.A. (2001) Mutant huntingtin enhancesexcitotoxic cell death. Mol. Cell Neurosci., 17, 41–53.
13. Zeron, M.M., Hansson, O., Chen, N., Wellington, C.L., Leavitt, B.R.,Brundin, P., Hayden, M.R. and Raymond, L.A. (2002) Increased sensitivityto N-methyl-D-aspartate receptor-mediated excitotoxicity in a mouse modelof Huntington’s disease. Neuron, 33, 849–860.
14. Zuccato, C., Ciammola, A., Rigamonti, D., Leavitt, B.R., Goffredo, D.,Conti, L., MacDonald, M.E., Friedlander, R.M., Silani, V., Hayden, M.R.et al. (2001) Loss of huntingtin-mediated BDNF gene transcription inHuntington’s disease. Science, 293, 493–498.
15. Panov, A.V., Gutekunst, C.A., Leavitt, B.R., Hayden, M.R., Burke, J.R.,Strittmatter, W.J. and Greenamyre, J.T. (2002) Early mitochondrial calciumdefects in Huntington’s disease are a direct effect of polyglutamines.Nat. Neurosci., 5, 731–736.
16. Leavitt, B.R., Guttman, J.A., Hodgson, J.G., Kimel, G.H., Singaraja, R.,Vogl, A.W. and Hayden, M.R. (2001) Wild-type huntingtin reduces the cellulartoxicity of mutant huntingtin in vivo. Am. J. Hum. Genet., 68, 313–324.
17. Brinkman, R.R., Mezei, M.M., Theilmann, J., Almqvist, E. andHayden, M.R. (1997) The likelihood of being affected with Huntingtondisease by a particular age, for a specific CAG size. Am. J. Hum. Genet., 60,1202–1210.
18. Duff, K., McGuigan, A., Huxley, C., Schulz, F. and Hardy, J. (1994) Insertionof a pathogenic mutation into a yeast artificial chromosome containing thehuman amyloid precursor protein gene. Gene Ther., 1, 70–75.
19. Harper, P. (1991) Huntington’s Disease. W.B. Saunders, London.20. Hayden, M.R. (1981) Huntington’s Chorea. Springer, New York.21. Vonsattel, J.P., Myers, R.H., Stevens, T.J., Ferrante, R.J., Bird, E.D. and
Richardson, E.P. Jr (1985) Neuropathological classification of Huntington’sdisease. J. Neuropathol. Exp. Neurol., 44, 559–577.
22. Mullen, R.J., Buck, C.R. and Smith, A.M. (1992) NeuN, a neuronal specificnuclear protein in vertebrates. Development, 116, 201–211.
23. Ouimet, C.C., Langley-Guillon, K.C. and Greengard, P. (1998) Quantitativeimmunocytochemistry of DARPP-32-expressing neurons in the ratcaudatoputamen. Brain Res., 808, 8–12.
24. Ferrante, R.J., Andreassen, O.A., Jenkins, B.G., Dedeoglu, A.,Kuemmerle, S., Kubilus, J.K., Kaddurah-Daouk, R., Hersch, S.M. andBeal, M.F. (2000). Neuroprotective effects of creatine in a transgenic mousemodel of Huntington’s disease. J. Neurosci., 20, 4389–4397.
25. Levine, M.S., Klapstein, G.J., Koppel, A., Gruen, E., Cepeda, C.,Vargas, M.E., Jokel, E.S., Carpenter, E.M., Zanjani, H., Hurst, R.S.,
et al. (1999) Enhanced sensitivity to N-methyl-D-aspartate receptoractivation in transgenic and knockin mouse models of Huntington’sdisease. J. Neurosci. Res., 58, 515–532.
26. Dragatsis, I., Levine, M.S. and Zeitlin, S. (2000) Inactivation of Hdh in thebrain and testis results in progressive neurodegeneration and sterility inmice. Nat. Genet., 26, 300–306.
27. Luesse, H.G., Schiefer, J., Spruenken, A., Puls, C., Block, F. andKosinski, C.M. (2001) Evaluation of R6/2 HD transgenic mice fortherapeutic studies in Huntington’s disease: behavioral testing and impactof diabetes mellitus. Behav. Brain Res., 126, 185–195.
28. Gutekunst, C.A., Li, S.H., Yi, H., Mulroy, J.S., Kuemmerle, S., Jones, R.,Rye, D., Ferrante, R.J., Hersch, S.M. and Li, X.J. (1999) Nuclear andneuropil aggregates in Huntington’s disease: relationship to neuropathology.J. Neurosci., 19, 2522–2534.
29. Rosas, H.D., Goodman, J., Chen, Y.I., Jenkins, B.G., Kennedy, D.N.,Makris, N., Patti, M., Seidman, L.J., Beal, M.F. and Koroshetz, W.J. (2001)Striatal volume loss in HD as measured by MRI and the influence of CAGrepeat. Neurology, 57, 1025–1028.
30. Carter, R.J., Lione, L.A., Humby, T., Mangiarini, L., Mahal, A., Bates, G.P.,Dunnett, S.B. and Morton, A.J. (1999) Characterization of progressivemotor deficits in mice transgenic for the human Huntington’s diseasemutation. J. Neurosci., 19, 3248–3257.
31. Keene, C.D., Rodrigues, C.M.P., Eich, T., Chhabra, M.S., Steer, C.J. andLow, W.C. (2002) Tauroursodeoxycholic acid, a bile acid, is neuroprotectivein a transgenic animal model of Huntington’s disease. Proc. Natl Acad. Sci.USA, 99, 10671–10676.
32. Mastroberardino, P.G., Iannicola, C., Nardacci, R., Bernassola, F.,De Laurenzi, V., Melino, G., Moreno, S., Pavone, F., Oliverio, S., Fesus, L.and Piacentini, M. (2002) ‘Tissue’ transglutaminase ablation reducesneuronal death and prolongs survival in a mouse model of Huntington’sdisease. Cell Death Differ., 9, 873–880.
33. Coyle, J.T. and Schwarcz, R. (1976) Lesion of striatal neurons with kainicacid provides a model for Huntington’s chorea. Nature, 263, 244–246.
34. McGeer, E.G. and McGeer, P.L. (1976) Duplication of biochemical changesof Huntington’s chorea by intrastriatal injections of glutamic and kainicacids. Nature, 263, 517–519.
35. Schauwecker, P.E. and Steward, O. (1997) Genetic determinants ofsusceptibility to excitotoxic cell death: implications for gene targetingapproaches. Proc. Natl Acad. Sci. USA, 94, 4103–4108.
36. Schauwecker, P.E. (2002) Modulation of cell death by mouse genotype:differential vulnerability to excitatory amino acid-induced lesions. Exp.Neurol., 178, 219–235.
37. DiFiglia, M., Sapp, E., Chase, K.O., Davies, S.W., Bates, G.P., Vonsattel, J.P.and Aronin, N. (1997) Aggregation of huntingtin in neuronalintranuclearinclusions and dystrophic neurites in brain. Science, 277,1990–1993.
38. Davies, S.W., Turmaine, M., Cozens, B.A., DiFiglia, M., Sharp, A.H.,Ross, C.A., Scherzinger, E., Wanker, E.E., Mangiarini, L. and Bates, G.P.(1997) Formation of neuronal intranuclear inclusions underlies theneurological dysfunction in mice transgenic for the HD mutation. Cell, 90,537–548.
39. Saudou, F., Finkbeiner, S., Devys, D. and Greenberg, M.E. (1998)Huntingtin acts in the nucleus to induce apoptosis but death doesnot correlate with the formation of intranuclear inclusions. Cell, 95,55–66.
40. Kim, M., Lee, H.S., LaForet, G., McIntyre, C., Martin, E.J., Chang, P.,Kim, T.W., Williams, M., Reddy, P.H., Tagle, D. et al. (1999) Mutanthuntingtin expression in clonal striatal cells: dissociation of inclusionformation and neuronal survival by caspase inhibition. J. Neurosci., 19,964–973.
41. Wheeler, V.C., Gutekunst, C.A., Vrbanac, V., Lebel, L.A., Schilling, G.,Hersch, S., Friedlander, R.M., Gusella, J.F., Vonsattel, J.P., Borchelt, D.R.and MacDonald, M.E. (2002) Early phenotypes that presage late-onsetneurodegenerative disease allow testing of modifiers in Hdh CAG knock-inmice. Hum. Mol. Genet., 11, 633–640.
42. Wellington, C.L., Ellerby, L.M., Gutekunst, C.A., Rogers, D., Warby, S.,Graham, R.K., Loubser, O., van Raamsdonk, J., Singaraja, R., Yang, Y.Z.et al. (2002) Caspase cleavage of mutant huntingtin precedes neurode-generation in Huntington’s disease. J. Neurosci., 22, 7862–7872.
43. Kim, Y.J., Yi, Y., Sapp, E., Wang, Y., Cuiffo, B., Kegel, K.B., Qin, Z.H.,Aronin, N. and DiFiglia, M. (2001) Caspase 3-cleaved N-terminalfragments of wild-type and mutant huntingtin are present in normal andHuntington’s disease brains, associate with membranes, and undergo
1566 Human Molecular Genetics, 2003, Vol. 12, No. 13
by guest on Novem
ber 8, 2014http://hm
g.oxfordjournals.org/D
ownloaded from

calpain-dependent proteolysis. Proc. Natl Acad. Sci. USA, 98,12784–12789.
44. Gafni, J. and Ellerby, L.M. (2002) Calpain activation in Huntington’sdisease. J. Neurosci., 22, 4842–4849.
45. Lunkes, A., Lindenberg, K.S., Ben-Haiem, L., Weber, C., Devys, D.,Landwehrmeyer, G.B., Mandel, J.L. and Trottier, Y. (2002) Proteases actingon mutant huntingtin generate cleaved products that differentially build upcytoplasmic and nuclear inclusions. Mol. Cell, 10, 259–269.
46. Hackam, A.S., Singaraja, R., Wellington, C.L., Metzler, M.,McCutcheon, K., Zhang, T., Kalchman, M. and Hayden, M.R. (1998) The
influence of huntingtin protein size on nuclear localization and cellulartoxicity. J. Cell Biol., 141, 1097–1105.
47. Davis, J.M., Pennington, J.E., Kubler, A.M. and Conscience, J.F. (1982)A simple, single-step technique for selecting and cloning hybridomasfor the production of monoclonal antibodies. J. Immunol. Meth., 50,161–171.
48. Gutekunst, C.A., Li, S.H., Yi, H., Ferrante, R.J., Li, X.J. and Hersch, S.M.(1998) The cellular and subcellular localization of huntingtin-associatedprotein 1 (HAP1): comparison with huntingtin in rat and human.J. Neurosci., 18, 7674–7686.
Human Molecular Genetics, 2003, Vol. 12, No. 13 1567
by guest on Novem
ber 8, 2014http://hm
g.oxfordjournals.org/D
ownloaded from
Copyright © 2022 FDOKUMEN