Selection of Initial Mold–Metal Interface Heat Transfer Coefficient Values in Casting...
10
Selection of Initial Mold–Metal Interface Heat Transfer Coefficient Values in Casting Simulations—a Sensitivity Analysis RAMESH K. NAYAK and SURESH SUNDARRAJ Mold–metal interface heat transfer coefficient values need to be determined precisely to accu- rately predict thermal histories at different locations in automotive castings. Thermomechanical simulations were carried out for Al-Si alloy casting processes using a commercial code. The cooling curve results were validated with experimental data from the literature for a cylindrical- shaped casting. Our analysis indicates that the interface heat transfer coefficient (IHTC) initial value choice between chill–metal and the sand mold–metal interfaces has a marked effect on the cooling curves. In addition, after choosing an IHTC initial value, the solidification rates of the alloy near the chill–metal interfaces varied during subsequent cooling when the gap began to form. However, the gap formation, which results in an IHTC change from the initial value, does not affect the cooling curves within the vicinity of the sand–metal interface. Optimized initial IHTC values of 3000 and 7000 W m 2 -K 1 were determined for a sand–metal interface and a chill (steel or copper)–metal interfaces, respectively. The initial IHTC had a significant effect on the prediction of secondary dendrite arm spacing (SDAS) (varying between approximately 15 microns and 70 microns) and ultimate tensile strength (UTS) (varying between approximately 250 MPa and 370 MPa) for initial IHTC values that were less than the optimized value of 7000 W m 2 K 1 for the chill–metal interfaces. DOI: 10.1007/s11663-009-9317-0 Ó The Minerals, Metals & Materials Society and ASM International 2009 I. INTRODUCTION CASTINGS for automotive applications are manufac- tured through precision sand, gravity, or pressure die casting processes. Several models have been developed to study the solidification phenomena that occur in these casting processes. Such models have been used successfully to design castings that are free from gross solidification defects such as macroshrinkage cavities for conventional automotive Al casting alloys. However, with the increasing use of advanced casting alloys, it is necessary to improve the predictive capability of these models. One key input needed to accurately model solidification in these casting processes is the interface heat transfer coefficient (IHTC) between the metal and the mold. IHTC controls the heat transfer through the air gap that forms between the metal and the mold because of shrinkage that occurs during solidification. Several studies have attempted to quantify the IHTC, which highlight the different factors that affect heat flow across the inter- face during solidification. These factors include the thermophysical properties of the contacting materials, the casting geometry, the orientation of the casting–mold interface that affects the contact pressure, mold temper- ature, liquid alloy surface tension, pouring temperature, the roughness of the mold contacting surface, and the mold coating. [1,2] Initial work by Ho and Pehlke [3] was directed toward understanding the mechanisms of air gap formation at the chill–metal interface. They suggested that a thin skin of solidified metal first forms when molten metal comes into contact with the chill surface. During this stage, heat transfer occurs by conduction through the peaks of the rough surfaces of the casting and chill that are in contact and also by conduction through air or other gases trapped in the voids between these contact areas (Figure 1). As solidification progresses, relative expan- sion and contraction of the chill and the casting alters the amount of contact and the size of the interfacial gap between the two surfaces. Eventually, this process leads to a complete separation and a drastic reduction of the heat transfer coefficient as the heat is extracted from the casting through a relatively insulating ‘‘air gap.’’ Griffiths [4] has studied the effect of direction orientation of solidification on IHTC. For the three different orien- tations of the chill–metal geometry, which were cast and cooled separately from the bottom, top, and sides of the mold walls, the IHTC values were calculated to be 7100, 3400, and 5000 Wm 2 K 1 , respectively. Stavros et al. [5] observed that an increase in mold surface roughness resulted in a decrease in the heat transfer coefficient and that an increase in metal temperature resulted in an increase in the heat transfer coefficient. Hallam and Griffiths [6] RAMESH K. NAYAK, formerly Engineer CAE, Powertrain, General Motors India Pvt Ltd, is now Deputy Manager, Development, with Foundry and Forge Division, Hindustan Aeronautics Ltd, Bangalore Complex, Bangalore 560 017, India. SURESH SUNDARRAJ, Staff Researcher, is with the Materials Characterization and Modeling, R&D, General Motors India Pvt Ltd, 2nd/3rd Floor, Creator Building, International Tech Park, Whitefield Road, Bangalore 560 066, India. Contact e-mail: [email protected] Manuscript submitted March 18, 2009. Article published online November 17, 2009. METALLURGICAL AND MATERIALS TRANSACTIONS B VOLUME 41B, FEBRUARY 2010—151
Transcript of Selection of Initial Mold–Metal Interface Heat Transfer Coefficient Values in Casting...

Selection of Initial Mold–Metal Interface Heat TransferCoefficient Values in Casting Simulations—a SensitivityAnalysis
RAMESH K. NAYAK and SURESH SUNDARRAJ
Mold–metal interface heat transfer coefficient values need to be determined precisely to accu-rately predict thermal histories at different locations in automotive castings. Thermomechanicalsimulations were carried out for Al-Si alloy casting processes using a commercial code. Thecooling curve results were validated with experimental data from the literature for a cylindrical-shaped casting. Our analysis indicates that the interface heat transfer coefficient (IHTC) initialvalue choice between chill–metal and the sand mold–metal interfaces has a marked effect on thecooling curves. In addition, after choosing an IHTC initial value, the solidification rates of thealloy near the chill–metal interfaces varied during subsequent cooling when the gap began toform. However, the gap formation, which results in an IHTC change from the initial value, doesnot affect the cooling curves within the vicinity of the sand–metal interface. Optimized initialIHTC values of 3000 and 7000 W m�2-K�1 were determined for a sand–metal interface and achill (steel or copper)–metal interfaces, respectively. The initial IHTC had a significant effect onthe prediction of secondary dendrite arm spacing (SDAS) (varying between approximately15 microns and 70 microns) and ultimate tensile strength (UTS) (varying between approximately250 MPa and 370 MPa) for initial IHTC values that were less than the optimized value of7000 W m�2 K�1 for the chill–metal interfaces.
DOI: 10.1007/s11663-009-9317-0� The Minerals, Metals & Materials Society and ASM International 2009
I. INTRODUCTION
CASTINGS for automotive applications are manufac-tured through precision sand, gravity, or pressure diecasting processes. Several models have been developed tostudy the solidification phenomena that occur in thesecasting processes. Suchmodels have been used successfullyto design castings that are free from gross solidificationdefects such as macroshrinkage cavities for conventionalautomotiveAl casting alloys.However,with the increasinguse of advanced casting alloys, it is necessary to improvethe predictive capability of these models.
One key input needed to accuratelymodel solidificationin these casting processes is the interface heat transfercoefficient (IHTC) between themetal and themold. IHTCcontrols the heat transfer through the air gap that formsbetween themetal and themold because of shrinkage thatoccurs during solidification. Several studies haveattempted to quantify the IHTC, which highlight thedifferent factors that affect heat flow across the inter-face during solidification. These factors include the
thermophysical properties of the contacting materials,the casting geometry, the orientation of the casting–moldinterface that affects the contact pressure, mold temper-ature, liquid alloy surface tension, pouring temperature,the roughness of the mold contacting surface, and themold coating.[1,2] Initial work by Ho and Pehlke[3] wasdirected toward understanding themechanisms of air gapformation at the chill–metal interface. They suggestedthat a thin skin of solidifiedmetal first forms whenmoltenmetal comes into contact with the chill surface. Duringthis stage, heat transfer occurs by conduction through thepeaks of the rough surfaces of the casting and chill that arein contact and also by conduction through air or othergases trapped in the voids between these contact areas(Figure 1). As solidification progresses, relative expan-sion and contraction of the chill and the casting alters theamount of contact and the size of the interfacial gapbetween the two surfaces. Eventually, this process leads toa complete separation and a drastic reduction of the heattransfer coefficient as the heat is extracted from the castingthrough a relatively insulating ‘‘air gap.’’Griffiths[4] has studied the effect of direction orientation
of solidification on IHTC. For the three different orien-tations of the chill–metal geometry, which were cast andcooled separately from the bottom, top, and sides of themold walls, the IHTC values were calculated to be 7100,3400, and 5000 Wm�2 K�1, respectively. Stavros et al.[5]
observed that an increase inmold surface roughness resultedin a decrease in the heat transfer coefficient and that anincrease in metal temperature resulted in an increase inthe heat transfer coefficient. Hallam and Griffiths[6]
RAMESH K. NAYAK, formerly Engineer CAE, Powertrain,General Motors India Pvt Ltd, is now Deputy Manager, Development,with Foundry and Forge Division, Hindustan Aeronautics Ltd,Bangalore Complex, Bangalore 560 017, India. SURESH SUNDARRAJ,Staff Researcher, is with the Materials Characterization and Modeling,R&D, General Motors India Pvt Ltd, 2nd/3rd Floor, Creator Building,International Tech Park, Whitefield Road, Bangalore 560 066, India.Contact e-mail: [email protected]
Manuscript submitted March 18, 2009.Article published online November 17, 2009.
METALLURGICAL AND MATERIALS TRANSACTIONS B VOLUME 41B, FEBRUARY 2010—151

showed thatwith an increase in the initial temperature of acoated steel chill from 20 �C to 300 �C, the IHTCincreases, whereas an increase in the die coating thickness(from100 to 300microns) reduces the IHTCby a factor oftwo. Santos et al.[2] showed that the transient IHTCbetween mold–air and metal–mold interfaces can beexpressed as a time-dependent power law function. Forthe mold–air interface, they provided an expression forthe IHTC in a general form, i.e., ha = Cm t0.15, and themold–metal interface was hs = Ci t
–n. In these expres-sions, t denotes time in seconds, Cm is a constant thatdepends on the thickness of the chill, and Ci and n areconstants that depend on alloy composition, chill mate-rial, and the superheat. The analysis by Hines[7] indicatesthat a greater difference exists between the IHTC forconcave and convex surfaces of the mold and thatdifferent IHTC values for different surface configurationsshould be used in the solidification modeling analysis toobtain accurate cooling curve predictions.
Although previous studies have identified variousfactors that affect IHTC, the effect of the initial value ofIHTC on the cooling curve behavior has not beenstudied comprehensively. The objective of the presentwork is to use a commercial code, i.e., ProCAST(ProCAST Products, Inc., Highland, CA),[8] to performcoupled thermal-stress analysis calculations on differentgeometries as well as sensitivity analyses to determinethe effect of the initial IHTC choice on the coolingcurves. We also have optimized the initial IHTC valuefor different types of mold materials, i.e., steel chills,copper chills, and sand. The application of theseoptimized IHTC values in the thermal analysis of thechill–metal interface for a section of an engine blockcasting also has been discussed.
II. MATHEMATICAL MODEL
A. Thermal Model
The heat transfer equation that governs the conduc-tion-driven solidification can be expressed as follows:
@
@tqHð Þ ¼ r � KrTð Þ ½1�
where H denotes enthalpy that is expressed as follows:
H ¼ cpTþ 1� gsð ÞDHf ½2�
where q, cp, K, and DHf represent density, specific heat,thermal conductivity, and latent heat, respectively.The fraction of solid gs in the mushy zone is estimated
by the Scheil equation, which assumes perfect mixing inthe liquid and no solid diffusion at the local microscopicscale.[9,10] Assuming that the liquidus and solidus curvesof the phase diagram have constant slopes, gs can beexpressed as follows:
gs ¼ 1� Tm � T
Tm � Tliq
� �1=ðk0�1Þ½3�
where Tm, Tliq, and k0 are the melting temperature ofpure metal, liquidus temperature of the alloy, and thepartition coefficient of the alloy, respectively. The vol-ume averaged[11] properties are expressed as follows:
q ¼ gsqs þ ð1� gsÞql
cp ¼ gscps þ ð1� gsÞcplK ¼ gsKs þ ð1� gsÞKl
½4�
where the subscripts s and l denote solid and liquidphases, respectively. The mold–casting IHTC areexpressed as follows:
h ¼ Kgap
Xgap½5�
where h is the IHTC, Kgap is the thermal conductivity ofthe air in the interface gap, and Xgap is the averageinterface width.
B. Stress Model
In the stress analysis using ProCAST, the total strainvector {De} is calculated as follows:
Def g ¼ Deel� �
þ Deth� �
½6�
where {Deel} is the elastic strain increment and {Deth} isthe thermal strain increment vector. The total strain incre-ment vector {De} is related to the stress increment vector{Dr} by Hooke’s law, which is expressed as follows:
Drf g ¼ D½ � Def g ½7�
where [D] is the elastic tensor. The incremental thermalstrain vector {Deth} is the result of volume changesthat accompany the temperature change DT that is cal-culated from the thermal model.
Deth� �
¼ aðTÞDTf g ½8�
In the above expression, a represents the thermalexpansion coefficient.
III. RESULTS AND DISCUSSION
Griffiths[12] carried out experiments to determine theheat-transfer coefficient for the case of unidirectional
Fig. 1—Schematic view of heat flow across the mold–casting inter-face.
152—VOLUME 41B, FEBRUARY 2010 METALLURGICAL AND MATERIALS TRANSACTIONS B

solidification of an Al-7 pct Si alloy. This simulationwas used in the present study to benchmark theProCAST simulation results. In Griffith’s experiments,Al-7 pct Si alloys were cast in a cylindrical refractoryfiber tube mold. The physical properties of the alloy andthe mold materials are provided in Table I. A copperchill was located at the bottom of the casting, which waswater-cooled; refer to the experimental setup shown inFigure 2. The expansion–contraction of the copper chillthat occurred during the casting process was taken intoaccount while performing the thermal-stress calcula-tions. Figure 3 shows a comparison of cooling curvesbetween the experimental and simulation results chosenat two equidistant locations of 75 mm above and belowthe chill–metal interface. The predicted simulationresults reasonably agreed with the experimentally mea-sured cooling curves.
A. Sensitivity Studies
For the sensitivity studies, a cubical shape (1 91 9 1 cm3) casting of Al-13 pct Si alloy with a bottom
sand–steel–copper chill (1 9 1 9 1 cm3) to induce uni-directional solidification was chosen (see Figure 4). Inthis simulation, the chill was assumed to be rigid. Thethermo-mechanical simulations were carried out using
Table I. Properties of Cu Chill and Al-7 wt pct Si alloy[12]
Property(Units) Value
Properties of CopperThermal conductivity(W m�1 K�1)
416.51 – 0.05874 T
Specific heat capacity(J kg�1 K�1)
351+0.11069 T
Density (kg m�3) 9095.11 – 0.4629 TCoefficient of thermalexpansion (K�1)
17.7 9 10�6
Young modulus (Pa) 115 9 109
Poisson’s ratio 0.33Properties of Al-7wt pct Si Alloy (Liquid Phase)Thermal conductivity(W m�1 K�1)
88.6
Specific heat capacity(J kg�1 K�1)
1080
Density (kg m�3) 2394Properties of Al-7wt pct Si Alloy (Solid Phase)Thermal conductivity(W m�1 K�1)
198
Specific heat capacity(J kg�1 K�1)
917
Density (kg m�3) 2672Coefficient of thermalexpansion (K�1)
24 9 10�6
Young modulus (Pa) 58,795+121.35 T– 0.2288 T2
Poisson’s ratio 0.33Yield stress (Pa) 3.41 9 109 9 10�0.00383T
Latent heat (J kg�1) 397,490Liquidus temperature (K) 890Solidus temperature (K) 850Fraction of solidof the primary phase
0.5248
Partition coefficient 0.13Effective specific heat capacity(J kg�1 K�1)
3415+8.0234 9 103 T+4.71754 T2
Fig. 2—Schematic view of unidirectional solidification of Al-7 pct Sialloys.[12]
Fig. 3—Comparison of experimental[4] and predicted cooling curves.
Fig. 4—Schematic view of a cube casting model.
METALLURGICAL AND MATERIALS TRANSACTIONS B VOLUME 41B, FEBRUARY 2010—153

Table II. Properties of Al-13 wt pct Si Alloy, Steel, and Sand Materials[8]
Al-13 pct Si Alloy Temperature (K) Value Temperature (K) Value
Thermal conductivity (W m�1 K�1) 573 152 Poisson’s ratio 299 0.37843 144 339 0.37845 80 399 0.371023 80 459 0.37
Specific heat capacity (kJ kg�1 K�1) 573 1.02 519 0.37723 1.13 579 0.37823 1.2 639 0.37843 1.21 699 0.37845 1.21 759 0.371023 1.21 819 0.37
Density (kg m�3) 573 2600 834 0.37843 2560 840 0.37845 2478 846 0.391023 2431 852 0.43
Latent heat (J kg�1) 522,000 858 0.43Eutectic Temperature (K) 844 864 0.44Yield stress (MPa) 293 186 870 0.45
473 172 876 0.46573 117 882 0.48673 54 888 0.50773 31 890 0.50829 9 893 0.50848 5 Coefficient of thermal
expansion (K�1)313 2.2E–05
889 5 673 2.5E–05Young modulus (MPa) 299 7.3.E+04 773 2.6E–05
359 7.3.E+04 819 2.6E–05419 7.1.E+04 830 2.6E–05479 6.6.E+04 840 2.6E–05539 5.8.E+04 844 2.6E–05599 4.8.E+04 848 2.3E–05659 3.7.E+04 888 2.3E–05719 2.7.E+04779 1.7.E+04830 8.0.E+03836 6.9.E+03842 5.5.E+03848 1.4.E+03854 1.0.E+03
Thermal conductivity(W m�1 K�1)
296 25 Young modulus (MPa) 521 209,526473 26 611 206,930773 27 701 200,016873 28 791 189,0021073 28 881 174,783
Density (kg m�3) 518 7625 971 158,202538 7619 1061 140,741558 7614 1151 124,988578 7608 Poisson’s ratio 521 0.36598 7602 641 0.36618 7596 761 0.36638 7590 881 0.36658 7584 1001 0.36678 7577 1121 0.36698 7571 1241 0.36718 7565 Coefficient of thermal
expansion (K�1)631 1.4E05
738 7558 871 1.5E–05758 7552 1051 1.5E–05778 7545 1111 1.5E–05798 7539 1171 1.3E–05
Enthalpy (kJ kg�1) 518 26 Sand Temperature (K) Value
538 38 Thermal conductivity(W m�1 K�1)
298 0.73558 50 473 0.64578 62 673 0.59598 75 873 0.59618 88 1073 0.64
154—VOLUME 41B, FEBRUARY 2010 METALLURGICAL AND MATERIALS TRANSACTIONS B

the material properties given in Table II. Note that thecooling curves were chosen at two equidistant locationsof 2 mm on either side of the mold–metal interfaces forall the cases studied here.
1. Cubical Block—Sand Mold CastingFigure 5 shows the comparison of cooling curves with
different initial IHTC values for sand mold casting.Figure 6 shows the corresponding interface IHTC vs
time for hi = 1000 and 3000 Wm�2 K�1. In this case,the heating rate of the mold changed more rapidlycompared with the cooling behavior of the casting up to200 seconds.This behavior is attributed to the fact that the
interface gap did not form until 200 seconds (i.e., the
Fig. 5—Comparison of cooling curves at casting and mold surfacesin cube casting for different initial IHTC (hi) (sand mold–metalinterface).
Fig. 6—Comparison of IHTC vs time for initial IHTC (hi) = 1000and 3000 W m�2 K�1 (sand mold–metal interface). Fig. 7—(a) Comparison of cooling curves at the casting surface in
cube casting for different initial IHTC (hi) (steel chill–metal interface).(b) Comparison of cooling curves at the mold surface in the cube cast-ing for different initial IHTC (hi) (steel chill–metal interface).
Table II. Continued
Al-13 pct Si Alloy Temperature (K) Value Temperature (K) Value
638 101 1273 0.7658 114 Specific heat capacity
(kJ kg�1 K�1)300 0.68
678 128 400 0.86698 141 600 0.99718 156 800 1.07738 170 1000 1.12758 185 1200 1.17778 200 Density (kg m�3) 1520798 215
Yield Stress (MPa) 422 814644 647773 396823 302
METALLURGICAL AND MATERIALS TRANSACTIONS B VOLUME 41B, FEBRUARY 2010—155

metal was in close contact with the sand where the initialIHTC value chosen predominantly controls the heattransfer through the sand mold). After 200 seconds, anair gap began to form, which then controlled the heattransfer process and lead to small changes in the coolingcurves of the alloy for the chosen initial IHTC values.When the air gap stabilized beyond 280 seconds, themold and the alloy began to cool at the same rate.
2. Cubical Casting with Steel ChillFigures 7(a) and (b) show the comparison of cooling
curves with different initial IHTC (hi) values for acasting with a steel chill–metal interface. Both the chillheating and the metal cooling were sensitive to the initialIHTC choice. This behavior can be attributed to thehigh thermal conductivity and low heat capacity of thechill, which caused a gap to form within 1 second afterthe metal came into contact with the mold as opposed tothe sand–mold interface in which the gap formationbegan after 200 seconds.
Figures 8(a) and (b) show the change in IHTC as afunction of time and temperature, respectively, duringthe thermomechanical simulation for two differentinitial values of IHTC. Significant differences wereobserved in terms of the gap formation in these two
cases during the solidification process, which explainsthe differences observed in the predicted metal coolingand chill heating curves. Based on these results, an initialchoice of IHTC = 7000 Wm�2 K�1 was an optimalvalue that provided sufficient accuracy in casting sim-ulations involving steel chill–metal interfaces.
3. Cubical Casting with Copper ChillFigures 9(a) and (b) compare the cooling curves with
different initial IHTC values for the cubical casting witha copper chill. The corresponding IHTC values as afunction of time and temperature are shown inFigures 10(a) and (b). Here, again, a similar behavioras the steel chill–metal interface was observed. Also, anoptimal initial IHTC value of 7000 Wm�2 K�1 wassufficient to provide the required degree of accuracy forcasting simulations that involved a copper chill–metalinterface.
B. Effect of IHTC on Secondary Dendrite Arm Spacing(SDAS) and Ultimate Tensile Strength (UTS)
The effect of initial IHTC on secondary dendrite armspacing (SDAS) and ultimate tensile strength (UTS)
Fig. 8—(a) Comparison of IHTC vs time for initial IHTC(hi) = 3000 and 7000 W m�2 K�1 (steel chill–metal interface).(b) Comparison of IHTC vs temperature for initial IHTC(hi) = 3000 and 7000 W m�2 K�1 (steel chill–metal interface).
Fig. 9—(a) Comparison of cooling curves at the casting surface incube casting for different initial IHTC (hi) (copper chill–metal inter-face). (b) Comparison of cooling curves at the mold surface in cubecasting for different initial IHTC (hi) (copper chill–metal interface).
156—VOLUME 41B, FEBRUARY 2010 METALLURGICAL AND MATERIALS TRANSACTIONS B

were analyzed for the cubical casting geometry shown inFigure 4 and for the case of a quarter section of anengine block casting. A schematic view of the chillgeometry used for the engine block casting is shown inFigure 11. The thermophysical properties of the alloy(Al-7 wt pct Si) and chill materials (copper and steel) areshown in Table I.
Zhang et al.[13] provided an empirical correlation ofSDAS with respect to the local solidification time ts forthe Al-7 pct Si alloy through the following relationship:
SDAS ¼ 8:79 tsð Þ1=3 ½9�
Flemings et al.[14] correlated the UTS with the SDASmeasurements for the A356 alloy from which thefollowing relationship has been derived:
UTS ¼ 410:9� 2:864� SDASþ 0:01� SDAS2 ½10�
C. SDAS and UTS Calculations for Cubical BlockCastings with Steel–Copper Chills
Simulations were carried out using different initialvalues of the IHTC for cubical casting with differentchill materials (steel and copper). The SDAS andUTS results were calculated with Eqs. [9] and [10],respectively, using the local solidification time, ts,predicted at a location 2 mm above the chill–metalinterface. Table III clearly shows the significant changesin these properties because of the choice of the initialIHTC values. These results also are depicted inFigures 12 and 13 for the cubical casting with a copperchill. A similar variation was observed for the steelchill. These results clearly indicate that the SDAS and
Fig. 10—(a) Comparison of IHTC vs time for initial IHTC(hi) = 5000 and 10000 W m�2 K�1 (copper chill–metal interface).(b) Comparison of IHTC vs temperature for initial HTC (hi) = 5000and 10,000 m�2 K�1 (copper chill/metal interface). Fig. 11—Schematic view of chill geometry for engine block casting.
Table III. Effect of Initial IHTC on the SDAS and UTS Predictions Using Copper–Steel Chills Using Thermomechanical
(TH-ME)/Thermal (TH) Simulations for the Cubical Casting
Initial IHTC(W m�2 K�1)
Copper Chill Steel Chill
SDAS(lm) TH-ME
SDAS(lm) TH
UTS(MPa) TH-ME
UTS(MPa) TH
SDAS(lm) TH-ME
SDAS(lm) TH
UTS(MPa) TH-ME
UTS(MPa) TH
100 58 58 278 278 57 57 281 281500 35 35 323 323 34 34 325 3251000 27 27 340 341 27 27 341 3413000 18 18 362 363 19 18 360 3625000 15 14 371 373 16 16 367 3687000 12 12 378 378 15 15 370 37110000 9 9 385 385 14 12 373 377
METALLURGICAL AND MATERIALS TRANSACTIONS B VOLUME 41B, FEBRUARY 2010—157
UTS values were extremely sensitive to the choice of theinitial IHTC values below 7000 Wm�2 K�1.
D. Engine Block Casting Section Using Steel–CopperChills
The SDAS and UTS sensitivity analysis was extendedto study the effect of the initial IHTC values at the
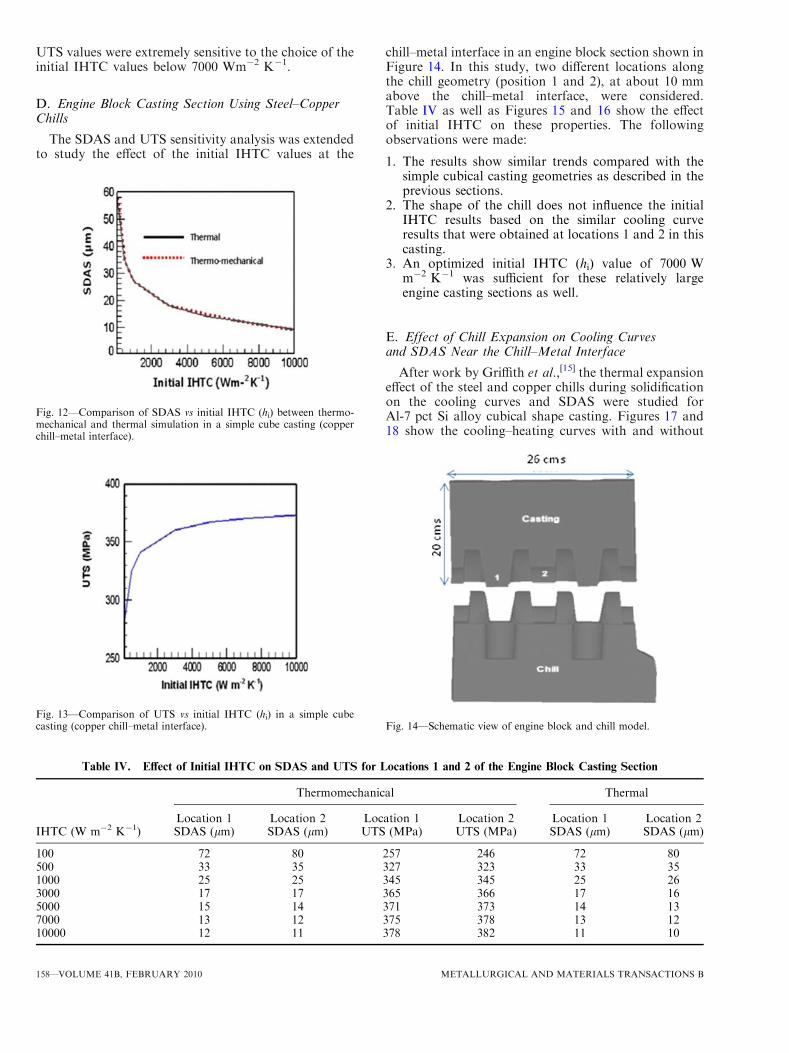
chill–metal interface in an engine block section shown inFigure 14. In this study, two different locations alongthe chill geometry (position 1 and 2), at about 10 mmabove the chill–metal interface, were considered.Table IV as well as Figures 15 and 16 show the effectof initial IHTC on these properties. The followingobservations were made:
1. The results show similar trends compared with thesimple cubical casting geometries as described in theprevious sections.
2. The shape of the chill does not influence the initialIHTC results based on the similar cooling curveresults that were obtained at locations 1 and 2 in thiscasting.
3. An optimized initial IHTC (hi) value of 7000 Wm�2 K�1 was sufficient for these relatively largeengine casting sections as well.
E. Effect of Chill Expansion on Cooling Curvesand SDAS Near the Chill–Metal Interface
After work by Griffith et al.,[15] the thermal expansioneffect of the steel and copper chills during solidificationon the cooling curves and SDAS were studied forAl-7 pct Si alloy cubical shape casting. Figures 17 and18 show the cooling–heating curves with and without
Fig. 12—Comparison of SDAS vs initial IHTC (hi) between thermo-mechanical and thermal simulation in a simple cube casting (copperchill–metal interface).
Fig. 13—Comparison of UTS vs initial IHTC (hi) in a simple cubecasting (copper chill–metal interface). Fig. 14—Schematic view of engine block and chill model.
Table IV. Effect of Initial IHTC on SDAS and UTS for Locations 1 and 2 of the Engine Block Casting Section
Thermomechanical Thermal
IHTC (W m�2 K�1)Location 1 Location 2 Location 1 Location 2 Location 1 Location 2SDAS (lm) SDAS (lm) UTS (MPa) UTS (MPa) SDAS (lm) SDAS (lm)
100 72 80 257 246 72 80500 33 35 327 323 33 351000 25 25 345 345 25 263000 17 17 365 366 17 165000 15 14 371 373 14 137000 13 12 375 378 13 1210000 12 11 378 382 11 10
158—VOLUME 41B, FEBRUARY 2010 METALLURGICAL AND MATERIALS TRANSACTIONS B
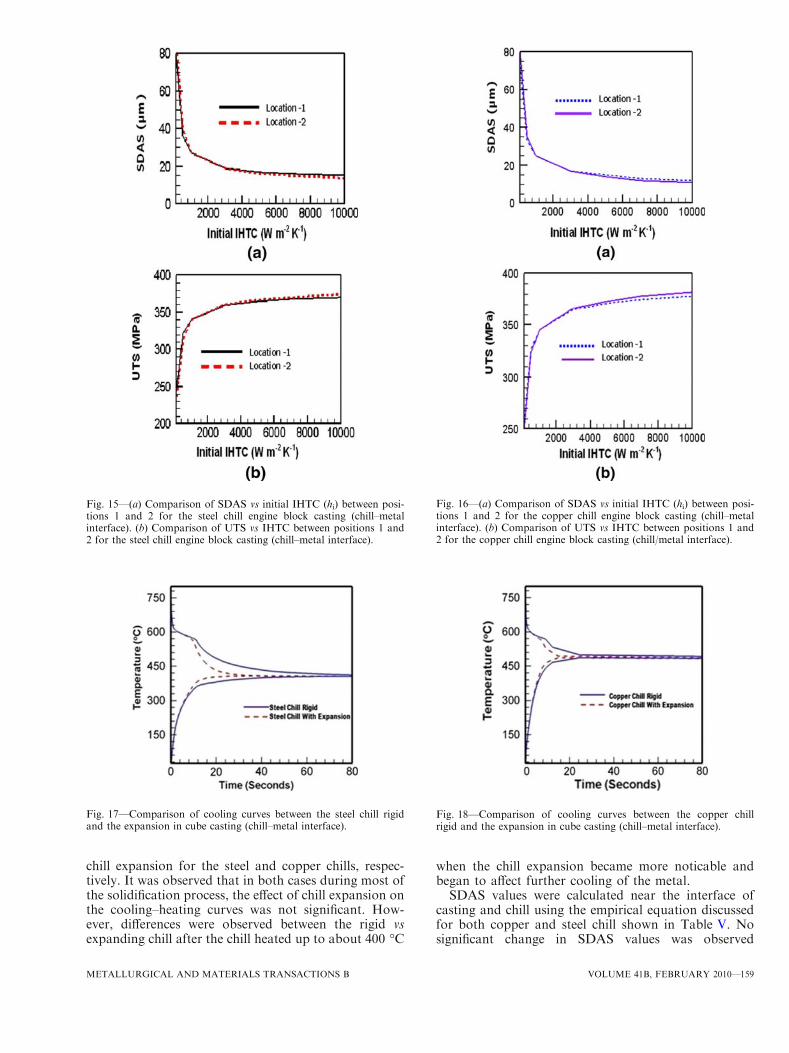
chill expansion for the steel and copper chills, respec-tively. It was observed that in both cases during most ofthe solidification process, the effect of chill expansion onthe cooling–heating curves was not significant. How-ever, differences were observed between the rigid vsexpanding chill after the chill heated up to about 400 �C
when the chill expansion became more noticable andbegan to affect further cooling of the metal.SDAS values were calculated near the interface of
casting and chill using the empirical equation discussedfor both copper and steel chill shown in Table V. Nosignificant change in SDAS values was observed
Fig. 15—(a) Comparison of SDAS vs initial IHTC (hi) between posi-tions 1 and 2 for the steel chill engine block casting (chill–metalinterface). (b) Comparison of UTS vs IHTC between positions 1 and2 for the steel chill engine block casting (chill–metal interface).
Fig. 16—(a) Comparison of SDAS vs initial IHTC (hi) between posi-tions 1 and 2 for the copper chill engine block casting (chill–metalinterface). (b) Comparison of UTS vs IHTC between positions 1 and2 for the copper chill engine block casting (chill/metal interface).
Fig. 17—Comparison of cooling curves between the steel chill rigidand the expansion in cube casting (chill–metal interface).
Fig. 18—Comparison of cooling curves between the copper chillrigid and the expansion in cube casting (chill–metal interface).
METALLURGICAL AND MATERIALS TRANSACTIONS B VOLUME 41B, FEBRUARY 2010—159

between where the chill was assumed to be rigid andwhere the chill expansion was considered, which can beattributed to the fact that the chill expansion wasnegligible during most of the solidification process.
IV. CONCLUSIONS
1. The initial IHTC is critical for thermal and thermo-mechanical simulations regardless of the type of moldmaterial used or their geometrical shape complexities.
2. The optimized value for the initial IHTC for thesand–metal interface was 3000 W m–2 K�1, whereasfor steel (or copper) chill–metal interface was 7000 Wm�2 K�1.
3. With the correct initial IHTC value choice, a thermalsimulation is sufficient to predict the cooling curvesaccurately, without resorting to the use of a fullycoupled thermomechanical simulation, provided onlysand mold–metal interfaces are involved in thecasting.
4. However, when a chill–metal interface is involved inthe casting, a thermomechanical simulation isrequired because both the initial IHTC and the rateof gap formation significantly affect the alloy solidi-fication process.
5. The effect of initial IHTC on both SDAS and UTSusing steel and copper chills for cubical casting aswell as for an engine block casting section were
studied. In both cases, the initial IHTC had a sig-nificant effect on the prediction of SDAS and UTSvalues.
6. The chill expansion does not affect SDAS and UTSvalues significantly near the chill–metal interfacewhen the chill is assumed to be rigid. The chillexpansion is small during solidification because thechill temperatures are lower. When the chill heats upbeyond 400 �C, future cooling of the casting sectionnear the interface is affected when the chill expansionis considered.
REFERENCES1. C.A. Santos, C.A. Siqueria, A. Garcia, J.M.V. Cuaresma, and J.A.
Spim: Inv. Problems Sci. Eng., 2004, vol. 12, pp. 279–96.2. C.A. Santos, J.M.V. Cuaresma, and A. Garcia: Alloys Compd.,
2001, vol. 319, pp. 174–86.3. K. Ho and R.D. Pehlke:Metall. Trans. B, 1985, vol. 16B, pp. 585–
94.4. W.D. Griffiths: Metall. Mater. Trans. B, 1999, vol. 30B, pp. 473–
82.5. S.A. Argyropoulos and H.G. Carletti:Mineral Metals Mater. Soc.,
2006, pp. 243–50.6. C.P. Hallam and W.D. Griffiths: Metall. Mater. Trans. B, 2004,
vol. 35B, pp. 721–33.7. J.A. Hines: Metall. Mater. Trans. B, 2004, vol. 35B, pp. 299–311.8. ProCAST User Manual, version 6.1. ESI Software, Paris, France,
2007.9. V.R. Voller and S. Sundarraj: Mater. Sci. Technol., 1993, vol. 9,
pp. 474–81.10. S. Sundarraj and V.R. Voller: Int. J. Heat Mass Transfer, 1993,
vol. 36, pp. 713–23.11. J. Ni and C. Beckermann: Metall. Trans. B, 1991, vol. 22, pp. 349–
61.12. W.D. Griffiths: Metall. Mater. Trans. B, 2000, vol. 31B, pp. 285–
95.13. P. Zhang, F. Du, Z. Xu, and L. Zhao: Mater. Sci. Forum, 2008,
vols. 575–78, pp. 115–20.14. M.C. Flemings, T.Z. Kattamin, and B.P. Bardes: AFS Trans.,
1991, vol. 99, pp. 501–06.15. W.D. Griffiths, K.N. Prabhu, C P. Hallam, and R. Kayikci: Int. J.
Cast Metal. Res., 2003, vol. 15, pp. 545–50.
Table V. Efffect of Chill Expansion on the SDAS
Predictions for Al-7 pct Si Alloy
Chill TypeChill Rigid—SDAS
(lm)Chill with
Expansion—SDAS (lm)
Copper 16 15Steel 18 17
160—VOLUME 41B, FEBRUARY 2010 METALLURGICAL AND MATERIALS TRANSACTIONS B