Segmentation of Plaques in Sequences of Ultrasonic B-Mode Images of Carotid Arteries Based on Motion...
10
2202 IEEE TRANSACTIONS ON BIOMEDICAL ENGINEERING, VOL. 58, NO. 8, AUGUST 2011 Segmentation of Plaques in Sequences of Ultrasonic B-Mode Images of Carotid Arteries Based on Motion Estimation and a Bayesian Model Franc ¸ois Destrempes, Jean Meunier, Marie-France Giroux, Gilles Soulez, and Guy Cloutier* Abstract—The goal of this paper is to perform a segmentation of atherosclerotic plaques in view of evaluating their burden and to provide boundaries for computing properties such as the plaque deformation and elasticity distribution (elastogram and modulo- gram). The echogenicity of a region of interest comprising the plaque, the vessel lumen, and the adventitia of the artery wall in an ultrasonic B-mode image was modeled by mixtures of three Nakagami distributions, which yielded the likelihood of a Bayesian segmentation model. The main contribution of this paper is the es- timation of the motion field and its integration into the prior of the Bayesian model that included a local geometrical smoothness con- straint, as well as an original spatiotemporal cohesion constraint. The Maximum A Posteriori of the proposed model was computed with a variant of the exploration/selection algorithm. The starting point is a manual segmentation of the first frame. The proposed method was quantitatively compared with manual segmentations of all frames by an expert technician. Various measures were used for this evaluation, including the mean point-to-point distance and the Hausdorff distance. Results were evaluated on 94 sequences of 33 patients (for a total of 8988 images). We report a mean point- to-point distance of 0.24 ± 0.08 mm and a Hausdorff distance of 1.24 ± 0.40 mm. Our tests showed that the algorithm was not sensitive to the degree of stenosis or calcification. Manuscript received July 28, 2010; revised December 1, 2010, February 14, 2011; accepted March 7, 2011. Date of publication March 14, 2011; date of current version July 20, 2011. This work was jointly supported by the Natural Sciences and Engineering Research Council of Canada under Grant 138570-06 and Grant 323405-06 and by the Canadian Institutes of Health Research under Grant PPP-78763. Asterisk indicates corresponding author. F. Destrempes is with the Laboratory of Biorheology and Medical Ultrason- ics, University of Montreal Hospital Research Center (CRCHUM), Montr´ eal, QC H2L-2W5, Canada (e-mail:[email protected]). J. Meunier is with the Department of Computer Science and Operation Research (DIRO), University of Montreal, Montr´ eal, QC H3C-3J7, Canada, and also with the Institute of Biomedical Engineering, University of Montreal, Montr´ eal, QC H3T-1J4, Canada (e-mail: [email protected]). M.-F. Giroux is with the Department of Radiology, University of Montreal Hospital Center (CHUM), Montr´ eal, QC H2L-4M1, Canada, and also with the Department of Radiology, Radio-Oncology, and Nuclear Medicine, University of Montreal, Montr´ eal, QC H3T-1J4, Canada (e-mail: [email protected]). G. Soulez is with the Department of Radiology, University of Montreal Hospital Center (CHUM), Montr´ eal, QC H2L-4M1, Canada, with the De- partment of Radiology, Radio-Oncology, and Nuclear Medicine, University of Montreal, Montr´ eal, QC H3T-1J4, Canada, and also with the Institute of Biomed- ical Engineering, University of Montreal, Montr´ eal, QC H3T-1J4, Canada (e-mail:[email protected]). *G. Cloutier is with the Laboratory of Biorheology and Medical Ultrasonics, University of Montreal Hospital Research Center (CRCHUM), Montr´ eal, QC H2L-2W5, Canada, with the Department of Radiology, Radio-Oncology and Nuclear Medicine, University of Montreal, Montr´ eal, QC H3T-1J4, Canada, and also with the Institute of Biomedical Engineering, University of Montreal, Montr´ eal, QC H3T-1J4, Canada (e-mail:[email protected]). Digital Object Identifier 10.1109/TBME.2011.2127476 Index Terms—B-Mode, Bayesian model, carotid artery, expec- tation maximization algorithm, exploration selection algorithm, mixtures of Nakagami distributions, motion estimation, plaque, segmentation, stochastic optimization, tracking, ultrasound. I. INTRODUCTION P RECISE segmentations of plaques in a sequence of ul- trasonic B-mode images of the carotid artery allow the computation of various biomechanical and anatomical proper- ties of the artery wall that may be useful to clinicians to follow the evolution of the atherosclerotic disease. In fact, in [1]–[4], an elasticity map is computed in a region of interest (ROI) of the artery wall along a few cardiac cycles to help determining the vulnerability of the plaque. Thus, it is useful to have a segmen- tation of the ROI through a whole sequence of ultrasound (US) images to track time-varying elasticity changes. Considering the amount of time required to perform manually the segmentation task as well as the intraobserver or interobserver variability that is usually associated with this task, an algorithm that performs the segmentation based on minimal user interaction is important in the research context. Several algorithms for the segmentation of carotid arteries that present a plaque have been proposed in US imaging (see Table I). In [5] and [6], various snake segmentation methods, with initialization based on the blood flow image, were tested in the context of 2-D longitudinal images of carotid plaques. The plaque in 2-D longitudinal images is segmented in [7]–[9] using a combination of gradient-based segmentation, a snake segmentation method, and a fuzzy K-means algorithm, with an initialization based on pixel intensity. Hough transforms are used in [10] to perform the segmentation of 2-D longitudinal and cross-sectional images of plaques. Other papers (e.g. [11]–[15]) have presented atherosclerotic carotid segmentation techniques, but for the segmentation of the lumen rather than the plaque itself. The reader may consult [16]–[18] for numerous other references on US imaging, including intravascular ultrasound segmentation methods and tissue characterization. In this paper, we present a method for the segmentation of plaques in video sequences of US images of the internal carotid artery (ICA). We formulate the proposed method in a Bayesian framework. The proposed Bayesian model is inspired by the model presented in [19]. As in [19], the likelihood of the proposed segmentation model is based on mixtures of Nakagami distributions, which are used to describe the statis- tical properties of the intensity in a B-mode image. The main addition to our previous paper [19], that was limited to healthy 0018-9294/$26.00 © 2011 IEEE
-
Upload
universityofmontreal -
Category
Documents
-
view
2 -
download
0
Transcript of Segmentation of Plaques in Sequences of Ultrasonic B-Mode Images of Carotid Arteries Based on Motion...

2202 IEEE TRANSACTIONS ON BIOMEDICAL ENGINEERING, VOL. 58, NO. 8, AUGUST 2011
Segmentation of Plaques in Sequences of UltrasonicB-Mode Images of Carotid Arteries Based on
Motion Estimation and a Bayesian ModelFrancois Destrempes, Jean Meunier, Marie-France Giroux, Gilles Soulez, and Guy Cloutier*
Abstract—The goal of this paper is to perform a segmentationof atherosclerotic plaques in view of evaluating their burden andto provide boundaries for computing properties such as the plaquedeformation and elasticity distribution (elastogram and modulo-gram). The echogenicity of a region of interest comprising theplaque, the vessel lumen, and the adventitia of the artery wall inan ultrasonic B-mode image was modeled by mixtures of threeNakagami distributions, which yielded the likelihood of a Bayesiansegmentation model. The main contribution of this paper is the es-timation of the motion field and its integration into the prior of theBayesian model that included a local geometrical smoothness con-straint, as well as an original spatiotemporal cohesion constraint.The Maximum A Posteriori of the proposed model was computedwith a variant of the exploration/selection algorithm. The startingpoint is a manual segmentation of the first frame. The proposedmethod was quantitatively compared with manual segmentationsof all frames by an expert technician. Various measures were usedfor this evaluation, including the mean point-to-point distance andthe Hausdorff distance. Results were evaluated on 94 sequences of33 patients (for a total of 8988 images). We report a mean point-to-point distance of 0.24 ± 0.08 mm and a Hausdorff distanceof 1.24 ± 0.40 mm. Our tests showed that the algorithm was notsensitive to the degree of stenosis or calcification.
Manuscript received July 28, 2010; revised December 1, 2010, February 14,2011; accepted March 7, 2011. Date of publication March 14, 2011; date ofcurrent version July 20, 2011. This work was jointly supported by the NaturalSciences and Engineering Research Council of Canada under Grant 138570-06and Grant 323405-06 and by the Canadian Institutes of Health Research underGrant PPP-78763. Asterisk indicates corresponding author.
F. Destrempes is with the Laboratory of Biorheology and Medical Ultrason-ics, University of Montreal Hospital Research Center (CRCHUM), Montreal,QC H2L-2W5, Canada (e-mail:[email protected]).
J. Meunier is with the Department of Computer Science and OperationResearch (DIRO), University of Montreal, Montreal, QC H3C-3J7, Canada,and also with the Institute of Biomedical Engineering, University of Montreal,Montreal, QC H3T-1J4, Canada (e-mail: [email protected]).
M.-F. Giroux is with the Department of Radiology, University of MontrealHospital Center (CHUM), Montreal, QC H2L-4M1, Canada, and also with theDepartment of Radiology, Radio-Oncology, and Nuclear Medicine, Universityof Montreal, Montreal, QC H3T-1J4, Canada (e-mail: [email protected]).
G. Soulez is with the Department of Radiology, University of MontrealHospital Center (CHUM), Montreal, QC H2L-4M1, Canada, with the De-partment of Radiology, Radio-Oncology, and Nuclear Medicine, University ofMontreal, Montreal, QC H3T-1J4, Canada, and also with the Institute of Biomed-ical Engineering, University of Montreal, Montreal, QC H3T-1J4, Canada(e-mail:[email protected]).
*G. Cloutier is with the Laboratory of Biorheology and Medical Ultrasonics,University of Montreal Hospital Research Center (CRCHUM), Montreal, QCH2L-2W5, Canada, with the Department of Radiology, Radio-Oncology andNuclear Medicine, University of Montreal, Montreal, QC H3T-1J4, Canada,and also with the Institute of Biomedical Engineering, University of Montreal,Montreal, QC H3T-1J4, Canada (e-mail:[email protected]).
Digital Object Identifier 10.1109/TBME.2011.2127476
Index Terms—B-Mode, Bayesian model, carotid artery, expec-tation maximization algorithm, exploration selection algorithm,mixtures of Nakagami distributions, motion estimation, plaque,segmentation, stochastic optimization, tracking, ultrasound.
I. INTRODUCTION
PRECISE segmentations of plaques in a sequence of ul-trasonic B-mode images of the carotid artery allow the
computation of various biomechanical and anatomical proper-ties of the artery wall that may be useful to clinicians to followthe evolution of the atherosclerotic disease. In fact, in [1]–[4],an elasticity map is computed in a region of interest (ROI) of theartery wall along a few cardiac cycles to help determining thevulnerability of the plaque. Thus, it is useful to have a segmen-tation of the ROI through a whole sequence of ultrasound (US)images to track time-varying elasticity changes. Considering theamount of time required to perform manually the segmentationtask as well as the intraobserver or interobserver variability thatis usually associated with this task, an algorithm that performsthe segmentation based on minimal user interaction is importantin the research context.
Several algorithms for the segmentation of carotid arteriesthat present a plaque have been proposed in US imaging (seeTable I). In [5] and [6], various snake segmentation methods,with initialization based on the blood flow image, were testedin the context of 2-D longitudinal images of carotid plaques.The plaque in 2-D longitudinal images is segmented in [7]–[9]using a combination of gradient-based segmentation, a snakesegmentation method, and a fuzzy K-means algorithm, withan initialization based on pixel intensity. Hough transforms areused in [10] to perform the segmentation of 2-D longitudinal andcross-sectional images of plaques. Other papers (e.g. [11]–[15])have presented atherosclerotic carotid segmentation techniques,but for the segmentation of the lumen rather than the plaqueitself. The reader may consult [16]–[18] for numerous otherreferences on US imaging, including intravascular ultrasoundsegmentation methods and tissue characterization.
In this paper, we present a method for the segmentationof plaques in video sequences of US images of the internalcarotid artery (ICA). We formulate the proposed method in aBayesian framework. The proposed Bayesian model is inspiredby the model presented in [19]. As in [19], the likelihoodof the proposed segmentation model is based on mixtures ofNakagami distributions, which are used to describe the statis-tical properties of the intensity in a B-mode image. The mainaddition to our previous paper [19], that was limited to healthy
0018-9294/$26.00 © 2011 IEEE

DESTREMPES et al.: SEGMENTATION OF PLAQUES IN SEQUENCES OF ULTRASONIC B-MODE IMAGES OF CAROTID ARTERIES 2203
TABLE IOVERVIEW OF ATHEROSCLEROTIC CAROTID PLAQUE SEGMENTATION TECHNIQUES FOR ULTRASOUND IMAGING
carotids, is the consideration of more complex and moving echotextures of heterogeneous plaques, as well as variable shapes ofthe plaque. It includes a tracking method that uses an estimationof the motion field of the plaque in the video sequence basedon optical flow estimates. The prediction of the position andshape of the plaque at the current frame (based on the motionfield estimates) is then integrated directly into a spatiotemporalcohesion prior term of the proposed Bayesian model. Wealso consider an original geometrical local smoothness priorfor the plaque boundaries. The segmentation problem is thenformulated as the computation of the Maximum A Posteriori(MAP) of the Bayesian model. All computations are performedafter the manual segmentation of the plaque in the first B-modeimage of the video sequence (which is the only user interactionin the proposed method). Thus, the proposed method is semi-automatic. See [20] for a brief account of the proposed method.
The strategy of exploiting optical flow estimates to track mo-tion has appeared in [21] and it was adopted in this study. In [21],it was used as an initialization of the velocities in an active con-tour segmentation method. In our case, the optical flow estimatesare based on a first-order tissue dynamics model (i.e., motionfield), which simplifies their computation. We show that forthe database used in the reported tests, the hypothesis of opti-cal flow is self-consistent, due mainly to small deformations ofthe plaque from one frame to the next one. Moreover, in ourcase, the optical flow estimates are integrated into the prior of aregion-based segmentation model, rather than a contour-basedsegmentation model (as in [21]).
The proposed method was tested on 94 sequences of 2-D lon-gitudinal images of internal carotid arteries of 33 patients, fora total of 8988 images. The size of our database compares veryfavorably with previous studies [6] (80 images), [8] (56 images),and [10] (4 images) that are also testing a segmentation methodof longitudinal images of plaques. Additional material includ-ing a segmented video sequence can be found at our websitehttp://www.lbum-crchum.com (see the publication section).
II. MATERIALS
A. Image Acquisition
The RF images were acquired with a 10-MHz 38-mm lin-ear array transducer of a Sonix RP echograph (Ultrasonix,
Vancouver, BC, Canada). The frame rate was set by the radiol-ogist and depended on the video sequence. It varied between 19and 24 Hz, and the average duration of the sequences acquiredover consecutive cardiac cycles was about 7 s. For 74 of thevideo sequences used in the tests reported in Section VI, 1 mmcorresponds to 51.9 pixels in the axial direction, whereas in thelateral direction, 1 mm is equal to about 6.7 pixels (i.e., 256scan lines for 38 mm). For the other 20 sequences, the axialresolution had been changed at the acquisition step, and 1 mmcorresponds to about 26 pixels in the axial direction (due to anew version of the Sonix RP echograph software).
B. Data
We considered 94 video sequences of B-mode images (i.e.,the uncompressed envelope of the acquired RF images) from 33patients with carotid plaques. Women and men of 40 years orolder for which at least one of the carotid arteries presented astenosis of at least 50% (in diameter reduction) were included inour study. Pathological subjects for whom carotid atherosclero-sis was newly diagnosed were recruited by vascular radiologists,neuroradiologists or neurologists of the University of MontrealHospital Center (CHUM) and by the service of Vascular Neu-rology of CHUM. The Institutional Review Board approved thishealth insurance portability and accountability act-compliant re-search project, and patients signed an informed consent. Therewere 22 men and 11 women with a mean age of 71.5 ± 7.5years. Their body mass index was 25.7 ± 3.4 Kg/m2 . For mostpatients, longitudinal views of the left and right proximal inter-nal carotid arteries were acquired independently by two expertradiologists, for a total of four video sequences per patient.However, in some cases, only the left or right proximal internalcarotid was acquired (seven patients), so that the total numberof carotid arteries was actually 59. Some of the sequences werenot acquired on both sides due to the presence of a thrombosisor a past surgery on the carotid artery. Also, in some cases, onlyone of the expert radiologists performed an acquisition (on 24carotid arteries). The degrees of stenosis and calcification [22]for the 94 sequences are indicated in Table II. When available,stenoses were graded on angiography by computed tomogra-phy (CT), magnetic resonance (MR) or conventional angiogra-phy, using North American Symptomatic Carotid Endarterec-tomy Trial (NASCET) criteria [23]. If MR, CT, or catheter

2204 IEEE TRANSACTIONS ON BIOMEDICAL ENGINEERING, VOL. 58, NO. 8, AUGUST 2011
TABLE IIDEGREE OF PLAQUE STENOSIS IN DIAMETER REDUCTION AND CALCIFICATION
FOR THE 94 SEQUENCES OF B-MODE IMAGES IN THE DATABASE
USED FOR THIS STUDY
angiography were not available, the degree of carotid stenosiswas determined on Doppler ultrasound examination, using thefollowing criteria [22]: 1) <30% when the ICA peak systolicvelocity (PSV) was less than 125 cm/s and no or minimal (lessthan 30% in B-mode) plaque or intimal thickening was visi-ble; 2) 30%–50% stenosis when ICA PSV was less than 125cm/s and a plaque or an intimal thickening between 30% and50% was visible on B-mode; 3) 50%–70% stenosis when ICAPSV was 125–230 cm/s and a plaque was visible on B-mode;4) >70% stenosis to near occlusion when ICA PSV was greaterthan 230 cm/s and a visible plaque and a lumen narrowing wereseen; 5) 95% for near occlusion when there was a markedly nar-rowed lumen on color Doppler US; and 6) 100% or total occlu-sion when there was no detectable patent lumen on grayscale USand no flow on spectral power, and color Doppler US. Note that a100% stenosis or an occlusion was not included in our database.
III. TRACKING THE POSITION AND SHAPE OF THE PLAQUE
USING MOTION VECTOR FIELDS
A. Motion Field
Given a sequence of T RF images, r(x, y, t) denotes thebrightness of the B-mode envelope of the RF signal in the tthframe at pixel (x, y), where x and y denote the lateral andaxial directions, respectively. Similarly to [24], we adopted thefollowing first-order tissue dynamics:
(x, y) �→ τ + L(x, y) (1)
where
τ =(
τx
τy
); L(x, y) =
(δ11 + 1 δ12
δ21 δ22 + 1
) (xy
).
(2)Concretely, this means that a point of the plaque or its surround-ing tissues with coordinates (x, y) at frame t gets mapped tothe point with coordinates τ + L(x, y) at frame t + 1. In par-ticular, τ + L can be viewed as a motion field of the plaque andits surrounding tissues, where τ denotes a translation and L adeformation.
In Section III-B, we propose the use of optical flow to esti-mate the motion field τ + L. Thus, one is interested in the cor-relation between the gray level of the B-mode image r(x, y, t)at frame t and the registered B-mode image r(x∗, y∗, t + 1),where (x∗, y∗) = (τ + L)(x, y), i.e., the B-mode envelope ofthe Lagrangian speckle image of [25]. The optical flow hy-
pothesis is equivalent to a perfect correlation between the twoimages r(x, y, t) and r(x∗, y∗, t + 1), and the conservation oftheir mean gray level (MGL).
We present in Section VII-B empirical tests for verifying thehypotheses of the correlation between the B-mode images andthe conservation of their MGL from one frame to the next, inthe case of our database. The outcome is that the use of opticalflow is self-consistent on our database.
B. Estimating the Motion Field
As discussed in Section III-A, we assumed only small defor-mations, and this hypothesis was verified on the database as re-ported in Section VII-B. In other words, we assumed the conser-vation of the B-mode gray level over time: r(x, y, t) ≡ constant,t ≥ 1, which yields the well-known identity of the optical flow
∂
∂xr(x, y, t)d x +
∂
∂yr(x, y, t)d y
= − ∂
∂tr(x, y, t)d t. (3)
Taking dt = 1 (corresponding to frames t and t + 1), under thetissue dynamics of (1), we have(
d xd y
)= τ + L(x, y) −
(xy
)= τ +
(δ11 δ12δ21 δ22
) (xy
).
(4)Thus, given a segmentation R of the plaque at the tth frame,each pixel (x, y) within a neighborhood of the segmented regiongives rise to the linear equation
∂
∂xr(x, y, t)(τx + δ11x + δ12y)
+∂
∂yr(x, y, t)(τy + δ21x + δ22y) = − ∂
∂tr(x, y, t) (5)
in the six variables τx , δ11 , δ12 , τy , δ21 , and δ22 . In our appli-cation, the number of points (and hence of equations) is greaterthan 6, and therefore, we obtained an overdetermined systemof linear equations. This system of equations (and hence, themotion field) was then estimated in the sense of the least meansquare (LMS). In our implementation, we took as neighborhood,the region encompassed by the set of points within 2 mm of thesegmented region R. Considering a neighborhood of the plaqueallows us to take into account the motion field at the boundaryof the plaque and slightly beyond, rather than only in its interior.
For the computation of the partial derivatives in (5), wefirst applied a uniform low-pass spatial filter of size 0.75 ×0.25 mm2 (laterally, axially)1 to the B-mode image, resulting inan image r(x, y, t). We then made use of the following second-order approximations:
∂
∂xr(x, y, t)
≈ 18(r(x + 1, y − 1, t − 1) − r(x − 1, y − 1, t − 1)
1That is 5 × 13 pixels2 for the first 74 video sequences and 5 × 7 pixels2 forthe 20 remaining ones.
DESTREMPES et al.: SEGMENTATION OF PLAQUES IN SEQUENCES OF ULTRASONIC B-MODE IMAGES OF CAROTID ARTERIES 2205
+ r(x + 1, y + 1, t − 1) − r(x − 1, y + 1, t − 1)
+ r(x + 1, y − 1, t + 1) − r(x − 1, y − 1, t + 1)
+ r(x + 1, y + 1, t + 1) − r(x − 1, y + 1, t + 1)) (6)
and similarly for ∂∂y r(x, y, t) and ∂
∂ t r(x, y, t). At the boundariesof the video sequences (i.e., t = 1 or t = T ) or at the boundariesof the images, the second-order approximations of (6) wereadjusted accordingly, making use of first-order approximationsif necessary. For instance, if t = 1 and x coincides with the leftboundary of the image, we used the first-order approximation
∂
∂xr(x, y, t)
≈ 14(r(x + 1, y − 1, t) − r(x, y − 1, t)
+ r(x + 1, y + 1, t) − r(x, y + 1, t)
+ r(x + 1, y − 1, t + 1) − r(x, y − 1, t + 1)
+ r(x + 1, y + 1, t + 1) − r(x, y + 1, t + 1)). (7)
C. Propagation of a Segmented Region ThroughSuccessive Motion Fields
Given two frames, t′ < t, let R be a segmented region atframe t′. Then, the motion fields (τ + L)t ′ , . . . , (τ + L)t−1
were learned recursively as follows, in our implementation. Themotion field (τ + L)t ′ was estimated on a neighborhood of thesegmented region R at frame t′, as explained in Section III-B;applying that motion field pointwise [using (1) and (2)] to theboundary of the region R yielded a new region R′ at frame t′ + 1;then, the motion field at the next frame t′ + 1 was learned on aneighborhood of R′, and so on. Combining these motion fieldsfor frames t′ up to t − 1, in that order, yielded the propagationof the region R in frame t′ to a region in frame t.
D. Average of Propagations of SegmentedRegions at Previous Frames
At the first frame, we took the manual segmentation of theplaque as initial segmentation. At an ulterior frame t > 1, onecould take the segmentation of the plaque at the previous framet − 1 and use its propagation at frame t (using the propagationmethod of Section III-C) as a prediction of the segmentationat frame t. For more robustness, we considered the varioussegmentations of the plaque at previous frames, and each ofthese segmentations was propagated at frame t according to themethod of Section III-C. We then considered the average ofthese propagations as a prediction of the segmentation at framet. In our implementation, we considered the immediate previousframes, corresponding to about 1 s of the video sequence.
IV. SEGMENTATION OF THE PLAQUE USING
A PREDICTION OF THE SOLUTION
In this section, we present a refinement of the Bayesian modelintroduced in [19] that takes into account the great variabilityin the shape of a plaque, as well as its displacement [26] anddeformation [1] from one frame to the next. Based on the pre-
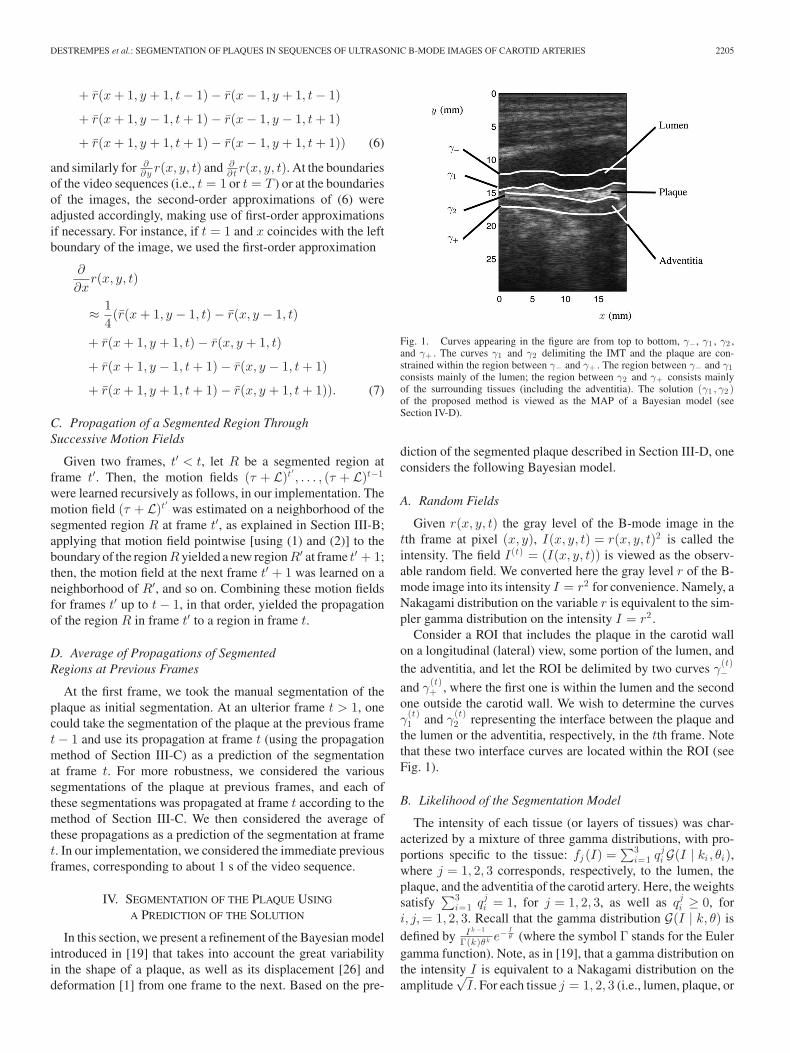
Fig. 1. Curves appearing in the figure are from top to bottom, γ−, γ1 , γ2 ,and γ+ . The curves γ1 and γ2 delimiting the IMT and the plaque are con-strained within the region between γ− and γ+ . The region between γ− and γ1consists mainly of the lumen; the region between γ2 and γ+ consists mainlyof the surrounding tissues (including the adventitia). The solution (γ1 , γ2 )of the proposed method is viewed as the MAP of a Bayesian model (seeSection IV-D).
diction of the segmented plaque described in Section III-D, oneconsiders the following Bayesian model.
A. Random Fields
Given r(x, y, t) the gray level of the B-mode image in thetth frame at pixel (x, y), I(x, y, t) = r(x, y, t)2 is called theintensity. The field I(t) = (I(x, y, t)) is viewed as the observ-able random field. We converted here the gray level r of the B-mode image into its intensity I = r2 for convenience. Namely, aNakagami distribution on the variable r is equivalent to the sim-pler gamma distribution on the intensity I = r2 .
Consider a ROI that includes the plaque in the carotid wallon a longitudinal (lateral) view, some portion of the lumen, andthe adventitia, and let the ROI be delimited by two curves γ
(t)−
and γ(t)+ , where the first one is within the lumen and the second
one outside the carotid wall. We wish to determine the curvesγ
(t)1 and γ
(t)2 representing the interface between the plaque and
the lumen or the adventitia, respectively, in the tth frame. Notethat these two interface curves are located within the ROI (seeFig. 1).
B. Likelihood of the Segmentation Model
The intensity of each tissue (or layers of tissues) was char-acterized by a mixture of three gamma distributions, with pro-portions specific to the tissue: fj (I) =
∑3i=1 qj
i G(I | ki, θi),where j = 1, 2, 3 corresponds, respectively, to the lumen, theplaque, and the adventitia of the carotid artery. Here, the weightssatisfy
∑3i=1 qj
i = 1, for j = 1, 2, 3, as well as qji ≥ 0, for
i, j,= 1, 2, 3. Recall that the gamma distribution G(I | k, θ) isdefined by I k −1
Γ(k)θk e−Iθ (where the symbol Γ stands for the Euler
gamma function). Note, as in [19], that a gamma distribution onthe intensity I is equivalent to a Nakagami distribution on theamplitude
√I . For each tissue j = 1, 2, 3 (i.e., lumen, plaque, or

2206 IEEE TRANSACTIONS ON BIOMEDICAL ENGINEERING, VOL. 58, NO. 8, AUGUST 2011
adventitia), the three coefficients qji , i = 1, 2, 3, were estimated
using a straightforward expectation–maximization (EM) algo-rithm [27]. This latter point is the only difference with [19], asfar as the likelihood is concerned. In fact, due to the hypothesisof a healthy carotid artery, the lumen had been matched with thegamma distribution having the lowest mean intensity, the adven-titia corresponded to the gamma distribution having the highestmean intensity, whereas the IMT corresponded to a mixture ofthe three gamma distributions. Details on the likelihood can befound in [19] and [20].
Now, let the pair of curves (γ(t)1 , γ
(t)2 ) represent the interface
between the lumen and the plaque or the plaque and the ad-ventitia, respectively. Using the identification of each tissue toa mixture of distributions, the likelihood Pt(I(t) | γ
(t)1 , γ
(t)2 ) of
the segmentation model was defined as in [19]∏s∈R1
f(t)1 (I(t)
s ) ×∏
s∈R2
f(t)2 (I(t)
s ) ×∏
s∈R3
f(t)3 (I(t)
s ) (8)
where R1 is the region delimited by the pair of curves (γ(t)− , γ
(t)1 )
(the lumen), R2 is the region delimited by (γ(t)1 , γ
(t)2 ) (the
plaque), and R3 is the region delimited by (γ(t)2 , γ
(t)+ ) (the
adventitia).
C. Prior of the Segmentation Model
In the case of healthy carotids, anatomical information couldbe used to construct a prior for the segmentation model (see[19]), namely, the average IMT, as well as its spatial and tem-poral variances (in the sense of [28]). However, these valuescover only the expected dimensions of healthy carotids. As weare interested in patients presenting pathologies of the carotidwall in this paper, a prior based on a manual segmentation ofthe plaque in the first frame was used instead. Namely, twoconstraints that regularize the segmentation process were con-sidered. These constraints differ from the ones presented in [19].
1) Geometrical Smoothness Constraint: Let γ be a contin-uous piecewise linear curve of the form γ(l) = (x(l), y(l)), forl ∈ [1, L], with vertices (x(1), y(1)), . . . , (x(L), y(L)), wherethe first coordinate indicates the lateral position and the second,the axial position. To take into account the different scalingalong the axial and lateral directions, we considered the ra-tio ρ = 51.9/6.7 (1 pixel in the lateral direction correspondsto ρ ≈ 7.7 pixels in the axial direction), or ρ = 26/6.7 ≈ 3.9(depending on the axial resolution). Accordingly, we consid-ered the curve γρ(l) = (ρx(l), y(l)). Doing so yields the ratiobetween the lateral and axial coordinates in the real scene (inmillimeter), rather than the ratio of the coordinates in the image(in pixels). For simplicity of notation, we drop the subindex ρin what follows, so that γ now stands for γρ .
A geometrical smoothing constraint Δsm ,d(γ) was then de-fined as the line integral
ρ
∫γ
Gd d γ = ρ
∫ L
1Gd(γ(l)) ‖γ(l)‖ d l (9)
where γ(l) denotes the derivative of the curve γ(l), and Gd(γ(l))is a local measure of the abruptness of the curve γ in a neigh-
borhood of the given point γ(l) (see below for additional infor-mation). If γ is rectilinear at the given point, then Gd has a valueof 0, and the more the γ is abrupt at the given point, the higheris the value of Gd . The parameter d controls the size of the localneighborhood.
Now, consider the direction vector of the tangent vector to thecurve γ (i.e., ( x√
x2 + y 2, y√
x2 + y 2), where the “dot” denotes the
derivative). Then, a natural choice of measure of abruptness isthe variance of the coordinates of that direction vector in a neigh-borhood of radius d along the curve and centered at the givenpoint γ(l), i.e., Gd(γ(l)) = Var[ x√
x2 + y 2] + Var[ y√
x2 + y 2]. If d
covers the entire curve, an overall rectilinear shape of the plaque(or the IMT) is expected. Since we consider the presence ofvascular pathologies, we selected a smaller value; namely, dcorresponds to 5 pixels (0.75 mm) in the lateral direction, thusallowing a greater variability in the shape of the plaque, sincethe constraint is more local.
2) Spatiotemporal Cohesion Constraint: Let (γ1,pred ,γ2,pred) be a predicted solution and let (γ1 , γ2) be a pair ofcurves (we drop the index (t) in this paragraph). In this paper,we used the propagations of solutions in previous frames (cf.,Section III-D) as a predicted solution, in order to take into ac-count the lateral and axial displacements of the plaque and itsvariable shape. Preliminary tests on a few video sequences ofplaques convinced us that it was a better strategy than using onlythe solution in the previous frame. A spatiotemporal cohesionconstraint at frame t encourages the curve γi to be near γi,pred .Namely, we defined the constraint Δtm(γi, γi,pred) as
12σ2
t
∫ L
1‖γi(l) − γi,pred(l)‖2(‖γi(l)‖ + ‖γi,pred(l)‖
)/2 d l
(10)where the standard deviation is taken equal to σt = 0.12 mm(i.e., the temporal standard deviation of the IMT as in [28]). Thefunction Δtm(γi, γi,pred) is equal to 0 if and only if γi = γi,pred ,and it is symmetric. We used it as a measure of the discrepancybetween the segmented curve and the predicted solution.
Altogether, combining the two constraints mentioned earlier,we considered the prior Pt(γ
(t)1 , γ
(t)2 | γ
(t)1,pred , γ
(t)2,pred) propor-
tional to
2∏i=1
exp(−βΔsm ,d(γ(t)i ) − Δtm(γ(t)
i , γ(t)i,pred)) (11)
for t > 1, where β > 0 is the weight of the geometrical smooth-ing constraint. The value of β was estimated, based on themanual segmentation of the first frame, in the sense of theMaximum Pseudo-A-Posteriori estimator (that is closely relatedto the Maximum Pseudo-Likelihood estimator of [29], [30]). Seethe Appendix for details. In our tests, the estimated value of βvaried between 0.2 and 10.
D. Posterior Distribution of the Segmentation Model
Combining the likelihood of (8) and the prior of (11),one obtains the following expression for the posterior dis-tribution Pt(γ
(t)1 , γ
(t)2 | I(t) , γ
(t)1,pred , γ
(t)2,pred) of the proposed

DESTREMPES et al.: SEGMENTATION OF PLAQUES IN SEQUENCES OF ULTRASONIC B-MODE IMAGES OF CAROTID ARTERIES 2207
segmentation model up to a normalizing constant:
Pt(I(t) | γ(t)1 , γ
(t)2 )Pt(γ
(t)1 , γ
(t)2 | γ
(t)1,pred , γ
(t)2,pred). (12)
The proposed method consisted in estimating (γ(t)1 , γ
(t)2 ) in the
sense of the MAP, i.e., to find (γ(t)1 , γ
(t)2 ) that maximizes (12).
The MAP solution was computed using the stochastic op-timization algorithm exploration/selection (ES) of [19], withan adaptation to the data structure that takes into account thevariable shapes of plaques.
V. COMPARATIVE MANUAL ASSESSMENT
Let M(R,Rman) be a measure of agreement or, on the con-trary, a measure of discrepancy between two (segmented) re-gions R and Rman . Then, if (R(t)) and (R(t)
man), t = 1, ..., T ,are the sequences of regions corresponding to the semiauto-matic segmentation and the manual segmentation by an ex-pert technician, respectively, for a same video sequence (of Tframes), one can define a measure between the two segmen-tations upon averaging the measure over all frames of that se-quence: M = 1
T
∑Tt=1 M(R(t) , R
(t)man). Note that R
(1)man is the
manual segmentation in the first frame that was used as ini-tialization of the proposed segmentation algorithm. The manualsegmentations in the other frames were used solely for the vali-dation of the method, as described in this section.
In our tests, we considered the following four measures ofagreement based on receiver operating characteristic analy-sis [31], [32] between a semiautomatic segmentation R anda manual segmentation Rman . The four measures are the sensi-tivity (also called true positive rate or recall), the specificity, thekappa index (also called the F-measure), and the overlap whichare respectively defined as follows:
se =|R ∩ Rman ||Rman |
; sp =|R ∩ Rman ||Rman |
; (13)
KI = 2|R ∩ Rman ||R| + |Rman |
; ov =|R ∩ Rman ||R ∪ Rman |
. (14)
These four measures (together with the precision and the ac-curacy) were used in the study [6] (R and Rman correspond to“AS” and “GT”, respectively, in [6, eq. (1)]. Since the precisionand the accuracy are redundant with the other four measures, wedo not report them in this paper. Note that the measure of speci-ficity requires the notion of the complement of the segmentedregion, which in turn depends arbitrarily on the ROI chosen todefine the complement. For instance, if the ROI is enlarged, thenthe false positive rate decreases artificially. For that reason, wetook the smallest rectangle (parallel to the axial and lateral axes)that contained both R and Rman (see Fig. 2 for an illustration).
We also considered four measures of discrepancy. The firstone is the error of area in [12], and is defined as follows:
EArea =|R| − |Rman |
|Rman |. (15)
The sign indicates whether the area is overestimated (+) orunderestimated (−). We also computed the absolute error of
Fig. 2. Two segmented regions and the smallest rectangle parallel to the axialand lateral axes that contains both of them. The dotted line: manual segmentationand the full line: semiautomatic segmentation.
area defined by
AEArea =‖R| − |Rman‖
|Rman |. (16)
The two other measures of discrepancy are based on theaverage point-to-point distance D and the Hausdorff point-to-point distance HD, respectively (cf., [33]), between theboundary of the region R and that of the region Rman . Re-call that the Hausdorff distance between two sets A andB is defined as HD(A,B) = max(h(A,B), h(B,A)), whereh(A,B) = maxa∈Aminb∈B ‖a − b‖ (‖a − b‖ is the Euclideannorm). If d is the Hausdorff distance between two sets A and B,then every point of A must be within a distance d of B and viceversa (cf., [33]).
VI. EXPERIMENTAL RESULTS
The manual segmentations were performed by one experttechnician and reviewed by a vascular sonographer for eachframe of the 94 sequences. In our tests, the expert technicianchose the temporal interval of each sequence where good qualityimages were present and with minimal transient motion artifactsdue to movements of the transducer or of the patient, and per-formed the manual segmentations of the plaque throughout thechosen interval. The expert technician used a software devel-oped in our laboratory to perform the manual segmentations.Once the sequence was loaded, a video of the full sequencecould be viewed. The manual segmentation done in a framecould be copied on the next frame, and then adjusted throughcontrol points of a spline curve, if necessary. In total, 8988frames were manually segmented. Fig. 3 shows four examplesof semiautomatic segmentations of plaques.
Whenever the plaque was located on both the near and the farcarotid artery wall (this fact holds for 36 of the 94 sequences),thus comprising two distinct connected components (see thesecond and fourth examples of Fig. 3), we used the segmentationmethod independently on the two components (each one with

2208 IEEE TRANSACTIONS ON BIOMEDICAL ENGINEERING, VOL. 58, NO. 8, AUGUST 2011
Fig. 3. Examples of semiautomatic (full line) and manual (dotted line) segmentations of plaques appearing at the proximal internal carotid, at the 60th frame ofthe segmented sequence. Two leftmost images: left and right carotids of a patient acquired by a same operator. Two rightmost images: left and right carotids ofanother patient acquired by a same operator.
TABLE IIIQUANTITATIVE EVALUATION OF THE SEGMENTATIONS OBTAINED BY THE
PROPOSED METHOD, USING MANUAL SEGMENTATIONS PERFORMED BY AN
EXPERT TECHNICIAN AS GROUND TRUTH
TABLE IVQUANTITATIVE EVALUATION OF THE SEGMENTATIONS OBTAINED BY THE
PROPOSED METHOD, USING MANUAL SEGMENTATIONS PERFORMED BY AN
EXPERT TECHNICIAN FOR THE ASSESSMENT
its own manual initialization). Henceforth, there were actuallya total of 130 video-sequence segmentations to be performedusing the proposed algorithm. This represented 12206 framesegmentations, but the total number of images was 8988.
The quantitative results of the evaluation method are pre-sented in Tables III and IV. Namely, the measures of agreementor discrepancy of Section V, between the algorithmic and man-ual segmentations, were computed. In these tables, we includedresults from [6] and [10] that are discussed in Section VII-A.
The EM algorithm combined with the segmentation methodtook 129 h and 41 min (this represents 63391 estimations and12206 frame segmentations) for the 130 video sequences. Thus,segmenting one frame took 38 s on average. The implementationwas in C++ and the tests were run on a 3 GHz Pentium 4 CPU.
VII. DISCUSSION
A. Comparison of the Segmentation Method With Other Studies
The results of Table III indicate that the proposed methodcompares favorably with [6], especially for the kappa index andthe overlap measures. Note, however, that no standard deviationof the measures was reported in that study. On the other hand,the results reported in [10] are better than the ones obtainedin [6] and this study. But then, the database size was very small(4 plaques) in [10].
Comparing with our previous study [19], we see in Table IVthat the mean distance (0.24 ± 0.08 mm) between the semiau-tomatic and the manual segmentations is smaller than the meandistance between the segmentations of the intima–media layersof disease-free proximal internal carotid arteries performed bytwo expert technicians (the mean distance was 0.33 ± 0.17 mmfor the lumen–intima interface and it was 0.40 ± 0.29 mm forthe media–adventitia interface). However, the Hausdorff dis-tance was better in [19] (0.73 ± 0.33 mm for the lumen–intimainterface and 0.88 ± 0.67 mm for the media–adventitia inter-face, whereas it is 1.24 ± 0.40 mm in this study). Also, letus mention that in the study [8], reported in Table I, the seg-mentation errors are reported in pixels rather than millimeters.No quantitative comparison can thus be made. On the otherhand, in the study [34], the maximum and mean standard devia-tions for manual segmentations of the carotid surface were 1.64and 0.45 mm, respectively. We interpret those two measures asthe Hausdorff and the mean point-to-point distances betweenvarious manual segmentations and their mean. Based on thatintraobserver variability study, we conclude that the Hausdorffand mean point-to-point distances of 1.24 and 0.24 mm, re-spectively, obtained in this study can be considered as good,especially if one considers our large database.
B. Assessment of the Optical Flow Hypothesis
If our hypotheses on the correlation of the B-mode images andthe conservation of their MGL from one frame to the next aretrue, then the method of Section III-B for estimating the motionfield τ + L (based on the optical flow identity) makes sense,and we should find a good correlation between two successiveframes (taking into account the motion field), and a ratio of theirMGL near 1 in our database.

DESTREMPES et al.: SEGMENTATION OF PLAQUES IN SEQUENCES OF ULTRASONIC B-MODE IMAGES OF CAROTID ARTERIES 2209
For each of the 130 video-sequence segmentations, we esti-mated the motion field as in Section III-B, on a neighborhood ofthe segmented region at each frame t of the video sequence. Wethen computed, for each frame, the correlation coefficient andthe MGL ratio between the images at that frame and the nextframe, as well as the Euclidean norm of the deformation matrixof the estimated motion field between the two frames. We thentook the average values of these three measures over the 130video sequences of the database. The correlation coefficientwas 0.97 ± 0.031, the MGL ratio was 1.0 ± 0.0024, and theEuclidean norm of the deformation matrix was 0.012 ± 0.0068,which means that the deformation L of (1) was near the identityoperator. In our opinion, this indicates that the use of opticalflow was self-consistent in the context of this application.
C. Evaluation of the Overall Movement of the Plaque
The results of Section VII-B indicate that the use of the opti-cal flow method was reasonable to perform the tracking of theplaque over the video sequence. But, was tracking of the plaquenecessary? To answer this question, we considered for each ofthe 130 segmented video sequences, the geometric center of thesegmented plaque (xc,t , yc,t) at frame t = 1, ..., T . The curves(xc,t)T
t=1 and (yc,t)Tt=1 yield the tracking of the geometric cen-
ter of the plaque over the video sequence in the lateral andaxial directions. The measures Dx = max(xc,t) − min(xc,t)and Dy = max(yc,t) − min(yc,t) give the total lateral and ax-ial displacements. We obtained Dx = 1.07 ± 0.49 mm andDy = 0.52 ± 0.30 mm. We conclude that tracking of the plaquewas necessary.
D. Strengths and Limitations of the Method
The average computation time was 38 s per frame. Furtherefficiency can be made on a commercial version, provided one isgiven a few CPUs combined with a GPU implementation. In fact,the EM and the ES algorithms would benefit from paralleliza-tion. So, the clinician might carry on the patient examination,while the segmentation of the whole sequence is performed.Thus, there is a reasonable hope to see a clinically applicableversion in the future. On the other hand, we evaluated that theexpert technician spent about 9.6 s per frame for the manualsegmentations. An average processing time of 20 s per image isreported in [8, p. 1267, end of Section II].
The proposed method is semiautomatic, in the sense that itrequires an initial manual segmentation of the plaque in the firstframe, and then proceeds to the segmentation of the entire se-quence without further user interaction. In particular, the methoddepends on the initial segmentation. We performed segmenta-tions on the entire database following a random perturbation ofthe manual segmentation in the first frame within a distance of0.5 mm. Note that the mean intraobserver variability reportedin [34] is 0.45 mm. Paired t-tests with a confidence level of 0.05showed that there were no significant difference in the eightevaluation measures used (based on the manual segmentationswithout random perturbation). Thus, the method is robust to areasonable variability in the initialization. On the other hand, itis understood that the initial manual segmentation is user de-
pendent, and in fact, corresponds to prior information on theidentification of the carotid artery within the image, the detec-tion, and the localization of a plaque.
In the plaque segmentation methods of [6], [8] and [10],the initialization of the algorithm was performed automatically,based on blood flow, echogenicity of the lumen and the plaque,or the Hough transform, respectively. Moreover, none of thesemethods was presented nor tested in the context of a sequence ofultrasound images. Now, in principle, if a method works well foran individual image, it might work well for a whole sequence ofimages, each one treated individually. However, we are inclinedto think that it is preferable to perform the motion tracking overthe sequence, based on a plaque segmentation in a referenceframe (for instance, the first one). Then, the plaque segmentationin the reference frame might be done automatically with one ofthe methods [6], [8], [10].
We performed one-way analyses of variance on the eightevaluation measures of the segmentation algorithm among thegroups determined by the degree of stenosis or calcification, andthere were no statistically significant differences, except for thekappa index and the overlap. However, a pairwise comparisongave significant differences for the kappa index and the overlaponly between mild and moderate calcification (and not betweenno calcification and severe calcification). Thus, the performanceof the algorithm is not inversely proportional to the severity ofstenosis or calcification. The evaluation measures of the algo-rithm according to the degree of stenosis or calcification arepresented in Table V. Incidentally, Fig. 1 is an example of aplaque with calcification.
In the studies [6], [8] and [10], the US images were B-modescans with further postprocessing, such as speckle reductionfiltering [6] or low-pass filtering [8], [10]. Since the segmenta-tion methods in these studies are mainly based on gradients, apostprocessing step was desirable. In this study, the proposedsegmentation method is based on the statistical distribution ofthe gray level in the echo envelope of the RF signal. Since itis a region-based segmentation method, we believe that it isless likely to be sensitive to the image quality and image noisethan a method based solely on gradients, that is to say with-out postprocessing steps, but we have not tested this aspect.Note that Nakagami distributions, viewed as approximations ofhomodyned K-distributions, are well suited to model the echoenvelope of RF images [35]. On the other hand, if the B-modeimage is postprocessed, one may consider gamma distributions,rather than Nakagami distributions, to model the gray level ofB-mode images2. See [36] for instance. In particular, with thatslight modification in mind, the proposed method may also beapplied to B-mode scans with manufacturer proprietary post-processing.
The proposed method is not meant as a registration methodin the context of large motion as it stands. Such a context wouldrequire further development of the method.
2One should not confuse the gamma distribution on the gray level of theB-mode image with the gamma distribution on the intensity of the B-modeimage (i.e., the square of the gray level). The latter is equivalent to a Nakagamidistribution on the gray level itself, as mentioned in Section IV-B.
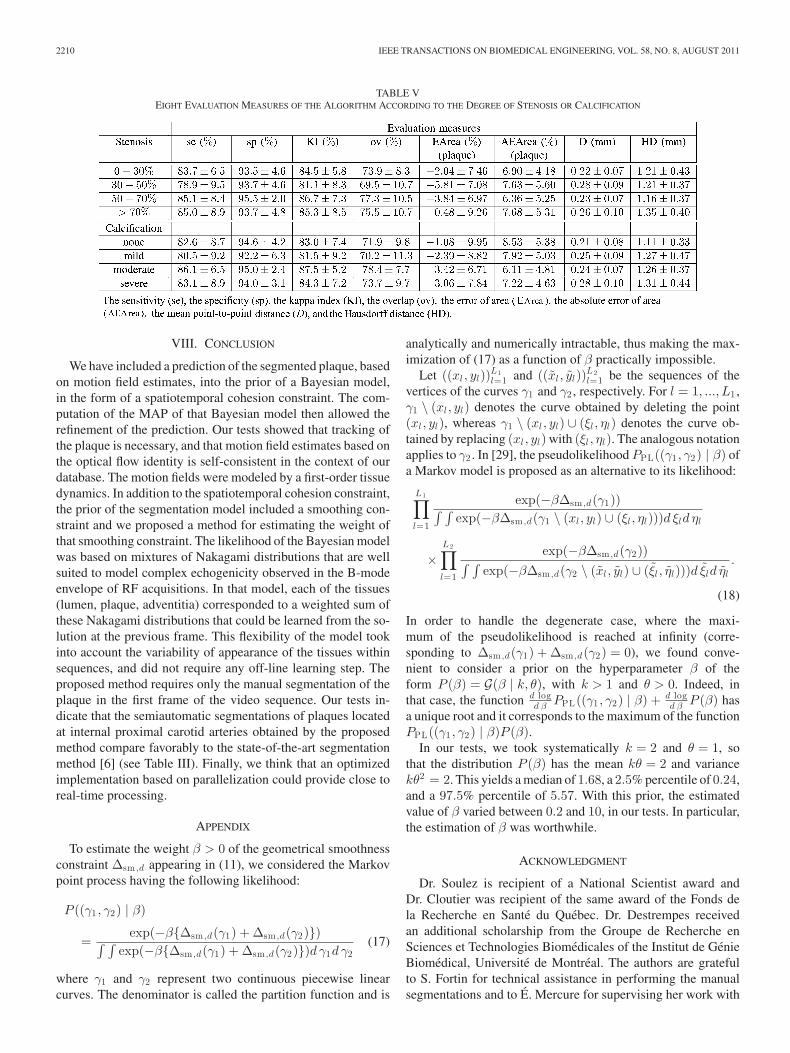
2210 IEEE TRANSACTIONS ON BIOMEDICAL ENGINEERING, VOL. 58, NO. 8, AUGUST 2011
TABLE VEIGHT EVALUATION MEASURES OF THE ALGORITHM ACCORDING TO THE DEGREE OF STENOSIS OR CALCIFICATION
VIII. CONCLUSION
We have included a prediction of the segmented plaque, basedon motion field estimates, into the prior of a Bayesian model,in the form of a spatiotemporal cohesion constraint. The com-putation of the MAP of that Bayesian model then allowed therefinement of the prediction. Our tests showed that tracking ofthe plaque is necessary, and that motion field estimates based onthe optical flow identity is self-consistent in the context of ourdatabase. The motion fields were modeled by a first-order tissuedynamics. In addition to the spatiotemporal cohesion constraint,the prior of the segmentation model included a smoothing con-straint and we proposed a method for estimating the weight ofthat smoothing constraint. The likelihood of the Bayesian modelwas based on mixtures of Nakagami distributions that are wellsuited to model complex echogenicity observed in the B-modeenvelope of RF acquisitions. In that model, each of the tissues(lumen, plaque, adventitia) corresponded to a weighted sum ofthese Nakagami distributions that could be learned from the so-lution at the previous frame. This flexibility of the model tookinto account the variability of appearance of the tissues withinsequences, and did not require any off-line learning step. Theproposed method requires only the manual segmentation of theplaque in the first frame of the video sequence. Our tests in-dicate that the semiautomatic segmentations of plaques locatedat internal proximal carotid arteries obtained by the proposedmethod compare favorably to the state-of-the-art segmentationmethod [6] (see Table III). Finally, we think that an optimizedimplementation based on parallelization could provide close toreal-time processing.
APPENDIX
To estimate the weight β > 0 of the geometrical smoothnessconstraint Δsm ,d appearing in (11), we considered the Markovpoint process having the following likelihood:
P ((γ1 , γ2) | β)
=exp(−β{Δsm ,d(γ1) + Δsm ,d(γ2)})∫ ∫
exp(−β{Δsm ,d(γ1) + Δsm ,d(γ2)})d γ1d γ2(17)
where γ1 and γ2 represent two continuous piecewise linearcurves. The denominator is called the partition function and is
analytically and numerically intractable, thus making the max-imization of (17) as a function of β practically impossible.
Let ((xl, yl))L1l=1 and ((xl , yl))L2
l=1 be the sequences of thevertices of the curves γ1 and γ2 , respectively. For l = 1, ..., L1 ,γ1 \ (xl, yl) denotes the curve obtained by deleting the point(xl, yl), whereas γ1 \ (xl, yl) ∪ (ξl , ηl) denotes the curve ob-tained by replacing (xl, yl) with (ξl , ηl). The analogous notationapplies to γ2 . In [29], the pseudolikelihood PPL((γ1 , γ2) | β) ofa Markov model is proposed as an alternative to its likelihood:
L1∏l=1
exp(−βΔsm ,d(γ1))∫ ∫exp(−βΔsm ,d(γ1 \ (xl, yl) ∪ (ξl , ηl)))d ξld ηl
×L2∏l=1
exp(−βΔsm ,d(γ2))∫ ∫exp(−βΔsm ,d(γ2 \ (xl , yl) ∪ (ξl , ηl)))d ξld ηl
.
(18)
In order to handle the degenerate case, where the maxi-mum of the pseudolikelihood is reached at infinity (corre-sponding to Δsm ,d(γ1) + Δsm ,d(γ2) = 0), we found conve-nient to consider a prior on the hyperparameter β of theform P (β) = G(β | k, θ), with k > 1 and θ > 0. Indeed, inthat case, the function d log
d β PPL((γ1 , γ2) | β) + d logd β P (β) has
a unique root and it corresponds to the maximum of the functionPPL((γ1 , γ2) | β)P (β).
In our tests, we took systematically k = 2 and θ = 1, sothat the distribution P (β) has the mean kθ = 2 and variancekθ2 = 2. This yields a median of 1.68, a 2.5% percentile of 0.24,and a 97.5% percentile of 5.57. With this prior, the estimatedvalue of β varied between 0.2 and 10, in our tests. In particular,the estimation of β was worthwhile.
ACKNOWLEDGMENT
Dr. Soulez is recipient of a National Scientist award andDr. Cloutier was recipient of the same award of the Fonds dela Recherche en Sante du Quebec. Dr. Destrempes receivedan additional scholarship from the Groupe de Recherche enSciences et Technologies Biomedicales of the Institut de GenieBiomedical, Universite de Montreal. The authors are gratefulto S. Fortin for technical assistance in performing the manualsegmentations and to E. Mercure for supervising her work with

DESTREMPES et al.: SEGMENTATION OF PLAQUES IN SEQUENCES OF ULTRASONIC B-MODE IMAGES OF CAROTID ARTERIES 2211
Dr. G. Soulez. The authors thank the anonymous reviewers fortheir comments.
REFERENCES
[1] C. Schmitt, G. Soulez, R. L. Maurice, M.-F. Giroux, and G. Cloutier,“Noninvasive vascular elastography: Toward a complementary character-ization tool of atherosclerosis in carotid arteries,” Ultrasound Med. Biol.,vol. 33, no. 12, pp. 1841–1858, 2007.
[2] H. Ribbers, R. G. P. Lopata, S. Holewijn, G. Pasterkamp, J. D.BlankenSteijn, and C. L. de Korte, “Noninvasive two-dimensional strainimaging of arteries: Validation in phantoms and preliminary experience incarotid arteries in vivo,” Ultrasound Med. Biol., vol. 33, no. 4, pp. 530–540, 2007.
[3] H. Shi, C. C. Mitchell, M. McCormick, M. A. Kliewer, R. J. Dempsey,and T. Varghese, “Preliminary in vivo atherosclerotic carotid plaque char-acterization using the accumulated axial strain and relative lateral shiftstrain indices,” Phys. Med. Biol., vol. 53, pp. 6377–6394, 2008.
[4] T. Yamagishi, M. Kato, Y. Koiwa, K. Omata, H. Hasegawa, and H. Kanai,“Evaluation of plaque stabilization by fluvastatin with carotid intima-medial elasticity measured by a transcutaneous ultrasonic-based tissuecharacterization system,” J. Atherosclerosis Thrombosis, vol. 16, no. 5,pp. 662–673, 2009.
[5] C. P. Loizou, C. S. Pattichis, R. S. H. Istepanian, M. Pantziaris, andA. Nicolaides, “Atherosclerotic carotid plaque segmentation,” in Proc.29th Ann. Int. Conf. IEEE Engineering in Medicine and Biology Society(EMBS), San Francisco, CA, Sep. 1–5, 2004, pp. 1403–1406.
[6] C. P. Loizou, C. S. Pattichis, M. Pantziaris, and A. Nicolaides, “An in-tegrated system for the segmentation of atherosclerosis carotid plaque,”IEEE Trans. Inform. Technol. Biomed., vol. 11, no. 6, pp. 661–667, Nov.2007.
[7] S. Delsanto, F. Molinari, W. Liboni, P. Giustetto, S. Badalamenti, andJ. S. Suri, “User-independent plaque characterization and accurate IMTmeasurement of carotid artery wall using ultrasound,” in Proc. 28th Ann.Int. Conf. IEEE Engineering in Medicine and Biology Society (EMBS),New York City, NY, Aug. 30–Sep. 3, 2006, pp. 2404–2407.
[8] S. Delsanto, F. Molinari, P. Giustetto, W. Liboni, S. Badalamenti, andJ. S. Suri, “Characterization of a completely user-independent algorithmfor carotid artery segmentation in 2-D ultrasound images,” IEEE Trans.Instr. Meas., vol. 56, no. 4, pp. 1265–1274, Aug. 2007.
[9] F. Molinari, W. Liboni, E. Pavanelli, P. Giustetto, S. Badalamenti, andJ. S. Suri, “Accurate and automatic carotid plaque characterization in con-trast enhanced 2-D ultrasound images,” in Proc. 29th Ann. Int. Conf. IEEEEngineering in Medicine and Biology Society (EMBS), Cite Internationale,Lyon, France, Aug. 23–26, 2007, pp. 335–338.
[10] S. Golemati, J. Stoitsis, E. G. Sifakis, T. Balkisas, and K. S. Nikita, “Usingthe Hough transform to segment ultrasound images of longitudinal andtransverse sections of the carotid artery,” Ultrasound Med. Biol., vol. 33,no. 12, pp. 1918–1932, 2007.
[11] P. Abolmaesumi, M. R. Sirouspour, and S. E. Salcudean, “Real-time ex-traction of carotid artery contours from ultrasound images,” in Proc. 13thIEEE Symp. Computer-Based Medical Systems (CBMS), Houston, TX,Jun. 2000, pp. 181–186.
[12] J. Guerrero, S. E. Salcudean, J. A. McEwen, B. A. Masri, and S. Nico-laou, “Real-time vessel segmentation and tracking for ultrasound imagingapplications,” IEEE Trans. Med. Imaging, vol. 26, no. 8, pp. 1079–1090,Aug. 2007.
[13] J. D. Gill, H. M. Ladak, D. A. Steinman, and A. Fenster, “Segmentation ofulcerated plaque: A semi-automatic method for tracking the progressionof carotid atherosclerosis,” in Proc. World Congr. Med. Phys. Biomed.Eng., Chicago, IL, 2000, pp. 1–4.
[14] F. Mao, J. Gill, D. Downey, and A. Fenster, “Segmentation of carotid arteryin ultrasound images: Method development and evaluation technique,”Med. Phys., vol. 27, no. 8, pp. 1–10, 2000.
[15] G. Slabaugh, G. Unal, M. Wels, T. Fang, and B. Rao, “Statistical region-based segmentation of ultrasound images,” Ultrasound Med. Biol., vol. 35,no. 5, pp. 781–795, 2009.
[16] J. A. Noble and D. Boukerroui, “Ultrasound image segmentation: A sur-vey,” IEEE Trans. Med. Imaging, vol. 25, no. 8, pp. 987–1010, Aug.2006.
[17] J. A. Noble, “Ultrasound image segmentation and tissue characterization,”Proc. Institution Mech. Eng., Part H: J. Eng. Med., vol. 224, no. 2, pp. 307–316, 2010.
[18] E. Kyriacou, C. Pattichis, M. Pattichis, C. Loizou, C. Christodoulou,S. Kakkos, and A. Nicolaides, “A review of noninvasive ultrasound imageprocessing methods in the analysis of carotid plaque morphology for theassessment of stroke risk,” IEEE Trans. Inform. Technol. Biomed., vol. 14,no. 4, pp. 1027–1038, 2010.
[19] F. Destrempes, J. Meunier, M.-F. Giroux, G. Soulez, and G. Cloutier,“Segmentation in ultrasonic B-mode images of healthy carotid arteriesusing mixtures of Nakagami distributions and stochastic optimization,”IEEE Trans. Med. Imaging, vol. 28, no. 2, pp. 215–229, Feb. 2009.
[20] F. Destrempes, G. Soulez, M.-F. Giroux, J. Meunier, and G. Cloutier,“Segmentation of plaques in sequences of ultrasonic B-mode images ofcarotid arteries based on motion estimation and Nakagami distributions,”in Proc. IEEE Int. Ultrasonics Symp., Rome, Italy, Sep. 2009, pp. 2480–2483.
[21] I. Mikic, S. Krucinski, and J. D. Thomas, “Segmentation and trackingin echocardiographic sequences: Active contours guided by optical flowestimates,” IEEE Trans. Med. Imaging, vol. 17, no. 2, pp. 274–284, Apr.1998.
[22] E. G. Grant, C. B. Benson, G. L. Moneta, A. V. Alexandrov, J. D. Baker,E. I. Bluth, B. A. Carroll, M. Eliasziw, G. Gocke, B. S. Hertzberg,S. Katanick, L. Needleman, J. Pellerito, J. F. Polak, K. S. Rholl, D. L.Wooster, and E. Zierler, “Carotid artery stenosis: Grayscale and DopplerUS diagnosis: Society of Radiologists in Ultrasound Consensus Confer-ence,” Radiology, vol. 229, no. 2, pp. 340–346, 2003.
[23] NASCET Collaborators, “Beneficial effect of carotid endarterectomy insymptomatic patients with high-grade carotid stenosis,” N. Engl. J. Med.,vol. 325, pp. 445–453, 1991.
[24] J. Meunier and M. Bertrand, “Ultrasonic texture motion analysis: Theoryand simulation,” IEEE Trans. Med. Imaging, vol. 14, no. 2, pp. 293–300,Jun. 1995.
[25] R. L. Maurice, J. Ohayon, Y. Fretigny, M. Bertrand, G. Soulez, andG. Cloutier, “Non-invasive vascular elastography: Theoretical frame-work,” IEEE Trans. Med. Imaging, vol. 23, no. 2, pp. 164–180, Feb.2004.
[26] M. Cinthio and R. Ahlgren, “Intra-observer variability of longitudinaldisplacement and intramural shear strain measurements of the arterialwall using ultrasound noninvasively in vivo,” Ultrasound Med. Biol.,vol. 36, no. 5, pp. 697–704, 2010.
[27] A. Dempster, N. Laird, and D. Rubin, “Maximum likelihood from incom-plete data via the EM algorithm,” J. Roy. Stat. Soc. (Ser. B), vol. 39,pp. 1–38, 1977.
[28] J. M. Meinders, L. Kornet, and A. P. G. Hoeks, “Assessment of spatialinhomogeneities in intima media thickness along an arterial segment us-ing its dynamic behavior,” Am. J. Physiol.: Heart Circulatory Physiol.,vol. 285, pp. H384–H391, 2003.
[29] J. Besag, “Statistical analysis of non-lattice data,” Statistician, vol. 24,no. 3, pp. 179–195, 1975.
[30] F. Comets, “On consistency of a class of estimators for exponential familiesof Markov random fields on the lattice,” Ann. Stat., vol. 20, no. 1, pp. 455–468, 1992.
[31] C. Metz, “Basic principles of ROC analysis,” Semin. Nucl. Med., vol. 8,pp. 283–298, 1978.
[32] T. Fawcett, “An introduction to ROC analysis,” Pattern Recognit. Lett.,vol. 27, pp. 861–874, 2006.
[33] D. P. Huttenlocher, G. A. Klanderman, and W. J. Rucklidge, “Comparingimages using the Hausdorff distance,” IEEE Trans. Pattern Anal. Mach.Intell., vol. 15, pp. 850–863, Sep. 1993.
[34] J. D. Gill, H. M. Ladak, D. A. Steinman, and A. Fenster, “Accuracy andvariability assessment of a semiautomatic technique for segmentation ofthe carotid arteries from three-dimensional ultrasound images,” Med.Phys., vol. 27, no. 6, pp. 1333–1342, 2000.
[35] F. Destrempes and G. Cloutier, “A critical review and uniformized rep-resentation of statistical distributions modeling the ultrasound echo enve-lope,” Ultrasound Med. Biol., vol. 36, no. 7, pp. 1037–1051, 2010.
[36] Z. Tao, H. D. Tagare, and J. D. Beaty, “Evaluation of four probabilitydistribution models for speckle in clinical cardiac ultrasound images,”IEEE Trans. Med. Imaging, vol. 25, no. 11, pp. 1483–1491, Nov. 2006.
Authors’ photographs and biographies not available at the time of publication.