
Security Analytics 8.1.x Administration and Central Manager ...
420
Security Analytics 8.1.3 Administration and Central Manager Guide Updated: Wednesday, August 12, 2020
-
Upload
khangminh22 -
Category
Documents
-
view
0 -
download
0
Transcript of Security Analytics 8.1.x Administration and Central Manager ...

Security Analytics 8.1.3 Administration and Central Manager Guide
Updated: Wednesday, August 12, 2020

Administration and CentralManager Guide SecurityAnalytics 8.1.3
Copyrights, Trademarks, and Intellectual Property
Broadcom, the pulse logo, Connecting everything, and Symantec are among the trademarks of Broadcom. The term “Broadcom” refers to Broadcom Inc. and/or its subsidiaries. Copyright © 2020 Broadcom. All Rights Reserved. For more information, please visit www.broadcom.com.
Broadcom reserves the right to make changes without further notice to any products or data herein to improve reliability, function, or design. Information furnished by Broadcom is believed to be accurate and reliable. However, Broadcom does not assume any liability arising out of the application or use of this information, nor the application or use of any product or circuit described herein, neither does it convey any license under its patent rights nor the rights of others.
3

Administration and CentralManager Guide SecurityAnalytics 8.1.3
Table of Contents
New in Security Analytics 8.1.x 13AWS Virtual Private Cloud (VPC) Traffic Mirroring 13VXLAN Support 13Deprecation Notices 13More New Features 13
Setting Up Security Analytics 8.1.x 14
Initial Configuration 16Network Settings 16Install the License 18
Appliance Ports 202G Appliances 20SA-S500-20-FA 20SA-2G-10T-G6 21
10G Appliances 21SA-S500-30-FA 21SA-S500-35-FA 22SA-S500-40-FA 22SA-10G-HD-8T-FC-G6 22SA-10G-26T-G6 23
Central Managers 23SA-S500-10-CM 23SA-CM-4T-G6 23
Storage Modules and Arrays 24SA-E5660-ISA-300T 24SA-J5300-DAS-40T 24SA-SM-48T-G6 25SA-SM-240T-FC-G6 26
Alerts Management Dashboard 28Populating the Dashboard 29
Capture 30Initiate or Stop Capture 30Capture Summary Graph 31Total Traffic per Interface and Uptime 32View Menu 32Clear the Capture Summary Graph Data 33Actions Menu 33
4

Administration and CentralManager Guide SecurityAnalytics 8.1.3
Static Filters 33Apply a Capture Filter to an Interface 34Apply a Capture Filter to a PCAP Download 34
Intelligent Capture 34Intelligent Capture vs. Dynamic Filters 34Intelligent Capture Operation 35
Dynamic Filters 36Dynamic Filter Operation 36Guidelines for Creating Dynamic Filters 37Expected Behavior with Dynamic Filters 37
Capture-Interface Aggregation 38PCAP Files 39Download PCAPs of Captured Data 39Import PCAP Files 41PCAP File Analysis 42Automatically Import PCAP Files 44Automatically Export PCAP Files 45Configure a Mount Point 45
Playback 46Create a Playback Session 47Many-to-Many Sessions 48Playback of Imported PCAPs 49
Data Availability 49Data Enrichment Profiles 49Viewing Data Availability 50Calendar Display 51Capture Summary Graph 52
Reindexing 52Reprocessing 53
Data Analysis 56Metadata Settings 56Metadata Tables 58
Integrated Cyber Defense Exchange (ICDx) 82ICDx Metadata Forwarding 83ICDx Remote Notifications 85
Open Parser 86Open Parser Conventions 87Create an Open-Parser Rule 88View the Report Data 90Add the Open Parser Report Widget to a Summary View 91Open Parser Alerts 91PII Reports Example 92Open Parser Data Matching 95
Summary Views 96
5

Administration and CentralManager Guide SecurityAnalytics 8.1.3
Report Widgets 96Create a Summary View 97Report Widget Controls 98Apply Filters to Summary Views 100Save the Output of a Summary View 100Session Resolution 100
Anomaly Detection 101Enabling Anomaly Detection 101Anomalies Pages 102Filtering Anomaly Alerts 103Anomaly Investigation View 103Anomaly Detectors 104Tuning ADM Settings 106
Filters 107Primary Filters 107Dynamic Filters 109Data Enrichment Filters 109Timespan Filters 112Advanced Filters 113Create Filters from Graphical Screen Elements 114Capture Filters 115Advanced-Filter Attributes 115Wildcards and Logical Operators 121Universal Connector 128
Indicators 129Preloaded Indicators 129Indicator Specifications 130Using Indicators 130Create a New Indicator 131Create an Indicator from the Filter Bar 132Import Indicators from a List, or Create a Live-Feed Indicator 132Export Indicators 133Edit Indicators 134Delete Indicators 135Format a List of Indicators 136JSON Formatting for Indicators 137
Reports 137Reports Page 138Report Results List 138Compare Report Results 139Save Report Results 139Export Reports 140Risk and Visibility Report 140Report Status Pages 141Scheduled Reports 143Summary Views 144Populating the Reports 149
6

Administration and CentralManager Guide SecurityAnalytics 8.1.3
Extractions 152Artifacts 152Extraction Status Page 154Save Extractions and Artifacts 158Save Multiple Extraction Items 158Cancel an Extraction 159Artifact Preview 159Root Cause Explorer 159Artifacts Timeline 159Email Extractions 159IM Conversations 160Media Panel 161Tune the Extraction Process 161
Artifact Preview 161Artifact Views 162
Sessions 172Sessions Page 173Session Results Table 174Save Session Results 175
Geolocation 176Map Navigation 176Results List 177Saving Geolocation Results 178Geolocation Settings 178Geolocation Filters 179MaxMind City and Country Databases 180Google Earth 181
Encapsulation Detection 181PPPoE 181IPv6 in IPv4 182GRE Encapsulation 183
Packet Analyzer 184Packet Analyzer Filters 184Packet List 184Packet Details 186Packet Bytes Pane 186
Data Enrichment 188Reputation Queries 188Activate a Data-Enrichment Resource 189Exclude from Lookup 189Data Enrichment Filters 190Enrichment Providers 190URL and IP Enrichment 190File and File-Hash Enrichment 191
7

Administration and CentralManager Guide SecurityAnalytics 8.1.3
Other Enrichment 191Data Enrichment Resources in Dark Sites 191Symantec Intelligence Services 193Symantec On-Demand Providers 197Symantec Analysis Providers 202Reputation Providers 210Third-Party Integration Providers 214Endpoint Providers 217Custom Hash List 218YARA Rules 220Login Correlation 222File Names Sent to Providers 228
Rules 230Rules Activated by Default 230Prepare to Create a Rule 231Create a New Rule 231
Alerts 236Alert Creation Workflow 236Alert Management 237Data Enrichment Alerts 239
Remote Notifications 245Configure the Server 245Choose or Create a Template 245Select the Notification When Creating or Editing a Rule 247
Data Enrichment Filters 247
Appliance Security 255User Accounts and Groups 255Local Users 256Shell-Only Users 257Account Profile Settings 258User Groups 259Remote-Authentication Users 265
Account Settings 265Remote Authentication 267LDAP Authentication 267CAC Authentication 272Troubleshooting LDAP 272Kerberos Authentication 273RADIUS Authentication 274Two-Factor Authentication 275
Common Access Card Authentication 276Configure Security Analytics to Authenticate with a CAC 277
Using RADIUS and LDAP in Parallel on Security Analytics 278Behavior in SA 8.1.1 278Behavior in SA 8.0-8.3 278
8

Administration and CentralManager Guide SecurityAnalytics 8.1.3
Functionality and Process 279
LDAP Group Inheritance 279Remote Access 284Firewall 284Web Access 286SSH Access 288Ping (ICMP) 288Web Interface Settings 289
Passwords 290Password-Complexity Rules 290Set Notification Interval for Password Expiry 291
SSL Certificates and Keys 291Install a New Certificate and Key 292Additional Certificate Requirements 295Certificates Between CMCs and Sensors 297
Security Analytics Ports and Protocols 298Inbound Connections to Security Analytics 298Outbound Connections from Security Analytics 299
Disable SSH Root Logins 301SSH Authentication 302Generate an SSH Key for Data Enrichment Providers 302
MD5-Encrypted Password for Bootloader 303Federal Information Processing Standards 304Entering FIPS Mode 304Exiting FIPS Mode 305
System Maintenance 306Logging and Communication 306Logging 306Email Alerts 308SNMP Settings 309Syslog Settings 311Splunk Phantom 312Communication Settings 312MIB Files 313Resetting System Logs 314
Job Queue and System Alerts 314Job Queue 314System Alerts 314File-System Notifications 315System-Critical Notifications 315
Software Upgrades 315Add an Upgrade Server 316Upgrade Security Analytics 317
9

Administration and CentralManager Guide SecurityAnalytics 8.1.3
Upgrading from a TAR File 317Licensing 318Network Settings 319System Date and Time 320Statistics 321Network System 321Size on Disk 322Storage System 323Total Captured 324Total Filtered 324
Drive-Space Management 324Capture and Index Drives 324System Drive 324Home Drive 326Time-Based Data Deletion 326
Reboot or Shut Down 328From the Web Interface 328From the CLI 328Using the IPMI Interface 329
Troubleshooting 329Search the Knowledge Base 329Contact Support 329Submit a Support Case 330Consult Help Topics 330
Introduction to the Central Manager Console 331CMC Initial Settings 332Connect Your First Sensor to the CMC 333Generate the Authorization Key for the Sensor 333Link the Sensor to the CMC 334Grant Yourself Access to the Sensor 335Disconnect Sensors from a CMC 336Manage One Sensor with Multiple CMCs 337
User Accounts and Groups on the CMC 338Sensor Access 338
Remote Groups: Example Setup 339Network Setup 339Requirements 340Design 340Create the Remote Groups 341Create the Users 342Assign Sensor Authorizations 344Results 344
Multi-Sensor Environment 347View Multiple Sensors 347
10

Administration and CentralManager Guide SecurityAnalytics 8.1.3
Data Aggregation 352Multi-Sensor Metadata 353Multi-Sensor ICDx Metadata 354Multi-Sensor Summary Views 354Multi-Sensor Reports 354Multi-Sensor Extractions 355Multi-Sensor Indicators 356Multi-Sensor Rules 357Multi-Sensor Alerts 357Multi-Sensor PCAP Files 358PCAP Import 358Multi-Sensor Geolocation and Google Earth 358Multi-Sensor Communication Settings 358
Upgrading Sensors 359CMC Upgrade Repository 359Add an Upgrade Image to the CMC Repository 360Upgrade Sensors from the CMC Repository 360
CMC Local Management 362CMC Dashboard 362Your Sensors list 363Other Sensors List 364Control Buttons 364Upgrading the CMC 365
Appendix 366How Security Analytics Works 367Implementation 367Drive Configuration 367Packet Capture 368Writing the Slots 370Data Overwriting 370Overwriting Imported PCAPs 372
Flows in Security Analytics 373TCP Finite State Machine 374UDP State Machine 375Flows in Security Analytics 376Flow-Based Reports 377
Populating the Reports 379Where's my data? 380Metadata Settings 380Natively Indexed Metadata 380Conversation Reports 381Data Enrichment Verdicts 381Hash Reports 382Open-Parser Rules 383
Detecting File Types 383
11

Administration and CentralManager Guide SecurityAnalytics 8.1.3
Primary Filters for File Types 383Advanced Extraction Filters 383Why Can't I Detect All JavaScript Files? 384
Artifact Extraction 385Protocol Carvers 385Signature-Based Extraction 385
Data Enrichment Process 389Default Data-Enrichment Process 389Example: Create a Data Enrichment Rule to Evaluate PDFs 390
FRS Prefilter Process 392FRS Prefilter Process 392When to Disable the FRS Prefilter 397
Anomaly Detection Process 398Initial Evaluation 398Statistical Analysis 399ADM Detectors 399Interpreting Anomaly Messages 400
All Settings 404Interface Icons 407Menu > Analyze > Summary 410Menu > Analyze > Summary > Reports 411Menu > Analyze > Summary > Extractions 412Menu > Analyze > Summary > Sessions 414Menu > Analyze > Summary > Geolocation 415Menu > Capture > Summary 416
Resources 419
12

Administration and CentralManager Guide SecurityAnalytics 8.1.3
New in Security Analytics 8.1.xThe additions to Security Analytics in version 8.1.x are as follows:
AWS Virtual Private Cloud (VPC) Traffic MirroringAs of this release, we recommend using VPC Traffic Mirroring over the previous solution, CloudLens. For more information, see the Security Analytics AWS Deployment Guide, or https://docs.aws.amazon.com/vpc/latest/mirroring/vpc-tm.pdf.
VXLAN Support In an effort to provide additional paths to transmit monitoring data, we have introduced VXLAN support in this release.
Note: For more information on configuring AWS VPC Traffic Mirroring and VXLAN support, please refer to the Security Analytics AWS Installation Guide, available on https://techdocs.broadcom.com.
Deprecation Notices n Symantec DeepSight
Following Security Analytics 8.1.2, support for DeepSight will no longer be available.
n UI and Documentation LocalizationFollowing Security Analytics 8.1.2, documentation and User Interface content will be provided in English only.
n Artifact Timeline. Security Analytics 8.1.2 is the last version to include the Artifact Timeline Feature.
More New Features n YARA upgraded to version 3.8.1
13

Administration and CentralManager Guide SecurityAnalytics 8.1.3
Setting Up Security Analytics 8.1.xIf you are installing Security Analytics 8.1.x for the first time you must follow these instructions, because the method for setting the management IP address is different from version 7.x.
To permit multiple management interfaces, Security Analytics 8.0.1 and later uses bond0 as the management interface, replacing eth0 in versions previous to 8.0.1.
By default physical eth0 is always bound to logical bond0. Adding another physical interface to bond0 removes that interface from the pool of capture interfaces. (To see the port enumeration for your hardware consult Appliance Ports, below. )
To specify the IP address for bond0 from the command line follow these steps:
1. Access the CLI from a direct connection or use SSH to go to 192.168.20.20.
2. Log in with the default admin credentials: admin | Solera
3. Run this command:
sudo cfg_bond_interface.py -i eth0 -n <IP>/<netmask> -g <gateway>
Specify the netmask in dotted-decimal format: 255.255.255.0.
4. Provide the sudo password: Solera
5. In a web browser navigate to the address you just specified.
6. Log in with default admin credentials: admin | Solera
7. Accept the EULA.
8. Complete the Initial Configuration page and license the product.
9. If you want to add another management interface after the appliance reboots:
14

Administration and CentralManager Guide SecurityAnalytics 8.1.3
n Go to Menu > Settings > Network.
n Select Use Multiple Management Interfaces.
n Select the other interface and click Save.
The Secondary Network Address is a failover address for bond0. It is not the IP address for the second management interface.
15

Administration and CentralManager Guide SecurityAnalytics 8.1.3
Initial ConfigurationHave you set the management IP address on your appliance?
Yes — Continue. No — Go to "Setting Up Security Analytics 8.1.x" on page 14.
This page contains instructions for configuring the Symantec Security Analytics appliance on the Initial Configuration page. To see how to configure other settings, see "All Settings" on page 404.
Network Settings 1. After you have logged in to the web interface (admin | Solera), accept the EULA and then the Initial
Configuration page is displayed. If you cannot see the Initial Configuration page, append /settings/initial_config to the appliance's IP address in the address line of your browser.
n Specify a Fully Qualified Hostname (system name) for the Security Analytics appliance.
o If the hostname is not an FQDN, you may get unexpected results.
o The name typed here is displayed as part of the prompt when anyone logs in to the command line for this appliance.
o The hostname is the first element of an artifact filename.
o You must register this hostname with your DNS servers if you intend to refer to this appliance by its hostname in other contexts.
o Later, if you want to refer to this appliance using multiple hostnames, go to Settings > Web Interface and input the additional hostnames under Allowed Hostnames.
2. Set the IP address, mask, and default gateway for the management interface (bond0) using one of the following methods:
n Select the Use DHCP check box to automatically retrieve network settings for bond0. (DHCP is not available for multiple management interfaces.) If you choose to enable DHCP, Symantec recommends that you use the DHCP reservation feature of your DHCP server to statically map the MAC address of the management interface to an IP address.
n As desired, edit the static network settings manually.
If you specify an IPv6 address, the network service restarts after you click Save, and you may lose connectivity temporarily.
3. Optional — For IPv6 secondary addresses, separate the addresses with a space.
16

Administration and CentralManager Guide SecurityAnalytics 8.1.3
4. Optional — If your appliance accesses the Internet through a proxy, type the IP address of the HTTP Proxy in the following format: <hostname>:<port>
5. Optional — Specify comma-delimited exceptions to the proxy in the No Proxy field: .mycompany.com,10.18.5.5, 2508:34ed:af:2d1::3d33
n The value hostname is always present in the No Proxy field, even though it is not visible.
n If your appliance accesses the Internet through an authenticated proxy, edit /etc/environment as follows:
http_proxy="http://<username>:<password>@<IPv4>:<port>"https_proxy="http://<username>:<password>@<IPv4>:<port>"
or
http_proxy="https://<username>:<password>@[<IPv6>]:<port>" https_proxy="https://<username>:<password>@[<IPv6>]:<port>"
Also see how to "Authenticate to an Internet Proxy" on page 296, which you can do after you license Security Analytics.
6. Specify up to three DNS servers. If you will be using hostnames for other settings on this appliance, you must specify the primary DNS.
7. Set the correct date and time for the appliance (MM/DD/YYYY hh:ii:ss). You can enable NTP later.
8. Select the appropriate Time Zone for this appliance's physical location.
Because time is an essential parameter for both PCAP generation and playback, you must set the correct time and time zone on the appliance before you begin to capture data.
9. Select the Interface Language.
Changing the browser language setting while filters or processes are active is not supported.
10. Change the root password for the appliance and specify its lifespan. To change the root password after initial configuration use passwd on the CLI.
17

Administration and CentralManager Guide SecurityAnalytics 8.1.3
n There is no password-backup option. If you lose the root password you may need to send the appliance back to Symantec Support for reset.
n Follow best key-maintenance practices by manually recording the root and admin passwords and by keeping a copy in a secure location that is separate from the appliance.
11. Select Lock Root Account to disable all root access to the appliance.
WARNING! You cannot re-enable the root account unless you have console access to the appliance, and then you will have to contact Symantec Support for assistance.
12. Change the password for the admin account and specify its lifespan. To change the admin password after
initial configuration, select [current account] > Account Settings.
13. For Password, change any of the requirements, as desired.
Alterations to the password requirements apply to the root and admin passwords that you set on this page as well as to all new user accounts. You can change the requirements after initial configuration on Settings > Security. See "Passwords" on page 290.
14. Click Save.
If there are any errors on the page, you will be prompted to fix the errors. Before you click Save again, you must input the passwords again for both the root and admin accounts.
Install the License 15. The License Details dialog is displayed.
16. Retrieve your license key from Symantec Support (support.broadcom.com/security) as instructed in the eFulfillment message from Symantec.
17. Does your appliance have access to the internet (license.soleranetworks.com; port 443)?
18

Administration and CentralManager Guide SecurityAnalytics 8.1.3
Yes — Under Retrieve License, input the License Key and click Send Request.
n If applicable, select the desired license type.
n The appliance sends the license key and the license seed file to the Symantec license server, which generates the appropriate license file (license.tgz) and returns it to the appliance, which then automatically reboots.
No — Click Download DS Seed to download the seed file (dsseed.tgz) to your workstation.
n On a workstation that has Internet access, go to license.soleranetworks.com.
n Type your license key, upload dsseed.tgz, and click Submit.
n If applicable, select the desired license type and click Submit.
n Save the license file (license.tgz) to your workstation.
n Return to the License Details dialog.
n Click Browse and select license.tgz.
n The license is uploaded and the appliance automatically reboots.
18. Once the system has rebooted, select About > License Details to verify that the items are correct.
19. Click Download to create an archive copy of the license file (solera-license.dat). Store this file in a safe location that is not on the appliance.
20. Consult "All Settings" on page 404 to further configure your system. If you are setting up a Central Manager Console, continue to "CMC Initial Settings" on page 332.
19

Administration and CentralManager Guide SecurityAnalytics 8.1.3
Appliance PortsConsult the following diagrams to see how ports are designated on a Symantec Security Analytics appliance.
For instructions on cabling and configuration for head unit plus storage module combinations, see the Security Analytics Installation Guides on Symantec Support Center under Installation Guide. Be sure that you use the instructions for the correct hardware vendor and generation.
Go to Security Analytics documentation on the Symantec Support Center and select Compatibility Lists under Onboarding to see the bill of materials for each Dell or NetApp model.
The location of the management port (physical: eth0; logical: bond0) on the Dell Hardware is valid only after Security Analytics has been installed on the hardware.
2G Appliances
SA-S500-20-FA
20

Administration and CentralManager Guide SecurityAnalytics 8.1.3
SA-2G-10T-G6Dell PowerEdge R630 Rack Server
10G Appliances
SA-S500-30-FA
21

Administration and CentralManager Guide SecurityAnalytics 8.1.3
SA-S500-35-FA
SA-S500-40-FA
SA-10G-HD-8T-FC-G6Dell PowerEdge R630 Rack Server
22

Administration and CentralManager Guide SecurityAnalytics 8.1.3
SA-10G-26T-G6Dell PowerEdge R730xd Rack Server
Central Managers
SA-S500-10-CM
SA-CM-4T-G6Dell PowerEdge R630 Rack Server
23

Administration and CentralManager Guide SecurityAnalytics 8.1.3
Storage Modules and Arrays
SA-E5660-ISA-300T Security Analytics E5660 300T Intelligent Storage Array
SA-J5300-DAS-40TBlue Coat Security Analytics J5300 40T Direct-Attached Storage
24
Administration and CentralManager Guide SecurityAnalytics 8.1.3
The rightmost two ports in each module are used only in a two-node failover cluster, which Symantec does not support for Security Analytics.
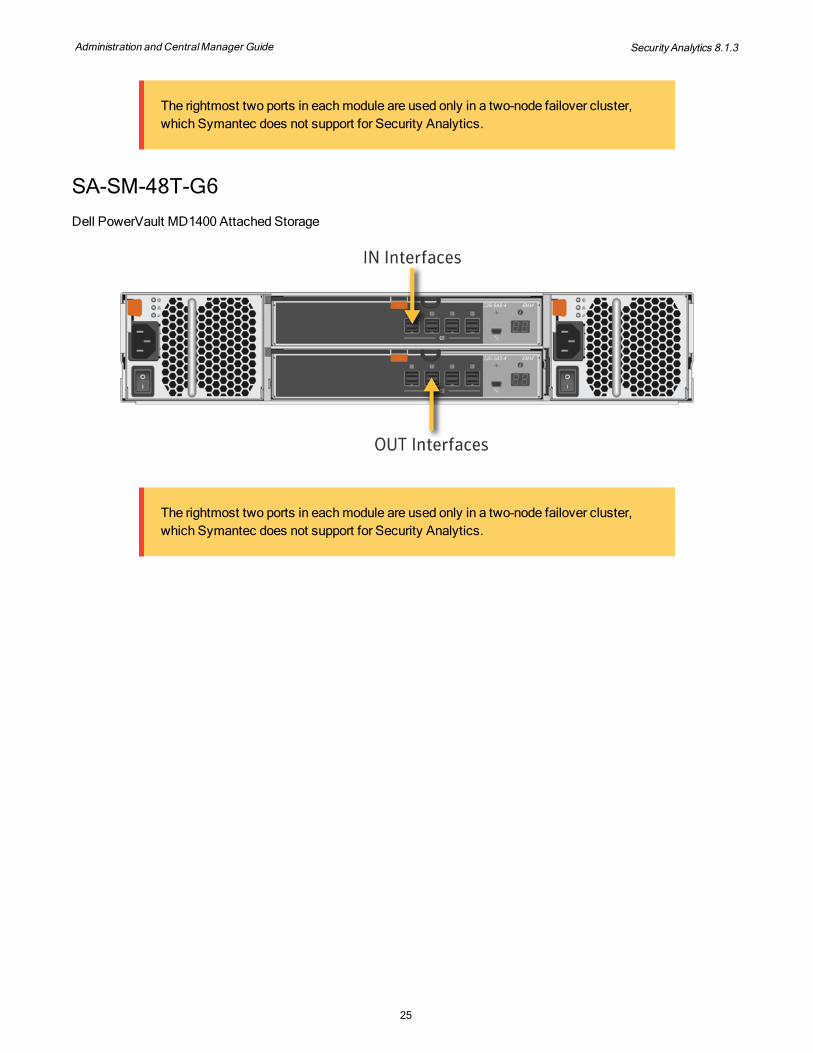
SA-SM-48T-G6Dell PowerVault MD1400 Attached Storage
The rightmost two ports in each module are used only in a two-node failover cluster, which Symantec does not support for Security Analytics.
25

Administration and CentralManager Guide SecurityAnalytics 8.1.3
SA-SM-240T-FC-G6Dell PowerVault MD3860f High-Speed Fibre Channel Storage
26

Administration and CentralManager Guide SecurityAnalytics 8.1.3
NetApp® E2760 Storage Array
27

Administration and CentralManager Guide SecurityAnalytics 8.1.3
Alerts Management DashboardThe default landing page, the Alerts Management Dashboard, provides immediate visibility into the current state of network traffic.
n "Populating the Dashboard" on the next page
n Alerts List
1
Analyze, Capture, Statistics, Settings, Menus
8 Dashboard, Summary, and List tabs
2
Alerts and Anomalies in the last 96 hours; this count is not affected by the alerts filters
9 Time Range Filter
3
System Utilization 10 IP Filter
4
About Menu 11 Advanced Filter
5
Job Queue 12 Importance Filter — Click to add to the Advanced Filter
28

Administration and CentralManager Guide SecurityAnalytics 8.1.3
6
Notifications 13 Alert Distribution over Time Histogram
7
Account Settings 14 Alert Cards — Click details to see the alert list
Populating the DashboardAlerts are produced by rules.
n By default, the following rules are enabled: Heartbleed Attack Attempt, Non-Standard SSH, Shellshock Webserver Exploit Attempt, and Local File Analysis - Live Exploits.
n To enable other rules or create new ones, select Analyze > Rules or click Set Up Rules for Alerts.
29

Administration and CentralManager Guide SecurityAnalytics 8.1.3
CaptureInitiate or Stop Capture 30
Capture Summary Graph 31
Static Filters 33
Intelligent Capture 34
Dynamic Filters 36
Capture-Interface Aggregation 38
PCAP Files 39
Playback 46
Data Availability 49
Reindexing 52
Reprocessing 53
Also see "Tap Placement and Capture Optimization Best Practices" on the Security Analytics documentation site.
The Menu > Capture > Summary page has two sections: the interactive graph at the top of the page and a set of summary boxes (one per interface). (See "Menu > Capture > Summary" on page 416.)
Initiate or Stop Capture
You can also use the dscapture command in the CLI for some of these actions. (Consult the in the Security Analytics 8.1.x Reference Guide on support.symantec.com.)
1. Select Menu > Capture > Summary and identify the graphical box for the interface.
2. Click Start Capture. The green Start Capture button becomes a red Stop Capture button.
30

Administration and CentralManager Guide SecurityAnalytics 8.1.3
3. If there is traffic on that interface, the Current, Max, and Total rows in the Captured column will begin to populate.
Do not click Start Capture for interfaces that receive no traffic or you will produce unexpected behavior.
1. To view the interface's traffic in the graph, click the Hidden icon.
2. The color of the left margin of the graphical box is the same color as the interface's line in the graph. Select View > Aggregated Statistics to display all traffic in one line.
Capture Summary GraphThe capture summary graph provides a view of the capture statistics for each network interface so that you can see patterns in network data over time. Click and drag the cursor over a section of the graph to highlight a section to enlarge. The graph polls the system regularly to get information on interface captures. By default, the graph will display up to six months of historical data.
This interval can be changed by selecting About > Data-Retention Settings. The "age" of graph data is calculated according to when it was written to the database, not according to the timestamps on the packet data. For example, if you import a two-year-old PCAP today and retain the timestamps, the graph for the PCAP will be displayed
31

Administration and CentralManager Guide SecurityAnalytics 8.1.3
two years in the past; however, if you set the data-retention interval to one month, the graph data for the PCAP will be erased only after a month has elapsed.
Total Traffic per Interface and UptimeAt the upper-left of the graph you can see System Uptime as well as total traffic per interface and 10-day average capture rate.
n To show or hide each interface, click its Hide/Show Line on Graph icon. (See "Capture Interfaces" on page 417.)
View MenuUse this menu to display information about system performance. You can select as many or as few of these values as you want.
Process Definition Unit of Measurement
CPU Usage Amount of CPU capacity currently used Percentage of Capacity
RAM Usage Amount of RAM currently used Percentage of Capacity
Flow Table Size Cumulative size of the flow table since last reboot Cumulative (Kilo)bytes
DPI Threads Cumulative number of deep-packet inspection (DPI) threads
Cumulative Number
Slot Overflow The number of slots that exceed the DPI slot capacity Current Number
Cumulative Flow Maximum
The highest number of flows since last reboot Cumulative Number
Flows in Progress The number of flows that are currently being processed Current Number
Slots in Use The number of slots that are currently being processed Current Number
Packets in Progress The number of packets that are currently being processed
Current Number
Flows Initiated The number of new flows that have begun processing Current Number
PCAP Import Toggle to show/hide PCAP imports in the graph Network traffic unit of measure
Aggregated Statistics Aggregate data from all capture interfaces Network traffic unit of measure
File Analysis Jobs in Progress
The number of file-analysis jobs that are in the queue Current Number
32

Administration and CentralManager Guide SecurityAnalytics 8.1.3
Process Definition Unit of Measurement
Processed File Analysis The number of file-analysis jobs that have been processed
Current Number
File Analysis Queue Discards
The number of file-analysis jobs that were dropped because the extractor's queue limit was exceeded
Current Number
File Analysis Range Discards
The number of file-analysis jobs that were dropped because the maximum slot range limit was exceeded
Current Number
File Analysis Slot Discards
The number of data-enrichment jobs that were dropped because the slot was not in memory (not live)
Current Number
File Analysis Requests The number of file-analysis requests to the Intelligence Services
Current Number
Clear the Capture Summary Graph Data
1. Select About > Data-Retention Settings.
2. Click Delete ALL Capture Summary Graph Data. You cannot undo this action.
3. Optional — Specify how long to keep data for Life of Capture Summary Graph Data.
Actions MenuClick the Actions menu to access the following options:
n Download PCAP — Save the data in the selected timespan as a PCAP file.
n Start Playback — Create a playback session based on the selected timespan. (See "Playback" on page 46.)
n Reprocess — Resend packets through the rules engine. (See "Reprocessing" on page 53.)
n Reset Zoom — Reset the graph to the default view.
n Analyze Data — View the selected timespan on the Summary page.
Static FiltersWith static capture filters, you can select the packets to be captured or discarded by a given network interface. Static filters are applied manually and do not expire.
Security Analytics uses the standard Berkeley Packet Filter language to define capture filters at the Ethernet, network, and transport levels (OSI Layers 2–4). Once created, the filter definition can be saved and reused for other capture interfaces. Capture filters can also be applied to PCAP downloads and playback. (Consult BPF Syntax in the Security Analytics 8.1.x Reference Guide on support.symantec.com.)
33

Administration and CentralManager Guide SecurityAnalytics 8.1.3
Traffic that is excluded by a capture filter is not written to the capture drive. To filter out traffic types at the application level, use dynamic filters. (See "Dynamic Filters" on page 36.)
Apply a Capture Filter to an Interface
1. Select Menu > Capture > Summary.
2. For the desired interface, click the filter icon .
3. For Filter, do one of the following:
n Select an existing filter.
n Select Create New Filter. Provide the Name and BPF Expression for the filter.
4. Click Save. The interface will now capture only the traffic specified by the filter.
5. To remove the filter click again, select No Filter, and click Save.
Apply a Capture Filter to a PCAP DownloadFollow the steps in "Download PCAPs of Captured Data" on page 39, select PCAP without Packet Filters for Type, and then specify a new BPF filter in the space provided.
Intelligent CaptureNew in Security Analytics 8.1.1 With intelligent capture you can specify which packets are not written to the capture drive but that are nevertheless subjected to classification, indexing, and the rules engine. For example, you may want to classify encrypted traffic so that you can see report data on that traffic, but you also do not want to store those packets on the capture drive.
You can use intelligent capture to keep your capture drive from filling up with packets that you do not want to record, such as Netflix® movies, Pandora® audio streams, SSL-encrypted traffic, or any other traffic that you can identify with an indicator.
Intelligent Capture vs. Dynamic Filters Intelligent capture performs a similar function to dynamic filters—preventing the capture drive from filling up as quickly as it otherwise would. The differences are as follows:
n Dynamic filters stop all traffic at the point of ingress to the system, that is, at the capture interface; with intelligent capture the traffic enters the system but is later discarded.
n Dynamic filters are far more resource-intensive than intelligent capture.
34
Administration and CentralManager Guide SecurityAnalytics 8.1.3
n Intelligent capture permits metadata indexing and rules to be performed on the traffic that is later discarded; with dynamic filters there is no metadata for the excluded traffic.
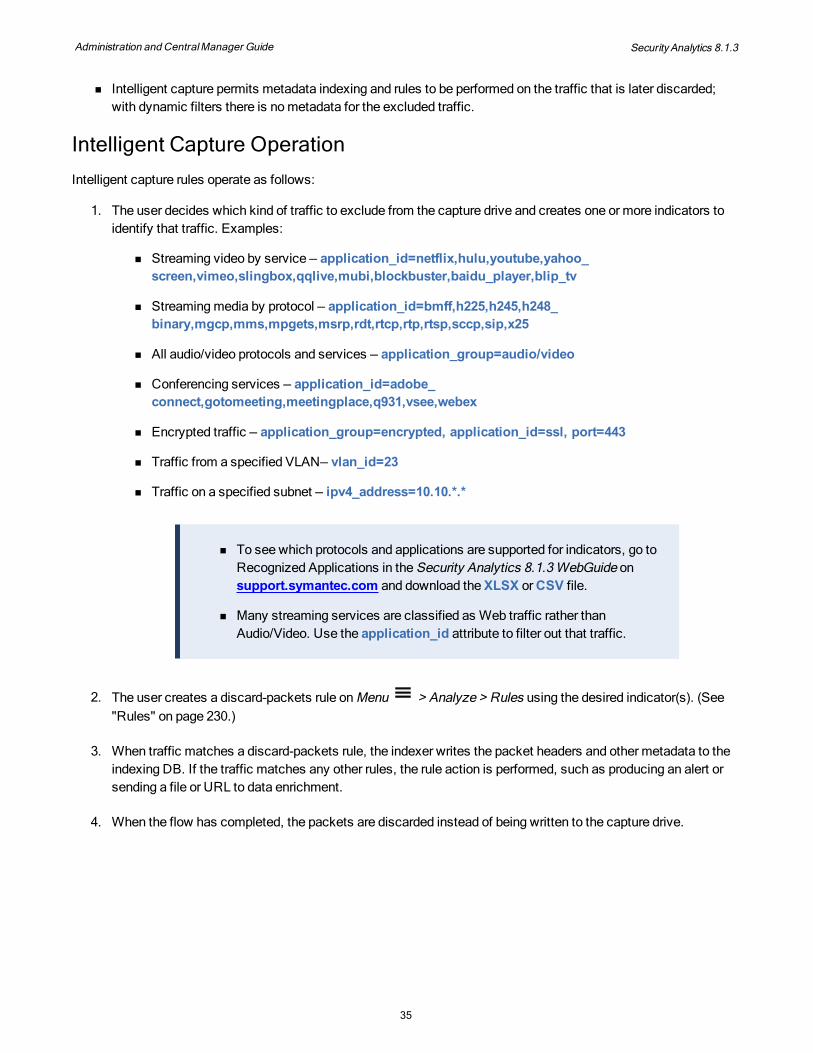
Intelligent Capture Operation Intelligent capture rules operate as follows:
1. The user decides which kind of traffic to exclude from the capture drive and creates one or more indicators to identify that traffic. Examples:
n Streaming video by service — application_id=netflix,hulu,youtube,yahoo_screen,vimeo,slingbox,qqlive,mubi,blockbuster,baidu_player,blip_tv
n Streaming media by protocol — application_id=bmff,h225,h245,h248_binary,mgcp,mms,mpgets,msrp,rdt,rtcp,rtp,rtsp,sccp,sip,x25
n All audio/video protocols and services — application_group=audio/video
n Conferencing services — application_id=adobe_connect,gotomeeting,meetingplace,q931,vsee,webex
n Encrypted traffic — application_group=encrypted, application_id=ssl, port=443
n Traffic from a specified VLAN— vlan_id=23
n Traffic on a specified subnet — ipv4_address=10.10.*.*
n To see which protocols and applications are supported for indicators, go to Recognized Applications in the Security Analytics 8.1.3 WebGuide on support.symantec.com and download the XLSX or CSV file.
n Many streaming services are classified as Web traffic rather than Audio/Video. Use the application_id attribute to filter out that traffic.
2. The user creates a discard-packets rule on Menu > Analyze > Rules using the desired indicator(s). (See "Rules" on page 230.)
3. When traffic matches a discard-packets rule, the indexer writes the packet headers and other metadata to the indexing DB. If the traffic matches any other rules, the rule action is performed, such as producing an alert or sending a file or URL to data enrichment.
4. When the flow has completed, the packets are discarded instead of being written to the capture drive.
35
Administration and CentralManager Guide SecurityAnalytics 8.1.3
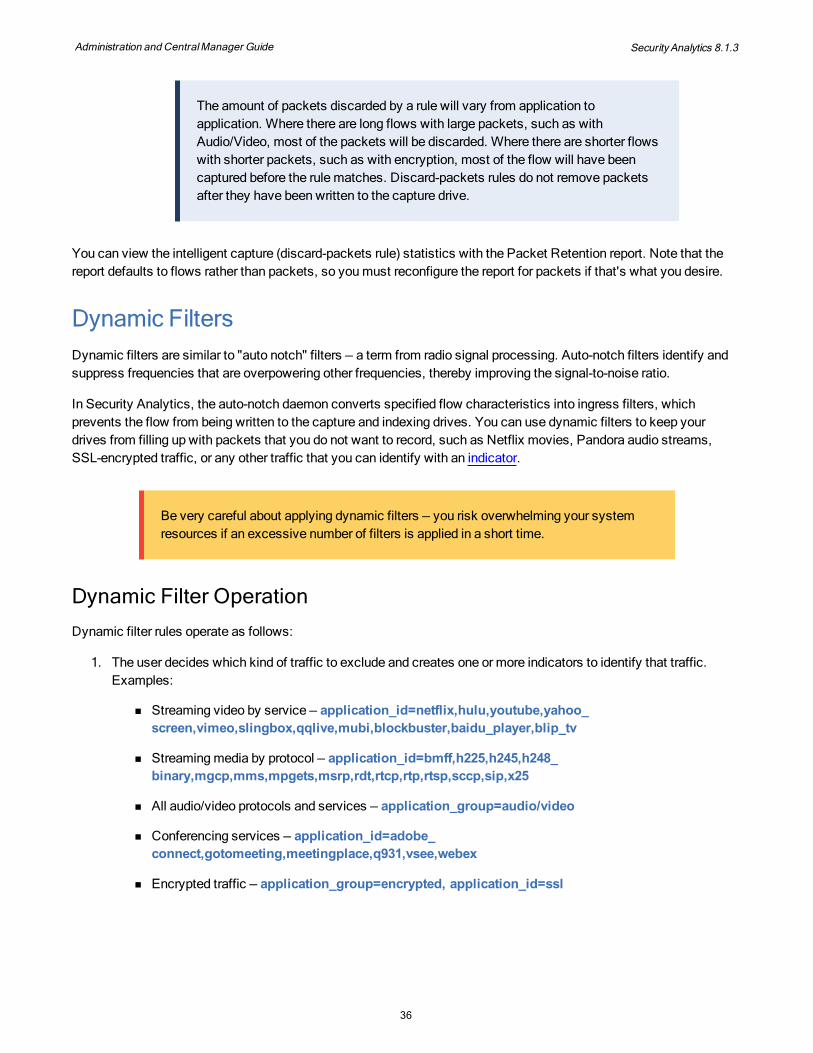
The amount of packets discarded by a rule will vary from application to application. Where there are long flows with large packets, such as with Audio/Video, most of the packets will be discarded. Where there are shorter flows with shorter packets, such as with encryption, most of the flow will have been captured before the rule matches. Discard-packets rules do not remove packets after they have been written to the capture drive.
You can view the intelligent capture (discard-packets rule) statistics with the Packet Retention report. Note that the report defaults to flows rather than packets, so you must reconfigure the report for packets if that's what you desire.
Dynamic FiltersDynamic filters are similar to "auto notch" filters — a term from radio signal processing. Auto-notch filters identify and suppress frequencies that are overpowering other frequencies, thereby improving the signal-to-noise ratio.
In Security Analytics, the auto-notch daemon converts specified flow characteristics into ingress filters, which prevents the flow from being written to the capture and indexing drives. You can use dynamic filters to keep your drives from filling up with packets that you do not want to record, such as Netflix movies, Pandora audio streams, SSL-encrypted traffic, or any other traffic that you can identify with an indicator.
Be very careful about applying dynamic filters — you risk overwhelming your system resources if an excessive number of filters is applied in a short time.
Dynamic Filter Operation Dynamic filter rules operate as follows:
1. The user decides which kind of traffic to exclude and creates one or more indicators to identify that traffic. Examples:
n Streaming video by service — application_id=netflix,hulu,youtube,yahoo_screen,vimeo,slingbox,qqlive,mubi,blockbuster,baidu_player,blip_tv
n Streaming media by protocol — application_id=bmff,h225,h245,h248_binary,mgcp,mms,mpgets,msrp,rdt,rtcp,rtp,rtsp,sccp,sip,x25
n All audio/video protocols and services — application_group=audio/video
n Conferencing services — application_id=adobe_connect,gotomeeting,meetingplace,q931,vsee,webex
n Encrypted traffic — application_group=encrypted, application_id=ssl
36

Administration and CentralManager Guide SecurityAnalytics 8.1.3
n Traffic from a specified VLAN— vlan_id=23
n Traffic on a specified subnet — ipv4_address=10.10.*.*
To see which protocols and applications are supported for indicators, go to Recognized Applications in the Security Analytics 8.1.3 WebGuide on support.symantec.com and download the XLSX or CSV file.
Use the dynfilter command to manage the dynamic filters. (More information in the Security Analytics 8.1.x Reference Guide on support.symantec.com.)
2. The user creates a dynamic filter rule on Menu > Analyze > Rules using the desired indicator(s). (See "Rules" on page 230.)
3. When traffic matches a dynamic filter rule, an ingress filter is applied to the capture interface where the traffic was detected. The flow that matches the filter is dropped before it is written to the capture and indexing drives, except for the first few packets (less than one second) of the flow.
4. When the interval specified in the rule elapses, the filter is deleted from the capture interface. If the same media is still streaming, it triggers the rule again and the filter is reapplied.
5. When a dynamic filter is applied to a capture interface, the interface display should show how much traffic is being filtered in the Filtered column.
Guidelines for Creating Dynamic Filters n Avoid creating dynamic filters on any type of traffic that is likely to occur frequently across a diverse set of
flows. Such a dynamic filter rule will produce filter strings that soon exceed the size limit for the ingress filter, after which no new entries can be added until older entries expire. For example, a dynamic filter rule using the Commonly Scanned Ports indicator will soon fill allotted memory and prevent other dynamic filters from being applied.
n Dynamic filters should be as course-grained as possible, meaning that you should select only 1 or 2 of the five available attributes to create the filter: usually, IP Responder and IP Protocol together. There is a limit on the number of flows that can be dynamically filtered at a time. By ensuring that only 1–2 of the options are selected, the limit is much harder to reach.
Expected Behavior with Dynamic Filters n Between the time that a flow enters the system and the time that the flow is classified and the dynamic filter
applied, some packets will still be captured to disk. If the flow is especially short, the entire flow may be captured before it is classified and the filter applied.
n Because dynamic filters time out, a flow that lasts longer than the filter timeout may begin to be captured after the filter expires. The DPI engine must reclassify the flow and reapply the dynamic filter before the flow's packets are again filtered out and discarded.
37

Administration and CentralManager Guide SecurityAnalytics 8.1.3
n It may take more time to apply a dynamic filter to the traffic in an imported PCAP than it takes to import the PCAP. Unless the PCAP is especially large or the import speed especially slow, dynamic filters probably will not be applied to imported PCAP data.
Capture-Interface AggregationIn some cases it is advantageous to aggregate two or more physical interfaces into one virtual interface — for example, if you have separate physical interfaces for Rx and Tx traffic — an aggregated interface permits Security Analytics to match initiator traffic with its corresponding responder traffic.
You can also aggregate capture interfaces with the dscapture command in the Security Analytics 8.1.x Reference Guide on support.symantec.com.
The following rules apply to interface aggregation:
n You can aggregate as many interfaces as reside on a single appliance.
n You can add only one interface to the aggregate at a time.
n If any of the component interfaces have a capture filter, that filter will be ignored in the aggregate.
n You can apply a capture filter to the aggregated interface.
n When you separate an aggregated interface, you separate all of the component interfaces; you cannot delete only one or two interfaces from the aggregate.
n After separating an aggregated interface, any filters that were on the individual interfaces will be reapplied, whereas any filters that were on the aggregated interface will be removed.
To aggregate interfaces, follow these steps:
1. Stop capture and playback on all of the interfaces that you want to aggregate.
2. Click and drag one interface box onto another interface box.
38

Administration and CentralManager Guide SecurityAnalytics 8.1.3
3. Verify that you have selected the correct interfaces, make a note of the new interface name, and click Combine.
4. Click Start Capture to start capturing on the aggregated interface.
5. To separate the aggregated interface into its component interfaces, stop the capture or playback on the interface, click the chain icon at the top-right of the interface box and click Separate.
PCAP FilesPCAP files contain copies of all captured packets for a given timespan. Symantec Security Analytics supports PCAP and PCAPNG formats, both Ethernet-encapsulated and PPP-encapsulated.
PCAP files can be very large. If you are accessing the Security Analytics web interface on Microsoft® Internet Explorer 9 or another browser that cannot send files in chunks, you cannot support PCAP files larger than 2 GB without using the Web Services APIs in the Security Analytics 8.1.x Reference Guide on support.symantec.com.
Download PCAPs of Captured Data
1. Do one of the following on Menu > Analyze > [Summary | Reports | Extractions | Geolocation]:
n Select Actions > Download PCAP — Any filters in the filter bar are applied to the downloaded file.
n Click the info icon on the Status bar.
2. The Download PCAP dialog is displayed.
3. For Filter click View Path to see the /pfs/flows path.
4. Click Calculate Size to see the amount of data to be downloaded.
39

Administration and CentralManager Guide SecurityAnalytics 8.1.3
5. For Type, select one of the following:
n PCAP — File is downloaded in PCAP format.
n PCAPNG — File is downloaded in PCAPNG format.
n PCAP without Packet Filters — All primary filters are cleared from the data.
n To apply a BPF filter, click the Filter list. Select a previously configured filter or select Create New Filter, type a name for the filter, and enter the BPF expression in the space provided. (See BPF Syntax.)
6. For Download Options, select one of the following:
n Browser — Download the PCAP file using your browser's file-download feature.
n Offline — Send the PCAP download job to the queue, to run in the background. (Not available for PCAP without Packet Filters.)
o A message indicates that the generation of the PCAP has begun.
o Click the notification at the upper-right corner of the web interface. The entry shows PCAP generation in progress.
o When the process has completed, the status changes from Processing to Download. Click the entry and follow the prompts to save the PCAP file.
n NFS save — Save to an NFS server. (Not available for PCAP without Packet Filters.)
The apache user (on the Security Analytics Apache instance) must have both read and write permissions to copy the PCAP to the mounted NFS server.
n For Server, click the Manage Connections icon. The Manage Connections dialog is displayed. As needed, configure an NFS mount point.
7. Click Download to save data.pcap or data.pcapng.
Other PCAP Downloads
Download PCAPs as follows, using your browser's Save function:
n On Menu > Analyze > [Summary | Reports | Extractions | Geolocation], select Actions >Analyze Packets, and then click Download PCAP — Any packet-analysis filters are applied to the downloaded PCAP. (See "Packet Analyzer" on page 184.)
40

Administration and CentralManager Guide SecurityAnalytics 8.1.3
n Select Menu > Analyze > Summary > Extractions and expand an artifact entry.
o Click Download and then select Download Artifact PCAP or Download Artifact PCAPNG.
o Click Analyze PCAP and then click Download PCAP — Any packet-analysis filters are applied to the downloaded PCAP.
n Select Menu > Capture > Summary, then select Actions > Download PCAP — Any filters on the capture interfaces are applied to the downloaded PCAP.
Automatic PCAP Downloads
To export PCAPs automatically, create a PCAP Export rule.
Import PCAP FilesYou can import PCAP files from your workstation, a USB drive, or a remote server. To import from a USB drive, insert the drive into the Security Analytics appliance before performing the next steps; do not remove the USB drive until the import is complete.
n Select View > PCAP Import in the Capture Summary Graph ("Menu > Capture > Summary" on page 416) to see the histogram of the import.
n You can also use the dspcapimport command in the CLI for this function. (More information in the Security Analytics 8.1.x Reference Guide on support.symantec.com.)
1. Select Menu > Capture > Import PCAP.
2. Click New.
3. For Import from, specify the import device.
n My Computer — Click Browse, locate the PCAP file, and open. (Not available from the CMC; see "Multi-Sensor PCAP Files" on page 358.)
n Appliance USB Drive — Select the PCAP file to import. (Not available from the CMC.)
n Remote Server — Select an existing mount point or specify a new one, select the Schedule, and then select the PCAP file to import.
4. Indicate whether to share the imported PCAP.
5. Clear the Retain original packet timestamps check box to use the importation begin and end times as the timestamps.
41

Administration and CentralManager Guide SecurityAnalytics 8.1.3
When the original timestamps are not retained, the PCAP is imported as fast as system resources allow; therefore, the new timestamps will not necessarily be in the same order as in the original PCAP. If you need to preserve the order or timing of events, Symantec recommends that you retain the original packet timestamps.
6. Click Import.
n When you upload a series of PCAPs rapidly, one after the other, each PCAP may be imported over a different virtual interface: impt0–impt9. PCAP data can be imported concurrently on up to ten virtual interfaces.
n Use dspcapimport to specify which impt interface to use for a PCAP import. (More information in the in the Security Analytics 8.1.x Reference Guide on support.symantec.com.)
PCAP File AnalysisAfter you have imported a PCAP file, use the following methods to further analyze the data.
Analyze PCAPs on Security Analytics
The web UI on Security Analytics offers these options:
n "PCAP Imports List" below
n "Storage System Page" on the next page
n "Capture Summary Page" on page 44
PCAP Imports List
Select Menu > Capture > Import PCAP. On the Imports list, the following information is available:
n Name — Name of the imported PCAP file.
n Status — Import state such as Running, Queued, Completed, or Canceled. To filter the list by status, click All at the top-left of the list and select the desired state.
n Import Source — The method of importing the PCAP, such as Browser Upload or the name of the remote server (as specified under Manage Connections).
n Interface — The interface on which the PCAP was imported, usually impt0.
n Import ID — Sequential number that is assigned to the import. This number appears in filters as import_id=<x>.
42

Administration and CentralManager Guide SecurityAnalytics 8.1.3
n Extraction Jobs — Number of files that have been reconstructed by the micro-extraction process. Total shows how many rule hits were registered, and Completed shows how many micro-extractions have been completed.
n Data Enrichment Jobs — Number of verdicts that have been returned by the enrichment providers. One artifact can trigger multiple data enrichment jobs when multiple enrichment providers receive the artifact. Total shows how many data enrichment jobs have been created, and Completed shows how many verdicts have been returned.
n Created Time — The time at which the PCAP import began.
n First Packet Time — The timestamp on the first packet in the PCAP file. If you selected Retain original packet timestamps for the import, this date will be earlier than the Created Time; otherwise, it will be a few seconds later.
n Actions — Click an icon:
o View Import Information — See more information about the import, including error messages.
o View Alerts of This Import — Open the Alerts Management Dashboard to see the alerts that this PCAP generated.
o View This Import — Loads the PCAP into the Menu > Analyze > Summary view with import_id=<x>in the filter bar.
n You cannot directly type import_id=<x> into the filter bar to view the PCAP data, because the proper timespan for the import must also be specified. Always use View This Import to load the PCAP data into the Analyze pages.
n On the Alerts pages, you can type import_id=<x> into the Advanced Filter to see the alerts that were generated by that PCAP.
Storage System Page
On the Menu > Statistics > Storage System page, an entry for the imported PCAP is displayed under Active Slot Chain for Interface impt<X>.
43

Administration and CentralManager Guide SecurityAnalytics 8.1.3
n Because PCAPs are imported to the capture drive along with the live captures, imported PCAPs will be overwritten as the capture process cycles.
n As a PCAP is overwritten, the values that indicate size and location gradually decrease. The entry for the PCAP disappears when the PCAP data in the capture drive is completely overwritten.
n When you import multiple PCAPs via the same virtual interface, the system shows the combined statistics for the PCAPs in a single entry.
Capture Summary Page
On the Menu > Capture > Summary page, select View > PCAP Import to see the histogram for the PCAP.
n If you selected the Retain original packet timestamps check box during import, the PCAP data will be displayed in its original capture timeframe at the far left of the chart.
n Any activity that the PCAP import generates — such as Intelligence Service requests or flows in progress — is displayed using the actual timestamps. For example, if the original packet timestamps are in February and the PCAP is imported the following April (with timestamps retained), the histogram for the PCAP import will be in February and the data enrichment requests it generates will be shown as occurring in April.
Analyze PCAP Files in Wireshark
n To view PCAP files in Wireshark®, download and install that third-party application.
n Follow the Wireshark instructions to import and read PCAP(NG) files.
n Alternatively, open Menu > Analyze > [Summary | Reports | Extractions | Geolocation] and then select Actions > Analyze Packets. The PCAP is displayed in the packet analyzer, which has an interface similar to Wireshark's.
Automatically Import PCAP FilesUse watch folders to automatically import PCAP files from a remote server.
1. Select Menu > Capture > Import PCAP and click the Watch Folders tab.
2. Click New.
3. Do you need to configure a new server (mount point)?
Yes — Follow the steps to Configure a Mount Point to configure the new server and directory.
No — Select an existing mount point and continue the procedure.
4. For Check for Files, specify the interval to check for new PCAP files.
5. For Select folders, specify which folder(s) to monitor for new PCAP files. The selected folder names are displayed in the space below.
44

Administration and CentralManager Guide SecurityAnalytics 8.1.3
6. Optional — Clear the Retain original packet timestamps check box to ignore the PCAP timestamps and use the import start time instead.
7. Click Create. The system will check the specified folder(s) and automatically upload any new PCAP files that it finds.
8. Click Manage Connections to edit the information for the watch folder mount points.
Automatically Export PCAP FilesTo automatically export PCAP files, use a PCAP export rule. (See "Rules" on page 230.)
Configure a Mount PointFollow these steps to configure a mount point:
1. Do one of the following to access the Manage Connections dialog:
n Select Menu > Capture > Import PCAP and click Manage Connections.
n On Menu > Analyze > [Summary | Reports | Extractions | Geolocation], select Actions >
Download PCAP or click the Info icon on the Status bar.
o Select NFS save for Download Options, and then click the Manage Connections icon .
n Select Menu > Analyze > Rules, click New, select PCAP Export for Type, and then click the
Manage Connections icon .
2. On the Manage Connections dialog, click Add New Server.
3. For Title, specify a unique name for the mount point. You can create multiple mount points on the same server that point to different directories.
4. For Protocol, select CIFS/SMB or NFS.
45

Administration and CentralManager Guide SecurityAnalytics 8.1.3
5. For Server, specify the IP address or hostname for the server. Optionally, you can add a port number after a colon: 10.11.12.13:80.
6. For Directory, type a slash and then the path: /public/saved_pcaps/SA_0344
7. CIFS/SMB Only — Enter the Username and Password of the account to access the server or directory.
8. Click Save.
Playback
Use the dsregen command in the CLI for these functions. (More information in the Security Analytics 8.1.x Reference Guide on support.symantec.com.)
Use the playback feature to reconstruct and transmit captured data flows to a physical network interface for analysis. Depending on which data is selected for replay, the data is lifted from the capture drives or regenerated directly from the input interface(s). Play back live data to forward data flows to a physical network interface for analysis. The Symantec Security Analytics appliance can regenerate traffic with less than 1 ms latency, even at high network speeds (up to 10 Gbps).
When sending data from multiple input interfaces to a single output, take into consideration the interface speeds. For example, if you have two 100-Mbps input interfaces and your output interface is also 100 Mbps, you might experience problems with throughput.
46

Administration and CentralManager Guide SecurityAnalytics 8.1.3
Create a Playback Session
1. Select Menu > Capture > Summary.
2. For the output interface, click Start Playback.
3. Select the input interface(s) whose data you want to include.
4. Select the Output Interface to be used.
Interfaces that are in use for capture cannot be used as the output interfaces for playback; otherwise, the existing capture sessions will be stopped.
5. For Time Span, select one of the following:
n All Captured Data — Select to replay all of the data that is currently on the capture drives.
n Live Data — Select to send the data that is currently being captured.
n Custom Time Range — Select to specify the beginning and end.
o For Start Time, expand the list to select a fixed timespan or specify manually the date and time.
o Select Never End so that the data continues to play back until you stop it.
o For End Time, expand the list to select a fixed timespan or specify manually the date and time.
6. To apply a filter to the output interface, expand the Filter list and do one of the following:
47

Administration and CentralManager Guide SecurityAnalytics 8.1.3
n Select or edit an existing filter.
n Select Create New Filter and specify a Name and the BPF expression for the filter. (See BPF Syntax.)
7. Click Save.
8. The message Playback in Progress is displayed on the interface box if the playback session is successful.
Click to see the parameters of the playback.
Many-to-Many SessionsWhen a playback session is created, the system merges the input from the physical interfaces and maps it to a virtual interface (imfX), which then forwards the traffic to another physical output interface. (See Virtual Interface Mapping.)
The web interface permits you to specify many-to-one sessions—that is, multiple input interfaces to a single output interface. To create the equivalent of a many-to-many session, you must create one session per output interface.
example
In the example above, there are two output interfaces — eth6 and eth7 — so the following two sessions must be created:
Session Input Filter Output
1 eth2, eth3 [as desired] eth6
48
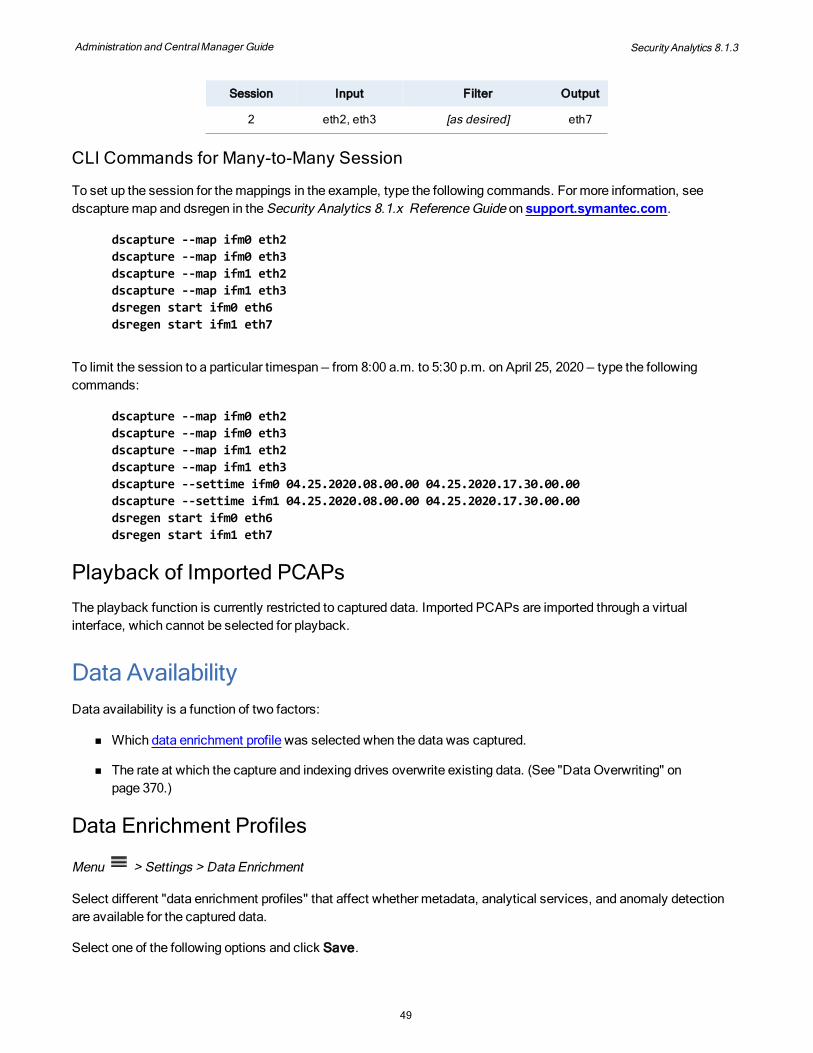
Administration and CentralManager Guide SecurityAnalytics 8.1.3
Session Input Filter Output
2 eth2, eth3 [as desired] eth7
CLI Commands for Many-to-Many Session
To set up the session for the mappings in the example, type the following commands. For more information, see dscapture map and dsregen in the Security Analytics 8.1.x Reference Guide on support.symantec.com.
dscapture --map ifm0 eth2dscapture --map ifm0 eth3dscapture --map ifm1 eth2dscapture --map ifm1 eth3dsregen start ifm0 eth6dsregen start ifm1 eth7
To limit the session to a particular timespan — from 8:00 a.m. to 5:30 p.m. on April 25, 2020 — type the following commands:
dscapture --map ifm0 eth2dscapture --map ifm0 eth3dscapture --map ifm1 eth2dscapture --map ifm1 eth3dscapture --settime ifm0 04.25.2020.08.00.00 04.25.2020.17.30.00.00dscapture --settime ifm1 04.25.2020.08.00.00 04.25.2020.17.30.00.00dsregen start ifm0 eth6dsregen start ifm1 eth7
Playback of Imported PCAPsThe playback function is currently restricted to captured data. Imported PCAPs are imported through a virtual interface, which cannot be selected for playback.
Data AvailabilityData availability is a function of two factors:
n Which data enrichment profile was selected when the data was captured.
n The rate at which the capture and indexing drives overwrite existing data. (See "Data Overwriting" on page 370.)
Data Enrichment Profiles
Menu > Settings > Data Enrichment
Select different "data enrichment profiles" that affect whether metadata, analytical services, and anomaly detection are available for the captured data.
Select one of the following options and click Save.
49

Administration and CentralManager Guide SecurityAnalytics 8.1.3
It is not necessary to reboot after changing the data enrichment profile; however, changing from one profile to another may take a few minutes to complete.
n Full Data Enrichment with Anomaly Detection — All services are available:
o indexing (solera-shaft)
o reindexing (solera-reindexerd)
o data enrichment (tonicd)
o rules and alerts (solera-ruleEngine)
o artifact extraction (solera-extractord)
o anomaly detection (adm-connector)
o IPFIX export (solera-ipfixexport)
o PCAP export (solera-pcapexport)
n Full Data Enrichment (No Anomaly Detection) — Default. All services are available except anomaly detection (adm-connector).
n Packets Only — All resources are dedicated to writing data to the capture drive as fast as the hardware permits. All of the analytical and metadata services are disabled. To retrieve PCAPs from the drive that were written during Packets Only, use the GET: /pcap/download/merge API; you cannot download filtered PCAPs from the web UI during Packets Only.
Data that was captured during Packets Only — and that has not been overwritten — can be reprocessed to index the data and apply all active rules. (See "Reprocessing" on page 53.)
Viewing Data Availability
You can see data availability on Menu > Analyze > [Summary | Reports | Extractions | Geolocation] by expanding the timespan selector.
50

Administration and CentralManager Guide SecurityAnalytics 8.1.3
Data availability information is displayed:
n [no message] — All metadata and packet data are available.
n limited packet data — Full metadata is available as well as some packet data.
n metadata only — Full metadata is available but no packet data.
n limited metadata — Some metadata is available but no packet data.
n no data — All packets and metadata have been overwritten, or no data was captured during that time.
In some cases, just after packets have been captured but indexing has not been completed, the data is temporarily not available for searches and reports.
Calendar DisplayClick a date to see color-coded information for packet and metadata availability.
51

Administration and CentralManager Guide SecurityAnalytics 8.1.3
n White background — All metadata and packet data are available. Reports, artifacts, and PCAP downloads are available for this data.
n Light pink background — Metadata is available but the corresponding packets have been overwritten. Only reports are available for this data.
n Dark pink background — All packet data and metadata have been overwritten, or no data was captured on those days.
Capture Summary Graph"Menu > Analyze > Summary" on page 410
The capture summary graph indicates overwritten data with the dark pink No Data Available area and the light pink Packet Data Overwritten (Metadata Only) area.
Capture summary graph data can remain available after the corresponding packets and metadata have been overwritten because it is not stored on the capture or index drives. See "Drive-Space Management" on page 324 for information on retaining and deleting capture summary data.
ReindexingAlso see "Reprocessing" on the next page.
52

Administration and CentralManager Guide SecurityAnalytics 8.1.3
During periods of heavy network activity, the system may not be able to index every packet as it is written to the capture drive. During periods of lower activity, the system returns to the unindexed packets on the capture drive and attempts to finish indexing them.
On the Status bar, the total amount of data in the flows is indicated. If the system has not been able to finish indexing
all of the packets, the warning icon is displayed. Click the icon to see how many flows remain to be indexed.
Click Give Priority to This Timespan to move the unindexed flows in the current view to the top of the reindexing queue.
In some cases the warning icon is still visible for several minutes after the reindexing job has finished.
As soon as a flow has been indexed, it is examined by the rules engine. If the flow matches a rule, the flow will be processed according to the instructions in the rule.
To see reindexing jobs, select Capture > Summary > Actions > Reprocess. Reindexing jobs show 1 in the Command column.
ReprocessingAlso see "Reindexing" on the previous page.
In some cases, when a data-enrichment rule sends a query to an external source, or when an Intelligence Service sends a query to the Global Intelligence Network, there is no immediate response. In other cases, you may have altered your indicators or rules, new report attributes may have been included in an updated version of Security Analytics, or you captured data using the Packets Only profile.
53

Administration and CentralManager Guide SecurityAnalytics 8.1.3
As necessary, you can select data to be examined again by the data-enrichment process as well as reindexed by Security Analytics.
For certain encrypted protocols such as SSH, IPSEC, and ISAKMP, the tls_heartbeat_attack_attempt attribute will not be indexed during reprocessing. Heartbleed detection is therefore dependent on the tls_heartbeat_mismatch attribute.
Imported PCAPs cannot be reprocessed.
1. On Capture > Summary select a timespan to reprocess.
2. Select Actions > Reprocess. The Reprocessing Jobs page is displayed.
3. Click New. The Time Range shows the same start and end times as you selected on the Capture Summary page. You may change the time range, as desired.
4. Click Save. The selected data is sent back through the rules engine and is also indexed again.
Depending on system load, reprocessing may not initiate for up to an hour. In the case of heavy system load, it may not initialize until after system load is reduced.
5. The columns on the Reprocessing Jobs page are as follows:
n Start Time — The starting time of the data to be reprocessed.
n End Time — The ending time of the data to be reprocessed.
n Processing Start — The time that the reprocessing job starts.
n Processing End — The time that the reprocessing job ends.
n Command — The type of reprocessing job:
o 1 = Reindexing — Packets that were not indexed at time of capture are indexed.
o 2 = Reprocessing — Packets are run again through indexing, rules engine, and data enrichment.
n Source — The origin of the job:
o 1 = Auto — When system resources prevent indexing at time of capture, resulting in classification discards, the system uses its idle time to index that data.
54

Administration and CentralManager Guide SecurityAnalytics 8.1.3
Data that is captured during a Packets Only session is not reindexed or reprocessed automatically.
o 2 = Manual — The reprocessing or reindexing job was initiated by the user:
l Reprocessing is manually initiated as described in Steps 1–4.
l Reindexing is manually initiated on the Summary page status bar.
n Percent Complete — Percentage of the job that is completed.
n Actions — Click to cancel the unfinished portion of the job. If the job is 100% complete, this will delete the entry from the list.
To prevent data corruption, the reprocessor will not reprocess the last 150 slots (~10 GB) of captured data.
55

Administration and CentralManager Guide SecurityAnalytics 8.1.3
Data AnalysisMetadata Settings 56
Integrated Cyber Defense Exchange (ICDx) 82
Open Parser 86
Summary Views 96
Anomaly Detection 101
Filters 107
Indicators 129
Reports 137
Extractions 152
Artifact Preview 161
Sessions 172
Geolocation 176
Encapsulation Detection 181
Packet Analyzer 184
Metadata SettingsAlso see "Integrated Cyber Defense Exchange (ICDx)" on page 82.
n Select Menu > Settings > Metadata to enable or disable hundreds of report attributes. Saving changes to this page will cause the appliance to reboot.
n For each selected metadata attribute, the following is true:
o You can include its report widget in Summary views. (More than 18 widgets per view will compromise system performance and integrity.)
o Its report is available on Menu > Analyze > Summary > Reports under its respective report group.
o The attribute is available in the primary filter bar.
o Additional system resources are used during the indexing processes.
Table Columns
For each report group there is a table with the following columns:
56

Administration and CentralManager Guide SecurityAnalytics 8.1.3
n Report — Name of the report, as presented on the Menu > Analyze > Reports page.
n Attribute — The primary filter attribute that corresponds to the report. Use the attribute when creating queries . The attribute is visible on the Metadata Settings page when resting the cursor on the report name. (See Best Searching Practices in Security Analytics.)
n Description — A description of the data in the report.
n Namespace — The namespace to which the metadata belongs.
o A Summary view that contains report widgets from different namespaces will take longer to complete.
o When creating complex primary filters, attributes from different namespaces are valid only when joined by AND. (See "Complex Filters Across Namespaces" on page 125.)
n Source — The source of the data in the report, such as packet header or metadata indexer. (See "Populating the Reports" on page 379.)
n Format — The format for the data in the report, such as string or integer
n Num/Len — An X in this column means that you can use the length len(<attribute>) or number num(<attribute>) function in the primary filter bar. num(<attribute>) returns the flows that contain the specified number of the attribute; len(<attribute>) returns the attribute with the specified length. For example, len(filename)=6 returns all of the flows that contain a six-character filename, whereas num(filename)=6 returns all of the flows that contain six instances of the filename attribute.
Note: Wildcards are not valid for the len(<attribute>) and num(<attribute>) functions.
n New — An X in this column means that the report is new in Security Analytics 8.1.3.
General Information
n Only the first 4096 bytes of an attribute are stored in the Indexing DB.
n Select Actions > Download Raw TSV from any Menu > Analyze page (Summary | Reports | Extractions | Geolocation) to download a tab-delimited file that contains selected attributes and their values for the timespan. See RAW.TSV Fields.
n See how to use the attributes in the primary filter, including complex filters, in "Creating Complex Filters" on page 123.
57

Administration and CentralManager Guide SecurityAnalytics 8.1.3
Metadata Tables
Application
The Application attributes cannot be disabled.
Report Attribute Description Namespace Source
Forma
Num/Len
Application application_id
One of over 2800 recognized applications. See Recognized Applications.
flows DPI engine
string X
Application Group
application_group
One of 35 groups to which the applications are assigned.
flows DPI engine
string
Custom Analytics
The Custom Analytics reports are created by open-parser rules. (See "Open Parser" on page 86.) When you enable or disable the reports on this page, the corresponding rules are also disabled.
Report Attribute Description Namespace Source Format Num/Len New
<rule_name>*
<rule_name>
Reports are populated only when the rule specifies :
n Add flag to metadata
n Add matching value to metadata
n Add succeeding value to metadata until this delimiter
flows Regular expression in open-parser rule
string
Packet Retention
packet_retention
The percentage of packets that are either retained or discarded
flows Internal rule string X
Queue Processor
queue_processor
How much indexing is being processed by each queue processor thread
flows Internal rule integer X
* The name of the open parser rule is converted to all lower-case letters, and underscores replace spaces.
DatabaseReport Attribute Description Namespace Source Format Num/Len
Database Query
database_query
Query sent to the database
flows Packet header, multiple protocols
string X
58

Administration and CentralManager Guide SecurityAnalytics 8.1.3
Report Attribute Description Namespace Source Format Num/Len
TNS Base tns_base Name of accessed database
flows Packet header
string X
TNS Client Hostname
tns_client_hostname
Client machine hostname flows Packet header
string X
TNS Client OS
tns_client_os
Client machine operating system
flows Packet header
string X
TNS Client Program Name
tns_client_program_name
Client program name flows Packet header
filename X
TNS Client Program Path
tns_client_program_path
Client program absolute path
flows Packet header
filepath/filename.ext
X
TNS Content Length
tns_content_length
Length in header field flows Packet header
integer X
TNS Login
tns_login
User login; also included in the Social Persona report
flows Packet header
string X
TNS MTU tns_mtu Maximum Transmission data Unit size
flows Packet header
integer X
TNS Password
tns_password
Password to access the TNS server; also included in the Password report
flows Packet header
string X
TNS Query
tns_query
Database query; also included in the Database Query report
flows Packet header
string X
TNS Server Hostname
tns_server_hostname
Database server hostname
flows Packet header
9.9.9.9 | hostname.tld
X
TNS Server OS
tns_server_os
Database server operating system
flows Packet header
string X
TNS Version
tns_version
Version number of Oracle server
flows Packet header
integer X
59

Administration and CentralManager Guide SecurityAnalytics 8.1.3
DNS
Also see Attributes for the DNS Reports.
Report Attribute Description Namespace Source Format Num/Len
DNS ANCOUNT
dns_ancount Number of records in the answer section
flows Packet header
integer X
DNS Answer Name
dns_name URLs in the answer section of the DNS response
flows Packet header
domain.tld X
DNS ARCOUNT
dns_arcount Number of additional records
flows Packet header
integer X
DNS Autogenerated Domain
autogenerated_domain
DNS server name, SSL common name, or SSL server name that may have been created by a DGA; this attribute cannot be disabled
flows DGA detector
score - protocol - name
DNS Autogenerated Domain Score
autogenerated_domain_score
Probability that the DNS server name, SSL common name, or SSL server name was created by a DGA (9 = highest probability); this attribute cannot be disabled
flows DGA detector
integer
DNS Flags dns_flags 16-bit representation of some DNS header flags: QA, Opcode, AA, TC, RD, RA, Z, RCODE
flows Packet header
hex X
60

Administration and CentralManager Guide SecurityAnalytics 8.1.3
Report Attribute Description Namespace Source Format Num/Len
DNS Host dns_host DNS server name
flows Packet header
domain.tld X
DNS Host Type
dns_host_type DNS response type: IP address, authoritative name server, primary name server, canonical name, domain name pointer, IPv6 address
flows Packet header
string X
DNS IPv4 Answer
dns_host_ipv4_addr
IPv4 addresses that resolve to the URL
flows Packet header
9.9.9.9 X
DNS IPv6 Answer
dns_host_ipv6_addr
IPv6 addresses that resolve to the URL
flows Packet header
a9a9::a9a9:a9a9 X
DNS Message Type
dns_message_type
Message type: QUERY, RESPONSE
flows Packet header
string X
DNS NSCOUNT
dns_nscount Number of answers in the Authority section
flows Packet header
integer X
DNS QDCOUNT
dns_qdcount Number of queries in the request
flows Packet header
integer X
DNS Query dns_query URL for which a DNS query is made
flows Packet header
9.9.9.9IN-ADDR-ARPA domain.tld
X
DNS Query Type
dns_query_type
DNS query type flows Packet header
string X
DNS Reply Code
dns_reply_code
Return message
flows Packet header
string X
DNS Response Time
dns_response_time
Elapsed time between sending of the DNS request and reception of its response
flows Packet header
9.99 X
61

Administration and CentralManager Guide SecurityAnalytics 8.1.3
Report Attribute Description Namespace Source Format Num/Len
DNS Reverse Addr
dns_reverse_addr
IP address returned to the pointer request
flows Packet header
9.9.9.9 X
DNS Reverse Addr6
dns_reverse_addr6
IPv6 address returned to the pointer request
flows Packet header
a9a9::a9a9:a9a9 X
DNS Section Type
dns_section_type
Type of section for each DNS answer
flows Packet header
string X
DNS Transaction ID
dns_transaction_id
DNS unique transaction ID
flows Packet header
hex X
DNS TTL dns_ttl Time (in seconds) DNS information returned by the server will be kept in cache
flows Packet header
integer X
DNS Web Application Info
dns_web_application_info
Metadata for the classification of known HTTP-based web applications
flows Packet header
<application>/9.9.9.9
X
EmailReport Attribute Description Namespace Source Format Num/Len
Email Recipient
email_recipient email_address
Email address in the receiver field
flows Packet header, multiple protocols
X
Email Sender
email_sender email_address
Email address in the sender field
flows Packet header, multiple protocols
X
Email Subject
subject Email subject flows Packet header, multiple protocols
string X
Email URI
mail_uri URIs extracted from email and HTTP artifacts
flows Default open-parser rule
string
SMTP Header Raw
smtp_header_raw Fields and values in the header
flows Packet header string X
62

Administration and CentralManager Guide SecurityAnalytics 8.1.3
Report Attribute Description Namespace Source Format Num/Len
SMTP X-Mailer
smtp_xmailer The user agent of the mailer
flows Packet header string X
EncryptionReport Attribute Description Namespace Source Format Num/Len New
SSL Certificate Serial Number
ssl_serial_number
Serial number of certificate flows Packet header
hex X
SSL Cipher Suite
ssl_cipher_suite
Cipher suite used in the SSL session
flows Packet header
string X
SSL Cipher Suite List
ssl_cipher_suite_list
List of cipher suites supported by the client
flows Packet header
string X
SSL Common Name
ssl_common_name
Domain name mentioned in the certificate
flows Packet header
URL X
SSL Handshake Type
ssl_handshake_type
Handshake type flows Packet header
integer
X
SSL Issuer ssl_issuer Certificate authority flows Packet header
string X
SSL Organization Name
ssl_organization_name
Organization name mentioned in the certificate
flows Packet header
string X
SSL Protocol Version
ssl_protocol_version
Indicates which SSL/TLS protocol was chosen by the server for this session
flows Packet header
string X
SSL Request Size
ssl_request_size
Contains the total length in bytes of the request or the response (including SSL headers); this attribute is computed at the end of the request or response
flows Packet header
integer
X
SSL Server Name
ssl_server_name
The host that performs the server role in the SSL session, as identified in the Client Hello message
flows Packet header
string X
SSL Subject Alt Name
ssl_subject_alt_name
Identifies a list of host names that belong to the same certificate
flows Packet header
URL X
SSL Supported Next Protocol
ssl_supported_next_protocol
Supported protocol on top of SSL, specified by the server in the Next Protocol Negotiation TLS extension
flows Packet header
string X
63

Administration and CentralManager Guide SecurityAnalytics 8.1.3
Report Attribute Description Namespace Source Format Num/Len New
SSL Version
ssl_version Protocol version: v2, v3 flows Packet header
string X
TLS Heartbleed Attack Attempted
tls_heartbeat_attack_attempt
Number of sessions in which the payload_length field of the heartbeat_request does not match the (D)TLSPlaintext.length field ; this attribute cannot be disabled
flows Metadata indexer
binary
TLS Heartbleed Mismatch
tls_heartbeat_mismatch
Number of sessions in which the heartbeat_request and heartbeat_response payloads are not equal in length ; this attribute cannot be disabled
flows Metadata indexer
binary
n Encrypted Heartbleed Attacks — If a "Heartbleed" attack is contained within anencryptedheartbeat message, the tls_heartbeat_attack_attemptattribute cannot detect it; however, a successful attempt will be detected by tls_heartbeat_mismatch
FileReport Attribute Description Namespace Source Format Num/Len
Detected File Type
file_type Derived from the file_type field in the headers for HTTP, IMAP, POP3, and SMTP. See Detected File Types.
flows Metadata indexer
string X
File Extension
file_extension
File extensions derived from the filename field ; this attribute cannot be disabled
flows string
File Name filename File name flows string X
FTP Method
ftp_method FTP commands such as PASS, USER, RETR, and OPTS
flows Packet header
string X
Fuzzy Hash *
fuzzy_hash Fuzzy hash of the artifact groups Rules engine + extractor
hex
MD5 Hash *
md5_hash MD5 hash of the artifact groups Rules engine + extractor
hex
Presented MIME Type
mime_type Content type of the request or the web page flows Packet header
string X
SHA1 Hash *
sha1_hash SHA1 Hash of the artifact groups Rules engine + extractor
hex
SHA256 Hash *
sha256_hash
SHA256 Hash of the artifact groups Rules engine + extractor
hex
64

Administration and CentralManager Guide SecurityAnalytics 8.1.3
Report Attribute Description Namespace Source Format Num/Len
SMB Command
smb_command
Command number use flows Packet header
integer
X
SMB Command String
smb_command_string
Command name flows Packet header
string X
SMB Dialect
smb_dialect
The version of the SMB Protocol flows Packet header
string X
SMB Dialect Index
smb_dialect_index
Index of the selected SMB Protocol version flows Packet header
integer
X
SMB Domain
smb_domain Domain name flows Packet header
string X
SMB File Attributes
smb_file_attributes
File attributes (bit field) flows Packet header
integer
X
SMB File Chunk Data Offset
smb_file_chunk_data_offset
Offset of the transferred data flows Packet header
integer
X
SMB File Chunk Length
smb_file_chunk_len
Size of the transferred piece flows Packet header
integer
X
SMB File ID
smb_file_id
Identifier of the file affected by the command (USMB v1: 4 char; USMB v2, 32 char)
flows Packet header
hex X
SMB File Name
smb_filename
Full name of the file or directory; also included in the File Name report
flows Packet header
string X
SMB File Size
smb_filesize
Size (byte) of the transferred file flows Packet header
integer
X
SMB Loadway
smb_loadway
The file transfer way (upload or download) flows Packet header
string X
SMB Login smb_login Login of the user; also included in the Social Persona report
flows Packet header
string X
SMB Native LAN Manager
smb_native_lan_manager
The native LAN manager type flows Packet header
string X
SMB Native OS
smb_native_os
Client's operating system flows Packet header
string X
SMB Path smb_path The server/share name of the resource to which the client attempts to connect
flows Packet header
filepath
X
SMB Process ID
smb_process_id
Identifier of the process being affected by the command that follows
flows Packet header
integer
X
65

Administration and CentralManager Guide SecurityAnalytics 8.1.3
Report Attribute Description Namespace Source Format Num/Len
SMB Query ID
smb_query_id
Indexes and correlates requests and responses
flows Packet header
integer
X
SMB Query Type
smb_query_type
Indicates if the message is a request (1) or a response (2)
flows Packet header
integer
X
SMB Search Attributes
smb_search_attributes
An attribute mask used to specify the standard attributes a file must have in order to match the search
flows Packet header
integer
X
SMB Search Pattern
smb_search_pattern
The file pattern to search for flows Packet header
string X
SMB User ID
smb_user_id
User identifier (SMB USMB v1 only) flows Packet header
integer
X
SMB Version
smb_version
Protocol version flows Packet header
integer
X
VoIP ID voip_id Identifier for a VoIP conversation flows Packet header
integer
X
*
The hash reports are not populated by the DPI engine nor the metadata indexer. Hashes are calculated by the extractor under the following circumstances:
n At least one data-enrichment rule is activated — and that rule sends either a file or a file hash to one of these enrichment providers:
o File Reputation Service o ICAP o Malware Analysis o Calculate and Store Hashes o ClamAV o jsunpack-n
o YARA o Cuckoo o FireEye AX-series o Lastline File or Hash o TitaniumScale o VirusTotal File or Hash
n Fuzzy Hash Only — Fuzzy-hash reports are not populated until after you edit /etc/solera/extractor/extractord.conf as shown and then run systemctl restart solera-extractord:
# Flag to calculate the fuzzy hash calc_fuzzy_hash=1 <== Uncomment this line and set the value to 1
n Because the hash reports contain data that is calculated after the flows are sent through the rules engine, you cannot use hash attributes as valid indicators for rules. For example, md5_hash~93fd02e cannot trigger a rule; however, it can be a valid primary or advanced filter. (See "Primary Filters" on page 107, "Advanced Filters" on page 113, "Indicators" on page 129)
Enable hash calculation for manual extractions on Settings > System. (Those settings do not affect hash-related reports.)
66

Administration and CentralManager Guide SecurityAnalytics 8.1.3
n Hash Searches — When using the md5_hash, sha1_hash, and sha256_hash attributes, the match must be exact to produce a result, but for fuzzy_hash you can specify how much of the hash must match.
o Command Line Interface — /fuzzy_hash/_ge_abc123eae%2570/ will find fuzzy hashes that have a 70% or higher match. To specify a range — for example, between 70–80% — type /fuzzy_hash/_ge_abc123eae%2570_and_le_abc123eae%2580/. Note that the percent sign must be URL-encoded as %25.
o Web UI — For fuzzy_hash>=abc123eae%70 the percent sign should not be URL-encoded.
GeographicalReport Attribute Description
Namespace
Source Format Num/Le
Country Initiator
country_initiator
Location of the initiator
flows MaxMind database IP correlation . See "MaxMind City and Country Databases" on page 180.
string
Country Responder
country_responder
Location of the responder
flows MaxMind database IP correlation string
Network Layer n Initiator/Responder Fields — The field that provides the value for these attributes depends on the host’s role in
a flow: the host that sends the first SYN packet is the initiator and the host that sends the corresponding SYN+ACK packet is the responder. Also see "Flows in Security Analytics" on page 373.
Report Attribute Description Namespace Source Format Num/Len
Ethernet Initiator
ethernet_initiator ethernet_address
MAC address of session initiator
flows Frame header + metadata indexer
a9:a9:a9:a9:a9:a9
Ethernet Initiator Vendors
ethernet_initiator_vendorsethernet_address_vendors
Vendor name of the initiator NICs
flows Frame header + vendor ID file
string:a9:a9:a9
Ethernet Protocol
ethernet_protocol
Layer 3 protocol (IPv4 or IPv6)
flows Frame header
integer
Ethernet Responder
ethernet_responderethernet_address
MAC address of session responder
flows Frame header + metadata indexer
a9:a9:a9:a9:a9:a9
67

Administration and CentralManager Guide SecurityAnalytics 8.1.3
Report Attribute Description Namespace Source Format Num/Len
Ethernet Responder Vendors
ethernet_responder_vendorsethernet_address_vendors
Vendor name of the responder NICs
flows Frame header + vendor ID file
string:a9:a9:a9
Flow Duration
flow_duration
Length of the flow in seconds; this attribute cannot be disabled
flows Metadata indexer
floating point
Flow ID flow_id Unique identifier for the flow; this attribute cannot be disabled
flows Metadata indexer
integer
Interface interface Interface the data was captured on; this attribute cannot be disabled
flows Metadata indexer
eth X imptX
IP Bad Checksums
ip_bad_csums
Number of bad checksums; best used with !=0; this attribute cannot be disabled
flows Metadata indexer
integer
IP Fragments
ip_fragments
Number of IP fragments; best used with !=0; this attribute cannot be disabled
flows Metadata indexer
integer
IP Protocol ip_protocol IP protocols used: TCP, UDP, ICMP, OSPFGP
flows Packet header
string
IPv4 Conversation
n/a IPv4 addresses of both hosts in a session; data for this report is assembled only when the report is called; this report is not visible on the Metadata Settings page and cannot be disabled
Query handler
9.9.9.9-9.9.9.9§
IPv4 Initiator ipv4_initiator ipv4_address
IPv4 addresses of hosts that initiated a session
flows Packet header + metadata indexer
9.9.9.9§
68
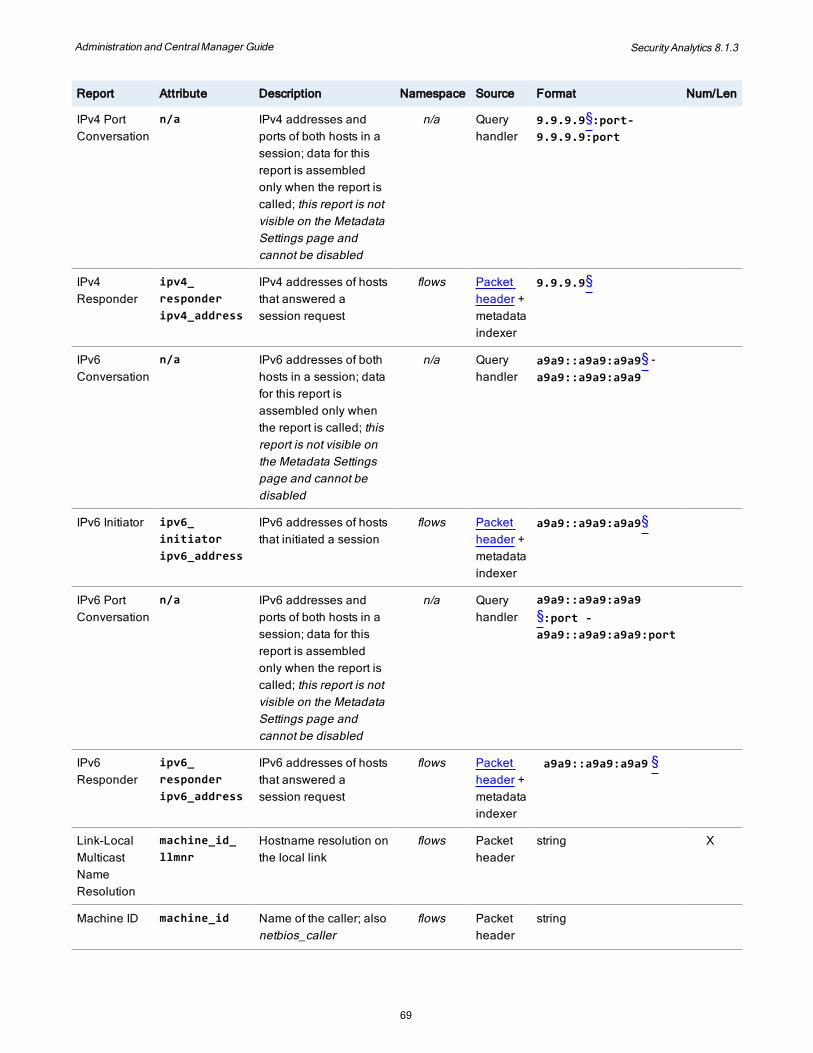
Administration and CentralManager Guide SecurityAnalytics 8.1.3
Report Attribute Description Namespace Source Format Num/Len
IPv4 Port Conversation
n/a IPv4 addresses and ports of both hosts in a session; data for this report is assembled only when the report is called; this report is not visible on the Metadata Settings page and cannot be disabled
n/a Query handler
9.9.9.9§:port- 9.9.9.9:port
IPv4 Responder
ipv4_responder ipv4_address
IPv4 addresses of hosts that answered a session request
flows Packet header + metadata indexer
9.9.9.9§
IPv6 Conversation
n/a IPv6 addresses of both hosts in a session; data for this report is assembled only when the report is called; this report is not visible on the Metadata Settings page and cannot be disabled
n/a Query handler
a9a9::a9a9:a9a9§ - a9a9::a9a9:a9a9
IPv6 Initiator ipv6_initiator ipv6_address
IPv6 addresses of hosts that initiated a session
flows Packet header + metadata indexer
a9a9::a9a9:a9a9§
IPv6 Port Conversation
n/a IPv6 addresses and ports of both hosts in a session; data for this report is assembled only when the report is called; this report is not visible on the Metadata Settings page and cannot be disabled
n/a Query handler
a9a9::a9a9:a9a9 §:port - a9a9::a9a9:a9a9:port
IPv6 Responder
ipv6_responder ipv6_address
IPv6 addresses of hosts that answered a session request
flows Packet header + metadata indexer
a9a9::a9a9:a9a9 §
Link-Local Multicast Name Resolution
machine_id_llmnr
Hostname resolution on the local link
flows Packet header
string X
Machine ID machine_id Name of the caller; also netbios_caller
flows Packet header
string
69

Administration and CentralManager Guide SecurityAnalytics 8.1.3
Report Attribute Description Namespace Source Format Num/Len
NBNS Query nbns_query NetBIOS name server query sent
flows Packet header
string X
NBNS Query Type
nbns_query_type
NetBIOS name server query type
flows Packet header
string X
NBNS Service
nbns_service
NetBIOS name server service name
flows Packet header
string X
NetBIOS Callee
netbios_callee
Name of the called member
flows Packet header
string X
NetBIOS Caller
netbios_caller
Name of the caller; also the Machine ID report
flows Packet header
string X
NetBIOS Command
netbios_command
Message command value
flows Packet header
string X
NetBIOS Message Type
netbios_message_type
The message type flows Packet header
string X
Packet Length
packet_length
The length of the packets captured
packets Frame header
integer
Port Initiator port_initiator port
Port of sending application
flows Packet header
integer
Port Responder
port_responder port
Port of responding application
flows Packet header
integer
Size in Bytes bytes Number of bytes in the flow
flows Metadata indexer
integer
Size in Packets
packets Number of packets in the flow
flows Metadata indexer
integer
Syslog Message
syslog_syslog_message
Syslog message body flows Payload string X
TCP Initiator tcp_initiator tcp_port port
TCP port of initiating application
flows Packet header
integer
TCP Responder
tcp_responder tcp_port port
TCP port of responding application
flows Packet header
integer
70

Administration and CentralManager Guide SecurityAnalytics 8.1.3
Report Attribute Description Namespace Source Format Num/Len
Tunnel Initiator
tunnel_initiator_ip
IPv4 or IPv6 of the GRE tunnel initiator; this attribute cannot be disabled. See "Encapsulation Detection" on page 181.
flows Packet header
9.9.9.9 § a9a9::a9a9:a9a9
Tunnel Responder
tunnel_responder_ip
IPv4 or IPv6 of the GRE tunnel responder; this attribute cannot be disabled
flows Packet header
9.9.9.9 § a9a9::a9a9:a9a9
UDP Initiator udp_initiator udp_port port
UDP port of initiating application
flows Packet header
integer
UDP Responder
udp_responder udp_port port
UDP port of responding application
flows Packet header
integer
VLAN ID vlan_id Virtual LAN ID; this attribute cannot be disabled
flows Frame header
integer
§ For IPv4 and IPv6 networks you can input CIDR notation as follows:
n 198.51.*.* n 198.51.0.0_16 n 198.51.0.0/16 n 2001::/31
SCADA
To select all of the attributes for a particular protocol, select its check box.
Report Attribute Description Namespace Source Format Num/Len New
CIP Add Status Size
cip_add_status_size
Number of 16-bit words in the additional status array
flows Packet header
integer X X
CIP Attr CCV cip_attr_ccv Value modified each time any nonvolatile attribute is altered; it can be a CRC or a counter, for instance
flows Packet header
integer X X
71

Administration and CentralManager Guide SecurityAnalytics 8.1.3
Report Attribute Description Namespace Source Format Num/Len New
CIP Attr Device Type
cip_attr_device_type
The device profile that a particular product is using
flows Packet header
integer X X
CIP Attr Heartbeat
cip_attr_heartbeat
Sets the nominal interval between production of optional heartbeat messages
flows Packet header
integer X X
CIP Attr Product Code
cip_attr_product_code
A particular product within a device type of an individual vendor
flows Packet header
integer X X
CIP Attr Product Name
cip_attr_product_name
Description of the product/product family represented by the product code; the same product code may have a variety of product names
flows Packet header
string X X
CIP Attr Rev Major
cip_attr_rev_major
The major revision of the item the identity object is representing
flows Packet header
integer X X
CIP Attr Rev Minor
cip_attr_rev_minor
The minor revision of the item the identity object is representing
flows Packet header
integer X X
CIP Attr Serial Number
cip_attr_serial_number
Number used in conjunction with the vendor ID to form a unique identifier for each device on any CIP network
flows Packet header
integer X X
CIP Attr State cip_attr_state
An indication of the present state of the device
flows Packet header
integer X X
CIP Attr Status
cip_attr_status
The current status of the entire device flows Packet header
integer X X
CIP Attr Vendor ID
cip_attr_vendor_id
A unique number assigned to the various vendors of products
flows Packet header
integer X X
CIP Ekey Device Type
cip_ekey_device_type
The device type in the electronic key flows Packet header
integer X X
CIP Ekey Vendor ID
cip_ekey_vendor_id
The vendor in the electronic key flows Packet header
integer X X
CIP Number of Services
cip_number_of_services
The number of services contained within the CIP message (request and reply)
flows Packet header
integer X X
CIP Path Logical Seg Class Value
cip_path_logical_seg_class_value
Class type of the logical segment (lower byte first)
flows Packet header
integer X X
CIP Path Logical Seg Format
cip_path_logical_seg_format
The format of the logical segment flows Packet header
integer X X
CIP Path Logical Seg Type
cip_path_logical_seg_type
The type of logical segment flows Packet header
integer X X
CIP Path Seg Type
cip_path_seg_type
The type of path segment flows Packet header
integer X X
72

Administration and CentralManager Guide SecurityAnalytics 8.1.3
Report Attribute Description Namespace Source Format Num/Len New
CIP Reply Service Code
cip_reply_service_code
Service code that has been sent by the request
flows Packet header
integer X X
DNP3 AL Confirm
dnp3_al_con Confirm application-layer control flag packets Packet header
binary X
DNP3 AL Control
dnp3_al_control
Application-layer control flags byte packets Packet header
integer X
DNP3 AL Final
dnp3_al_final Final application-layer control flag packets Packet header
binary X
DNP3 AL First
dnp3_al_first First application-layer control flag packets Packet header
binary X
DNP3 AL Function Code
dnp3_al_function_code
Function code, identifying the type of message at the application layer
packets Packet header
integer X
DNP3 AL IIN1
dnp3_al_iin1 First byte of the DNP3 Internal Indication (IIN) 16-bit word, set by a slave station to indicate states and diagnostic results
packets Packet header
integer X
DNP3 AL IIN2
dnp3_al_iin2 Second byte of the DNP3 Internal Indication (IIN) 16-bit word, set by a slave station to indicate states and diagnostic results
packets Packet header
integer X
DNP3 AL Obj Qualifier Field
dnp3_al_obj_qualifier_field
Byte specifying the range of the first object. Only the first object is handled
packets Packet header
integer X
DNP3 AL Obj Type Field
dnp3_al_obj_type_field
First object type in the application-layer control field. Only the first object is handled
packets Packet header
integer X
DNP3 AL Sequence
dnp3_al_sequence
Sequence number of an application message fragment
packets Packet header
integer X
DNP3 AL Unsolicited
dnp3_al_uns Unsolicited application-layer control flag packets Packet header
binary X
DNP3 DL Control
dnp3_dl_control
Data link-layer frame control byte packets Packet header
integer X
DNP3 DL CRC
dnp3_dl_crc CRC checksum field packets Packet header
integer X
DNP3 DL Destination
dnp3_dl_destination
Destination address of the frame packets Packet header
integer X
DNP3 DL Direction
dnp3_dl_direction
Physical transmission direction control flag
packets Packet header
binary X
DNP3 DL Frame Count Bit
dnp3_dl_fcb Frame Count Bit data link-layer control flag
packets Packet header
binary X
73

Administration and CentralManager Guide SecurityAnalytics 8.1.3
Report Attribute Description Namespace Source Format Num/Len New
DNP3 DL Frame Count Valid
dnp3_dl_fcv Frame Count Valid data link-layer control flag
packets Packet header
binary X
DNP3 DL Function Code
dnp3_dl_function_code
Function Code identifying the frame type at the data-link layer
packets Packet header
integer X
DNP3 DL Function Code Name
dnp3_dl_function_code_name
Function code name, corresponding to the DL Function Code
packets Packet header
integer X
DNP3 DL Invalid Codes
dnp3_invalid_codes
Invalid-message error codes packets Packet header
integer X
DNP3 DL Length
dnp3_dl_length
DNP3 frame length packets Packet header
integer X
DNP3 DL Primary
dnp3_dl_prm Primary data link-layer control flag packets Packet header
binary X
DNP3 DL Source
dnp3_dl_src Source address of the frame packets Packet header
integer X
DNP3 DL Start Sync
dnp3_dl_start_sync
Header start magic field packets Packet header
integer X
DNP3 TL Control
dnp3_tl_control
Transport-layer control flag byte packets Packet header
integer X
DNP3 TL Final
dnp3_tl_final Final transport-layer control flag packets Packet header
binary X
DNP3 TL First
dnp3_tl_first First transport-layer control flag packets Packet header
binary X
DNP3 TL Sequence
dnp3_tl_seq Frame-sequence number field packets Packet header
integer X
ENIP Command
enip_command Command code that has been sent by the request
flows Packet header
integer X X
ENIP CSD CPF Data Item Count
enip_csd_cpf_data_item_count
Number of items to follow in the packet flows Packet header
integer X X
ENIP CSD CPF Item Length
enip_csd_cpf_item_length
Size of the encapsulated item flows Packet header
integer X X
ENIP CSD CPF Item Type ID
enip_csd_cpf_item_type_id
Type of encapsulated item flows Packet header
integer X X
ENIP CSD Interface Handle
enip_csd_interface_handle
Communications interface ID flows Packet header
integer X X
74

Administration and CentralManager Guide SecurityAnalytics 8.1.3
Report Attribute Description Namespace Source Format Num/Len New
ENIP CSD Timeout
enip_csd_timeout
Timeout in seconds used by routers flows Packet header
integer X X
ENIP Data Item Count
enip_data_item_count
Number of items to follow in the packet flows Packet header
integer X X
ENIP Data Length
enip_data_length
Length in bytes of command data section
flows Packet header
integer X X
ENIP Data Type ID
enip_data_type_id
Type of encapsulated item flows Packet header
integer X X
ENIP Declassify Override
enip_declassify_override
Specifies whether the current session path maybe be declassified
flows Packet header
integer X X
ENIP Options enip_options Options, for future use flows Packet header
integer X X
ENIP Session Handle
enip_session_handle
Session ID flows Packet header
integer X X
ENIP Status enip_status Status code flows Packet header
integer X X
MODBUS AND Mask
modbus_and_mask
AND mask applied when writing the data of the register
packets Packet header
integer X
MODBUS Byte Count
modbus_byte_count
The number of data bytes to follow packets Packet header
integer X
MODBUS Coil Status
modbus_coil_status
Status code of the coil. packets Packet header
binary X
MODBUS Event Count
modbus_event_count
Event counter packets Packet header
integer X
MODBUS Events
modbus_events Data containing statuses of MODBUS send or receive operations
packets Packet header
string X
MODBUS Exception Code
modbus_exception_code
The extraction of the exception code specifies that the function code is an exception function code; the value specifies the type of error
packets Packet header
integer X
MODBUS FIFO Count
modbus_fifo_count
Quantity of data registers in the queue packets Packet header
integer X
MODBUS FIFO Pointer Address
modbus_fifo_pointer_address
Queue content address packets Packet header
integer X
MODBUS File Number
modbus_file_number
Identifier of the file packets Packet header
integer X
MODBUS File Response Length
modbus_file_resp_length
File length packets Packet header
integer X
75

Administration and CentralManager Guide SecurityAnalytics 8.1.3
Report Attribute Description Namespace Source Format Num/Len New
MODBUS Function Code
modbus_function_code
The kind of action to perform. The values indicates the public function codes used for classification
packets Packet header
integer X
MODBUS Function Subcode
modbus_function_subcode
Specifies the MODBUS function code action. See SCADA Function Codes.
packets Packet header
integer X
MODBUS Invalid Codes
modbus_invalid_codes
Error code when reading a specific MODBUS function
packets Packet header
integer X
MODBUS Length
modbus_length A byte count of the following fields, including the unit identifier and data fields
packets Packet header
integer X
MODBUS MEI Type
modbus_mei_type
MODBUS encapsulated interface transport unique number
packets Packet header
integer X
MODBUS Message Count
modbus_message_count
Quantity of messages processed by the remote device
packets Packet header
integer X
MODBUS OR Mask
modbus_or_mask
OR mask applied when writing the data of the register
packets Packet header
integer X
MODBUS Output Address
modbus_output_address
The data address of the coil or register packets Packet header
integer X
MODBUS Output Data
modbus_output_data
Exception status outputs, packed into one byte (one bit per output)
packets Packet header
integer X
MODBUS Output Value
modbus_output_value
Value to write packets Packet header
string X
MODBUS Outputs Value
modbus_outputs_value
Requested ON/OFF coil states packets Packet header
integer X
MODBUS PDU
modbus_pdu The protocol data unit is defined by the function code and the data fields
packets Packet header
integer X
MODBUS Protocol ID
modbus_protocol_id
MODBUS protocol is identified by the value 0
packets Packet header
integer X
MODBUS Quantity of Coils
modbus_quantity_of_coils
Total number of coils requested packets Packet header
integer X
MODBUS Quantity of Outputs
modbus_quantity_of_outputs
The number of coils or registers to write packets Packet header
integer X
MODBUS Read Registers Value
modbus_read_registers_value
Register value packets Packet header
string X
76
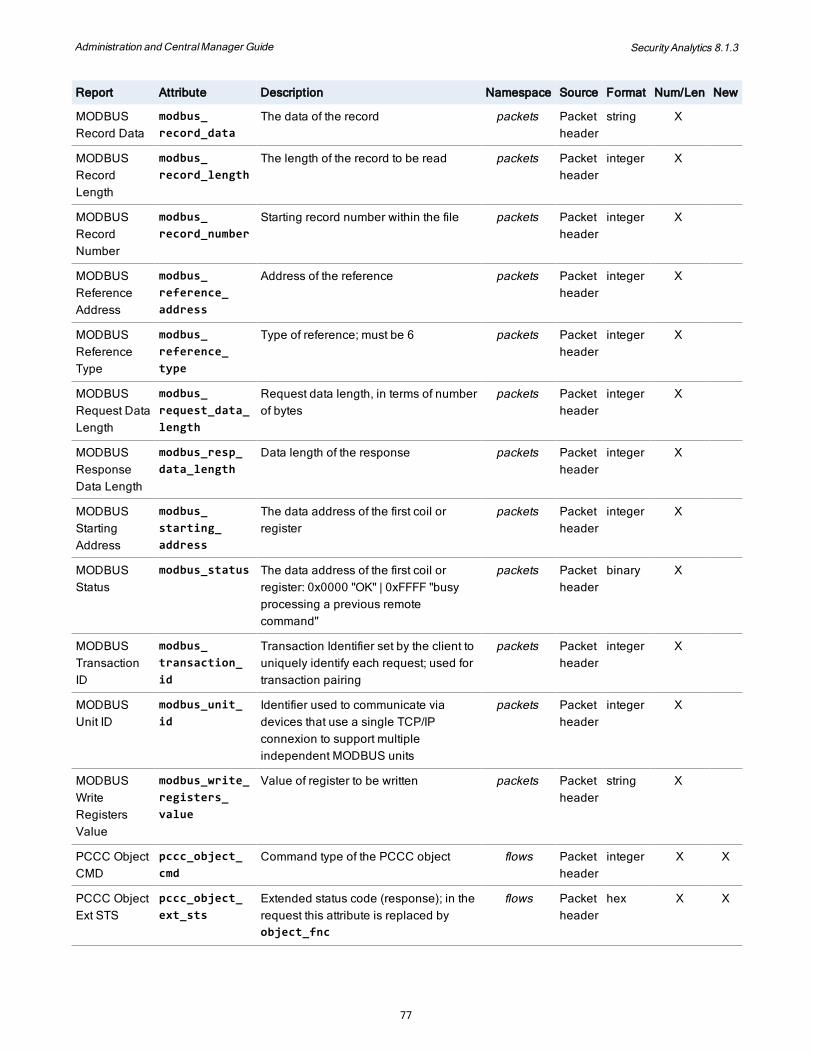
Administration and CentralManager Guide SecurityAnalytics 8.1.3
Report Attribute Description Namespace Source Format Num/Len New
MODBUS Record Data
modbus_record_data
The data of the record packets Packet header
string X
MODBUS Record Length
modbus_record_length
The length of the record to be read packets Packet header
integer X
MODBUS Record Number
modbus_record_number
Starting record number within the file packets Packet header
integer X
MODBUS Reference Address
modbus_reference_address
Address of the reference packets Packet header
integer X
MODBUS Reference Type
modbus_reference_type
Type of reference; must be 6 packets Packet header
integer X
MODBUS Request Data Length
modbus_request_data_length
Request data length, in terms of number of bytes
packets Packet header
integer X
MODBUS Response Data Length
modbus_resp_data_length
Data length of the response packets Packet header
integer X
MODBUS Starting Address
modbus_starting_address
The data address of the first coil or register
packets Packet header
integer X
MODBUS Status
modbus_status The data address of the first coil or register: 0x0000 "OK" | 0xFFFF "busy processing a previous remote command"
packets Packet header
binary X
MODBUS Transaction ID
modbus_transaction_id
Transaction Identifier set by the client to uniquely identify each request; used for transaction pairing
packets Packet header
integer X
MODBUS Unit ID
modbus_unit_id
Identifier used to communicate via devices that use a single TCP/IP connexion to support multiple independent MODBUS units
packets Packet header
integer X
MODBUS Write Registers Value
modbus_write_registers_value
Value of register to be written packets Packet header
string X
PCCC Object CMD
pccc_object_cmd
Command type of the PCCC object flows Packet header
integer X X
PCCC Object Ext STS
pccc_object_ext_sts
Extended status code (response); in the request this attribute is replaced by object_fnc
flows Packet header
hex X X
77

Administration and CentralManager Guide SecurityAnalytics 8.1.3
Report Attribute Description Namespace Source Format Num/Len New
PCCC Object FNC
pccc_object_fnc
Function code related to the command type (request); in the reponse this attribute is replaced by object_ext_sts
flows Packet header
hex X X
PCCC Object STS
pccc_object_sts
Status of the PCCC object; it should be always 0x00 for a request message
flows Packet header
hex X X
PCCC Object TNS
pccc_object_tns
Transaction identifier of the PCCC object; request and related response must share the same TNS value
flows Packet header
integer X X
PCCC Routing Info DST Link
pccc_routing_info_dst_link
Destination link address flows Packet header
integer X X
PCCC Routing Info DST Node
pccc_routing_info_dst_node
Destination node address flows Packet header
integer X X
PCCC Routing Info SRC Link
pccc_routing_info_src_link
Source link address flows Packet header
integer X X
PCCC Routing Info SRC Node
pccc_routing_info_src_node
Source node address flows Packet header
integer X X
Social PersonaReport Attribute Description
Namespace
Source Format
Num/Len
Password password Cleartext passwords flows Packet headers, multiple protocols
string X
Social Persona
social_persona
User name of account; login
flows Packet headers, multiple protocols
string X
User Name ‡
user_name Username as identified by LCS
flows Login Correlation Service string
‡ Data for this report is available only if you are running the Login Correlation Service. (See "Login Correlation" on page 222.)
Threat Intel
Because the threat intel reports contain data that is calculated after the flows are sent through the rules engine, you cannot use threat intel attributes as valid indicators for rules. For example, malware_analysis_verdict>8 cannot trigger a rule; however, it can be a valid primary filter.
78

Administration and CentralManager Guide SecurityAnalytics 8.1.3
To populate these reports you must license and enable the data-enrichment provider mentioned in the Source column, either as a subscription or as an on-site appliance.
Report Attribute Description Namespace Source Format Num/Len
File Signature Verdict
file_signature_verdict Degree of risk of the file hash
verdicts SymantecFile Reputation Service
integer
Local File Analysis
local_file_analysis_verdict
Degree of risk of the file hash
verdicts Local File Analysis providers
integer
Malware Analysis Verdict
malware_analysis_verdict
Degree of maliciousness based on direct file analysis
verdicts Malware Analysis appliance
integer
Third-Party Verdict
third_party_integration_verdict
Degree of risk of the file hash
verdicts ReversingLabs ® TitaniumScale ® server
integer
Threat Category
threat_category Category of threat verdicts ReversingLabs TitaniumScale server
integer
Threat Description
threat_description Description of threat verdicts ReversingLabs TitaniumScale server
string
Threat Severity
threat_severity Severity of threat verdicts ReversingLabs TitaniumScale server
integer
URL Categories
url_categories Known category of the URL; this attribute cannot be disabled
verdicts Web Reputation Service
string
URL Risk Verdict
url_risk_verdict Degree of risk of the URL; this attribute cannot be disabled
verdicts Calculated by Security Analytics
integer
When inputting a verdict attribute in the filter bar, use the numerical values for these text equivalents.
Value Text Equivalent
1 Very Low Risk
2
3 Low Risk
4
5 Unknown/Unrated
79

Administration and CentralManager Guide SecurityAnalytics 8.1.3
Value Text Equivalent
6 Moderate Risk
7
8 High Risk
9
10 Very High Risk
WebReport Attribute Description Namespace Source Format Num/Len
HTTP and Email URIs
uri URIs extracted from HTTP and email artifacts
flows Payload URI X
HTTP Auth Username
http_auth_username
Login used in the HTTP Authorization request extension for authentication. The supported authentication methods are Basic and Digest.
flows Packet header
string X
HTTP Code
http_code Return code sent by the server flows Packet header
integer X
HTTP Content Disposition
http_content_disposition
Information related to the disposition of the content present on the web page
flows Packet header
string X
HTTP Content Encoding
http_content_encoding
The type of encoding used on the data flows Packet header
string X
HTTP Content Length
http_content_len
The content length of the HTTP request/response
flows Packet header
integer X
HTTP Content Type
http_content_type
The MIME type of the body of POST and PUT requests
flows Request packet header
string X
HTTP Cookie
http_cookie
An HTTP cookie previously sent by the server with Set-Cookie
flows Packet header
string X
HTTP Forward Address
http_forward_addr
IPv4 DNS address to which the client is redirected. This is the HTTP header X-Forwarded: for=<ip_address>
flows Packet header
URL X
HTTP Header Name
http_header_name
Fields that are included in the HTTP header, such as Accept, Accept-Language, Referer, Content-Type, or Cache-Control
flows Packet header
string X
80

Administration and CentralManager Guide SecurityAnalytics 8.1.3
Report Attribute Description Namespace Source Format Num/Len
HTTP Header Raw
http_header_raw
Field names in the header plus the field values, such as Accept-Encoding: gzip,deflate,sdch or Keep-Alive: timeout=300, max=946
flows Packet header
string X
HTTP Header Status Line
http_header_statusline
The status line just before the header lines, such as HTTP/1.1 200 OK or GET<filepath>/<filename>HTTP/1.1
flows Packet header
string X
HTTP Header Value
http_header_value
Field values that are included in the HTTP header, independent of field names
flows Packet header
string X
HTTP Index
http_index Identifier of the request and response in an HTTP flow. The indices of a completed flow are 1 through N, with 1 being the first request, 2 being the response to the request, and N being the last transaction in the flow.
flows Packet header
integer X
HTTP Last Modified
http_last_modified
The date and time at which the origin server recorded the last modification to the file
flows Packet header
day, DD MMM YYYY hh:ii:ss ZZZ
X
HTTP Location
http_location
Destination address where the client is redirected
flows Packet header
URL X
HTTP Method
http_method
HTTP command sent by the client: GET, POST, HEAD, CONNECT, and so on
flows Packet header
string X
HTTP NTLM Domain
http_ntlm_domain
Domain attribute of the NT LAN Manager protocol; included in the HTTP Authentication field
flows Packet header
string X
HTTP NTLM User
http_ntlm_user
User attribute of the NT LAN Manager protocol; included in the HTTP Authentication field
flows Packet header
string X
HTTP NTLM Workstation
http_ntlm_workstation
Workstation attribute of the NT LAN Manager protocol; included in the HTTP Authentication field
flows Packet header
string X
HTTP Part Header Name
http_part_header_name
Fields that are included in the HTTP part header, such as Accept, Accept-Language, Referer, Content-Type, or Cache-Control; extracted only if Content-Type is multipart
flows Packet header
string X
HTTP Part Header Value
http_part_header_value
Field values that are included in the HTTP part header, independent of field names; extracted only if Content-Type is multipart
flows Packet header
string X
81

Administration and CentralManager Guide SecurityAnalytics 8.1.3
Report Attribute Description Namespace Source Format Num/Len
HTTP Post Variable Decoded
http_post_variable_decoded
The 'name/value' metadata from each web-form CGI parameter found in a POST HTTP request. The name and value strings are normalized. The parameters are extracted from the URL of the request, and/or from the x-www-form-urlencodedPOST data.
flows Packet header
string X
HTTP Proxy Auth
http_proxy_auth
Authentication type on the proxy: basic, digest, NTLM
flows Packet header
string X
HTTP Proxy Login
http_proxy_login
Authentication credentials flows Packet header
string X
HTTP Referrer
referer The address of the previous web page from which a link to the currently requested page was followed; was "Referrer" in versions previous to 7.3.2
flows Packet header
URL X
HTTP Server
http_server
The FQDN of the server flows Packet header
URL X
HTTP Server Agent
web_server Server type: Apache, IIS, nginx; was "Web Server" in versions previous to 7.3.2
flows Packet header
string X
HTTP Set Cookie
http_set_cookie
Contains a cookie stored by the server (Set-Cookie)
flows Packet header
string X
HTTP URI http_uri The domain name of the server plus the path to the file
flows Packet header
URI X
HTTP User Agent
user_agent Software used by the client to access the web page
flows Packet header
string X
Web Query web_query Database query flows Packet header; multiple protocols
string X
Integrated Cyber Defense Exchange (ICDx)New in Security Analytics 8.1.1
Symantec Integrated Cyber Defense Exchange (ICDx) is an open platform that gives you control over your enterprise security data: how much you collect, how long you retain it, and where it resides. It also provides a standard, cross-product schema for analytics, reports, and dashboards.
ICDx integrates Symantec enterprise security products by:
n Collecting events from Symantec Integrated Cyber Defense products
n Normalizing the collected events to the Integrated Cyber Defense Schema
82

Administration and CentralManager Guide SecurityAnalytics 8.1.3
n Filtering and forwarding the collected events to different customer destinations, such as RabbitMQ, Splunk, Elasticsearch, or ServiceNow
On the ICDx server you must create at least one exchange of type AMQP to receive Security Analytics metadata.
There are two ways to send metadata to an ICDx server from Security Analytics:
n ICDx Metadata Forwarding — Send selected metadata for all traffic
n ICDx Remote Notifications — Send alert metadata for traffic that matches a rule
ICDx Metadata ForwardingIn this use case you select metadata attributes to send, and then Security Analytics sends those attributes, for all traffic, to the ICDx server. The metadata is marked with "Informational" severity. Each individual event on the ICDx server represents a distinct flow.
To send selected metadata for all traffic to an ICDx server, follow these steps:
1. "Select the Metadata to Export" below
2. "Specify the ICDx Server" on the next page
Select the Metadata to Export
Follow these steps to select which metadata to export to the ICDx server.
1. Select Settings > ICDx Metadata.
2. Review the metadata attributes to ensure that the metadata you want is visible on this page. (The aggregate_<X>_hooks items are often drawn from multiple attributes.) The following attributes are enabled by default and cannot be disabled:
n start_time
n stop_time
n flow_id
n initiator_ip
n responder_ip
n initiator_port
n responder_port
3. If you do not see the desired metadata attributes, go to Settings > Metadata and select the desired attributes.
83

Administration and CentralManager Guide SecurityAnalytics 8.1.3
When you save new metadata attributes on that page the appliance automatically reboots.
Only attributes in the flows namespace will appear on the ICDx Metadata page. Consult "Metadata Settings" on page 56 to see the namespace for each attribute.
4. On the ICDx Metadata page select the desired attributes. Do not click Save yet.
Specify the ICDx Server
Follow these steps to configure the ICDx server for this function. These are not the same server settings as are on the Communication Settings page.
1. On Settings > ICDx Metadata select the Enable ICDx check box.
2. Under Integrated Cyber Defense Exchange (ICDx) Settings input the username and password to access the server.
3. Select Use SSL Encryption to encrypt traffic to the ICDx server.
4. Select Verify Server Certificate to perform a certificate check on the ICDx server. If you select this option you must upload the certificate authority bundle for the ICDx server on Settings > Security > PKI and SSL > Additional Certificate Authority Bundle.
5. Specify the IP or hostname of the ICDx server as well as the port. Default: 5672 for unencrypted or 5671 for encrypted.
6. For Exchange specify an exchange on the ICDx server.
7. Click Test Server Settings.
8. If the test is successful click Save. Security Analytics begins to send the metadata to the ICDx server.
n To stop the flow of metadata clear the Enable ICDx check box and click Save.
Metadata for Each Flow
The example below shows the JSON-formatted data that is sent for each flow. The pivot URL is valid only for sensors that are connected to a CMC: copy pivot_url to a browser to view the flow through the sensor's first CMC.
{ "log_name": "<log name>", "timezone": <integer>, "type_id": <integer>, "product_data": { "flow_id": "<integer>", "start_time": "<epoch>.999999999", "stop_time": "<epoch>.999999999", "<attribute1>": "<value1>", "<attribute2>": "<value2>", ... "<attributeN>": "<valueN>",
84

Administration and CentralManager Guide SecurityAnalytics 8.1.3
"pivot_url": "https://<SA hostname>/deepsee#{\"ac\":\"Summary\",\"ca\":{\"start\":<epoch>,\"end\":<epoch>},\"pb\":[\"flow_id=<integer>\"],\"icdx\":{\"cmc_pivot\":1}}" }, "product_name": "Symantec Security Analytics", "uuid": "<uuid>", "ref_uid": "<flow ID>", "log_time": "YYYY-MM-DDThh:ii:ss.zzzZ", "product_ver": "Solera release 8.1.3 (8.1.3_99999)", "device_ip": "<SA ip>", "device_name": "<SA hostname>", "category_id": <integer>, "connection": { "dst_ip": "<ip>", "dst_port": <port>, "src_ip": "<ip>", "src_port": <port> }, "id": <integer>, "severity_id": <integer> }
ICDx Remote NotificationsIn this use case you send alert metadata to the ICDx server only for traffic that matches a rule. The metadata that is sent to the ICDx server is not the metadata that is present on the ICDx Metadata page; rather, it is controlled by the default ICDx template (see "Default Template Output" on page 246) or by an ICDx template that you create. None of the settings on the ICDx Metadata page are connected to these remote notifications.
To send alert metadata to an ICDx server you must follow these steps:
1. "Specify the ICDx Server" below
2. "Select a Template" on the next page
3. "Create Rules for Data to Export" on the next page
Specify the ICDx Server
Follow these steps to configure the ICDx server for this function. These are not the same server settings as on the ICDx Metadata page.
1. Select Settings > Communication.
2. Under Integrated Cyber Defense Exchange (ICDx) Settings input the username and password to access the server.
3. Select Use SSL Encryption to encrypt traffic to the ICDx server.
4. Select Verify Server Certificate to perform a certificate check on the ICDx server. If you select this option you must upload the certificate authority bundle for the ICDx server on Settings > Security > PKI and SSL > Additional Certificate Authority Bundle.
85

Administration and CentralManager Guide SecurityAnalytics 8.1.3
5. Specify the IP or hostname of the ICDx server as well as the port. Default: 5672 for unencrypted or 5671 for encrypted.
6. For Exchange specify an exchange on the ICDx server.
7. Click Test Server Settings.
8. If the test is successful click Save at the bottom of the page.
Select a Template
Follow these instructions to specify the format of the data that you export to ICDx.
n Review the default ICDx Template output on "Default Template Output" on page 246 to verify that it suits your needs.
n If you would like to send different metadata, select Settings > Communication > Templates > New and follow the instructions in "Choose or Create a Template" on page 245.
Create Rules for Data to Export
Follow these steps to create rules that export data to ICDx.
1. Select Analyze > Indicators. Determine whether existing indicators specify the type of traffic that you want to match. If they do not, select Actions > New to create new indicators. See "Indicators" on page 129 for more information.
2. Select Analyze > Rules and click New.
3. Specify a name for the rule and populate First Event with the indicator(s) that you have chosen for this rule.
4. Optional — Select Open Parser. See "Open Parser" below for instructions.
5. Select the rule type. (See "Rules" on page 230 for more information.) Select None if you do not want any other action performed on the traffic that matches this rule.
6. Specify whether to share this rule with other users of this appliance. Once you set this attribute you cannot change it.
7. Under Remote Notifications select ICDx, select the ICDx template to use, and click Save. The rule is enabled by default when it is created.
The number of alerts produced on the Security Analytics appliance may be smaller than the alerts on the ICDx server. Security Analytics counts as one alert an alert that had one parent and three child alerts, but on ICDx it may be counted as three alerts.
Open ParserUse the open parser to create customized reports and report widgets that you can use in the same way as other Security Analytics reports. With the open parser you can include regular expressions in rule definitions as well as user-
86

Administration and CentralManager Guide SecurityAnalytics 8.1.3
defined Lua scripts.
Open parser rules can consume considerable system resources by generating a large number of rule hits. Use indicators that detect the smallest amount of network traffic possible.
Open Parser ConventionsKeep the following in mind when using the open parser:
n Regular expressions must be RE2-compliant.
n The operator between regex lines is OR.
n The open parser rule name is converted into a report name by making all letters lower-case and replacing all spaces with an underscore. For example, Phone Numbers becomes phone_numbers.
n An open parser report is available only when its corresponding rule is active.
n New in Security Analytics 8.1.1 Lua scripts must conform to the following rules:
o Must have the .lua extension.
o Must not contain a function that is not whitelisted. The following functions are whitelisted:
87

Administration and CentralManager Guide SecurityAnalytics 8.1.3
assert coroutine.create coroutine.resume coroutine.running coroutine.status coroutine.wrap error ipairs math.abs math.acos math.asin math.atan math.atan2 math.ceil math.cos math.cosh math.deg math.expmath.floor math.fmod
math.frexp math.huge math.ldexp math.log math.log10 math.max math.min math.modf math.pi math.pow math.rad math.random math.sin math.sinh math.sqrtmath.tan math.tanh next OpenParser.setCallback OpenParser.setFlowEndCallback
OpenParser.createMeta OpenParser.createAlert OpenParser.classify OpenParser.getFlowData OpenParser.payloadToString OpenParser.findStringInPayload os.clock os.difftime os.time os.date pairs pcall select string.byte string.char string.find string.format string.gmatch string.gsub
string.lenstring.lower string.match string.rep string.reverse string.sub string.upper table.foreach table.insert table.maxn table.remove table.sort tonumber tostring type unpack _VERSION xpcall
Create an Open-Parser Rule
1. Select Menu > Analyze > Rules and click New.
2. For Name, specify a unique name for the rule. It must begin with a letter, must not exceed 60 characters, and cannot be the same as an existing report name. (See " Metadata Tables" on page 58.)
3. For First Event, specify one or more indicators or create new indicators. (See "Indicators" on page 129.)
Do not click Add Second Event. Multiple events are not supported with the open parser.
4. Select the Open Parser check box.
5. For Regular Expressions, type or paste a regular expression and click Add. The expression is copied to the space below. You may add up to eight expressions, and each expression must not exceed 1024 characters.
n To delete an expression, select it and click Remove.
6. For Metadata Options, select one of the following:
88

Administration and CentralManager Guide SecurityAnalytics 8.1.3
n Select Add flag to metadata — A Boolean is written to the indexing database entry to indicate that the flow matches the regular expression. The report shows how many flows are Matched but does not contain the matching values.
n Select Add matching value to metadata — The values that match the regular expression are written to the indexing database, where they are visible in the report.
n Select Add succeeding value to metadata, until this delimiter — The characters that come after the string that matches the regular expression, up to the RE2-compliant delimiter, are written to the indexing database, where they are visible in the report.
n Select Take no action — No values are written to the indexing database. A report will be available for this rule but it will never contain data.
n Select Execute Lua script — Click Browse to select a Lua script to execute when the regular expression is matched.
o Click Download Script to download a Lua script that is already uploaded.
When a Lua script is uploaded to an open-parser rule, the script is executed for validation purposes before the rule is saved. If the GUI stops responding, it means that the script contains an error that prevents it from being validated; for example, it contains an os.execute command or non-zero exit codes.
n For Type, select the rule type and click the corresponding link for instructions on completing the rule:
o "Alert Rule" on page 233
o "Data-Enrichment Rule" on page 233
o "PCAP Export Rule" on page 235
o "IPFIX Export Rule" on page 235
o ""None" Rule" on page 236
89

Administration and CentralManager Guide SecurityAnalytics 8.1.3
View the Report Data
Select Menu > Analyze > Summary and click the Reports tab. Reports that contain data from active open parser rules are available under Custom Analytics.
Select Menu > Analyze > Summary > Reports and select Application > Application ID. The rule name is present to show that data from the rule was generated during the timespan.
90

Administration and CentralManager Guide SecurityAnalytics 8.1.3
Click the entry to add the rule to an application_id filter to help you locate the artifact that matched the rule.
Add the Open Parser Report Widget to a Summary View
1. Select Menu > Analyze > Summary. Select an existing view or create a new view where the widget will be displayed.
2. Select Actions > Add/Edit Widgets. From the Available Reports list, select the custom analytics report, move it to the Selected Reports list, and click Add/Edit Widgets.
Open Parser AlertsAn alert from an open-parser rule shows the regular expression that triggered the alert.
91

Administration and CentralManager Guide SecurityAnalytics 8.1.3
To see the value that matched the regular expression, click View Report Summary and select a view that contains the report widget that corresponds to the rule. When you pivot from an alert to a widget, the widget displays all of the matching values that are present in the same flow.
PII Reports ExampleThis example shows how to create open-parser rules to find personally identifiable information (PII) in HTTP and EML files and then display the PII in reports.
Create an indicator
1. Select Menu > Analyze > Indicators and select Actions > New.
2. Create an indicator named HTTP with the filter application_group=web
3. Verify that the Email indicator exists on the appliance (application_group="Mail", application_group="Webmail").
The HTTP and Email indicators will detect a large amount of traffic. For your network, you may want to add more indicators to exclude traffic that is unlikely to contain PII.
Create the rule
Create an open-parser rule that extracts likely phone numbers.
92

Administration and CentralManager Guide SecurityAnalytics 8.1.3
1. Select Menu > Analyze > Rules and click New.
2. Create a rule named [Phone Numbers | Social Security Numbers | Credit Card Numbers] with the Email and HTTP indicators as the First Event.
3. Select the Open Parser check box. In the regular expressions field, enter the regular expression ["Phone Numbers" on the next page | "Social Security Numbers" on the next page | "Credit Card Numbers" on the next page] and click Add.
4. For Metadata Options, select Add matching value to metadata.
5. For Type select None so that no alerts are generated.
n Alternatively, if you select Alert, you can set the Importance for each rule hit.
6. Optional — Select Shared to make the rule viewable by everyone who has access to this appliance.
7. Remote Notifications — Optional — Select one or more remote-notification types. You may select the default template or configure a template on Settings > Communication > Templates. (See "Choose or Create a Template" on page 245.) Verify that the appropriate server(s) have been configured. (See "Logging and Communication" on page 306.)
n SMTP — Optional — Specify email accounts to receive the alert notifications.
93

Administration and CentralManager Guide SecurityAnalytics 8.1.3
8. Endpoint Providers — Optional — Select to send endpoint data to external endpoint analysis providers. (See "Endpoint Providers" on page 217.)
9. Click Save. The rule is displayed in the Rules list. Verify that the rule is activated .
Phone Numbers
This regular expression detects likely phone numbers in the United States and Canada.
n Name — Phone Numbers
n Regular Expression — ((?:\+?1[ .-]\s*)?(((\(\s*[2-9]\d{2}\s*\)\s*[ .-]?)|([2-9]\d{2}\s*[ .-])))\s*[2-9]((1[02-9])|([02-9]\d{1}))\s*[ .-]\s*\d{4})
Social Security Numbers
This regular expression detects likely U.S. Social Security numbers.
n Name — Social Security Numbers
n Regular Expression — ((?:[0-6]\d{2}|7([0-6]\d|7[012]))[-]\d{2}[-]\d{4})
Credit Card Numbers
This regular expression detects likely MasterCard, Visa, Discover, and American Express card numbers.
n Name — Credit Card Numbers
n Regular Expression — (4[0-9]{3}[0-9]{4}[0-9]{4}[0-9](?:[0-9]{3})?|[0-9]{4}[-][0-9]{4}[-][0-9]{4}[-][0-9]{4}|5[1-5][0-9]{2}[0-9]{4}[0-9]{4}[0-9]{4}|3[47][0-9]{13}|3(?:0[0-5]|[68][0-9])[0-9]{11}|6(?:011|5[0-9]{2})[0-9]{12}|(?:2131|1800|35\d{3})\d{11})
n Metadata Options — Select Execute Lua script and upload the following file, which can also be found on the appliance at /usr/lib64/lua/5.1/userDefined/pii_parser.lua_tmpl:
94

Administration and CentralManager Guide SecurityAnalytics 8.1.3
require"OpenParser" function callback_method(data)
local token = data[TOKEN_KEY]locallen = data[TOKEN_SIZE_KEY] -- Validate using Luhns Algoodd =0even =0total =0numdigit =0nDigits =lenreverse=string.reverse(token)
for count =0,nDigits-1do
num =0digit =tonumber(string.sub(reverse, count+1,count+1)) if digit then
numdigit = numdigit +1if((numdigit%2) ~=0)then
odd = odd + digitelse
num = digit*2if num >9then
num = num -9endeven = even + num
endend
end total = odd + even if((total %10) ==0)then
OpenParser.createMeta(token)end
end OpenParser.setCallback(callback_method)
This file must have the .lua extension before it can be uploaded.
Open Parser Data MatchingOpen parser rules run their regular expressions against the following types of fields:
n Content — Fields such as FTP:CONTENT, HTTP:CONTENT, FACEBOOK_MAIL:CONTENT, and POP3:CONTENT
n Message — Fields such as ICMP:MESSAGE, SYSLOG:MESSAGE, and GMAIL_CHAT:MESSAGE
95

Administration and CentralManager Guide SecurityAnalytics 8.1.3
n Attachments — Attachments to emails, such as GMAIL:ATTACH_CONTENT, SMTP:ATTACH_CONTENT_DECODED, and POP3:ATTACH_CONTENT
n General data — The entire data portion of a data protocol, including headers and body.
Summary Views
The Menu > Summary views in Symantec Security Analytics are collections of report widgets on a single page. Report widgets are discrete graphical elements that summarize data according to selected criteria. A collection of widgets can then be run against a user-selected time period and a user-defined set of filters. (See "Timespan Filters" on page 112, "Primary Filters" on page 107)
See "Menu > Analyze > Summary" on page 410 for a description of all page elements.
Report Widgets
Menu > Analyze > Summary
While the data is still loading for the Summary page, you may click the red Stop Reports button to stop the data from processing.
Included on Security Analytics are report widgets that correspond to the available reports. (See " Metadata Tables" on page 58.)
Select a summary view from the view selector.
96

Administration and CentralManager Guide SecurityAnalytics 8.1.3
Use the edit control to change the name, share the view, duplicate the view, or specify a view as the default.
Create a Summary ViewYou can create a new summary view from a blank view, or you can modify an existing view.
1. Select Menu > Analyze > Summary.
2. Click the view selector and select Add New View.
3. Type a name for your new view.
4. Optional — Select Use flow-based columns to permit the report widgets to adjust to the available width of the window. Clearing this check box forces the report widgets to stay in a fixed-grid location.
5. Optional — Select Shared to share the view.
6. Optional — Select Duplicate Existing View? to select a view to duplicate as the new view.
7. Optional — Select Set as default to make this the default view.
8. Click Save. You get a blank summary screen and the Add/Edit Widgets dialog box is displayed.
9. Select one or more report widgets from the Available Reports list and add them to the Selected Reports list. Press Ctrl to select more than one report, and then click the single arrow button to move them to the Selected Reports list.
97

Administration and CentralManager Guide SecurityAnalytics 8.1.3
n The more report widgets in a view, the longer it takes to load the view. For optimal performance and system integrity, limit the number of widgets to 18 per view.
n If the report widgets in the same view are from different namespaces, the reports will take longer to generate.
n Application Group includes the Application Group and the Application Group over Time widgets.
10. Click Add/Edit Widgets.
Report Widget ControlsTo reveal the report widget controls, place your cursor over the widget header.
1 Move Widget
2 Widget Settings
3 Delete Widget
98

Administration and CentralManager Guide SecurityAnalytics 8.1.3
1 Sort-by Field — Select from the widget name or bytes, packets, sessions, IP fragments, or bad checksums.
2 Order — Ascending, Descending
3 View — Table, Pie, Column, Bar
4 Resolution — Select the check box and slide the selector to the desired resolution.
The settings affect only this report widget in this view. If this report widget is present in other views, the settings on those views will be not changed.
Application Group Widgets
Two widgets — Application Group and Application Group over Time — are different from the other widgets; user configuration is limited to session-resolution settings. The Application Group widget has Bytes, Packets, and Sessions columns. The Application Group over Time widget is a histogram of the Application Group widget. Place your cursor over a data point to see the details.
When adding widgets to a view, selecting Application Group adds both the Application Group and the Application Group over Time widget to the view.
99

Administration and CentralManager Guide SecurityAnalytics 8.1.3
Apply Filters to Summary ViewsTo apply a filter to a summary view, see "Primary Filters" on page 107 and "Indicators" on page 129.
Save the Output of a Summary ViewThe output of a summary view can be saved on the appliance and viewed on the Report Status list.
1. Select Menu > Analyze > Summary and select the desired view.
2. Add, delete, and modify the report widgets as desired. Add any filters that you want.
3. Select Actions > Save in the upper-right corner of the interface.
4. Type a name for the saved output (max 300 characters).
5. If you click Save before the system has finished processing the data, you have the option to:
n Save and Stop — Save only the data that was processed before you clicked Save and Stop.
n Save and Continue — The save operation will continue until all data is processed.
6. If you click Save after Status shows Finished (100%), all of the results are saved.
7. Retrieve the saved results by selecting Analyze > Report Status > List. There is a separate report entry for each widget.
8. Click View Report to see the report in the Reports (not Summary) view.
Session ResolutionIn the Summary, Reports, and Geolocation views, the session resolution percentage is located on the status bar. The purpose of this feature is to limit reports to a subset of data, which allows quicker display of data.
Adjust Session Resolution
1. Click the session resolution value for the view.
100

Administration and CentralManager Guide SecurityAnalytics 8.1.3
2. Slide the bar to the percentage of data that you want to view.
Anomaly DetectionAlso see: "Anomaly Detection Process" on page 398.
Anomaly Detection and Modeling (ADM) provides visibility into abnormalities in your traffic patterns. By evaluating traffic in 10-minute analysis windows, ADM determines which traffic is normal for your network and then creates alerts for outlier network behavior.
Because ADM folds all received traffic into the baseline, regularly occurring "anomalies" will eventually become part of the baseline. The longer ADM runs, the fewer false positives it will register.
ADM requires an appliance or VM with at least 64 GB RAM to function properly. Less memory will result in degraded performance and missed alerts. To disable anomaly detection, select the appropriate data enrichment profile. (See "Data Enrichment Profiles" on page 49.)
Enabling Anomaly DetectionADM is automatically enabled when newly installing or upgrading to Security Analytics 7.2.x through 7.3.1.
n Beginning in version 7.3.2, ADM is not automatically enabled on new installations unless the appliance has more than 128 GB RAM. Anomaly detection is not disabled when upgrading an appliance that is already running ADM.
n It takes approximately 6 hours for ADM to establish a baseline and then begin to report anomalies. See "Anomaly Detection Process" on page 398 for more information.
To disable or enable ADM, go to Menu > Settings > Data Enrichment and select the following Profile:
n Enable
o Full Data Enrichment with Anomaly Detection
n Disable
o Full Data Enrichment (No Anomaly Detection)
o Packets Only
To enable remote notification of anomalies go to Menu > Settings > Communication > Advanced.
101

Administration and CentralManager Guide SecurityAnalytics 8.1.3
n Under Remote Notifications, select the Anomaly Events check box for Email, SNMP, or Remote Syslog, as desired. (Select the check box for Local to see anomalies in the Audit Log).
n Set up the corresponding remote notification method(s) on Settings > Communication > Server Settings.
n See the "Anomaly Notification Format" on page 105.
Anomalies PagesSelect Analyze > Anomalies to see the Anomalies pages: Summary and List.
Anomalies Summary
The Anomalies Summary page displays a series of tables that show which IP addresses, URL categories, countries, and applications have been involved in anomalous traffic. Click a value to add it to the advanced filter. (See "Advanced Filters" on page 113.)
Anomalies List
The Anomalies List displays the following (also see "Interpreting Anomaly Messages" on page 400):
1 Anomaly — Anomaly message. 7 Function — Type of operation used to detect the anomaly.
2 Time of Detection — Start time of the analysis window, which ends 10 minutes later.
8 Field — The attribute that is to be analyzed as a metric.
3 Score — Amount of deviation from the baseline on a scale of 0–9; higher numbers indicate greater deviation.
9 Over Field — The initiator or responder IP that is associated with the anomalous activity. (For the URL categories anomaly this is a By Field, which is a specific value of the field that analyzed as a metric.)
102

Administration and CentralManager Guide SecurityAnalytics 8.1.3
4 Clear — Click to delete all visible anomalies.
10 Partition Field — Each distinct value in this field constitutes a separate category for analysis. Not present for all anomalies.
5Actions
— Click to view the
anomaly in the Anomaly Investigationview with the over-field value in the primary filter bar.
11 Baseline Value — The mean value of this same combination of Field, Over Field, and Partition Field during a comparable analysis window.*
6 Analysis Window — Timespan for the view when you click View Report
Summary .
12 Anomalous Value — An outlier value, compared to several standard deviations from the baseline.
Filtering Anomaly AlertsThe Advanced Filter on the Anomalies page permits you to filter the messages by the attributes shown on the Advanced-Filter Attributes page. (See "Advanced-Filter Attributes" on page 115.) To find a particular type of anomaly you might need to search on two fields.
Message Search On
Large data transfer by <ip_address>, located in <country>
partition_field_name~country
Excessive data transfer by <ip_address> while using <applications>
partition_field_name~id
<ip_address> sending long strings to DNS server <dns_name>
function~info
<ip_address> using numerous applications field_name~id
Many conversations between <ip_address> and multiple <ips/ports>
function~distinct AND (field_name~ip OR field_name~port)
<ip_address> contacting a high number of countries
field_name~country
URL category <category> getting high amount of traffic.
by_field_name~url
Anomaly Investigation ViewThe Anomaly Investigation view is a default summary view that is opened when you pivot from View Report Summary
. The half-hour timespan for the report begins 20 minutes before the analysis window starts so that you can more clearly see when the anomaly occurred in the Application Group over Time histogram.
Included in the Anomaly Investigation view are report widgets for most of the attributes that ADM analyzes.
103

Administration and CentralManager Guide SecurityAnalytics 8.1.3
n Application Group
n Application Group over Time
n Application
n IPv4 Initiator
n IPv4 Responder
n Flow Duration (sorted ASC by duration)
n Size in Bytes (sorted ASC by bytes)
n DNS Answer Name
n Country Initiator
n Country Responder
n Port Initiator
n Port Responder
On this page you can:
n Select Actions > Save to save the metadata on Analyze > Report Status.
n Select Actions > Download PCAP to save the packet data.
n Add or delete widgets from the view.
n Edit widgets for a customized display.
n Select Actions > Analyze Packets to see the packets in a Wireshark-like interface.
Anomaly DetectorsThe ADM detectors consist of the following parameters:
Message Function Field Over Field Partition Field
Large data transfer by IP [initiator | responder] <ip_address>, located in <country>
high_sum total_bytes initiator_ip
initiator_country
responder_ip
responder_country
Excessive data transfer by IP [initiator | responder] <ip_address> while using <application_ids>
high_sum total_bytes initiator_ipresponder_ip
application_ids
IP [initiator | responder] <ip_address> sending long strings to DNS server(s)
high_info_content
dns_name initiator_ip responder_ip
—
IP [initiator | responder] <ip_address> using numerous applications
high_distinct_count
application_ids
initiator_ip responder_ip
—
Many conversations between IP [initiator | responder] <ip_address> and multiple [[initiator | responder] ips | [initiator | responder] ports]
high_distinct_count
responder_ip responder_port
initiator_ip
—
initiator_ip
responder_ip
104

Administration and CentralManager Guide SecurityAnalytics 8.1.3
Message Function Field Over Field Partition Field
IP [initiator | responder] <ip_address> contacting a high number of countries
high_distinct_count
initiator_country responder_country
initiator_ip responder_ip
—
URL category <url_categories>§ getting high amount of traffic.
high_count
— url_categories*
—
* This is a By Field rather than an OverField.
§ URL categories for anomalies are available only with the Web Reputation Service. (See "Symantec Intelligence Services" on page 193.)
Anomaly Notification Format
Format for anomaly notifications in the audit log. Not all fields are present in every message:
Anomaly: score=<integer> anomaly_score=<floating_point> typical=<floating_point> actual=<floating_point> probability=<floating_point> actual_probability=<floating_point[ e-<integer>]> create_time=<YYYY>-<MM>-<DD>T<hh>:<ii>:<mm>-<zzzz> start_time=<YYYY>-<MM>-<DD>T<hh>:<ii>:<mm>-<zzzz> end_time=<YYYY>-<MM>-<DD>T<hh>:<ii>:<mm>-<zzzz> function='<text>' partition_field_name='<text>' partition_field_value='<text>' field_name='<text>' by_field_name='<text>' by_field_value='<text>' over_field_name='<text>' over_field_value='<text; dotted-decimal>' link='https://<appliance>/<path_to_summary_page>'
Web UI Display Correlation
The attributes in the notifications correspond to the web UI fields as follows:
n score — A normalization of probability to values 0–9, Score uses the same schema as the data-enrichment verdicts.
n anomaly_score — A sophisticated aggregation of the anomaly records. The calculation is optimized for high throughput, gracefully ages historical data, and reduces the signal-to-noise levels. It adjusts for variations in event rate, takes into account the frequency and the level of anomalous activity and is adjusted relative to past anomalous behavior. The higher the anomaly_score, the more likely the anomaly is worthy of further investigation.
n typical — Baseline Value
n actual — Anomalous Value
n probability — Calculated using anomaly_score and actual_probability and normalized to values 0.00–100.00.
n actual_probability — Statistical probability of the anomalous value occurring during a comparable analysis window*
n create_time — Time of Detection
n start_time — Analysis Window start time
105

Administration and CentralManager Guide SecurityAnalytics 8.1.3
n end_time — Analysis Window end time
n function — Function
n partition_field_name — Partition Field
n partition_field_value — Value in Partition Field
n field_name — Field
n by_field_name — By Field
n by_field_value — Value in By Field
n over_field_name — Over Field
n over_field_value — Value in Over Field
n link — Opens to the default Summary view (not the Anomaly Investigation view).
Tuning ADM SettingsThe following settings in /etc/solera/config/adm-conn-config.json control some of the behavior of ADM:
{"connector_config" : {
"anomaly_threshold" : 80.00,"long_poll_timeout" : 60,"hours_to_limit_anomalies" : 6
}}
n anomaly_threshold — Valid values: 0.00–100.00. Anomalies with a score lower than this value are not posted. ADM uses a scale of 0.00–100.00, and the web interface normalizes this score to a scale of 1–10.
n long_poll_timeout — Valid values: 30–200. Number of seconds for ADM to respond to a query before Security Analytics repeats the query.
n hours_to_limit_anomalies — Valid values: 0–720. Amount of time before anomalies will begin to be posted. If the value is set to 0, ADM will run for ~50 minutes before posting anomalies.
After making any changes to the configuration file, restart the ADM connector: systemctl restart adm-connector
The default behavior of ADM is therefore:
n For the first 6 hours of system uptime, no alerts are generated while ADM establishes a baseline.
n Only anomalies that have a score of 8 or higher are posted.
n Security Analytics polls ADM for anomaly results every 60 seconds until it gets a response.
106

Administration and CentralManager Guide SecurityAnalytics 8.1.3
FiltersSymantec Security Analytics employs the following types of filters:
n "Primary Filters" below — Applied to Summary, Reports, Extractions, Sessions, and Geolocation pages, primary filters return all flows that contain matching traffic.
n "Dynamic Filters" on page 109 — Apply capture filters to interfaces only when traffic matches a dynamic filter rule.
n "Data Enrichment Filters" on page 109 — Specify which file types to send to each enrichment provider. (See "Enrichment Providers" on page 190.)
n "Timespan Filters" on page 112 — Applied in the same contexts as the primary filter. Use the narrowest possible timespan filter to conserve system resources.
n "Advanced Filters" on page 113 — Applied to the flows that are generated on Reports, Extractions, Sessions, Geolocation, Alerts, and Audit Log pages, advanced filters eliminate extraneous data from matching flows. (See "Flows in Security Analytics" on page 373.)
n "Capture Filters" on page 115 — Applied to capture interfaces and PCAP downloads.
Primary Filters n Valid parameters for the filter bar are on "Metadata Settings" on page 56.
n Recognized Applications
n "Indicators" on page 129
The filter bar — present on Menu > Analyze > [Summary | Reports | Extractions | Geolocation] — is at the heart of Security Analytics. With these filters, you can display specific time frames or attributes of the captured data.
1 Filter bar
2 Timespan filter selector
Using the Filter Bar
Type directly in the filter bar to create a new filter.
1. Select Menu > Analyze > [Summary | Reports | Extractions | Sessions | Geolocation].
2. Click in the filter bar and begin typing a filter attribute.
107
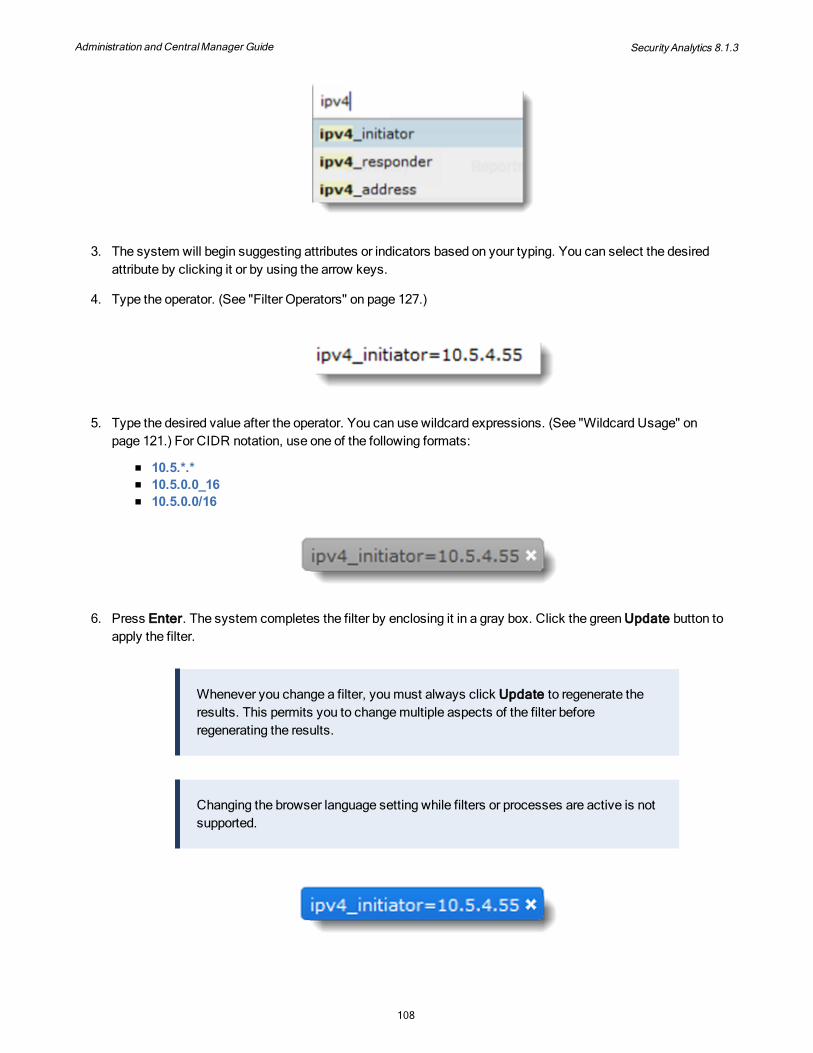
Administration and CentralManager Guide SecurityAnalytics 8.1.3
3. The system will begin suggesting attributes or indicators based on your typing. You can select the desired attribute by clicking it or by using the arrow keys.
4. Type the operator. (See "Filter Operators" on page 127.)
5. Type the desired value after the operator. You can use wildcard expressions. (See "Wildcard Usage" on page 121.) For CIDR notation, use one of the following formats:
n 10.5.*.* n 10.5.0.0_16 n 10.5.0.0/16
6. Press Enter. The system completes the filter by enclosing it in a gray box. Click the green Update button to apply the filter.
Whenever you change a filter, you must always click Update to regenerate the results. This permits you to change multiple aspects of the filter before regenerating the results.
Changing the browser language setting while filters or processes are active is not supported.
108

Administration and CentralManager Guide SecurityAnalytics 8.1.3
7. All applied filters appear as white text against a blue background.
8. To modify a filter, click the blue field and edit as desired. Press Enter or click outside the blue field; the box will become gray again. Click Update to apply the modified filter.
You can also create complex primary filters using AND and OR. See "Creating Complex Filters" on page 123.
Preloaded Indicators
Security Analytics is preloaded with indicators such as non-standard protocols, common MIME types, and known malware passwords. (See "Preloaded Indicators" on page 129.) You can use these indicators as primary filters.
1. Select Menu > Analyze > [Summary | Reports | Extractions | Sessions | Geolocation].
2. Expand the filter bar to see a list of indicators. Select the desired indicator.
n Alternatively, select Analyze > Indicators. Under Actions for the desired indicator, click Add to Filter
Bar . The Summary view will be displayed with that indicator in the filter bar.
3. The indicator appears in the filter bar and is applied to the operation (report, extraction, geolocation).
4. For instructions on creating and editing indicators, see "Indicators" on page 129.
Dynamic FiltersSee "Dynamic Filters" above.
Data Enrichment Filters
Menu > Settings > Data Enrichment > Default Data Enrichment Filter
Per-provider filters specify which file types to send to providers that evaluate files and hashes, such as the File Reputation Service and ClamAV. The default filter sends the following file types to the enrichment providers. (Consult "Data Enrichment Filters" on page 247 to see which file types are included in each category.)
109

Administration and CentralManager Guide SecurityAnalytics 8.1.3
n The filters apply only to real-time extractions, which occur when traffic matches rules. On-demand reputation queries are not affected by these filters.
n The checked boxes indicate the file types to send to the enrichment providers; clear the check boxes for file types that you do not want to send to the providers.
n After you have finished making changes to this filter, click Save.
By default all of the enrichment providers use the Default Data Enrichment Filter except integrations with Malware Analysis, which has a default filter to permit Adobe PDF, Archives, Debian Packages, Office Documents, and Programs and Libraries.
Customize a Data Enrichment Filter
To customize the data enrichment filter for a provider, follow these steps:
1. Select Menu > Settings > Data Enrichment.
2. For the enrichment provider click Edit.
110

Administration and CentralManager Guide SecurityAnalytics 8.1.3
3. Clear the Use Defaults check box.
4. Clear and select the file-type check boxes as desired and click Save. See "Data Enrichment Filters" on page 247 to see which file types are included with each filter.
5. A list of file types that are selected for the filter is displayed.
File-Type Promotions
Sometimes it is difficult to understand how Security Analytics defines file types for the data-enrichment filter. Security Analytics now exposes the "promotions," which are rules that define how Security Analytics classifies a file for the data-enrichment filter when certain combinations of characteristics are true.
The promotions are defined in /etc/solera/config/tonicfilterconf under "promotions". For example:
111

Administration and CentralManager Guide SecurityAnalytics 8.1.3
Promotion Explanation
{ "detected_types": [ "bin", "text" ], "presented_types": [ "javascript" ], "presented_extensions": [ "js" ], "promoted_type": "javascript" },
When the detected MIME type is bin or text AND (the presented MIME type is javascript OR the presented extension is js) the file type is promoted to javascript for the purposes of the data-enrichment filter.
You may edit, delete, or add new promotions. The valid values for the _type fields correspond to the file-type filter names: archives bin code config deb documents email executables
images ipa jar javascript multimedia pdf text
To see which MIME types are included in each filter, see "Data Enrichment Filters" on page 247.
Timespan Filters
Timespan filters are present on Menu > Analyze > [Summary | Reports | Extractions | Sessions | Geolocation]. By default, the system displays the last 15 minutes of data captured.
Expand the control to select another predefined timespan or click the date/time fields to specify a particular time.
112

Administration and CentralManager Guide SecurityAnalytics 8.1.3
See "Data Availability" on page 49 for an explanation of the calendar-shading colors.
Advanced Filters n See valid "Advanced-Filter Attributes" on page 115
With the advanced filters, you can easily and rapidly apply additional filters to the report data. When an advanced filter is applied, the charts and tables change automatically to reflect the new criteria.
n Advanced filters are applied directly to the data in the view, whereas applying a primary filter causes the operation, for example an extraction, to be performed again.
n Advanced filters affect only what is shown in the current view; they do not affect what is shown in other views (Summary, Reports, Extractions, Sessions, Geolocation) nor can they be carried across to other views.
Create an Advanced Filter
1. Select Menu > Analyze > [Reports | Extractions | Sessions | Geolocation | Alerts].
2. Select the desired view from the view selector.
3. Click Add a Filter to select a list of valid attributes for this view.
113

Administration and CentralManager Guide SecurityAnalytics 8.1.3
4. Select an operator.
5. Type or select the desired value and press Enter. The system applies the filter to the displayed data.
Create Nested Filters
This example shows how to convert the following expression into a nested advanced filter:
(file_size>=1000 AND file_extension=ico) OR (file_type=image/x-icon AND file_size>=1000) 1. Begin by selecting the Boolean
that will link the first group of filters to the second group—in this case, OR— and then click Add Filter Group.
2. Select the Boolean that links the terms within the first group (AND) and then add the filters.
3. To add the second group, click the same Add Filter Group icon as for the first group, and then add the filters for the second group.
Create Filters from Graphical Screen ElementsYou can instantly create a primary, advanced, or timespan filter from many of the graphical elements on the Web interface. The example below shows what happens when you click the value in the URI Host field of an extracted
114

Administration and CentralManager Guide SecurityAnalytics 8.1.3
artifact:
Depending on the attribute, you have the options of:
n adding the value to the filter bar or advanced filter
n adding the value as one of multiple attributes
n using one of up to four logical operators
Other graphical elements with this feature include:
n Report and widget charts and graphs
n Items in results lists: locations, IP addresses, applications
n The Application Group over Time widget, as shown below:
Capture FiltersSee "Capture Filters" above.
Advanced-Filter AttributesThe values for the advanced filter are different for each page. See "Advanced Filters" on page 113 for an explanation of how advanced filters work. Also see "Metadata Settings" on page 56.
Alerts
The Menu > Analyze > Alerts pages offer the following options:
115

Administration and CentralManager Guide SecurityAnalytics 8.1.3
n appliance — CMC Only.Sensor on which the alert was registered
n artifact_identifier — Add the identifier from the Alerts List page, as shown above
n cached — Specify true for reports that were retrieved from the cache
n destination_ip — Destination IP address
n destination_mac — Destination MAC address
n destination_port — Destination port number
n flow_id — Identifier for the flow that triggered the alert
n import_id — Specify the Import ID as shown on the Menu > Capture > Import PCAP page
n importance — 1 = Notification, 2 = Warning, 3 = Critical
n indicator — Name of the indicator that triggered the alert
n integration_provider — Derived from the values in the rule's Send to field
n owner_name — Name of the user to whom the alert is assigned
n match_criteria — Regular expression in an open parser rule that triggered the alert
n name — Name of the open-parser rule that triggered the alert
n rule — Name of the rule that triggered the alert
n score — Score returned by the integration provider
n source_ip — Source IP address
n source_mac — Source MAC address
n source_port — Source port number
n type — Specify file or url
n workflow_state — State that has been assigned to the alert
Anomalies
The Menu > Analyze > Anomalies pages offer the following options. See "Anomaly Detection" on page 101 for an explanation of the attributes and valid values:
116

Administration and CentralManager Guide SecurityAnalytics 8.1.3
n appliance — CMC Only. Sensor on which the anomaly was detected
n by_field_name — Name of the By Field attribute
n by_field_value — Value for the By Field
n field_name — Name of the Field attribute
n function — Function used to detect the anomaly
n over_field_name — Name of the Over Field attribute
n over_field_value — Value for the Over Field
n partition_field_name — Name of the Partition Field attribute
n partition_field_value — Value for the Partition Field
n score — Anomaly score (0–10)
Audit Log
See "Audit Log" on page 307.
Extractions
Consult the table below to see which advanced-filter attributes are available in the various Menu > Analyze > Summary > Extractions views. Artifacts and Artifacts Timeline provide identical attributes.
Field Description Artifacts
IM Media
email_bcc Email addresses in the Blind Carbon-Copy field X X
email_cc Email addresses in the Carbon-Copy field X X
email_from Email addresses in the From field X X
email_messageid
Email message ID X X
email_priority
Email priority X X
email_replyto
Email addresses in the Reply To field X X
email_subject
Email subject line X X
email_to Email addresses in the To field X X
file_extension
Extension of file (DOCX, COM, EXE, JPG) X X
file_size Size of file in kilobytes (KB) X X
file_type Presented MIME type X X
117

Administration and CentralManager Guide SecurityAnalytics 8.1.3
Field Description Artifacts
IM Media
file_type_mismatch
All entries where the presented MIME type is different from the detected type.
X
fuzzy Fuzzy hash of artifact X X
hex Hexadecimal value X
http_header String in HTTP header X
http_method post or get X
http_request_header
String in HTTP Request headers only X
http_response_code
Three-digit HTTP response code, e.g., 404, 302 X
http_response_header
String in HTTP Response headers only X
image_height Image height (x-value) in pixels X X
image_hw_ratio
Height-to-width ratio of the image X X
image_wh_ratio
Width-to-height ratio of the image X X
image_width Image width (y-value) in pixels X X
ip_address Any IP address (IPv4 or IPv6) X X X X
ip_initiator Source IP address (IPv4 or IPv6) X X X X
ip_responder Destination IP address (IPv4 or IPv6) X X X X
keyword Text string inside an artifact. Not valid from the CMC. X X X
keyword_arabic
Cleartext keyword in Arabic alphabet (UTF-8, ISO 8859-6). Not valid from the CMC.
X
keyword_european
Cleartext keyword in Latin alphabet (UTF-8, ISO 8859-1, Windows 1252). Not valid from the CMC.
X
keyword_japanese
Cleartext keyword in Japanese characters (UTF-8, Japanese Shift-JIS, ISO-2022-JP, EUC-JP). Not valid from the CMC.
X
keyword_korean
Cleartext keyword in Korean characters (UTF-8, EUC-KR). Not valid from the CMC.
X
keyword_utf8 Keyword in UTF-8 characters. Search is case-insensitive. Not valid from the CMC.
X
md5 MD5 hash of artifact X X X
port Any port number X X X X
118

Administration and CentralManager Guide SecurityAnalytics 8.1.3
Field Description Artifacts
IM Media
port_initiator
Destination port number X X X X
port_responder
Source port number X X X X
protocol Protocol X X
referer Referrer of artifact X X
sha1 SHA1 hash of artifact X X X
sha256 SHA256 hash of artifact X
url URL of artifact X X
user Username of participant in IM conversation X
Extraction Status
The Menu > Analyze > Extraction Status page has the following search terms:
n artifacts — Number of artifacts
n db_size — Size of extraction metadata in the PostgreSQL database
n disk_size — Size on disk of the extracted artifacts
n extraction_end — Time when the extraction stopped
n extraction_start — Time when the extraction was initiated
n filter_end — End time of the timespan filter
n filter_start — Begin time of the timespan filter
n id — Extraction identifier
n name — Name of user who initiated the extraction
n percentage — Percent complete
n state — Current or final state of the extraction
n user_name — Name of the user who launched the extraction
Sessions
The Menu > Analyze > Summary > Sessions advanced filter options correspond to the columns selected to display on the Sessions table. For example if the Sessions table has columns for ipv4_initiator, port_initiator, ipv4_responder, port_responder, application_id, packets, and bytes, these are the options that can be set for advanced filters.
119

Administration and CentralManager Guide SecurityAnalytics 8.1.3
Tip: Use the Actions menu to select which columns to display on the Sessions table.
Geolocation
The Menu > Analyze > Summary > Geolocation advanced filter offers the following options:
n bytes — Number of bytes
n ip_count — Number of IP addresses at a location
n location — Name of location
Job Queue
For the Job Queue page (accessed by clicking the Job Queue icon in the upper-right corner) the advanced filter offers the following options:
n id — Job identifier
n status — Job status
n type — Type of job
Reports
For Menu > Analyze > Summary > Reports, the advanced filter offers the following options:
n <report_attribute> — See "Metadata Settings" on page 56 for the list.
n bad_checksums — Number of erroneous checksums
n bytes — Number of bytes
n fragments — Number of IP fragments
n packets — Number of packets
n sessions — Number of sessions
Report Status
The Menu > Analyze > Report Status pages have the following search terms:
n field — Attribute for the report.
n id — Unique ID for the report
n name — Name of the saved report; field is blank if the report has not been saved
n state — Current or final state of the report
n username — Name of user who generated the report
120

Administration and CentralManager Guide SecurityAnalytics 8.1.3
Wildcards and Logical Operators
Wildcard Usage
Indicators and filters support two regular-expression characters: the question mark (?) and the asterisk (*):
? = single character
* = zero or more characters
These wildcard expressions may be used in the primary filters and for indicators. (See "Logical Operators in Advanced Filters" on page 128.)
Expression Description Returns Excludes
filename=*solera* All file names that contain the string solera. soleramysolerastuffsolerastuffmysolera
sol123erasollera
filename=*solera All file names that end with solera. soleramysolera
solerastuff
filename=solera* All file names that begin with solera. solerasolerastuff
mysolera
filename=sole*ra All file names that begin with sole and end with ra.
solerasolemncapybara
solenoidmordedura
filename=sol?ra All file names that start with sol and end with ra and that have a single character between sol and ra.
solerasol1ra
sol123ra
filename="*solera*"
All file names that are exactly *solera*. The double quotes disable the character expansion.
*solera* soleramysolera
filename="sol?ra" All file names that are exactly sol?ra. sol?ra solera
filename=\*solera* All file names that begin with *solera. The backslash disables the character expansion for the first wildcard only.
*solera*solerastuff
solerastuffmysolerastuff
filename!=* The file name does not exist. All entries without filenames
All entries that have filenames
To include a hyphen in a filter value, use a backslash, e.g., http_uri=wp\-admin
121

Administration and CentralManager Guide SecurityAnalytics 8.1.3
Logical Operators in Primary Filters
Filters are applied from left to right, such that the first value on the left is filtered first and each filter is applied afterward, in order.
For this filter the data is filtered first on the application_id value and then on the ipv4_initator value, which returns all entries where the application is HTTP and the initiator IP is not10.10.2.123.
The default logic joins unlike attributes with AND and identical attributes withOR.
In this filter, the operator after application_id is AND, whereas between the two ipv4_initiator filters the operator is
OR. Click the More Information icon in the status bar to see the query that is passed to the system.
Logical Display
When you enter filter definitions in primary filters, the logical equivalent is displayed below the graphical display.
The logical display shows how Boolean AND joins filters with different attributes, whereas filters with the same attribute are joined with OR. This is the query path:
122

Administration and CentralManager Guide SecurityAnalytics 8.1.3
The logical display also shows how filters that contain multiple, comma-delimited values for the same attribute are joined by AND.
If the application_id values were entered as individual attributes, they would be joined by OR.
Creating Complex Filters
With the logic exposed on the line below, you can directly edit the operators (AND, OR only) and change the parentheses, thereby creating "complex filters."
123

Administration and CentralManager Guide SecurityAnalytics 8.1.3
For example, when you change the second AND to OR, it forces a second set of parentheses.
Because the default logic does not permit OR between unlike attributes, the graphical filters disappear; however, the filter is still valid. Notice that the query path, below, contains escaped curly and square brackets, which indicates that the filter is complex.
Likewise, you can move the parentheses to a different location, and the filter is still valid.
124

Administration and CentralManager Guide SecurityAnalytics 8.1.3
Complex Filters Across Namespaces
All filter attributes belong to one of four namespaces: flows, verdicts, packets, and groups. The " Metadata Tables" on page 58 show the namespace for each attribute. A complex filter cannot contain attributes from different namespaces. For example, all four namespaces are present in this filter:
Because AND joins all of the attributes, the filter is valid. However, if you change one or more ANDs to OR, the filter is not valid, and an error message is displayed.
Likewise, if you add parentheses the filter is not valid.
Logical Display of Indicators
When an indicator is included in the primary filter:
n The individual filters in an indicator are not shown in the logical display, because indicators can contain an extremely high number of filters.
n The individual filters inside an indicator are treated as individual filters, and then the default logic is applied.
For example, the default Local File Analysis indicator contains these filters:
125

Administration and CentralManager Guide SecurityAnalytics 8.1.3
Because all of the attributes are the same, the filters are joined by OR when the indicator is added to the path bar or used in a rule. When another filter is included with the indicator ("favorite"), the displayed Boolean is always AND.
However, the actual logic of this filter is
(file_extension=exe OR file_extension=pdf OR file_extension=html OR file_extension=htm OR file_extension=js OR file_extension=swf file_extension=jar)
Boolean OR is the operator because all of the filters use the same attribute: file_extension.
When an indicator contains unlike attributes, the logic differs depending on the Boolean that joins the indicator with the other filters. For example, a custom indicator called OCSP Japan contains two filters, each using a different attribute:
When adding another filter that has one of the same attributes as the indicator, the logical display shows AND.
However, the actual logic is
(application_id="ocsp" and (country="Japan" OR country="China"))
If you change the AND to OR, the logic changes to
126

Administration and CentralManager Guide SecurityAnalytics 8.1.3
((application_id="ocsp and country="Japan") OR country="China")
The filters in the graphical display are not shown, because the OR is not supported by the default logic.
Filter Operators
Operation Syntax Example Result
AND <attribute>=<"value1","value2">
ipv4_address="1.1.1.1","2.2.2.2"
Returns entries with both 1.1.1.1 and 2.2.2.2 as host addresses.
<attribute1>=<value><attribute2>=<value>
ipv4_address=1.1.1.1 application_id=http
Returns HTTP entries with host address 1.1.1.1.
OR <attribute>=<value1><attribute>=<value2>
ipv4_address=1.1.1.1 ipv4_address=2.2.2.2
Returns entries with either 1.1.1.1 or 2.2.2.2 as host addresses.
RANGE <attribute>=<value1-value2>
ipv4_address=1.1.1.1-1.1.1.254
Returns entries with any host address between 1.1.1.1 and 1.1.1.254.
NOT <attribute>!=<value> application_id!=http Returns all applications except HTTP.
!indicator !MIME Type BIN Returns everything that does not match mime_type="application/bin", "application/binary", "application/x-msdownload"
contains <attribute>~<value> http_uri~yahoo Returns all URIs that contain yahoo.
does not contain <attribute>!~<value> http_uri!~twitter Returns all URIs except those that contain twitter.
is null <attribute>!=* referer!=* Returns all entries where the referer field is empty or non-existent.
greater than <attribute>><value> vlan_id>45 Returns all entries that have VLAN ID numbers larger than 45.
greater than or equals
<attribute>>=<value> packet_length>=1024 Returns all entries that have packet lengths of 1024 bytes or larger
less than <attribute><<value> interface<3 Returns all entries from interfaces with an ID less than 3.
127

Administration and CentralManager Guide SecurityAnalytics 8.1.3
Operation Syntax Example Result
less than or equals
<attribute><=<value> port_initiator<=35000 Returns all entries that have port initiator number of 35000 or lower
n OR is operational only with the same attribute types, for example, two application_id filters or multiple port filters. If the attribute types are different, the operation is always AND.
n To apply a primary filter to a different view (Summary, Reports, Extractions, Geolocation), select the view while the filter is still present in the filter bar.
n To save a primary filter, click the star to add it to the indicators list.
n To delete an individual filter, click its white and click Update or press Enter.
n To delete everything in the filter bar, click and click Update or press Enter.
n To modify an attribute/value pair, click it to enter edit mode, type the new value, and press Enter.
n Applying a primary filter causes an operation such as extraction to be performed again, whereas advanced filters are applied only to the data already in the view.
Logical Operators in Advanced Filters
n NOT (does not equal) is treated as a negative AND. When there are multiple NOTs in the filter, they are treated as a single AND operator.
n Any special character between double quotes is treated as plain text: the asterisk in "A*C" is treated as plain text, whereas in A*C it is a wildcard.
n The term null is valid for the = and != operators: referer!=null will return all entries where the referer field contains a value.
Universal ConnectorWith the Universal Connector, you can directly add IP addresses to the filter bar from a web browser.
n To install the Universal Connector, select About > Universal Connector.
n Under Browser Bookmarklet, right-click the Bookmark button and select Add to favorites, Bookmark this link, or Add link to bookmarks (depending on your browser).
Add an IP Address to the Filter Bar with the Universal Connector
1. Browse to a page with one or more IP addresses on it. (The IP addresses must be in dotted-decimal notation: 203.0.113.17, not domain.tld.)
2. Launch the Universal Connector by opening Bookmarks and double-clicking Universal Connector.
128

Administration and CentralManager Guide SecurityAnalytics 8.1.3
3. The Universal Connector underlines all IP addresses (linked and plain text). Place your cursor over an IP address to invoke the Add control and click.
4. The IP address is added to the list; alternatively, you can click the IP Address field and type the address manually.
5. Optional — For Endpoint, select Either, Source, or Destination.
6. Optional — For Port, type a port number and select the Type and Endpoint values.
7. Optional — Select a new date or time (default: last 15 minutes).
8. For Appliance, type the hostname or IP address of your appliance.
9. Click Investigate in Security Analytics.
10. The filter is added to the filter bar in the Menu > Analyze > Summary view.
IndicatorsAn indicator consists of one or more primary filters (attribute/value pairs). Indicators are used to filter report results and to trigger rules and alerts. (See "Primary Filters" on page 107, "Rules" on page 230, "Alerts" on page 236.)
Preloaded IndicatorsSymantec Security Analytics is preloaded with a variety of indicators, including but not limited to the following:
n Presented MIME Types
n Presented File Types
n Commonly Scanned Ports
n Non-Standard Protocol Traffic
n SSL Certificate Validity
n RFC1918 IPv4 Addresses
Live-Feed Indicators
Security Analytics includes live-feed indicators such as:
129
Administration and CentralManager Guide SecurityAnalytics 8.1.3
From rules.emergingthreats.net
o CI Army Threat Intel
o Botnet C2
o Compromised IPs
o Spamhaus Block List
From abuse.ch
o Ransomware Tracker Domains, IPs, URLs
o Feodo Tracker
o Zeus Tracker-Bad Domains, IPs
From malwaredomains.com
o DNS-BH - MalwareDomains
From isc.scans.edu
o SANS ISC - IP Block List
o SANS ISC - Suspicious Domains
C
h
aracteristics
n The live-feed indicators will be updated only after they have been activated .
n After activating a live-feed indicator, click Edit to make sure that:
o the update schedule is convenient (default: daily at 03:33)
o your appliance can reach the URI
n Every update replaces the entire indicator: deletions, additions, changes
n To create your own live-feed indicators, follow the instructions in "Import Indicators from a List, or Create a Live-Feed Indicator" on page 132.
Indicator Specifications n The size of the filters in an indicator cannot exceed 512 MB, which is calculated by character count. For
example, an indicator can contain ~900,000 ipv4_address filters or ~150,000 http_server filters (~200 characters for the URL values).
n When an indicator has more than 1000 filters, the filters cannot be edited or deleted using the web UI.
n A maximum of 1024 indicators can be active (in rules) at the same time.
Using IndicatorsTo use indicators, do one of the following:
n Select Menu > Analyze > Indicators. For the indicator, click Add to Filter Bar . The indicator is added to the filter bar on the Summary page.
n Select Menu > Analyze >[Summary | Reports | Extractions | Geolocation] and
o Expand the filter bar to select the desired indicator.
130

Administration and CentralManager Guide SecurityAnalytics 8.1.3
o Type part of a name and select the indicator from the options that the system presents. You can choose to include or exclude the indicator: <indicator> or !<indicator>.
n Create a rule and add the indicator to the rule under First Event.
Create a New Indicator
1. Select Menu > Analyze > Indicators.
2. Select Tools > New. The Create an Indicator dialog box is displayed.
3. Specify a Name for the indicator.
4. For Filter, type one or more primary filter attributes (see " Metadata Tables" on page 58) or the names of existing indicators. Begin typing to get suggestions. You can use "Wildcards and Logical Operators" on page 121.
131

Administration and CentralManager Guide SecurityAnalytics 8.1.3
The rules engine cannot detect values for attributes that are in the verdicts or groups namespaces. Those values are produced by data enrichment processes, which populate the Indexing DB after the data has passed through the rules engine. (See "Data Enrichment" on page 188.) Attributes in the packets namespace (such as" SCADA" on page 71) are also not supported by the rules engine, with the exception of packet_length.
5. Optional — Clear the Shared check box.
6. Click Save.
Create an Indicator from the Filter Bar 1. In the filter bar, type the desired filter attributes. (See " Metadata Tables" on page 58). Consult "Wildcards and
Logical Operators" on page 121.
2. Click the star to save the indicator.
3. Provide a name for the indicator and indicate whether it is to be shared.
4. Click Save. You can view the new indicator on Menu > Analyze > Indicators or in the filter bar drop-down list.
Import Indicators from a List, or Create a Live-Feed Indicator
1. Select Menu > Analyze > Indicators and select Actions > Import. The Import an Indicator dialog is displayed.
2. For File Type, select one of the following:
n DShield — Access the feed at feeds.dshield.org/block.txt. This file, updated daily, shows the top 20 attacking Class C networks over the past three days.
n Snort® — Recommended rules are located at rules.emergingthreats.net/blockrules/. See "Snort Rules" on the next page for conversion conventions.
n JSON — Indicators formatted as JSON arrays, such as indicators that have been exported from a Security Analytics appliance. (See "JSON Formatting for Indicators" on page 137.)
n List — Import a text file that contains one or more values for a single filter attribute. Delimiters determine the Boolean operator. (See "Format a List of Indicators" on page 136.)
3. Specify a Name for the indicator.
4. Snort Only — Select the Honor rule directionality check box to preserve inbound- and outbound-specifics. See "Snort Rules" on the next page.
5. Location — Select one of the following:
132

Administration and CentralManager Guide SecurityAnalytics 8.1.3
n Browser Upload — Click Browse and select a file to upload.
n Remote — Use this option for third-party live feeds or for your own live updates. Specify the URI where the file containing the indicators is located, then set the schedule for how often the indicators are to be uploaded. (The scheduler is similar to the scheduler for reports. (See "Scheduled Reports" on page 143.) Each time the file is updated, the indicator changes to include all additions, deletions, and edits to the file.
6. Click Save.
Snort Rules
Imported Snort files (.rules) are converted to filter attributes as follows:
n The Layer 4 protocol becomes ip_protocol=tcp or ip_protocol=udp. The protocol is not attached to a specific IP address or port as it is with the Snort rule.
n Fields such as msg, reference, flags, classtype, and sid are ignored.
n The IP addresses and ports are extracted from Snort rules as ipv4_address=[x] and port=[x] unless you select Honor rule directionality to specify initiator or responder:
o $EXTERNAL_NET -> [$HOME_NET] creates IP and port initiator filters
o $HOME_NET -> [$EXTERNAL_NET] creates IP and port responder filters
example
This Snort rule, imported with Honor Rule Directionality selected
alert tcp $HOME_NET any -> 203.0.113.211 1023 (msg:"ET CNC Shadowserver Reported CnC Server Port 1023 Group 1"; flags:S; reference:url,doc.emergingthreats.net/bin/view/Main/BotCC; reference:url,www.shadowserver.org; threshold: type limit, track by_src, seconds 360, count 1; classtype:trojan-activity; flowbits:set,ET.Evil; flowbits:set,ET.BotccIP; sid:2405004; rev:4233;)
becomes this indicator:
No other attributes besides IP protocol, source/destination IP/port, and direction are extracted from Snort rules.
Export IndicatorsFollow these steps to export JSON indicators, which can be imported to another Security Analytics appliance.
133

Administration and CentralManager Guide SecurityAnalytics 8.1.3
1. Select the check box for the indicator(s) that you want to export.
2. Select Actions > Export.
3. Follow the prompts to save indicators.json to your workstation.
Edit Indicators 1. To edit an indicator, do one of the following:
n Select Menu > Analyze > Indicators and click Edit for the indicator to modify.
n Click on an indicator anywhere on the web UI to open the Edit Indicator dialog.
2. Make the desired changes to the filters or the name of the indicator and click Save.
If you change the name of the indicator, the indicator's name will be changed for all of the alerts, including alerts that were posted when the indicator had its previous name.
134

Administration and CentralManager Guide SecurityAnalytics 8.1.3
Delete IndicatorsWhen you delete an indicator, you also delete every other indicator, alert, and rule that contains only that indicator. A rule that still contains an indicator that has not been deleted will not be deleted.
example
The following items contain Indicator1:
n Indicator3 contains Indicator1 and application_group~web.
n AlertABC contains Indicator1 and another indicator called Email.
n AlertXYZ contains ChinaWeb and Indicator3.
The alerts that are triggered by the rules, by indicator, are as follows:
When Indicator1 is deleted, these are the results:
135

Administration and CentralManager Guide SecurityAnalytics 8.1.3
n Indicator3 is deleted because it contained Indicator1.
n AlertXYZ is not deleted because it has a remaining indicator, ChinaWeb.
n AlertABC is not deleted because it has a remaining indicator, Email.
n All alerts that were triggered by Indicator1 and Indicator3 are deleted.
n The alerts that were triggered by Email and ChinaWeb still remain.
Format a List of IndicatorsYou can import a list of values for a single filter attribute. Importing a list of values in this manner automatically creates the indicator as attribute=value. The list delimiter determines the Boolean operator.
Delimiter Example Text File Indicator(s) Created
Comma (AND) network management, file server, file transfer, network service
attribute="network management, file server, file transfer, network service"
198.51.*.*, 192.0.0.0_8, 203.0.113.0/24
attribute="198.51.*.*, 192.0.0.0_8, 203.0.113.0/24"
Line Break (OR)
22 33 44 55
attribute="22"attribute="33"attribute="44"attribute="55"
*solera* sol?ra "solera"
attribute="*solera*"attribute="sol?ra"attribute="\"solera\""
n The system will automatically escape double quotation marks, backslashes, and other non-wildcard characters. (See "Wildcards and Logical Operators" on page 121.)
n For other operators, nesting, or multiple attributes, see "JSON Formatting for Indicators" on the next page.
136

Administration and CentralManager Guide SecurityAnalytics 8.1.3
JSON Formatting for Indicators n Define the indicators to import using JSON. (See "Import Indicators from a List, or Create a Live-Feed
Indicator" on page 132.) The file should be UTF-8 encoded without BOM.
n Imported indicators that have the name of an existing indicator will be renamed <indicator> 2.
n Valid values for attribute and value are shown in the " Metadata Tables" on page 58.
n Valid values for <operator> are equals (=), does not equal (!=), less than (<), less than or equals (<=), greater than (>), greater than or equals (=>), contains (~), does not contain (!~). Format single-level indicators as follows:
{"indicator_name_1":
["attribute_1<operator>value_1","attribute_2<operator>value_2"],
"indicator_name_2":["attribute_3<operator>value_3","attribute_4<operator>value_4"]
}
Nested JSON Indicators
To nest indicators, the lowest-level indicators must be defined first in the file, followed by the "container" indicator. The container cannot reference indicators that already exist on the appliance. The following example creates four indicators: three "sub-indicators" and one "container" that includes the sub-indicators.
{"sub-indicator_1":
["attribute_1=value_1"],
"sub-indicator_2":["attribute_2=value_2"],
"sub-indicator_3":["attribute_3=value_3"],
"CONTAINER_INDICATOR":["indicator=sub-indicator_1", "indicator=sub-indicator_2", "indicator=sub-indicator_3"]
}
ReportsThe Reports page presents a detailed, filterable view of every kind of report. Select which reports are available on
Menu > Settings > Metadata. On the Summary page, double-click the heading of a widget to open that report on the Reports page.
137

Administration and CentralManager Guide SecurityAnalytics 8.1.3
n See "Menu > Analyze > Summary > Reports" on page 411
n See a list of available reports on "Metadata Settings" on page 56
Reports Page
Menu > Analyze > Summary > Reports
1 Report Summary Chart
2 Total [Unit] over Time histogram
3 Report comparison controls and advanced filter
4 Report results list
5 Column selector control
Report Results ListThe report results list is a table of the individual records as well as the bytes, packets, sessions, IP fragments, and bad checksums associated with that record. (You can display the IP fragments and bad checksums by clicking the column selector control.) The column values are shown as both an absolute number and as a percentage. Click on any of the column headers to sort on the column value; click a second time to invert the sort order. To specify how many rows to display at a time use the Results per Page control at the bottom of the page. (Permanently set this value by
selecting [Account Name] > Preferences.)
Reports are limited to 100,000 rows.
138

Administration and CentralManager Guide SecurityAnalytics 8.1.3
When you change the sort topic or the sort order, the Report Summary and Total [unit] over Time charts are updated to reflect the changed topic or order.
Compare Report ResultsOn the Reports page, you can compare the amount of change over time.
1. Select Menu > Analyze > Summary > Reports.
2. Select the desired view from the view selector.
3. Select Enable Report Comparison.
4. Optional — Select the unit of measurement to compare: Bytes, Packets, or Sessions.
5. Optional — The Comparison Time Range box displays the From and To times in the main timespan selector. Expand the timespan control to select a timespan (last 15 minutes, last 60 minutes, etc.) or click the date/time to specify another time.
6. The change over time is displayed both as the amount (Change column) and the percentage (Change % column). The default sort order is Change in absolute values, with the greatest value first.
7. The Total [Unit] over Time chart displays a line that represents the older timespan.
8. In the Selected Totals chart, change the display settings to Bar Chart or Column Chart to see the comparison line. (See Report Summary Chart.)
Save Report ResultsYou can save report results to view later.
1. Select Menu > Analyze > Summary > Reports.
2. From the view selector, select the view to save.
3. Optional — Use the primary filter or timespan filter, as desired.
139

Administration and CentralManager Guide SecurityAnalytics 8.1.3
4. Select Actions > Save.
5. Type a name for saved output (max. 300 characters).
6. Click Save.
7. Retrieve the saved results by selecting Menu > Analyze > Report Status > List and clicking View
Report for that entry.
Export ReportsYou can export basic reports in CSV or PDF format. (Compared results cannot be exported.)
1. Select Menu > Analyze > Summary > Reports.
2. From the view selector, select the view to export. Filter and modify the results as desired.
3. Select Actions > Download [PDF | CSV].
n CSV file:
o Follow the prompts to save <timespan>_<report_attribute>_report.csv.
n PDF file:
o A message indicates that the generation of the report has begun.
o Click the notification at the upper-right corner of the web interface. The entry shows PDF generation in progress.
o When the process has completed, the status changes from Processing to Download. Click the entry and follow the prompts to save deepsee-report.pdf.
Risk and Visibility Report Generate a PDF document to provide non-analysts, executives, and other members of your organization with a general overview of the latest threats that have been detected by Security Analytics.
The logged-in user must be in a group that has permission to generate the report under
Menu > Analyze > Reports in the permissions table. (See "Group Permissions" on page 261.)
If you import a PCAP, pivot to the Summary page, and then run the Risk and Visibility report for the PCAP, you should add a few minutes to the timespan so that data-enrichment verdicts can be included in the report.
140

Administration and CentralManager Guide SecurityAnalytics 8.1.3
1. Select [Account Name] > Risk and Visibility Report.
2. Select the desired timespan. By default the timespan in the current window is selected.
3. Select one or both options:
n Email — In the space provided, specify one or more comma-delimited email addresses. For this option,
you must also specify an email server on Menu > Settings > Communication > Server Settings > Email Settings. (See "Email Alerts" on page 308.)
n Download — A PDF of the report is generated. When it is finished, you can download it from the system notifications. (See "Job Queue and System Alerts" on page 314.)
4. You can monitor the progress of the report by selecting Menu > Analyze > Report Status > List. The reports are displayed with Risk Report in the Name column. To stop the Risk and Visibility report, select the check boxes for all of the reports and click Delete.
Report Status Pages
Menu > Analyze > Report Status
The Report Status pages display reports that are running or that have completed. Use the information on these pages to keep track of system resources and of report-generation history.
Menu > Analyze > Report Status > Summary
The Report Status Summary page displays report totals by the following:
n State — The current state of a report. Possible values are:
o New — The report request has been sent to the query handler.
o Starting — The query handler has begun generating the report.
o Active — The report is currently running but is not complete.
141

Administration and CentralManager Guide SecurityAnalytics 8.1.3
o Stopped — The report was stopped by the user clicking the Stop Report button , by browsing away for more than a minute, or by closing the browser window where the report was initiated.
o Stopping — The stop command has been sent to this report but it has not stopped yet.
o Complete — The report has run to completion.
n User — Username of person who ran the report.
n Field — Attribute name of the report. For example, if you select Menu > Analyze > Summary and the selected view has four widgets on it, each widget will have its own entry in this list.
Menu > Analyze > Report Status > List
The Report Status List displays the details about every report that has been saved or that has not timed out. Reports that have not been viewed for one hour will be removed from this list. Saved reports do not time out.
On this page use the check box for each report and the Delete button to:
n Stop reports that were started accidentally
n Stop reports that hang instead of completing
n Delete reports that take up too much space
n Delete saved reports that are no longer needed
Report Status Columns
n ID — Unique ID number of the report
n Username — User who ran the report
n Field — Attribute name of the report
n Timespan Start — Start time for the report data
n Timespan End — End time for the report data
n Start — Time at which the report was started
n End — Time at which the report was completed
n Processing Time — Interval between Start and End; the amount of time to generate the report
n Name — Name of the saved report; field is blank if the report has not been saved
n Saved — Whether the report has been saved; non-saved reports (false) will time out of this list after one hour
n Disk Usage — Amount of space that the report occupies; empty reports are typically 16 kB
142

Administration and CentralManager Guide SecurityAnalytics 8.1.3
n State — The current state of a report. Possible values are:
o New — The report request has been sent to the query handler.
o Starting — The query handler has begun generating the report.
o Active — The report is currently running but is not complete.
o Stopped — The report was stopped by the user clicking the Stop Report button , by browsing away for more than a minute, or by closing the browser window where the report was initiated.
o Stopping — The stop command has been sent to this report but it has not stopped yet.
o Complete — The report has run to completion.
n Actions — Click View report summary to see the report in Menu > Analyze > Summary > Reports or
click to see the report details.
Scheduled ReportsYou can set up reports to be run at predetermined times on a regular basis. These reports are sent to specified email accounts.
Prior to receiving scheduled reports, you must configure SMTP settings as shown in "Email Alerts" on page 308.
1. Do one of the following:
n Select Menu > Analyze > Scheduled Reports.
n Select Menu > Analyze > Summary > Reports > Actions > Schedule Report.
2. Click New.
3. For Name, specify a unique name for the schedule. This name will be the filename of the report.
4. For Recipients, type one or more email addresses to receive the reports.
5. For Output Format, select PDF or CSV.
6. Specify whether the scheduled report is to be shared. (A shared report can be edited by all of the authorized users on the appliance; however, the reports will be sent only to the accounts that are specified in the Recipients field.)
How often will the report run?
7. Select the tab that represents the frequency of the report to be run and set the parameters.
143

Administration and CentralManager Guide SecurityAnalytics 8.1.3
n In the Hour fields, 00 = midnight.
n For Custom, you can select multiple values for Months, Weeks, and Days.
n The value in [x]Week of the Month is defined according to ISO 8601 conventions, which means that the week in which the first day of the month appears is the first week, even when the first day falls on a weekend.
What is on the report?
8. For Report Type, select one of the available report types. Begin typing to skip to the report name. (See " Metadata Tables" on page 58.)
9. Optional — For Filter, type filter attributes and values to apply. Begin typing to get suggestions.
The attributes for imported PCAPs — interface=imptX and import_id=Y — are not valid for this field unless you select Only Once for the timespan.
10. For the report timespan, select whichever option is available:
n Standard Range — Select the amount of time to be included in the report. The time is calculated backwards from the time the report will run. For example, if you schedule a report to run daily at 13:00 and you specify a range of 2 hours, the report will contain data from the two hours previous to 13:00, that is, 11:00 to 13:00.
n Custom Range — Specify the timespan.
11. Click Save. The scheduled report is displayed in the Scheduled Reports list.
Summary Views
The Menu > Summary views in Symantec Security Analytics are collections of report widgets on a single page. Report widgets are discrete graphical elements that summarize data according to selected criteria. A collection of widgets can then be run against a user-selected time period and a user-defined set of filters. (See "Timespan Filters" on page 112, "Primary Filters" on page 107)
See "Menu > Analyze > Summary" on page 410 for a description of all page elements.
Report Widgets
Menu > Analyze > Summary
While the data is still loading for the Summary page, you may click the red Stop Reports button to stop the data from processing.
144

Administration and CentralManager Guide SecurityAnalytics 8.1.3
Included on Security Analytics are report widgets that correspond to the available reports. (See " Metadata Tables" on page 58.)
Select a summary view from the view selector.
Use the edit control to change the name, share the view, duplicate the view, or specify a view as the default.
Create a Summary View
You can create a new summary view from a blank view, or you can modify an existing view.
1. Select Menu > Analyze > Summary.
2. Click the view selector and select Add New View.
3. Type a name for your new view.
145

Administration and CentralManager Guide SecurityAnalytics 8.1.3
4. Optional — Select Use flow-based columns to permit the report widgets to adjust to the available width of the window. Clearing this check box forces the report widgets to stay in a fixed-grid location.
5. Optional — Select Shared to share the view.
6. Optional — Select Duplicate Existing View? to select a view to duplicate as the new view.
7. Optional — Select Set as default to make this the default view.
8. Click Save. You get a blank summary screen and the Add/Edit Widgets dialog box is displayed.
9. Select one or more report widgets from the Available Reports list and add them to the Selected Reports list. Press Ctrl to select more than one report, and then click the single arrow button to move them to the Selected Reports list.
n The more report widgets in a view, the longer it takes to load the view. For optimal performance and system integrity, limit the number of widgets to 18 per view.
n If the report widgets in the same view are from different namespaces, the reports will take longer to generate.
n Application Group includes the Application Group and the Application Group over Time widgets.
10. Click Add/Edit Widgets.
Report Widget Controls
To reveal the report widget controls, place your cursor over the widget header.
146

Administration and CentralManager Guide SecurityAnalytics 8.1.3
1 Move Widget
2 Widget Settings
3 Delete Widget
1 Sort-by Field — Select from the widget name or bytes, packets, sessions, IP fragments, or bad checksums.
2 Order — Ascending, Descending
3 View — Table, Pie, Column, Bar
4 Resolution — Select the check box and slide the selector to the desired resolution.
The settings affect only this report widget in this view. If this report widget is present in other views, the settings on those views will be not changed.
147

Administration and CentralManager Guide SecurityAnalytics 8.1.3
Application Group Widgets
Two widgets — Application Group and Application Group over Time — are different from the other widgets; user configuration is limited to session-resolution settings. The Application Group widget has Bytes, Packets, and Sessions columns. The Application Group over Time widget is a histogram of the Application Group widget. Place your cursor over a data point to see the details.
When adding widgets to a view, selecting Application Group adds both the Application Group and the Application Group over Time widget to the view.
Apply Filters to Summary Views
To apply a filter to a summary view, see "Primary Filters" on page 107 and "Indicators" on page 129.
Save the Output of a Summary View
The output of a summary view can be saved on the appliance and viewed on the Report Status list.
1. Select Menu > Analyze > Summary and select the desired view.
2. Add, delete, and modify the report widgets as desired. Add any filters that you want.
3. Select Actions > Save in the upper-right corner of the interface.
4. Type a name for the saved output (max 300 characters).
5. If you click Save before the system has finished processing the data, you have the option to:
n Save and Stop — Save only the data that was processed before you clicked Save and Stop.
n Save and Continue — The save operation will continue until all data is processed.
6. If you click Save after Status shows Finished (100%), all of the results are saved.
7. Retrieve the saved results by selecting Analyze > Report Status > List. There is a separate report entry for each widget.
8. Click View Report to see the report in the Reports (not Summary) view.
Session Resolution
In the Summary, Reports, and Geolocation views, the session resolution percentage is located on the status bar. The purpose of this feature is to limit reports to a subset of data, which allows quicker display of data.
148

Administration and CentralManager Guide SecurityAnalytics 8.1.3
Adjust Session Resolution
1. Click the session resolution value for the view.
2. Slide the bar to the percentage of data that you want to view.
Populating the ReportsAlso see:
"Flows in Security Analytics" on page 373, "Alerts" on page 236, "FRS Prefilter Process" on page 392, Best Searching Practices in Security Analytics, and "Metadata Settings" on page 56.
Where's my data?
If you do not see data in your reports and report widgets, it is possible that the features that populate the reports have not been activated or properly set up. This section explains how each report is populated so that you can troubleshoot empty or sparsely populated reports.
Metadata Settings
User-selectable metadata permits you to decide which metadata attributes are written to the Indexing DB. Report data
is not written to the Indexing DB unless it has been selected on Menu > Settings > Metadata.
Natively Indexed Metadata
The data for most Security Analytics reports is extracted directly from the packet headers by the deep-packet inspection (DPI) engine, or it has been added by system processes at the time of indexing. The reports that contain this data are available within seconds of the data being captured, provided that system resources are available. (See "Reindexing" on page 52.)
149

Administration and CentralManager Guide SecurityAnalytics 8.1.3
Packet-Header Metadata
n IP/port and Ethernet addresses
n IP protocol
n Email sender, receiver, subject line
n File name, extension, MIME type
n HTTP status code, method, URI, content disposition, server, referrer, user agent, location (redirect), content length
n Username, social persona (user identifier), or password
n Database or web queries
n DNS fields
n Packet length
n User-selectable metadata
System-Added Metadata
n Capture interface or import ID
n Application ID, application group
n Flow ID, flow duration
n NIC vendor
n File type
n Autogenerated domain and score
n Country initiator and responder
n Machine ID
For the other reports, specific conditions must be true before the data is written to the metadata array:
n "Conversation Reports" below
n "Data Enrichment Verdicts" below
n "Hash Reports" on the next page
n "Open-Parser Rules" on page 152
Conversation Reports
The data for the Conversation reports is assembled only when the report is queried. For example, if you invoke the IP Layer View on the Analyze > Summary page, the IPv4 and IPv6 conversations for that timespan will be assembled and presented in their respective report widgets.
n IPv4 Conversation
n IPv4 Port Conversation
n IPv6 Conversation
n IPv6 Port Conversation
The values in the Conversation reports are cached but are not written to the metadata DB.
To specify a conversation in the primary filter bar, enter IPv[x]_address="<ip_address1>","<ip_address2>" There is no ipv[X]_conversation attribute.
Data Enrichment Verdicts
Also see: "Data Enrichment Process" on page 389.
Data for the reports in the verdicts namespace is produced by the data-enrichment process. The following conditions must be true for a data-enrichment report to contain data:
150

Administration and CentralManager Guide SecurityAnalytics 8.1.3
n The corresponding enrichment provider is licensed and activated.
n Traffic matches a data-enrichment rule for the provider.
n The provider has returned the verdict to Security Analytics OR the verdict for that artifact is already in the verdict cache.
The data-enrichment reports are populated as follows:
Report Providers
File Signature Verdict File Reputation Service, FRS prefilter
URL Categories Local Web Reputation Service, Global Intelligence Network (GIN)
URL Risk Verdict Local Web Reputation Service, GIN
Local File Analysis Calculate and Store Hashes, ClamAV, Custom Hash List, jsunpack-n, YARA
Malware Analysis Verdict Malware Analysis appliance; also see FRS Prefilter
Third-Party Verdict ReversingLabs® TitaniumScale® server
Threat Category ReversingLabs TitaniumScale server
Threat Description ReversingLabs TitaniumScale server
Threat Severity ReversingLabs TitaniumScale server
User Name (flows namespace)
Login Correlation Service
Exception: URL Risk Verdict
With one exception, you cannot use the data-enrichment verdict attributes as indicators for rules, because the data for those attributes is written to the Indexing DB after the rules engine inspects the traffic.
For URL Risk Verdict data, however, the process is as follows:
1. The Web Reputation Service is licensed and activated.
2. A Web Reputation Service rule that contains the url_risk_verdict attribute is activated.
3. The metadata indexer sends all URLs to the local copy of the Web Reputation Service, which returns a verdict (1-10) with 5 being unknown.
4. When a verdict has been returned for every URL in a flow, the metadata indexer sends the flow to the rules engine.
5. If url_risk_verdict is 5 or higher, the system queries GIN to obtain a definitive verdict for that URL.
6. The verdict is written to the Indexing DB.
Hash Reports
The hash reports are not populated by the DPI engine nor the metadata indexer. Hashes are calculated by the extractor under the following circumstances:
151

Administration and CentralManager Guide SecurityAnalytics 8.1.3
n At least one data-enrichment rule is activated — and that rule sends either a file or a file hash to one of these enrichment providers:
o File Reputation Service o ICAP o Malware Analysis o Calculate and Store Hashes o ClamAV o jsunpack-n
o YARA o Cuckoo o FireEye AX-series o Lastline File or Hash o TitaniumScale o VirusTotal File or Hash
n Fuzzy Hash Only — Fuzzy-hash reports are not populated until after you edit /etc/solera/extractor/extractord.conf as shown and then run systemctl restart solera-extractord:
# Flag to calculate the fuzzy hash calc_fuzzy_hash=1 <== Uncomment this line and set the value to 1
n Because the hash reports contain data that is calculated after the flows are sent through the rules engine, you cannot use hash attributes as valid indicators for rules. For example, md5_hash~93fd02e cannot trigger a rule; however, it can be a valid primary or advanced filter. (See "Primary Filters" on page 107, "Advanced Filters" on page 113, "Indicators" on page 129)
Enable hash calculation for manual extractions on Settings > System. (Those settings do not affect hash-related reports.)
Open-Parser Rules
Report data for open-parser rules is written to the Indexing DB only when the following are true:
n The open-parser rule is active.
n The rule specifies that metadata be written to the Indexing DB.
ExtractionsSymantec Security Analytics extracts and reconstructs most common file types so that you can see accurate copies of the images, web pages, and documents that have been transported across your LAN. (See "Artifact Preview" on page 161.) Reconstructed files are called "artifacts" in Security Analytics.
Security Analytics performs two types of extractions:
n Manual — When the user selects Menu > Analyze > Summary > Extractions. (See "Menu > Analyze > Summary > Extractions" on page 412.)
n Real Time — When a Data Enrichment rule registers a hit.
ArtifactsArtifacts are objects such as Microsoft Word files, executables, JavaScript files, and HTML pages.
152

Administration and CentralManager Guide SecurityAnalytics 8.1.3
When an artifact is transferred via HTTP or email, the MIME type is specified in the header ("presented" in system nomenclature). If it differs from the file type that the system detects, using the magic number or file signature, the value in the Type column is shown in red text. You can also use the file_type_mismatch attribute in the advanced filter to find all such artifacts.
Click an entry in the Results list to see additional information about the artifact.
1 HTTP Response Codes 4 Actions
2 MD5, SHA1, and SHA256 hashes*
5 HTTP method
3 Fuzzy hash * 6 Displayed MIME or file type
A set of actions along the bottom provides the following functionality:
Preview See "Artifact Preview" on page 161
153
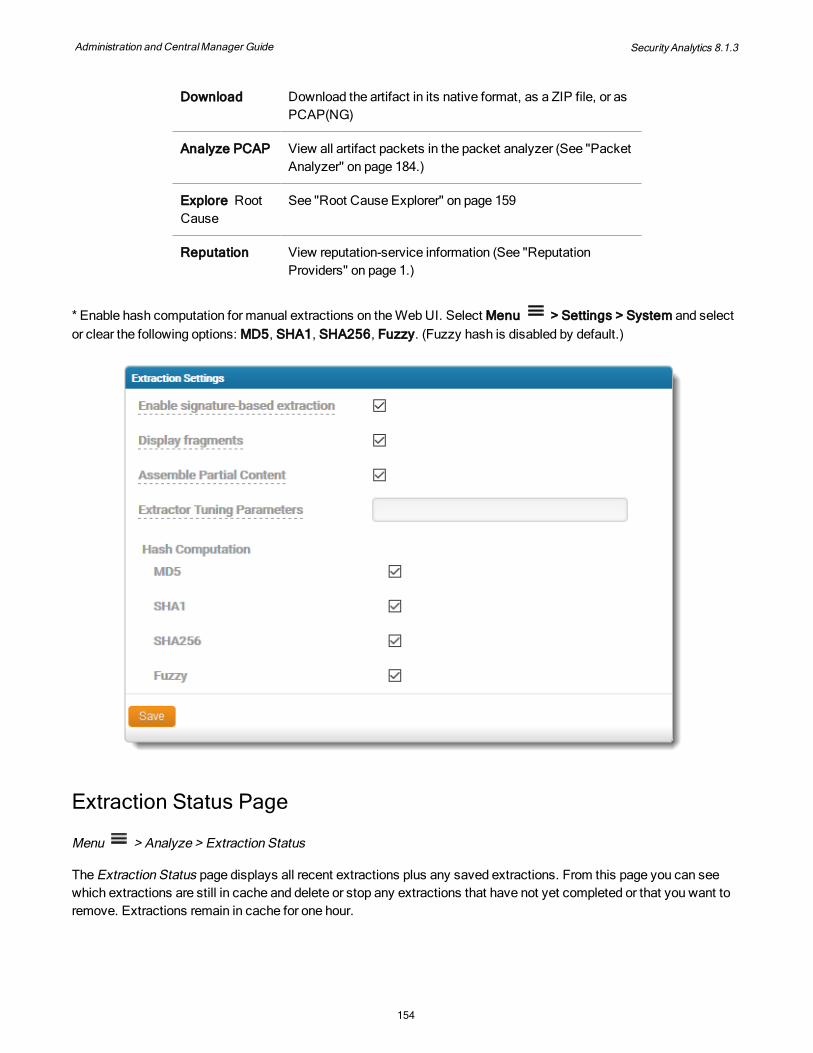
Administration and CentralManager Guide SecurityAnalytics 8.1.3
Download Download the artifact in its native format, as a ZIP file, or as PCAP(NG)
Analyze PCAP View all artifact packets in the packet analyzer (See "Packet Analyzer" on page 184.)
Explore Root Cause
See "Root Cause Explorer" on page 159
Reputation View reputation-service information (See "Reputation Providers" on page 1.)
* Enable hash computation for manual extractions on the Web UI. Select Menu > Settings > System and select or clear the following options: MD5, SHA1, SHA256, Fuzzy. (Fuzzy hash is disabled by default.)
Extraction Status Page
Menu > Analyze > Extraction Status
The Extraction Status page displays all recent extractions plus any saved extractions. From this page you can see which extractions are still in cache and delete or stop any extractions that have not yet completed or that you want to remove. Extractions remain in cache for one hour.
154

Administration and CentralManager Guide SecurityAnalytics 8.1.3
When you save an extraction by selecting Actions > Save on the Extractions page, the extraction is saved on this page until you delete it. Extractions that are not saved will be deleted from this page after six hours.
Field Description
Click to delete the extraction from the page and from disk
Stop the extraction
Pivot to the Extractions page to view the extraction
Click to copy the PCAP path to clipboard
Status Whether the extraction is running, canceled, or complete
Created By The user who initiated the extraction
ID The extraction ID
Start Timespan start time
End Timespan end time
Length Amount of time between Start and End
Started Time that the extraction was initiated
Finished Time that the extraction ended
Duration Amount of time to perform the extraction
Database Size of extraction metadata in the PostgreSQL database (/var/lib/pgsql)
Disk Size of the artifacts on the system disk (/home/apache/artifacts)
Artifacts Number of artifacts in the extraction
MIME-Type Display
Specify which method determines the displayed file type of an artifact on [Account Name] > Preferences:
n Artifact MIME-Type Display — Specify how the file type is displayed in the Type column on the Extractions page:
o Presented — Use the value in the Content-Type field of the HTTP or email header, else show unknown.
o Detected — Use the embedded magic number or file signature, else show unknown.
o Derived — If both presented and detected values are present, use internal logic to display the most likely file type.
155

Administration and CentralManager Guide SecurityAnalytics 8.1.3
SMB Artifacts
For artifacts transmitted over SMB, an extra field is displayed.
SMB Fragment displays whether the artifact is a known SMB fragment (true). To display SMB fragments, go to
Menu > Settings > System and select the Display fragments check box.
HTTP POST Payloads
For HTTP POSTs, the payload has a separate entry from the original POST and is displayed below it.
The payload artifact does not display an HTTP method or the HTTP response icon.
Click Show Payload to see the Artifact Details for the payload.
VoIP Extractions
The VoIP artifacts are extracted and displayed by segment and payload type rather than by participant. The figure below shows the segments from one side of the call: PCMU (default audio), CN (comfort noise), and video/H263
156

Administration and CentralManager Guide SecurityAnalytics 8.1.3
(which is present in the VoIP implementation but unused in this particular call). (Consult RFC 3551 for payload formats.)
From the main (multipart/x-voip) artifact entry, you can download the entire call in Ogg or WAV format or as a PCAP(NG).
To preview the call, select the Ogg or WAV format and then listen to the call.
Following the main artifact are separate artifacts that display each segment separately. From each separate entry you can download the raw version of that segment.
157

Administration and CentralManager Guide SecurityAnalytics 8.1.3
Save Extractions and ArtifactsYou may save the extraction results at any time, even if the extraction process for that view has not finished.
1. Open an Extractions page and apply any desired filters.
2. Select Actions > Save.
3. Type a name for the results.
4. If you click Save before the extraction process is finished, you are provided with two options:
n Save and Stop — Everything that was extracted until you click Save and Stop will be saved.
n Save and Continue — The save operation will continue until the extraction process is completed.
5. If you click Save after Status shows Finished (100%), all of the results in the view will be saved.
6. Click Save.
7. Go to Menu > Analyze > Extraction Status to retrieve the extraction. Saved extractions persist on disk until you manually delete them.
Save Multiple Extraction Items 1. Open an Extractions page and apply any desired filters.
2. Select the check boxes for the artifacts to save.
3. In the left panel, under Selected Actions (X), click Download Artifacts and follow the prompts to save the artifacts to your workstation in a ZIP file.
158

Administration and CentralManager Guide SecurityAnalytics 8.1.3
Cancel an ExtractionWhile an extraction is running, you can cancel it without saving the results.
1. Select Actions > Stop Extraction. A few minutes may elapse before the extraction stops completely.
2. When the extraction has fully stopped, the status will show Canceled 100% regardless of how much data was processed.
3. Optional — Select Actions > Save to save the data that was extracted before the process was canceled. After you have saved the data, you may restart the extraction by selecting Actions > Rerun.
Artifact PreviewSee "Artifact Preview" on page 161.
Root Cause ExplorerThe root cause explorer presents the chain of referrers for a given artifact.
1. To view referrer URL information, select Menu > Analyze > Summary > Extractions.
2. Click an artifact.
3. If there is a value in the Referrer field, click Explore Root Cause. The system will display the referring artifact. If that artifact also has a referrer, that artifact will be displayed as well, until no more referrers are found. All of the referrers must be in the same extraction session (same timespan and filters) for the referrer to be included.
Artifacts TimelineThe Artifacts Timeline view displays the distribution of artifacts across time.
n You can view the timeline by initiator/responder IP or port or by file type.
n Click the artifact or [X]Artifacts to see more information.
n Once you have selected an individual artifact, you can view it the same way as a single artifact.
Email ExtractionsThe Email view provides information about email messages (EML) and their attachments. If an attachment is included in an email, it can be exported using the FTP File Mover. (See "Configure Integration Providers" on page 216.)
Security Analytics extracts only non-encrypted email messages. To decrypt SSL/TLS-encrypted messages, install a Symantec SSL Visibilty Appliance upstream of the Security Analytics appliance.
159

Administration and CentralManager Guide SecurityAnalytics 8.1.3
n Click Preview to see the email.
n Click the attachment to select the file-type for download.
n Click View Attachment Details to see more information.
IM ConversationsThe IM Conversations view displays a list of IM conversations.
Security Analytics extracts only non-encrypted IM conversations. To decrypt SSL/TLS-encrypted messages, install Symantec SSL Visibilty Appliance upstream of the Security Analytics appliance.
IM Conversation Preview
160

Administration and CentralManager Guide SecurityAnalytics 8.1.3
1 Participant list, including avatars
2 Click to view more about each participant
3 Conversation details
4 Date of capture, such as the date the PCAP file was imported or the conversation was captured
5 Click to hide or show status changes
6 Conversation date
Media PanelThe media panel displays thumbnails of captured image, audio, and multimedia files. By default, images that are smaller than 2 Kb are not displayed.
1. Under Filter Results, you can select one or more image or audio file types.
2. Use the Advanced Filter to narrow the search.
3. Preview small, medium, or large thumbnails.
4. Place your cursor over a thumbnail to see a summary of its attributes (URL, source/destination IP, file size, MIME type). Click the thumbnail to see the image's actual size.
5. For audio files, click to launch an audio player for the file.
Tune the Extraction Process
Menu > Settings > System
Use these settings to better adapt the extraction process to your environment.
n Enable signature-based extraction — Enable this setting to determine how to extract artifacts from the protocols.
n Display fragments — Enable this setting to display whether the artifact is a known SMB fragment.
n Assemble partial content — Enable this setting to reassemble partial HTTP content, when possible.
n Extractor Tuning Parameters — Use this field only in conjunction with Symantec Support.
Artifact PreviewThe Preview function provides the following views:
161

Administration and CentralManager Guide SecurityAnalytics 8.1.3
n Audio — Audio player for VoIP calls and other audio files
n Email — The actual email message
n EXIF — The Exchangeable Image File data for JPG/JPEG files
n File Info — Output of the file command
n HTTP Headers — Request and response headers for the artifact
n Hex — Hex dump of the plain text
n Web Page — The HTML document with or without graphics, style sheets, and JavaScript®
n Image — The actual image: GIF, BMP, PNG
n jsunpack-n — The jsunpack-n results
n Strings — Output of the strings command
n Text — The plain text or formatted code, including FTP and Telnet sessions
Artifact ViewsThe Artifact Preview window displays all of the tabs for all of the views so that you can see different renderings for each artifact, regardless of the presented or detected file type.
Audio
A playable audio interface for audio files:
Any file can be displayed in the Audio view, and if you click the Play button, your browser will attempt to launch the file in its native application. Take care not to accidentally launch malware in this way; instead, click Download Artifact to obtain the artifact in a ZIP archive.
See "File Names Sent to Providers" on page 228 for an explanation of the default extractor file name.
162

Administration and CentralManager Guide SecurityAnalytics 8.1.3
The email message in HTML.
EXIF
For JPG/JPEG files, the embedded EXIF information.
File Info
Results from the File command, such as the artifact filename, file modification date/time, application version, and flags.
163

Administration and CentralManager Guide SecurityAnalytics 8.1.3
See "File Names Sent to Providers" on page 228 for an explanation of the default extractor file name.
HTTP Headers
The HTTP request and response headers for the artifact, such as GET, POST, error codes, cookies.
In the results list, you can also place your cursor over the icon to see the HTTP response code, if any.
164
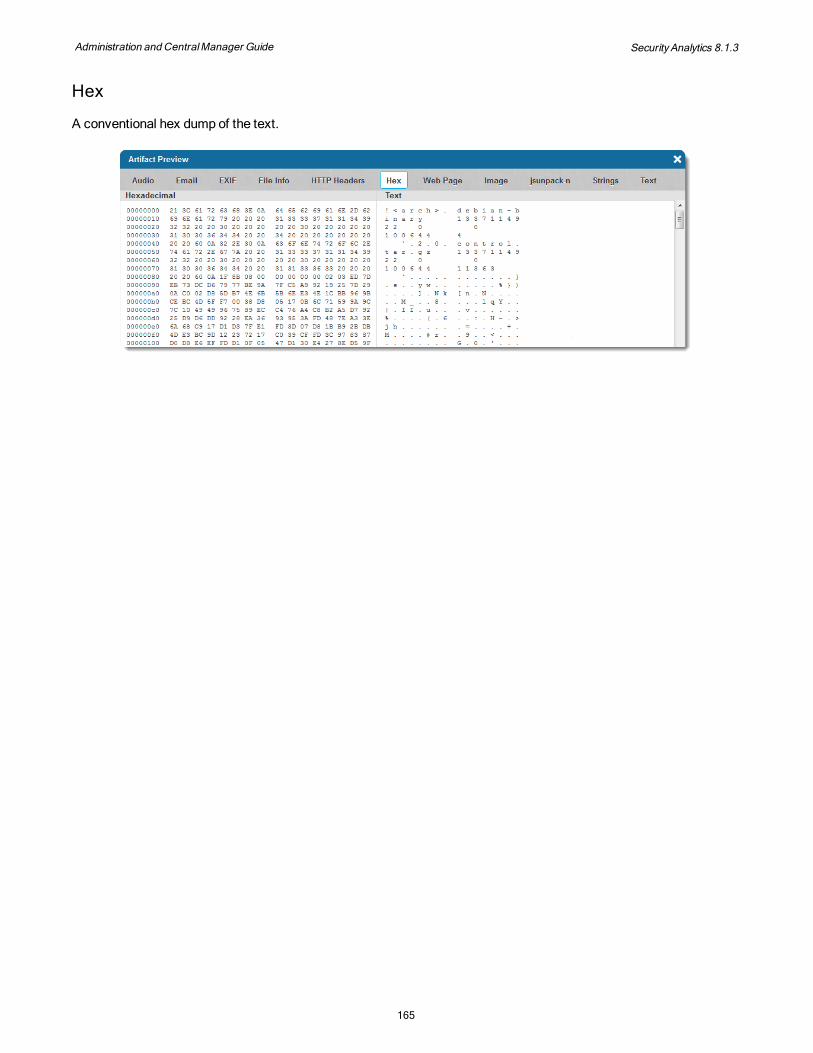
Administration and CentralManager Guide SecurityAnalytics 8.1.3
Hex
A conventional hex dump of the text.
165

Administration and CentralManager Guide SecurityAnalytics 8.1.3
Web Page
For text/html, the stripped-down web page.
Click View Options to add other elements (images, cascading style sheets, scripts) to the view.
n Captured Data — Retrieve from your capture drive.
n External — Retrieve from the Internet.
166

Administration and CentralManager Guide SecurityAnalytics 8.1.3
n Click View Page Elements to see a list of images, CSSs, and scripts that are included on the web page.
When you view scripts (captured or external), you risk infecting your system with any malware in the scripts. To prevent the importation of external images, stylesheets, and scripts during HTML preview, select Settings > Web Interface and clear the Enable External HTML Elements Preview check box.
Security Best Practice Clear the Enable External HTML Elements Preview check box.
n Click Download Artifact to save the HTML page (but not the page elements).
167

Administration and CentralManager Guide SecurityAnalytics 8.1.3
Image
The actual image, if it can be rendered.
jsunpack-n
The results from jsunpack-n. In most cases, there is no JavaScript inside the artifact, so it will return [nothing detected] and info:[0] no JavaScript.
For JS, PDF, HTML, and SWF files, the process will usually return more details. The phrase [nothing detected] means that no malicious code was found. (Most error messages are generated by the script as it attempts to access data and variables in other files; they are not an indication that the file has been corrupted.)
168

Administration and CentralManager Guide SecurityAnalytics 8.1.3
For a corrupted file jsunpack-n will designate elements as "malicious" or "suspicious":
169

Administration and CentralManager Guide SecurityAnalytics 8.1.3
Strings
Results from the Strings command.
Text
The artifact in plain text. You can select one of the Syntax Highlighting options to see code in its native formatting.
Syntax Highlighting Options
ActionScript®3
CSS Formatted
HTML Formatted
Perl® Scala
Bash/Shell Delphi JavaScript PHP SQL
ColdFusion Diff JS Formatted Plain Text
Visual Basic®
C# Erlang Java Python XML
C/C++ Groovy JavaFX® Ruby XML Formatted
CSS HTML
170

Administration and CentralManager Guide SecurityAnalytics 8.1.3
Encoder/Decoder Tool
When the text consists of obfuscation-encoded characters such as BASE-64 or URL, you can decode the text by
copying the text and selecting [Account Name] > Encoder/Decoder Tool. Paste the text to decode in Encoded Text, select the Algorithm, and click Decode. (Alternatively, you can paste plain text into Decoded Text, select an algorithm, and click Encode to encode the text.)
171

Administration and CentralManager Guide SecurityAnalytics 8.1.3
For FTP sessions, the Text preview shows the sequence of events .
For Telnet sessions, the Text preview (HTML Formatted) displays the messages with <server> and <client> tags.
SessionsNew in Security Analytics 8.1.1
See also "Menu > Analyze > Summary > Sessions" on page 414
The Sessions table presents a detailed, filterable view of sessions seen by Security Analytics. A session is a defined conversation between two endpoints. By filtering the sessions for a specific time range and for certain attributes, you can diagnose and troubleshoot network problems.
172

Administration and CentralManager Guide SecurityAnalytics 8.1.3
Example of how the sessions table can be useful:
1. Your firewall sends an alert about traffic between two endpoints. You want to understand what was happening on the network between these two endpoints, both at the time of the alert and for a few days before.
2. To troubleshoot this issue, go to the Sessions tab in Security Analytics, set the timespan filter to the time of the alert and for the preceding 72 hours, and set the IP address filters to the two endpoints.
3. Analyzing the Sessions table, you see that most of the traffic has been classified as HTTP, although not necessarily on standard HTTP ports (80 and 443). What URLs are being accessed and from what countries? You need to add some additional columns to find out.
4. On the Actions menu, select Add/Edit Columns, and add HTTP URI and Country Responder.
5. End result: The Sessions table displays all of the information (IP, ports, application IDs, URI paths, responder countries) necessary to help troubleshoot the issue and identify outliers.
Sessions Page
Menu > Analyze > Summary > Sessions
1 Filter bar—Enter attributes to filter the session results. See "Using the Filter Bar" on page 107.
2 View selector—Create named session views so that you can quickly retrieve them later. The view includes the type and order of columns, but not the filter.
3 Advanced Filter
173

Administration and CentralManager Guide SecurityAnalytics 8.1.3
4 Session results list
5 Status bar
6 Actions:
Analyze—View packets for the selected session in the packet analyzer (See "Packet Analyzer" on page 1.)
Extract—Open the selected session in the Extractions view. See "Extractions" on page 1.
Download—Download the pcap of the selected session. See "PCAP Files" on page 1.
Session Results TableThe sessions table lists the sessions that match the attributes defined in the advanced filter for the defined time range. Click on any of the column headers to sort on the column value; click a second time to invert the sort order. To specify how many rows to display at a time use the Results per Page control at the bottom of the page. (Permanently set this
value by selecting [Account Name] > Preferences.)
Security Analytics tracks a variety of statistics for the sessions that it sees. By default, the sessions table displays fields for initiator IP address and port, responder IP and port, application ID, packets, and bytes. To specify additional fields, select Actions > Add/Edit Columns.
In the session results table, some items are colored black (such as date/time values) and others are blue (IP addresses, ports, etc.). Blue values are hot links that display a shortcut menu when clicked. This shortcut menu provides options for building a filter based on the value. For example, if you click http in the application_id column, you can build a filter application_id="http". For more information, see "Create Filters from Graphical Screen Elements" on page 114.
Detail View
To see detailed statistics and information about a particular session, use Detail View. Detail View shows over 30 different fields for the selected session, including application_group, bytes, flow_duration, ip_protocol, and packets. These details appear within the session results table, directly below the selected session row; rows below the selected row slide down to make space for the details.
174

Administration and CentralManager Guide SecurityAnalytics 8.1.3
To display the details associated with a selected session, do one of the following:
n Click in an empty area of a cell in the session row.
Note: Don't click on blue values in a cell—this data is a hot link that displays a shortcut menu. If you do that accidentally, just click on an empty area.
n Use the up- and down-arrow keys on the keyboard to select the session row, then press the right-arrow key.
To hide the details, click again in an empty area of the cell or press the left-arrow key.
Additional Notes
n You are allowed to display Detail View of as many sessions as you like. Note that details are not saved with the report.
n There is not a keyboard control for displaying the next page in the sessions results; click Next to display the next page of results.
Save Session ResultsYou can save session results to view later.
1. Select Menu > Analyze > Summary > Sessions.
2. Optional — Use the primary filter or timespan filter, as desired.
3. Select Actions > Save.
4. Type a name for saved output (max. 300 characters).
5. Click Save.
6. To retrieve the saved results:
a. Select Menu > Analyze > Report Status > List.
175

Administration and CentralManager Guide SecurityAnalytics 8.1.3
b. In the Name column, locate the name you assigned to the saved sessions report.
c. Click to view the report.
GeolocationSymantec Security Analytics provides "geolocation," which is a representation of a host location on a world map.
n Select Menu > Analyze > Summary > Geolocation to view the geolocation report. (See "Menu > Analyze > Summary > Geolocation " on page 415.)
n The Report Summary panel displays a geographic representation of the filtered data. By default, the map is centered on the Greenwich meridian at the equator (0 lat, 0 long).
n The geographic location of every IP address is identified by a dot on the map. The size of the dot indicates amount of data transferred to or from that geographical area, and the saturation of the color indicates the concentration of markers: darker dots indicate that, upon zooming in on that location, you will see multiple markers.
Geolocation can locate only IP addresses that have location information in the MaxMind databases.
Map NavigationUse the controls in the upper-left corner to zoom and center the map.
Press Shift and drag your cursor to select a specific area of the map to enlarge. The results will change to list only the results that are in the view.
To return to the full view, click the globe icon.
176

Administration and CentralManager Guide SecurityAnalytics 8.1.3
Place your cursor over a dot to see how many IP addresses and how much traffic is associated with that location.
To save the view (the magnification and area), select Save Current Map as View.
Fill in the fields as desired and click Save. The view is now available from the view selector.
Results List
Click a location to see all of the IP addresses that are associated with that location.
177

Administration and CentralManager Guide SecurityAnalytics 8.1.3
The locations in the list will be as specific as possible. A general item such as “United States” contains all of the IP addresses in the U.S. for which a more specific location could not be found. It is not the total of all IP addresses in the United States.
Saving Geolocation Results 1. To save the results, click Actions > Save.
2. Give the results a name and click Save.
3. Retrieve the results from Analyze > Saved Results. Click View Report to open the results as an IPv4 Conversation report.
Notes on the Accuracy of Geolocation Data
n Geolocation can identify only the server location, not a specific device.
n Routing randomization with services such as Tor® or Onion may produce unreliable geolocation data.
n IP addresses can be spoofed with readily available technology.
Geolocation Settings
Select Menu > Settings > Geolocation to open the Geolocation page. On this page you can view and specify values used when examining the geographic location of connections. These include internal subnets, Google Earth country colors, and MaxMind city databases.
178

Administration and CentralManager Guide SecurityAnalytics 8.1.3
Internal Subnets
Use the Internal Subnets controls to specify the geographic location of an internal subnet (or multiple subnets). This marks all the traffic on that subnet as occurring at a single location.
By definition, internal subnets do not have an externally knowable geographic location and by default are located at 0 latitude, 0 longitude. Use the Internal Subnets feature to specify where your subnets are located on the world map.
example
A company has offices in New York, Vancouver, and Tokyo. Their network IPs are 10.1.0.0/16 for New York, 10.2.0.0/16 for Vancouver, and 10.3.0.0/16 for Tokyo. Without setting the internal subnet values, they would all appear at 0,0 on the map. With the Internal Subnets feature, the subnets appear in their proper locations.
Specify Geographic Locations for Internal Subnets
1. Select Menu > Settings > Geolocation.
2. Under Internal Subnets, select the Enable Internal Subnets check box.
3. Type the IPv4 address for the subnet using a CIDR notation that includes zeroes: 192.168.0.0/16. For IPv6 addresses, do not include a subnet mask.
4. Type the latitude and longitude for the subnet.
5. Type a label for the subnet.
The label that you specify can be anything you want; it will be displayed in the data table and when users place their cursors over the dot on the map.
6. To specify additional internal subnets, click add a new subnet.
Geolocation FiltersThe Advanced Filter control in the Results panel allows you to easily and rapidly apply additional filtering to the report data.
To apply an advanced filter, click the Add a Filter box and select the filter term you want to use. To apply a primary filter, follow these steps:
179

Administration and CentralManager Guide SecurityAnalytics 8.1.3
1. Select Menu > Analyze > Summary > Geolocation.
2. In the Results panel, under Location, click the city name to look at. The item expands, displaying a list of the IP addresses that are associated with that geographic location.
3. Click an IP address to examine.
4. For each IP address to add as a filter, click Add to Filter Bar > As[attribute]>[Equals | Not Equals]. The filter is added to the filter bar.
n If you click Add to Filter Bar only, the filter ipv4_address="x.x.x.x" is added to the filter bar.
5. When you have finished adding filters, click Update.
MaxMind City and Country DatabasesThe system can use either the free (GeoLite2® City) or paid (GeoIP2® City) versions of the MaxMind City Databases or the MaxMind Country Databases in both IPv4 and IPv6. For more information on these databases, visit GeoLite2 or GeoIP2 and download the MaxMindDB binary.
n Once a MaxMind City database is uploaded, it cannot be removed.
n Download the database from the MaxMind site and then unzip the file. Only MMDB-formatted files can be uploaded.
n MaxMind releases new, free databases every month and a new paid database every week. You must upload these updated versions manually.
1. Select Menu > Settings > Geolocation.
2. Under Upload MaxMind [X] Database, click Browse.
3. Locate and select the database file.
4. Click Upload. This uploads the database to Security Analytics, and it is immediately available for geolocation as well as the Country Initiator and Country Responder reports.
180

Administration and CentralManager Guide SecurityAnalytics 8.1.3
Google EarthUse the Google Earth settings to control the default color used for markers and routes in Google Earth, enable and disable the display of routes, and set the color used for transactions that start or end in a country.
Google Earth can color the routes to captured IP addresses differently from the defaults or those of a different country.
1. Select Menu > Settings > Geolocation.
2. Under Google Earth Country Colors, do the following:
n Click the color swatch for Default Color to change the pin color.
n Select Enable Routes.
n Select Enable Country Colors.
3. If you selected Enable Country Colors, select a country.
4. Click the Color swatch to open the color picker.
5. Specify the color and click Select.
6. To specify colors for additional countries, click add a new color.
7. Click Save.
Google Earth Files (KML, KMZ)
KMZ files are compressed KML files.
1. On Menu > Analyze > [Summary | Reports | Extractions | Geolocation], select Actions > Google Earth.
2. Select Save File and click OK.
3. The KMZ file is saved to your downloads directory.
4. To display KMZ and KML files, open them in the Google Earth application.
Encapsulation DetectionSecurity Analytics can detect and display various types of packet encapsulation.
PPPoEThis figure from the Packet Analyzer shows part of an HTTP session that contains PPP-over-Ethernet encapsulation.
181

Administration and CentralManager Guide SecurityAnalytics 8.1.3
The Layer 2 protocol is visible only in the Packet Analyzer, whereas the Ethernet Protocol and IP Protocol reports display IPv6 and TCP, respectively.
IPv6 in IPv4For IPv6-in-IPv4 encapsulation, as shown in this figure from the Packet Analyzer, both types of IP addresses are indexed.
The IPv6 addresses are displayed in the IPv6 Initiator and IPv6 Responder reports, and the IPv4 encapsulation is displayed in the Tunnel Initiator and Tunnel Responder reports.
182

Administration and CentralManager Guide SecurityAnalytics 8.1.3
GRE EncapsulationSymantec Security Analytics can identify the endpoints and reconstruct the content of GRE-encapsulated IPv4, IPv6, and WCCP flows. The following figure shows how GRE-encapsulated traffic appears on the Summary page in a customized view. (See "Create a Summary View" on page 145.)
The endpoints of the GRE tunnel are displayed in the Tunnel Initiator and Tunnel Responder report widgets. The IPv4 Conversation report widget shows the IPv4 sessions that were encapsulated in the GRE tunnel. The IPv6 Conversation report widget would show any GRE-encapsulated IPv6 sessions.
Capture filters can be configured to find GRE-encapsulated IPs using offsets. (See BPF Syntax in the Security Analytics 8.1.x Reference Guide on support.symantec.com.)
The Extractions page displays the artifacts that passed through the GRE tunnel.
183

Administration and CentralManager Guide SecurityAnalytics 8.1.3
Packet Analyzer
Select Actions > Analyze Packets on Menu > Analyze > [Summary | Reports | Extractions | Geolocation] to see the data in an interface similar to Wireshark’s.
By default, the Packet Analyzer will load only the first 1000 packets of the specified PCAP. As you scroll down to packet number 1001, Packet Analyzer will automatically load the next 1000 packets onto the screen. (For reference, the PCAP path is displayed at the top of the window.) It is recommended that you not load more than 10,000 packets, to avoid performance degradation.
Packet Analyzer FiltersThe Packet Analyzer filter uses the same syntax as Wireshark® display filters. Type the desired filter string in the space provided and click Apply Filter. For more examples and information, see wiki.wireshark.org/DisplayFilters.
Action Filter Syntax
Show only SMTP (port 25) and ICMP traffic. tcp.port eq 25 or icmp
Show packets originating from 192.0.2.0 and destined for 203.0.113.0.
ip.src == 192.0.2.0/24 and ip.dst == 203.0.113.0/24
Show packets originating from 2620:3b:afa:2030::1 and not destined for 2620:3b:afa:2aaf::202
ipv6.src eq 2620:3b:afa:2030::1 and ipv6.dst ne 2620:3b:afa:2aaf::202
TCP buffer full — Source is instructing Destination to stop sending data.
tcp.window_size == 0 &&tcp.flags.reset != 1
Filter on Windows — Filter out noise, while watching Windows Client/DC exchanges.
smb || nbns || dcerpc || nbss || dns
Match packets that contain the 3-byte sequence 0x81 0x60 0x03 anywhere in the UDP header or payload.
udp contains 81:60:03
Match HTTP requests where the last characters in the URI are the characters gl=se. The $ character is a PCRE punctuation character that matches the end of a string, in this case the end of the http.request.uri field.
http.request.uri matches "gl=se$"
Packet ListThe Packet List pane has 8 columns and as many rows as needed to show the data being analyzed. You cannot change the columns, the sort order, or the colors. The default columns show the following data:
No. The number of the packet in the capture file. This number will not change even when a filter is used.
Time The timestamp of the packet. The presentation format of this timestamp cannot be changed.
Source The IP address of the packet’s origin
184

Administration and CentralManager Guide SecurityAnalytics 8.1.3
Src Port The port of the packet’s origin
Destination The IP address of the packet’s destination
Dst Port The port of the packet’s destination
Protocol The protocol name in a short (perhaps abbreviated) version
Info Additional information about the packet content
Follow TCP Stream
Click a TCP or HTTP field in the packet list to invoke the Follow TCP Stream control.
If there are fields in the TCP stream, the Follow TCP Stream dialog will open to display color-coded text for both sides of the conversation.
185

Administration and CentralManager Guide SecurityAnalytics 8.1.3
You can also select one side of the conversation to view.
Packet DetailsThe Packet Details pane shows the selected packet in a detailed form that explicitly identifies the packet’s protocols. Click a protocol to see details.
Packet Bytes PaneThe Packet Bytes pane shows the data of the selected packet in a standard hex-dump style. As is usual for a hex dump, the left column shows the offset, the middle columns show the data in hexadecimal, and the right column shows the corresponding ASCII characters.
You can select the hex characters independently of the other hex-dump columns and then paste them into the Encoder/Decoder tool. (See "Encoder/Decoder Tool" on page 171.)
186

Administration and CentralManager Guide SecurityAnalytics 8.1.3
187

Administration and CentralManager Guide SecurityAnalytics 8.1.3
Data EnrichmentReputation Queries 188
Activate a Data-Enrichment Resource 189
Exclude from Lookup 189
Data Enrichment Filters 190
Enrichment Providers 190
Rules 230
Alerts 236
Remote Notifications 245
Data Enrichment Filters 247
Use data enrichment (also called "real-time extraction" or "micro-extraction") to send selected artifacts and flows to additional resources for analysis. Among the resources are:
n "Symantec Intelligence Services" on page 193
n "Symantec Analysis Providers" on page 202
n "Reputation Providers" on page 210
n "Additional Symantec Threat Intelligence Resources" on page 194
n "Third-Party Integration Providers" on page 214
Also see "Data Enrichment Process" on page 389.
Reputation QueriesSymantec Security Analytics supports two kinds of reputation queries:
n On Demand — The user initiates a reputation query from the web UI.
n Data-Enrichment Rule — A data-enrichment rule sends matching traffic to one or more enrichment providers, such as Symantec Intelligence Services.
188

Administration and CentralManager Guide SecurityAnalytics 8.1.3
Activate a Data-Enrichment ResourceSome of the data-enrichment resources must be licensed before they can be used.
n Contact Symantec Support to obtain a Symantec Intelligence Services subscription, a Symantec DeepSight or MATI login, Symantec Malware Analysis, Symantec Content Analysis, Symantec Endpoint Protection, or Symantec Endpoint Detection and Response.
n The Third Party On-Demand Reputation Providers are licensed by default.
n Licenses for the Third Party On-Demand Integration Providers are the responsibility of the user.
1. Select Menu > Settings > Data Enrichment.
2. In the Actions column, click the deactivated icon to activate that resource.
Consult "Security Analytics Ports and Protocols" on page 298 to configure your network firewalls for data-enrichment traffic.
Exclude from LookupYou can specify IP addresses and domains to exclude from lookup under Settings > Data Enrichment > Exclude from Lookup.
n This setting applies only to providers that evaluate URLs and IPs, such as the Web Reputation Service and VirusTotal URL.
n Non-routable addresses are excluded by default: 127/8, 10/8, 192.168/16, 172.16/12, 169.254/16.
n For IP Subnets, type those IP addresses that you want to exclude. Use CIDR notation without zeros: specify 127.0.0.0/8 as 127/8.
n For Internal Domains, type domain names to exclude.
n Type each entry on its own line.
n Alternatively, in the Alerts list, you can click a responder IP address to add it to this list.
189

Administration and CentralManager Guide SecurityAnalytics 8.1.3
Data Enrichment FiltersSee "Data Enrichment Filters" on page 109.
Enrichment ProvidersFor data enrichment, Security Analytics provides a broad range of options to get the latest threat intelligence on your network traffic.
URL and IP EnrichmentTo get additional threat intelligence on URLs and IP addresses, use these providers:
n Symantec Web Reputation Service*
n URL support for Symantec Malware Analysis*
n Symantec Threat Explorer*
n Symantec DeepSight*
n Symantec DeepSight MATI*
n Symantec EDR Manager*
n Customized Pivot-Only Providers
n Third-Party Integration Providers:
o VirusTotal® URL*
n Third-Party On-Demand Reputation Providers:
o Domain Age Reporter§
o Google Safe Browsing®
o Google® Search
o RobTex® Host
o RobTex IP
o SANS ISC® Host
o SANS ISC IP
o SORBS DNSBL Host
o SORBS DNSBL IP
o WHOIS Host §
o WHOIS IP§
* Requires additional licensing or subscription from Symantec or the vendor.
§ Domain Age Reporter and WHOIS cannot be used behind a proxy.
190

Administration and CentralManager Guide SecurityAnalytics 8.1.3
File and File-Hash EnrichmentTo get additional threat intelligence on files or file hashes, use these providers:
n Symantec File Reputation Service*
n Symantec Malware Analysis* §
n Symantec Content Analysis*
n Symantec Endpoint Protection*
n Symantec Threat Explorer*
n Symantec DeepSight*
n Symantec DeepSight MATI*
n Symantec EDR Manager*
n Customized Pivot-Only Providers
n Local File Analysis:
o ClamAV®
o Custom Hash List
o jsunpack-n
o YARA rules
n Third-Party On-Demand Reputation Providers:
o Google Search
n Third-Party Integration Providers:
o Cuckoo®§
o FireEye®AX-series*§
o Lastline® File* § or Hash
o ReversingLabs® TitaniumCore* §
o VirusTotal File* §
o VirusTotal Hash*
* Requires additional licensing, subscription, or system from Symantec or the vendor.
§Security Analytics sends the actual file to the provider.
Other Enrichment n Login Correlation — Get username/IP correlation from Microsoft® Active Directory logs.
n Endpoint — Send information on endpoints to providers such as EnCase® Cybersecurity by Guidance® Software.
Data Enrichment Resources in Dark SitesIn environments where the Security Analytics management interface (bond0) does not have Internet access, the availability of data-enrichment providers and other resources is as follows:
Provider Available Offline
Symantec Web Reputation Service Partially
Symantec File Reputation Service No
Symantec EDR Manager With on-site deployment
Symantec Content Analysis Yes
191

Administration and CentralManager Guide SecurityAnalytics 8.1.3
Provider Available Offline
Symantec DeepSight and MATI No
Symantec Endpoint Protection With on-site deployment
Symantec Malware Analysis Yes
Symantec Threat Explorer No
Anomaly Detection Yes
ClamAV With configuration change
Cuckoo Yes
Custom Hash List Yes
Domain Age Reporter No, nor behind a proxy
FireEye Yes
FTP File Mover Yes
jsunpack-n Yes
Lastline With on-site deployment
Live-Feed Indicators With internal mirror
Local File Mover Yes
SCP File Mover Yes
ReversingLabs TitaniumScale With on-site deployment
VirusTotal No
WHOIS No, nor behind a proxy
YARA Yes
n Symantec Web Reputation Service (WRS) — Partial offline support. Security Analytics first queries the locally hosted copy of the Web Reputation Service database. If the data-enrichment system cannot find the URL in the local database, and it cannot access the Symantec Global Intelligence Network, the verdict is Unrated.
n Symantec File Reputation Service (FRS) — No offline support; Internet connection required.
n Symantec EDR Manager (ATP) — Offline support with on-site deployment. The EDR Manager appliance's location relative to Security Analytics determines its availability.
n Symantec Content Analysis (CA) — Offline support with on-site deployment. The Content Analysis appliance's location relative to Security Analytics determines its availability.
n Symantec DeepSight and MATI — No offline support; Internet connection required.
n Symantec Endpoint Protection (SEP) — Offline support with on-site deployment. The Endpoint Protection Manager appliance's location relative to Security Analytics determines its availability.
192

Administration and CentralManager Guide SecurityAnalytics 8.1.3
n Symantec Malware Analysis (MA) — Offline support. When the FRS prefilter is enabled, Security Analytics attempts to retrieve a verdict from FRS. Where there is no verdict or no Internet connection, the data-enrichment system sends the file to the locally deployed MA appliance for detonation.
n Symantec Threat Explorer — No offline support; internet connection required.
n Anomaly Detection and Modeling (ADM) — Offline support. The ADM system does not use Internet resources.
n ClamAV — Offline support with configuration change. By default, ClamAV retrieves updates from the Internet, but it also supports private local mirrors for its signature database. Refer to the ClamAV documentation online (https://www.clamav.net/documents/private-local-mirrors) and in the man files for /etc/freshclam.conf for information on configuring ClamAV to use a local mirror.
n Cuckoo — Offline support. The Cuckoo sandbox is deployed locally by the user. Responsibility for update mechanisms resides with Cuckoo and is external to Security Analytics and Symantec. More information is available at http://www.cuckoosandbox.org/.
n Custom Hash List — Offline support. The custom hash list accepts MD5, SHA1, and SHA256 hashes as input by the user but does not use Internet resources.
n Domain Age Reporter — No offline support. Domain Age Reporter cannot be used behind a proxy.
n FireEye — Offline support. FireEye’s MAS and AX appliances are deployed locally by the user. Responsibility for update mechanisms resides with FireEye and is external to Security Analytics and Symantec .
n FTP File Mover, Local File Mover, SCP File Mover — Offline support. The file servers are deployed locally by the user; no Internet resources are necessary.
n jsunpack-n — Offline support. This open-source utility is wholly contained on the Security Analytics appliance; no online or offline updates are necessary.
n Lastline — Offline support with on-site deployment. Typically deployed as a cloud-based sandbox solution, Lastline can also be deployed on-site, which removes the need for Internet access.
n Live-Feed Indicators — Offline support with internal mirror. By default the live-feed indicators require Internet access for updates, but the indicators can be edited to point to a local mirror instead.
n TitaniumScale — Offline support. The ReversingLabs TitaniumScale server is deployed locally by the user. Responsibility for update mechanisms resides with ReversingLabs and is external to Security Analytics and Symantec .
n VirusTotal — No offline support. VirusTotal is a cloud-based antivirus scanner that requires Internet connectivity.
n WHOIS — No offline support. WHOIS cannot be used behind a proxy.
n YARA — Offline support. YARA rules are maintained locally by the user; no Internet resources are necessary.
Symantec Intelligence ServicesUse the Symantec Intelligence Services as integration providers for Data Enrichment Rules or as reputation providers for on-demand queries.
193

Administration and CentralManager Guide SecurityAnalytics 8.1.3
The following features are available only with an Intelligence Services subscription. Contact support for more information.
n File Reputation Service (FRS) — The SHA256 hashes of files that match a rule are sent to the Symantec Global Intelligence Network (GIN), which returns a verdict based on the file-reputation information from more than 15,000 customers and 75 million endpoints that contribute to GIN’s threat intelligence, which includes:
o A blacklist of 3.5 billion file hashes
o Additional black and white lists from three major security organizations
o Symantec Malware Analysis detonation results from the field
o Research results from Symantec Labs
o Symantec controls the final verdict behind a File Reputation Service score with algorithms and logic to minimize some of the noise; for example, weighting detections from less-reputable vendors differently
n Web Reputation Service (WRS) — The URLs associated with artifacts that match the rule are sent to GIN, which returns one or more URL categories that Security Analytics evaluates for its threat level.
The Intelligence Services provide the following reports and report widgets:
n File Signature Verdict — Verdicts that are returned by the File Reputation Service.
n Malware Analysis Verdict§ — Verdicts that are returned by SymantecMalware Analysis.
n URL Categories — URL category, returned from GIN.
n URL Risk Verdict — Risk level assigned by Security Analytics based on the URL categories.
n Local File Analysis — Verdict on common file types from the local file analysis providers (YARA, ClamAV, jsunpack-n).
§ Data for this report is available only from a Symantec Malware Analysis or Content Analysis appliance. (See "Content Analysis Integrations" on page 202.)
To report false positives for Symantec services go to this link: https://symsubmit.symantec.com/
Additional Symantec Threat Intelligence Resources
n Endpoint Protection — View which hosts have a particular file, and then apply policies to infected hosts.
n Endpoint Detection and Response — Pivot directly from SHA256 hashes, URLs, and IP addresses to your Symantec Endpoint Detection and Response (ATP) manager.
n DeepSight — Pivot directly from Security Analytics to DeepSight from URLs and file hashes (MD5, SHA1, SHA256).
194

Administration and CentralManager Guide SecurityAnalytics 8.1.3
n ICAP — Integrate with Symantec Content Analysis. To obtain Content Analysis, contact Symantec Support.
n Local File Analysis — A feature that is provided by default, local file analysis resources include YARA rules, ClamAV, and a user-defined hash list.
n Malware Analysis — Files that trigger a user-defined rule are sent automatically to one or more Symantec Malware Analysis or Content Analysis appliances to evaluate their behavior in a sandbox or virtual environment. Files can be manually sent for Malware Analysis (called "on-box sandboxing" on Content Analysis) from Security Analytics as well. Malware Analysis returns a verdict to indicate the level of maliciousness. To obtain Content Analysis, contact Symantec Support.
Web Reputation Service Database Updates
To configure the updates for the local copy of the Web Reputation Service database, select Settings > Data Enrichment and scroll down to Web Reputation ServiceUpdate Location.
n Web Reputation ServiceVersion — Displays the current Web Reputation Service version and when it was last updated.
n Initiate Web Reputation Service Update — Click Update to force a local Web Reputation Service update.
n Update Interval in Seconds — Specify how many seconds between automatic Web Reputation Service updates.
n Enable Custom Update Location — Select the check box to configure an alternate location from which to update the Web Reputation Service database.
o URL — Specify the location. If the database is controlled by Basic HTTP Auth, also specify the Username and Password.
Troubleshooting Symantec Intelligence Services
If you are not getting responses from the Global Intelligence Network (GIN), try investigating the following issues:
n Time and NTP Settings — Incorrect time may prevent SSL validation, which prevents access to GIN.
n SSL Intercept — Security Analytics does not support SSL intercept of management traffic (bond0), because the intercept devices send different WRS and FRS certificates to Security Analytics.
n OCSP Validation and Connectivity — If OCSP fails and certificate revocation is enabled, GIN also fails. (See "Certificate Revocation Checks for Symantec and Security Analytics Services" on page 296.)
Intelligence Services Diagnostic Tests
The Intelligence Services diagnostic tests display relevant information to assist in troubleshooting your Intelligence Services connections. Alternatively, you can run the GIN Diagnostic Script.
1. Under Symantec Intelligence Services, click the Test Service icon for Web Reputation Service or File Reputation Service and select one or more of the tests to run:
195

Administration and CentralManager Guide SecurityAnalytics 8.1.3
Web Reputation Service Tests
n Web Reputation Service Rules Config — Displays whether the Web Reputation Service and the Web Reputation Service rule are active.
n Web Reputation Service Credentials — Verifies that the Web Reputation Service credentials are correctly stored in the vault.
n Web Reputation Service Database Status — Displays the last time that the local copy of the Web Reputation Service was downloaded.
n Web Reputation Service — Sends a test request to the Web Reputation Service and displays the result.
File Reputation Service Tests
n File Reputation Service Rules Config — Displays whether the File Reputation Service and the File Reputation Service rule are active.
n File Reputation Service Credentials — Verifies that the File Reputation Service credentials are correctly stored in the vault.
n File Reputation Service — Sends a test request to the File Reputation Service and displays the result.
2. Click Run. The results are displayed below. Click the arrow by each test result to see details.
3. Click Download Diagnostic Data to download gin.diag.out.<ID>.tar.gz, which contains the PCAPs of the tests as well as the log. It may take a few minutes to generate the file:
n gin.diag.out.<ID>.bcwf.ocsp.pcap — Testing the Web Reputation Service with OCSP.
n gin.diag.out.<ID>.bcwf.pcap — Testing the Web Reputation Service without OCSP.
n gin.diag.out.<ID>.frs.ocsp.pcap — Testing the File Reputation Service with OCSP.
n gin.diag.out.<ID>.frs.pcap — Testing the File Reputation Service without OCSP.
n gin.diag.out.<ID>.log — Test log.
GIN Diagnostic Script
The gindiag.sh script gathers relevant information to assist in troubleshooting your GIN connection. When you run gindiag.sh, it conducts a series of tests on the NTP setup, the DNS settings, and the File Reputation Service (FRS) and Symantec WebFilter (BCWF) connections, both with and without OCSP validation. The PCAPs for those tests plus the log are archived in /tmp/gin.diag.out.<ID>.tar.gz, where ID is a unique number for each time the script is run. You can analyze the PCAPs yourself or send them to Symantec Support.
[root@hostname ~] gindiag.shbeginntpdnsfrs credsbcwf credsbcwf dirfrs testbcwf testshine logendcollect files into archive:-rw------- 1 root root 2922377 YYYY-MM-DD hh:ii gin.diag.out.<ID>.bcwf.ocsp.pcap-rw------- 1 root root 2774852 YYYY-MM-DD hh:ii gin.diag.out.<ID>.bcwf.pcap-rw------- 1 root root 7675 YYYY-MM-DD hh:ii gin.diag.out.<ID>.frs.ocsp.pcap
196

Administration and CentralManager Guide SecurityAnalytics 8.1.3
-rw------- 1 root root 10241 YYYY-MM-DD hh:ii gin.diag.out.<ID>.frs.pcap-rw------- 1 root root 3440147 YYYY-MM-DD hh:ii gin.diag.out.<ID>.logPlease submit /tmp/gin.diag.out.<ID>.tar.gz
Symantec On-Demand ProvidersIntegrate Symantec Security Analytics with various other Symantec solutions to obtain additional threat intelligence or to enact policies on your endpoints.
n Symantec Endpoint Protection
n Symantec DeepSight
n Symantec EDR Manager
n Symantec Threat Explorer
Symantec Endpoint Protection
Symantec Endpoint Protection is designed to address today’s threat landscape with a comprehensive approach that spans the attack chain and provides defense in depth. By utilizing the world’s largest civilian threat-intelligence network, Symantec Endpoint Protection can effectively stop advanced threats with next-generation technologies that apply advanced machine-learning, file reputation analysis, and real-time behavioral monitoring.
Customers who have deployed Symantec Endpoint Protection (SEP) in their environment can configure Security Analytics to send actionable information to SEP directly from the Security Analytics web UI. To obtain SEP, contact Symantec .
Also see "Endpoint Providers" on page 217.
Integrate Endpoint Protection Manager with Security Analytics
Follow these steps to integrate Security Analytics with Endpoint Protection.
1. Select Menu > Settings > Data Enrichment.
2. Under Symantec On-Demand Providers, click the edit icon for SEP.
3. Provide the Location (IP or hostname), Username, and Password for the Endpoint Protection Manager.
4. For Data Enrichment Actions, select one or more of the following options to provide on the web UI:
n List Infected Hosts — Display the endpoints that have received this file. Security Analytics sends the file hash to SEP, which returns the endpoints where the file resides.
n List Infected Host — Display the endpoint for this instance of the file. Security Analytics sends the source and destination IPs for this artifact to SEP, and then SEP returns the endpoint that has the file.
n Remediate File — Apply the remediation policy to all instances of the file on all endpoints that are managed by the Endpoint Protection Manager.
197

Administration and CentralManager Guide SecurityAnalytics 8.1.3
o The remediation policy quarantines the file and adds the file hash to the File Fingerprint List on the Endpoint Protection Manager.
l You can view the File Fingerprint List by selecting Policies > Policy Components > File Fingerprint Lists.
l Entries in the File Fingerprint List that were added by Security Analytics can be deleted by selecting Clients > Policies > System Lockdown. Under Application File Lists, select an entry in the File Fingerprint List and click Remove.
o In the Endpoint Protection Manager quarantine log, the Risk is listed as "Manually Generated Anomaly."
n Remediate File by IPs — Apply the remediation policy to all of the selected hosts with the same source and destination IPs. Security Analytics sends the source and destination IP addresses to SEP, and then SEP applies the remediation policy to all instances of the file that match the IPs.
5. Click Save.
6. Click the Deactivated icon to Activate the SEP integration.
Perform SEP Actions
1. On the Extractions page, expand an artifact.
2. Click the file name and then select Perform Action > SEP > [action].
3. Security Analytics sends the information (source/destination IPs, file hash) to the SEP manager, which displays the requested information or performs the specified action.
When you select List Infected Host(s), the SEP manager queries all hosts, which then perform their own searches for the file hash. During that time, the request to SEP may time out. In that case, wait a few minutes and then repeat the request. Security Analytics will return the results from cache.
DeepSight Intelligence Services
198

Administration and CentralManager Guide SecurityAnalytics 8.1.3
Get a complete range of threat intelligence along with supporting research tools that encompass information on vulnerabilities, malware, indicators of compromise, campaigns, tactics/techniques/ procedures, and adversary profiles. SymantecDeepSight Intelligence provides you with a complete view of relevant threats and exposures. DeepSight Managed Adversary and Threat Intelligence (MATI) research, Directed Threat Research (DTR), a full range of technical intelligence, and management mechanisms for Data feeds and the API are accessible via this customizable portal. A separate subscription from Symantec is required to access these resources.
I
ntegrate DeepSight with Security Analytics
Follow these steps to integrate DeepSight or DeepSight MATI with Security Analytics.
1. Select Menu > Settings > Data Enrichment.
2. Under Symantec On-Demand Providers, click the Deactivated icon to Activate each DeepSight integration.
Pivot to DeepSight or MATI
Follow these steps to use the DeepSight integrations with reports or artifacts.
Reports for DeepSight
1. Open a Summary View or a Reports page.
2. Click one of the following fields:
n DNS Answer Name n DNS IPv4 Answer n DNS IPv6 Answer n DNS Query n HTTP Referrer
n HTTP Server n HTTP URI n IPv4 Addresses n IPv6 Addresses n MD5 Hash
3. Select View Reputation Information > DeepSight.
Artifacts for DeepSight
1. On the Extractions page, expand an artifact.
2. Click one of the following fields:
n HTTP Referrer n IP Addresses n MD5 n SHA256 n URI Host
3. Select View Reputation Information > DeepSight.
4. Pivot to DeepSight
199

Administration and CentralManager Guide SecurityAnalytics 8.1.3
Reports for MATI
1. Open a Summary View or a Reports page.
2. Click one of the following fields:
n DNS IPv4 Answer (MATI IP) n DNS IPv6 Answer (MATI IP) n DNS Query (MATI Domain) n HTTP Server (MATI Domain)
n IPv4 Addresses (MATI IP) n IPv6 Addresses (MATI IP) n MD5 Hash (MATI Hash) n SHA256 Hash (MATI Hash SHA256)
3. Select View Reputation Information > MATI [X].
Artifacts for MATI
1. On the Extractions page, expand an artifact.
2. Click one of the following fields:
n IP Addresses (MATI IP) n MD5 Hash (MATI Hash) n SHA256 Hash (MATI Hash SHA256) n URI Host (MATI Domain)
3. Select View Reputation Information > MATI [X].
Endpoint Detection and Response (EDR)
Uncover the stealthiest threats that would otherwise evade detection by using global intelligence from one of the world’s largest cyber intelligence networks combined with local customer context. ATP provides a layered approach at the email, cloud, network, and endpoint levels. To obtain EDR, contact Symantec.
Integrate EDR Manager with Security Analytics
Follow these steps to integrate ATP with Security Analytics.
1. Select Menu > Settings > Data Enrichment.
2. Under Symantec On-Demand Providers, click the edit icon for EDR.
3. For Location enter the IP address or hostname of the EDR Manager and click Save.
4. Click the Deactivated icon to Activate the EDR integration.
Pivot to EDR
Follow these steps to use the EDR integration with reports or artifacts.
200

Administration and CentralManager Guide SecurityAnalytics 8.1.3
Reports
1. Open one of the following reports in a Summary View or on the Reports page:
n SHA256 Hash n HTTP Server n IPv4/IPv6 Addresses
2. Click one of the values in the report.
3. Select View Reputation Information > EDR.
Artifacts
1. On the Extractions page, expand an artifact.
2. Click one of the following fields:
n SHA256 Hash n IPv4/IPv6 Addresses n URI Host
3. Select View Reputation Information > EDR.
Threat Explorer
Returning in Security Analytics 8.1.1 Drawing on the full resources of Symantec Global Intelligence Network (GIN)—which includes WebPulse as well as feedback from Malware Analysis sandboxing and millions of Symantec customers—Threat Explorer provides a portal where you can get extensive threat intelligence on IP addresses, URLs, files, and file hashes. To obtain a Threat Explorer subscription, contact Symantec.
n You do not need to configure anything on Security Analytics: just enable the Threat Explorer provider on Menu
> Settings > Data Enrichment.
Pivot to Threat Explorer
Follow these steps to use the Threat Explorer integration with reports or artifacts.
Reports
1. Open one of these reports in a Summary View or on the Reports page:
n IPv4 Addresses n DNS IPv4 Answer n MD5 Hash n SHA1 Hash n SHA256 Hash n HTTP Forward Address n HTTP Referrer n HTTP Server n HTTP URI
201

Administration and CentralManager Guide SecurityAnalytics 8.1.3
2. Click one of the values in the report.
3. Select View Reputation Information > Threat Explorer.
Artifacts
1. On the Extractions page, expand an artifact.
2. Click one of these fields:
n Source IP Address n Destination IP Address n MD5 n SHA1 n SHA256 n Original URL n URI Host n Referrer
3. Select View Reputation Information > Threat Explorer.
Symantec Analysis ProvidersSymantec analysis providers leverage the analytical capabilities of existing Symantec solutions — legacy Malware Analysis and Content Analysis— to enrich captured data. Malware Analysis has typically been provided by SymantecMalware Analysis appliances. The functionality of the Malware Analysis appliance has been incorporated into Content Analysis as of version 2.2.
If you have not upgraded your legacy Malware Analysis appliance to Content Analysis 2.2 or later, follow the steps in the Security Analytics 7.3.x Help Files (Data Enrichment > Providers > Symantec Analysis Providers) to integrate that appliance with Security Analytics.
Content Analysis Integrations
You can integrate Content Analysis with Security Analytics using one or both of these methods:
n Malware Analysis (Content Analysis 2.2 or later, with subscription)
o Send actual files (not file hashes) to the Content Analysis appliance.
o Specify the sandbox or iVM function as the analytical method, or you can select both.
o When the verdict is 7 or higher you get a malware alert. From this alert you can pivot to the Malware Analysis task page on the Content Analysis appliance for further information.
o The verdicts are displayed in the Malware Analysis Verdict report on Security Analytics.
202
Administration and CentralManager Guide SecurityAnalytics 8.1.3
o Analyze compressed archives.
o Analyze URLs (requires iVM function)
n ICAP (any version of Content Analysis) — Send ICAPs of matching data for virus-scanning and analysis.
o Send ICAPs of matching traffic.
o ICAPs are subjected to virus-scanning, predictive analysis, and any other analytical method you have configured on Content Analysis.
o When the verdict is 7 or higher you get a file alert. From this alert you can view the alert results.
o ICAP verdicts are not displayed in reports.
The latest Content Analysis documentation is located on the Broadcom Security Support portal.
Integrate Using the Malware Analysis Function
n Manually send URLs to Malware Analysis from an artifact's Original URL field, provided that the Malware Analysis entry on the Data Enrichment Settings page includes at least one iVM — Sandbox only is not supported for URLs.
n Files are sent to Malware Analysis under the following circumstances:
o The user manually submits an artifact to Malware Analysis from the artifact entry.
o The user has created a rule that sends specified files to Malware Analysis, and:
l The FRS Prefilter (if enabled) does not exclude the file.
l The data enrichment filter for Malware Analysis permits the file type.
n You can send details about EXE and DLL analyses to the SymantecGlobal Intelligence Network (GIN) to share with other users via GIN-based resources. Select Settings > Web Interface and select Enable Global Intelligence Network Feedback.
To report false positives for Symantec services go to this link: https://symsubmit.symantec.com/
Set up Malware Analysis on the Content Analysis appliance
The Symantec Malware Analysis feature on Content Analysis
203
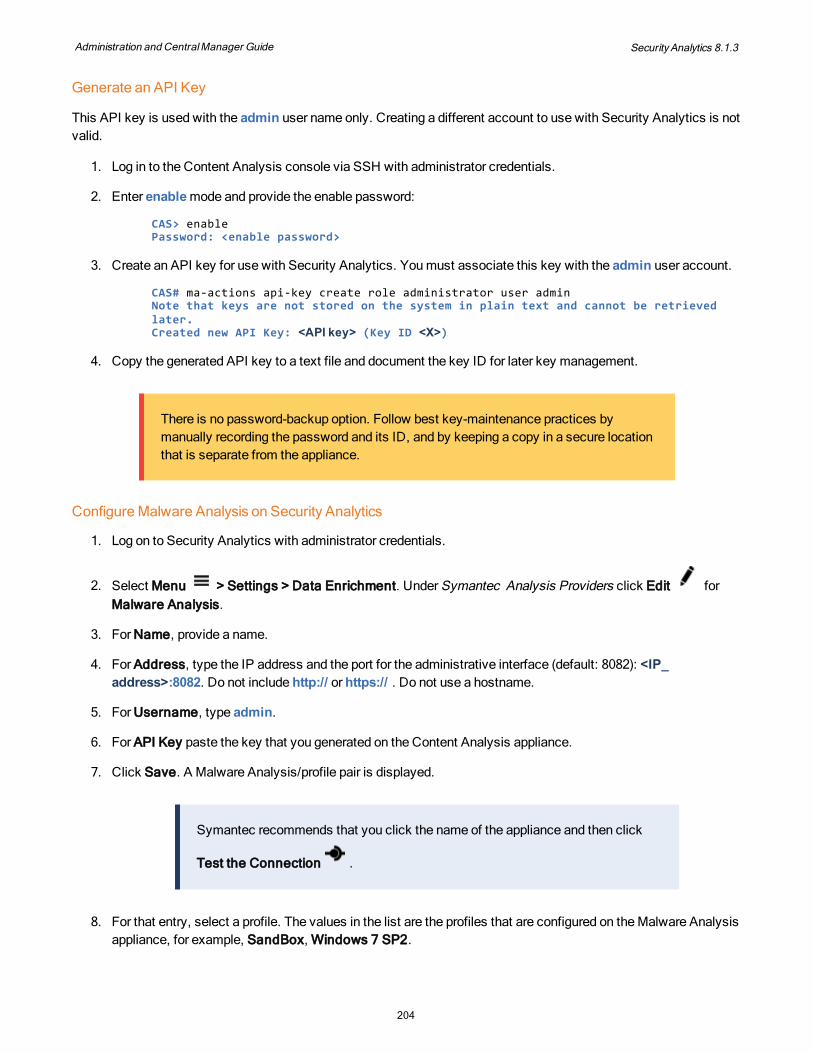
Administration and CentralManager Guide SecurityAnalytics 8.1.3
Generate an API Key
This API key is used with the admin user name only. Creating a different account to use with Security Analytics is not valid.
1. Log in to the Content Analysis console via SSH with administrator credentials.
2. Enter enable mode and provide the enable password:
CAS> enable Password: <enable password>
3. Create an API key for use with Security Analytics. You must associate this key with the admin user account.
CAS# ma-actions api-key create role administrator user adminNote that keys are not stored on the system in plain text and cannot be retrieved later.Created new API Key: <API key> (Key ID <X>)
4. Copy the generated API key to a text file and document the key ID for later key management.
There is no password-backup option. Follow best key-maintenance practices by manually recording the password and its ID, and by keeping a copy in a secure location that is separate from the appliance.
Configure Malware Analysis on Security Analytics
1. Log on to Security Analytics with administrator credentials.
2. Select Menu > Settings > Data Enrichment. Under Symantec Analysis Providers click Edit for Malware Analysis.
3. For Name, provide a name.
4. For Address, type the IP address and the port for the administrative interface (default: 8082): <IP_ address>:8082. Do not include http:// or https:// . Do not use a hostname.
5. For Username, type admin.
6. For API Key paste the key that you generated on the Content Analysis appliance.
7. Click Save. A Malware Analysis/profile pair is displayed.
Symantec recommends that you click the name of the appliance and then click
Test the Connection .
8. For that entry, select a profile. The values in the list are the profiles that are configured on the Malware Analysis appliance, for example, SandBox, Windows 7 SP2.
204

Administration and CentralManager Guide SecurityAnalytics 8.1.3
To send URLs to Content Analysis (on-demand only), at least one of the profiles must be an iVM. If only the Sandbox profile is available, Content Analysis cannot evaluate the URL.
9. Optional — Click Add a new appliance/profile pair. A duplicate of the first entry is displayed. Do one of the following:
n Select a different profile for Malware Analysis.
n Click the name of the Malware Analysis appliance, select Connect to a new Malware Analysis appliance, and repeat the procedure to add the new Malware Analysis appliance.
10. If you have more than one Malware Analysis/profile pair, configure How should the profiles be queried?:
n In Parallel — Queries are sent to all of the Malware Analysis/profile pairs at the same time.
n Sequentially — Queries are sent to the Malware Analysis/profile pairs one at a time, beginning with the first pair.
205

Administration and CentralManager Guide SecurityAnalytics 8.1.3
n When you add two or more Malware Analysis/profile pairs, you can set the conditions for sending the query to the next Malware Analysis/profile pair: If the result is [operator] [value] continue to [Malware Analysis/profile pair].
n You can drag the Malware Analysis/profile pairs to change their order in the sequence.
11. Select FRS Prefilter to not send files to Malware Analysis if the File Reputation Service already has a verdict for that file. (See "FRS Prefilter Process" on page 392.)
12. By default only Adobe PDF, Archives, Debian Packages, Office Documents, and Programs and Libraries are sent to Malware Analysis. To change this setting, go to "Data Enrichment Filters" on page 109.
These file types require that the corresponding file-type filters be activated:
n APK — JAR Archives
n iOS — Archives and Binaries
n IPA — Archives
13. When you are ready to begin sending samples to Malware Analysis from Security Analytics, click the
(inactive) control to activate the Malware Analysis appliance entry.
14. Select Menu > Analyze > Rules and activate the Symantec Malware Analysis Service rule.
Sample Analysis
Samples that are submitted to multiple Malware Analysis/profile pairs are processed according to the following rules:
n A sample is sent one time to Malware Analysis, where it is processed in a separate task for each profile.
n For samples sent in parallel, Security Analytics sends the sample to the SandBox first (provided that the SandBox supports the file type); if the results indicate a suspicious sample, the sample is sent to the iVM profile(s). This measure prevents filling the iVM queues with innocuous samples.
n As soon as one profile returns a significant result, that result is returned to Security Analytics instead of waiting for all profiles to complete before sending a verdict.
n Malware Analysis automatically routes mobile samples (Android APK) to the MobileVM, regardless of which profiles are configured on Security Analytics.
To see the health of the Malware Analysis connection, open the System Utilization window in the upper-right corner of the web UI.
206

Administration and CentralManager Guide SecurityAnalytics 8.1.3
Green — The connection is active.
Yellow — There is an alert condition on Content Analysis.
Black — The connection is inactive.
Malware Analysis Alerts
Verdicts will be displayed as follows:
n In the Malware Analysis Verdict report and report widget.
n On the Menu > Analyze > Alerts pages, if the verdict is 7 or higher.
o When Malware Analysis returns a verdict, the Malware icon is displayed with the alert. Click Reputation Report for an overview of the detonation results.
o Click Go to MAA to view the full detonation results on the Content Analysis appliance.
Manually Send Samples
You can send individual artifacts to Malware Analysis from the Security Analytics interface.
1. Select Menu > Analyze > Extractions. Select the timespan and apply any filters to display the artifact to send.
2. Expand the artifact entry.
207

Administration and CentralManager Guide SecurityAnalytics 8.1.3
3. Click the File Name field and select View Reputation Information > Malware Analysis. The file is sent to the
Malware Analysis profiles that you configured on Menu > Settings > Data Enrichment.
4. The results are displayed in a pop-up window.
Compressed-Archive Analysis
The Security Analytics extractor recognizes the archive types that are listed on "Data Enrichment Filters" on page 109, but it does not extract files from those archives and display them as artifacts on the Extractions page.
However, when an archive matches a Malware Analysis rule, the data-enrichment process extracts the files from the archive before sending them to Malware Analysis, according to the default Malware Analysis data-enrichment filter.
The data-enrichment process handles archive-extraction according to the default settings:
n Files are extracted two directory layers deep.
n The files inside archives that are larger than 500 MB are not extracted.
n Archived files that are larger than 100 MB are not extracted.
n Files with paths longer than 260 characters are not extracted.
n Only the first 100 files that do not exceed the size or path-length limits are extracted.
Integrate Using the ICAP Functionality
Send ICAP-formatted data to any version of Symantec Content Analysis. Files are sent to the ICAP provider under the following circumstances:
n The user manually submits an artifact to ICAP from the artifact entry.
n The user has created a rule that sends specified files to the ICAP provider and the data enrichment filter for ICAP permits the file type.
Configure Security Analytics for ICAP
Follow these steps to configure Security Analytics to send ICAP service objects to Content Analysis:
208
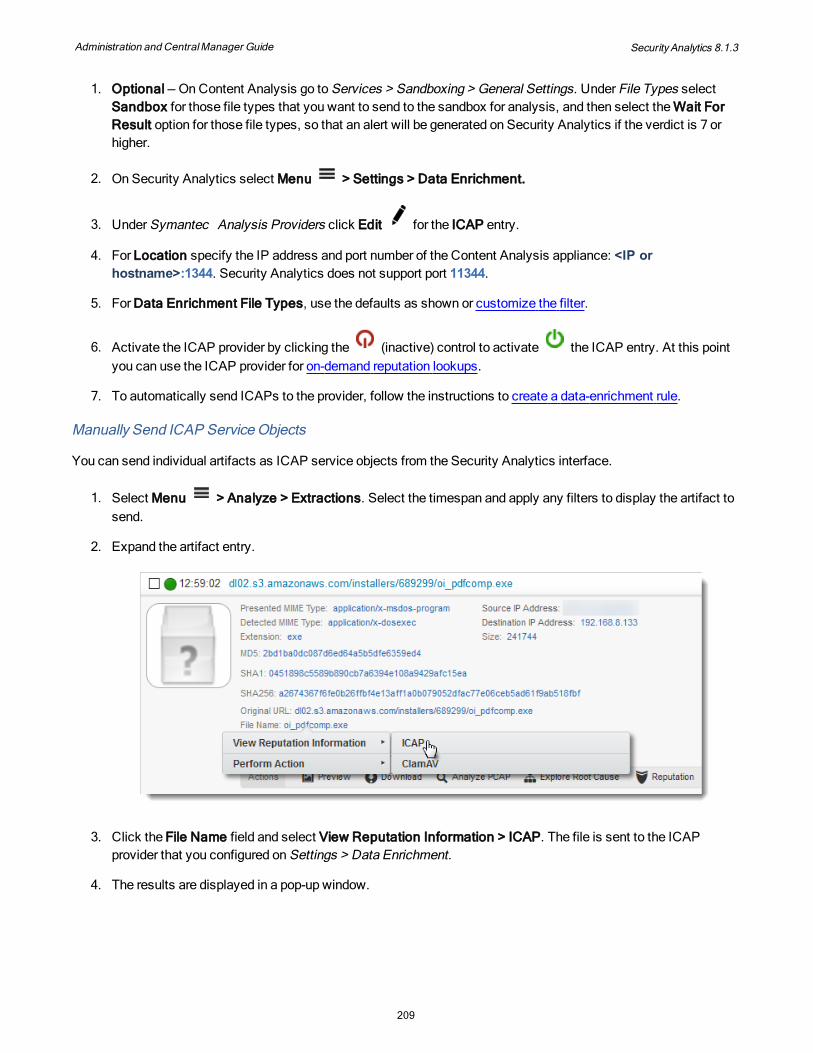
Administration and CentralManager Guide SecurityAnalytics 8.1.3
1. Optional — On Content Analysis go to Services > Sandboxing > General Settings. Under File Types select Sandbox for those file types that you want to send to the sandbox for analysis, and then select the Wait For Result option for those file types, so that an alert will be generated on Security Analytics if the verdict is 7 or higher.
2. On Security Analytics select Menu > Settings > Data Enrichment.
3. Under Symantec Analysis Providers click Edit for the ICAP entry.
4. For Location specify the IP address and port number of the Content Analysis appliance: <IP or hostname>:1344. Security Analytics does not support port 11344.
5. For Data Enrichment File Types, use the defaults as shown or customize the filter.
6. Activate the ICAP provider by clicking the (inactive) control to activate the ICAP entry. At this point you can use the ICAP provider for on-demand reputation lookups.
7. To automatically send ICAPs to the provider, follow the instructions to create a data-enrichment rule.
Manually Send ICAP Service Objects
You can send individual artifacts as ICAP service objects from the Security Analytics interface.
1. Select Menu > Analyze > Extractions. Select the timespan and apply any filters to display the artifact to send.
2. Expand the artifact entry.
3. Click the File Name field and select View Reputation Information > ICAP. The file is sent to the ICAP provider that you configured on Settings > Data Enrichment.
4. The results are displayed in a pop-up window.
209

Administration and CentralManager Guide SecurityAnalytics 8.1.3
ICAP Alerts
n Any results with a verdict higher than 7 will be displayed on the Menu > Analyze > Alerts pages.
o When Content Analysis returns a verdict, the File icon is displayed with the alert. Click Reputation Report for an overview of the scan results.
n Content Analysis ICAP verdicts are not available in reports.
To report false positives for Symantec services go to this link: https://symsubmit.symantec.com/
Reputation ProvidersReputation providers supply threat intelligence on web sites, IP addresses, file hashes, and artifacts. You can access reputation information in one of two ways:
n On Demand
n Data Enrichment Alerts
Symantec Reputation Providers
Symantec's proprietary reputation providers leverage the full power of the Symantec Global Intelligence Network (GIN) as well as additional Symantec legacy and Symantec products.
Symantec Intelligence Services
Perform on-demand reputation queries against GIN as well as create customized data-enrichment rules to send specified files to GIN automatically. License and activate the following Symantec Intelligence Services:
n Web Reputation Service
n File Reputation Service
Symantec Analysis Providers
Perform on-demand reputation queries against these Symantec analysis providers as well as create customized data-enrichment rules to send specified files to the providers:
n Content Analysis (ICAP)
n Malware Analysis
Symantec On-Demand Providers
Perform on-demand reputation queries against these Symantec on-demand reputation providers:
n Endpoint Protection
n Advanced Threat Protection
210

Administration and CentralManager Guide SecurityAnalytics 8.1.3
n DeepSight Intelligence
n DeepSight Adversary (MATI) Intelligence
Providers Activated by Default
As soon as you install Security Analytics, these providers are activated:
n Calculate and Store Hashes
n ClamAV®
n Custom Hash List
n Domain Age Reporter
n Google® Search
n Google Safe Browsing
n jsunpack-n
n RobTex® Host
n RobTex IP
n SANS ISC® Host
n SANS ISC IP
n SORBS DNSBL® Host
n SORBS DNSBL IP
n WHOIS Host
n WHOIS IP
n YARA
To disable any of these providers, select Menu > Settings > Data Enrichment and click the Activated icon.
Local File Analysis Providers
Local file analysis provides on-box analysis of extracted files without contacting external resources. These local providers have been separated out so that you can select each one for a data-enrichment rule, or you can get the on-demand reputation results shown in this table.
Local File Analysis Provider
Service ProvidedArtifact Fields: On-Demand Reputation
Calculate and Store Hashes
Calculate MD5, SHA1, and SHA256 hashes for files that match the rule and write them to the indexing database.
n/a
ClamAV® File scanning for known viruses File Name
Custom Hash List Upload your own black and white hash lists. File Name*
jsunpack-n On-board analysis of JavaScript, PDF, HTML, and SWF files.
Artifact Preview
YARA Helps detect live exploits before they are known to the Symantec Global Intelligence Network.
File Name
* Because this provider requires hash types other than MD5, the artifact itself must be sent; therefore, the on-demand reputation is associated with the File Name field instead of the hash fields.
Third-Party On-Demand Reputation Providers
The following third-party sources provide on-demand reputation information. The Reports, Alerts List, and Artifact Fields columns show the fields for which the providers can give information:
211

Administration and CentralManager Guide SecurityAnalytics 8.1.3
Third-Party Reputation Provider
Service Provided Reports Alerts List Artifact Fields
Domain Age Reporter The amount of time elapsed since the domain was first registered
DNS QueryHTTP Server
URI Host
Google Safe Browsing URL validation HTTP URI Original URL
Google® Search Pivot to Google search results for the item
all IPv4 addressesIPv6 addresses
all
RobTex® Host Pivot to hostname-based reputation
DNS Query, HTTP Server
URI Host
RobTex IP Pivot to IP-based reputation
IPv4 addressesIPv6 addresses
IPv4 addressesIPv6 addresses
IPv4 addressesIPv6 addresses
SANS ISC® Host Hostname lookups against known-bad hostnames
DNS Query, HTTP Server
URI Host
SANS ISC IP IP lookups against known-bad IPs
IPv4 addresses IPv4 addresses IPv4 addresses
SORBS DNSBL® Host DNS reputation DNS Query, HTTP Server
URI Host
SORBS DNSBL IP IP address reputation IPv4 addresses IPv4 addresses IPv4 addresses
WHOIS Host Domain registration information
DNS Query, HTTP Server
URI Host
WHOIS IP IP address information IPv4 addresses IPv4 addresses IPv4 addresses
* Because this provider requires hash types other than MD5, the artifact itself must be sent; therefore, the on-demand reputation is associated with the File Name field instead of the hash fields.
Activate Reputation Providers
The Third-Party On-Demand and Local File Analysis providers are activated by default. Other reputation providers must be licensed or activated or both.
1. Go to Menu > Settings > Data Enrichment.
2. For any reputation provider, click the inactive icon to activate the resource.
3. Click Save.
After you click Save, approximately two minutes elapse before the changes take effect in the data-enrichment process.
212

Administration and CentralManager Guide SecurityAnalytics 8.1.3
On-Demand Reputation Queries
You have several means at your disposal to make on-demand reputation queries. A provider must be activated on Settings > Data Enrichment to be available in the reputation lists:
n Click an IP address in an alert entry and select View Reputation Information >[reputation service provider].
n Click an entry in any results lists (Reports, Extractions, Geolocation) and select View Reputation Information >[reputation service provider].
n Click a field in the artifact details and select View Reputation Information >.
213

Administration and CentralManager Guide SecurityAnalytics 8.1.3
n Expand an item in the Extractions list, and then click Reputation to show all reputation information for all fields.
Third-Party Integration ProvidersSymantec Security Analytics supports the following third-party integration providers. Also see "Enrichment Providers" on page 190.
Licensing and installation of these services is the responsibility of the user.
These providers can be selected for a data-enrichment rule, or you can get the on-demand reputation results on the Extractions page, as shown in this table.
Provider ServiceArtifact Fields: On-Demand Reputation
<custom pivot-only provider>
Add custom pivot-only providers from the web UI (or use scm pivot_only_provider in the Security Analytics 8.1.x Reference Guide on support.symantec.com).
MD5, SHA1, SHA256, Fuzzy, URL, IP, Hostname
214

Administration and CentralManager Guide SecurityAnalytics 8.1.3
Provider ServiceArtifact Fields: On-Demand Reputation
Cuckoo Send extracted files to a Cuckoo® sandbox for detonation.
n The default port number is 8090.
n Only version 0.6 and later is supported by Security Analytics 7.1.x and later.
n The file api.pymust be run on the server side. See the Cuckoo documentation for more information.
n The Cuckoo response is written to /var/log/messages, where you can find the link to the Cuckoo report.
File Name
FireEye Send extracted files to your FireEye® Malware Analysis System, AX-series solution for detonation. For more information, visit http://www.fireeye.com/products-and-solutions/malware-analysis.html Also see Specify Which FireEye Profile to Use.
File Name
FTP File Mover
Send extracted files to a remote server via FTP. n/a
Lastline® File
Send extracted files to Lastline's cloud-based sandbox for malware analysis. For more information, visit https://www.lastline.com/platform/integrations/blue-coat-security-analytics-platform
File Name
[Lastline Hash]
Send MD5 file hashes to Lastline to check against known-bad hashes. (Change the Category for Lastline File to hash.)
MD5
Local File Mover
Write files to a local directory on the Security Analytics. n/a
Titanium Scale
Send extracted files to your ReversingLabs® TitaniumScale® server. File Name
SCP File Mover
Send extracted files to a remote server via SCP. You must also set up SSH authentication on the remote server.
n/a
VirusTotal® File
Send extracted files to VirusTotal for malware analysis. For more information, visit https://www.virustotal.com/en/documentation/
File Name
VirusTotal Hash
Send MD5 file hashes to VirusTotal to check against known-bad files. MD5
VirusTotal URL
Send URLs to VirusTotal to check against known-bad URLs. Original URLReferrer
HTTP URI (Report)
Activate Integration Providers
n When you create a new Integration Provider, it is automatically activated, as shown by the green Activated
icon .
215

Administration and CentralManager Guide SecurityAnalytics 8.1.3
n To activate an inactive Integration Provider, click the red Deactivated icon .
Configure Integration Providers
You may configure as many entries for each provider type as you wish. For example, if you have three FTP servers, you can configure three FTP entries and then specify which servers will receive the extracted data in the data-enrichment rule.
1. Select Settings > Data Enrichment.
2. Under Integration Providers, click edit for the desired entry or click New.
3. Specify or edit the Name and add a Description, as desired.
4. Select the Type of provider.
5. Select the Category, as provided, to specify which field supports the reputation lookup:
n Hash (MD5)
n Host
n IP
n SHA1
n SHA256
n URL
6. Supply the information for the provider type:
n Cuckoo — Provide the Location (hostname or IP address). If you are upgrading from Security Analytics 7.1.x, specify port 8090 (<cuckoo_ip>:8090) or use dsportmapping to change the port to 8090.
n FireEye — Provide the Location (hostname or IP address) and account credentials. Optionally, see "Specify Which FireEye Profile to Use" on the next page.
n FTP File Mover — Provide the Location (hostname or IP address), account credentials, target directory, and FTP mode.
n Before sending files to the FTP server, Security Analytics renames the files to avoid conflicts. The new filename is the MD5 hash of [artifact time, source IP/port, destination IP/port, MD5 file hash]. Select Preserve Original Filename to append the original filename to the new name: <md5-hashed_filename>_<original_filename>
n Lastline — Provide the Token and Location for your account.
n Local File Mover — Provide the Directory. Take care not to overfill system directories or performance may be severely degraded.
n Pivot — Enter the URL of the resource as http://<url>%{TOKEN} or https://<url>%{TOKEN}. The %{TOKEN} string will be automatically replaced by the value to search. If the %{TOKEN} string cannot be at the end of the URL, enclose the entire URL in double quotation marks: "http://<url>"%{TOKEN}"<string>" For examples see scm pivot_only_provider in the Security Analytics 8.1.x Reference Guide on support.symantec.com.
216

Administration and CentralManager Guide SecurityAnalytics 8.1.3
n SCP File Mover — First, you must set up SSH authentication on the remote server and then provide the Location (hostname or IP address), Username of the <remote_user>, and target Directory.
n TitaniumScale — Provide the Location.
n VirusTotal — Provide the account Key.
7. See "Data Enrichment Filters" on page 109 to see how to specify which file types to send to the provider.
8. Click Save.
Specify Which FireEye Profile to Use
FireEye integration requires that SCP enable the diffie-hellman-group1-sha1 algorithm for this integration provider only.
Follow these instructions to specify which profile to use when sending a file to a FireEye AX-series server.
1. Log in to the FireEye console and run this command:
malware analyze sandbox url file:/file guestos ?
2. The list of available guest operating systems (profiles) is displayed. Make a note of the exact name of the guest OS.
3. On Security Analytics, open the ax_malware_analyze.sh script for editing:
[root@hostname ~] vi /opt/tonic/share/ax_malware_analyze.sh
4. Locate this line — around line 186 — and edit it as shown:
send "malware analyze sandbox url file:/$filename guestos <guest OS> force\r"
5. Save and close the script, and then restart data-enrichment and related services:
scotus stopscotus start
Endpoint Providers
Symantec SEP Integration
You can integrate the functionality of Symantec SEP with Symantec Security Analytics. See "Symantec Endpoint Protection" on page 197.
Rule-Based Endpoint Providers
Security Analytics can provide endpoint information to external endpoint-analysis providers such as EnCase® Cybersecurity by Guidance® Software. Using a Security Analytics Web API, endpoint analysis providers can retrieve source and destination IPs, source and destination ports, and the timespan for selected alerts. With this information, the provider can conduct its own endpoint investigations.
217

Administration and CentralManager Guide SecurityAnalytics 8.1.3
It is the responsibility of the user to license and install third-party endpoint analysis solutions.
Enable endpoint analysis support on the New/Edit Rule dialog by selecting the Endpoint Providers check box.
Custom Hash List n The Custom Hash List is an UnQLite embedded NoSQL database.
n The list accepts MD5, SHA1, and SHA256 hashes.
n Hashes must be designated as either "white" (known good) or "black" (known bad).
n The hash lists are stored here:
o /var/lib/solera/meta/local_hash_repo_md5.unq
o /var/lib/solera/meta/local_hash_repo_sha1.unq
o /var/lib/solera/meta/local_hash_repo_sha256.unq
n Both black and white hashes for each type of hash are contained in the same UNQ file.
n On a fresh install or upgrade from Security Analytics 7.1.x or earlier, the UNQ files do not exist; the Custom Hash List is empty until the user adds hashes to it.
n When a blacklist hash matches a file, the verdict is 10; a whitelist hash currently produces no score.
Add Hashes to the Custom Hash List
The lhr_flat_to_qdb command converts flat files of hashes (one hash per line) into database format. Only one kind of hash can be present in each file: Do not attempt to use a file that contains both MD5 and SHA1 hashes, for example.
syntaxlhr_flat_to_qdb -[5|1|2] -[b|w] -f <filename> [-d] [-v]
parameters
-5, --md5 Process file as MD5 hashes
218

Administration and CentralManager Guide SecurityAnalytics 8.1.3
-1, --sha1 Process file as SHA1 hashes
-2, --sha256 Process file as SHA256 hashes
-b, --black Add hashes to blacklist
-w, --white Add hashes to whitelist
-f, --file=<ARG> Read hashes from <ARG>
-o, --output=<ARG> Write database files with <ARG> prefix
-d, --debug Turn debug logging on
-v, --verbose Turn verbose logging on
-n, --noexec Perform a dry run; do not read or write files
-h, --help Display usage and help info
ld library path
lhr_flat_to_qdb requires access to the SO files in /usr/local/share/tonic/plugins.
examplesLD_LIBRARY_PATH=/usr/local/share/tonic/plugins /usr/local/bin/lhr_flat_to_qdb --verbose --sha1 --black --file=sha1_blacklist.txt
Uploads the SHA1 hashes in sha1_blacklist.txt to /var/lib/solera/meta/local_hash_repo_sha1.unq, marks them as blacklist hashes, and enables verbose logging.
LD_LIBRARY_PATH=/usr/local/share/tonic/plugins /usr/local/bin/lhr_flat_to_qdb -5 -w -n -f md5_hashes.txt
Shows the results of uploading md5_hashes.txt to /var/lib/solera/meta/local_hash_repo_md5.unq and marking them as whitelist hashes, but without performing the operation.
LD_LIBRARY_PATH=/usr/local/share/tonic/plugins /usr/local/bin/lhr_flat_to_qdb -2 -b -d -f sha256_blacklist.txt -w -f sha256_whitelist.txt
Uploads the SHA256 hashes in sha256_blacklist.txt as black hashes and sha256_whitelist.txt as white hashes to /var/lib/solera/meta/local_hash_repo_sha256.unq and enables debug messages.
Create a Flat File of Hashes
Follow these steps to create flat files of hash lists from files that are on a Linux or Unix system.
list of files<hash> sum <list-of-files> | awk '{ print $1; }' > <output_file>
all files in current directory<hash> sum -b * | awk '{ print $1; }' > <output_file>
219
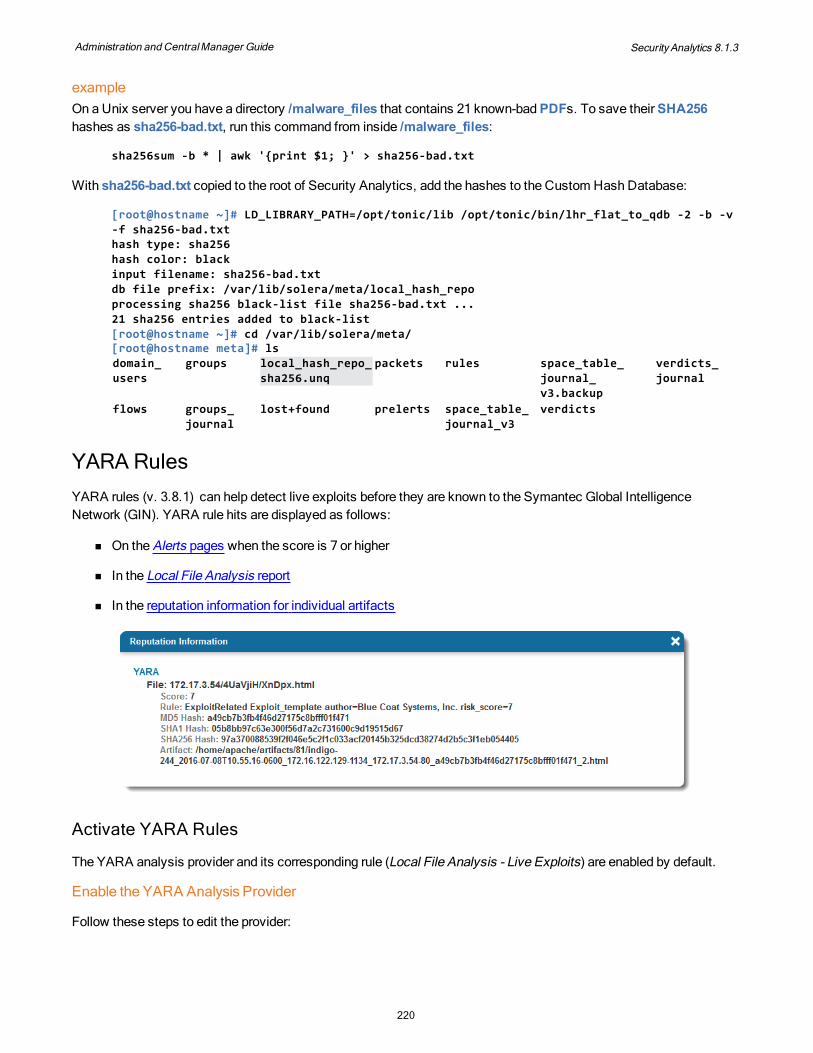
Administration and CentralManager Guide SecurityAnalytics 8.1.3
exampleOn a Unix server you have a directory /malware_files that contains 21 known-bad PDFs. To save their SHA256 hashes as sha256-bad.txt, run this command from inside /malware_files:
sha256sum -b * | awk '{print $1; }' > sha256-bad.txt
With sha256-bad.txt copied to the root of Security Analytics, add the hashes to the Custom Hash Database:
[root@hostname ~]# LD_LIBRARY_PATH=/opt/tonic/lib /opt/tonic/bin/lhr_flat_to_qdb -2 -b -v -f sha256-bad.txthash type: sha256 hash color: black input filename: sha256-bad.txt db file prefix: /var/lib/solera/meta/local_hash_repo processing sha256 black-list file sha256-bad.txt ... 21 sha256 entries added to black-list [root@hostname ~]# cd /var/lib/solera/meta/[root@hostname meta]# lsdomain_users
groups local_hash_repo_sha256.unq
packets rules space_table_journal_v3.backup
verdicts_journal
flows groups_journal
lost+found prelerts space_table_journal_v3
verdicts
YARA RulesYARA rules (v. 3.8.1) can help detect live exploits before they are known to the Symantec Global Intelligence Network (GIN). YARA rule hits are displayed as follows:
n On the Alerts pages when the score is 7 or higher
n In the Local File Analysis report
n In the reputation information for individual artifacts
Activate YARA Rules
The YARA analysis provider and its corresponding rule (Local File Analysis - Live Exploits) are enabled by default.
Enable the YARA Analysis Provider
Follow these steps to edit the provider:
220

Administration and CentralManager Guide SecurityAnalytics 8.1.3
1. Select Menu > Settings > Data Enrichment.
2. Under Local File Analysis Providers you can
n Enable or disable YARA .
n Edit the per-provider data enrichment filter.
Take care when creating rules that use the YARA provider. Only one YARA task runs at a time. If the rules engine sends excessive artifacts to the YARA provider, the verdict may take too long to be returned. Furthermore, when the YARA queue is full, new requests are dropped.
Enable the YARA Rule
Do one of the following:
n Select Menu > Analyze > Rules and enable or disable the Local File Analysis - Live Exploits rule.
n Create or edit a data-enrichment rule and select YARA in the Send to field.
The Live Exploits Indicator
The Local File Analysis - Live Exploits indicator, which is used by the Local File Analysis - Live Exploits rule, specifies multiple mime_type=<mime_type> values and then specifies uri_risk_verdict=5 (Unrated). The uri_risk_verdict filter is included to prevent overloading the YARA rules engine: only activity from unrated URLs is analyzed. The local copy of the Web Reputation Service database provides the uri_risk_verdict attribute.
The uri_risk_verdict attribute is available only with an Intelligence Services license.
Customize YARA Rules
You can customize your YARA rules by following these steps:
1. Select Menu > Settings > Data Enrichment, scroll down to the YARA File Manager section, and click Download to download the current file: rules.yar.
n Alternatively, you can open the YARA rules file: /usr/share/solera/yara_rules/rules.yar.
2. Use a text editor to add, delete, or modify YARA rules, as desired.
221

Administration and CentralManager Guide SecurityAnalytics 8.1.3
Avoid writing overly complicated rules: If a rule takes longer than two seconds to process, the process is terminated.
3. Specify meta information to generate alerts for YARA hits. The risk_score attribute specifies the lowest score for which alerts are generated. Because the system threshold for alerts is 7, user-defined rules should specify 7 or higher:
{meta:
author = "MyOrganization"risk_score = <integer 7–10>
strings:<strings>
condition:<condition>
}
If you do not specify a risk score, you will not get alerts or manual reputation results.
4. Save the file, and then on the web UI click Upload to upload the new file to the appliance. If you are editing the file directly, you must restart the data-enrichment service.
systemctl restart tonicd
5. To test the new rule set, open the Extractions page, expand an artifact entry, and then click Reputation. YARA rules should return a result.
6. To restore the YARA file to its default, click Restore.
Login CorrelationThe Login Correlation Service (LCS) for Microsoft® Active Directory® associates network activity with Microsoft Active Directory (AD) domain users. The LCS sends the following information to Symantec Security Analytics:
n Username
n IP address (as found in the domain server's DHCP log)
n Login time
n Authentication method
How the LCS Works
The LCS has two components:
n LCS agent — Detects user logons and logoffs and creates an IP-to-username correlation. Resides on a domain controller (DC).
n adlistener-d — A Linux daemon that adds the correlation information to the Indexing DB, from which the User Name report is generated. Resides on Security Analytics.
222

Administration and CentralManager Guide SecurityAnalytics 8.1.3
The LCS agent parses the logon/logoff events of a DC's security logs. Specifically, it monitors the logs for these event IDs:
n 4624 — An account was successfully logged on.
n 4634 — An account was logged off. After detecting this event ID, the LCS agent sends a WMI query to the workstation to verify whether the user has actually logged off.
The LCS agent extracts the following information from those events:
n User Name n Domain n Logon ID
n Logon Type n Workstation Name n Source Network
Address
n Source Port n Time n Date
The LCS agent correlates User Name with Source Network Address and sends the pairings to adlistener-d over port 8843, which adds the information to the Indexing DB.
Requirements
n .NET Framework 3.5 or later
n Windows Server
o 2012 (R2) (Domain Controller)
o 2016 (Domain Controller)
o 2019 (Domain Controller)
The LCS agent supports read-only domain controllers.
Configure the Domain Controller
These instructions include wording for both 2008 and 2016/2019 versions, with differences indicated in parentheses.
For every Active Directory domain controller that you want to monitor for logon events, perform these steps:
Configure the Advanced Audit Policy Setting
User logon information is stored in security logs on the DC. The LCS derives its information from these logs. To capture logon events, the DC’s advanced audit policy must be configured to audit successful logon and logoff events.
To configure an advanced domain login audit policy setting, follow these steps:
1. Log on to the DC as a member of the local administrators group.
2. Select Start > [Windows] Administrative Tools > Group Policy Management.
223

Administration and CentralManager Guide SecurityAnalytics 8.1.3
3. In the console tree, double-click your forest, e.g., Forest: domain.com.
4. Double-click Domains, and then double-click the domain controller, e.g., controller.com.
5. Right-click Default Domain Policy, and then click Edit.
6. Open the following items in this order:
a. Computer Configuration
b. Policies
c. Windows Settings
d. Security Settings
f. Advanced Audit Policy (Configuration)
g. (System) Audit Policies
h. Logon/Logoff
i. (Audit) Logon
7. Select the Configure the following audit events check box, select the Success check box, and then click OK.
8. Set (Audit) Logoff to Success as well.
Configure the Group Policy to Enable WMI Access to a Remote Machine
n The LCS uses remote WMI queries to verify whether a domain user is logged off. If a domain workstation does not respond to a WMI query, then the LCS regards the user as not logged off.
n If the user does not log off gracefully, Windows does not generate an event log; therefore, the LCS does not detect the event. This missed event can sometimes be inferred when a user logs on later to a workstation with the same IP address.
1. Select Administrative Tools > Group Policy Management > [Forest] > Group Policy Objects. Right-click Default Domain Policy and select Edit.
2. Select Start > [Windows] Administrative Tools > Group Policy Management.
3. In the console tree, double-click your forest, e.g., Forest: domain.com.
4. Double-click Domains, and then double-click the domain controller, e.g., controller.com.
5. Under default domain policy, select Computer Configuration > (Policies) > Administrative Templates > Network > Network Connections > Windows (Defender) Firewall > Domain Profile. Right-click the Allow inbound remote administration exception and enable.
6. Repeat the previous steps for Standard Profile.
224

Administration and CentralManager Guide SecurityAnalytics 8.1.3
Update the Group Policy Settings
1. Do one of the following:
n Select Start > All Programs > Accessories, right-click Command Prompt, and click Run as administrator.
n Open Windows PowerShell.
2. If the User Account Control dialog box is displayed, confirm that the action it shows is what you want, and then click Yes.
3. Type gpupdate and press Enter.
Verify That the Audit Policy Settings Were Applied Correctly
1. Type auditpol.exe /get /category:"Logon/Logoff" and press Enter.
C:\Windows\system32>auditpol /get /category: "Logon/Logoff"
System audit policyCategory/SubcategoryLogon/LogoffLogonLogoff
Setting Success Success
2. Verify that the setting for both Logon and Logoff is Success.
Install the LCS Agent
1. Select Menu > Settings > Data Enrichment.
2. Click Download Version [x] of the Login Correlation Service Installation File and save DSLoginCorrelation.exe to your workstation.
Only one LCS agent is required per domain. You must install the LCS agent on the domain controller.
3. Run DSLoginCorrelation.exe on the target machine and follow the prompts to install it. During installation you are required to provide administrator credentials for a domain administrator account or an account that has permission to read domain-controller security event logs and execute WMI queries. DSLoginCorrelation.exe installs the following:
n The LCS agent
n A GUI application to configure the LCS
The installation process requires a system restart to complete.
225

Administration and CentralManager Guide SecurityAnalytics 8.1.3
4. When the domain controller has finished rebooting, launch Symantec Corporation > Login Correlation Service or double-click the desktop shortcut.
5. On the welcome page click Next.
6. On the Select Installation Folder page, specify the folder and click Next. The LCS agent begins to install.
7. On the Installation Complete page, click Close.
Configure the LCS Agent
1. Launch Login Correlation Service and click Connect.
2. No DCs are detected. Click Add.
3. Click Add again.
4. In the Domain Controllers section:
n For Domain Name, type the name of the current domain controller, e.g., ad.domain.com.
n For Domain IP, type the IP of the DC.
n For Login Name and Password, type the name and password of the administrator account for the DC.
n Click Apply.
5. In the Security Analytics sensors section:
n Click Add.
n For Appliance IP, type the IP address of Security Analytics.
n For Login Name and Password, type the name and password of the root account.
6. Optional — If Security Analytics requires a client certificate, select the Use Client Certificate check box.
Client authentication occurs when the adlistener-d service on the appliance requests a certificate from the LCS agent during the SSL handshake; an LCS agent cannot initiate a request to be authenticated.
7. Click Import SSL Certificate and upload a PEM-format certificate that will permit the LCS agent to access the appliance.
8. Click Apply.
9. Select File > View > Read-Only Tree View to see a hierarchical view of the DCs and appliances.
Import DCs and Appliances from a CSV File
You can import multiple DCs and Security Analytics appliances from a CSV file.
226

Administration and CentralManager Guide SecurityAnalytics 8.1.3
Syntax for DCsDomainController-IP,username,password
example192.0.2.55,administrator,<password>198.51.100.55,administrator,<password>2001::40da:223c,administrator,<password>
Syntax for Security AnalyticsAppliance-IP,username,password,SSL_agent_certificate_path
example192.0.2.20,root,<password>198.51.100.219,root,<password>,F:\shares\certificates\adl-cacert.pem 2001:3eda::4008,root,<password>
Enable LCS on the Appliance
1. Select Menu > Settings > Security on the web interface.
2. Scroll down to Login Correlation Service. Do one of the following:
n Select the Allow All Agent IPs check box. With this setting enabled, the login events from all LCS agents will be accepted by this Security Analytics appliance.
n To specify which LCS agent events to accept, clear the Allow All Agent IPs check box.
o For Server, type the address of a domain controller that has the LCS agent.
o Optional — Click add another agent IP for additional LCS agents.
3. On Menu > Settings > Security click Configure Firewall.
4. A default rule permits all Login Correlation traffic (port 8843) from all IPs. Create more firewall rules as desired.
5. Click Save.
View LCS Activity
From the CLI
1. Log on to the appliance via the CLI as root and execute the following command:
ps -aux | grep adl
2. You should see a display similar to the following:
227

Administration and CentralManager Guide SecurityAnalytics 8.1.3
In the Log File
The log file DomainLogonWatcher.log is created in the application data folder on the machine where the LCS agent resides: C:\Users\<username>\AppData\Roaming\Symantec Corporation\. The file has a maximum size of 100 Mb.
The \AppData\ directory is hidden by default.
Login Correlation Service activity appears similar to the following:
Domain Admin Account4/12/2020 8:02:33 PM Updated configuration will be applied to domain :<domain_name>4/23/2020 8:02:33 PM Certificate error: RemoteCertificateNameMismatch, RemoteCertificateChainErrors 4/23/2020 8:02:33 PM Trying to authenticate at appliance 203.0.113.149 4/23/2020 8:02:33 PM AcknowledgeReceiverThread started for ip 203.0.113.149 4/23/2020 8:02:33 PM Authenticated to ADListner 203.0.113.149 4/23/2020 8:02:33 PM Adding domain controller<domain_name>: 203.0.113.150 4/23/2020 8:02:33 PM Adding domain controlle <domain_name>: 203.0.113.151
Non-Admin Account4/23/2020 6:11:06 PM Updated configuration will be applied to domain :<domain_name>4/23/2020 6:11:08 PM trying to connect to domain controller<domain_name>[ 203.0.113.151 ] 4/23/2020 6:11:08 PM Exception received while connecting to Domain Controller<domain_name>: Access is denied. (Exception from HRESULT: 0x80070005 (E_ACCESSDENIED)) 4/23/2020 6:11:11 PM Exception received while connecting to Domain Controller<domain_name>: Access denied 4/23/2020 6:11:18 PM trying to connect to domain controller<domain_name>[ 203.0.113.151 ] 4/23/2020 6:11:18 PM Exception received while connecting to Domain Controller<domain_name>: Access is denied. (Exception from HRESULT: 0x80070005 (E_ACCESSDENIED)) 4/23/2020 6:11:21 PM trying to connect to domain controller<domain_name>[ 203.0.113.150 ]
On the Web Interface
To see AD user names in the web interface, do one of the following:
n On the a Summary view, add the User Name widget.
n On the Analyze > Report page, select the Social Persona > User Name report.
Add user_name=<username> to the primary filter and run the IPv[x] Initiator report to see the user's IP address.
File Names Sent to ProvidersWhen Security Analytics sends the actual file (rather than a file hash) to data enrichment providers, the name of the file may be altered, according to the provider and its settings. The alteration is made to distinguish among identically named files that are captured at different times, from different sources, and that may have different contents.
Default Extractor Filename
By default the extractor assigns each artifact a new name, which includes the hostname of the appliance that captured the artifact, the date and time that the artifact was captured, and the MD5 hash of the file itself.
228

Administration and CentralManager Guide SecurityAnalytics 8.1.3
<hostname>_<YYYY-MM-DD>T<hh:ii:ss>-<zzzz>_<src_IP>-<src_port>_<dst_IP>-<dst_port>_<md5_hash>.<original_extension>
example
For the file 2020-executive-report.pdf, the default extractor filename might be:
SA-0324_2020-11-03T03:32:29-0700_198.51.100.10-8080_203.0.113.11-80_edc26aac26b6eb93c20e2bf4db77f5f9.pdf
Security Analytics sends artifacts with the default extractor filename to these providers:
n Cuckoo
n FireEye AX-series
n Lastline
n VirusTotal File
Other File Names
These providers do not receive artifacts with the default extractor filename.
Malware Analysis
The filename that Security Analytics sends to the Malware Analysis appliance differs depending on which process sends the artifact.
Real-Time Extraction
When traffic matches a Malware Analysis rule, Security Analytics sends a byte stream that has a title, which is the original file name. The title is derived from each protocol according to its packet headers: for example, FTP specifies a file name, emails have attachment filenames, HTTP specifies the file name in the URI or the POST content.
examplespdfcreator-1.3.2-en.win.exe watch_as3-vflGW0leG.swf 2020-executive-report.pdf
Manual Reputation Request
In an artifact entry on the Extractions page, click the file name and then select View Reputation Information > Malware Analysis. The name of the artifact is the default extractor filename.
In Malware Analysis you can further edit the Label of any sample (file) that you send from Security Analytics.
FTP Mover
The FTP Mover settings include the Preserve Original Filename option.
229

Administration and CentralManager Guide SecurityAnalytics 8.1.3
n Enabled — <unix_epoch_start_time>__<src_ip>_<dst_ip>__<original_filename>.<original_extension>
n Disabled — <unix_epoch_start_time>__<src_ip>_<dst_ip>.<original_extension>
examples
For the file 2020-executive-report.pdf, the filenames might be:
n Enabled — 1476834423.12753__198.51.100.10_203.0.113.11__2020-executive-report.pdf
n Disabled — 1476834423.12753__198.51.100.10_203.0.113.11.pdf
RulesUse rules to trigger a process on any flow that matches one or more indicators.
The rule types on Symantec Security Analytics are:
n Alert — Matching traffic triggers an alert.
n Data Enrichment — Matching traffic is submitted to additional resources for analysis.
n Discard Packets — Matching traffic is indexed and the rules engine is applied, but the packets are discarded and not written to the capture drive.
n Dynamic Filter — The first few packets of matching traffic are written to the capture and indexing drives, then all subsequent matching flows are excluded from the drives for a specified interval.
n PCAP Export — Matching traffic is saved as a PCAP to an external server.
n IPFIX Export — Matching traffic is sent to an external IPFIX collector.
n None — Matching traffic triggers a remote notification without producing an alert.
Rules Activated by DefaultAs soon as you upgrade to or install Security Analytics 8.1.x, these rules are applied to all incoming traffic:
n Alert - Heartbleed Attack Attempt — Alerts on traffic that matches the tls_heartbeat_attack_attempt indicator
n Alert - Non-Standard SSH — Alerts on traffic that matches application_id=ssh AND tcp_responder!=22
n Local File Analysis - Live Exploits — Applies YARA rules to traffic that matches the Local File Analysis indicator
Activate and Deactivate Rules
1. The rule is displayed in the Menu > Analyze > Rules list. The green icon indicates that the rule is active.
230

Administration and CentralManager Guide SecurityAnalytics 8.1.3
2. Click the green icon to deactivate the rule .
Prepare to Create a Rule
If you intend to use the open parser in a rule, follow the instructions in "Open Parser" on page 86.
The following rule types require prior setup:
n Alert — Optional — Set up the SMTP server on Menu > Settings > Communication > Server Settings to send alerts via email.
n Data Enrichment — Enrichment providers such as Intelligence Services and Content Analysis must be
configured and activated on Menu > Settings > Data Enrichment. (See "Symantec Intelligence Services" on page 193.)
n Dynamic Filter — Create one or more indicators to specify which types of flows to exclude. (See "Indicators" on page 129.)
n PCAP Export — Configure a directory (mount point) on an external server where the PCAPs will be sent.
n IPFIX Export — Deploy an IPFIX collector on your network. The IPFIX files that Security Analytics produces are IPFIX (NetFlow) v.10-formatted.
Create a New Rule
1. Select Menu > Analyze > Rules and click New.
2. For Name, specify a unique name for the rule.
3. For First Event, specify one or more indicators or create new indicators.
The rules engine cannot detect values for attributes that are in the verdicts or groups namespaces. Those values are produced by data enrichment processes, which populate the Indexing DB after the data has passed through the rules engine. (See "Data Enrichment" on page 188.) Attributes in the packets namespace (such as" SCADA" on page 71) are also not supported by the rules engine, with the exception of packet_length.
4. Do you want to add more events?
231

Administration and CentralManager Guide SecurityAnalytics 8.1.3
Yes — Will you be using the open parser?
Yes — You cannot add multiple events. Follow the instructions in "Open Parser" on page 86.
No — Continue the procedure.
No — Skip to this step.
5. Click Add Second Event.
6. For Then Within, specifies the amount of time that monitoring for the second event will take place, after the first event has occurred.
7. For Second Event, specify one indicator.
8. Optional — Click Add Condition. Specify which attribute of the first event should match/not match the second event. You may add as many as four conditions, each of which must be unique.
9. Optional — Click Add Third Event, specify the timespan, one indicator, and as many as four conditions.
10. For Type, select the rule type and click the corresponding link for instructions on completing the rule:
n "Alert Rule" on the next page
n "Data-Enrichment Rule" on the next page
n "Discard Packets Rule" on page 234
n "Dynamic Filter Rule " on page 234
n "PCAP Export Rule" on page 235
n "IPFIX Export Rule" on page 235
n ""None" Rule" on page 236
232

Administration and CentralManager Guide SecurityAnalytics 8.1.3
Alert Rule
This type of rule posts alerts and sends remote notifications for matching traffic but takes no further action.
n Email Frequency — Optional — Specify how often email alerts are sent (15 minutes, hour, day, and week). You must also select SMTP for Remote Notifications and set up an SMTP server on Settings > Communication to receive email alerts.
n Importance — Select the importance level.
If you change the importance level of an alert, you must deactivate then activate the rule for the change to take effect.
n Shared — Optional — Select to make the rule viewable by everyone who has access to this appliance. After you set this attribute, you cannot change it.
n Remote Notifications — Optional — Select one or more remote-notification types. You may select the default
template or configure a template on Menu > Settings > Communication > Templates. (See "Logging and
Communication" on page 306.) Verify that you have configured the appropriate server(s) on Menu > Settings > Communication > Server Settings. For ICDx you must also activate the metadata types, as described in ICDx.
o SMTP — Optional — Specify email accounts to receive the alert notifications. If you specify no email
accounts, the default email address on the Menu > Settings > Communication > Server Settings page will be used.
n Endpoint Providers — Optional — Select to send endpoint data to endpoint analysis providers.
n Click Save.
Data-Enrichment Rule
This type of rule sends data to one or more enrichment providers and posts an alert if the score is 7 or higher.
n Send to — Select one or more enrichment providers. The options for this field are derived from the items on the Data Enrichment Settings page.
n You can select a provider that is not active or licensed, but the rule will not produce a result for that provider until the provider is activated.
n The importance level (critical, warning, notice) is determined by the score that the provider returns.
233

Administration and CentralManager Guide SecurityAnalytics 8.1.3
n Shared — Optional — Select to make the rule viewable by everyone who has access to this appliance. After you set this attribute, you cannot change it.
n Remote Notifications — Optional — Select one or more remote-notification types. You may select the default
template or configure a template on Menu > Settings > Communication > Templates. (See "Logging and
Communication" on page 306.) Verify that you have configured the appropriate server(s) on Menu > Settings > Communication > Server Settings. For ICDx you must also activate the metadata types, as described in ICDx.
o SMTP — Optional — Specify email accounts to receive the alert notifications. If you specify no email
accounts, the default email address on the Menu > Settings > Communication > Server Settings page will be used.
n Endpoint Providers — Optional — Select to send endpoint data to external endpoint analysis providers.
n Click Save.
Consult Security Analytics Ports and Protocols to configure your network firewalls for data-enrichment traffic.
Discard Packets Rule
New in Security Analytics 8.1.1This type of rule prevents matching packets from being written to the capture drive. See "Intelligent Capture" on page 34.
n Shared — Optional — Select to make the rule viewable by everyone who has access to this appliance. After you set this attribute, you cannot change it.
n Click Save. When network traffic matches the event(s), the traffic is indexed and the rules engine is applied but the packets are not written to the capture drive.
Dynamic Filter Rule
See "Dynamic Filters" on page 36 for an explanation of this rule type. Before creating a dynamic filter rule, review "Guidelines for Creating Dynamic Filters" on page 37.
To see which protocols and applications are supported for indicators, go to Recognized Applications in the Security Analytics 8.1.3 WebGuide on support.symantec.com and download the XLSX or CSV file.
Use the dynfilter command to manage the dynamic filters. (More information in the Security Analytics 8.1.x Reference Guide on support.symantec.com.)
234

Administration and CentralManager Guide SecurityAnalytics 8.1.3
n Select at least one attribute from the 5-tuple that Security Analytics uses to identify a flow. Symantec recommends that you use IP protocol and IP responder only:
o IP/port initiator — Selecting the initiator port can add significant workload to the system.
o IP/port responder
o IP protocol (TCP or UDP)
n Filter Duration in Seconds — Specify the number of seconds to apply this rule before disengaging the rule.
n Shared — Optional — Select to make the rule viewable by everyone who has access to this appliance. After you set this attribute, you cannot change it.
n Click Save. When network traffic matches the event(s), the system creates a capture filter using the selected attributes and applies it for the specified interval. An alert is not produced for this type of rule, but the Audit Log will show when the rule is applied.
PCAP Export Rule
This type of rule converts matching flows to PCAP or PCAPNG files and exports them to an external server.
n Server — Select an existing mount point on an external server or click the Manage Connections icon to configure a new mount point.
n PCAPNG — Select to export in PCAPNG format.
n Shared — Optional — Select to make the rule viewable by everyone who has access to this appliance. After you set this attribute, you cannot change it.
n Remote Notifications — Optional — Select one or more remote-notification types. You may select the default
template or configure a template on Menu > Settings > Communication > Templates. (See "Logging and
Communication" on page 306.) Verify that you have configured the appropriate server(s) on Menu > Settings > Communication > Server Settings. For ICDx you must also activate the metadata types, as described in ICDx.
o SMTP — Optional — Specify email accounts to receive the alert notifications. If you specify no email
accounts, the default email address on the Menu > Settings > Communication > Server Settings page will be used.
n Click Save. When network traffic matches the events, the entire flow is exported to the specified directory as a PCAP(NG) file. The file will be named <hostname>/<rule_name>/<indicator_name>/<filename>.pcap(ng)
IPFIX Export Rule
This type of rule converts matching flows to IPFIX v.10 and exports them to an external IPFIX server. It is the responsibility of the user to deploy an IPFIX server that supports v.10 formatting.
n IPFIX Server IP — Specify the IP address or hostname of the IPFIX collector.
n IPFIX Server Port — Specify the port number that the IPFIX collector uses.
235

Administration and CentralManager Guide SecurityAnalytics 8.1.3
n Shared — Optional — Select to make the rule viewable by everyone who has access to this appliance. After you set this attribute, you cannot change it.
n Remote Notifications — Optional — Select one or more remote-notification types. You may select the default
template or configure a template on Menu > Settings > Communication > Templates. (See "Logging and
Communication" on page 306.) Verify that you have configured the appropriate server(s) on Menu > Settings > Communication > Server Settings. For ICDx you must also activate the metadata types, as described in ICDx.
o SMTP — Optional — Specify email accounts to receive the alert notifications. If you specify no email
accounts, the default email address on the Menu > Settings > Communication > Server Settings page will be used.
n Click Save. When network traffic matches the indicator(s), the entire flow is exported to the external IPFIX collector.
"None" Rule
This type of rule can be used to send remote notifications of matching traffic without producing an alert.
n Shared — Optional — Select to make the rule viewable to everyone who has access to this appliance. After you set this attribute, you cannot change it.
n Remote Notifications — Optional — Select one or more remote-notification types. You may select the default
template or configure a template on Menu > Settings > Communication > Templates. If you have not already done so, configure the appropriate server(s).
o SMTP — Optional — Specify email accounts to receive the alert notifications. If you specify no email
accounts, the Default Email Address on the Menu > Settings > Communication > Server Settings page will be used.
n Click Save.
AlertsThe Alerts Management Dashboard is the default landing page. From there you can easily access the Alerts Summary and Alerts List.
Alert Creation WorkflowFollow this procedure to populate the Alerts pages.
1. Determine what data you want to be alerted on and create one or more indicators to detect that data. (See "Indicators" on page 129.)
2. If you need to use a regular expression to detect the data, prepare and verify the expression. (See "Open Parser" on page 86.)
3. Determine what you want to know about that data.
236

Administration and CentralManager Guide SecurityAnalytics 8.1.3
Security Analytics detected the data — Follow the steps in "Rules" on page 230 to create a simple alert.
Security Analytics got a significant verdict from a data enrichment provider regarding the data — Continue the procedure.
4. Decide which enrichment providers should evaluate the data. Ensure that each provider is licensed and activated. (See "Enrichment Providers" on page 190.)
5. Verify that your firewalls permit the data enrichment traffic. (See "Security Analytics Ports and Protocols" on page 298.)
6. Ensure that the file-type filter on the enrichment provider permits the data type to reach the enrichment provider. (See "Data Enrichment Filters" on page 190.)
7. Create a data enrichment rule that includes the indicators and/or regular expression, and that sends the data to the proper enrichment providers. (See "Rules" on page 230.)
Alert ManagementThe Alerts List provides alert management and immediate data visibility.
n Assign alerts to specific users
n Assign a state to each alert to track the investigation
n Delete alerts individually or across a selected timespan
n Add responder IP addresses to the Exclude from Lookup list.
n When the alerts table exceeds 100,000 rows, the deletion algorithm removes Closed alerts first.
237

Administration and CentralManager Guide SecurityAnalytics 8.1.3
1 Alert check box.
n To toggle between Select All and Clear All, press Shift Alt *
n To expand selected alerts press Shift Alt +
n To collapse selected alerts press Shift Alt –
8 Start time for the flow that contains the alert. This value is affected by reindexing and by retaining timestamps for a PCAP import.
2 Select All check box. This check box controls only the alerts on the current page.
9 Modified on/ Modified time — Time at which the most recent child alert was posted
3 Importance level:
n Critical
n Warning
n Notice
10 Alert State — Select the alert's check box, select Actions > Set State, and select [Unassigned | Assigned | In progress | On hold | Resolved | Closed]
4 Name of the rule that produced the alert 11 Alert Owner — Select the alert's check box, select Actions > Set Owner, and select a user account.
n Users in this list have Analyze > Rules permissions.
o On a CMC, the users must have remote group permissions for the sensor; users on the sensor are not displayed on the CMC.
n To change an alert's owner, a user must have Settings > Users and Groups > User Names permissions.
238

Administration and CentralManager Guide SecurityAnalytics 8.1.3
5 Name of the indicator that matched the flow; click to view or edit the indicator.
12 Actions menu. For some actions, you have the option to apply the action to:
n all alerts that meet the filter criteria
n only the alerts with the check box selected
6 Layers 2–4 Flow Data — Ethernet and IP addresses, port numbers, and the system-assigned flow ID
Click a responder IP address to view the geolocation, get a reputation report, or select Whitelist IP for URL Reputation to add it to the Exclude from Lookup list on Settings > Data Enrichment. Adding the IP to the Exclude from Lookup list does not delete alerts that have already been posted.
13 View Report Summary — Click to view the flow in the default Summary View
7 Time when the alert was posted 14 View Artifacts — Click to extract the artifacts in this flow
Data Enrichment AlertsData enrichment alerts are generated by data-enrichment rules that you explicitly configure and enable on Analyze > Rules.
Symantec Web Reputation Service Alerts
Symantec Web Reputation Service alerts are available with an Intelligence Services subscription. Contact Symantec Support for more information.
To activate Web Reputation Service alerts:
239

Administration and CentralManager Guide SecurityAnalytics 8.1.3
1. Select Menu > Settings > Data Enrichment.
2. Under Symantec Intelligence Services, click the icon to activate Symantec Web Reputation Service.
3. Select Menu > Analyze > Rules and click the icon to activate the Symantec Web Reputation Service rule. This rule sends all URLs with a url_risk_verdict equal to or higher than 5 (unknown) to the Web Reputation Service.
4. You may edit the indicators for this rule and also specify the Web Reputation Service as a provider for other data enrichment rules, either existing or user-defined.
5. In addition to the basic alert, a Web Reputation Service alert includes child alerts for the parent:
1 Parent alert — Contains all of the information in the basic alert. Double-click the parent to toggle between expanding and collapsing the child alerts.
6 Whether the verdict was retrieved from cache. Run scm db clear_redis tonic to clear the verdict cache.
2 Child alert — Only the parent alert is counted in the tally. All child alerts come from the same flow.
7 Time when the child alert was posted
3 Alert type: URL 8 Reputation Report — Click to see verdict details
4 Risk score, as returned by the Web Reputation Service
9 URL that triggered the alert
5 Number of child alerts for the parent 10 Enrichment provider that returned the verdict
240

Administration and CentralManager Guide SecurityAnalytics 8.1.3
Symantec File Reputation Service Alerts
Symantec File Reputation Service alerts are available with an Intelligence Services subscription. Contact Symantec Support for more information.
To activate File Reputation Service alerts:
1. Select Menu > Settings > Data Enrichment.
2. Under Symantec Intelligence Services, click the icon to activate Symantec File Reputation Service.
3. Select Menu > Analyze > Rules and click the icon to activate the Symantec File Reputation Service rule. This rule sends all files that match the filters in the Symantec File Reputation Service Presented File Extensions, Symantec File Reputation Service File Types, and Symantec File Reputation Service Presented MIME Types indicators to the File Reputation Service.
4. You may edit the indicators for this rule and also specify the File Reputation Service as a provider for other data enrichment rules, either existing or user-defined.
5. When an artifact matches the indicators, the artifact is extracted, the SHA256, SHA1, and MD5 hash values are written to the Indexing DB, and an entry is displayed on the Alerts pages.
6. In addition to the basic alert, a File Reputation Service alert includes child alerts for the parent:
241

Administration and CentralManager Guide SecurityAnalytics 8.1.3
1 Parent alert — Contains all of the information in the basic alert. Double-click the parent to toggle between expanding and collapsing the child alert.
6 Whether the verdict was retrieved from cache. Run scm db clear_redis tonic to clear the verdict cache.
2 Child alert — Only the parent alert is counted in the tally. All child alerts come from the same flow.
7 Time when the child alert was posted
3 Alert type: File 8 Reputation Report — Click to see verdict details
4 Risk score, as returned by the File Reputation Service
9 MD5 hash plus file name of artifact that triggered the alert
5 Number of child alerts for the parent 10 Enrichment provider that returned the verdict
242
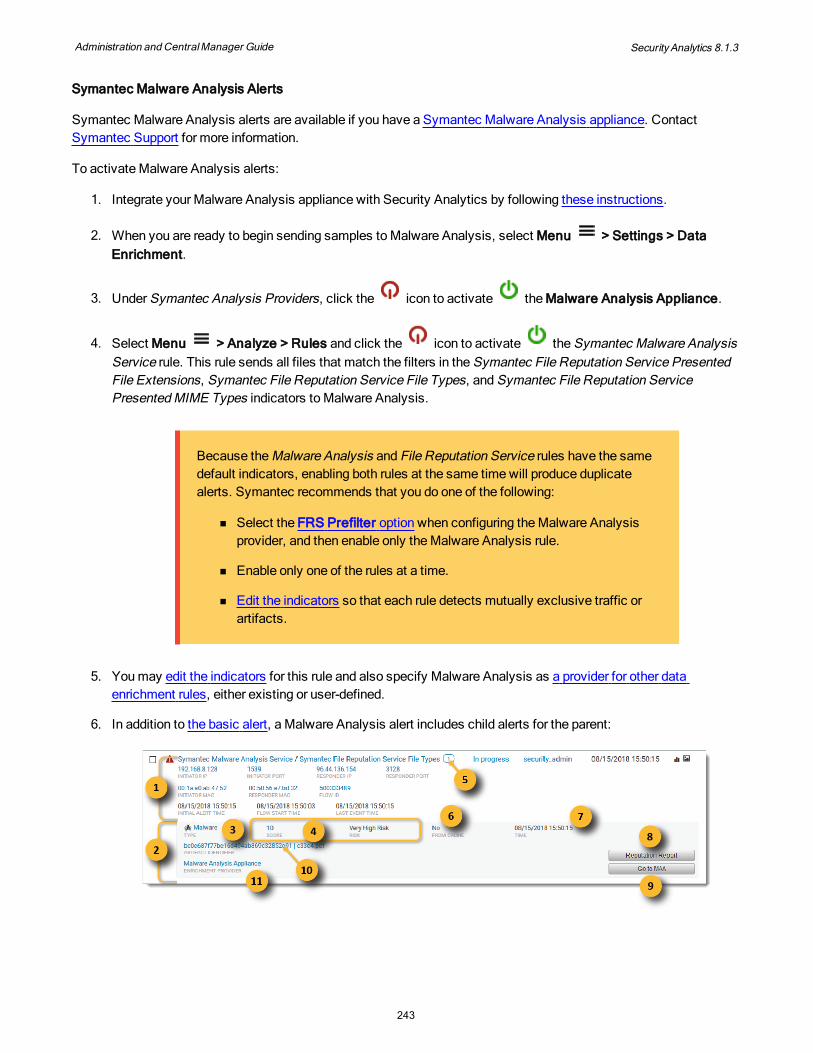
Administration and CentralManager Guide SecurityAnalytics 8.1.3
Symantec Malware Analysis Alerts
Symantec Malware Analysis alerts are available if you have a Symantec Malware Analysis appliance. Contact Symantec Support for more information.
To activate Malware Analysis alerts:
1. Integrate your Malware Analysis appliance with Security Analytics by following these instructions.
2. When you are ready to begin sending samples to Malware Analysis, select Menu > Settings > Data Enrichment.
3. Under Symantec Analysis Providers, click the icon to activate the Malware Analysis Appliance.
4. Select Menu > Analyze > Rules and click the icon to activate the Symantec Malware Analysis Service rule. This rule sends all files that match the filters in the Symantec File Reputation Service Presented File Extensions, Symantec File Reputation Service File Types, and Symantec File Reputation Service Presented MIME Types indicators to Malware Analysis.
Because the Malware Analysis and File Reputation Service rules have the same default indicators, enabling both rules at the same time will produce duplicate alerts. Symantec recommends that you do one of the following:
n Select the FRS Prefilter option when configuring the Malware Analysis provider, and then enable only the Malware Analysis rule.
n Enable only one of the rules at a time.
n Edit the indicators so that each rule detects mutually exclusive traffic or artifacts.
5. You may edit the indicators for this rule and also specify Malware Analysis as a provider for other data enrichment rules, either existing or user-defined.
6. In addition to the basic alert, a Malware Analysis alert includes child alerts for the parent:
243

Administration and CentralManager Guide SecurityAnalytics 8.1.3
The FRS Prefilter option — enabled by default — has a substantial effect on Malware Analysis alerts and reports by returning FRS verdicts for known artifacts and then sending only the unknown artifacts to the Malware Analysis appliance.
1 Parent alert — Contains all of the information in the basic alert. Double-click the parent to toggle between expanding and collapsing the child alert.
7 Time when the child alert was posted
2 Child alert — Only the parent alert is counted in the tally. All child alerts come from the same flow.
8 Reputation Report — Click to see verdict details.
3 Alert type: Malware 9 Go to MAA — Click to open the task page on the Malware Analysis appliance.
4 Risk score, as returned by a Malware Analysis appliance
10 MD5 hash plus file name of artifact that triggered the alert
5 Number of child alerts for the parent 11 Enrichment provider that returned the verdict
6 Whether the verdict was retrieved from cache. Run scm db clear_redis tonic to clear the verdict cache.
244

Administration and CentralManager Guide SecurityAnalytics 8.1.3
Remote NotificationsWith the remote notifications feature, you can customize the alert notifications that the system sends to configured ICDx, SMTP, SNMP, Splunk Phantom®, or syslog servers.
To send remote notifications follow these steps:
1. "Configure the Server" below
2. "Choose or Create a Template" below
3. "Select the Notification When Creating or Editing a Rule" on page 247
Configure the ServerConfigure server settings by following these instructions:
n "ICDx Remote Notifications" on page 85
n "Email Alerts" on page 308
n "SNMP Settings" on page 309
n "Splunk Phantom" on page 312
n "Syslog Settings" on page 311
Choose or Create a TemplateYou can select an existing template or create one or more new templates with a customized format.
1. Select Menu > Settings > Communication > Templates.
n Several preconfigured templates are already present on this page. They cannot be edited or deleted.
2. Click New. The New Template dialog is displayed.
3. For Template Name, specify a name.
4. For Type, select SNMP, SMTP, or syslog.
n If you selected SMTP, type the Subject Line for the email message.
5. For Available Fields, select the fields to include in the template. The fields correspond to the primary filter attributes plus Flow Timestamp, which is start_time="".
6. Use the up and down arrows to put the fields in the desired order.
7. For Delimiter, select which character to put between the fields.
8. The Template Output Characters field displays the template and counts the characters. This field is not editable.
9. Click Save.
245

Administration and CentralManager Guide SecurityAnalytics 8.1.3
10. These templates are available in the Rules dialog boxes (Create, Edit) under Remote Notifications. When you select a remote notification type, a drop-down list is displayed with the available templates.
Default Template Output
The default templates cannot be edited. To get other attributes create a new template. The default output is as follows:
CEF
CEF syslog messages conform to ArcSight CEF version 17.
CEF:0|<OB_CEF_DEVICE_VENDOR>|<OB_CEF_DEVICE_PRODUCT>|<VERSION>|<OB_CEF_EVENT_ID_ALERT>|<OB_CEF_EVENT_NAME_ALERT>|<alert importance>|src=<ipv4_initiator> spt=<port_initiator> dst=<ipv4_responder> dpt=<port_responder> start=<UNIX timestamp> end=<UNIX timestamp> smac=<ethernet_initiator> dmac=<ethernet_responder> msg="Rule: '<rule name>' was triggered by indicator: '<indicator name>'"
File Reputation
File reputation syslog messages are semicolon-delimited.
mime_type="<mime type>";file_type="<file type>";filename="<file name>";application_id="<application id>";md5="<md5 hash>";sha1="<sha1 hash>";sha256_hash="<sha256 hash>";ipv4_initiator="<ipv4 initiator>";ipv4_responder="<ipv4 responder>";ipv6_initiator="<ipv6 initiator>";ipv6_responder="<ipv6 responder>";ip_protocol="<ip protocol>";port_initiator="<port initiator>";port_responder="<port responder>";http_uri="<uri>";
ICDx
Security Analytics sends a JSON-formatted message to the ICDx server. This example message comes from an alert rule with only the default metadata selected on ICDx Metadata. For data-enrichment alerts the details from the enrichment provider are included.
{"log_name": "<log_name>","timezone": <integer>,"type_id": <integer>,"product_data":{"connection":{"src_ip": "<initiator ip>","dst_ip": "<responder ip>","src_port": <initiator port>,"dst_port": <responder port>,"src_mac": "<initiator mac>","dst_mac": "<responder mac>"},"ref_url": "https://<host ip>/deepsee#{\"ac\":\"Summary\",\"ca\":{\"start\":<epoch>,\"end\":<epoch>},\"pb\":[\"flow_id=<id>\"],\"icdx\":{\"cmc_pivot\":1}}","ipv4_initiator": "<initiator ip>","port_initiator": "<initiator port>","ipv4_responder": "<responder ip>","port_responder": "<responder port>","start_time": "<epoch>:999999999"},"message": "<rule or provider name>","product_name": "Symantec Security Analytics","uuid": "<uuid>","ref_uid": "<integer>","log_time": "YYYY-MM-DDThh:ii:ss.069Z","product_ver": "Solera release 8.1.3 (8.1.3_99999)","device_ip": "<host ip>","device_name": "<hostname>","category_id": <integer>,"severity_id": <integer>,"device_time": <epoch>},
Sandboxing Malware Analysis
Sandboxing Malware Analysis syslog messages are semicolon-delimited.
mime_type="<mime type>";file_type="<file type>";filename="<file name>";application_id="<application id>";md5="<md5 hash>";sha1="<sha1 hash>";sha256_hash="<sha256 hash>";ipv4_initiator="<ipv4 initiator>";ipv4_responder="<ipv4 responder>";ipv6_initiator="<ipv6 initiator>";ipv6_responder="<ipv6 responder>";ip_protocol="<ip protocol>";port_initiator="<port initiator>";port_responder="<port responder>";maa_report="><data from Malware Analysis appliance>";http_uri="<uri>";
246

Administration and CentralManager Guide SecurityAnalytics 8.1.3
SMTP
SMTP messages are tab-delimited.
ipv4_initiator=<ipv4 initiator>→port_initiator=<port initiator>→ipv4_responder=<ipv4 responder>→port_responder=<port responder>→start_time=<UNIX timestamp>
SNMP
SNMP messages are pipe-delimited.
ipv4_initiator=<ipv4 initiator>|port_initiator=<port initiator>|ipv4_responder=<ipv4 responder>|port_responder=<port responder>|start_time=<UNIX timestamp>
Splunk Phantom
Security Analytics sends JSON-formatted data. This output does not have a template associated with it, and you cannot create a custom template for this output.
{"cn1":<verdict>,"cn1Label":"verdict","cs4":"<rule_name>","cs5":"<indicator_name>","dmac":"<destination_MAC_address>","end":"<artifact_end_unix_time>","msg":"Rule '<rule_name>' was triggered by Indicator: '<indicator_name>'","smac":"<source_MAC_address>","start":"<artifact_start_unix_time>""title":"<file_name>|<url>"}
Web Reputation
Web reputation syslog messages are semicolon-delimited.
http_uri="<http url>";mime_type="<mime type>";application_id="<application id>";ip_protocol="<ip protocol>";ipv4_initiator="<ipv4 initiator>";ipv4_responder="<ipv4 responder>";ipv6_initiator="<ipv6 initiator>";ipv6_responder="<ipv6 responder>";port_initiator="<port initiator>";port_responder="<port responder>";
Select the Notification When Creating or Editing a RuleFor more information see "Rules" on page 230.
n Near the bottom of the New Rule and Edit Rule dialogs there is a Remote Notifications section.
n Select one or more check boxes for the remote notifications that you want to send.
n For most check boxes that you select you can select the template to use for the notification.
n When the rule is active, data is sent to the configured server in the format that you have selected.
n To stop the data from being sent you have these options:
o Deactivate the rule
o Edit the rule to clear the check box for the notification
Data Enrichment Filters
Menu > Settings > Data Enrichment > Default Data Enrichment Filter
247

Administration and CentralManager Guide SecurityAnalytics 8.1.3
This table displays the file and MIME types that are included in each Data Enrichment File-Type Filter. Data Enrichment File-Type Filter.
Filter Name MIME Types
Adobe® PDF application/acrobatapplication/pdfapplication/x-pdftext/pdftext/x-pdf
Archives application/bz2 application/bzip2 application/epub+zip application/gzip application/gzip-compressed application/gzipped application/rar application/vnd.ms-cab-compressed application/x-7z-compressed application/x-bz2 application/x-bzip application/x-bzip2 application/x-cab application/x-cab-compressed application/x-cabinet application/x-compress application/x-compressed application/x-cpio application/x-gunzip application/x-gzip application/x-gzip-compressed application/x-rar application/x-rar-compressed application/x-redhat-package-manager application/x-rpm application/x-tgz application/x-xz application/x-zip application/x-zip-compressed application/zip gzip/document multipart/x-zip
Binaries application/binapplication/binaryapplication/octet-stream
248

Administration and CentralManager Guide SecurityAnalytics 8.1.3
Filter Name MIME Types
Code application/cgi application/force-download application/php application/x-cgi application/x-httpd-php application/x-httpd-php3 application/x-httpd-php3-preprocessed application/x-httpd-php4 application/x-httpd-php-source application/x-php text/html text/phptext/x-ctext/x-c++wwwserver/shellcgi
Configuration Files application/isf.sharing.configapplication/vnd.centra.client.configuration
Debian® Packages application/osx.app-archive application/vnd.debian.binary-package application/x-apple-diskimage application/x-deb application/x-debian-package application/x-debian-package-iphoneos application/x-debian-package-osx application/x-ios-app
Email application/emailapplication/x-emailmessage/rfc822
IPA Files application/ios.app-archive
249

Administration and CentralManager Guide SecurityAnalytics 8.1.3
Filter Name MIME Types
Images application/bmp application/jpeg application/png application/x-bmp application/x-png application/x-win-bitmap image/bmp image/gif image/jpeg image/jpg image/ms-bmp image/pjpeg image/png image/vnd.swiftview-jpeg image/x-arib-png image/x-bitmap image/x-bmp image/x-citrix-pjpeg image/x-ms-bmp image/x-png image/x-win-bitmap image/x-windows-bmp image/x-xbitmap images/jpeg images/png img/png
JAR Archives application/jar application/java-archive application/vnd.android.package-archiveapplication/x-jar application/x-java-applet application/x-java-archive application/x-java-bean
JavaScript application/javascriptapplication/js application/vnd.javascript application/x-javascript application/x-js text/javascript text/js text/x-javascript text/x-js
250

Administration and CentralManager Guide SecurityAnalytics 8.1.3
Filter Name MIME Types
Multimedia, Audio, Video application/x-troff-msvideo application/asx application/flv application/swf application/vnd.ms-asf application/x-fcs application/x-flv application/x-mplayer2 application/x-pn-mpg application/x-shockwave-flash application/x-shockwave-flash2-preview audio/aiff audio/asf audio/avi audio/mp3 audio/mpeg audio/mpeg3 audio/mpg audio/vnd.rn-realaudio audio/wav audio/wave audio/x-amzaudio audio/x-mp3 audio/x-mpeg audio/x-mpeg3 audio/x-mpegaudio audio/x-mpg audio/x-pn-realaudio audio/x-pn-realaudio-plugin audio/x-pn-wav audio/x-realaudio audio/x-wav image/avi image/mov image/mpg video/avi video/flash video/fli video/flv video/mp2t video/mp4 video/mpeg video/mpeg2 video/mpg video/msvideo video/quicktime video/x-flv video/x-mpeg video/x-mpeg2a video/x-mpg
251

Administration and CentralManager Guide SecurityAnalytics 8.1.3
Filter Name MIME Types
video/xmpg2 video/x-ms-asf video/x-ms-asf-plugin video/x-msvideo video/x-ms-wm video/x-ms-wmv video/x-ms-wmx video/x-pn-realvideo video/x-quicktime
252

Administration and CentralManager Guide SecurityAnalytics 8.1.3
Filter Name MIME Types
Office Documents appl/text application/cdfv2 application/cdfv2-corrupt application/doc application/msexcel application/mspowerpnt application/mspowerpoint application/ms-powerpoint application/msword application/powerpoint application/rtf application/vnd.ms-excel application/vnd.ms-excel.12 application/vnd.ms-excel.addin.macroEnabled application/vnd.ms-excel.addin.macroEnabled.12 application/vnd.ms-excel.sheet.binary.macroEnabled application/vnd.ms-excel.sheet.binary.macroEnabled.12 application/vnd.ms-excel.sheet.macroEnabled application/vnd.ms-excel.sheet.macroEnabled.12 application/vnd.ms-excel.template.macroEnabled application/vnd.ms-excel.template.macroEnabled.12 application/vnd.ms-office application/vnd.ms-officetheme application/vnd.mspowerpoint application/vnd.ms-powerpoint application/vnd.ms-powerpoint.addin.macroEnabled application/vnd.ms-powerpoint.addin.macroEnabled.12 application/vnd.ms-powerpoint.presentation.12 application/vnd.ms-powerpoint.presentation.macroEnabled application/vnd.ms-powerpoint.presentation.macroEnabled.12 application/vnd.ms-powerpoint.slideshow.macroEnabled application/vnd.ms-powerpoint.slideshow.macroEnabled.12 application/vnd.ms-powerpoint.template.macroEnabled application/vnd.ms-powerpoint.template.macroEnabled.12 application/vnd.msword application/vnd.ms-word application/vnd.ms-word.document.macroEnabled application/vnd.ms-word.document.macroEnabled.12 application/vnd.ms-word.template.macroEnabled application/vnd.openxmlformats-officedocument.presentationml.presentation application/vnd.openxmlformats-officedocument.presentationml.slideshow application/vnd.openxmlformats-officedocument.presentationml.template application/vnd.openxmlformats-officedocument.spreadsheetml.sheet application/vnd.openxmlformats-officedocument.spreadsheetml.template application/vnd.openxmlformats-officedocument.wordprocessingml.document application/vnd.openxmlformats-officedocument.wordprocessingml.template
253

Administration and CentralManager Guide SecurityAnalytics 8.1.3
Filter Name MIME Types
application/vnd.wordperfect application/winword application/word application/x-dos_ms_excel application/x-excel application/xls application/x-msexcel application/x-ms-excel application/x-msw6 application/x-msword application/x-powerpoint application/x-rtf text/richtext text/rtf
Programs and Libraries application/bat application/exe application/vnd.ms-dll application/x-bat application/x-dosexec application/x-exe application/x-msdos-program application/x-msdownload application/x-msi application/x-ole-storage application/x-vbs text/vbs text/vbscript text/x-msdos-batch
254

Administration and CentralManager Guide SecurityAnalytics 8.1.3
Appliance SecurityUser Accounts and Groups 255
Account Settings 265
Remote Authentication 267
Common Access Card Authentication 276
Using RADIUS and LDAP in Parallel on Security Analytics 278
LDAP Group Inheritance 279
Remote Access 284
Passwords 290
SSL Certificates and Keys 291
Security Analytics Ports and Protocols 298
Disable SSH Root Logins 301
SSH Authentication 302
MD5-Encrypted Password for Bootloader 303
Federal Information Processing Standards 304
Security Best Practice n Do not run "software hardening" scripts on Security Analytics; such scripts are
likely to change internal settings that will cause the system to malfunction.
n Never modify system settings via the CLI (such as CONF files) unless you are explicitly directed to by Support or the user documentation. Modifying system settings in this manner may lead to an insecure or malfunctioning device.
n To fine-tune security settings that are not described in user documentation, contact Symantec Support.
User Accounts and Groups
Select Menu > Settings > Users and Groups to configure local user accounts and their groups. With these groups you can exercise RBAC (Role-Based Access Control). RBAC gives administrators the ability to assign specific view or modify permissions to "roles" (which are represented by "groups" on Security Analytics), and then to assign the users to one or more groups. In this way, administrators can impose a granular level of control over what users are permitted to do or see on Security Analytics.
255

Administration and CentralManager Guide SecurityAnalytics 8.1.3
Local Users n You can create up to 256 local users on the Security Analytics appliance.
n User names and passwords support the UTF-8 character set.
n Password strength can be configured on Settings > Security.
n To enable two-factor authentication for your account, see "Two-Factor Authentication" on page 275.
Security Best Practices n Do not modify password complexity settings except to increase password length.
n Specify different passwords for each user when setting up local user accounts.
n Require that user passwords be regularly changed, using "password aging." 90 days should be the maximum age.
n Notify users 7 days before their passwords expire.
Add a User
1. Select Menu > Settings > Users and Groups > Users.
2. Select Tools > New.
3. Under Login Details, specify the username and type the password twice. The username cannot contain spaces.
4. Optional — For User Groups, the default user group is present. You can delete this group or add other user groups, as desired.
A user account that does not belong to any groups does not have access to the appliance.
5. Optional — Under Account Details specify the user's real name and email address.
6. Click Save.
n If you lose access to all of the admin-level accounts on the web interface, log on to the CLI with root permissions and run the following:
/gui/dsweb/Console/cake --app /gui/dsweb solera_acl elevate <username>
256

Administration and CentralManager Guide SecurityAnalytics 8.1.3
n where <username> is the name of an existing user account. The command places the user in a new group with administrator privileges called elevated-admin-<YYYY-MM-DD>T<hh:ii:ss>. Log on with this account using its original password, and then edit the account and the group in Settings > Users and Groups.
Modify User Accounts
Use the controls on the Users and Groups page to modify or delete user accounts.
Local User — This user account was created directly on the appliance. When you delete this user, the user’s group membership and login data are deleted, so the user cannot log in to the appliance again.
Edit Account — Click to change the user’s password, enable or disable the account, or change group membership.
Delete User — If a user is logged in when its account is deleted, the user’s next action will fail.
Non-Local Account — This user has logged in to the appliance using remote-server credentials such as LDAP or RADIUS. When you delete a non-local user from the appliance, the user is deleted from all local groups, but the account on the remote server is unaffected. When the user logs in to the appliance again using those remote credentials, the user account appears again on the Users and Groups page in the default group. The admin may then manually add or remove the user from the group.
To prevent remote users from gaining unwanted access, do one of the following:
n Create a group that has few access privileges and designate it as the default group.
n In the LDAP search settings, select a Group DN that excludes unwanted users. (See "LDAP Group Inheritance" on page 279.)
Enabling and Disabling User Accounts
n User accounts are disabled automatically after a specified number of failed login attempts. (See "Web Access"
on page 286.) You can re-enable the user account by clicking its Edit icon and clearing Account Disabled.
n Likewise, you can manually disable a user account by selecting the Account Disabled check box.
Shell-Only UsersShell-only user accounts can access the appliance through an SSH session only. They do not appear on and cannot be modified in the web interface. The password for a shell-only user expires after 60 days.
To create a shell-only user, log in to the CLI with root credentials.
257

Administration and CentralManager Guide SecurityAnalytics 8.1.3
syntaxscm solera_acl shell_only [<parameters>]
parameters
<username> User name for the shell account; this account must already exist on the appliance, created either on the web interface or with the dsadduser command.
-r Remove the shell-only flag from the account.
examplesscm solera_acl shell_only
Displays a list of shell-only users.
scm solera_acl shell_only <username>
Converts the username account on the web UI to shell only. The account is no longer displayed in the web UI.
scm solera_acl shell_only -r <username>
Removes the shell-only flag from the user account.
Account Profile SettingsClick the name of the current account to change user name, email, password, display, and authentication preferences.
Settings
[Account Name] > Account Settings
1. For Name, type a display name for your account.
2. For Email, type the email address to associate with the account.
3. Optional — Click Change Password.
n The default requirements for password strength are:
o 14 characters
o digit (numeral)
o other character (non-alphanumeric [#, &, %])
o upper-case letter
n To change these rules, go to Settings > Security. (See "Passwords" on page 290.)
o Type the current (old) password.
o Type and then retype the new password.
258

Administration and CentralManager Guide SecurityAnalytics 8.1.3
4. API Key — The API key is used for web services APIs. You must be logged in to the account to generate its API key. Admin-level accounts cannot generate API keys for other accounts.
n The API key is not visible on the web UI by default.
n Click Reset API Key to view and copy the API key.
n After you close the Account Settings dialog, the API key will not be available again. You must click Reset API Key to generate a new key.
n When you click Reset API Key, the previous API key is deleted.
n A new user account does not have an API key until the user logs in to the web UI, opens Account Settings, and clicks Reset API Key.
5. Time Prefix, Time Suffix — See Single Time-Value Configuration in the Security Analytics 8.1.x Reference Guide on support.symantec.com.
Preferences
[Account Name] > Preferences
n Number of Entries per Page — Select the number of rows to display for the data tables.
n Network Traffic — Select the unit of measurement to display: bits, bytes, packets.
n Language — Select the language for the interface.
n Enable Google Authenticator — Select to enable 2FA.
Do not enable 2FA until after you have installed Google Authenticator on your smart phone; otherwise, you may be locked out of the web interface.
n Artifact MIME-Type Display — Specify how the file type is displayed in the Type column on the Extractions page:
o Presented — Use the value in the Content-Type field of the HTTP or email header, else show unknown.
o Detected — Use the embedded magic number or file signature, else show unknown.
o Derived — If both presented and detected values are present, use internal logic to display the most likely file type.
User GroupsSecurity Analytics has three preconfigured user groups:
n admin — Full modification rights via the web interface and the CLI
n auditor — View and download logs
259

Administration and CentralManager Guide SecurityAnalytics 8.1.3
n security_admin — Full modification rights but no capture or analyze permissions
n user — View and modify capture and analysis pages; all new users are assigned to this group by default.
Create or Modify a Group
1. Select Menu > Settings > Users and Groups > Groups.
2. Do one of the following:
n Click the Edit icon for an existing group.
n Click Actions > New and specify a unique Name.
3. Optional — Select Default to make this the default group. All new users will placed into this group by default.
4. Optional — For Description, describe the group characteristics.
5. Specify the group's access rights. See Group Permissions, below.
6. Optional — For Filter, specify which data this group can access. (See "Data Access Control" on page 265.)
7. Optional — For Users, type the names of the group's members. You can also leave this field blank and return later to add names.
8. Is LDAP authentication enabled on this appliance?
Yes — Optional: For LDAP Groups, type any value that exists within the search scope of the Group DN field on the Authentication Settings page. See "Limiting LDAP User Searches" on page 269 and "LDAP Group Inheritance" on page 279 for more information.
No — Continue the procedure.
9. Click Save.
260

Administration and CentralManager Guide SecurityAnalytics 8.1.3
Group Permissions
Security Best Practices Provide users with only the level of access that is required for their roles.
n Use the security_admin group for users who must verify that the appliance's security settings conform to your organization's policies.
n If a user needs to view reports but will not be responsible for making configuration changes, assign the user to a group that does not have Settings permissions or that has read-only access to the Settings pages.
n Assign a user who is an auditor to the default audit group, which has permission to view and download logs only.
n Use data-access control to restrict access to particular types of report and artifact data. For example, if Filter contains application_group!=web, the user cannot view data that has been classified in the Web Application Group.
When assigning group permissions, you can select a parent permission to include all of its children permissions, or you can select each permission separately. When you select the Capture check box, for example, you assign all capture-related permissions to the group, or you can clear Capture child permissions individually.
n The Security Administrator has access to all settings and the CLI but cannot capture or analyze data.
n New in Security Analytics 8.1.1 Read-only (view) permissions have been provided for some common features. New permissions are shaded in yellow. These new permissions are automatically enabled for the admin group upon upgrade.
n Click the link below to see the table.
261

Administration and CentralManager Guide SecurityAnalytics 8.1.3
Default Group PermissionsPermission Admin
Sec. Admin
Auditor User
Full modify permissions X
Settings — Modify all Settings pages. X X
Authentication — Remote login services (LDAP, RADIUS, Kerberos) X X
Central Manager — Add and remove CMC control X X
Communication — SNMP, syslog, notifications X X
View — View communications X X
Modify — Modify communications X X
Data Enrichment — Data-enrichment server setup; reputation providers X X
View — View data enrichment settings X X
Modify — Modify data enrichment settings X X
Data Retention — Time-based data deletion; summary graph data purge X X
Date/Time — Time zone, NTP X X
View — Read date/time settings X X
Edit — Modify date/time settings X X
Geolocation — Google Earth, MaxMind databases, internal subnets X X
ICDx — View and modify ICDx settings X X
View — View ICDx settings X X
Edit — Modify ICDx settings X X
License — View, install, and download license X X
View — View license information X X
Edit — Modify license information X X
Metadata — Enable and disable reports and indexing attributes. X X
Network — IP address, hostname, DNS, proxy X X
Security — Firewall, access control, session control X X
System X X
CSR — Download the Customer Service Report X X
Reboot X X X
Shut Down X X
Upgrades — Initiate upgrades X X
262

Administration and CentralManager Guide SecurityAnalytics 8.1.3
Permission AdminSec. Admin
Auditor User
Users and Groups — View, create, and modify user and group accounts X X
User Names — View user names only X X X
User Records — Create, update, and view user records X X
Web Interface — Session timeouts, referrers, and message of the day X X
Statistics — View statistics pages X X X
Logs — View and download logs X X X
Capture — Perform all capture, playback, and PCAP functions X
Capture Summary — View Capture Summary Graph X X
Capture — Stop and start capture X X
Playback — Stop and start playback X X
Reindexing — Initiate reindexing X X
Capture Statistics — View capture rate and system statistics X X
Filters — Create, modify, and apply capture filters X
Import PCAP — Import PCAP files X X
Import Remote PCAP — From remote servers X X
Import Local PCAP — From local directories and USB drives X
Import PCAP from Browser — Import PCAPs using a browser X X
PCAPs — Download and analyze PCAPs X X
PCAPs without Access Restrictions — Download PCAPs using BPF filter; ignore data-access restrictions
X X
Analyze — Analyze PCAPs X X
Download — Download PCAPs X X
Analyze — All pages under Analyze X X
Summary — View Summary page X X
View — View the Summary page X X
Edit — Modify the Summary page X X
Reports — View, generate, schedule, and modify reports X X
Risk and Visibility Report — Generate the Risk and Visibility report X
View — View reports X X
Modify — Modify reports X X
Scheduled Reports — Create and modify scheduled reports X X
263

Administration and CentralManager Guide SecurityAnalytics 8.1.3
Permission AdminSec. Admin
Auditor User
Artifacts — View and download artifacts X X
Download — Download and preview artifacts X X
Metadata — View artifact metadata X X
Geolocation — View the Geolocation page X X
View — View the Geolocation page X X
Edit — Modify the Geolocation page X X
Rules — Create, edit, and delete rules and alerts X X
Current User Only — Create, edit, and delete rules for the logged-in user account; view related alerts
X X
All User Rules — Edit and delete rules from all users; view all alerts X X
Edit Rules — Create, edit, and delete rules for the logged-in user account
X X
Indicators — View, create, and modify indicators X X
View — View indicators X X
Edit — Create, upload, edit, and delete indicators X X
CLI — Restricted-shell access to the CLI via SSH X X
Base Permissions — Read-only commands such as ls, pwd, less X X
Tier 1 Permissions — Networking and file system management, as specified in /etc/sudoers.d
X X
Tier 2 Permissions — File system and admin utilities, process and drive Management, as specified in /etc/sudoers.d
X X
Job Queue — View the Job Queue page, delete jobs and download files X X
View — View the Job Queue page X X
Delete — Delete jobs X X
Download — Download files from the jobs X X
Security Best Practice Assign only Base-level permissions for shell access.
264

Administration and CentralManager Guide SecurityAnalytics 8.1.3
Data Access Control
n Use data access control to specify which data types a group can access. All primary filter attributes are valid for this field. (See " Metadata Tables" on page 58.)
n For example, if you specify application_group=web, the users in the group can access only the data that is related to the Web application group. Leave the field blank to grant access to all data types.
Remote-Authentication Users n When remote authentication is enabled (LDAP, Kerberos, RADIUS), users can log on to the appliance without
the admin creating the user on the appliance.
n When a user logs on to the appliance with remote credentials, the user automatically appears on the Settings > Users and Groups page and is placed in the default group.
Create a default user group on Security Analytics with minimal or zero permissions so that when the user logs in to the appliance for the first time, the user will not be able to access sensitive information. After you verify that the user is a legitimate Security Analytics user you can move the user into a group that has suitable permissions.
n Remote users are designated by this icon , whereas local users are designated thus:
n If remote authentication is enabled, you cannot create a local username that is identical to a username on a remote authentication server.
Account Settings
The settings in this menu affect only the logged-in account. To configure general user settings, see "User Accounts and Groups" on page 255 or "Remote Authentication" on page 267.
265

Administration and CentralManager Guide SecurityAnalytics 8.1.3
n Account Settings — Change the display name, associated email, and password; set the time prefix and suffix for APIs, and view the account's API key.
n Preferences
o Number of Entries per Page — Select the default number of rows to show in results tables.
o Network Traffic — Select the unit of measurement: bits, bytes, or packets to display on the capture interface boxes.
o Language — Select the display language for the web interface.
o Use Dark Theme — New in Security Analytics 8.1.1 Select to change the UI colors from a light background to a dark background. After clicking Save, refresh the browser.
o Enable Two-Factor Authentication — Select to enable Two-Factor Authentication.
Do not enable 2FA until after you have verified the following; otherwise, you may be locked out of the web interface*:
n The TOTP app is installed on your smart phone and is working.
n The time on the Security Analytics appliance is correct and coordinated with NTP. Because the 2FA token is valid for only 30 seconds, the appliance will reject a token that appears to be outside the validity timespan.
*Use the scm tally command to restore access.
n Artifact MIME-Type Display — Specify how the file type is displayed in the Type column on the Extractions page:
o Presented — Use the value in the Content-Type field of the HTTP or email header, else show unknown.
o Detected — Use the embedded magic number or file signature, else show unknown.
o Derived — If both presented and detected values are present, use internal logic to display the most likely file type.
n Risk and Visibility Report— Generate a PDF document that contains summaries of key findings, threat analysis, network visibility, and anomalies for a selected timespan.
n Encoder/Decoder Tool — Convert copied text to and from encoding algorithms such as URL and Base 64.
266

Administration and CentralManager Guide SecurityAnalytics 8.1.3
Remote Authentication
Security Best Practices n Because remote-authentication servers may provide stronger password-storage
and password-guessing protections than local user accounts, implement third-party authentication instead of using local accounts.
o Create a default user group with minimal permissions so that remote-authentication users cannot automatically access sensitive information.
n Active Directory and LDAP should have encrypted connections to Security Analytics.
o Security Analytics should initiate authenticated connections with the remote authentication server—not the other way around.
n Encrypt connections to authentication servers with TLS. Security Analytics 7.3.1 and later uses TLS 1.2 only.
LDAP AuthenticationWith the LDAP authentication service, users can log on to the Security Analytics appliance using a username/password combination stored on an external LDAP server. These credentials are valid for both the web interface and the CLI.
Because each network is unique, Symantec cannot make specific recommendations as to how you should integrate LDAP with Security Analytics.
When a user attempts to authenticate via LDAP, the process is as follows:
1. The user logs in via HTTP or SSH.
2. The appliance sends a BIND request containing the BIND DN credentials to the LDAP server.
3. The LDAP server returns success or failure.
4. The appliance sends the LDAP user credentials and search base criteria to the LDAP server.
5. The LDAP server returns success or failure.
6. The appliance allows authentication; if successful, the user is added to the user list in the default user group on the Users and Groups settings page.
267

Administration and CentralManager Guide SecurityAnalytics 8.1.3
Create a default user group on Security Analytics with minimal or zero permissions. When an LDAP user logs in to the appliance for the first time, the user will not be able to access sensitive information. If the user is a legitimate Security Analytics user you can move the user into a group that has suitable permissions.
Enable LDAP
1. Select Menu > Settings > Authentication.
2. Select the Enable LDAP Authentication check box. The system will automatically attempt to discover an LDAP server.
3. Decide whether to enable/disable the Use Radius for authentication check box:
n Is RADIUS also enabled? If not, this option is not applicable and will be ignored.
n Disable this option when you want Security Analytics to use LDAP for authentication if RADIUS authentication fails. If LDAP authentication also fails, Security Analytics will attempt to authenticate the user with the local user database.
n Enable this option when you want Security Analytics to only use RADIUS for authentication. If RADIUS authentication fails, the user cannot log in, even if the user is also defined on the LDAP server or the local user database.
4. If the auto-discover is unsuccessful, the LDAP Auto-Discover dialog box is displayed. Do one of two things:
n Click Cancel and manually specify the LDAP settings.
n Supply the BIND domain FQDN and click Save.
o Follow the prompts to provide the LDAP BIND authentication credentials for the domain controller. For an anonymous LDAP BIND, leave these fields blank.
o Click Save. The system discovers the configuration information from Active Directory or LDAP server and populates the Authentication page.
At any time during LDAP configuration, you can click the Test LDAP button to see if the settings are valid
Modify LDAP Server Settings
If there is more than one domain controller on the system, by default the system discovers the primary server configured. You can change the settings to use another domain controller by following these steps:
1. For Server, enter the LDAP server’s hostname or IP address.
2. For Port, enter one of the following:
268

Administration and CentralManager Guide SecurityAnalytics 8.1.3
n 636 for secure LDAP
n 389 for LDAP
n 3268 for Active Directory®
3. Select the Encryption Type.
n For SSL/TLS or StartTLS, you should select the Verify Server Certificate check box only if your LDAP server has a certificate from a valid certificate authority.
n If the LDAP server certificates are self-signed, clear the Verify Server Certificate check box.
4. Enter the BIND DN and BIND Password for an account that has rights to search the containers where the LDAP users are located. If your LDAP server does not require an authorized login, you may leave the Authenticated BIND fields blank.
5. Select Enable Credentialed Group BIND if you want to determine group membership by querying LDAP as the logged-in user instead of using the authenticated BIND credentials.
6. Click Save. The appliance will immediately try to connect to the LDAP server.
Limiting LDAP User Searches
To improve LDAP login performance, you can constrain the range of containers to be searched when looking for an LDAP user.
Search Base
The starting container where the LDAP server will begin searching for LDAP users. Only one search base is allowed. Specify using LDIF, e.g., DC=<subdomain>,DC=<domain>.
Scope
How the LDAP server will search within that container.
n base — Queries only the search base but nothing below it
n one — Queries only the first level under the search base but not the search base itself
n sub — Queries the search base and every level under it
Group DN
The group whose members will be added to the default user group on the Security Analytics appliance.
Before you specify the Group DN, you must correctly set the Group Membership Attribute under Schema Configuration. This attribute's syntax varies according to your LDAP implementation. If the attribute is specified incorrectly, the Group DN field will not populate properly.
Examples of the group members that are included in the search parameters are displayed.
269

Administration and CentralManager Guide SecurityAnalytics 8.1.3
Warning: When configuring LDAP, do not leave Group DN blank, as all LDAP users in the search scope will be able to authenticate as members of the default user group. Doing so poses a security risk.
Before you specify Group DN, create a default user group on Security Analytics with minimal permissions so that the LDAP users are not accidentally granted more permissions than desired. Later, you can manually assign each user to the desired groups.
Membership in the Security Analytics user group is established when the LDAP user logs in to Security Analytics for the first time. If you change the default user group or the Group DN, the membership of users who have logged in once to Security Analytics will not change.
After you specify a Group DN, you can add other LDAP groups to different Security Analytics user groups such that the LDAP group inherits the permissions of the Security Analytics group. See LDAP Group Inheritance.
Group Name Attribute
Specify the attribute to use for the group name.
Identifying the LDAP Schema Configuration
Because LDAP schema mappings vary between LDAP implementations, you can select an appropriate schema mapping such as InetOrgPerson, Microsoft® Active Directory®, and Microsoft Services for Unix®. Select the LDAP schema that your server uses from the list. Most Open LDAP implementations will work with the InetOrgPerson configuration. If your server’s schema is not in the list, select User Defined and fill out the resulting fields.
Note on Server-Side Changes to LDAP
LDAP server settings are performed with each proprietary LDAP implementation. Depending on the LDAP server being used, schema may need to be extended to allow for certain attributes such as Unix attributes to be added to the user objects themselves. This may require elevated rights to make the necessary modifications to either the LDAP schema or the LDAP users. The attributes that must be present on the LDAP users are uidnumber, gidnumber, and homeDirectory.
Specify a Mapped LDAP Schema
1. Select Menu > Settings > Authentication and scroll down to Schema Configuration.
2. For LDAP Schema select one of the following options:
n InetOrgPerson — Standard LDAP configurations
n Microsoft Active Directory — Microsoft Active Directory configurations
270

Administration and CentralManager Guide SecurityAnalytics 8.1.3
n Microsoft Active Directory (RFC 2307) — MS Active Directory configurations compliant with the ITEF RFC 2307 standard
n Microsoft Services for Unix 2.0 — MS Active Directory configurations compliant with the Unix 2.0 standard
n Microsoft Services for Unix 3.5 — MS Active Directory configurations compliant with the Unix 3.5 standard
n RFC 2307 Network Information Service — Network Information Service compliant with the ITEF RFC 2307 standard
n RFC 2307bis Network Information Service — Network Information Service compliant with the ITEF RFC 2307bis standard
n User Defined — All other LDAP configurations. If you select this option, go to "Define a New LDAP Schema" below.
3. Click Save. The appliance will now use these values when searching for LDAP users.
Define a New LDAP Schema
1. Scroll down to the Schema Configuration section.
2. For LDAP Schema, select User Defined.
3. Specify the User Object Class.
4. For Login Name Attribute, type the LDAP distinguished name.
5. For Full Name (GECOS) Attribute, type the full name of the user (or application name, if the account is for a program). You can also append the following (separated by commas):
n Building and room number or contact person
n Office telephone number
n Any other contact information (pager number, fax, etc.)
6. For User Password Attribute, type the account password.
7. Select the Password Change Method:
n Active Directory (ASDI) n Cleartext n Cleartext (remove old password first) n Crypt n IBM® RACF
n MD5 n Novell® NDS n RFC 6032 n RFC 6032 (send old and new
passwords)
8. Specify the User ID Number Attribute and Home Directory Attribute.
9. For User Shell Attribute, type the name of the shell that the user will use to log in.
10. Specify any Shadow Object Class.
271

Administration and CentralManager Guide SecurityAnalytics 8.1.3
11. Specify the Group Object Class and Group ID Number Attribute for nested and dynamic groups.
12. For Group Membership Attribute, type the name of the attribute where group membership should be derived. This attribute must match the schema on the LDAP server.
13. Select Distinguished Name or UID for Group Membership Type.
14. Click Save. The appliance will now use these mapping values when searching for LDAP users.
CAC AuthenticationInstead of entering credentials in the Security Analytics login screen, users can insert a Common Access Card (CAC) in a card reader connected to their workstation. Note that the user accounts (names and passwords) must be previously defined on an external LDAP server, and the CAC must be signed with a CA bundle. For more information about configuring Security Analytics for CAC authentication, see "Common Access Card Authentication" on page 276.
Note: Before enabling CAC, make sure to complete steps 1 and 2 in "Configure Security Analytics to Authenticate with a CAC" on page 277.
To enable CAC authentication:
1. Select Menu > Settings > Authentication.
2. Make sure LDAP has been enabled, configured, and tested.
3. Locate the Smart Cards and Certificates section.
4. Select the Use Certificate / Card for Authentication check box.
5. Click Save.
Troubleshooting LDAPFor further assistance, contact Symantec Support.
problem
The system returns the error message: Your LDAP settings were not discoverable. Please enter the BIND Domain FQDN and another attempt will be made.
solution
Verify that the name servers are configured properly. The search base and domain should not be pointing to the wrong domain in /etc/resolv.conf.
problem
The system returns the error message: Your LDAP settings were not discoverable. Please check the username and password. If that still does not fix the problem, cancel this dialog and manually enter your settings.
272

Administration and CentralManager Guide SecurityAnalytics 8.1.3
solution
Select Settings >Network and verify that DNS is configured correctly and is pointing to a Windows domain controller. Verify that the username and password are correct for the domain controller.
problem
Security Analytics sends too many login requests to the LDAP server.
solution
In versions 7.3.2 and later, create /etc/ldap_throttle.conf with the following arguments to control the number of milliseconds between sequential LDAP login requests.
./pam_ldap.c:#define THROTTLE_MIN <milliseconds>
./pam_ldap.c:#define THROTTLE_MAX <milliseconds>
When /etc/ldap_throttle.conf does not exist, the system performs no throttling.
Kerberos AuthenticationIf Kerberos® is implemented on your network, you can provide single sign-on (SSO) access to the Security Analytics appliance.
Kerberos SSO and Active Directory authentication via an LDAP group DN are mutually exclusive. If Kerberos is enabled, anyone in the domain can authenticate to the Security Analytics appliance successfully. If you specify a group DN in the Searches section, Kerberos authentication will be automatically disabled.
LDAP Server Setup
Install and configure the Active Directory or LDAP server. Consult the LDAP vendor's documentation for instructions.
Create a default user group on Security Analytics with minimal or zero permissions. When a Kerberos user logs in to the appliance for the first time, the user will not be able to access sensitive information. If the user is a legitimate Security Analytics user you can move the user into a group that has suitable permissions.
Security Analytics Setup
1. Select Menu > Settings > Date/Time and select the Use Network Time Protocol (NTP) check box.
2. For Primary NTP, type the FQDN of the LDAP server and click Save.
3. Select Settings > Network. Make a note of the Hostname.
273

Administration and CentralManager Guide SecurityAnalytics 8.1.3
4. On all of the DNS servers that are listed in the Domain Name Servers section, add forward and reverse lookup entries for the Security Analytics appliance hostname: <ip_address> = <hostname>
5. Follow the steps in "Enable LDAP" on page 268 to configure LDAP authentication.
6. For Group DN, verify that nothing is selected.
7. Select the Enable Kerberos check box. The Domain Controller, Realm, and Domain fields should be auto-populated with the LDAP configuration settings
8. Specify the Username and Password to bind the appliance to the Kerberos domain.
9. Click Save.
Single Sign-On Setup
For every device that is to authenticate to the Security Analytics appliance using single sign-on, perform these steps:
1. Verify that the device is in the same Kerberos domain as the Security Analytics appliance.
2. The FQDN of the Security Analytics appliance must be specified as a trusted site, according to browser settings:
n For Firefox®, go to the about:config page and modify the network.negotiate-auth.trusted-uris setting to include the FQDN of the appliance.
n For Internet Explorer, go to Internet Options > Local Intranet, and add the FQDN of the Security Analytics appliance as a local intranet site. (If you are using the Windows short name, you do not need to perform this step.)
3. Configure the browser to negotiate with Kerberos instead of NTLM (NT LAN Manager).
4. Users must navigate to the domain name of the Security Analytics appliance instead of its IP address. This domain name can be the Windows short name or the FQDN. (The FQDN is recommended, because that is the name in the certificate for HTTPS management.)
RADIUS AuthenticationYou can configure Security Analytics to accept RADIUS authentication.
Create a default user group on Security Analytics with minimal or zero permissions. When a Kerberos user logs in to the appliance for the first time, the user will not be able to access sensitive information. If the user is a legitimate Security Analytics user you can move the user into a group that has suitable permissions.
Also see "Using RADIUS and LDAP in Parallel on Security Analytics " on page 278.
1. Select Menu > Settings > Authentication.
2. Select the Enable RADIUS Authentication check box.
274

Administration and CentralManager Guide SecurityAnalytics 8.1.3
3. Fill in the fields as follows:
n Server — IP address or hostname of the RADIUS server. In Security Analytics 8.1.1 you may use IPv6 addresses.
n Port — Port number (default: 1812)
n Shared Secret — Passphrase
n Timeout (Seconds) — Number of seconds before an idle RADIUS session times out
4. Click Save.
Two-Factor AuthenticationTwo-factor authentication (2FA) requires a token in addition to the username and password to access the web interface. The authentication token is created by a TOTP-compatible mobile app such as Symantec VIP or Google Authenticator®.
Do not enable 2FA until after you have verified the following; otherwise, you may be locked out of the web interface*:
n The TOTP app is installed on your smart phone and is working.
n The time on the Security Analytics appliance is correct and coordinated with NTP. Because the 2FA token is valid for only 30 seconds, the appliance will reject a token that appears to be outside the validity timespan.
*Use the scm tally command to restore access.
1. Download the TOTP app and follow the instructions to install the application on your smart phone.
2. On the web interface, select [Account Name] > Preferences.
3. Select the Two-Factor Authenticationcheck box.
4. Enter the secret key to the TOTP app in one of two ways:
n Scan the QR code.
n Type the case-sensitive secret key into the space provided.
5. Click Save. 2FA is now enabled for this user account.
2FA is enabled per user account, not per appliance; therefore, some user accounts on the same appliance can require 2FA to log in while others do not.
275

Administration and CentralManager Guide SecurityAnalytics 8.1.3
2FA Logins
When logging in to the web interface with a 2FA-enabled account, follow these steps:
1. Type the username and password as usual and click Log In.
2. A second login prompt is displayed. Type the authentication token as provided by the TOTP app and click Log In.
The authentication token changes about every 30 seconds, so you must consult the TOTP app for each login instance.
Common Access Card AuthenticationNew in Security Analytics 8.1.1
Certificates and private keys can be stored in multiple locations. On the client, one such location is a Common Access Card (CAC). However, a smart card or reader is not required for SSL mutual authentication, you can install the certificates on your browser and into Security Analytics's truststore.
The following example describes an SSL mutual authentication transaction using a CAC that has been signed with a CA bundle.
1. The user accesses Security Analytics by entering its IP address in a supported browser. Instead of entering credentials in the Security Analytics login screen, the user inserts a CAC into a reader connected to the workstation.
2. Security Analytics presents its certificate to the browser.
276

Administration and CentralManager Guide SecurityAnalytics 8.1.3
3. The browser validates the appliance certificate. This includes the following checks:
n The certificate subject must match the appliance’s hostname.
n The certificate must be issued by a CA listed in the browser’s Trusted Root Certificate store.
4. The browser confirms that the appliance has the certificate's private key by challenging the appliance to sign random data. The browser validates the signature using the appliance's certificate.
5. If appliance authentication succeeds, the browser accesses the client certificate and private key on the CAC. It then presents the certificate to the appliance.
6. The appliance validates the certificate that the browser presents. This includes the following checks:
n The certificate must be issued by a CA included in Security Analytics's truststore.
n The appliance confirms that the browser has the certificate's private key by challenging the browser to sign random data. The appliance validates the signature using the browser’s certificate.
n The certificate must have a valid signature and not be expired.
7. If authentication succeeds, the appliance grants access to the user.
Configure Security Analytics to Authenticate with a CACFollow these steps to configure Security Analytics to authenticate LDAP users with a Common Access Card.
Note: The user accounts (names and passwords) must be previously defined on an external LDAP server.
Step 1: Configure LDAP Authentication
With the LDAP authentication service, users can log on to the Security Analytics appliance using a username/password combination stored on an external LDAP server. Instead of users manually logging in to Security Analytics with these LDAP credentials, they can use a CA-signed CAC onto which the LDAP user information is stored.
Thus, the first step in CAC configuration is to configure Security Analytics to use LDAP authentication. See "LDAP Authentication" on page 267.
Step 2: Configure Client Certificate
Configure the following client certificate settings:
n Require a client certificate to be submitted to the browser when users access the Security Analytics web interface.
n Upload the certificate that validates client certificates. Configure your Client Certificate Authority Bundle with the CA bundle that signed your smart card.
277

Administration and CentralManager Guide SecurityAnalytics 8.1.3
n Decide whether to use Online Certificate Status Protocol (OCSP) to determine whether the certificate has been revoked.
See "Additional Certificate Requirements" on page 295 for details.
Step 3: Enable CAC
The final configuration step is to tell Security Analytics to use the CAC for authentication. Select the Use Certificate / Card for Authentication check box in the LDAP settings. See "CAC Authentication" on page 272 for more information.
Step 4: Log in with CAC
At the Security Analytics login screen, instead of entering your credentials, insert your smart card into a reader connected to your workstation.
Using RADIUS and LDAP in Parallel on Security Analytics New in Security Analytics 8.1.1
Note: A new feature was added in SA 8.1.1 that changes the behavior of authentication when RADIUS and LDAP are both enabled.
Behavior in SA 8.1.1When both RADIUS and LDAP are configured on a Security Analytics appliance, RADIUS is used for credential authentication and LDAP is used for authorization (permissions) of users. A new option, introduced in SA 8.1.1 and 8.0.4, controls how Security Analytics proceeds in case RADIUS authentication fails.
n If the Use Radius for authentication option is disabled, Security Analytics will attempt to use LDAP for authentication if RADIUS authentication fails. If LDAP authentication also fails, Security Analytics will attempt to authenticate the user with the local user database.
n If the Use Radius for authentication option is enabled, only RADIUS is used for authentication. If RADIUS authentication fails, the user cannot log in, even if the user is also defined on the LDAP server or the local user database.
Behavior in SA 8.0-8.3When both RADIUS and LDAP are configured on a Security Analytics appliance:
1. RADIUS authentication is usually tried first.
n If the user account is defined only on the RADIUS server, the login fails.
n RADIUS user accounts must also be defined elsewhere, either in the local user database or on the LDAP server.
2. If RADIUS rejects the account credentials, Security Analytics will attempt LDAP authentication.
278

Administration and CentralManager Guide SecurityAnalytics 8.1.3
Functionality and ProcessIn Security Analytics:
n RADIUS serves one purpose — Authentication, which addresses the question: "Is this username/password tuple valid?"
n LDAP serves two purposes — Authentication and Authorization, which addresses the question: "May this user access the resource?"
n The local user database serves three purposes — Authentication, Authorization, and Accounting, as it records user activity in the log.
Logging in to Security Analytics has a different workflow depending on where the user-account information is defined:
n When a username/password tuple is defined only on the RADIUS server, the user will not be allowed to log in to a RADIUS-configured Security Analytics appliance, even if the correct username and password are given, because RADIUS does not serve the Authorization function. For a RADIUS-defined user to access an appliance, a corresponding user account must also be defined in a system that provides Authorization—the Security Analytics local user database or the LDAP server.
n When a user account is defined only on the LDAP server, the user can to log in even when no local user account has been defined on Security Analytics, because an LDAP user account provides both the Authentication and Authorization functions.
When both RADIUS and LDAP are configured on a Security Analytics appliance, user login attempts may trigger several transactions to both LDAP and RADIUS servers, because Security Analytics needs to resolve both the Authorization and Authentication questions.
Typically, one might first see Authorization-related queries to the LDAP server followed by Authentication-related queries to the RADIUS server, so the question of which authentication protocol is tried first has different answers depending on whether Security Analytics needs Authentication or Authorization information.
LDAP Group InheritanceSymantec Security Analytics supports the inheritance of local Security Analytics group membership based on user groups that are stored in a remote LDAP server.
example
These two LDAP users are members of three LDAP groups, as follows:
n bilbo (adventurer, hobbit)
n ggrey (adventurer, wizard)
In this example, members of the adventurer group will be added to the default user group (user) but only members of the wizard group will inherit admin privileges.
279

Administration and CentralManager Guide SecurityAnalytics 8.1.3
Step 1: Verify the LDAP Schema
Group memberships on the LDAP server must be stored as full distinguished names (DNs), not only as user names, because the pam_ldap module on Security Analytics forms a query filter based on the DN.
Step 2: Map the Group Membership Attribute
Depending on your schema you may need to manually specify the group membership attribute. This attribute is required for all group-membership lookups.
280

Administration and CentralManager Guide SecurityAnalytics 8.1.3
Step 3: Set the Group DN
To enable group permission inheritance, you must specify the Group DN.Each LDAP user in that group will be added to the default Security Analytics user group when the user logs in for the first time. Users who are not in that group cannot log in to Security Analytics.
281
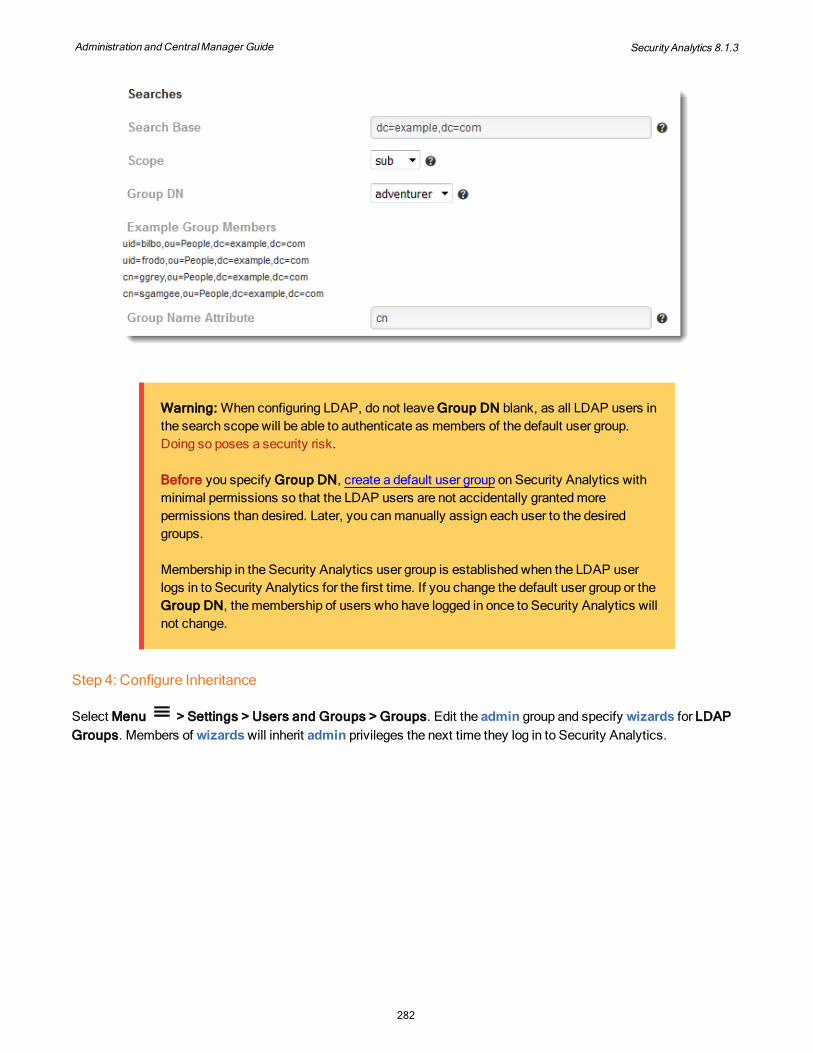
Administration and CentralManager Guide SecurityAnalytics 8.1.3
Warning: When configuring LDAP, do not leave Group DN blank, as all LDAP users in the search scope will be able to authenticate as members of the default user group. Doing so poses a security risk.
Before you specify Group DN, create a default user group on Security Analytics with minimal permissions so that the LDAP users are not accidentally granted more permissions than desired. Later, you can manually assign each user to the desired groups.
Membership in the Security Analytics user group is established when the LDAP user logs in to Security Analytics for the first time. If you change the default user group or the Group DN, the membership of users who have logged in once to Security Analytics will not change.
Step 4: Configure Inheritance
Select Menu > Settings > Users and Groups > Groups. Edit the admin group and specify wizards for LDAP Groups. Members of wizards will inherit admin privileges the next time they log in to Security Analytics.
282

Administration and CentralManager Guide SecurityAnalytics 8.1.3
An LDAP user who is a member of wizards — but is not in the group specified by Group DN — cannot log in.
283
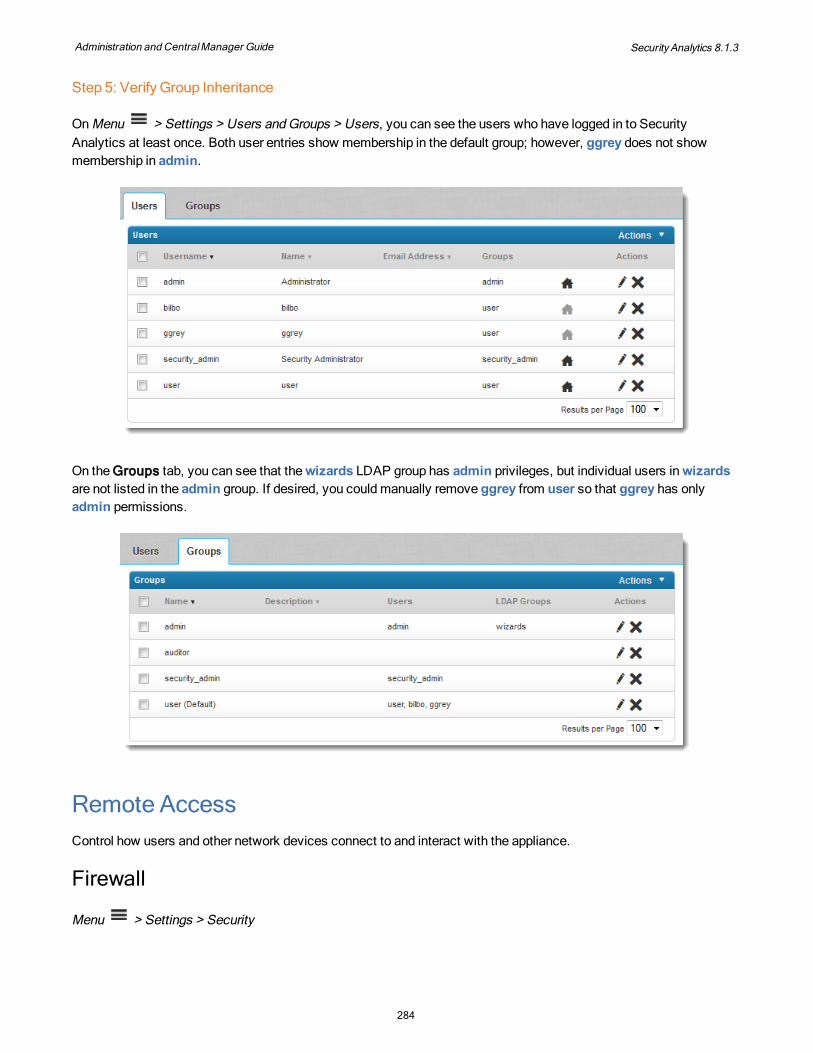
Administration and CentralManager Guide SecurityAnalytics 8.1.3
Step 5: Verify Group Inheritance
On Menu > Settings > Users and Groups > Users, you can see the users who have logged in to Security Analytics at least once. Both user entries show membership in the default group; however, ggrey does not show membership in admin.
On the Groups tab, you can see that the wizards LDAP group has admin privileges, but individual users in wizards are not listed in the admin group. If desired, you could manually remove ggrey from user so that ggrey has only admin permissions.
Remote AccessControl how users and other network devices connect to and interact with the appliance.
Firewall
Menu > Settings > Security
284

Administration and CentralManager Guide SecurityAnalytics 8.1.3
Security Best Practice If you are not using the FTP File Mover, delete the firewall rules that permit ftp-data
through port 20.
n Enable Firewall — Select to enable and view the firewall.
n Configure Firewall — Click to modify the firewall.
o The icmpDROP rules in both the IPv4 and IPv6 firewalls apply to ICMP types 13, 14, and 128. Click
Information to see the string for each rule. These types of rules cannot be edited nor can they be added via the web UI, because the web UI currently does not support all of the needed attributes. Symantec recommends that you not delete these rules.
o The default ACCEPT rule before the last default DROP rule specifies ESTABLISHED,RELATED in the State field to allow incoming traffic on the connections that Security Analytics initiated.
o When enabling and configuring many Security Analytics features, a firewall rule is added automatically; for example, when enabling syslog,
To add a new rule follow these steps:
1. Click New Rule.
All values are case-sensitive.
2. For Interface enter the interface name: bond0, tun+, and lo are some of the acceptable values. Leave blank for ANY.
3. For Protocol, enter the protocol in lower-case: udp, tcp, icmp, ssh. Leave blank for ANY.
4. For Source Address and Port, enter the IP address, IPv4 network in CIDR notation, or MAC address. Leave blank for ANY.
5. For Destination Address and Port, enter the IP address, IPv4 network in CIDR notation, or MAC address. Leave blank for ANY.
6. Optional — For State, specify one of the following connection states: NEW, ESTABLISHED, RELATED, INVALID.
7. For Policy, specify the action to take: ACCEPT, DROP, QUEUE, RETURN, or other valid iptables policy.
8. Optional — For Comment, add a comment in printable, ASCII characters.
9. Click OK. The rule is displayed at the bottom of the list.
10. Optional — Click and drag the rule to its desired position.
285

Administration and CentralManager Guide SecurityAnalytics 8.1.3
The word Modified in the upper-right corner of the interface indicates that neither the new rule nor the rule order have been saved.
11. Optional — Click Revert Changes to return to the last-saved version of the firewall or click Restore Defaults to return to the factory-installed rule set.
12. When you are satisfied with the rule set, scroll to the bottom of the page and click Save.
Web Access
Menu > Settings > Security
These settings affect how users access the appliance via the web interface.
Security Best Practices n Set the Maximum Login Attempts to no more than 3.
n Set the Unsuccessful Login Timeout to at least 1200 seconds.
You can also use the scm tally commands in the CLI for some of these settings. (See scm tally in the Security Analytics 8.1.x Reference Guide on support.symantec.com.)
n Maximum Login Attempts — Specify the number of login failures before an account is disabled. Default: 3
n Unsuccessful Login Timeout (Seconds) — Specify the number of seconds that elapse before a disabled account is automatically enabled. To prevent accounts from being automatically enabled, enter 0 (zero) or leave the field blank. Default: 1200
n Maximum Concurrent Sessions — Specify the number of sessions that can access the appliance at the same time. Default: 10
n Require HTTPS — Select to require that users access the appliance via HTTPS.
o When an account is disabled by failed login attempts, you can re-enable it in one of these ways:
l Wait for the interval in Unsuccessful Login Timeout to expire.
l Access the user account on Settings > Users and Groups and clear the Account Disabled check box.
l With root access on the CLI, run scm tally.
286

Administration and CentralManager Guide SecurityAnalytics 8.1.3
o Users are not notified that their accounts have been disabled by unsuccessful login attempts.
o The root account for the CLI is not disabled after reaching the maximum number of unsuccessful logins.
Web Access Ports
Security Best Practice n To prevent malicious access on ports that aren’t being used, disable unused
ports.
n Disable port 80 by deleting its entry in the firewall tables, as Security Analytics automatically redirects all inbound HTTP requests to HTTPS.
n See "Security Analytics Ports and Protocols" on page 298 in the Security Analytics 8.1.x Administration and Central Manager Guide on techdocs.broadcom.com.
n HTTP Port — Type an integer for the new HTTP port number.
n HTTPS Port — Type an integer for the new HTTPS port number.
BEFORE you change any web-access port number, you must add a corresponding rule to the firewall. If you are locked out, you must edit /etc/sysconfig/httpd and run systemctl restart httpd to regain access to the web UI.
All CMCs and their sensors must use the same port number for HTTPS.
Click Restore Defaults to reset as follows:
n Maximum Login Attempts — 3
n Unsuccessful Login Timeout — 1200
n Maximum Concurrent Sessions — 10
n Require HTTPS — Enabled
n HTTP Port — 80
n HTTPS Port — 443
287

Administration and CentralManager Guide SecurityAnalytics 8.1.3
SSH Access
Menu > Settings > Security
Security Best Practice n Disable root access via SSH.
n If you disable SSH root logins, be sure to review log files for root logins and activity.
n Allow SSH Access — Select to permit access to this appliance via SSH.
n SSH Port — Type an integer for the new SSH port number.
n Restore Defaults — Click to restore the SSH port to 22.
n The timeout value for the web interface also controls the SSH/console timeout .
Also see "SSH Authentication" on page 302 and "Disable SSH Root Logins" on page 301.
Ping (ICMP)
Menu > Settings > Security
Security Best Practice n Do not enable ping response except to test a deployment.
n Enable "ignore broadcast requests."
n Respond to Pings (ICMP) — Select to permit this appliance to respond to ICMP (ping) requests on the management interface (bond0).
Because the capture interfaces do not have an IP stack, they cannot be assigned an IP address and therefore cannot be pinged.
To enable "ignore broadcast requests" follow these steps:
288

Administration and CentralManager Guide SecurityAnalytics 8.1.3
1. Log in to the console as root.
2. Run these commands:
[root@hostname ~]# /sbin/sysctl -w net.ipv4.icmp_echo_ignore_broadcasts=1[root@hostname ~]# /sbin/sysctl -w net.ipv4.route.flush=1[root@hostname ~]# /bin/ed /etc/sysctl.conf << END g/^net\.ipv4\.icmp_echo_ignore_broadcasts.*=/d \$a net.ipv4.icmp_echo_ignore_broadcasts = 1 .wq [root@hostname ~]# END
Web Interface Settings
Menu > Settings > Web Interface
Inactivity Timeout
n Maximum time of inactivity before logout — Select the desired interval. The timeout value for the current browser session is updated immediately. The timeout value for other active browser sessions will not be updated until the page is changed or refreshed.
Security Best Practice Set the inactivity timeout to 10 minutes or less.
HTML Preview
n Enable External HTML Elements Preview — Select to permit the Web page preview function to retrieve external images, style sheets, and scripts from the Internet. When this feature is disabled, you can view only images and CSSs that are already written to the capture drive.
Anonymous Usage Tracking
n Enable Anonymous Usage Tracking — Select to permit your appliance to send the following data to Symantec :
o Randomly unique identifier that is not tied to any known information
o Public IP address of the appliance
o Country and city of the appliance
o Version, build, and model number
o User ID
o Browser type and version
o Time in use
o Pages accessed and actions taken
o Time to generate reports and extractions
o Query attributes used (not values)
o Widgets in use
o Number of indicators, rules, PCAPs, replays, filters
289

Administration and CentralManager Guide SecurityAnalytics 8.1.3
Message of the Day
Add custom text to the system login screen and the CLI.
n Message of the Day — Type the text in the space available:
o Limit of 5000 characters (including formatting).
o The only supported HTML tags are B and U.
Allowed Referrers
n Allowed Referrers — Type the hostname or IP address of a host that is allowed to link back to this appliance.
PasswordsThe passwords to access features on a Symantec Security Analytics appliance are as follows:
n "Local Users" on page 256
n "MD5-Encrypted Password for Bootloader" on page 303
n "SNMP Settings" on page 309
n "Remote Authentication" on page 267
n "Account Settings" on page 265
n "Email Alerts" on page 308
n Root
n "Two-Factor Authentication" on page 275
n "Syslog Settings" on page 311
Security Best Practices n Do not modify password complexity settings except to increase password length.
n Specify different passwords for each user when setting up local user accounts.
n Require that user passwords be regularly changed, using "password aging." 90 days should be the maximum age.
n Notify users 7 days before their passwords expire.
Password-Complexity RulesThe password-complexity rules affect the local and remote users (including the admin account) and root (SSH). To alter the password-complexity rules, follow these steps:
1. Select Menu > Settings > Security and scroll down to Password.
2. Adjust the Length as desired.
3. Select or clear the check boxes to require digits (numerals), other characters (non-alphanumeric), or upper-case letters.
4. Click Restore Defaults to reset as follows:
290

Administration and CentralManager Guide SecurityAnalytics 8.1.3
n Length — 14
n Require Digits — Enabled
n Require Other Characters — Enabled
n Require Uppercase — Enabled
n Require Lowercase — Enabled
Set Notification Interval for Password Expiry 1. Log in to the console as root.
2. Run this command to alert users 7 days before their passwords expire:
[root@hostname ~]# sed -i "s/^PASS_WARN_AGE.*/PASS_WARN_AGE 7/" /etc/login.defs
SSL Certificates and KeysYou may install a certificate for Symantec Security Analytics or require that browsers have a certificate to access the web interface. A self-signed certificate and key are automatically included on the appliance with a new Security Analytics installation.
n Security Analytics 7.3.x and later uses TLS 1.2 only.
n Only HIGH ciphers are enabled by default, for both the web server and clients: HIGH:!MEDIUM:!LOW:!EXP:!3DES:!MD5:!aNULL:!eNULL:!NULL:@STRENGTH
n The following HIGH ciphers are available:
o ECDHE-RSAC-AES-256-GCM-SHA384
o ECDHE-RSA-AES-256-CBC-SHA384
o DHE-RSA-AES-256-GCM-SHA384
o DHE-RSA-AES-256-CBC-SHA256
o RSA-AES-256-GCM-SHA384
o RSA-AES-256-CBC-SHA256
o ECDHE-RSA-AES-128-GCM-SHA256
o ECDHE-RSA-AES-128-CBC-SHA256
o DHE-RSA-AES-128-GCM-SHA256
o DHE-RSA-AES-128-CBC-SHA256
o RSA-AES-128-GCM-SHA256
o RSA-AES-128-CBC-SHA256
n In Security Analytics 7.1.x and earlier, self-signed certificates used the SHA-1 algorithm and 1024-bit keys. A new installation of Security Analytics 8.1.3 comes with SHA-512 and 4096-bit keys.
n Upgrading to version 8.1.3 from 7.1.x or earlier does not overwrite the existing certificate or key. Change the supported client ciphers by editing /etc/environment and rebooting.
291

Administration and CentralManager Guide SecurityAnalytics 8.1.3
Security Best Practices n Create a certificate to secure bond0 using a 2048-bit or stronger RSA keypair and
SHA-256 or stronger encryption algorithm.
n Get a certificate that is signed by a trusted CA.
n Use SSL/TLS certificates.
Install a New Certificate and KeyFollow these steps to replace the existing certificate and key on Security Analytics.
All certificates must be PEM-formatted.
Step 1: Back Up the Current Certificate and Key
Before installing new certificates and keys, Symantec strongly recommends that you create a backup copy of the current certificate and key:
mkdir backup cp /etc/pki/tls/private/localhost.key backup cp /etc/pki/tls/certs/localhost.crt backup
Step 2: Obtain a New Certificate and Key
Use one of these methods to generate the certificate-signing request and its key:
n Using the web UI
n Using the CLI
Step 2a: Using the Web UI
Generate a certificate-signing request from the web UI.
1. On Menu > Settings > Security scroll down to the bottom of the PKI and SSL section.
2. Fill in these fields:
n Country Name — Two-letter country designator (ISO-3166-1 Alpha-2)
n State or Province Name — Spelled-out name of state or province
n Locality Name — City or town
n Organization Name — Company name
292

Administration and CentralManager Guide SecurityAnalytics 8.1.3
n Organizational Unit Name — Division or department
n Common Name — Domain name (CN) of the server
n Email Address — Contact email address
3. Click Download Certificate-Signing Request to save localhost.csr to your workstation. The corresponding key should remain on the appliance.
4. Send localhost.csr to a valid Certificate Authority. When the signed certificate is returned, go to Step 3.
Step 2b: Using the CLI
These commands generate a new key, certificate, and certificate-signing request (CSR; not to be confused with the CSR) on the appliance that will be using the certificate, but they do not overwrite the appliance's current certificate and key.
1. Generate the new key:
openssl genrsa -out newKey.key [4096|2048]
2. Generate a certificate-signing request with that key:openssl req -new -sha[512|256] -key newKey.key -out newCsr.csr
You will be prompted to provide the following information for the distinguished name (DN):
n Two-letter country code
n State or province name
n Locality (city) name
n Organization name
n Organizational unit name
n Your or your server's name (Common Name [CN])
n Email address
3. Generate a temporary self-signed certificate to use until you get the CA-signed certificate: openssl req -x509 -sha[512|256] -days 365 -key newKey.key -in newCsr.csr -out newCert.crt
4. Copy the new key and temporary certificate to the proper locations: /etc/pki/tls/private/localhost.key /etc/pki/tls/certs/localhost.crt
5. Restart the web server to use the new certificate:systemctl restart httpd
6. Export newCsr.csr to your workstation and send it to a CA to be signed.
Because of the security risk, Symantec strongly warns against copying a key off the device that will be using the key and its certificate.
293

Administration and CentralManager Guide SecurityAnalytics 8.1.3
Enable theSSL Issuer report on Settings > Metadata > Encryption and create an indicator with All Valid Root CAs favorite.json ( in the in the Security Analytics 8.1.3 WebGuide on support.symantec.com), which contains most valid root CAs.
Step 3: Install the CA-Signed Certificate
Use one of these methods to install the certificate:
n Using the Web UI
n Using the CLI
Step 3a: Using the Web UI
1. Select Menu > Settings > Security and scroll down to PKI and SSL.
2. The temporary self-signed certificate for the appliance is displayed along with the key that you used to generate both the self-signed certificate and the CSR.
localhost.localdomain and localhost.key are always the names of the certificate and key that are currently installed.
3. Click edit for Appliance Certificate to upload the CA-signed certificate.
4. Click Save to apply the changes and restart the web server.
5. Go to "Additional Certificate Requirements" on the next page.
Step 3b: Using the CLI
Follow these steps to install the certificate from the Security Analytics root directory.
If you use this method to install the certificate, you bypass audit and record-keeping controls — which might be in violation of your organization's security policy.
294

Administration and CentralManager Guide SecurityAnalytics 8.1.3
1. Copy the CA-signed certificate to the root directory.
2. Overwrite the current certificate with the new certificate:
mv certificate.crt /etc/pki/tls/certs/localhost.crt
3. Restart the web server:
systemctl restart httpd
If you upload a key or certificate using the web UI and click Save, the internal HTTP server always restarts. If the key and certificate do not match, the web UI displays an error message; however, if you attempt to restart the HTTP server manually before both the key and its corresponding certificate have been installed, the web server will not restart.
Additional Certificate RequirementsAs required by your organization's security policy, implement the following security measures that are available on Settings > Security > PKI and SSL.
Require that Browsers Present a Certificate to the Appliance
If you want to require a valid client certificate to be presented when a user tries to access the Security Analytics web interface, you enable the Require Client Certificate to Access Web Interface check box and configure the other options in the Client PKI Settings section. This is required when configuring Security Analytics for authentication via a Common Access Card (CAC). See "Common Access Card Authentication" on page 276 for more information.
When you enable this feature, all web browsers that do not have a valid certificate from the Issuing Authority — including your workstation browser — will be prevented from accessing the web interface.
1. Select the Require Client Certificate to Access Web Interface check box. Several additional fields are displayed.
2. Upload the certificate that validates client certificates to Client Certificate Authority Bundle.
3. Decide whether to use Online Certificate Status Protocol (OCSP) to determine whether the certificate has been revoked. For OCSP for Client Revocation, choose one of the following:
Off — Don't do an OCSP revocation check.
On — Do an OCSP revocation check with the URL contained within the client certificate.
Override — Do an OCSP revocation check with the URL provided in the OCSP Responder URL field.
295

Administration and CentralManager Guide SecurityAnalytics 8.1.3
Troubleshooting
If there is a problem with the certificates, you will not be able to log in through the browser. If you want to undo the requirement that a valid certificate be presented to Security Analytics in order for the requester to receive the authentication page, you can make the following changes.
Note: You will need root access to the console to perform these steps.
$> vim /etc/sysconfig/httpd
Change:
export SSL_VERIFY_REQUIRE="SSLVerifyClient require"
to:
export SSL_VERIFY_REQUIRE="" $> service httpd restart
Certificate Revocation Checks for Symantec and Security Analytics Services
Menu > Settings > Security > PKI and SSL > Perform certificate revocation check for Symantec
The certificate-revocation check is disabled by default in version 7.3.1 and later. Specify the URL for the certificate revocation list in the space provided. Security Analytics retrieves updates on the 1st and 16th of every month at 23:00. The services that are affected by this option are:
n Symantec Web Reputation Service
n Symantec File Reputation Service
n Syslog over TLS or TLS-FIPS
Require Client Certificate for Login Correlation
Do the following:
1. If you have deployed the Login Correlation Service, select the Require Client Certificate for Login Correlation Service check box. (See "Login Correlation" on page 222.) Additional fields are displayed.
2. Upload the certificate that validates client certificates to Client Certificate Authority Bundle.
Authenticate to an Internet Proxy
If your appliance connects to the Internet via an authenticated proxy, and the proxy has a certificate handshake for SSL traffic, add the additional CA certificate bundle using any of these methods:
296

Administration and CentralManager Guide SecurityAnalytics 8.1.3
Using the Web Interface
1. Select Menu > Settings > Security and go to the PKI and SSL section.
2. For Additional Certificate Authority Bundle, click Browse to upload the certificate.
3. Click Save to restart the web server.
Using the CLI
1. Copy the bundle to /etc/pki/ca-trust/source/anchors/ and then run
update-ca-trust
2. Reboot to apply changes.
Certificates Between CMCs and SensorsIf you have a CMC environment, you may set up one of the following scenarios:
n All sensors (clients) present a certificate to the CMCs (servers).
n All CMCs (clients) present a certificate to the sensors (servers).
n Both the CMCs and the sensors present certificates to each other. (Perform both server and client steps on all appliances.)
Server Role
On the appliance that requires the certificate (server role), do the following:
1. Select Require Client Certificate to Access Web Interface. Additional fields are displayed.
When you enable this feature, all web browsers that do not have a valid certificate from the Issuing Authority — including your workstation browser — will be prevented from accessing the web interface.
2. Upload the certificate that validates client certificates to Client Certificate Authority Bundle.
3. Click Save to restart the web server.
Client Role
1. On the appliance that is required to present a certificate (client role), do one of the following:
n Select the Use Appliance Certificate as Client Certificate check box to use the appliance certificate for the client role. This option is valid only if the appliance certificate can function in both server and
297

Administration and CentralManager Guide SecurityAnalytics 8.1.3
client roles.
When you select the Use Appliance Certificate as Client Certificate check box and click Save, the web interface will be refreshed and the check box will be cleared. The client table will display the Common Name and Fingerprint information from the appliance.
n Under Upload Separate Client Certificate and Key, do the following:
2. Click edit for Client Certificate to upload the PEM-formatted client certificate.
3. Click edit for Client Certificate Key to upload the certificate's key.
4. Click Save to restart the web server.
Security Analytics Ports and ProtocolsConsult this table to configure your firewalls, according to the services that you have activated on your Symantec Security Analytics appliance. Configure the Security Analytics firewall on Settings > Security.
Also see:
n Required Ports, Protocols, and Services for Symantec Enterprise Security Products
n "Data Enrichment Resources in Dark Sites" on page 191
During the licensing and license-update procedures, the appliance communicates with license.soleranetworks.com over TCP 443. (See "Licensing" on page 318.)
Inbound Connections to Security AnalyticsService URL/IP Ports Comment
Central Management VPN
bond0 of CMC TCP/UDP 1194 or as specified
All sensors must be able to access the CMC's bond0 over port 1194.
298

Administration and CentralManager Guide SecurityAnalytics 8.1.3
Service URL/IP Ports Comment
FTP File Mover [as needed] TCP/UDP 20TCP/UDP 21
Use port 21 for active mode. If you are not using FTP File Mover, you should delete the internal firewall rules that permit ftp-data through port 20.
HTTP [none] TCP/UDP 80 All HTTP requests are automatically redirected to HTTPS. Symantec recommends that you delete the internal firewall rules that permit http through port 80.
HTTPS 1 [none] TCP/UDP 443 Change the default on Settings > Security. All CMCs and their sensors must use the same HTTPS port.
SSH 1 [none] TCP 22 The port can be changed on Settings > Security.
AWS Traffic Mirroring via VXLAN Tunnel
[none] UDP 4789 Used in AWS deployments for secure transmission of capture data.
1 Service is always used by Security Analytics.
Outbound Connections from Security AnalyticsService URL/IP Ports Comment
Active Directory® [none] TCP/UDP 3268
For LDAP authentication
Endpoint Detection and Response (ATP) Manager 3
[as needed] TCP 443
Central Management VPN
bond0 of CMC TCP/UDP 1194 or as specified
All sensors must be able to access the CMC's bond0 over port 1194.
ClamAV® 1 *.clamav.net TCP 80 Requires only HTTP access to update the signature database. Analysis is performed locally on the appliance.
Cuckoo 3 [as needed] TCP/UDP 8090
DeepSight 1,3 sso.trm.symantec.com TCP 443
DNS 2 [as needed] TCP/UDP 53
Domain Age Reporter 1,4
[same as WHOIS] [same as WHOIS]
The WHOIS settings also permit Domain Age Reporter traffic.
File Reputation Service 1,3
*.es.bluecoat.com185.2.196.2048.28.16.233199.116.169.204103.246.38.204
TCP 8443 The URL for the File Reputation Service will usually be frs.es.bluecoat.com; Symantec recommends that you create a rule for all of the listed IP addresses.
Future Engineering Services resources will also be provided from the *.es.bluecoat.com domain.
299

Administration and CentralManager Guide SecurityAnalytics 8.1.3
Service URL/IP Ports Comment
FireEye® 3 [as needed] [as needed] AX-series is supported.
Google Safe Browsing®
sb-ssl.google.com TCP 443 Uses Internet connection from workstation.
Google® Search google.com TCP 443 Uses Internet connection from workstation.
HTTP 2 [none] TCP/UDP 80 Change the default on Settings > Security.
HTTPS 2 [none] TCP/UDP 443 Change the default on Settings > Security. All CMCs and their sensors must use the same HTTPS port.
Intelligence Services 1,3
— — See File Reputation Service and Web Reputation Service
ICAP 3 [as needed] TCP 1344 (plaintext)
Security Analytics does not support port 11344 for Content Analysis integration.
ICDx [as needed] TCP 5672
Lastline® 1,3 analysis.lastline.com TCP 443
LDAP authentication [none] TCP/UDP 389
Live-feed indicators rules.emergingthreats.net:80mirror1.malwaredomains.com:80*.abuse.ch:443 isc.sans.edu:443
TCP/UDP 80TCP 443
Login Correlation Service
[none] TCP 8843 This port is used to communicate between the LCS and the agent's UI application. The Security Analytics firewall has a rule to accept this traffic.
Malware Analysis 3 [as needed] TCP/UDP 80, 443
MATI deepsightapi.symantec.com/v1 TCP 443
NTP [as needed] UDP 123
OCSP requests ocsp.entrust.net TCP 80 Various Security Analytics services use OCSP for certificate-chain validation.
RADIUS [as needed] UDP 1812, 1813
RobTex® 1 robtex.com TCP 80 Uses Internet connection from workstation.
SANS ISC® 1 isc.sans.edu TCP 443 Host and IP queries are transmitted over SSL.
SEP [SEP Manager hostname/IP] TCP 8446
SMTP [as needed] TCP 25
300

Administration and CentralManager Guide SecurityAnalytics 8.1.3
Service URL/IP Ports Comment
SNMP [as needed] TCP 161 (polling)TCP/UDP 162 (trap)
SORBS DNSBL® 1 dnsbl.sorbs.net UDP 53
Splunk Phantom [as needed] TCP 443
syslog [as needed] UDP 514
ThreatExplorer1,3 threatexplorer.symantec.com TCP 443 Service must be enabled on Settings > Data Enrichment.
VirusTotal® 1,3 www.virustotal.com TCP 443
Web Reputation Service 1,3
sp.cwfservice.net TCP 443
Web Reputation Service local database updates 1,3
list.bluecoat.com TCP 443 Used by the Web Reputation Service and ADM
WHOIS 1,4 [as needed] TCP 43 The WHOIS lookup service will query different WHOIS servers based on the registry associated with the top-level domain of the target. Consult this authoritative list of WHOIS servers.
1 Service requires internet access.2 Service is always used by Security Analytics.3 Licensing for this service is the responsibility of the user.4 Service cannot be used behind a proxy.
Disable SSH Root Logins
Security Best Practice n Disable root access via SSH.
n If you disable SSH root logins, be sure to review log files for root logins and activity.
This procedure disables root access over SSH connections but preserves root access via console.
1. Edit the sshd_config file:
[root@hostname ~]# vi /etc/ssh/sshd_config
301

Administration and CentralManager Guide SecurityAnalytics 8.1.3
2. Uncomment the line #PermitRootLogin yes and set the value to no:
PermitRootLogin no
3. Save and exit sshd_config.
4. Restart the SSH daemon to apply the changes:
[root@hostname ~]# systemctl restart sshd
To disable the root account entirely, append /settings/initial_config to the appliance's IP address or hostname in the address bar of the browser. Under Root Password, select Lock Root Account.
Warning: You cannot re-enable the root account unless you have console access to the appliance, and then you will have to contact Symantec Support for assistance.
SSH AuthenticationAlso see "Disable SSH Root Logins" on the previous page and "SSH Access" on page 288.
Security Analytics does not support versions of PuTTY earlier than 0.67.
To set up SSH public-key authentication between a Security Analytics appliance and a client, follow these steps:
1. Generate the SSH key on the client.
2. As root or admin, create the .ssh directory on the Security Analytics appliance. Note the leading dot in the directory name.
mkdir .ssh
3. Open the authorized_keys file for editing. You cannot cd into this directory; you must directly open the file in an editor.
vi .ssh/authorized_keys
4. Paste the public key from the client.
5. Save and exit the file.
Using ssh-copy-id to modify .ssh/authorized_keys is not supported.
Generate an SSH Key for Data Enrichment ProvidersFollow these instructions to set up SSH authentication between the data-enrichment ("tonic") user on the Security Analytics appliance and a remote server, such as the SCP File Mover integration provider, and all external providers
302

Administration and CentralManager Guide SecurityAnalytics 8.1.3
while in FIPS mode.
1. Log on to the Security Analytics appliance as the superuser (root).
2. Create the SSH key directory for the tonic user:
[root@hostname ~] mkdir -p ~tonic/.ssh
3. Create an SSH key in the directory. When prompted for a passphrase, press Enter twice. (Do not create a passphrase.)
[root@hostname ~] cd ~tonic/.ssh [root@hostname .ssh] ssh-keygen -t rsa -f id_rsa
4. You do not need to save the fingerprint or randomart image. Verify that id_rsa and id_rsa.pub were created.
[root@hostname .ssh] ll
5. Establish correct ownership and permissions for the key directory and files. Note the leading dot on the directory name.
[root@hostname .ssh] cd .. [root@hostname tonic] chmod 700 .ssh [root@hostname tonic] chown -R tonic:tonic .ssh
6. As the tonic user, copy the public key from the appliance to the remote user account that will be receiving artifacts. If the remote system runs Linux, use this command:
[root@hostname tonic] sudo -u tonic ssh-copy-id -i ~tonic/.ssh/id_rsa.pub <remote_user>@<remote_host>
7. Verify that the remote host key file (known_hosts) was created in tonic's SSH directory:
[root@hostname tonic] ls ~tonic/.ssh
8. Verify the key setup by attempting a manual file transfer as the tonic user; for example:
[root@hostname tonic] echo "test" > /tmp/test [root@hostname tonic] chmod a+r /tmp/test [root@hostname tonic] sudo -u tonic scp -B /tmp/test <remote_user>@<remote_host>:<remote_dir>
MD5-Encrypted Password for BootloaderThis page applies only to Dell-based hardware and virtual machines.
Security Best Practice Password-protect the bootloader.
1. Use the grub2-setpassword utility:
[root@hostname ~]# grub2-setpassword
303

Administration and CentralManager Guide SecurityAnalytics 8.1.3
Enter password: <grub_password>Confirm password: <grub_password>
Follow best key-maintenance practices by manually recording this password and keeping a copy in a secure location that is separate from the appliance.
2. When attempting to edit the grub menu the credentials are root and the grub password. Do not use the root system password here.
Enter Username:rootEnter Password:<grub_password>
Federal Information Processing StandardsOn 7 Feb 2017, Symantec Security Analytics 7.2.3 completed FIPS 140-2 Level 2 Functional Testing on Symantec S500 hardware. You can view the FIPS 140-2 Non-Proprietary Security Policy document at https://www.symantec.com/docs/DOC11425.
Entering FIPS Mode
Entering FIPS mode is a destructive process. Many services such as remote notification will have to be reconfigured.
Prior to entering FIPS mode, verify that your appliance's system clock is accurate and that NTP is enabled.
To enter FIPS mode:
1. Go to Menu > Settings > Security and scroll to the bottom of the page.
2. Select Toggle FIPS mode and click Save. The appliance reboots.
3. During this reboot, the appliance undergoes the following changes:
n All configuration files are archived.
n All TLS and SSH keys are zeroized and reset.
304

Administration and CentralManager Guide SecurityAnalytics 8.1.3
n User passwords are reset to the default (Solera).
n Enhanced random number generator requirements increase the boot time by about 1 minute.
If any FIPS-mode conversions are not successful, the appliance will halt in an error state; no input or output is permitted, and the process of entering FIPS mode will be reversed.
4. While in FIPS mode the following conditions are true:
n Because all TLS keys were zeroized and reset, all certificates, keys and certificate authority bundles must be re-uploaded to the appliance.
n All remote-notification methods require mutual authentication.
n Booting directly from a USB is disabled.
n Unauthorized or unvalidated algorithms such as MD5 cannot be used.
n The root account is disabled. (Many functions have been transferred to the admin account.)
n RPM and YUM are disabled.
n System software cannot be upgraded.
Exiting FIPS Mode
Exiting FIPS mode is a destructive process. Many services such as remote notification will have to be reconfigured.
To exit FIPS mode:
1. Go to Menu > Settings > Security and scroll to the bottom of the page.
2. Clear Toggle FIPS mode and click Save. The appliance reboots.
3. During this reboot, the appliance undergoes the following changes:
n All configuration files are archived.
n All TLS and SSH keys are zeroized and reset.
n User passwords are reset to the default (Solera).
305

Administration and CentralManager Guide SecurityAnalytics 8.1.3
System MaintenanceLogging and Communication 306
Job Queue and System Alerts 314
Software Upgrades 315
Upgrading from a TAR File 317
Licensing 318
Network Settings 319
System Date and Time 320
Statistics 321
Drive-Space Management 324
Reboot or Shut Down 328
Troubleshooting 329
Logging and CommunicationSymantec Security Analytics communication consists of logging, alerts, SNMP, and "Remote Notifications" on page 245.
Security Best Practice For highest security when sending the audit log data, make sure to use the following
settings when configuring the servers on Menu > Settings > Communication > Server Settings:
n Email—Enable Use STARTTLS. This setting upgrades an insecure connection to a secure connection using SSL or TLS. It does not encrypt the email content.
n SNMP—Select the Enable Authentication check box for Inform and/or Trap servers to enable SNMPv3.
n Syslog—Send encrypted syslog messages over TLS or TLS-FIPS.
LoggingFor each event, the logs record the date and time of the event as well as the priority and the category.
306

Administration and CentralManager Guide SecurityAnalytics 8.1.3
You can also use the dslogdump command in the CLI for these settings. (More information in the Security Analytics 8.1.x Reference Guide on support.symantec.com.)
Audit Log
Menu > Settings > Audit Log
n Click Download Log to download the audit log as comma-delimited file.
Security Best Practice To securely download the CSV log file, verify that you are logged into the web UI over
HTTPS.
n Use the advanced filter to search the logs by priority, category, or event.
To specify which event categories to display in the audit log, go to Settings > Communication > Advanced and select the Local check box for the category.
307

Administration and CentralManager Guide SecurityAnalytics 8.1.3
Event Categories
n Alert Events — Alerts cleared
n Anomaly Events — Anomaly detected (See "Anomaly Notification Format" on page 105.)
n Capture Events — Stop or start capture; add, modify, or remove capture filters; PCAP import started and stopped; mount points added, modified, or deleted; interfaces aggregated or separated
n Enrichment Events — Modifications on the Settings > Data Enrichment page, such as providers activated or deactivated; providers added, modified, or deleted; manual Web Reputation Service updates and settings changes, IP or hostname exclusion lists, file-type filter modifications
n Hardware Events — Power supply status, chassis fan status, disk status
n Indexing Events — Reindexing and reprocessing jobs created, stopped, or completed
n Indicator Events — Indicators created, modified, or deleted
n Miscellaneous — Modifications to the Settings > Security, Settings > System, Settings > Communication, and Settings > Central Management pages
n Playback Events — Playback started or stopped
n Report Events — Reports created, stopped, viewed, or deleted; extractions created, stopped, or viewed; Capture > Summary page viewed, scheduled reports created, modified, or deleted; communication templates created, modified, or deleted; PDF or CSV report generated or downloaded; report PCAP downloaded
n Rule Events — Rules activated, created, modified, or deleted
n System Events — Insufficient disk space, program segfaults, changes to Settings > Date/Time and Settings > Network pages, Malware Analysis appliance health
n Unclassified — Currently no messages
n User Events — Users and user groups created, modified, or deleted; user login success or failure, user logout
System Logs
From the CLI, you can access two additional logs:
n /var/log/audit/audit.log — User-initiated events written by auditd
n /var/log/messages — System events from all components
Email Alerts
You can also use the dslc command in the CLI for many of these settings. (More information in the Security Analytics 8.1.x Reference Guide on support.symantec.com.)
Security Analytics can send email alerts to any standard email address, either directly or through an SMTP server gateway. Configuring the email settings will automatically send outbound emails for log entries to one or more email addresses. You can specify any email address you prefer in the From field.
308

Administration and CentralManager Guide SecurityAnalytics 8.1.3
Security Analytics uses the sendmail application and must therefore have Internet access to send a message to an external email address. You can also configure the appliance to point to an internal SMTP server; however, that SMTP server must be set up to relay email from the Security Analytics appliance.
1. Select Menu > Settings > Communication > Server Settings.
2. For To, type at least one valid email address. Separate multiple email addresses with a comma.
3. For From, type the email address to be displayed in the From field. This field is required if you plan to run scheduled reports or the Risk and Visibility Report. (See "Scheduled Reports" on page 143 and "Risk and Visibility Report " on page 140.)
4. For SMTP Server and SMTP Port, type the server IP address or hostname and its port number.
5. Does the SMTP server require authentication?
Yes — For Username and Password, type the credentials for SMTP server access.
No — Select the No authentication required check box.
6. Select the Use STARTTLS check box if the SMTP server requires it.
7. For Default Email Address, type the email address that will be used whenever no email address is specified for an Alert. (See "Alert Rule" on page 233.)
8. Click the Advanced tab.
9. Under Remote Notifications, select the Email check box for the desired event categories and click Save.
SNMP Settings
You can also use the dslc command in the CLI for many of these settings. (More information in the Security Analytics 8.1.x Reference Guide on support.symantec.com.)
Security Best Practice Enable SNMPv3 to prevent non-authorized users from monitoring the appliance.
309

Administration and CentralManager Guide SecurityAnalytics 8.1.3
By default, the appliance will respond to incoming public queries from external SNMP devices. Security Analytics can be configured to send SNMP traps and inform messages to external SNMP servers. SNMP traps are error messages that do not require acknowledgment of receipt; SNMP informs require that the receiving server send back an acknowledgment.
n You can specify the same server to receive both trap and inform messages.
n Security Analytics supports only SHA for authentication and AES for privacy.
Any special character — including a space — that is entered in these SNMP fields will be converted to an underscore (_). The exception is the @ character, which will be left as-is.
1. Select Menu > Settings > Communication > Server Settings and scroll down to SNMP Settings.
2. Under Polling, configure these settings:
n Optional — Select Enable Polling.
n Enter the read-only community name in the space provided, or accept the default (public).
n Enter the read-only username in the space provided, or accept the default (public).
o New in Security Analytics 8.1.1 Add a second read-only username.
n Optional — Select Enable Authentication.
o Specify the authentication and privacy-encryption passwords.
o New in Security Analytics 8.1.1 Add a second authentication and privacy-encryption password.
3. Under Trap, configure these settings:
n Specify the name for the trap community.
n Specify the inform and trap server settings.
n Optional — Select Enable Authentication for a server.
o Specify the read-only username and the authentication and privacy-encryption passwords.
4. Optional — Select Enable Authtrap.
5. Click Save.
6. Click the Advanced tab.
7. Under Remote Notifications, enable the SNMP check box for the desired event categories and click Save.
310

Administration and CentralManager Guide SecurityAnalytics 8.1.3
Syslog SettingsSyslog records information about the operation of a computer or computer-related device. Syslog messages can be sent to an external syslog server.
You can also use the dslc command in the CLI for many of these settings. (More information in the Security Analytics 8.1.x Reference Guide on support.symantec.com.)
1. Select Menu > Settings > Communication > Server Settings and scroll down to Syslog Settings.
2. Optional — If multiple syslog messages are issued simultaneously, select the Enable Coalescing check box to group the messages before they are sent. This setting applies to all syslog servers.
3. For Syslog facility, select one of the following:
Kernel User Mail Daemon Auth syslog LPR
News UUCP Cron AuthPriv FTP Local Use 0–7
4. For Syslog Servers, type the hostname or IP address and port number.
5. Select one of four protocols to use for syslog:
n TCP
n UDP
n TLS
n TLS-FIPS
Syslog uses the certificate-revocation list that is configured on Settings > Security > PKI and SSL. Security Analytics updates the list on the 1st and 16th of every month at 23:00.
6. Click add a new host for multiple syslog servers to use the same facility.
To set up a many-to-many relationship among syslog servers and facilities, use dslc add syslog server <server> <port> <protocol> <facility>. Each server entry will be visible on the web interface but the facility that is associated with each entry will not be visible at this time. Run dslc show syslog to see the facilities that are associated with each server. (More information in the Security Analytics 8.1.x Reference Guide on support.symantec.com.)
7. Click Save.
311

Administration and CentralManager Guide SecurityAnalytics 8.1.3
8. Click the Advanced tab.
9. Under Remote Notifications, enable the Remote Syslog check box for the desired event categories and click Save.
Splunk PhantomIf you have deployed a Splunk Phantom® (formerly: Phantom Cyber) server you can send it flow metadata when traffic matches a rule.
1. Select Menu > Settings > Communication > Server Settings and scroll down to Splunk Phantom Settings.
2. Input the Server hostname and its API Key.
3. Go to "Remote Notifications" on page 245 for instructions on setting up the remote notification in a rule. You can see the output that is sent to the Splunk Phantom server under "Default Template Output" on page 246.
Communication Settings
Import Settings
Use the dslc import command in the CLI for these same settings. (More information in the Security Analytics 8.1.x Reference Guide on support.symantec.com.)
Select an existing communication configuration file and apply those settings to your Security Analytics appliance.
Importing settings is valid only for transferring configurations between the same models of hardware; for example, from one Dell R730xd to another Dell R730xd.
1. Select Menu > Settings > Communication > Advanced.
2. Under Import/Export Communication Settings, click Browse.
3. Locate and select a settings file, e.g., logging_config.dat, and click Open.
4. The New Settings File box shows the path to the selected file.
5. Click Import Communication Settings.
Your existing settings will immediately be overwritten, and — unless you had previously exported them — will not be recoverable.
312

Administration and CentralManager Guide SecurityAnalytics 8.1.3
Export Settings
You can export your current communication settings to view them or to import to an identical hardware model of appliance.
Do not modify the text file in an attempt to modify the settings.
1. Select Menu > Settings > Communication > Advanced.
2. Under Import/Export Communication Settings, click Export Settings. This saves your settings file as logging_config.dat.
Export Log Entries
Click Download to save the log as a CSV file.
Security Best Practice To securely download the CSV log file, verify that you are logged into the web UI over
HTTPS.
MIB FilesSecurity Analytics supports remote logging via SNMP and syslog. To use SNMP logging, you must export the MIB and install it on your SNMP system.
Do not modify the MIB text in an attempt to modify the settings.
1. Select Menu > Settings > Communication > Advanced.
2. Under Download SNMP MIB click Download MIB to save mibfiles.zip in your local downloads directory. This archive contains these files:
n SOLERA-AGENT-MIB.mib
n SOLERA-SMI-MIB.mib
313

Administration and CentralManager Guide SecurityAnalytics 8.1.3
Resetting System Logs
Once the log files have been cleared, the information that was in them cannot be recovered.
1. Select Menu > Settings > Communication > Advanced.
2. Under Reset Log, click Clear Log Entries. This deletes all audit log entries.
Use the dslc factory command in the CLI to restore the logging system to its default settings. (More information in the Security Analytics 8.1.x Reference Guide on support.symantec.com.)
Job Queue and System AlertsIn the upper-right corner of the web UI you can see the job queue and the system alerts.
Job Queue
n Click the job-queue icon to see various jobs that have been queued. These jobs will be available in the job queue:
o Risk and Visibility Report
o PDF reports
o Offline PCAP downloads
n After you download the PDF or PCAP, the item is no longer available in the job queue.
n Use the "Advanced Filters" on page 113 to narrow your search of jobs. See "Job Queue" on page 120 for a list of filter terms.
System Alerts
View system alerts (also called "notifications") by clicking the alert icon .
314

Administration and CentralManager Guide SecurityAnalytics 8.1.3
Click a notification to go to the corresponding audit-log message. Once you click-through to the message, the notification should be cleared.
File-System NotificationsNotifications are generated when these file systems reach 80% of capacity: / (root)
/home/apache
/tmp
/ds
/var
See "Drive-Space Management" on page 324 for instructions on clearing disk space.
System-Critical NotificationsWhen the file systems are nearly full or when other system-critical conditions occur a prominent alert is displayed along the top of the web UI. To clear such an alert, you must contact Symantec Support.
Software UpgradesTo upgrade Symantec Security Analytics, you must have a link to an upgrade server, and then you must download the new image from the upgrade server, initiate the upgrade, and reboot.
Also see "Upgrading from a TAR File" on page 317.
Prior to upgrading, remove all USB drives from the Security Analytics appliance.
315

Administration and CentralManager Guide SecurityAnalytics 8.1.3
Add an Upgrade ServerDuring the licensing procedure for the appliance, the upgrade server upgrade.soleranetworks.com should have been added to the Upgrade Servers list. If there is no entry in the Upgrade Servers list, follow these steps to add the upgrade server manually.
1. Select Menu > Settings > Upgrade. The Upgrade Servers page is displayed.
2. Click New. The Add Upgrade Server dialog box is displayed.
3. For Protocol, select https.
n When you select https you can also enable the Validate SSL/TLS Certificate check box. The certificate validation takes place as follows:
n upgrade.soleranetworks.com — If the Perform certificate revocation check for Symantec check box is enabled on Settings > Security > PKI and SSL, the server's certificate is validated against the appliance's local Certificate Authority bundle, and an OCSP verification is performed for all issuing authorities. If the Perform certificate revocation check for Symantec check box is disabled, the OCSP verification is not performed.
n Custom upgrade server over HTTPS — The remote certificate is validated against the appliance's local Certificate Authority bundle. (There is no OCSP or CRL check.)
n Custom upgrade server over HTTP — No certificate validation is performed; however, the upgrade file is encrypted with a private key, so the file can be decrypted only with the appliance's public key.
4. To add the upgrade server, follow these steps:
n For Host, type upgrade.soleranetworks.com
n For Path, type /upgrades/
n Under Login Information, type the credentials to access the upgrade server. The username and password are your license key.
5. To add a different upgrade server, specify the hostname and file path for the manifest.xml file on that server. Add login credentials, as necessary.
6. Click Save. The server is added to the list of available upgrade servers.
316

Administration and CentralManager Guide SecurityAnalytics 8.1.3
Upgrade Security Analytics
1. Select Menu > Settings > Upgrade. The Upgrade Servers page is displayed.
2. Recommended — Click Upgrade Precheck to see disk usage. You should have about 8 GB of disk space available on /home.
n Manage Extractions — Click to go to the Extraction Status page, where you can select which extractions to delete.
n Delete Extractions — Click to immediately delete all extractions, both saved and in cache.
3. For the desired upgrade server, click Upgrade from Server .
4. Select the upgrade version and click Download Upgrade.
5. When the download is complete, click Initiate Upgrade. The new image is downloaded, verified, and unpacked.
6. When prompted click Reboot. The system restarts, and the new image is installed.
The system will continue to operate normally until you click Reboot. During the reboot/upgrade, all capture and logging are suspended. The upgrade may take as long as 30 to 45 minutes, depending on your configuration. When the upgrade is complete, the system will automatically resume capture and logging.
7. When you log in again, verify that you are using the upgraded version by placing your cursor over the Symantec logo.
Upgrading from a TAR FileFollow these instructions to upgrade a Security Analytics appliance from the CLI, using a TAR file. This method is the
equivalent of upgrading the appliance on Menu > Settings > Upgrade in the web UI.
1. Obtain the TAR from Symantec Support or upgrade.soleranetworks.com/upgrades. The username and password are your license key.
2. On the appliance go to the /ds/upgrade directory and delete any files that are there.
3. Verify that the directory /home/apache/tmp/upgrade_iso.d exists and that it is empty. If it does not exist, create it.
4. Transfer the TAR to /home using SCP or the equivalent.
5. In /home run the upgrade script.
/etc/utils/verify-reboot-upgrade.sh atpsa-8.1.3-99999-x86_64-DVD.tar
317

Administration and CentralManager Guide SecurityAnalytics 8.1.3
6. When the script has successfully run, /home/apache/tmp/upgrade_iso.d should be empty, and you should see the following files and directory in /ds/upgrade:
/imagesatpsa-8.1.3-99999-x86_64-DVD.isoks.cfgmetapocrypha.patchmonit.state
7. Reboot.
LicensingDuring initial configuration, you are presented with the license dialog, where you must install a license before you can continue. (See "Install the License" on page 18.) To update or change a license, follow these steps:
1. Contact Symantec Support to purchase the renewal or upgrade. You will use your original license key for this procedure.
To see your serial number, select Settings > About. To see your license key, select Settings > Upgrade. The characters up until the bang (!) are your license key.
2. Select About and then click License Details.
3. Does your appliance have access to the Internet (license.soleranetworks.com; port 443)?
318

Administration and CentralManager Guide SecurityAnalytics 8.1.3
Yes — Under Retrieve License, input the License Key and click Send Request.
n If applicable, select the desired license type.
n The appliance sends the license key and the license seed file to the license server, which generates the appropriate license file (license.tgz) and returns it to the appliance, which automatically reboots.
No — Click Download DS Seed to download the seed file (dsseed.tgz) to your workstation.
n On a workstation that has Internet access, go to license.soleranetworks.com.
n Type your license key, upload dsseed.tgz, and click Update.
n If applicable, select the desired license type and click Update.
n Save the license file (license.tgz) to your workstation.
n Return to the License Details dialog.
n Click Browse and select license.tgz.
n The license is uploaded and the appliance automatically reboots.
Network Settings
Menu > Settings > Network
n Fully Qualified Hostname — The name typed here is displayed as part of the prompt when anyone logs in to the command line on this appliance. Failure to use an FQDN here will cause the system name to appear as "localhost" in log messages as well as cause other unexpected behaviors.
o To specify multiple hostnames for this appliance select Settings > Web Interface and add the names under Allowed Hostnames.
n Use DHCP — If you select this check box, it is recommended that you use the DHCP reservation feature of your DHCP server to statically map the MAC address of the management interface to an IP address. DHCP is not supported for multiple management interfaces.
n Use Multiple Management Interfaces — Select this check box and then select the check box for one other physical interface that you want to bind to the management interface, bond0. By default eth0 is bound to bond0. Any other interface that you select as a management interface will be unavailable for capture.
n IP Address, Netmask, Default Gateway — Enter these values in dotted-decimal format.
n IPv6 Address — Input the appliance's address.
n IPv6 Secondaries — Separate each address with a single space.
319

Administration and CentralManager Guide SecurityAnalytics 8.1.3
n IPv6 Dynamic Address and IPv6 Dynamic Secondaries — Automatically assigned by the IPv6 system.
n HTTP Proxy — If your appliance accesses the Internet through a proxy, type the IP address of the proxy in the following format: <IP>:<port>
o If your appliance accesses the Internet through an authenticated proxy, edit /etc/environment as follows:
http_proxy="http://<username>:<password>@<IPv4>:<port>"https_proxy="http://<username>:<password>@<IPv4>:<port>"
or
http_proxy="https://<username>:<password>@[<IPv6>]:<port>" https_proxy="https://<username>:<password>@[<IPv6>]:<port>"
Also see "Authenticate to an Internet Proxy" on page 296.
n No Proxy — Enter a comma-delimited list of IP addresses or domains that will not use the HTTP proxy to access the Internet: .maa.ourdomain.com,192.168.2.55, 2508:34ed:af:2d1::3d33
The value hostname is always present in the No Proxy field, even though it is not visible.
n Secondary Network Address — Specify the IP information for the failover interface for bond0. Only IPv4 addresses are supported in this section.
n Primary DNS, Secondary DNS, Tertiary DNS — Specify up to three DNS servers. If you intend to add this appliance to your domain name service, or if you will be specifying hostnames for other devices in this appliance's settings, then you must specify at least one DNS server.
n When you change the hostname, HTTP proxy settings (including No Proxy), or time zone, the appliance will automatically reboot.
n When you change the IP address you may need to wait for ~10 seconds before attempting to connect to the new IP address.
System Date and TimeTime is an important parameter for PCAP file generation, playback, and certificates; therefore, it is recommended that you use NTP to synchronize time between the management workstation and the appliance whenever possible.
1. Select Menu > Settings > Date/Time.
2. For Date, type the date as MM/DD/YYYY.
3. For Time, type the time as hh:ii:ss.
320

Administration and CentralManager Guide SecurityAnalytics 8.1.3
4. For Time Zone, select the appropriate time zone for your location.
You must manually input the time and date even if you intend to enable NTP.
5. Optional — Select the Use Network Time Protocol (NTP) check box. You may use the default NTP servers or specify others.
6. Optional — To enable NTP encryption:
n For each NTP server:
o Select the Use Autokey check box to enable encryption.
o Click Browse to upload the group key that was generated by the NTP server. When the key has been accepted, the Current Group field will be populated with the following: ntpkey_iff_[<ntp_server_name>|<IP>]
n Optional — Type the Group Key Password if a password was generated for the group key. This password must be the same for all of the servers' group keys.
n Select the Generate NTP Host Keys check box to generate a certificate and a host key for the appliance. These files will expire after one year.
n When you change the name of an NTP server, you must upload a new group key.
n When you change the hostname of the appliance on the Network Settings page, you must generate new NTP host keys.
7. Click Save. If you changed the time zone, the appliance will automatically reboot.
Statistics
Network SystemThe Network System page displays network interface statistics for SymantecSecurity Analytics. Select a specific network interface to view the statistics for that interface. Select Automatically Refresh Statistics to continuously update the displayed information.
Some of the "total" statistics will be reset after an upgrade or a reboot.
321

Administration and CentralManager Guide SecurityAnalytics 8.1.3
Statistic Description
Current Packets Captured per Second
The number of packets per second currently being captured. This is a snapshot statistic.
Current Packets Filtered per Second
The number of packets per second currently being filtered. This is a snapshot statistic.
Current Bytes Captured per Second
The current number of bytes per second currently being captured. This is a snapshot statistic.
Max Packets Captured per Second
The maximum number of packets received in a second.
Max Packets Filtered per Second
The maximum number of packets filtered in a second.
Max Bytes Captured per Second
The maximum number of bytes received in a second.
Total Packets Captured The total number of packets captured. Depending on the storage size, these packets may have already been overwritten.
Total Bytes Captured The total number of bytes captured. Depending on the storage size, these packets may have already been overwritten.
Total Packets Filtered The total number of filtered packets matching the filter.
Total Bytes Filtered The total number of bytes recorded from the filtered packets received.
Slot Allocation Misses The number of packets dropped due to no available memory slots.
Space Map Errors The number of packets dropped due to no available allocation for network interface.
DSR Read Misses The Disk Space Record was not found.
Active Slot The memory slot currently receiving packets.
Address of Active Slot The memory address of the active slot.
Packets Captured in Active Slot
The number of packets stored in the current memory slot.
Ring Buffers in Active Slot The total number of ring buffers (on the network capture card) used to capture packets.
Bytes Captured in Active Slot The total number of bytes stored in the active memory slot.
Metadata in Active Slot (Bytes) The total metadata bytes in the active memory slot.
Size on DiskThe Size on Disk page displays a pie chart that depicts the total bytes of storage used by capture operations on each Ethernet interface. This data is a representation of disk space used to store the data and not necessarily the exact amount of data stored. For example, a pie slice showing 25 GB may be a combination of 23 GB of actual payload data and 2 GB of overhead. Place the cursor over a segment of the graphic to see how large the segment is.
322

Administration and CentralManager Guide SecurityAnalytics 8.1.3
Storage SystemThe Storage System page displays a list of storage device statistics. Select Automatically Refresh Statistics to continuously update the displayed information.
Disk Space Record ID
Statistic Description
Disk Space Type The identified purpose of the storage.
Disk Space Active Identifies if the storage space is in use.
Disk Space Date/Time Time stamp of the disk space creation.
Member Count The number of logical storage devices.
Disk ID The kernel reported drive type (e.g., 20 = SATA).
Partition ID The name of the logical disk partition.
Slot Size (bytes) The number of bytes allocated for each slot.
Total Slots The total number of memory slots available for storage.
Cluster Size (bytes) The cluster size in bytes.
Total Clusters The total number of clusters available for storage.
Total 4K Blocks The total number of 4K blocks available for storage.
Disk Record Blocks The total number of disk record blocks.
Logical Data Area Start The start address for the logical data area.
Start of Slot Data The start address of slot data.
Space Table Size (bytes) The total size of the space table, in bytes.
Recycle Count The number of times the capture drive has filled to capacity.
Active Slot Chains
For each interface, the Storage System page shows the following data:
Statistic Description
Start Cluster Address of the start cluster
End Cluster Address of the end cluster
Start Time Start time and date
End Time End time and date
Slot Count Number of slots occupied
Elements Number of elements
Size (bytes) Bytes in the chain
Active Slot Active slot number
323

Administration and CentralManager Guide SecurityAnalytics 8.1.3
Statistic Description
Active Slot Address
Address of active slot
Packets Number of packets in the chain
Ring Buffers Number of ring buffers
Total Bytes Total bytes in the chain
Total Metadata Bytes
Total bytes that contain metadata
Total CapturedThe Total Captured page displays a pie chart that depicts the total bytes captured by each Ethernet interface. Place your cursor over a segment to display the actual amount captured by that interface.
Total FilteredThe Total Bytes page displays a pie chart depicts the total bytes for each filtered interface. Place your cursor over a segment to display the amount of filtered data captured by that interface.
Drive-Space ManagementThis page describes how Symantec Security Analytics organizes data so that you can delete the appropriate data sets if you need to free up space for new data.
Capture and Index DrivesThe data on both the capture and index drives is automatically overwritten according to the method described in "Data Overwriting" on page 370. To purge all data from the capture and index drives, run dszap from the command line.
You cannot retrieve data that you erase with the dszap command. Go to dszap to see exactly which types of data are deleted.
System DriveSecurity Analytics saves the following data on the system drive, so the data is not affected by the overwrite cycles on the capture and index drives:
n Indicators and rules†
n Logs
n Capture summary graph data
n Real-time extractions
n Capture filters†
n Statistics
n Saved extractions†
n Packet analysis data
324

Administration and CentralManager Guide SecurityAnalytics 8.1.3
†Save operation initiated by user
Delete Controls for Data Types
Some data is deleted with a special button; other data is deleted through settings and other controls. This table shows how to delete each data type.
Data Type UI CLI
Indicators Analyze > Indicators > n/a
Rules Analyze > Rules > n/a
Saved Reports Analyze > Report Status > List >
About > Data-Retention Settings
Included in dszap deletion
Saved Extractions Analyze > Extraction Status >
About > Data-Retention Settings
Included in dszap deletion
Audit Logs Settings > Communication > Advanced > Clear Log Entries
dslogdump --clear
Statistics n/a dsstats --reset
Packet Analyzer n/a rm -fr /home/apache/hammerhead
Captured Packets and Metadata
n/a dszap
Capture Summary Drive Data
About > Data-Retention Settings
>
Delete ALL Capture Summary Data
325
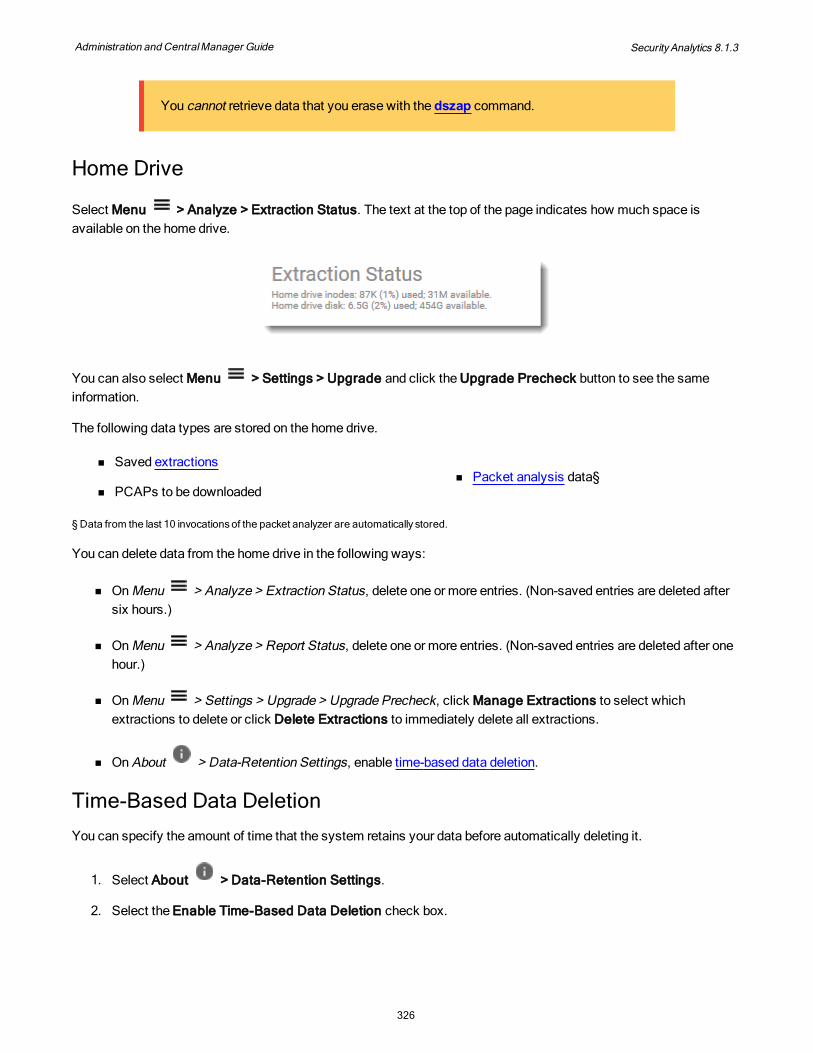
Administration and CentralManager Guide SecurityAnalytics 8.1.3
You cannot retrieve data that you erase with the dszap command.
Home Drive
Select Menu > Analyze > Extraction Status. The text at the top of the page indicates how much space is available on the home drive.
You can also select Menu > Settings > Upgrade and click the Upgrade Precheck button to see the same information.
The following data types are stored on the home drive.
n Saved extractions
n PCAPs to be downloaded n Packet analysis data§
§ Data from the last 10 invocations of the packet analyzer are automatically stored.
You can delete data from the home drive in the following ways:
n On Menu > Analyze > Extraction Status, delete one or more entries. (Non-saved entries are deleted after six hours.)
n On Menu > Analyze > Report Status, delete one or more entries. (Non-saved entries are deleted after one hour.)
n On Menu > Settings > Upgrade > Upgrade Precheck, click Manage Extractions to select which extractions to delete or click Delete Extractions to immediately delete all extractions.
n On About > Data-Retention Settings, enable time-based data deletion.
Time-Based Data DeletionYou can specify the amount of time that the system retains your data before automatically deleting it.
1. Select About > Data-Retention Settings.
2. Select the Enable Time-Based Data Deletion check box.
326

Administration and CentralManager Guide SecurityAnalytics 8.1.3
3. For Delete data older than, specify the number of days and hours to keep capture and metadata before deletion.
4. Optional — Select Delete Saved Reports and Artifacts.
5. Click Save.
Data-retention rules do not affect captured packets or indexed metadata; instead, the saved reports and artifacts that are derived from them are deleted.
If you have time-based data deletion enabled for saved reports and extractions, then the following behaviors may occur:
1 A saved item that straddles the deletion time will display the data that is still present but not the data that has been deleted.
327

Administration and CentralManager Guide SecurityAnalytics 8.1.3
2 A saved extraction with a start and end time that is after deletion will continue to appear in the Saved Extractions list but with Time Deletion in the Status column. When you attempt to view the saved extraction, you will be prompted to delete the item from the list.
3 A saved item that is being viewed during the deletion operation will be visible until the data is deleted. A message will then be displayed to inform the user that the data has been deleted.
Reboot or Shut Down
Never power off a Symantec Security Analytics appliance manually.
From the Web Interface
1. Select Menu > Settings > System.
2. Do one of the following:
n Under Reboot Appliance, click Reboot.
n Under Shut Down Appliance, click Shut Down. The appliance immediately shuts down. You must have physical access to the appliance to reboot it.
3. If you are unsuccessful and you have physical access to the appliance, press Ctrl+Alt+Delete on the console keyboard to initiate a clean system restart, then power down the appliance using the power button on the appliance — after the system POST (power-on self-test) but before system begins to boot.
From the CLI 1. Open an SSH session and navigate to the management interface's IP address.
2. Log in using an account with administrator or root privileges.
3. Type the command shutdown -r and press Enter. The appliance will shut down and then reboot itself. You should then be able to log in normally.
328

Administration and CentralManager Guide SecurityAnalytics 8.1.3
Using the IPMI Interface 1. Connect to the IP address of the IPMI port from a web browser.
If Security Analytics is installed on a Dell® server, consult Dell iDRAC user documentation to obtain this same functionality.
2. Click Remote Control.
3. Click the Remote Control tab and then click Launch Console to open a hardware-level console connection to the appliance. (Java® software is required for this operation.)
4. To remotely power on, power down, or reset the appliance, click the Power Control button and select the desired option.
Selecting any of the following IPMI menu options — Power Off Server – Immediate, Reset Server, or Power Cycle Server — will not perform a graceful shutdown of the appliance. Select one of these options only if you are unable to power down the appliance using the interfaces (web or CLI).
TroubleshootingUse these resources to address any problems that may arise.
Search the Knowledge Base n https://support.broadcom.com/home-search-
results.html?segment=SE&prodName=Security%20Analytics&cFacet=knowledge_base&q=*
Contact SupportYour serial number is visible in About.
329

Administration and CentralManager Guide SecurityAnalytics 8.1.3
Note: Symantec support is now handled through the Broadcom support ecosystem. For more information on that change, refer to this article: https://www.broadcom.com/support/symantec/getting-started.
n How to contact support, open tickets, and search the Broadcom Knowledgebase: https://knowledge.broadcom.com/external/article?articleId=163980.
n Broadcom support portal: https://support.broadcom.com/security
n Security Analytics Documentation: https://techdocs.broadcom.com/content/broadcom/techdocs/us/en/symantec-security-software/web-and-network-security/security-analytics/8-1.html
n Documentation Feedback: [email protected]
Submit a Support CaseFor many problems you should download the customer service report (CSR) and attach it to your case. The CSR contains multiple log files and other diagnostic output.
1. Select Menu > Settings > System.
2. Click Download CSR and save csr-report-<x>.tar.bz2 to your desktop. It will take several minutes to generate the file. Alternatively, run csr.sh.
3. Log in to https://support.broadcom.com/security.
4. Select Case Management.
5. Follow the prompts to create a case. Attach the CSR to the case.
Consult Help Topics n "Troubleshooting LDAP" on page 272
o "Using RADIUS and LDAP in Parallel on Security Analytics " on page 278
n "Troubleshooting Symantec Intelligence Services" on page 195
n Troubleshooting the Virtual Appliance Installation
n "Populating the Reports" on page 379
n Tap Placement and Capture Optimization Best Practices
n "FRS Prefilter Process" on page 392
n "Data Enrichment Process" on page 389
330

Administration and CentralManager Guide SecurityAnalytics 8.1.3
Introduction to the Central Manager Console
Security Best Practice n Update the CMC VPN key to a 2048-bit RSA keypair. If you are upgrading to
version 7.3.x or later from version 7.1.x or earlier, you must recreate the CMC VPN; all new connections between 7.3.x or later CMCs and their sensors use a 2048-bit RSA keypair.
n Provide a password when downloading the authorization key.
(missing or bad snippet)
The Symantec Security Analytics CMC is a dedicated appliance that is licensed as a CMC. With the CMC, you can manage multiple sensors (formerly "managed appliances") and analyze data from the sensors. Specifically, the CMC provides:
n An aggregated view of data across multiple sensors
n An interface for sensor management
n Centralized sensor software upgrades
This illustration shows one possible configuration: three sensors being managed by one CMC. Notice that all connections between the sensors and the CMC are conducted over VPN connections. The browser for the CMC’s web interface uses an HTTPS connection.
Each link between a sensor and the CMC has its own VPN connection.
331

Administration and CentralManager Guide SecurityAnalytics 8.1.3
n Because each of these connections is a separate tunnel, no sensor can "see" or communicate with another sensor through the VPN.
n The VPN can cross network boundaries.
n CMC-to-sensor traffic that is captured by Security Analytics is classified as udp > openvpn or tcp > openvpn in the Tunneling application group.
CMC Initial SettingsFollow these steps when installing a new CMC.
1. Complete the steps to configure a standalone appliance. configure a standalone appliance.
Before you create the VPN network, verify that the system timethe system time for the CMC is correct. Symantec recommends that you enable NTP on all CMCs and their sensors.
2. The Central Management Settings page should be the next display on the CMC interface, after the Initial
Settings page. If you are not on this page, select Menu > Settings > Central Management > Settings.
3. Select TCP or UDP as the VPN connection protocol.
4. Select IPV4 or IPV6 for Network Type. The IPV6 option is available only if the CMC has an IPv6 address for bond0, the management interface. You cannot set up both IPv4 and IPv6 subnets on the same CMC; for a mixed environment, Symantec recommends an IPv4 network.
5. Specify the following:
n IPv4 Network
o Subnet — Specify the IP addresses to be used for the VPN connections between the sensors and the CMC. The default is 10.8.0.0/16. This subnet must be different from any other subnet on your network.
o Netmask — Specify the netmask for the VPN subnet. The address space should be large enough to provide four IP addresses for each sensor that the CMC controls.
o Port — Specify the port for the VPN connection on the sensors: Default is 1194. It is strongly recommended that you not use ports 22, 80, or 443, because they are reserved for other applications and protocols.
n IPv6 Network
o IPv6 Unique Local Addresses — Specify a subnet for the Unique Local IPv6 Addresses (ULAs). This non-routable address should be unique on your network. Symantec recommends
332

Administration and CentralManager Guide SecurityAnalytics 8.1.3
that you not change the default (fdf9:568f:54b9::/64) unless it conflicts with the ULA for another CMC.
o Port — Specify the port for the VPN connection on the sensors: Default is 1194. It is strongly recommended that you not use ports 22, 80, or 443, because they are reserved for other applications and protocols.
n If you have more than one CMC on your network, the VPN subnets must be unique for each CMC.
n The CMC is always xx.xx.xx.1 on an IPv4 VPN subnet, and it assigns addresses to the sensors automatically: xx.xx.xx.2–254. For IPv6 VPNs, the CMC's address is the subnet designation and then it assigns addresses xxxx:xxxx:xxxx::1000 through xxxx:xxxx:xxxx::N to the sensors.
n Your organization's firewalls and routers must permit the traffic between the CMC and the sensors that you want to manage through the CMC. Verify that the VPN, port, and protocol settings (including HTTPS) permit the connections.
6. Click Save. Registration and configuration may take several minutes, depending on your network conditions. The VPN network settings are being established during this time.
Connect Your First Sensor to the CMCThis page explains how to connect one sensor to the Symantec Security Analytics CMC and to grant yourself (the Administrator on the CMC) access to the sensor. You should have already completed the "CMC Initial Settings" on the previous page.
Generate the Authorization Key for the Sensor 1. On the CMC, select CMC > Dashboard.
2. Click Manage Sensors.
3. Click Tools > New.
4. Type a unique, descriptive name for the sensor.
n The sensor's hostname and IP address do not appear on the CMC dashboard, so the sensor name should be as specific as possible.
n In the sensor selector, only the first 15–20 characters of the sensor name are visible; you may want to put the more distinguishing part of the name first.
5. For now, leave the Authorizations, Remote Groups, and Labels fields blank.
6. For Mssfix specify the maximum size for a UDP packet from this sensor. Default: 1400.
7. Click Save. A one-time field is displayed above the Sensors table.
8. Click Download Key.
333

Administration and CentralManager Guide SecurityAnalytics 8.1.3
9. Optional — Provide a password for Encrypt with Password and click Save to save the authorization key file as <sensor_name>_auth_key.tar.gz.gpg.
n To download the authorization key file at a later time, you can return to the
Manage Sensors page and click Download for the sensor.
n If you are using the Safari browser on a Macintosh workstation, Safari will unzip the TGZ file when you download it. You must re-compress the file for it to be valid.
Link the Sensor to the CMC
1. Log in directly to the sensor with administrator credentials and select Menu > Settings > Central Management.
2. Click New.
3. For Authorization Key File click Browse.
4. Locate the authorization key file for this sensor (<sensor_name>_auth_key.tar.gz[.gpg]) and click Open.
5. Enter the password for the file, if any.
6. For Central Manager Host, type the IP address for the CMC that generated the key. Use the primary IP address for the CMC's management port (bond0) — IPv4 for an IPv4 VPN or IPv6 for an IPv6 VPN. Do not use the CMC's VPN address nor its hostname. Do not use the CMC's secondary address.
To connect a sensor to a CMC over an IPv6 VPN, bond0 on the sensor must have an IPv6 address and IPv6 gateway.
7. Click Save. When the authorization is complete, an entry for the CMC appears in the Central Manager Settings list.
8. On the CMC, go to the dashboard.
9. The sensor appears in the Other Sensors list.
If you cannot see the sensor: Verify with your network administrators that corporate firewalls permit the sensors to reach the CMC's bond0 over port 1194. Ensure that the CMC and the sensor are using the same port for HTTPS.
334

Administration and CentralManager Guide SecurityAnalytics 8.1.3
Security Best Practice Destroy the authorization key file after you have used it to connect the sensor to the
Central Manager.
(missing or bad snippet)
Grant Yourself Access to the Sensor
1. On the CMC, select Menu > Settings > Users and Groups and click the Remote Groups tab.
2. Verify that the admin (Default) remote group is present.
3. Click the Edit icon for the admin remote group; under Group Members, type adm and select admin when it is displayed. Click Save.
4. On the CMC, select Menu > Settings > Central Management and click the Sensors tab.
5. The Sensors list displays the following information:
ID Sensor ID, as assigned by the CMC. If you delete a sensor and then re-add it, the CMC will assign it a new ID.
Name Name of the sensor, as created on the CMC
Host IP address of the sensor on the VPN network
Authorized Users Users who are authorized to access the sensor through the CMC, according to their remote-group permissions. Users in this field have access to the sensor even when the other remote-group members do not.
Authorized Remote Groups
User groups that are authorized to access the sensor through the CMC.
Labels Optional, user-defined tags to use while selecting multiple sensors.
Model Hardware type
335

Administration and CentralManager Guide SecurityAnalytics 8.1.3
Version Current software version of the sensor
Actions Controls to perform the following tasks:
Download the sensor's authorization key
Edit the sensor entry
Delete the sensor entry
Upgrade the software on the sensor
6. Click Edit for the sensor and do one or both of the following:
n For Authorizations, type adm and then select admin when it is displayed. This setting provides the admin account with admin-level access to the sensor without giving it to other users who are members of the admin remote group.
n For Remote Groups, type adm and then select admin when it is displayed. This setting provides admin-level access to the sensor to all members of the remote group.
On the CMC, the groups grant access to the CMC itself, whereas the remote groups grant access to the sensors through the CMC.
n Optional — For Labels, type a new label name and press Enter or type an existing name and select it. You can add as many labels as you need to organize your sensors for selection.
7. Click Save and return to the dashboard. The sensor should be in the Your Sensors list. You can click the sensor icon to access it or select it from the sensor selector (CMC button).
Disconnect Sensors from a CMCTo disconnect sensors from a CMC, you have these options:
n Interrupt the connection
n Delete the connection
Interrupt the Connection
1. On the CMC, click CMC to open the sensor selector.
2. Click to remove the sensor from the Selected column and click Apply.
336

Administration and CentralManager Guide SecurityAnalytics 8.1.3
Delete the Connection
Method 1
1. Log on directly to the sensor.
2. Select Menu > Settings > Central Management.
3. For the CMC, click to remove it.
When you delete the CMC's entry on the sensor, the sensor's entry in the CMC's Sensors table is not deleted. To reconnect to that CMC, you can repeat the connection process with the original authorization key.
4. On the CMC, select Menu > Settings > Central Management > Sensors.
5. Click to remove the sensor's entry. You cannot undo this action.
Method 2
1. On the CMC, select Menu > Settings > Central Management > Settings.
2. Click Reset Settings to reset the communication settings to default values.
When you click Reset Settings, you de-authorize all currently authorized sensors, delete all connections to them, and remove their entries from the Sensors table. To reconnect the sensors, you must create new sensor entries, download new authorization keys, and create new CMC entries on each sensor.
Manage One Sensor with Multiple CMCsYou may set up a many-to-one relationship among multiple CMCs and one sensor as well as multiple CMCs with multiple sensors.
1. Verify that each CMC uses a different VPN subnet. It is possible for a sensor to connect to one CMC over an IPv4 subnet and to another over an IPv6 subnet.
2. On each CMC that will manage the sensor, generate a key for the sensor.
3. Add each authorization key file to the sensor on Menu > Settings > Central Manager.
337

Administration and CentralManager Guide SecurityAnalytics 8.1.3
One sensor managed by three CMCs
When multiple CMCs manage one or more sensors, some CMC functions become unstable. Follow these guidelines to prevent unexpected behavior or data loss:
n Do not attempt to push-upgrade the same sensor from different CMCs at the same time.
n Do not use a CMC to create non-shared indicators or rules on the sensors.
User Accounts and Groups on the CMCAs with standalone appliances, access to a Symantec Security Analytics CMC is granted by membership in a group. To these groups, you can assign permissions at a granular level—any user in the group has those permissions on the appliance.
Likewise, users who access a sensor through the CMC must be assigned to a group that specifies which permissions the user has on the sensor. On the CMC, these are called "Remote Groups."
For instructions on assigning local permissions to groups — including LDAP groups — consult User Accounts and Groups User Accounts and Groups for standalone appliances.
Sensor AccessUsers cannot access a sensor until they are assigned permissions for that sensor. There are two methods for granting sensor-access privileges to a user:
n Authorizations — Individual access to the sensor, according to the user's remote-group permissions
n Remote Groups — Provides RBAC for groups of users
You may use one or both of these methods, that is, a user may be present in both the Authorizations field and in a remote group that is present in the Remote Groups field.
338
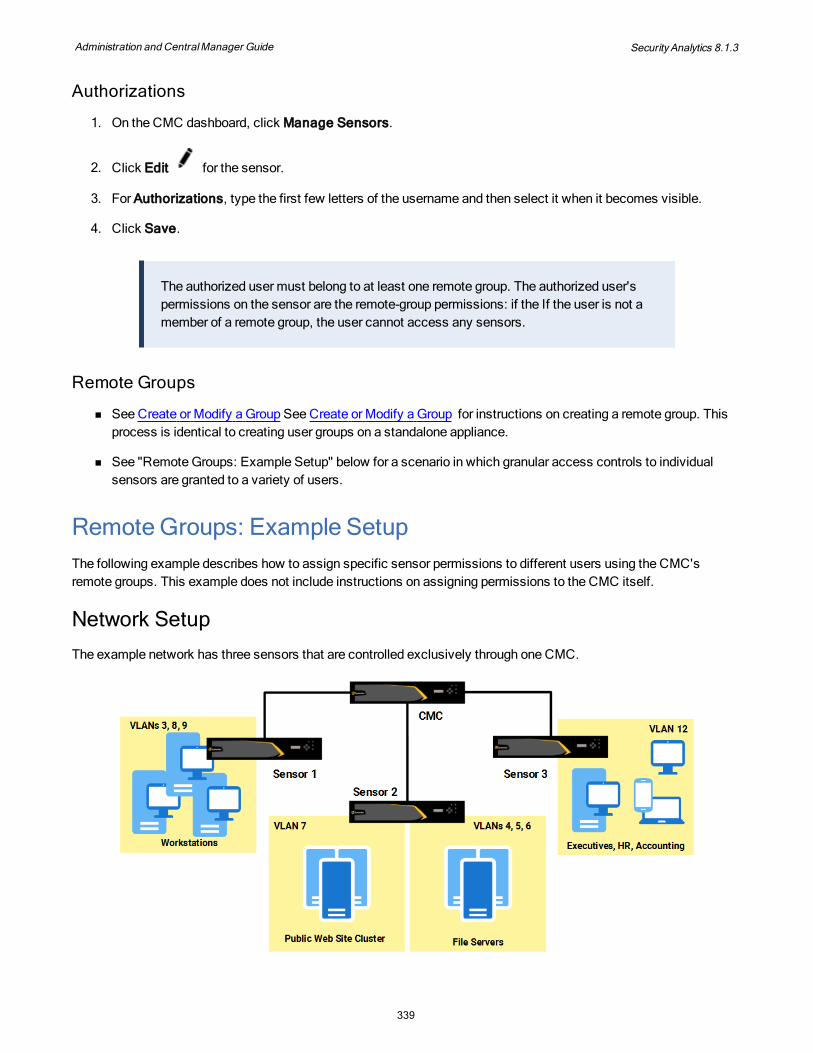
Administration and CentralManager Guide SecurityAnalytics 8.1.3
Authorizations
1. On the CMC dashboard, click Manage Sensors.
2. Click Edit for the sensor.
3. For Authorizations, type the first few letters of the username and then select it when it becomes visible.
4. Click Save.
The authorized user must belong to at least one remote group. The authorized user's permissions on the sensor are the remote-group permissions: if the If the user is not a member of a remote group, the user cannot access any sensors.
Remote Groups
n See Create or Modify a Group See Create or Modify a Group for instructions on creating a remote group. This process is identical to creating user groups on a standalone appliance.
n See "Remote Groups: Example Setup" below for a scenario in which granular access controls to individual sensors are granted to a variety of users.
Remote Groups: Example SetupThe following example describes how to assign specific sensor permissions to different users using the CMC's remote groups. This example does not include instructions on assigning permissions to the CMC itself.
Network SetupThe example network has three sensors that are controlled exclusively through one CMC.
339

Administration and CentralManager Guide SecurityAnalytics 8.1.3
n Sensor 1 monitors general workstation traffic in the organization.
n Sensor 2 monitors traffic that includes a public-facing web site, hosted on a cluster of HTTP servers that are on VLAN 7. Other file servers are on different VLANs that the sensor also monitors.
n Sensor 3 monitors traffic that includes VLAN 12, which contains executive workstations, devices, and servers that contain sensitive corporate, accounting, and human-resources data.
RequirementsThe organization needs the following sensor functions to be performed by different users:
n Full administrative access to modify all settings and accounts
n Log auditing to check for conformity to network policy as well as the archiving of logs
o Only one user is to be entrusted with auditing the traffic on VLAN 12
n Security enforcement, which ensures that all devices and user accounts conform to security policies
n General analysis of all LAN traffic to check for malware, breaches, and usage violations
o Only one user is to be entrusted with analyzing the traffic on VLAN 12
n Monitoring and analysis of all incoming traffic to the public web site, but no access to other LAN traffic
DesignThe requirements are best fulfilled with five remote groups:
n admin — All permissions. This remote group is already present on the CMC.
n auditor — View and download the audit log. This remote group is already present on the CMC.
n security_admin — Modify all sensor-access settings such as authentication, certificates, and the firewall. This remote group is already present on the CMC.
n Analyst — View and modify all Analyze pages, import PCAPs from local and remote sources, view and download audit logs, view the capture summary graph, modify data-enrichment settings.
n Website — View and modify all Analyze pages, import PCAPs from local sources, only view web-related traffic on VLAN 7.
The groups will be assigned permissions on the sensors as follows:
n Sensor 1 — admin, Analyst, Auditor, security_admin
n Sensor 2 — admin, Auditor, security_admin, Website
n Sensor 3 — admin, security_admin
In this example, eight users have access to the sensors:
340

Administration and CentralManager Guide SecurityAnalytics 8.1.3
n admin — Senior system administrator
n Analyzer1 — Senior analyst
n Analyzer2 — Associate analyst
n Auditor1 — Senior auditor
n Auditor2 — Associate auditor
n Watchman — Security compliance administrator
n WebMaster1 — Web site administrator
n WebMaster2 — Web site administrator
The order in which the remote groups, users, and sensor permissions are created is flexible. A simple sequence is presented here:
1. "Create the Remote Groups" below
2. "Create the Users" on the next page
3. "Assign Sensor Authorizations" on page 344 (The example assumes that the sensors are already connected to the CMC.)
Create the Remote GroupsCreate the remote groups shown in the table (admin, security_admin, and auditor are included by default):
Remote Group
Permissions
Analyst All Analyze pages, local and remote PCAP import, view and download audit log, view capture summary, modify data-enrichment settings
Website All Analyze pages, PCAP import, web-related traffic only, traffic on VLAN 7 only
1. Log on to the CMC with admin permissions.
2. Select Menu > Settings > Users and Groups. Click the Remote Groups tab.
3. Select Tools > New.
4. For Name, type Analyst.
5. For Description, type All Analyze pages, capture summary, PCAP import, data enrichment.
6. Select the following check boxes:
n Settings > Data Enrichment
n Capture > Capture Summary
341

Administration and CentralManager Guide SecurityAnalytics 8.1.3
n Capture > Import PCAP
n Analyze
7. For now, leave the Data Access Control and Group Members sections blank and click Save.
8. Select Tools > New.
9. For Name, type Website.
10. For Description, type application_group=web, vlan_id!=4,5,6; all Analyze pages, view and download audit log, local PCAP import
11. Select the following check boxes
n Logs
n Capture > Import PCAP
n Analyze
12. Under Data Access Control do the following:
n Type application_group=web and press Enter.
n Type the following and press Enter:
o vlan_id!=4
o vlan_id!=5
o vlan_id!=6
n Optional — Type vlan_id=7 and press Enter.
13. Click Save.
Create the UsersCreate the users and assign them their remote groups, as shown in this diagram.
342

Administration and CentralManager Guide SecurityAnalytics 8.1.3
1. Click the Users tab.
2. Verify that for the admin account, admin is shown under Remote Groups. If it is not:
n Click the Edit icon for the admin account.
n For Remote Groups, type adm and select admin when it is displayed.
n Click Save.
3. Select Tools > New.
4. For Username type Auditor1. This name cannot be changed later.
5. For Password and Confirm Password, type a password.
6. Under Group Memberships, do the following:
n For User Groups, accept the default: user. This setting determines the permissions that the user has on the CMC itself.
n For Remote Groups, delete admin, then type aud and select Auditor when it is displayed.
7. Click Save.
8. Create the remaining users with the values shown in the following table:
Username User Groups Remote Groups
Analyzer1 user Analyst
343

Administration and CentralManager Guide SecurityAnalytics 8.1.3
Username User Groups Remote Groups
Analyzer2 user Analyst
Auditor2 user Auditor
Watchman user security_admin, Auditor
WebMaster1 user Website
WebMaster2 user Website
Assign Sensor Authorizations
1. Select Menu > Settings > Central Management and click the Sensors tab.
2. Click the Edit icon for Sensor 1.
3. For Remote Groups, add the following:
n admin
n Analyst
n auditor
n security_admin
4. Click Save.
5. Add the authorizations and remote groups to Sensor 2 and Sensor 3 according to the following information:
Sensor Authorizations Remote Groups
Sensor 1 admin, Analyst, auditor, security_admin
Sensor 2 Analyzer2 admin, auditor, security_admin, Website
Sensor 3 Auditor1, Analyzer1 admin, security_admin
Results
To verify the inputs, go to Menu > Settings > Users and Groups > Remote Groups. The Remote Groups table should have the following data:
Name Description Users
admin (Default) admin
Analyst All Analyze pages, capture summary, PCAP import, data enrichment.
Analyzer1, Analyzer2
auditor Auditor1, Auditor2, Watchman
344

Administration and CentralManager Guide SecurityAnalytics 8.1.3
Name Description Users
security_admin Settings: authentication, security, and web interface
Watchman
user
Website application_group=web, vlan_id!=4,5,6; all Analyze pages, view and download audit log, local PCAP import
WebMaster1, WebMaster2
Given the preceding setup, the resulting sensor-access permissions are as follows:
Sensor 1
n All users that belong to the remote groups admin, Analyst, auditor, and security_admin are able to access Sensor 1 with their respective permissions.
n Watchman has both security_admin and auditor permissions on Sensor 1.
345

Administration and CentralManager Guide SecurityAnalytics 8.1.3
Sensor 2
n All users that belong to the remote groups admin, auditor, security_admin, and Website are able to access Sensor 2 with their respective permissions.
n Analyzer2 can access Sensor 2 with Analyzer permissions. Analyzer1 does not have permissions on Sensor 2.
n WebMaster1 and WebMaster2 can access web-related traffic on VLAN 7 only.
n The admin, Auditor1, Auditor2, and Watchman accounts have no data-specific restrictions on their access.
n Watchman has both security_admin and auditor permissions on Sensor 2.
Sensor 3
346

Administration and CentralManager Guide SecurityAnalytics 8.1.3
n Auditor1 is the only user with auditor permissions on Sensor 3.
n Analyzer1 is the only user with Analyzer permissions on Sensor 3.
n All users that belong to the remote groups admin and security_admin are able to access Sensor 3 with their respective permissions.
Multi-Sensor EnvironmentThe Symantec Security Analytics CMC does not perform data capture but instead aggregates report and PCAP data that the sensors send.
View Multiple SensorsAdd user-defined labels to each sensor so that related groups of sensors can be more easily managed. You can define or add labels at the time that you create the sensor entry, or you can add and remove labels on the Sensors page by selecting one or more sensors and selecting Tools > Add | Remove Labels.
347

Administration and CentralManager Guide SecurityAnalytics 8.1.3
1. On the CMC dashboard, click CMC to expand the sensor selector.
2. Select the sensors to view using one of two methods:
n Click one or more sensors to move them into the next column, and then click Apply.
348
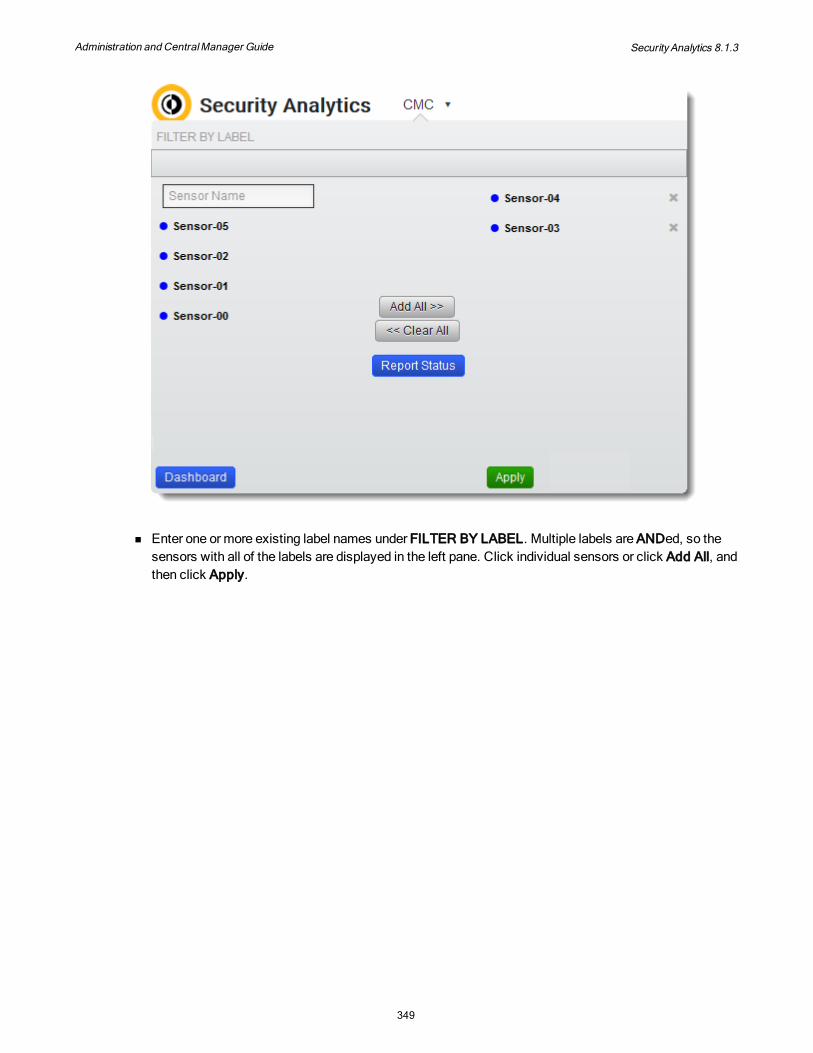
Administration and CentralManager Guide SecurityAnalytics 8.1.3
n Enter one or more existing label names under FILTER BY LABEL. Multiple labels are ANDed, so the sensors with all of the labels are displayed in the left pane. Click individual sensors or click Add All, and then click Apply.
349

Administration and CentralManager Guide SecurityAnalytics 8.1.3
3. To remove a sensor, click its X and then click Apply.
350

Administration and CentralManager Guide SecurityAnalytics 8.1.3
4. To remove all sensors, click Clear All and then click Apply.
351

Administration and CentralManager Guide SecurityAnalytics 8.1.3
5. To return to the CMC dashboard at any time, expand the sensor selector and click Dashboard.
Sensor-Selection in the URL
n The default behavior for the CMC is to specify the sensor's number in the URL:
https://<cmc>/?&appliances=7,3,8
In this example, the three selected sensors (appliances) are designated by their sensor IDs, which were assigned by the CMC in the order the sensors were created. You can see the sensor IDs on the Sensors page.
n Sensor IDs are not reused or reassigned, so if a sensor is re-added to the CMC after being deleted, it will be assigned a new sensor ID.
n You can manually specify the sensor's name in the URL in place of the sensor ID. The name must be URL-encoded, so if the sensor's name is Bldg 2, Level 5 the URL is:
https://<cmc>/?&appliances=Bldg%202%2C%20Level%205
Data AggregationWith two or more sensors selected, the summary screen displays aggregated data from the sensors. The Reports, Extractions, and Geolocation views have a drop-down arrow at the left of the status bar. Expand to see the status for each individual sensor.
352

Administration and CentralManager Guide SecurityAnalytics 8.1.3
Aggregation is not available for the following:
n Anomalies
n Capture pages
n Statistics pages
n Settings pages
For these pages, select a sensor from the selector in the upper-right corner of the interface to view each sensor's page separately.
Multi-Sensor Metadata
On Menu > Settings > Metadata,Settings > Metadata, you can choose from hundreds of metadata types to index. On this page you have the option of setting metadata attributes for one sensor or of pushing attributes to all connected sensors. Changes to this page will cause sensors to reboot. The CMC does not reboot when this page is changed.
n Sensors Selected — With one or more sensors selected, you can select each sensor's Metadata Settings page and save the settings.
n No Sensors Selected — With no sensors selected, you can push the settings on the CMC's Metadata Settings page to all connected sensors.
o Make the desired changes to the CMC's Metadata Settings page and click Save.
o Click Push Metadata to Sensors to push the new settings to all connected sensors.
All of the metadata settings across all sensors must be identical before you attempt to retrieve reports from those sensors via the CMC. Failure to synchronize the metadata settings on all sensors will result in no data returned for any report.
353

Administration and CentralManager Guide SecurityAnalytics 8.1.3
Multi-Sensor ICDx Metadata
New in Security Analytics 8.1.1 With all sensors de-selected on the CMC, you can go to Menu > Settings > ICDx MetadataSettings > ICDx Metadata to input server settings, select metadata attributes, and then push them to all connected sensors.
n If you do not see all of the desired metadata attributes on this page, follow the instructions in "Multi-Sensor Metadata" on the previous page to select and push the new attributes to all connected sensors (causing them to reboot). When they have finished rebooting, the new attributes will be displayed on the CMC's ICDx Metadata page.
n See "ICDx Metadata Forwarding" on page 83 ICDx Metadata Forwarding for instructions on configuring the ICDx Metadata page.
o When you have one or more sensors selected, you can configure the ICDx Metadata page for each sensor, one at a time.
o To configure all connected sensors at once, deselect all sensors.
l When you click Push ICDx Settings to All Servers you must provide the password of the ICDx server to continue.
l When the ICDx server and metadata settings are pushed to all connected sensors, a Sensor Push Status dialog informs you whether the push has been successful for each sensor.
If sensors running versions earlier than 8.1.1 are connected to the CMC, you will see an error for each of these sensors.
n To stop sending the ICDx metadata to the server, clear the Enable ICDx check box and click Save.
Multi-Sensor Summary Views
On all of the Menu > Summary views the data is aggregated from all selected sensors, provided that all of the metadata settings are identical across all sensors. When you create or edit a view on the CMC (by deleting or adding widgets, for example), the changes are not propagated to the individual sensors: only on the CMC can the user see the changes.
Multi-Sensor ReportsThe reports that are available on the CMC are the same as for a standalone appliance, provided that all of the metadata settings are identical across all sensors.
n The CMC does not generate reports for the sensors — each individual sensor generates its own report and passes the data to the CMC. However, the saved, aggregated report views are stored on the CMC.
354
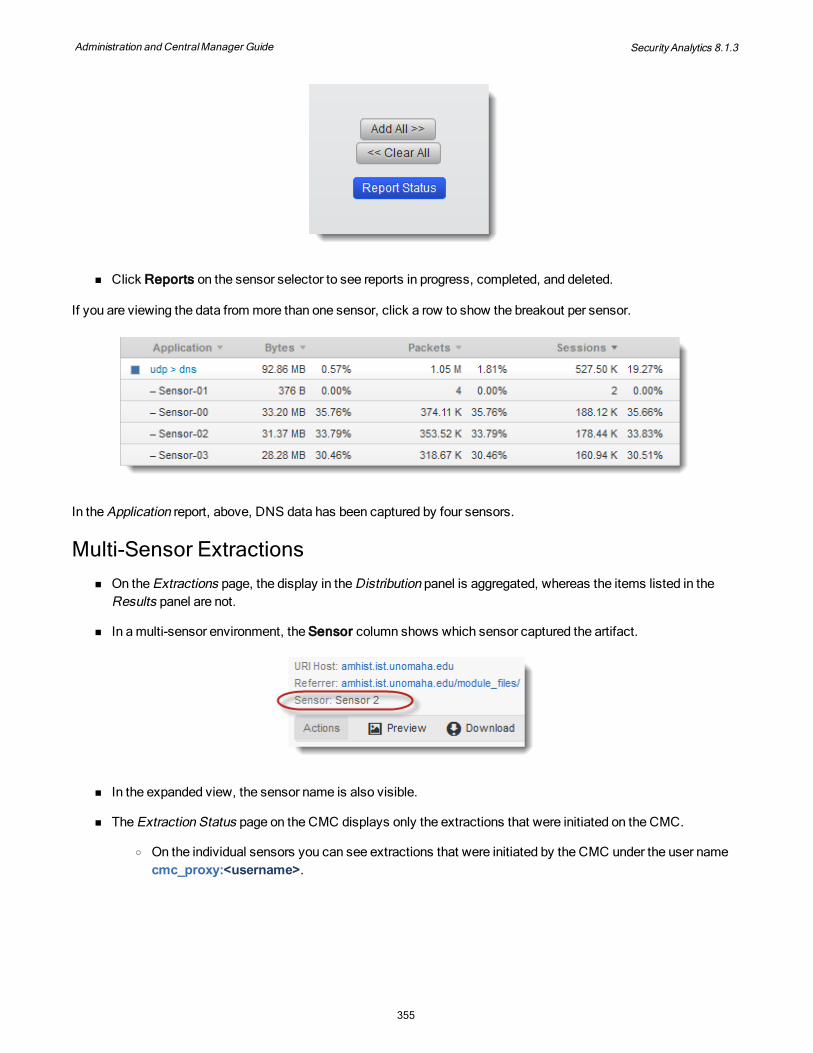
Administration and CentralManager Guide SecurityAnalytics 8.1.3
n Click Reports on the sensor selector to see reports in progress, completed, and deleted.
If you are viewing the data from more than one sensor, click a row to show the breakout per sensor.
In the Application report, above, DNS data has been captured by four sensors.
Multi-Sensor Extractions n On the Extractions page, the display in the Distribution panel is aggregated, whereas the items listed in the
Results panel are not.
n In a multi-sensor environment, the Sensor column shows which sensor captured the artifact.
n In the expanded view, the sensor name is also visible.
n The Extraction Status page on the CMC displays only the extractions that were initiated on the CMC.
o On the individual sensors you can see extractions that were initiated by the CMC under the user name cmc_proxy:<username>.
355

Administration and CentralManager Guide SecurityAnalytics 8.1.3
The CMC and the sensor clean up extracted artifacts on different schedules. For that reason, you may attempt to access an artifact that is visible on the CMC but is no longer present on the sensor.
Multi-Sensor IndicatorsOn the Indicators and Rules pages, a Sensors column shows the where the item is present, or for the Alerts List, which sensor generated the alert.
n If the same indicator is present on multiple sensors, click the [N] more link to see the full list of sensors.
n When creating an indicator, you can apply it to one or multiple sensors. In the Sensors field, all sensors appear by default. Delete any sensors to which you do not want to copy the indicator.
o Any indicator that you add to the Filter field must already be present on the sensor(s) where the new indicator is to be created.
o Creating non-shared indicators through the CMC is not supported; such indicators will not persist on the sensors and will cause unexpected behavior in any rules that are created with them.
o When you delete an indicator, you also delete other indicators, rules, and alerts that contain the indicator. See Delete Indicators. See Delete Indicators.
356

Administration and CentralManager Guide SecurityAnalytics 8.1.3
Multi-Sensor Rules
n When creating a rule, you must select the sensor on which the rule is to be created.
o When creating a rule, the indicator(s) in the First Event field must already be present on the sensor(s) where the rule is to be created.
o Creating non-shared rules through the CMC is not supported; creating such rules will result in unexpected behavior.
o Shared rules are is visible on the sensors.
Multi-Sensor Alerts
n On Menu > Analyze > Alerts > List, On Analyze > Alerts > List, you can see each instance of a triggered alert. The sensor that registered the hit is displayed in the Sensors column.
357

Administration and CentralManager Guide SecurityAnalytics 8.1.3
Multi-Sensor PCAP Files
n You can download PCAP files from the CMC from Menu > Analyze > [Summary | Reports | Extractions | Geolocation].
n The CMC creates a single ZIP file that contains a separate PCAP for each sensor.
PCAP Import n PCAP imports cannot be aggregated.
n When importing a PCAP to a sensor via the CMC, only the Remote Server option is supported for Import from.
n If two or more sensors have identical mount points, the identical mount points are aggregated in the display.
Multi-Sensor Geolocation and Google EarthAlthough the Geolocation and the Google Earth tools can show maps with both aggregated data and individual sensor data, the Geolocation tool in the CMC does not identify the sensor that the data came from. With the Google Earth tool, you can choose to display either aggregated data or data from any individual sensor.
When you download a Google Earth file with multiple sensors selected, you can choose whether to view the aggregated data or to view sensor data separately.
There are two methods to link the source sensor to a geographic location:
n Select the IP address, filter on that and view reports.
n Deselect all but one sensor and regenerate the Geolocation image; you may need to repeat this for each sensor until you find the desired data.
Multi-Sensor Communication SettingsFor settings that are related to remote notifications, scheduled reports, and other communication settings, the CMC will not synchronize its SNMP, SMTP, or syslog server information with that of the sensors.
358

Administration and CentralManager Guide SecurityAnalytics 8.1.3
This non-synchronization permits you to specify different servers for the CMC and for each sensor.
Upgrading SensorsYou can use a Symantec Security Analytics CMC as a software repository for the sensors, so that you download the upgrade from the Internet only once. (Alternatively, the sensors can be upgraded from their own interfaces in the same way as standalone appliances.)the same way as standalone appliances.)
CMC Upgrade RepositoryFor the CMC to act as an upgrade repository for its sensors, it must have at least one upgrade server configured in the CMC repository as well as an upgrade image in the CMC repository.
An upgrade image in the CMC repository is available to the sensors for upgrade but it is not available for the CMC itself to upgrade. Select Settings > Upgrade to perform an upgrade of the CMC.
On the dashboard, click Upgrade Repository. During the licensing procedure for the CMC, the upgrade server upgrade.soleranetworks.com should have been added to the CMC's External Repository list.
If no upgrade server is listed, follow these instructions to add the default Security Analytics upgrade server:
1. On the CMC, do one of the following:
n Select Menu > Settings > Central Management > Upgrades.
n On the dashboard, click Upgrade Repository.
2. Click New.
3. For Protocol, select http.
359

Administration and CentralManager Guide SecurityAnalytics 8.1.3
4. For Host, type upgrade.soleranetworks.com
5. For Path, type /upgrades/
6. For Username and Password, input your license key both times.
7. Click Save. The upgrade server is saved under External Repository.
This same server will also be listed on the CMC's Settings > Upgrade page.
Add an Upgrade Image to the CMC RepositoryBefore you can upgrade the sensors, the upgrade image must be present on the CMC repository.
1. On the CMC, do one of the following:
n Select Menu > Settings > Central Management > Upgrades.
n On the dashboard, click Upgrade Repository.
2. For the upgrade server, click Download from Server .
3. Select the desired version and click Download.
4. The latest version is now in the Local Repository list. The list shows which upgrade version is appropriate for each version to be upgraded.
Upgrade Sensors from the CMC RepositoryTo upgrade sensors from a CMC repository, you have two options:
n "Push" the upgrade from the CMC to the sensor
n "Pull" the upgrade from the CMC to the sensor
Unless otherwise instructed by the release notes, upgrade the CMC before upgrading the sensors that are attached to it.
Push Upgrades
A push upgrade is initiated on the CMC.
Do not attempt to push-upgrade the same sensor from multiple CMCs at the same time.
360

Administration and CentralManager Guide SecurityAnalytics 8.1.3
1. On the CMC, do one of the following:
n On the dashboard, click Manage Sensors.
n Select Menu > Settings > Central Management > Sensors.
2. Select the check boxes for the sensors to be upgraded.
n Alternatively, you can click Upgrade for each individual sensor.
3. Select Tools > Upgrade.
4. Select the upgrade file to use and click Upgrade.
5. On the dashboard, you can view the progress of the upgrade for each sensor. To see the whole upgrade message, place your cursor over the bottom line of the sensor's box.
6. While the upgrade image is loading onto the sensor, you can monitor its progress on the sensor's Settings > Upgrade page.
Do not click Initiate Upgrade on the sensor during a push upgrade; the process is automatic.
7. After the sensor has finished upgrading (including reboot), you can see that the CMC repository has been
automatically added to the sensor's Upgrade Servers list on the Menu > Settings > Upgrade page.
n The IP address under Host is the CMC's VPN address, which is xxx.xxx.xxx.1 for IPv4 or xx:xx:xx::1 for IPv6.
n You now have the option of clicking Upgrade from Server on the sensor to upgrade the software.
Pull Upgrades
A pull upgrade is initiated on the sensor.
Unless otherwise instructed by the release notes, upgrade the CMC before upgrading the sensors that are attached to it.
1. Access the sensor by doing one of the following:
n Log on directly to the sensor with admin-level permissions.
n Access the sensor through a CMC with a remote group account that has admin-level permissions.
2. Select Menu > Settings > Upgrade. Is there an entry for a CMC repository in the Upgrade Servers list?
361

Administration and CentralManager Guide SecurityAnalytics 8.1.3
Yes — Verify that the latest upgrade image is on the CMC.
Continue the procedure.
No — Select New.
n For Protocol, select https.
n For Host, type the VPN address of the CMC (xxx.xxx.xxx.1 or abab::1)
n For Path, type /upgrades/
n Leave the Login Information fields blank.
n Click Save.
n Verify that the latest upgrade image is on the CMC and continue the procedure.
3. On the sensor, click Upgrade from Server.
4. When the download is complete, click Initiate Upgrade.
CMC Local ManagementThis page describes how to manage the Symantec Security Analytics CMC itself. When managing the sensors through the CMC, the process is similar to single-appliance management, with the exceptions described in "Multi-Sensor Environment" on page 347.
CMC Dashboard
1 Menu icon, which opens the Settings menu
362

Administration and CentralManager Guide SecurityAnalytics 8.1.3
2 Sensor selector — Use this control to select one or more sensors to view or manage
3 System Utilization
4 About Menu
5 Job Queue
6 Notifications
7 Account Settings
8 Control Buttons
9 Your Sensors list
10 Other Sensors list
Your Sensors listThe Your Sensors list shows all of the sensors for which you have a role (remote group or authorization). Each individual sensor is represented on the dashboard page by a graphical box.
1 Connection status (blue = connected; gray = not connected)
2 Sensor name
3 Connection status
4 Software compatibility status
5 Capture status
363

Administration and CentralManager Guide SecurityAnalytics 8.1.3
6 Software version
7 Model number
The capture status is available only when the sensor is connected to the CMC and the user has access to the sensor. In some cases, the capture status of a sensor may take a few minutes to update. Click Check Sensor Connections to refresh the connection status.
Software Compatibility Status
When a sensor has a different software version than the CMC, an information icon is displayed in the upper-right corner of the sensor's box. Symantec strongly recommends that you upgrade the software; otherwise, some functionality is lost when selecting the sensor with outdated software.
Other Sensors ListThe Other Sensors list is visible only to CMC admin accounts and shows two types of appliances:
n Sensors for which you have begun but not finished the authorization process.
n Sensors for which your account does not have a role.
Software version number and capture status are not visible in the Other Sensors list.
Control Buttons
Manage Sensors Button
n Click to go to the Menu > Settings > Central Management > Sensors page.
o Add and delete sensors.
o Generate authorization key files.
o Use the Advanced Filter to select multiple sensors according to their user-defined labels.
364

Administration and CentralManager Guide SecurityAnalytics 8.1.3
Upgrade Repository Button
Click to go to the Menu > Settings > Central Management > Upgrades page.
Configure upgrade servers.
View or delete the software versions that have been uploaded to the repository.
Check Sensor Connections Button
New in Security Analytics 8.1.1 Click to refresh sensor connection status.
Upgrading the CMCDuring the licensing procedure for the CMC, the upgrade server license.soleranetworks.com should have been added to the CMC's Upgrade Servers list. If it has not, add the upgrade server add the upgrade server and return to these instructions.
The upgrade image that you download here is available to the CMC for upgrade but it is not available for sensor upgrade. Click Upgrade Repository on the dashboard to upgrade sensors.
1. On the CMC, select Menu > Settings > Upgrade.
2. For the upgrade server, click Upgrade from Server . A status bar is displayed.
3. When the upgrade file has finished downloading, click Initiate Upgrade. After the CMC has upgraded, you are prompted to reboot the CMC.
4. After you log back in, you can verify that you are using the updated software by resting your cursor on the Symantec logo.
365

Administration and CentralManager Guide SecurityAnalytics 8.1.3
AppendixHow Security Analytics Works 367Implementation 367Drive Configuration 367Packet Capture 368Writing the Slots 370Data Overwriting 370Overwriting Imported PCAPs 372
Flows in Security Analytics 373TCP Finite State Machine 374UDP State Machine 375Flows in Security Analytics 376Flow-Based Reports 377
Populating the Reports 379Where's my data? 380Metadata Settings 380Natively Indexed Metadata 380Conversation Reports 381Data Enrichment Verdicts 381Hash Reports 382Open-Parser Rules 383
Detecting File Types 383Primary Filters for File Types 383Advanced Extraction Filters 383Why Can't I Detect All JavaScript Files? 384
Artifact Extraction 385Protocol Carvers 385Signature-Based Extraction 385
Data Enrichment Process 389Default Data-Enrichment Process 389Example: Create a Data Enrichment Rule to Evaluate PDFs 390
FRS Prefilter Process 392FRS Prefilter Process 392
366

Administration and CentralManager Guide SecurityAnalytics 8.1.3
When to Disable the FRS Prefilter 397
Anomaly Detection Process 398Initial Evaluation 398Statistical Analysis 399ADM Detectors 399Interpreting Anomaly Messages 400
All Settings 404Interface Icons 407Menu > Analyze > Summary 410Menu > Analyze > Summary > Reports 411Menu > Analyze > Summary > Extractions 412Menu > Analyze > Summary > Sessions 414Menu > Analyze > Summary > Geolocation 415Menu > Capture > Summary 416
How Security Analytics Works
ImplementationIn a typical deployment, Symantec Security Analytics receives mirrored traffic from a SPAN port or network tap. The traffic enters the appliance through one or more Ethernet ports, called "capture interfaces." See Tap Placement and Capture Optimization Best Practices for additional information.
Drive ConfigurationAll Security Analytics appliances (except the CMC) comprise three logical drives or arrays:
367

Administration and CentralManager Guide SecurityAnalytics 8.1.3
n Capture — Raw packet data
n Indexing — Indexed metadata (Indexing DB)
n System — A Linux®-based operating system
The actual size and composition of the drives vary according to the hardware and the specific configuration of the Security Analytics deployment. For example, in a Security Analytics 10G Appliance, all three drives are RAID arrays, whereas in a virtual machine, the drives may be logically separate entities on a conventional hard drive.
Packet CaptureThe figure below shows how incoming packets are processed and analyzed by Security Analytics.
368

Administration and CentralManager Guide SecurityAnalytics 8.1.3
1 Mirrored packets arrive from the LAN through one or more NICs.
2 When traffic begins to arrive, the NIC requests a "slot," a 64-MB RAM "container” into which the NIC loads incoming packets. Each packet receives a time-of-capture stamp and a source-interface tag.
3 When the slot is full, the slot is written to the capture drive, and the NIC requests another slot.
4 The metadata (packet header fields, capture timestamps, and interface identifiers) for the packets are written to the Indexing DB. Flows ("conversations" or "sessions") between hosts are identified during indexing. Also see "Data Enrichment Process" on page 389.
5 Artifacts (files), email messages, and IM conversations are extracted from the capture drive.
6 When PCAPs are downloaded, the packets are retrieved from the capture drive.
7 Reports, report widgets, the capture summary graph, and geolocation are generated from the metadata on the indexing drive.
369

Administration and CentralManager Guide SecurityAnalytics 8.1.3
Writing the SlotsThe capture drive is logically organized into "slots." As each packet is captured, it is written to a slot. Slots are allocated to the interfaces in sequential order (0–N).
The figure above shows four NICs: eth2 through eth5.
colored Packet written from that NIC
gray Nothing written because another NIC has that slot
white Capture inactive on that NIC
> Start capture
X End capture
eth2 starts to capture first, so it is allocated slot 0. eth5 is allocated slot 1, eth3 is allocated slot 2, and eth4 receives slot 3. The faster or busier NICs are allocated slots more frequently than slower or less-busy NICs. In this example, eth2 and eth5 are allocated more slots because they fill their slots more quickly than eth3 and eth4.
n Each time capture begins on an interface, it creates a "slot chain" — a list of the slots that were used for that capture session in the order in which they were filled.
n In the figure above, eth2 created the slot chain 0-4-8-12-14-18-21-24-28, whereas eth3 created slot chains 2-6-10 and 16-19-22-25.
n Slots are interface-agnostic. After slot N is allocated, slot 0 will be allocated to the next NIC that requests a slot, regardless of which NIC was allocated to slot 0 in the previous cycle.
Select Statistics > Storage System to see slot and slot-chain data.
Data OverwritingThe figure below shows how packets are logically written to the capture and index drives. The full packets and their corresponding index entries (metadata) are written simultaneously to the two drives: the red circles represent a particular set of packets with its corresponding metadata.
370

Administration and CentralManager Guide SecurityAnalytics 8.1.3
1 Packets are written to the capture drive in slot order from 0–N.
2 The corresponding metadata is simultaneously written to the indexing drive.
The write process always starts at the first slot and runs continually to the last, which prevents the hard-drive heads from engaging in excessive motion. It also enables extremely fast packet capture: up to 10 Gbps with the appropriate system RAM and RAID arrays.
After the last slot is filled, the next captured packet is written to slot 0. When the capture drive overwrites the first slot, the capture drive has "recycled." Select Statistics > Storage System to see the recycle count for your capture drive. The interval between cycles depends on the amount of data being captured, the size of the packets being captured, and the size of the capture drive.
3 The indicated packet data is overwritten as the capture drive recycles the first time.
4 The corresponding metadata is still available for reports.
In the figure above, the recycle count has been incremented by one because the capture drive has begun to overwrite the first set of packets. Notice that the metadata for the first packets has not yet been overwritten, because the index drive typically does not recycle as quickly as the capture drive. For this reason, report and geolocation data is often available after the original packets have been overwritten.
371

Administration and CentralManager Guide SecurityAnalytics 8.1.3
5 The original packet data’s location is overwritten a second time.
6 The corresponding metadata has now been overwritten.
As the second cycle begins, the metadata for the original packets begins to be overwritten.
To see whether the packets or metadata have been overwritten, view data availability.
Overwriting Imported PCAPsWhen you import a PCAP, the PCAP is first uploaded to system RAM and queued into slots in the same manner as the data from the capture interfaces. The interface for an imported PCAP is designated as impt[x].
It is then written to the capture drive alongside the live data.
372

Administration and CentralManager Guide SecurityAnalytics 8.1.3
Because the capture drive overwrites slots according to slot order, not according to timestamps, imported PCAPs will be overwritten according to their location on the capture drive, not according to the "age" of the packets.
For example, if you are actively capturing data in 2019 and you import PCAPs from 2018 (and retain the original timestamps), the capture drive will not overwrite all of the PCAPs from 2018 before starting to overwrite the data from 2019; instead, it will overwrite the slots in numerical order, 0–N, as usual.
Flows in Security AnalyticsThis page explains how the TCP and UDP state machines impact flow-based reporting and artifact extraction in Security Analytics.
Symantec Security Analytics implements Internet Protocol (IP) state machines to identify, track, and return associated data for all network flows. A network flow — also called a "conversation" or "session" in Security Analytics — is an orderly exchange of data between two network entities.
At minimum, Security Analytics identifies a flow by a unique 5-tuple that is derived from the flow's first packet: three network-layer fields and two transport-layer fields:
n IP protocol
n Source IP address (src IP)
n Destination IP address (dst IP)
n Source port (src port)
n Destination port (dst port)
Transmission Control Protocol (TCP, part of Internet Protocol) uses a sequence number to explicitly identify each packet in the same flow, whereas User Datagram Protocol (UDP, also part of Internet Protocol) does not include a
373

Administration and CentralManager Guide SecurityAnalytics 8.1.3
sequence number. The end of a flow is determined either by a time-out mechanism (UDP) or a formal session termination (TCP).
TCP Finite State Machine
Most TCP flows establish a connection with a "graceful," 3-way handshake that includes a sequence number: a SYN (synchronize) packet, a SYN+ACK (acknowledge SYN) packet, and an ACK (acknowledge the SYN+ACK) packet.
In some cases, the first packet of a new TCP session does not have a traditional handshake, such as PSH/ACK, RST, or FIN/ACK depending on the behavior of the network application: probe utility, N-map, firewall port knocking, and so forth.
When Security Analytics detects a 3-way handshake it checks its flow table to determine whether a flow with the same 5-tuple already exists. If it does not, Security Analytics creates a new row in the flow table and generates a hash key from the 5-tuple to track the state of the flow throughout its duration.
The handshake is also used to determine directionality — the entity that sends the first SYN packet is the "initiator" and the entity that sends the corresponding SYN+ACK is the "responder."
When a new TCP packet enters the system and it is not preceded by a 3-way handshake nor does it have an entry in the flow table, Security Analytics uses the 5-tuple of the first captured packet to determine the TCP roles of initiator and responder and to generate the corresponding hash key for the flow.
This behavior is similar to how Wireshark constructs TCP streams. Security Analytics inspects every TCP packet that enters the system and performs the following operations:
374

Administration and CentralManager Guide SecurityAnalytics 8.1.3
n Determines whether the 5-tuple already exists in the flow table and creates a new entry if it does not.
n When the 5-tuple already exists, the TCP state machine matches the packet's sequence number to its entry in the flow table, so that the packets may be correctly reassembled.
n For each hash key, Security Analytics sequentially assigns a flow ID and writes the value to the Indexing DB as the flow_id attribute, which can be used in the primary filter and reports.
The flow ID field uses 62 bits and can therefore identify 262 unique flows. Based on the current capacity and supported capture rates of a 10G appliance, it would take an estimated 100 years or more before the flow ID numbers were exhausted.
Security Analytics considers a flow to be expired when the TCP session is gracefully torn down with an in-sequence FIN/ACK, when it is reset (RST), or when it times out from inactivity. The state machine expires a flow from the state table when the session remains open but no new packets arrive for 60 seconds. If new packets arrive for a previous session, after the 60-second timeout, they are treated as a new flow and given a new sequence number.
UDP State Machine UDP is a simple stateless protocol — packets arrive without an introductory handshake and stop without a formal session tear-down.
The UDP state machine works in a fashion similar to TCP: it inspects packets based on a 5-tuple and associates them with a unique flow ID. A UDP flow 5-tuple consists of IP proto, src IP, dst IP, src port, dst port.
375

Administration and CentralManager Guide SecurityAnalytics 8.1.3
n Because UDP is connectionless, the first packet in a new flow (rather than a handshake) — together with the 5-tuple — are used to determine the initiator, responder, and unique hash key for the flow.
n The state machine inspects all UDP packets to see if they match an existing flow in the system, and if not, it generates a new flow record.
n The UDP session inactivity timeout is 5 seconds; after 5 seconds of inactivity, a UDP session is considered closed. Any new packets that match the 5-tuple are written as a new flow in the Indexing DB.
Flows in Security AnalyticsThis simplified diagram of a TCP session shows why a single flow usually contains multiple files.
376

Administration and CentralManager Guide SecurityAnalytics 8.1.3
1 The Initiator sends a SYN packet to start the TCP session.
2 The Responder sends SYN+ACK to confirm.
3 The three-way handshake is completed by ACK from the Initiator. With the Layer 4 (transport) session established, the Initiator can make requests according to the application-layer protocol, such as HTTP, FTP, or SMB. In this example, the Initiator sends multiple HTTP Requests to the Responder.
4 Often using HTTP pipelining, the Responder sends files in response to each request as it arrives, instead of waiting to receive an acknowledgment for each response. In this example an HTML page with its associated elements — JavaScript, style sheets, graphics, and multimedia files — are transferred in a single flow.
5 At the end of the session, the Initiator sends a FIN packet.
6 The Responder sends FIN+ACK to terminate the session.
Flow-Based ReportsA single TCP flow may comprise tens of thousands of packets that contain an enormous variety of data types such as the application-delivery mechanism, multiple requests and responses (each with different request headers and server-side response headers), numerous file payloads, and a diverse collection of metadata. For network forensic investigations, it is paramount to understand the full chain of events and context for any network activity.
For example, finding a malicious file is important, but it is equally important to understand the transport protocol, application, IP addresses, user agents, and URIs that were used during the download of the malicious file. All of these data points help identify the different tactics, techniques, and procedures (TTPs) that an attacker used. For these reasons, Security Analytics is structured to return entire flows when the primary filter specifies a particular item of metadata as an indicator or filter.
example
A typical process for returning entire flows is displayed in this flowchart:
377

Administration and CentralManager Guide SecurityAnalytics 8.1.3
1 On the web interface, the user inputs one or more attribute/value tuples in the primary filter bar OR the user pivots from an alert to the Summary page.
2 The query handler finds matches for the tuples in flow_ids 111, 222, 333, 444, and 555.
3 If the user query is for a report, the flow_id request is sent to the Indexing DB.
4 If the user query is for an extraction, the flow_id request is sent to the extractor, which queries the capture drive and extracts artifacts from the flows that the query handler identified.
5 The Indexing DB returns all of the metadata for all of the flows in the request.
6 The extractor returns all of the artifacts for all of the flows in the request.
example
This example shows how a single attribute/value tuple in the primary filter bar will return multiple artifacts. As shown below, the filter filename=map.swf returns 36 artifacts, including synthetic, 0-byte artifacts. Only one of the artifacts has the file name map.swf, yet the extractor has returned all of the files in the requested flow.
378

Administration and CentralManager Guide SecurityAnalytics 8.1.3
In a corresponding Summary view, these report widgets show that all of the files in the flow share the same 5-tuple.
Populating the ReportsAlso see:
"Flows in Security Analytics" on page 373, "Alerts" on page 236, "FRS Prefilter Process" on page 392, Best Searching Practices in Security Analytics, and "Metadata Settings" on page 56.
379

Administration and CentralManager Guide SecurityAnalytics 8.1.3
Where's my data?If you do not see data in your reports and report widgets, it is possible that the features that populate the reports have not been activated or properly set up. This section explains how each report is populated so that you can troubleshoot empty or sparsely populated reports.
Metadata SettingsUser-selectable metadata permits you to decide which metadata attributes are written to the Indexing DB. Report data
is not written to the Indexing DB unless it has been selected on Menu > Settings > Metadata.
Natively Indexed MetadataThe data for most Security Analytics reports is extracted directly from the packet headers by the deep-packet inspection (DPI) engine, or it has been added by system processes at the time of indexing. The reports that contain this data are available within seconds of the data being captured, provided that system resources are available. (See "Reindexing" on page 52.)
Packet-Header Metadata
n IP/port and Ethernet addresses
n IP protocol
n Email sender, receiver, subject line
n File name, extension, MIME type
n HTTP status code, method, URI, content disposition, server, referrer, user agent, location (redirect), content length
n Username, social persona (user identifier), or password
n Database or web queries
n DNS fields
n Packet length
n User-selectable metadata
System-Added Metadata
n Capture interface or import ID
n Application ID, application group
n Flow ID, flow duration
n NIC vendor
n File type
n Autogenerated domain and score
n Country initiator and responder
n Machine ID
For the other reports, specific conditions must be true before the data is written to the metadata array:
n "Conversation Reports" on the next page
n "Data Enrichment Verdicts" on the next page
n "Hash Reports" on page 382
n "Open-Parser Rules" on page 383
380

Administration and CentralManager Guide SecurityAnalytics 8.1.3
Conversation ReportsThe data for the Conversation reports is assembled only when the report is queried. For example, if you invoke the IP Layer View on the Analyze > Summary page, the IPv4 and IPv6 conversations for that timespan will be assembled and presented in their respective report widgets.
n IPv4 Conversation
n IPv4 Port Conversation
n IPv6 Conversation
n IPv6 Port Conversation
The values in the Conversation reports are cached but are not written to the metadata DB.
To specify a conversation in the primary filter bar, enter IPv[x]_address="<ip_address1>","<ip_address2>" There is no ipv[X]_conversation attribute.
Data Enrichment VerdictsAlso see: "Data Enrichment Process" on page 389.
Data for the reports in the verdicts namespace is produced by the data-enrichment process. The following conditions must be true for a data-enrichment report to contain data:
n The corresponding enrichment provider is licensed and activated.
n Traffic matches a data-enrichment rule for the provider.
n The provider has returned the verdict to Security Analytics OR the verdict for that artifact is already in the verdict cache.
The data-enrichment reports are populated as follows:
Report Providers
File Signature Verdict File Reputation Service, FRS prefilter
URL Categories Local Web Reputation Service, Global Intelligence Network (GIN)
URL Risk Verdict Local Web Reputation Service, GIN
Local File Analysis Calculate and Store Hashes, ClamAV, Custom Hash List, jsunpack-n, YARA
Malware Analysis Verdict Malware Analysis appliance; also see FRS Prefilter
Third-Party Verdict ReversingLabs® TitaniumScale® server
Threat Category ReversingLabs TitaniumScale server
Threat Description ReversingLabs TitaniumScale server
Threat Severity ReversingLabs TitaniumScale server
User Name (flows namespace)
Login Correlation Service
381

Administration and CentralManager Guide SecurityAnalytics 8.1.3
Exception: URL Risk Verdict
With one exception, you cannot use the data-enrichment verdict attributes as indicators for rules, because the data for those attributes is written to the Indexing DB after the rules engine inspects the traffic.
For URL Risk Verdict data, however, the process is as follows:
1. The Web Reputation Service is licensed and activated.
2. A Web Reputation Service rule that contains the url_risk_verdict attribute is activated.
3. The metadata indexer sends all URLs to the local copy of the Web Reputation Service, which returns a verdict (1-10) with 5 being unknown.
4. When a verdict has been returned for every URL in a flow, the metadata indexer sends the flow to the rules engine.
5. If url_risk_verdict is 5 or higher, the system queries GIN to obtain a definitive verdict for that URL.
6. The verdict is written to the Indexing DB.
Hash ReportsThe hash reports are not populated by the DPI engine nor the metadata indexer. Hashes are calculated by the extractor under the following circumstances:
n At least one data-enrichment rule is activated — and that rule sends either a file or a file hash to one of these enrichment providers:
o File Reputation Service o ICAP o Malware Analysis o Calculate and Store Hashes o ClamAV o jsunpack-n
o YARA o Cuckoo o FireEye AX-series o Lastline File or Hash o TitaniumScale o VirusTotal File or Hash
n Fuzzy Hash Only — Fuzzy-hash reports are not populated until after you edit /etc/solera/extractor/extractord.conf as shown and then run systemctl restart solera-extractord:
# Flag to calculate the fuzzy hash calc_fuzzy_hash=1 <== Uncomment this line and set the value to 1
n Because the hash reports contain data that is calculated after the flows are sent through the rules engine, you cannot use hash attributes as valid indicators for rules. For example, md5_hash~93fd02e cannot trigger a rule; however, it can be a valid primary or advanced filter. (See "Primary Filters" on page 107, "Advanced Filters" on page 113, "Indicators" on page 129)
Enable hash calculation for manual extractions on Settings > System. (Those settings do not affect hash-related reports.)
382

Administration and CentralManager Guide SecurityAnalytics 8.1.3
Open-Parser RulesReport data for open-parser rules is written to the Indexing DB only when the following are true:
n The open-parser rule is active.
n The rule specifies that metadata be written to the Indexing DB.
Detecting File TypesA common task to perform with Security Analytics is to find all files of a certain type and then filter on additional characteristics until you find the files that you want. Unfortunately, creating filters to single out all files of a particular type will inevitably leave out some of those files while including files not of that type, because there is no single characteristic of a file that objectively indicates its type. Text-based files have few distinguishing characteristics, for example, and malicious users can spoof file characteristics, which means that short of attempting to open a file in its suspected application — a risky way to test the file type — determining file type is not an exact science.
The file-detection tools in Security Analytics provide excellent ways to narrow down which files are most likely to be of a particular type. While using Security Analytics, you should be aware of how each filter type works as it relates to the file type that you are looking for.
Also see: "Flows in Security Analytics" on page 373, Best Searching Practices in Security Analytics, "Metadata Settings" on page 56
Primary Filters for File TypesPrimary filters identify all flows that contain the matching filter value. These attributes are recorded in the Indexing DB:
n file_name — Derived from the header fields of application-layer protocols such as HTTP, SMB, IMAP, or TFTP. This is a presented attribute, meaning that Security Analytics merely indexes what the header contains.
n smb_filename — From the filename field of the SMB packet header.
n file_extension — Everything after the first dot of file_name.
n mime_type — The Content-Type field of an HTTP or SMTP header .
n file_type — Derived from the file signature (magic number) of files transmitted via HTTP, IMAP, POP3, and SMTP. This is a derived attribute, meaning that Security Analytics obtained the value from the file itself instead of from an application header. See which file types are detected by the file_type filter in Detected File Types.
Advanced Extraction FiltersOn the Extractions page, use advanced filters to filter out extraneous files from the flows that the primary filters identified.
n file_extension — Derived from the presented MIME type.
n file_type — Detects values in both the Presented MIME Type (mime_type) and Detected MIME Type (file_type) fields.
383

Administration and CentralManager Guide SecurityAnalytics 8.1.3
n file_type_mismatch — Shows files that have different presented and detected MIME types.
n keyword, keyword_[x] — Detects strings inside an artifact, provided that the string is in cleartext rather than being encoded.
n filename — Not available as an advanced filter, because the artifact's displayed file name may be derived from a variety of sources, not from the file_name in the Indexing DB. To find a particular file name, try URL~<filename>.
Why Can't I Detect All JavaScript Files?Attempting to filter for all files of a particular type — and only files of a particular type — presents difficulties that are inherent in the nature of file structure and the network transport of files. Filtering for JavaScript files, for example, presents the following difficulties:
n The .JS file extension is usually applied to JavaScript files, but some JavaScript files have a .PHP or other extension, and nothing prevents a non-JavaScript file from having a .JS extension.
n JavaScript files do not have a magic number or file signature, so they cannot be detected by the file_type primary filter.
n JavaScript formatting can resemble formatting for other protocols such as HTML, XML, and CSS.
n HTTP headers usually specify that the MIME type is JavaScript, but the header may specify that the MIME type is something else.
Recommended Methods
n Begin with one or more primary filters that return only the flows that contain likely JavaScript files, for example: mime_type~javascript or file_extension=js. (Apply these filters before running the extraction so that you don't waste system resources extracting artifacts in flows that definitely do not contain the specified files.)
n After you initiate the extraction, apply file_type advanced filters to detect file types that contain the terms javascript or js (but not json).
384

Administration and CentralManager Guide SecurityAnalytics 8.1.3
The advanced filter shown here will detect most of the likely JavaScript files. However, any filter set will leave out some of the files that you want and include some that you do not. Ultimately, you must determine for your purposes which characteristics of a file constitute the desired file and then apply your filters accordingly.
Artifact ExtractionThe protocol is detected by the DPI engine and then sent to the extractor, which uses the appropriate carver to extract and reconstruct the artifacts.
Protocol CarversSpecialized protocol carvers extract artifacts from these Application Layer protocols:
n File Transfer Carver
o AIM Transfer o IRC Transfer o Jabber Transfer o PalTalk Transfer o Tencent (QQ)
Transfer o Yahoo o Yahoo YMSG
Transfer
n FTP Carver
o FTP o FTP Data
n HTTP Carver
o HTTP
n HTTP2 Carver
o HTTP2
n Mail Carver
o IMAP o POP3 o SMTP
n Messaging Carver
o AIM o AIM Express o Badoo o eBuddy o Facebook o Gmail Chat o IRC o Jabber o PalTalk o Second Life o Teamspeak o Yahoo Messenger o Yahoo Web Messenger
n SMB Carver
o SMB
n Telnet Carver
o Telnet
n TFTP Carver
o TFTP
n VoIP Carver
o MGCP o RTP o SIP
Webmail Carver
o Active Sync o DIMP o Facebook Mail o GMAIL o GMAIL Basic o GMAIL Mobile o GMX o IMP o MS Hotmail o Mailru o Maktoob o MIMP o Orangemail o OWA o Rambler Webmail o Squirrel Mail o Yandex Webmail o Yahoo Webmail — AJAX o Yahoo Webmail Classic o Zimbra o Zimbra Standard
Signature-Based ExtractionIf an application does not have a protocol carver, the extractor performs a Foremost signature scan to determine how to extract artifacts from the protocols (except on protocols in the Encrypted application group). This secondary scan is performed only when all of the following are true:
385

Administration and CentralManager Guide SecurityAnalytics 8.1.3
n Enable signature-based extraction is enabled on Menu > Settings > System (default=enabled).
n The protocol is in /etc/solera/config/unknown_protocols.json.
n A flow matches a rule that includes the indicator application_id=unknown. This indicator is the equivalent of creating separate application_id=<protocol> indicator with each individual protocol in /etc/solera/config/unknown_protocols.json
By default this carver can extract artifacts from the following protocols, listed by Application Group. You can add any recognized application_id to unknown_protocols.json. (See Recognized Applications in the Security Analytics 8.1.3 WebGuide on support.symantec.com.)
386

Administration and CentralManager Guide SecurityAnalytics 8.1.3
n Application Service Group
o DICT o elasticsearch o exacqvision o FIX o GDB_remote o LDAP o MQ o MS MQ o MSNP o Perforce o SRVLOC o syslog o vMotion o XFS
n Audio/Video Group
o Afreeca o Apple Airplay o Baofeng o Fring o H245 o Hulu o ICY o Join Me o MMS o MPGETS o MSRP o Netflix o NicoNico Douga o Octoshape o PalTalk Audio o PalTalk Video o Periscope o PP Live o PP Stream o Q.931 o QQ (Tencent) Live o QVOD o RTSP o SCCP o SIP SOAP o SMARTalk o Spotify o Tango o TVAnts o TVU Player o UUSee o Viber o Voddler
n Game Group
o Battle.net o Battlefield 1 o Battlefield 4 o Clash of Clans o Clash Royale o CounterStrike o Destiny o Eve Online o Gameloft o Lineage 2 o QQ Dancer o QQ Speed o RuneScape o Steam o Vivox o World of Tanks o World of Warcraft o Xbox LIVE
n Instant Messaging Group
o BeeTalk o Feiliao o Fetion o Gadu-Gadu o Kakao Talk o KIK Messenger o Lava Lava o Line IM/VoIP o Lotus Sametime o Lync o Mailru Agent o MiTalk Messenger o M+ Messenger o OICQ o QQ IM o Skype o Snow o Softros Messenger o Teamspeakv3 o Telegram o Touch o UpLive o WeChat o WhatsApp o Yahoo Messenger
Conference o Zoom
n Mail Group
n Peer to Peer Group
o ADC o AppleJuice o Ares o Bitcoin o BitTorrent o DirectConnect o eDonkey o Filetopia o GNUnet o GNUtella o GoBoogy o iMesh o Juxtapose o Kugou o LUKE o Manolito o MUTE o QQ Music o Share o Shareman o SLSK o Stealthnet o Thunder o WinMX o WinNY
n Printer Group
o JetDirect
o LPR
n Routing Group
o BGP
n Terminal Group
o RLOGIN o RSH
n Thin Client Group
o AnyDesk o DameWare o Go to Device o Go to My PC o ICA o JEDI o MS Hyper-V o PCAnywhere
387

Administration and CentralManager Guide SecurityAnalytics 8.1.3
o WebEx o Yahoo Messenger
n Authentication Group
o DIAMETER o IDENT o KPASSWD o Kerberos 5 o TACACS+
n Behavioral Group
o SPID
n Database Group
o DRDA o Honeywell PHD o IBM DB2 o MobileLink DB o MongoDB o My SQL o PostgreSQL o SQLI o TDS o TNS
n ERP Group
o SAP
n File Server Group
o CFT o Hotline o PBX o Quantum DXi o RSYNC
n File Transfer Group
o iRODS
n Forum Group
o NNTP
o Lotus Notes
n Microsoft Office Group
o Groove
n Middleware Group
o AMQP o COAP o DCERPC o DeltaV o GIOP o Java RMI o MQTT o MS PSRP o OPCUA o PI Analysis Framework o PI DataArchive o Thrift
n Network Management Group
o Altiris o Ethernet/IP o IFIX o IPERF o MODBUS o Vnet/IP o Zabbix Agent
n Network Service Group
o COTP o CSP AB/Ethernet o CVS o DISTCC o DNP3 o DNS o DSI o ECHO o ISCSI o IWARP o NBNS o NCP o NDMP o RTMP o SNPP o SVN o T.38 o Time o ULP
o RADMIN o RFB o Teamviewer o VMware o x11
n Tunneling Group
o AICCU o CCProxy o LogMeIn Hamachi o Hotspot Shield o OpenVPN o PPTP o Socksto HTTP o Socks4 o Socks5 o Ultrasurf o XOT
n WAP Group
o SMPP o UCP
n Web Group
o Akamai o Amazon o Apple o Apple Airport o Baidu o eBay o Funshion o GroupWise o Habbo o HAProxy o HTTP Proxy o ICAP o Kaspersky Update o LLP o LogMeIn o NAVER o Orb o Pornhub Network o PP Film o QQ Games o QQ Web o Shopee o Sina Weibo o Slack o SPDY o Speedtest
388

Administration and CentralManager Guide SecurityAnalytics 8.1.3
o WHOIS o WINS o XMCP
o Taobao o Threema o Twitch o VTun o YouKu o Your Freedom
Data Enrichment ProcessThe data-enrichment process begins with the rules engine and ends with alerts posted and data written to the reports.
Default Data-Enrichment ProcessThis diagram shows how the rules engine directs the production of data-enrichment verdicts during real-time extraction. The Malware Analysis Process is different from the default.
1 Captured data and imported PCAPs are sent to the metadata indexer.
2 The metadata indexer sends the packets to the deep-packet inspection (DPI) engine, where the packet headers are extracted and classified.
3 The metadata indexer compares the classified metadata with active rules. When a rule is matched, the metadata indexer sends the flow ID and the rule it matched to data enrichment.
389

Administration and CentralManager Guide SecurityAnalytics 8.1.3
4 Data enrichment compares the artifact's file type to the file-type filter for each of the rule's enrichment providers. If the filter permits the file type, data enrichment sends the flow ID to the extractor to request a real-time extraction (RTE) or "microextraction."
5 The extractor reassembles all of the artifacts in the flow by reading packet data from the capture system, and for each artifact it calculates the MD5, SHA1, SHA256, and fuzzy hashes, according to user settings. (Fuzzy hash must be manually enabled.) When importing a PCAP, you can see how many rule-based extractions were performed on the PCAP in the Extraction Jobs column. The extractor returns the hashes to data enrichment.
6 If a verdict for an artifact is already present for an enrichment provider, data enrichment retrieves the verdict from cache.
7 If the verdict is not present in cache, data enrichment sends the hashes or files to the selected reputation provider(s) — local or off-box, such as ClamAV or Malware Analysis.
8 As soon as it receives a verdict, data enrichment writes the verdict and the hashes to the Indexing DB, where they are available for reports.
9 If the verdict is higher than 6, an alert and its reputation report are posted to the Alerts page.
10 If remote notification has been enabled for the rule, a remote notification is also sent.
Example: Create a Data Enrichment Rule to Evaluate PDFsThe Security Analytics rule engine provides a real-time, rule-based method to enrich extracted files and metadata. A rule consists of these simple building blocks:
n Indicator — Contains metadata attributes such as file type, IP address, DNS query, or HTTP URL
n Rule type — Data enrichment, alert, IPFIX export, or PCAP export
o For data-enrichment rules, a verdict from an enrichment provider such as File Reputation Service, ClamAV, YARA rules, or Malware Analysis.
n Notification — An alert when traffic matches the rule and the verdict is higher than 6.
n Action — In the case of IPFIX and PCAP export, sending the file to a PCAP or other file server
Follow these steps to set up a rule that detects malware inside a PDF document:
1. Enable one or more file-based enrichment providers such as Malware Analysis and ClamAV. Ensure that the desired file-type filter for the providers is selected. Enable the FRS Prefilter to reduce traffic to the Malware Analysis appliance.
390

Administration and CentralManager Guide SecurityAnalytics 8.1.3
2. Create one or more indicators to match the file type of interest: PDF. The indicators can include any DPI-based, primary-filter attributes such as filename=*.pdf or file_extension=pdf (matches the explicit file name), file_type=pdf (matches the magic number), or a pre-loaded indicator such as PDF – Presented MIME Type (matches various PDF-related MIME types).
Filters that use two or more different attributes are joined by Boolean AND. If the filter contained file_extension=pdf and PDF - Presented MIME Type, traffic would have to match both filters.
391

Administration and CentralManager Guide SecurityAnalytics 8.1.3
3. Create a rule and specify the indicator(s) as the event to match.
4. Select Data Enrichment for Type, and for Send to select the desired enrichment provider(s).
5. Optionally, configure remote notifications via email, syslog, or SNMP.
6. The rule is activated as soon as you click Save.
FRS Prefilter ProcessThe File Reputation Service (FRS) prefilter setting is enabled by default on the Malware Analysis provider so that artifacts that are already known to FRS are not sent to the Malware Analysis appliance.
FRS Prefilter ProcessFRS Prefilter alters the data-enrichment process for Malware Analysis by returning FRS verdicts for known artifacts and then sending only the unknown artifacts to the Malware Analysis appliance.
To manually bypass the FRS prefilter and all data enrichment filters for an artifact, go Analyze > Extractions, expand the artifact entry, click the file name, and select Malware Analysis, which sends the file to the Malware Analysis appliance.
392

Administration and CentralManager Guide SecurityAnalytics 8.1.3
1 The rules engine registers a hit based on a rule's indicator. The corresponding artifact is extracted and its hashes are calculated.
2 If the file type for the artifact does not match the Malware Analysis (MA) file-type filter, the process ends. No data-enrichment job is created.
3 When the artifact matches the Malware Analysis filter, a data-enrichment job is created.
4 If FRS Prefilter is enabled, the artifact must also match the File Reputation Service (FRS) file-type filter.
5 If FRS Prefilter is not enabled, the system looks for an existing MA verdict in the cache.
6 If no MA verdict is found in cache, the artifact is sent to the Malware Analysis appliance.
393

Administration and CentralManager Guide SecurityAnalytics 8.1.3
7 The MA verdict (cached or from the appliance) and the artifact hashes are written to the indexing DB, making them available for the Malware Analysis Verdict and hash reports.
8 If the MA verdict is 6 or lower, no alert is posted.
9 If the MA verdict is higher than 6, the alert is posted, showing Malware Analysis as the
Enrichment Provider and the
Type as
Malware
10 If there is no FRS verdict in the cache, the hash is reviewed by the local copy of the Web Reputation Service (WRS).
11 If the local WRS database has no verdict, then the hash is sent to the Global Intelligence Network (GIN).
12 If GIN returns a 5 (unknown), the system looks for an MA verdict in the cache, and if not found the artifact is sent to the Malware Analysis appliance.
13 If GIN returns a verdict other than 5, the FRS verdict and the artifact hashes are written to the Indexing DB, making them available for the File Signature Verdict and hash reports.
14 If the verdict is higher than 6, an alert is posted, showing File Reputation Service as the
Enrichment Provider and the
Type as
File
example
A file called pdfcreator-1-3-2-en-win.exe is known to the File Reputation Service as malware. A PCAP that contains pdfcreator-1-3-2-en-win.exe is imported three times to Security Analytics under these conditions:
n The File Reputation Service is licensed. (It does not need to be activated.)
n A Malware Analysis appliance has been added. (A Content Analysis 2.2 or later appliance with Malware Analysis licensed would also produce this behavior.)
n The Malware Analysis and File Reputation Service file-type filters both permit Programs and Libraries.
n The Symantec Malware Analysis Service rule is enabled.
n The Symantec File Reputation Service rule is not enabled. (Duplicate alerts would be produced.)
n Security Analytics has never received a verdict on pdfcreator-1-3-2-en-win.exe.
Iteration 1
The first time that the PCAP is imported, FRS Prefilter is disabled.
394

Administration and CentralManager Guide SecurityAnalytics 8.1.3
1. The file pdfcreator-1-3-2-en-win.exe is detected by the Symantec File Reputation Service File Types indicator.
2. Malware Analysis returns a verdict, so the alert has a malware icon
3. The alert has a link to the corresponding task on the Malware Analysis or Content Analysis appliance.
4. The result did not come from cache, which means that the artifact was sent to the Malware Analysis or Content Analysis appliance.
5. The verdict is present in the Malware Analysis Verdict report.
Iteration 2
For the second PCAP import, no settings are changed.
6. Security Analytics retrieves the verdict from cache.
395

Administration and CentralManager Guide SecurityAnalytics 8.1.3
7. The link to the original Malware Analysis task is also retrieved from cache.
8. The verdict is present in the Malware Analysis Verdict report.
Iteration 3
Before importing the PCAP the third time, the verdict cache is cleared by running scm db clear_redis tonic, and FRS Prefilter is enabled in the Malware Analysis entry on Settings > Data Enrichment.
9. The File Reputation Service returns the verdict, as indicated by the file icon, and there is no link to a Malware Analysis task. Symantec File Reputation Service is the Enrichment Provider.
10. The rule name is still Symantec Malware Analysis Service, because that rule detected pdfcreator-1-3-2-en-win.exe. The Reputation Report contains a note saying that the sample (artifact) was not sent to Malware Analysis.
396

Administration and CentralManager Guide SecurityAnalytics 8.1.3
11. The Data Enrichment Filter for the File Reputation Service was applied. (If the FRS filter excluded pdfcreator-1-3-2-en-win.exe, File Reputation Service would not be queried, and the file would not be sent to Malware Analysis had FRS returned a verdict of 5 [unknown].)
12. The verdict is present in the File Signature Verdicts report.
When to Disable the FRS PrefilterSymantec recommends that the FRS prefilter always be enabled, because it is the fastest method for returning verdicts on files: The longer the Malware Analysis queue becomes, the longer it takes to return a verdict. Disabling the FRS prefilter, however, may be feasible under the following circumstances:
397

Administration and CentralManager Guide SecurityAnalytics 8.1.3
n You reduce the number of files that Security Analytics sends to Malware Analysis by:
o Removing the default indicators for the Malware Analysis rule and replacing them with indicators that detect a small number of unique files.
o Using the data enrichment file-type filter to limit the file types to send to Malware Analysis. (When the FRS prefilter is enabled, the file-type filter for the File Reputation Service is used.)
n Testing in your environment shows that the size of the Malware Analysis queue does not create too much latency in verdict returns.
n Security Analytics does not have an internet connection and so cannot query the GIN cloud.
n You do not have an Intelligence Services subscription but have a Malware Analysis appliance.
Anomaly Detection ProcessAlso see: "Anomaly Detection" on page 101
The ADM process consists primarily of
n establishment of baseline values
n statistical analysis of new data
n alerting on outliers
Initial EvaluationFor the first six hours of operation, ADM evaluates all incoming traffic and establishes norms for the traffic according to:
n capture interface (eth2, impt0)
n time (time of day, day of week, day of month, month of year)
n IP addresses (initiators and responders)
n port numbers (initiators and responders)
n country of IP addresses (initiators and responders)
n application, as identified by the DPI engine
n bytes transferred
n length of DNS answers
n URL category (only with the Web Reputation Service enabled)
These parameters are derived from the ADM detectors, which have been specifically calibrated for Security Analytics.
398

Administration and CentralManager Guide SecurityAnalytics 8.1.3
Statistical AnalysisThe system sends data to ADM in 10-minute chunks, called "analysis windows." This data has already been classified by the DPI engine, so the initiators and responders have been established for each flow, and the URL category (if any) has been determined.
n The length of the analysis window is not significant: it was chosen to balance manageability with frequency of alerts.
n ADM does not compare values in an analysis window with the other values in the same window; rather, it compares all data against the baseline.
n A value is considered anomalous when it is an outlier compared to the mean plus several standard deviations.
n ADM assigns a score to the degree of deviation from the mean: 0–9; anomalies with a score of 8 or higher are posted.
n After ADM finishes evaluating the 10-minute chunk of data, it folds all of that data into the baseline, including the anomalies; therefore, a value that is anomalous today might be within the bounds of "normal" next week.
n If for any reason data stops being captured during an analysis window, the data that is in the partially filled window will not be analyzed until after capture resumes and the analysis window is filled. The detection time will be the same time as when the analysis window has been analyzed, not when the data first was captured. This may prevent you from seeing an anomaly when you pivot to the Summary view.
o For example, say that capture stops at 00:35, after the analysis window has been filling for five minutes. Capture then resumes four hours later at 04:35. After five more minutes of capture, the analysis window is full, and it is then analyzed. Any anomalies in this analysis window will show a detection time of 04:30, even if the data was captured between 00:30 and 00:35.
o When pivoting to the Summary view for an anomaly that was captured at 00:32, the anomaly will not be visible, because the timespan is set to the detection time minus 30 minutes: 04:00–04:30. You should manually set the timespan to 00:30–04:30 to see that anomaly.
ADM DetectorsStatistical analysis is performed according to the terms in the ADM detectors. Terms that ADM uses are:
n Field — The attribute to be analyzed as a metric. A By Field is a specific value of Field to be analyzed.
n Function — Operation that is performed on the Field:
o high_sum — Detects large sums for the Field value.
o high_info_content — Detects large amounts of content at the beginning of a DNS answer name.
o high_distinct_count — Detects large numbers of distinct values for the Field.
o rare — Detects first-time or unusual instances of a Field or By Field value.
n Over Field — Always an initiator or responder IP, it identifies the device associated with the anomaly.
399

Administration and CentralManager Guide SecurityAnalytics 8.1.3
n Partition Field — A value by which the data is separated into distinct groups for consideration. Not all detectors have a partition field.
example 1
Given this detector:
n Function: high_sum
n Field: total_bytes
n Over Field: initiator_ip
n Partition Field: application_ids
1. ADM groups all of the data in the analysis window by application_ids.
2. For each flow with a particular application ID, ADM sums the total_bytes of flows that have the same initiator_ip.
3. ADM compares the sum to the baseline value for the same
n application_ids
n initiator_ip
n comparable analysis window*
4. If total_bytes is abnormally high compared to the baseline, ADM assigns it a score 0–9.
5. If the score is 8 or higher, ADM posts the anomaly: "Excessive data transfer by IP initiator <ip_address> while using <application_ids>"
example 2
Given this detector:
n Function: high_distinct_count
n Field: initiator_country
n Over Field: responder_ip
1. ADM counts the number of different initiator_countrys that have the same responder_ip.
2. ADM compares the number of countries to the baseline value for the same
n responder_ip
n comparable analysis window*
3. If the number of different initiator_countrys is abnormally high compared to the baseline, ADM assigns it a score 0–9.
4. If the score is 8 or higher, ADM posts the anomaly: "IP responder <ip_address> contacting a high number of countries."
Interpreting Anomaly MessagesEach of these anomaly messages indicates that the event is unusual for a comparable analysis window:
400

Administration and CentralManager Guide SecurityAnalytics 8.1.3
A "comparable analysis window" is derived from multiple timespans that pertain to the same capture interface: the specific weekday and time, that time on weekdays in general, that time for that day of the month, as well as recent activity (~48 hours before the analysis window).
Excessive data transfer by IP address while using application
The amount of data that this IP address is transferring — while using this application — is unusually high.
example
Initiator IP 1.1.12.211, while using FTP, transferred 1,083,240 bytes at around 03:30 on 09 Jun 2016. The mean for this same capture interface + time + IP initiator + application ID combination is 242,026 bytes. That degree of deviation from the mean gets a score of 9.
anomaly might indicate
n data exfiltration
n covert communications
IP address sending long strings to DNS servers
This IP address made a DNS request with an unusually high number of characters in the DNS name.
example
401

Administration and CentralManager Guide SecurityAnalytics 8.1.3
Responder IP 4.2.2.2 sent an unusually long string — represented as 15484 — to a DNS server at around 17:50 on 01 Mar 2017. The mean for this same capture interface + time + IP responder + DNS communication combination is ~110. That degree of deviation from the mean gets a score of 8.
anomaly might indicate
n data exfiltration
n command-and-control traffic using DNS tunneling
IP address using numerous applications
This IP address is sending data using an unusually high number of applications.
example
IP Responder 1.1.48.91 was using 40 applications at around 03:30 on 08 June 2016. The mean for this same capture interface + time + IP responder + number of applications combination is ~1. That degree of deviation from the mean gets a score of 9.
anomaly might indicate
n systems under threat-actor control that are performing probes
n scans for penetration
n lateral movement
Many conversations between IP address and multiple IPs or ports
This IP address is having an unusually high number of conversations (sessions) with another IP or port.
example
402
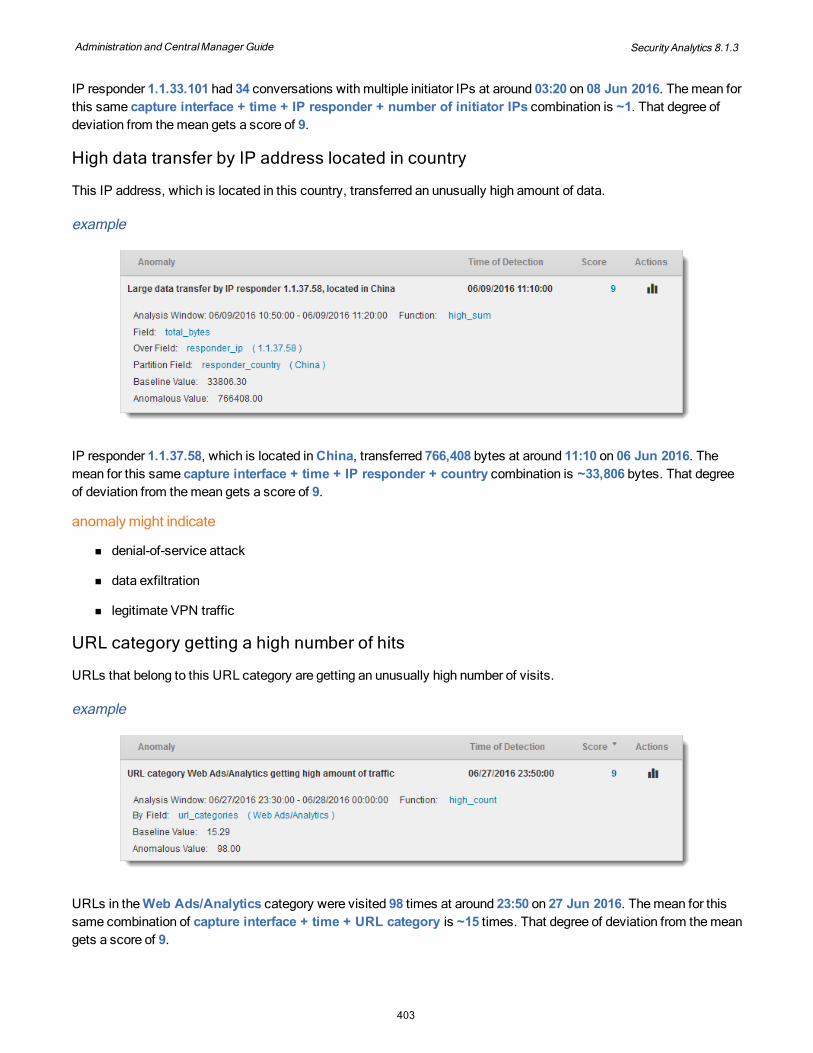
Administration and CentralManager Guide SecurityAnalytics 8.1.3
IP responder 1.1.33.101 had 34 conversations with multiple initiator IPs at around 03:20 on 08 Jun 2016. The mean for this same capture interface + time + IP responder + number of initiator IPs combination is ~1. That degree of deviation from the mean gets a score of 9.
High data transfer by IP address located in country
This IP address, which is located in this country, transferred an unusually high amount of data.
example
IP responder 1.1.37.58, which is located in China, transferred 766,408 bytes at around 11:10 on 06 Jun 2016. The mean for this same capture interface + time + IP responder + country combination is ~33,806 bytes. That degree of deviation from the mean gets a score of 9.
anomaly might indicate
n denial-of-service attack
n data exfiltration
n legitimate VPN traffic
URL category getting a high number of hits
URLs that belong to this URL category are getting an unusually high number of visits.
example
URLs in the Web Ads/Analytics category were visited 98 times at around 23:50 on 27 Jun 2016. The mean for this same combination of capture interface + time + URL category is ~15 times. That degree of deviation from the mean gets a score of 9.
403
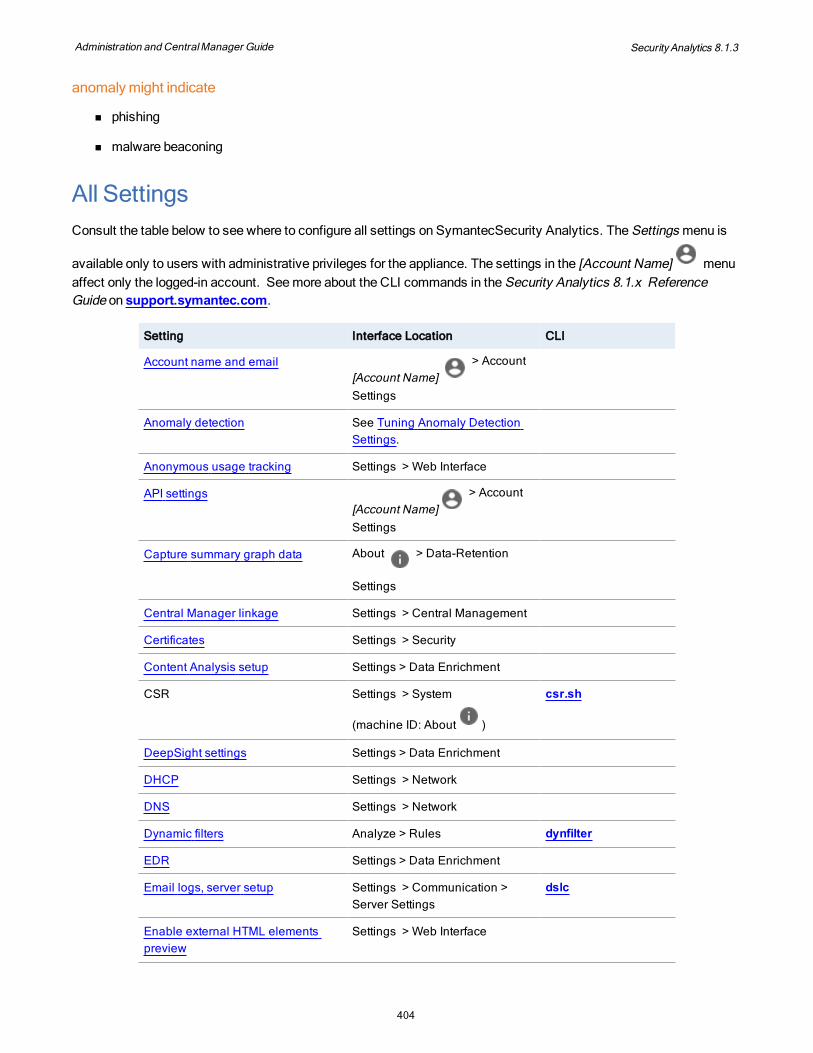
Administration and CentralManager Guide SecurityAnalytics 8.1.3
anomaly might indicate
n phishing
n malware beaconing
All SettingsConsult the table below to see where to configure all settings on SymantecSecurity Analytics. The Settings menu is
available only to users with administrative privileges for the appliance. The settings in the [Account Name] menu affect only the logged-in account. See more about the CLI commands in the Security Analytics 8.1.x Reference Guide on support.symantec.com.
Setting Interface Location CLI
Account name and email[Account Name]
> Account
Settings
Anomaly detection See Tuning Anomaly Detection Settings.
Anonymous usage tracking Settings > Web Interface
API settings[Account Name]
> Account
Settings
Capture summary graph data About > Data-Retention
Settings
Central Manager linkage Settings > Central Management
Certificates Settings > Security
Content Analysis setup Settings > Data Enrichment
CSR Settings > System
(machine ID: About )
csr.sh
DeepSight settings Settings > Data Enrichment
DHCP Settings > Network
DNS Settings > Network
Dynamic filters Analyze > Rules dynfilter
EDR Settings > Data Enrichment
Email logs, server setup Settings > Communication > Server Settings
dslc
Enable external HTML elements preview
Settings > Web Interface
404

Administration and CentralManager Guide SecurityAnalytics 8.1.3
Setting Interface Location CLI
Endpoint Protection settings Settings > Data Enrichment
Entries per page[Account Name]
>
Preferences
FIPS mode Settings > Security
Firewall Settings > Security dsfirewall
Global Intelligence Network connectivity
Settings > Data Enrichment gindiag.sh
Google Authenticator[Account Name]
>
Preferences
Google Earth® settings Settings > Geolocation
Hostname Settings > Network
HTTP proxy Settings > Network
HTTPS access Settings > Security
ICDx Settings > ICDx MetadataSettings > Communication > Server Settings
ICMP response Settings > Security
Inactivity timeout Settings > Web Interface
Integration providers Settings > Data Enrichment
Intelligence Services setup Settings > Data Enrichment
Intelligent capture Analyze > Rules
Internal subnets for geolocation Settings > Geolocation
IPs to exclude from reputation lookup
Settings > Data Enrichment
IPv4 and IPv6 addresses Settings > Network
Kerberos single sign-on Settings > Authentication
LDAP authentication Settings > Authentication
Licensing About > License Details
Log file export Settings > Communication > Advanced
dslc
Log file purge Settings > Communication > Advanced
dslc
405

Administration and CentralManager Guide SecurityAnalytics 8.1.3
Setting Interface Location CLI
Log notifications Settings > Communication > Server Settings
dslc
Log settings import Settings > Communication > Advanced
dslc
Logging (syslog, SNMP) Settings > Communication dslc
Login Correlation Service Settings > Data Enrichment
Malware Analysis setup Settings > Data Enrichment
MaxMind® uploads Settings > Geolocation
Message of the day Settings > Web Interface
Metadata Settings > Metadata
MIB Settings > Communication > Advanced
NTP Settings > Date/Time
Open parser Analyze > Rules
Passwords Various, click link
Ping response Settings > Security
Pivot-only providers Settings > Data Enrichment scm pivot_only_providers
RADIUS authentication Settings > Authentication
Reboot appliance Settings > System
Referrers Settings > Web Interface
Remote notifications Settings > Communications > Server Settings
Reputation providers Settings > Data Enrichment
Root password https://<appliance>/settings/initial_config
SEPM Settings > Data Enrichment
Session controls Settings > Security
Shut down appliance Settings > System
SNMP Settings > Communication > Server Settings
dslc
Splunk Phantom Settings > Communication > Server Settings
406

Administration and CentralManager Guide SecurityAnalytics 8.1.3
Setting Interface Location CLI
SSH access Settings > Security > Server Settings
syslog Settings > Communication > Server Settings
dslc
Threat Explorer Settings > Data Enrichment
Time/date/zone settings Settings > Date/Time
Time-based data deletion About > Data Retention
Two-factor authentication[Account Name]
>
Preferences
Units of measurement[Account Name]
>
Preferences
Upgrade system software Settings > Upgrade
User accounts and groups Settings > Users and Groups scm solera_acl_elevatescm solera_acl_shell_only
Web Reputation Service Updates Settings > Data Enrichment
YARA rules Settings > Data Enrichment
Interface IconsThese icons appear throughout the web interface as controls and signals.
Icon Function
Menu — Click to open the main menu.
About — Click to see the model and serial numbers, view license details, edit data-retention settings, and access the help files, EULA, audit log, Universal Connector, and Symantec Blogs.
Job Queue — Click to see jobs in the queue, such as offline PCAP downloads and generated PDFs
Notifications — Click to see system notifications.
Account Menu — For the logged-in account access account settings, preferences, the Risk and Visibility report, and the encoder/decoder tool.
407

Administration and CentralManager Guide SecurityAnalytics 8.1.3
Icon Function
Analyze > [Summary | Reports | Extractions | Geolocation] — Stop Report(s)/Extraction — Click to stop the data processing on that page.
Analyze > Extraction Status — Stop Extraction — Click to stop an extraction in progress.
Active/Inactive — Toggle to activate or deactivate the entry.
Delete — Click to delete this record.
Analyze > Extraction Status — Delete Extraction — Click to delete the extraction from the page and from disk.
Download — Click to download the item to the local workstation.
Edit — Click to edit this item.
Not Shared/Shared. Shared = Visible to all users on this appliance.
Analyze > Alerts > List — View Report Summary — Click to see the artifact on the Summary page. Analyze > Report Status > List — View Report — Click to view the report on the Reports page. Analyze > Indicators — Add to Filter Bar — Click to add the indicator to the filter bar. Analyze > Anomalies — View Report Summary — Click to view the anomaly data on the Summary page. Capture > Import PCAP — View This Import — Click to load the PCAP into the Summary page.
Analyze > Extraction Status — View Extraction — Pivot to the Extractions page to view the extraction.
Analyze > Extraction Status — Copy PCAP Path — Click to copy the PCAP path to clipboard.
Settings > Users and Groups — Remote/Local User. Local = Created on this appliance; remote = created on another authentication server such as an LDAP server.
Settings > Upgrade — Upgrade from Server — Click to initiate a software upgrade from the corresponding server.
408

Administration and CentralManager Guide SecurityAnalytics 8.1.3
Icon Function
Analyze > Alerts > List — View Artifacts— Click to view the artifact on the Extractions page. Analyze > Saved Extractions — View Extraction — Click to view the artifacts on the Extractions page. Analyze > Summary > Extractions — Preview — Click to preview the artifact.
Analyze > Alerts > List — URL — The item that triggered this alert is a URL.
Analyze > Alerts > List — File — The item that triggered this alert is a file.
Analyze > Alerts > List — Malware — The reputation report for this item was generated by a Malware Analysis or Content Analysisappliance.
Capture > Import PCAP — Manage Connections — Click to configure/edit a watch folder. Analyze > Rules > Create/Edit PCAP Export — Manage Connections — Click to configure/edit an external mount point.
Analyze > Summary — More Information — Click to see more information or to download the displayed data as a PCAP(NG). Analyze > Alerts > List — Rule Details — Click to display information about the advanced rule that triggered the alert. Capture > Import PCAP — Import Information — Click to see information on the imported PCAP(NG). Settings > Data Enrichment — View Description — Click to see the description of the custom script.
Capture > Summary — Hidden/Showing — Click to hide or show lines on the capture summary graph.
Capture > Summary — Capture Filter — Click to apply or remove a capture filter on an interface.
Analyze > Alerts > List — Critical Alert
Analyze > Alerts > List — WarningAnalyze > Summary — Unindexed Flows — Click to see how many of the flows in the current view are not yet indexed.
Analyze > Alerts > List — Notice
Capture > Import PCAP— View Alerts of This Import — Click to view the alerts that were generated by this PCAP.
Analyze > Summary > Extractions — Explore Root Cause — Click to view the root cause of the artifact.
Analyze > Summary > Extractions — Reputation — Click to view available reputation information for the artifact.
409

Administration and CentralManager Guide SecurityAnalytics 8.1.3
Icon Function
Analyze > Summary > Extractions — Analyze PCAP — Click to open the artifact in the Packet Analyzer.
Analyze > Summary > Extractions — Show Payload — For HTTP Method POST artifacts, display the payload.
Menu > Analyze > Summary
See "Summary Views" on page 144 for further information.
1 Analyze, Capture, Statistics, Settings, Menus
2 Filter Bar 14 Timespan Filter
3 Summary, Reports, Extractions, Sessions, Geolocation
15 Actions Menu
4 View Selector 16 Reindexing Control
5 Status Bar 17 Session Resolution Control
6 Save and Delete indicator Controls
18 Information and PCAP Download
410

Administration and CentralManager Guide SecurityAnalytics 8.1.3
7 Alerts in the last 96 hours and Anomalies
19 Application Group Widget
8 System Utilization 20 Application Group over Time Widget
9 About Menu 21 Table Display
10 Job Queue 22 Pie Chart Display
11 Notifications 23 Bar Chart Display
12 Account Settings 24 Column Display
13 Update and Stop Reports Buttons
Menu > Analyze > Summary > Reports
See "Reports" on page 137 for more information.
1 Analyze, Capture, Statistics, Settings, Menus
12 Account Settings
411
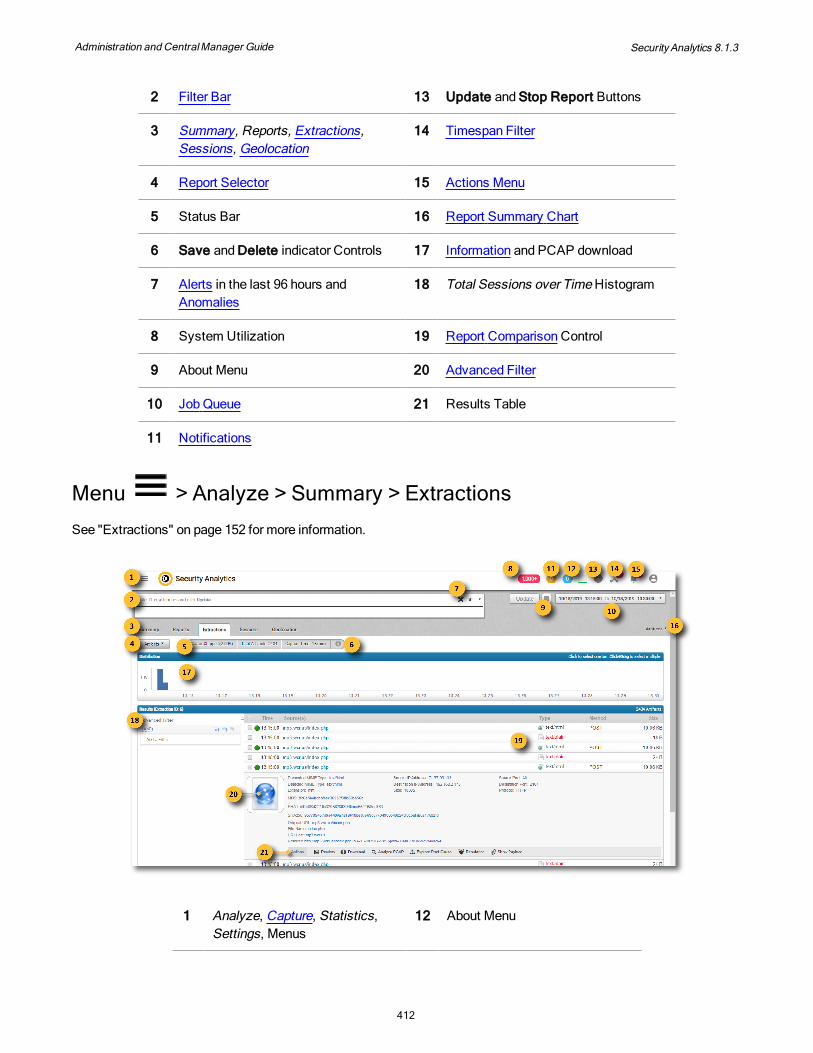
Administration and CentralManager Guide SecurityAnalytics 8.1.3
2 Filter Bar 13 Update and Stop Report Buttons
3 Summary, Reports, Extractions, Sessions, Geolocation
14 Timespan Filter
4 Report Selector 15 Actions Menu
5 Status Bar 16 Report Summary Chart
6 Save and Delete indicator Controls 17 Information and PCAP download
7 Alerts in the last 96 hours and Anomalies
18 Total Sessions over Time Histogram
8 System Utilization 19 Report Comparison Control
9 About Menu 20 Advanced Filter
10 Job Queue 21 Results Table
11 Notifications
Menu > Analyze > Summary > Extractions
See "Extractions" on page 152 for more information.
1 Analyze, Capture, Statistics, Settings, Menus
12
About Menu
412

Administration and CentralManager Guide SecurityAnalytics 8.1.3
2 Filter Bar 13
Job Queue
3 Analyze Menu: Summary, Reports, Extractions, Sessions, Geolocation
14
Notifications
4 View Selector: Artifacts, Artifacts Timeline, Email, IM Conversations, Media Panel
15
Account Settings
5 Status Bar 16 Actions Menu
6 Information and PCAP download
17
Histogram
7 Save and Delete indicator Controls
18
Advanced Filter
8 Alerts in the last 96 hours and Anomalies
19 Results List
9 Update and Stop Extraction Buttons
20
Expanded Artifact Entry
10
Timespan Filter 21 Artifact Actions: Preview, Download, Analyze, Explore Root Cause, Reputation
11 System Utilization
413

Administration and CentralManager Guide SecurityAnalytics 8.1.3
Menu > Analyze > Summary > Sessions
See "Sessions" on page 172 for more information.
1 Analyze, Capture, Statistics, Settings, Menus
11 Notifications
2 Filter Bar 12 Administrator Account Settings
3 Summary, Reports, Extractions, Sessions, Geolocation
13 Update and Stop Report Buttons
4 View Selector 14 Timespan Filter
5 Status Bar 15 Actions Menu
6 Save and Delete Controls 16 Session Resolution
7 Alerts in the last 96 hours and Anomalies
17 Information and PCAP download
8 System Utilization 18 Session Results Table
9 About Menu 19 Detail View
10 Job Queue 20 Advanced Filter
414

Administration and CentralManager Guide SecurityAnalytics 8.1.3
Menu > Analyze > Summary > Geolocation
See "Geolocation" on page 176 for more information.
1 Analyze, Capture, Statistics, Settings, Menus
11 Notifications
2 Filter Bar 12
Account Settings
3 Summary, Reports, Extractions, Sessions, Geolocation
13
Update and Stop Report Buttons
4 View Selector 14
Timespan Filter
5 Status Bar 15
Actions Menu
6 Save and Delete indicator Controls
16
Information and PCAP download
7 Alerts in the last 96 hours and Anomalies
17
Geolocation Map
415

Administration and CentralManager Guide SecurityAnalytics 8.1.3
8 System Utilization 18
Advanced Filter
9 About 19
Results List
10
Job Queue 20 Map Controls
Menu > Capture > Summary
See "Capture" on page 30 for more information.
1
Analyze, Capture, Statistics, and Settings menus
9 Graph Scales
2
Alerts in the last 96 hours and Anomalies
10
View Menu
3
System Utilization 11
Actions Menu
4
About Menu 12
Data Availability Histogram
416

Administration and CentralManager Guide SecurityAnalytics 8.1.3
5
Job Queue 13
Capture Totals
6
Notifications 14
Stop/Start Capture on All Interfaces
7
Account Settings 15 Capture Interfaces
8 Status Bar
Capture Interfaces
Each capture interface on a Security Analytics has a graphical box. To change the unit of measure on the boxes, go to [Account Name] > Preferences.
1 Line color on the graph
2 Interface name: eth — Ethernet; agg — aggregated interfaces. Click to edit the name.
3 Interface speed
4 Toggle to start/stop playback
5 Toggle to enable/disable data representation on the graph
417

Administration and CentralManager Guide SecurityAnalytics 8.1.3
6 Click to apply a capture filter
; during playback, click to
see playback information
7 Toggle to start/stop data capture
Each active interface box shows a table with the following columns:
n Type — Current, maximum, and total
n Captured — Total amount of data captured by this interface
n Filtered — Amount of filtered data captured by this interface
418

Administration and CentralManager Guide SecurityAnalytics 8.1.3
ResourcesConsult these resources for assistance with your Security Analytics implementation:
n Required Ports, Protocols and Services for Symantec Enterprise Security Products: https://techdocs.broadcom.com/content/broadcom/techdocs/us/en/symantec-security-software/web-and-network-security/security-analytics/8-1/ports-reference.html
n All Security Analytics documentation: https://techdocs.broadcom.com/content/broadcom/techdocs/us/en/symantec-security-software/web-and-network-security/security-analytics/8-1.html
n Security Analytics support page: https://support.broadcom.com/security
419


![Mission Manager[1]](https://static.fdokumen.com/doc/165x107/6313fe215cba183dbf075a68/mission-manager1.jpg)