Seasonal rainfall and runoff promote coral disease on an inshore reef
10
Seasonal Rainfall and Runoff Promote Coral Disease on an Inshore Reef Jessica Haapkyla ¨ 1,2 *, Richard K. F. Unsworth 3 , Mike Flavell 1 , David G. Bourne 2 , Britta Schaffelke 2 , Bette L. Willis 1 1 ARC Centre of Excellence for Coral Reef Studies, School of Marine and Tropical Biology, James Cook University, Townsville, Australia, 2 Australian Institute of Marine Science, Townsville, Australia, 3 Biological Sciences Research Unit, University of Glamorgan, Pontypridd, United Kingdom Abstract Background: Declining water quality coupled with the effects of climate change are rapidly increasing coral diseases on reefs worldwide, although links between coral diseases and environmental parameters remain poorly understood. This is the first study to document a correlation between coral disease and water quality on an inshore reef. Methodology/Principal Findings: The temporal dynamics of the coral disease atramentous necrosis (AN) was investigated over two years within inshore populations of Montipora aequituberculata in the central Great Barrier Reef, in relation to rainfall, salinity, temperature, water column chlorophyll a, suspended solids, sedimentation, dissolved organic carbon, and particulate nitrogen, phosphorus and organic carbon. Overall, mean AN prevalence was 10-fold greater during summer wet seasons than winter dry seasons. A 2.5-fold greater mean disease abundance was detected during the summer of 2009 (44 6 SE 6.7 diseased colonies per 25 m 2 ), when rainfall was 1.6-fold greater than in the summer of 2008. Two water quality parameters explained 67% of the variance in monthly disease prevalence in a Partial Least Squares regression analysis; disease abundance was negatively correlated with salinity (R2 = 20.6) but positively correlated with water column particulate organic carbon concentration (R2 = 0.32). Seasonal temperature patterns were also positively correlated with disease abundance, but explained only a small portion of the variance. Conclusions/Significance: The results suggest that rainfall and associated runoff may facilitate seasonal disease outbreaks, potentially by reducing host fitness or by increasing pathogen virulence due to higher availability of nutrients and organic matter. In the future, rainfall and seawater temperatures are likely to increase due to climate change which may lead to decreased health of inshore reefs. Citation: Haapkyla ¨ J, Unsworth RKF, Flavell M, Bourne DG, Schaffelke B, et al. (2011) Seasonal Rainfall and Runoff Promote Coral Disease on an Inshore Reef. PLoS ONE 6(2): e16893. doi:10.1371/journal.pone.0016893 Editor: Howard Browman, Institute of Marine Research, Norway Received November 4, 2010; Accepted January 5, 2011; Published February 10, 2011 Copyright: ß 2011 Haapkyla ¨ et al. This is an open-access article distributed under the terms of the Creative Commons Attribution License, which permits unrestricted use, distribution, and reproduction in any medium, provided the original author and source are credited. Funding: This work was supported by an Australian Research Council Grant and Australian Institute of Marine Science at James Cook University (AIMS@JCU) grant. The funders had no role in study design, data collection and analysis, decision to publish, or preparation of the manuscript. Competing Interests: The authors have declared that no competing interests exist. * E-mail: [email protected] Introduction Disease has emerged as a significant threat to wildlife populations in recent decades [e.g.1, 2]. A recent review highlights the substantial role that environmental nutrient enrichment has played in contributing to patterns of emerging human and wildlife diseases and the urgent need for studies to understand linkages, particularly in light of ongoing intensification of global nutrient cycles [3]. The current understanding of marine diseases is poor in comparison to knowledge of human, agricultural and terrestrial wildlife diseases [4]. It appears that epidemiological theories developed for terrestrial diseases may not translate well to marine ecosystems [4,5]. For example, diseases appear to spread more rapidly in comparatively open oceanic ecosystems [6] and marine pathogens are more diverse taxonomically and in their life histories [5]. Thus, marine case studies that advance understand- ing of potential links between nutrient enrichment and marine diseases are critical if management tools for the long-term conservation of marine wildlife are to be effective. Coral reefs are increasingly threatened by changes in water quality from terrestrial runoff [7], climate change [8,9] and over- exploitation [10,11]. Coral bleaching and disease have emerged as dominant drivers of coral population declines on coral reefs, particularly as oceans have warmed in the past few decades [12]. Current research supports a connection between a warming climate and increasing incidence of disease in corals [12,13,14]. For example, warm temperatures and high coral cover have been linked to increased abundance of white syndromes on the Great Barrier Reef (GBR) [14] and progression rates of black band disease were higher in the austral summer [15,16]. However, links to most other anthropogenic disturbances are less clear [17]. Although the mechanisms are unknown, outbreaks of disease on some coral reefs have been correlated with increases in nutrient runoff [18,19]. In the Philippines, a higher prevalence of growth anomalies and Porites ulcerative white spot disease was found near a sewage outfall [20], and white pox has also been linked to sewage inputs in the Caribbean [21]. Field experiments in the Caribbean have demonstrated that moderate increases in dissolved inorganic PLoS ONE | www.plosone.org 1 February 2011 | Volume 6 | Issue 2 | e16893
-
Upload
independent -
Category
Documents
-
view
6 -
download
0
Transcript of Seasonal rainfall and runoff promote coral disease on an inshore reef
Seasonal Rainfall and Runoff Promote Coral Disease onan Inshore ReefJessica Haapkyla1,2*, Richard K. F. Unsworth3, Mike Flavell1, David G. Bourne2, Britta Schaffelke2, Bette L.
Willis1
1 ARC Centre of Excellence for Coral Reef Studies, School of Marine and Tropical Biology, James Cook University, Townsville, Australia, 2 Australian Institute of Marine
Science, Townsville, Australia, 3 Biological Sciences Research Unit, University of Glamorgan, Pontypridd, United Kingdom
Abstract
Background: Declining water quality coupled with the effects of climate change are rapidly increasing coral diseases onreefs worldwide, although links between coral diseases and environmental parameters remain poorly understood. This isthe first study to document a correlation between coral disease and water quality on an inshore reef.
Methodology/Principal Findings: The temporal dynamics of the coral disease atramentous necrosis (AN) was investigatedover two years within inshore populations of Montipora aequituberculata in the central Great Barrier Reef, in relation torainfall, salinity, temperature, water column chlorophyll a, suspended solids, sedimentation, dissolved organic carbon, andparticulate nitrogen, phosphorus and organic carbon. Overall, mean AN prevalence was 10-fold greater during summer wetseasons than winter dry seasons. A 2.5-fold greater mean disease abundance was detected during the summer of 2009 (446 SE 6.7 diseased colonies per 25 m2), when rainfall was 1.6-fold greater than in the summer of 2008. Two water qualityparameters explained 67% of the variance in monthly disease prevalence in a Partial Least Squares regression analysis;disease abundance was negatively correlated with salinity (R2 = 20.6) but positively correlated with water columnparticulate organic carbon concentration (R2 = 0.32). Seasonal temperature patterns were also positively correlated withdisease abundance, but explained only a small portion of the variance.
Conclusions/Significance: The results suggest that rainfall and associated runoff may facilitate seasonal disease outbreaks,potentially by reducing host fitness or by increasing pathogen virulence due to higher availability of nutrients and organicmatter. In the future, rainfall and seawater temperatures are likely to increase due to climate change which may lead todecreased health of inshore reefs.
Citation: Haapkyla J, Unsworth RKF, Flavell M, Bourne DG, Schaffelke B, et al. (2011) Seasonal Rainfall and Runoff Promote Coral Disease on an Inshore Reef. PLoSONE 6(2): e16893. doi:10.1371/journal.pone.0016893
Editor: Howard Browman, Institute of Marine Research, Norway
Received November 4, 2010; Accepted January 5, 2011; Published February 10, 2011
Copyright: � 2011 Haapkyla et al. This is an open-access article distributed under the terms of the Creative Commons Attribution License, which permitsunrestricted use, distribution, and reproduction in any medium, provided the original author and source are credited.
Funding: This work was supported by an Australian Research Council Grant and Australian Institute of Marine Science at James Cook University (AIMS@JCU)grant. The funders had no role in study design, data collection and analysis, decision to publish, or preparation of the manuscript.
Competing Interests: The authors have declared that no competing interests exist.
* E-mail: [email protected]
Introduction
Disease has emerged as a significant threat to wildlife
populations in recent decades [e.g.1, 2]. A recent review highlights
the substantial role that environmental nutrient enrichment has
played in contributing to patterns of emerging human and wildlife
diseases and the urgent need for studies to understand linkages,
particularly in light of ongoing intensification of global nutrient
cycles [3]. The current understanding of marine diseases is poor in
comparison to knowledge of human, agricultural and terrestrial
wildlife diseases [4]. It appears that epidemiological theories
developed for terrestrial diseases may not translate well to marine
ecosystems [4,5]. For example, diseases appear to spread more
rapidly in comparatively open oceanic ecosystems [6] and marine
pathogens are more diverse taxonomically and in their life
histories [5]. Thus, marine case studies that advance understand-
ing of potential links between nutrient enrichment and marine
diseases are critical if management tools for the long-term
conservation of marine wildlife are to be effective.
Coral reefs are increasingly threatened by changes in water
quality from terrestrial runoff [7], climate change [8,9] and over-
exploitation [10,11]. Coral bleaching and disease have emerged as
dominant drivers of coral population declines on coral reefs,
particularly as oceans have warmed in the past few decades [12].
Current research supports a connection between a warming
climate and increasing incidence of disease in corals [12,13,14].
For example, warm temperatures and high coral cover have been
linked to increased abundance of white syndromes on the Great
Barrier Reef (GBR) [14] and progression rates of black band
disease were higher in the austral summer [15,16]. However, links
to most other anthropogenic disturbances are less clear [17].
Although the mechanisms are unknown, outbreaks of disease on
some coral reefs have been correlated with increases in nutrient
runoff [18,19]. In the Philippines, a higher prevalence of growth
anomalies and Porites ulcerative white spot disease was found near
a sewage outfall [20], and white pox has also been linked to sewage
inputs in the Caribbean [21]. Field experiments in the Caribbean
have demonstrated that moderate increases in dissolved inorganic
PLoS ONE | www.plosone.org 1 February 2011 | Volume 6 | Issue 2 | e16893

nutrient concentrations can substantially increase the severity of
aspergillosis and yellow blotch diseases [22] and the prevalence of
aspergillosis [18]. In other studies, nutrient exposure resulted in
increased progression rates of black band disease, with nutrients
thought to reduce the coral host’s ability to counteract infection by
pathogenic micro-organisms [23]. Experiments on the impacts of
organic carbon on microbiota suggested that the mechanism may
be indirect with elevated nutrients increasing the production of
organic carbon (through primary production), which in turn leads
to an increased growth rate of microbes living in the corals’ mucus
layer and a disruption of the balance between corals and their
associated microbiota [24].
Terrestrial runoff to the inshore GBR is mainly delivered in short-
lived flood events during the 5-month summer wet season [25],
often forming distinct flood plumes in the coastal zone that
sometimes reach far out into the GBR lagoon [26]. Elevated
concentrations of nutrients, suspended sediments and pesticides,
caused by changes in land use over the past 200 years of European
settlement, are now potentially affecting the health of coastal and
inshore ecosystems [25,27–29]. In particular, sediment loads to the
GBR have increased four to five-fold in this period [30], and five to
ten-fold in some catchments [31]. Moreover, the area of the GBR
affected by sediment inputs is increasing substantially as a result of
changing land management practices, to the point where fine
terrestrial sediment is reaching mid-shelf reefs for the first time in
their geological history [30]. Sediments settling on corals may
increase disease prevalence indirectly through increased stress and
energy expenditure required to remove sediments [28], which could
make them more susceptible to infections by microbial pathogens,
and/or directly if sediments act as disease reservoirs [23].
Atramentous necrosis (AN) is one of the few coral diseases with
high prevalence values on coastal GBR reefs (B. Willis and C. Page,
pers. comm. 2008). AN was first observed in December 2001 on
Magnetic Island, an inshore reef of the Central GBR [32], although
subsequently also observed on reefs in both the northern and
southern GBR (B. Willis and C. Page, pers. comm. 2008). In March
2002, a peak in AN causing significant mortality within Magnetic
Island populations of the plate-like coral Montipora aequituberculata
was observed during a thermal mass-bleaching event [32].
However, increased prevalence of AN was documented in spring
(temperature ,24.5uC), well before typical summer temperatures
were reached [33], suggesting that temperature may not be the only
environmental factor driving the occurrence of this disease.
AN progresses through four distinct stages: Stage 1 lesions are
small (1–2 cm diameter) areas of bleached but intact tissue; Stage
2 lesions are white skeleton devoid of tissue; Stage 3 lesions are
covered with a white bacterial film; and in Stage 4, a black,
sulphurous deposit accumulates under the white film [33] likely
the result of opportunistic secondary microbial community [34].
This is the first study to investigate a possible connection
between the seasonal dynamics of a coral disease and parameters
associated with water quality on the GBR. The aims of the present
study were to (i) document seasonal dynamics of AN and nine
seasonally varying environmental parameters, and (ii) analyse
relationships between disease prevalence and these parameters to
identify potential environmental drivers of AN within populations
of the coral Montipora aequituberculata on an inshore GBR reef.
Results
(a) Dynamics of atramentous necrosisAt the two study sites (Nelly and Geoffrey Bays, Magnetic
Island), a total of 379 colonies of Montipora aequituberculata showing
signs of atramentous necrosis (AN) were tagged during the two-
year study. The mean number of diseased corals was clearly higher
in the wet season than in the dry season (Fig. 1). Highest values of
both the mean number of AN cases and new disease cases
(incidence) were measured in the end of February in both 2008
and 2009 (Fig. 2a,b), although the disease peak was four-fold
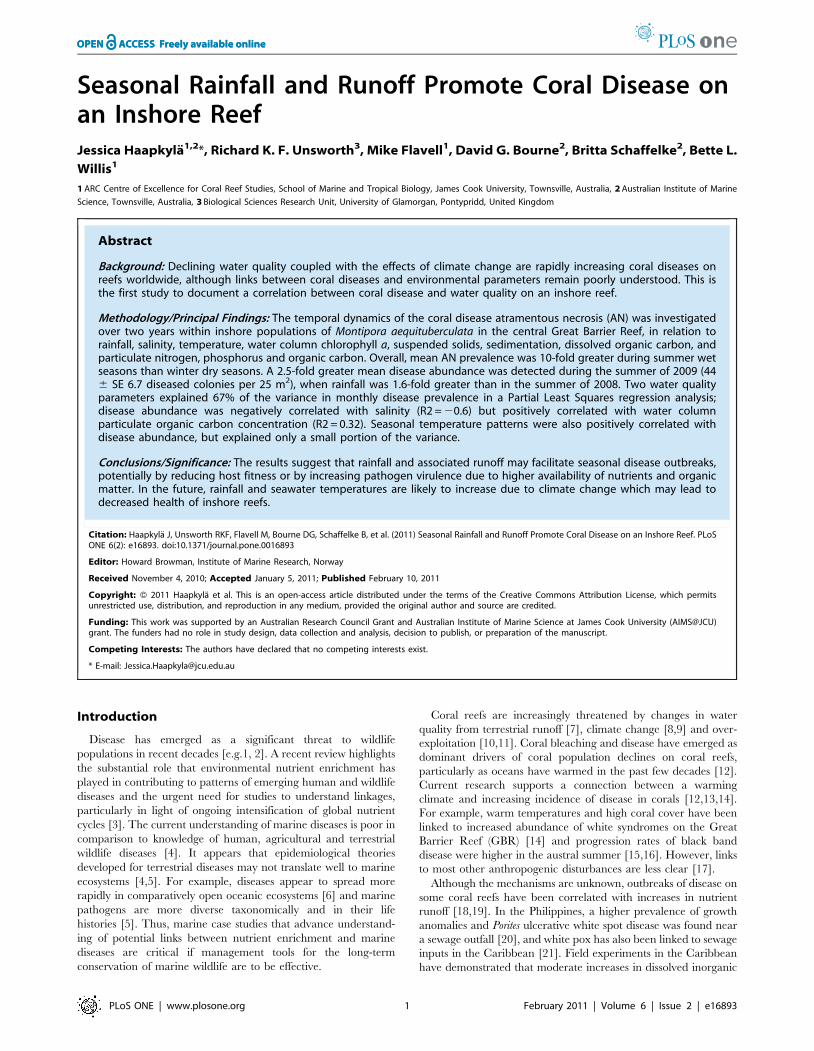
greater in 2009. In 2009, the mean (6SE) number of diseased
colonies was 4466.67 colonies per 25 m2 in Geoffrey Bay (GB)
and 4065.46 colonies per 25 m2 in Nelly Bay (NB), whereas in
Figure 1. A box plot illustrating the distribution of the mean numbers of diseased corals between two seasons. Vertical bars illustratestandard deviations and horizontal bars medians. Black dots represent the 95 percentiles.doi:10.1371/journal.pone.0016893.g001
Environmental Drivers of Coral Disease
PLoS ONE | www.plosone.org 2 February 2011 | Volume 6 | Issue 2 | e16893
2008, 1165.51 colonies were infected per 25 m2 in NB (Fig. 2a).
The mean (6SE) incidence (i.e. number of new infections) was also
higher in 2009, with 3564.04 new infections per 25 m2 in GB and
1964.18 per 25 m2 in NB, compared to only 664.51 new cases in
NB in 2008 (Fig. 2b). Disease abundance decreased to 0–2 cases
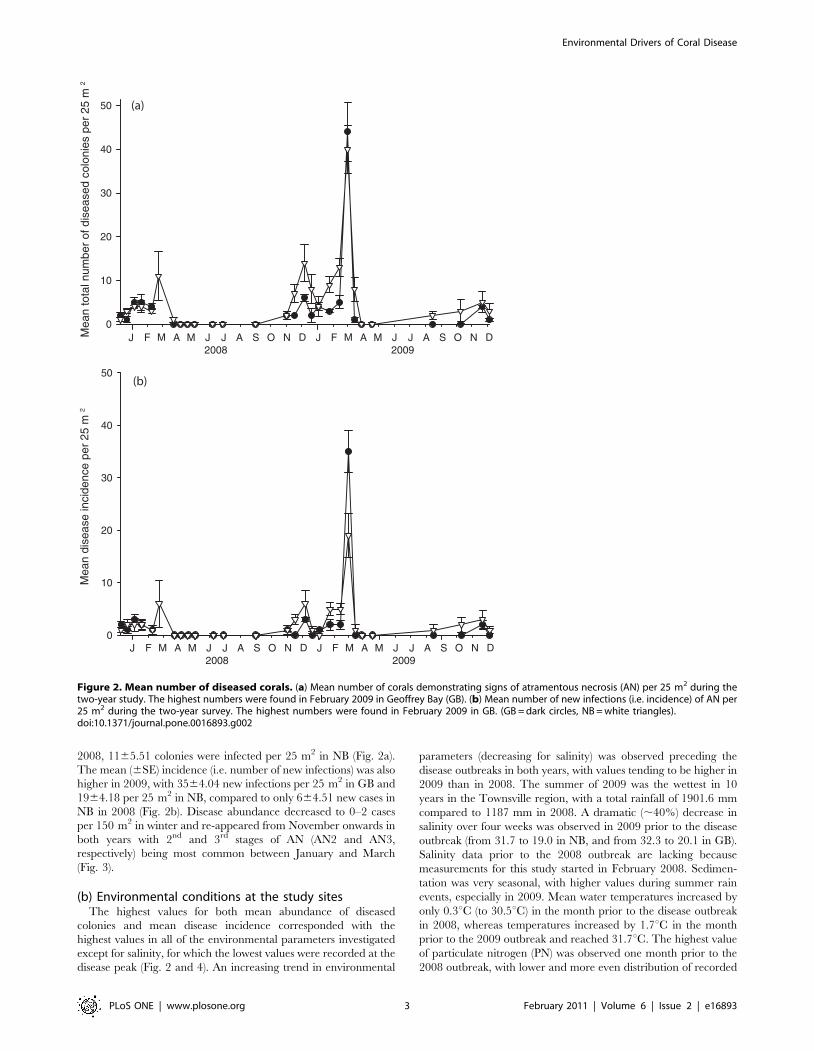
per 150 m2 in winter and re-appeared from November onwards in
both years with 2nd and 3rd stages of AN (AN2 and AN3,
respectively) being most common between January and March
(Fig. 3).
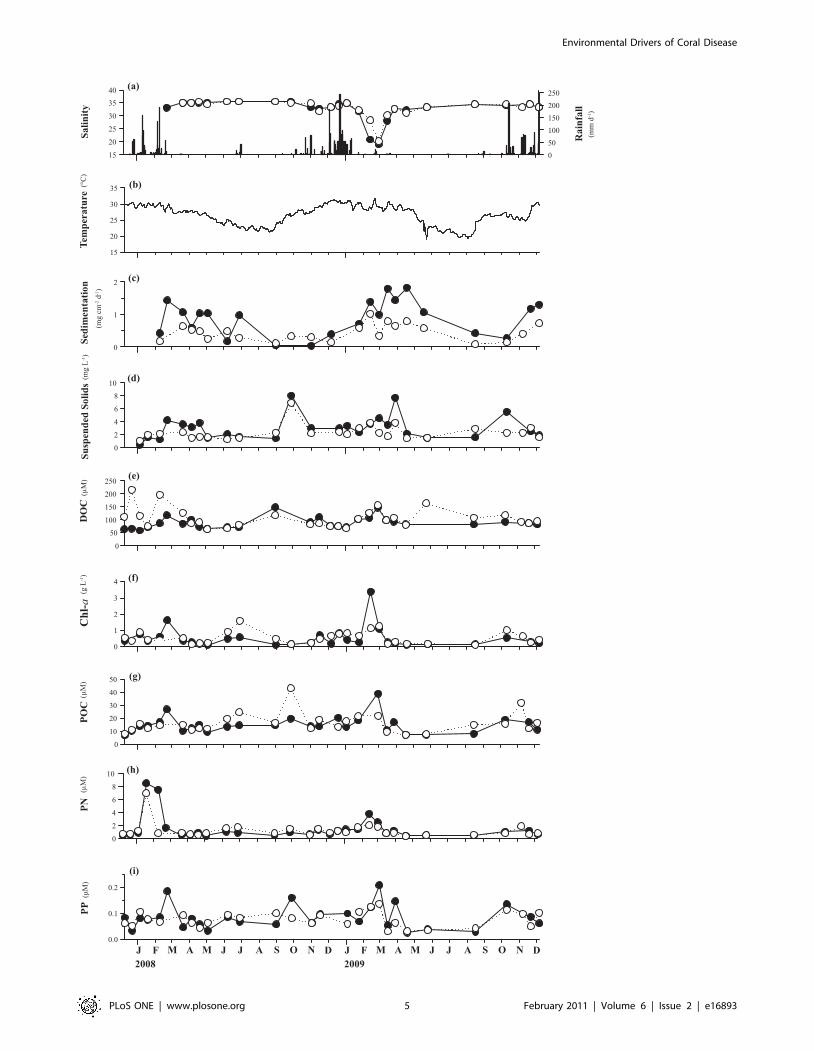
(b) Environmental conditions at the study sitesThe highest values for both mean abundance of diseased
colonies and mean disease incidence corresponded with the
highest values in all of the environmental parameters investigated
except for salinity, for which the lowest values were recorded at the
disease peak (Fig. 2 and 4). An increasing trend in environmental
parameters (decreasing for salinity) was observed preceding the
disease outbreaks in both years, with values tending to be higher in
2009 than in 2008. The summer of 2009 was the wettest in 10
years in the Townsville region, with a total rainfall of 1901.6 mm
compared to 1187 mm in 2008. A dramatic (,40%) decrease in
salinity over four weeks was observed in 2009 prior to the disease
outbreak (from 31.7 to 19.0 in NB, and from 32.3 to 20.1 in GB).
Salinity data prior to the 2008 outbreak are lacking because
measurements for this study started in February 2008. Sedimen-
tation was very seasonal, with higher values during summer rain
events, especially in 2009. Mean water temperatures increased by
only 0.3uC (to 30.5uC) in the month prior to the disease outbreak
in 2008, whereas temperatures increased by 1.7uC in the month
prior to the 2009 outbreak and reached 31.7uC. The highest value
of particulate nitrogen (PN) was observed one month prior to the
2008 outbreak, with lower and more even distribution of recorded
Figure 2. Mean number of diseased corals. (a) Mean number of corals demonstrating signs of atramentous necrosis (AN) per 25 m2 during thetwo-year study. The highest numbers were found in February 2009 in Geoffrey Bay (GB). (b) Mean number of new infections (i.e. incidence) of AN per25 m2 during the two-year survey. The highest numbers were found in February 2009 in GB. (GB = dark circles, NB = white triangles).doi:10.1371/journal.pone.0016893.g002
Environmental Drivers of Coral Disease
PLoS ONE | www.plosone.org 3 February 2011 | Volume 6 | Issue 2 | e16893
values in 2009. Particulate phosphorus (PP) showed 10-fold higher
values two weeks prior to the 2009 outbreak and particulate
organic carbon (POC) values were higher in 2009 than in 2008
(Fig. 4, Table 1).
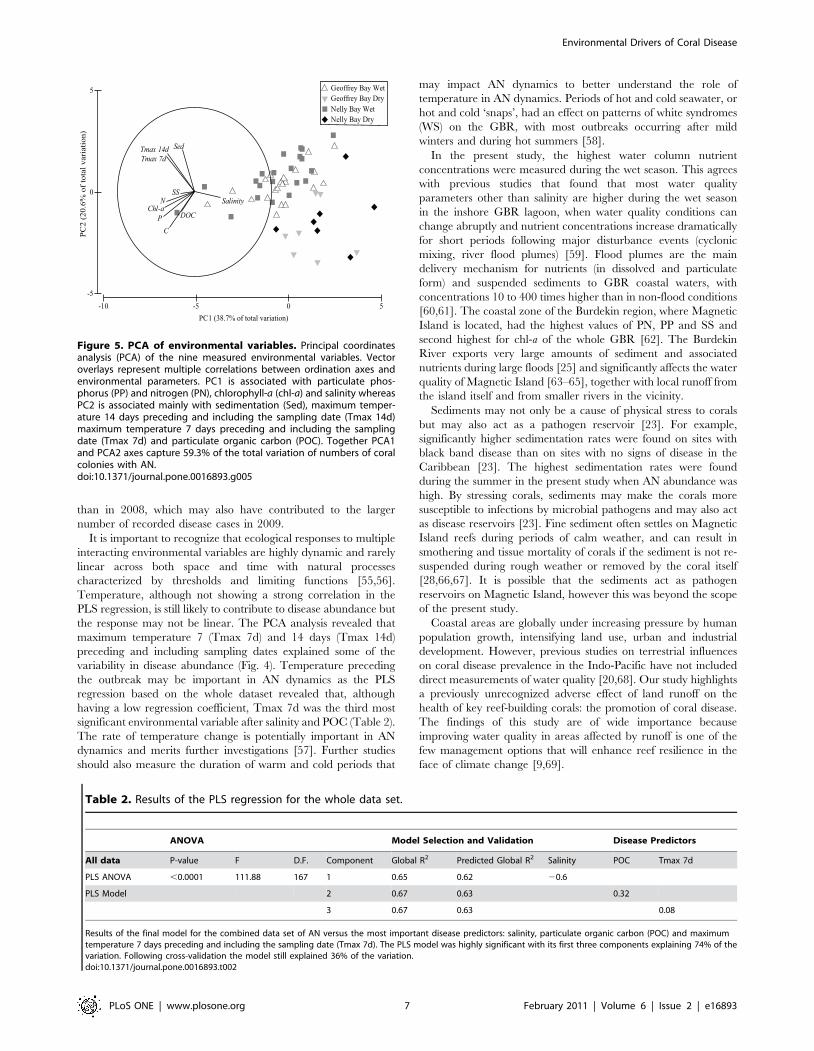
The exploratory multivariate ordination of the nine environ-
mental parameters in a principal coordinates analysis (PCA)
showed that some of the environmental variables were highly
correlated (Fig. 5). The first principal component, PC1, was
associated with water column concentrations of PP (eigenvalue
20.402), chlorophyll-a (chl-a; 20.382), PN (20.361) and salinity
(0.341). PC2 was associated with sedimentation (0.498), maximum
temperature 14 days preceding and including the sampling date
(Tmax 14d; 0.452), maximum temperature 7 days preceding and
including the sampling date (Tmax 7d; 0.423) and POC (20.417)
(Fig. 5). Together, PC1 and PC2 explained 59.3% of the total
variation in the data.
(c) PLS regressionIn the initial Partial Least Squares (PLS) regression model
containing all nine environmental variables, many of the variables
had low regression coefficients (R2) and hence were not good
predictors of the variance in the number of AN cases. These
predictors were therefore removed from the model in a stepwise
manner.
The variance associated with AN abundance in the PLS model
conducted using the combined datasets from both bays was
significantly related to salinity, POC and Tmax 7d
(F3,167 = 111.88, p,0.0001). More than 95% of the variance in
the model was found within its first component. The model
explained 67% of the variance within the first three components
(Global R2 = 0.67). Following cross-validation, the model for both
bays still explained 63% of the variation (predicted Global
R2 = 0.63). When the model was broken down to regression
coefficients, AN abundance was negatively correlated with salinity
(R2 = 20.6) and positively correlated with POC (R2 = 0.32) and
Tmax 7d (R2 = 0.08) (Table 2). The Durbin-Watson statistic was
1.39 indicating that there was no autocorrelation in the data set.
Discussion
As coastal human populations continue to increase, nutrients,
terrigenous silt, pollutants and even pathogens themselves can be
released to nearshore waters [35]. While the link between
anthropogenic stress and disease susceptibility is currently poorly
understood, it is thought that coral disease is facilitated by a
decrease in water quality [22]. Evidence of this exists from the
Caribbean [22,23,36] and the Philippines [20] and suggests that
anthropogenic stressors and coral disease are linked in complex
ways [35].
The present study documents a direct correlation between
temporal coral disease dynamics and environmental parameters
associated with water quality. The summer outbreaks of
atramentous necrosis corresponded to minima in seawater salinity
but maxima in all other water quality parameters investigated.
The disease was strongly and negatively correlated with salinity
and positively correlated with seawater concentrations of partic-
ulate organic carbon (POC).
The more pronounced AN outbreak in the summer of 2009
than in 2008 may be attributed to a greater terrestrial runoff
caused by higher rainfall and higher values for environmental
parameters (lower for salinity) preceding the outbreak in 2009.
This may have lead to increased stress on corals that may have
reduced their immune responses, and/or increased virulence of
pathogen(s) causing the disease. Decreased resistance of the host
coral caused by adverse environmental conditions may also
increase opportunistic diseases [37]. Intense wet seasons may
become more common in the future since strong rainfall events are
a likely scenario associated with climate change [38]. Rainfall may
be more variable from month to month, with longer dry spells and
possibly with an increased frequency of disturbance events such as
flooding rains and cyclones [39–42] which may lead to drastic
changes in inshore salinity levels.
While black band disease prevalence showed no relationship
with salinity in the Caribbean [43], the results of the present study
indicate that low salinity promoted AN outbreaks. In 2009, salinity
Figure 3. Disease stages in time. Disease stages in time per 150 m2 (AN1 = first stage of atramentous necrosis (AN) characterised by a small (1–2 cm diameter) initial area of bleached but intact tissue; AN2 = a lesion of white skeleton devoid of tissue; AN3 = lesions covered with a whitebacterial film and a black, sulphurous-smelling deposit, subsequently accumulating under the white film; S = disease progression stopped). The thirdstage was most common during the summer disease peak whereas the disease stopped in winter.doi:10.1371/journal.pone.0016893.g003
Environmental Drivers of Coral Disease
PLoS ONE | www.plosone.org 4 February 2011 | Volume 6 | Issue 2 | e16893
Environmental Drivers of Coral Disease
PLoS ONE | www.plosone.org 5 February 2011 | Volume 6 | Issue 2 | e16893
decreased in one month rapidly from above 30 to 20 in GB and to
19 in NB. Salinity measurements only commenced during the
2008 disease peak once this parameter was identified as a likely
driver of AN, therefore lower salinity values may have occurred in
the preceding weeks. Low salinity adversely affects corals [44] by
harming coral fertilization [45], by affecting the processes of
photosystem II [46] and, in extreme cases, by causing a
breakdown in coral-zooxanthellae symbiosis leading to coral
bleaching [47].
The role of POC in coral infections has not been investigated
previously; however, dissolved organic carbon (DOC) has been
linked to coral disease [24,48]. High levels of DOC increased the
growth rates of microbes and DOC was more detrimental to coral
health than nutrients (nitrate, phosphate, ammonia) [24]. The
authors suggested that there was a disruption in the balance
between the coral and its associated microbes, subsequently
shifting the microbial consortia resulting in disease. DOC
compounds released by macroalgae were found to increase
microbial activity [48]. These findings suggest that increasing
DOC levels associated with inputs of sewage and organic waste
from coastal development could contribute to the high incidence
of disease on highly polluted reefs [24]. In the present study, the
higher summer dissolved organic carbon (DOC) values could have
facilitated AN infections by increasing the growth rates of
microbes. High values of DOC and POC at the study sites were
likely associated with increased pelagic and benthic primary
production in the water after increased nutrient inputs following
heavy rainfall and runoff [49,50].
In the future, a combination of sea-level rise and an increase in
rainfall due to climate change [38] could synergistically alter
runoff and salinity in coastal ecosystems [51]. The duration and
intensity of the rainy season will be important factors in
determining the stress caused to corals since a long duration
could lead to chronic stress. Previous studies have concluded that
chronic stressors may be more harmful to corals than acute
stressors but their impact will depend on the period of exposure to
those stressors [52]. With the increasing probability of strong
rainfall events leading to increased runoff in the future, both low
salinity and high POC levels may lead to serious impacts on
inshore reefs. It is likely that most inshore reefs of the GBR are
heavily impacted by runoff during the wet season and that other
reefs with high Montipora cover may experience similar outbreaks
of AN like the ones on Magnetic Island. To date, no studies of how
runoff impacts other coral diseases and other coral genera have
been undertaken on the GBR and investigating this should be a
priority in coral disease research.
Previous studies have identified clear seasonal patterns related
particularly to warm temperatures for other coral diseases,
including white syndrome (WS) [14,53], black band disease
(BBD) [16], and ulcerative white spots [54] on the GBR, and
aspergillosis [13], white pox [21] and BBD [43] in the Caribbean.
Earlier studies on AN [32] documented an outbreak on reefs
around Magnetic Island when the water temperature was higher
than 31.5uC. In the present study, the water temperature was
31.7uC during the outbreak of 2009. In the month preceding the
outbreaks (Fig. 4, Table 1), temperature increased more in 2009
Figure 4. Temporal patterns in environmental variables. Temporal patterns in (a) salinity and rainfall, (b) daily mean sea water temperaturecombining temperatures from both bays, (c) ash-free dry weight of sediment (AFDW), (d) suspended solids (SS), (e) dissolved organic carbon (DOC), (f)chlorophyll a (chl-a), (g) particulate organic carbon (POC), (h) particulate nitrogen (PN), and (i) particulate phosphorus (PP) during the two-year studyin Nelly and Geoffrey Bays. Values represent means of two samples at each study site. (NB = dark circles, GB = white circles).doi:10.1371/journal.pone.0016893.g004
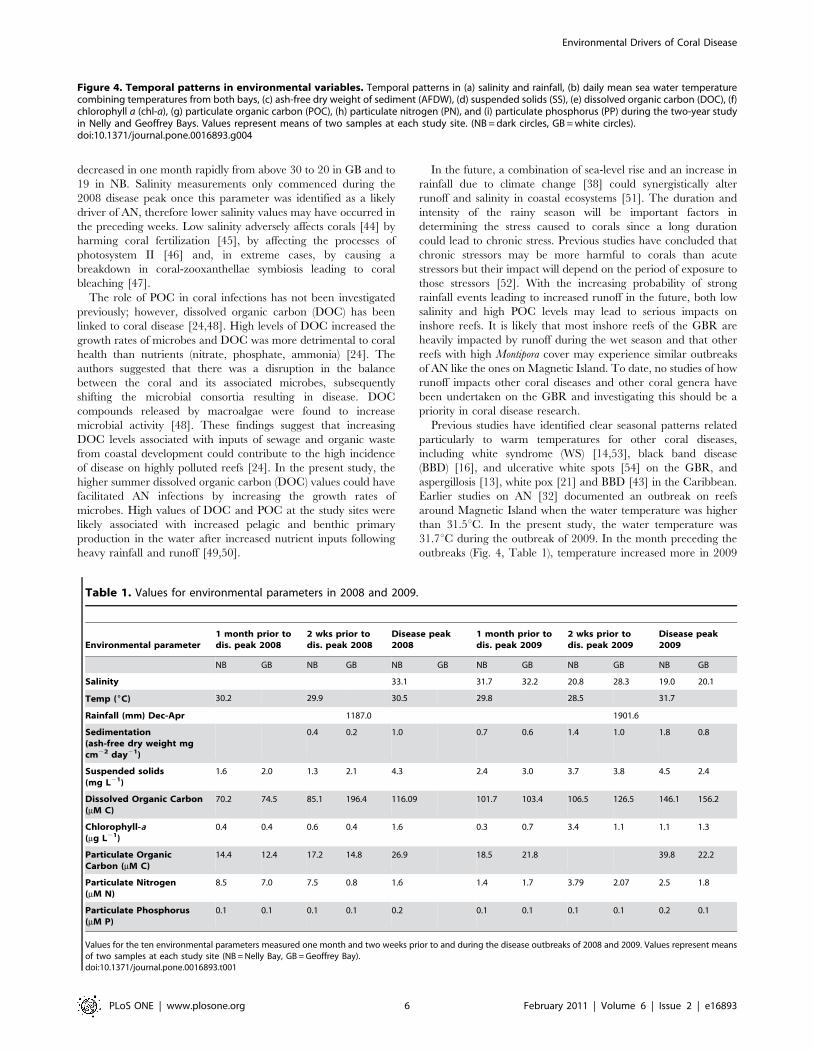
Table 1. Values for environmental parameters in 2008 and 2009.
Environmental parameter1 month prior todis. peak 2008
2 wks prior todis. peak 2008
Disease peak2008
1 month prior todis. peak 2009
2 wks prior todis. peak 2009
Disease peak2009
NB GB NB GB NB GB NB GB NB GB NB GB
Salinity 33.1 31.7 32.2 20.8 28.3 19.0 20.1
Temp (6C) 30.2 29.9 30.5 29.8 28.5 31.7
Rainfall (mm) Dec-Apr 1187.0 1901.6
Sedimentation(ash-free dry weight mgcm22 day21)
0.4 0.2 1.0 0.7 0.6 1.4 1.0 1.8 0.8
Suspended solids(mg L21)
1.6 2.0 1.3 2.1 4.3 2.4 3.0 3.7 3.8 4.5 2.4
Dissolved Organic Carbon(mM C)
70.2 74.5 85.1 196.4 116.09 101.7 103.4 106.5 126.5 146.1 156.2
Chlorophyll-a(mg L21)
0.4 0.4 0.6 0.4 1.6 0.3 0.7 3.4 1.1 1.1 1.3
Particulate OrganicCarbon (mM C)
14.4 12.4 17.2 14.8 26.9 18.5 21.8 39.8 22.2
Particulate Nitrogen(mM N)
8.5 7.0 7.5 0.8 1.6 1.4 1.7 3.79 2.07 2.5 1.8
Particulate Phosphorus(mM P)
0.1 0.1 0.1 0.1 0.2 0.1 0.1 0.1 0.1 0.2 0.1
Values for the ten environmental parameters measured one month and two weeks prior to and during the disease outbreaks of 2008 and 2009. Values represent meansof two samples at each study site (NB = Nelly Bay, GB = Geoffrey Bay).doi:10.1371/journal.pone.0016893.t001
Environmental Drivers of Coral Disease
PLoS ONE | www.plosone.org 6 February 2011 | Volume 6 | Issue 2 | e16893
than in 2008, which may also have contributed to the larger
number of recorded disease cases in 2009.
It is important to recognize that ecological responses to multiple
interacting environmental variables are highly dynamic and rarely
linear across both space and time with natural processes
characterized by thresholds and limiting functions [55,56].
Temperature, although not showing a strong correlation in the
PLS regression, is still likely to contribute to disease abundance but
the response may not be linear. The PCA analysis revealed that
maximum temperature 7 (Tmax 7d) and 14 days (Tmax 14d)
preceding and including sampling dates explained some of the
variability in disease abundance (Fig. 4). Temperature preceding
the outbreak may be important in AN dynamics as the PLS
regression based on the whole dataset revealed that, although
having a low regression coefficient, Tmax 7d was the third most
significant environmental variable after salinity and POC (Table 2).
The rate of temperature change is potentially important in AN
dynamics and merits further investigations [57]. Further studies
should also measure the duration of warm and cold periods that
may impact AN dynamics to better understand the role of
temperature in AN dynamics. Periods of hot and cold seawater, or
hot and cold ‘snaps’, had an effect on patterns of white syndromes
(WS) on the GBR, with most outbreaks occurring after mild
winters and during hot summers [58].
In the present study, the highest water column nutrient
concentrations were measured during the wet season. This agrees
with previous studies that found that most water quality
parameters other than salinity are higher during the wet season
in the inshore GBR lagoon, when water quality conditions can
change abruptly and nutrient concentrations increase dramatically
for short periods following major disturbance events (cyclonic
mixing, river flood plumes) [59]. Flood plumes are the main
delivery mechanism for nutrients (in dissolved and particulate
form) and suspended sediments to GBR coastal waters, with
concentrations 10 to 400 times higher than in non-flood conditions
[60,61]. The coastal zone of the Burdekin region, where Magnetic
Island is located, had the highest values of PN, PP and SS and
second highest for chl-a of the whole GBR [62]. The Burdekin
River exports very large amounts of sediment and associated
nutrients during large floods [25] and significantly affects the water
quality of Magnetic Island [63–65], together with local runoff from
the island itself and from smaller rivers in the vicinity.
Sediments may not only be a cause of physical stress to corals
but may also act as a pathogen reservoir [23]. For example,
significantly higher sedimentation rates were found on sites with
black band disease than on sites with no signs of disease in the
Caribbean [23]. The highest sedimentation rates were found
during the summer in the present study when AN abundance was
high. By stressing corals, sediments may make the corals more
susceptible to infections by microbial pathogens and may also act
as disease reservoirs [23]. Fine sediment often settles on Magnetic
Island reefs during periods of calm weather, and can result in
smothering and tissue mortality of corals if the sediment is not re-
suspended during rough weather or removed by the coral itself
[28,66,67]. It is possible that the sediments act as pathogen
reservoirs on Magnetic Island, however this was beyond the scope
of the present study.
Coastal areas are globally under increasing pressure by human
population growth, intensifying land use, urban and industrial
development. However, previous studies on terrestrial influences
on coral disease prevalence in the Indo-Pacific have not included
direct measurements of water quality [20,68]. Our study highlights
a previously unrecognized adverse effect of land runoff on the
health of key reef-building corals: the promotion of coral disease.
The findings of this study are of wide importance because
improving water quality in areas affected by runoff is one of the
few management options that will enhance reef resilience in the
face of climate change [9,69].
Figure 5. PCA of environmental variables. Principal coordinatesanalysis (PCA) of the nine measured environmental variables. Vectoroverlays represent multiple correlations between ordination axes andenvironmental parameters. PC1 is associated with particulate phos-phorus (PP) and nitrogen (PN), chlorophyll-a (chl-a) and salinity whereasPC2 is associated mainly with sedimentation (Sed), maximum temper-ature 14 days preceding and including the sampling date (Tmax 14d)maximum temperature 7 days preceding and including the samplingdate (Tmax 7d) and particulate organic carbon (POC). Together PCA1and PCA2 axes capture 59.3% of the total variation of numbers of coralcolonies with AN.doi:10.1371/journal.pone.0016893.g005
Table 2. Results of the PLS regression for the whole data set.
ANOVA Model Selection and Validation Disease Predictors
All data P-value F D.F. Component Global R2 Predicted Global R2 Salinity POC Tmax 7d
PLS ANOVA ,0.0001 111.88 167 1 0.65 0.62 20.6
PLS Model 2 0.67 0.63 0.32
3 0.67 0.63 0.08
Results of the final model for the combined data set of AN versus the most important disease predictors: salinity, particulate organic carbon (POC) and maximumtemperature 7 days preceding and including the sampling date (Tmax 7d). The PLS model was highly significant with its first three components explaining 74% of thevariation. Following cross-validation the model still explained 36% of the variation.doi:10.1371/journal.pone.0016893.t002
Environmental Drivers of Coral Disease
PLoS ONE | www.plosone.org 7 February 2011 | Volume 6 | Issue 2 | e16893

Methods
A research permit for this study was provided by the Great
Barrier Reef Marine Park Authority (GBRMPA).
(a) Study site and assessment of disease dynamicsThe study sites were located in two adjacent bays, Nelly Bay and
Geoffrey Bay, on the south-eastern side of Magnetic Island (19uS,
147uE), which is situated within the inner shelf region of the Great
Barrier Reef. Both bays have fringing coral reefs and are similar in
shape, physical structure, and hydrodynamic setting [70]. The
study was conducted between December 2007 and December
2009. Sampling was conducted every 2 weeks in the austral
summer (Nov-Apr) and once a month in the winter (May-Oct).
Increased sampling frequency in summer was based on the
hypothesis that AN increases with warm water temperatures
[32,33]. Disease dynamics were assessed in three permanent
565 m quadrats at 3–5 m depth at each site. Coral colonies
demonstrating signs of AN [33] were tagged with numbered
plastic tags attached to cable ties. Visual surveys were able to
clearly distinguish the four stages in the development of AN lesions
described above, although the last two stages were combined
because they generally occur simultaneously. Thus, in the present
study, the disease stages were referred to as: AN1 ( = stage 1), AN2
( = stage 2), AN3 ( = stages 3 and 4), and S ( = disease progression
stopped).
The diseased corals were all colonies of Montipora aequituberculata,
which was the most prevalent species of Montipora in the quadrats.
New disease cases (disease incidence) were counted and tagged in
each plot during each survey. New AN infections, in addition to
both lesion progression and cessation, were monitored on
individual colonies to elucidate spatiotemporal patterns in disease
dynamics. Due to logistical constraints, Geoffrey Bay was not
sampled in February 2008.
(b) Environmental parametersAt each sampling occasion, two replicate water samples were
collected in 1-L plastic bottles 1 m above the coral and on opposite
sides of the quadrats for the analysis of concentrations of: dissolved
organic carbon (DOC), chlorophyll a (chl-a), particulate organic
carbon (POC), particulate nitrogen (PN), particulate phosphorus
(PP) and suspended solids (SS). Due to logistical reasons, only two
replicate water samples were used. Three physical variables were
also measured, i.e. salinity, temperature and sedimentation.
DOC samples were filtered immediately through a 0.45 mm
syringe filter (Sartorius MiniSart N) into acid-washed, screw-cap
plastic test tubes. Samples were acidified by adding 100 ml of AR-
grade hydrochloric acid (32%) and stored at 4uC until analysis.
The concentrations were measured by high temperature combus-
tion (680uC), using a Shimadzu Total Organic Carbon TOC-
5000A carbon analyser. Prior to analysis, CO2 remaining in the
sample water was removed by sparging with O2 carrier gas [71].
For the chl-a analysis, a 100 ml sub-sample was filtered
immediately onto a 25 mm pre-combusted glass fibre filter
(Whatman GF/F). Filters were wrapped in pre-combusted
aluminium foil envelopes and stored at 218uC until analysis.
Chl-a concentrations were measured fluorometrically using a
Turner Designs 10AU fluorometer after grinding the filters in 90%
acetone [72].
For analyses of POC, PN and PP, sub-samples of 250 ml were
filtered onto 25 mm pre-combusted glass fibre filters (Whatman
GF/F) and stored at 218uC. PN was determined by high
temperature combustion using an ANTEK 9000 NS Nitrogen
Analyser [26]. PP was determined spectrophotometrically as
inorganic P (PO4, [73] after digestion in 5% potassium persulphate
[72]. POC was determined by high temperature combustion
(950uC) using a Shimadzu Total Organic Carbon TOC-V carbon
analyser fitted with a Solid Sample Module SSM-5000A after
acidification with concentrated phosphoric acid [71]. Inorganic C
on the filters (e.g. CaCO3) was removed by acidification of the
sample with 2M hydrochloric acid, the filter introduced into the
sample oven (950uC), purged of atmospheric CO2 and the
remaining organic carbon combusted in an oxygen stream and
quantified by an infrared gas analyser.
Sub-samples for suspended solids (SS) were collected by filtering
1000 mL of water onto pre-weighed, 0.4 mm, polycarbonate filters
(47 mm diameter, GE Water & Process Technologies), and SS
concentrations were determined gravimetrically from the weight
difference between loaded and unloaded filters after drying
overnight at 60uC [71].
Salinity was measured at each sampling occasion with a hand-
held refractometer (r2 Mini, Reichert GmbH, Germany). Tem-
perature was measured using a temperature logger (ODYSSEY
data recording systems, Christchurch, New Zealand) attached
underneath a sediment trap in both Nelly and Geoffrey bays. It
was retrieved and downloaded approximately every 2 months.
Temperature data from sensors were combined with data collected
by the Australian Institute of Marine Science (AIMS) sea surface
temperature monitoring program in the same two bays (data
available at http://www.aims.gov.au). Maximum temperatures
were calculated for the periods of 7 and 14 days up to and
including the sampling date.
Two sediment traps (40 cm high with a diameter of 10 cm) were
deployed 10 m apart close to the permanent 565 m quadrats at
each site. Traps were collected at every second sampling occasion
in the winter and on each occasion in the summer. After decanting
the seawater, the sediment was carefully transferred from the trap
into a polycarbonate sample jar using a wash bottle with seawater.
Salt in the samples was removed by adding distilled water, gently
mixing the sediment and discarding the supernatant after the
sediment had settled for a short time. This was repeated three
times. Sediment samples were dried at 60uC for at least 3 days
prior to determining their dry weight. The ash-free dry weight
(AFDW) of the sediment was determined after combusting the
sample at 450uC in a muffle furnace for 24 hours. The AFDW was
used as a coarse measure of the organic content of the sediment.
Rainfall data for Townsville were obtained from the Australian
Bureau of Meteorology web site (http://www.bom.gov.au).
(c) Statistical analysesRelationships between environmental parameters measured at
the field sites were explored using a principal coordinates analysis
(PCA) in PRIMER version 6.1.10 [75]. PCA results were
summarized in a bi-plot containing the distribution of environ-
mental parameters in two-dimensional space and their correlations
with the PCA axes.
To investigate potential relationships between environmental
parameters and AN prevalence in more detail, a Partial Least
Squares (PLS) regression model was developed in Minitab. This
technique is an extension of multiple regression analysis, in which
the effects of linear combinations of several predictors on a
response variable (or multiple response variables) are analyzed in a
stepwise manner to remove descriptive variables that do not
contribute to the model. PLS regression is particularly suited to
cases in which the matrix of predictors has more variables than
observations, or when there is multi-collinearity among variables
[76]. This technique was first used in analytical chemistry and has
been applied to analyses of ecological data since the late 1990s
Environmental Drivers of Coral Disease
PLoS ONE | www.plosone.org 8 February 2011 | Volume 6 | Issue 2 | e16893

[76] and in recent publications [77]. Monthly disease prevalence
data were analysed against maximum temperatures for the periods
of 7 and 14 days up to and including the sampling date, assuming
a time lag in the corals’ response to changing environmental
parameters. When observations were missing for temperature,
sedimentation, POC, PN, PP, chl-a, DOC and SS, mean values of
data before and after the missing data point were used to fill data
gaps to be able to run the PLS regression. The PLS analysis
calculates an analysis of variance table analogous to conventional
multiple regression analysis, providing an overall assessment of the
probability of statistical significance of the calculated PLS model.
The PLS analysis also calculated a predicted residual sum of
squares (PRESS) following cross-validation. This allowed for the
calculation of a predicted Global R2 value in addition to a
conventional Global R2, hence determining the predictive power
of the observed relationship. A predicted Global R2 value lower
than the conventional Global R2 indicates that the model is
dependent upon only a few observations and does not have good
predictive power.
Acknowledgments
We are very grateful for the field assistance provided by numerous
volunteers and thank Margaret Wright, Michele Skuza and Stephen Boyle
from the AIMS water quality team for analyzing the water samples. We
would like to thank Barbara Trattner and Christian Lechner from the X-
Base Backpackers on Magnetic Island for support during fieldwork. Jessica
Melbourne-Thomas kindly assisted in the multivariate analysis.
Author Contributions
Conceived and designed the experiments: JH DB BS BW. Performed the
experiments: JH MF. Analyzed the data: JH RKFU. Contributed
reagents/materials/analysis tools: BS BW. Wrote the paper: JH RKFU
DB BS BW. Editing figures: MF DB.
References
1. Daszak P, Cunningham AA, Hyatt AD (2000) Emerging infectious diseases of
wildlife: threats to biodiversity and human health. Science 287: 443–449.
2. Dobson A, Foufopoulos J (2001) Emerging infectious pathogens of wildlife. Phil
Trans R Soc B 356: 1001–1012.
3. Johnson PTJ, Townsend AR, Cleveland CC, Glibert PM, Howarth RW, et al.
(2010) Linking environmental nutrient enrichment and disease emergence in
humans and wildlife. Ecol Appl 20: 16–29.
4. Harvell CD (2004) Ecology and evolution of host-pathogen interactions in
nature. Am Nat 164: S1–S5.
5. McCallum H, Kuris A, Harvell CD, Porter J, Lafferty K (2004) Does terrestrial
epidemiology apply to marine systems? Trends in Ecology & Evolution 19:585–591.
6. McCallum H, Harvell CD, Dobson A (2003) Rates of spread of marinepathogens. Ecol Lett 6: 1062–1067.
7. De’ath G, Fabricius KE (2010) Water quality as a regional driver of coralbiodiversity and macroalgae on the Great Barrier Reef. Ecol Appl 10: 840–850.
8. Hoegh-Guldberg O, Mumby PJ, Hooten AJ, Steneck RS, Greenfield P, et al.
(2007) Coral Reefs Under Rapid Climate Change and Ocean Acidification.Science 318: 1737–1742.
9. Veron JEN, Hoegh-Guldberg O, Lenton TM, Lough JM, Obura DO, et al.(2009) The coral reef crisis: The critical importance of ,350ppm CO2. Mar Poll
Bull 58: 1428–1436.
10. Jackson JBC, Kirby MX, Berger WH, Bjorndal KA, Botsford LW, et al. (2001)
Historical overfishing and the recent collapse of coastal ecosystems. Science 293:629–638.
11. Unsworth RKF, Cullen L (2010) Recognising the necessity for Indo-Pacificseagrass conservation. Conservation Letters 00: 1–11.
12. Harvell CD, Mitchell CE, Ward JR, Altizer S, Dobson AP, et al. (2002) Climate
Warming and Disease Risks for Terrestrial and Marine Biota. Science 296:2158–2162.
13. Harvell CD, Kim K, Quirolo C, Weir J, Smith G (2001) Coral bleaching anddisease: contributors to 1998 mass mortality in Briareum asbestinum (Octocorallia,
Gorgonacea). Hydrobiologia 460: 97–104.
14. Bruno JF, Selig ER, Casey KS, Page CA, Willis BL, et al. (2007) Thermal stress
and coral cover as drivers of coral disease outbreaks. PLoS Biol 5: 1220–1227.(DOI: 10.1371/journal.pbio.0050124).
15. Boyett HV, Bourne DG, Willis BL (2007) Elevated temperature and light
enhance progression and spread of black band disease on staghorn corals of theGreat Barrier Reef. Mar Biol 151: 1711–1720.
16. Sato Y, Bourne DG, Willis BL (2009) Dynamics of seasonal outbreaks of blackband disease in an assemblage of Montipora species at Pelorus Island (Great
Barrier Reef, Australia). Proc R Soc B 27: 2795–2803. (DOI: 10.1098/rspb.2009.0481).
17. Bruckner AW (2002) Priorities for the effective management of coral diseases.NOAA technical memorandum. Silver Springs, Maryland.
18. Kim K, Harvell CD (2002) Aspergillosis of sea fan corals: dynamics in theFlorida Keys. In: Porter JW, Porter KG, eds. The Everglades, Florida bay, and
coral reefs of the Florida Keys: an ecosystem sourcebook. Boca Raton: CRC
Press. pp 813–824.
19. Sutherland KP, Porter JW, Torres C (2004) Disease and immunity in Caribbean
and Indo-Pacific zooxanthellate corals. Mar Ecol Prog Ser 266: 273–302.
20. Kaczmarsky LT (2006) Coral disease dynamics in the central Philippines. Dis
Aquat Org 69: 9–21.
21. Patterson KL, Porter JW, Ritchie KB, Polson SW, Mueller E, et al. (2002) The
etiology of white pox, a lethal disease of the Caribbean Elkhorn coral, Acropora
palmata. Proc Nat Ac Sci USA 99: 8725–8730.
22. Bruno JF, Petes LE, Harvell CD, Hettinger A (2003) Nutrient enrichment can
increase the severity of coral diseases. Ecol Lett 6: 1056–1061.
23. Voss JD, Richardson LL (2006) Coral diseases near Lee Stocking Island,
Bahamas: patterns and potential drivers. Dis Aquat Org 69: 33–40.
24. Kline DI, Kuntz NM, Breitbart M, Knowlton N, Rohwer F (2006) Role of
elevated organic carbon levels and microbial activity in coral mortality. Mar
Ecol Prog Ser 314: 119–125.
25. Furnas M (2003) Catchment and corals: terrestrial runoff to the Great Barrier
Reef. Townsville: Australian Institute of Marine Science. 334 p.
26. Devlin M, Schaffelke B (2009) Spatial extent of riverine flood plumes and
exposure of marine ecosystems in the Tully coastal region, Great Barrier Reef.
Mar Freshwater Res 60: 1109–1122.
27. Brodie J, Mitchell A (2005) Nutrients in Australian tropical rivers: changes with
agricultural development and implications for receiving environments. Mar
Freshwater Res 56: 279–302. (DOI: 10.1071/MF04081).
28. Fabricius KE (2005) Effects of terrestrial runoff on the ecology of corals and
coral reefs: review and synthesis. Mar Poll Bull 50: 125–146. (DOI: 10.1016/
J.MARPOLBUL.2004.11.028).
29. Schaffelke B, Mellors J, Duke NC (2005) Water quality in the Great Barrier Reef
region: responses of mangrove, seagrass and macroalgal communities. Mar Poll
Bull 51: 279–296. (DOI: 10.1016/J.MARPOLBUL.2004.10.025).
30. Maughan M, Brodie J, Waterhouse J (2008) What river impacts this reef? A
simple exposure model. In: Lambert M, Daniell T, Leonard M, eds. Proceedings
of Water Down Under 2008, incorporating 31st Hydrology and Water
Resources Symposium and 4th International Conference on Water Resources
and Environment Research, Adelaide, 14–17 April 2008 Adelaide, Australia. pp
1912–1923.
31. McCulloch M, Fallon S, Wyndham T, Hendy E, Lough JM, et al. (2003) Coral
record of increased sediment flux to the inner Great Barrier Reef since European
settlement. Nature 421: 727–730.
32. Jones RJ, Bowyer J, Hoegh-Guldberg O, Blackall LL (2004) Dynamics of a
temperature-related coral disease outbreak. Mar Ecol Prog Ser 281: 63–77.
33. Anthony SL, Page CA, Bourne DG, Willis BL (2008) Newly characterized
distinct phases of the coral disease ‘atramentous necrosis’ on the Great Barrier
Reef. Dis Aquat Org 81: 255–259. (DOI: 10.3354/dao01962).
34. Bourne DG (2005) Microbiological assessment of a disease outbreak on corals
from Magnetic Island (Great Barrier Reef, Australia). Coral Reefs 24: 304–312.
35. Harvell CD, Jordan-Dahlgren E, Merkel S, Rosenberg E, Raymundo L, et al.
(2007) Coral disease, environmental drivers, and the balance between coral and
microbial associates. Oceanography 20: 172–195.
36. Kaczmarsky LT, Draud M, Williams EH (2005) Is there a relationship between
proximity to sewage effluent and the prevalence of coral disease? Carribean
Journal of Science 41: 124–137.
37. Harvell CD, Kim K, Burkholder JM, Colwell RR, Epstein PR, et al. (1999)
Emerging marine diseases – climate links and anthropogenic factors. Science
285: 1505–10.
38. Trenberth KE (1998) Atmospheric moisture residence times and cycling:
implications for rainfall rates with climate change. Climatic Change 39:
667–694.
39. Easterling DR, Evans JL, Groisman PY, Karl TR, Kunkel KE, et al. (2000)
Observed variability and trends in extreme climate events: a brief overview.
Bulletin of the American Meteorological Society 81: 417–425.
40. Walsh KJE, Ryan BF (2000) Tropical cyclone intensity increase near Australia as
a result of climate change. J Climate 13: 3029–3036.
41. Milly PCD, Wetherald RT, Dunne KA, Delworth TL (2002) Increasing risk of
great floods in a changing climate. Nature 415: 514–517. (doi: 10.1038/
415514a).
42. Palmer TN, Raianen J (2002) Quantifying the risk of extreme seasonal
precipitation events in a changing climate. Nature 415: 512–514.
Environmental Drivers of Coral Disease
PLoS ONE | www.plosone.org 9 February 2011 | Volume 6 | Issue 2 | e16893
43. Kuta KG, Richardson LL (2002) Ecological aspects of black band disease of
corals: relationships between disease prevalence and environmental factors.Coral Reefs 21: 393–398.
44. Veron JEN (2008) Mass extinctions and ocean acidification: biological
constraints on geological dilemmas. Coral Reefs 27: 459–472.45. Humphrey C, Weber M, Lott C, Cooper T, Fabricius K (2008) Effect of
suspended sediments, dissolved inorganic nutriens and salinity on fertilizationand embryo development in the coral Acropora millepora (Ehrenberg, 1834). Coral
Reefs 27: 837–850.
46. Chartrand KM, Durako MJ, Blum JE (2009) Effect of hyposalinity on thephotophysiology of Siderastrea radians. Mar Biol 156: 1691–1702. (DOI: 10.1007/
s00227-009-1204-3).47. DeVantier LM, Turak E, Done TJ, Davidson J (1997) The effects of cyclone
Sadie on coral communities of nearshore reefs in the central Great Barrier Reef.Cylone Sadie flood plumes in the GBR: composition and consequences,
Workshop series Great Barrier Reef Marine Park Authority, No. 22, Townsville,
Qld: Great Barrier Marine Park Authority. pp 65–88.48. Smith JE, Shaw M, Edwards RA, Obura D, Pantos O, et al. (2006) Indirect
effects of algae on coral: Algae-mediated, microbe-induced coral mortality. EcolLett 9: 835–845.
49. Alongi DM, McKinnon AD (2005) The cycling and fate of terrestrially-derived
sediments and nutrients in the coastal zone of the Great Barrier Reef shelf. MarPoll Bull 51: 239–252.
50. Furnas M, Mitchell A, Skuza M, Brodie JE (2005) In the other 90%:phytoplankton responses to enhanced nutrient availability in the GBR lagoon.
Mar Poll Bull 51: 253–265.51. Sokolow S (2009) Effects of a changing climate on the dynamics of coral
infectious disease: a review of the evidence. Dis Aquat Org 87: 5–18.
52. Kuntz NM, Kline DI, Sandin SA, Rohwer F (2005) Pathologies and mortalityrates caused by organic carbon and nutrient stressors in three Caribbean coral
species. Mar Ecol Prog Ser 294: 173–180.53. Willis BL, Page CA, Dinsdale EA (2004) Coral disease on the Great Barrier
Reef. In: Rosenberg E, Loya Y, eds. Coral health and disease. Heidelberg,
Germany: Springer. pp 69–104.54. Haapkyla J, Melbourne-Thomas J, Flavell M, Willis BL (2010) Spatiotemporal
patterns of coral disease prevalence on Heron Island, Great Barrier Reef,Australia. Coral Reefs (DOI: 10.1007s00338010-0660-z).
55. Farnsworth E (1998) Issues of spatial, taxonomic and temporal scale indelineating links between mangrove diversity and ecosystem function. Global
Ecol Biogeogr 7: 15–25.
56. Koch EW, Barbier EB, Silliman BR, Reed DJ, Perillo GME (2009) Non-linearity in ecosystem services: temporal and spatial variability in coastal
protection. Front Ecol Environ 7: 29–37. (DOI: 10.1890/080126).57. Lonergan C (2006) Atramentous necrosis coral disease on Magnetic Island.
Townsville, Australia: Master’s thesis James Cook University. 120 p.
58. Heron SF, Willis BL, Skirving WJ, Eakin CM, Page CA, et al. (2010) Summerhot snaps and winter conditions: modelling white syndrome outbreaks on Great
Barrier Reef corals. PLoS One 5(8): e12210. (DOI: 10.1371/journal.pone.0012210.
59. Schaffelke B, Thompson A, Carleton J, De’ath G, Feather G, et al. (2007) Waterquality and ecosystem monitoring programme: reef water quality protection plan
- final report. TownsvilleQld: Australian Institute of Marine Science. 196 p.
60. Devlin M, Waterhouse J, Taylor J, Brodie J (2001) Flood plumes in the GreatBarrier Reef: spatial and temporal patterns in composition and distribution.
Research Publication No. 68. TownsvilleQld: Great Barrier Reef Marine Park
Authority.
61. Devlin MJ, Brodie J (2005) Terrestrial discharge into the Great Barrier Reef
Lagoon: nutrient behavior in coastal waters. Mar Poll Bull 51: 9–22.
62. De’ath G, Fabricius KE (2008) Water Quality of the Great Barrier Reef:
Distributions, Effects on Reef Biota and Trigger Values for the Protection of
Ecosystem Health. Research Publication No. 89. TownsvilleQld: Great Barrier
Reef Marine Park Authority.
63. Wolanski E, van Senden D (1983) Mixing Burdekin River flood waters in the
Great Barrier Reef. Aust J Mar Fresh Res 34: 49–63.
64. King B, McAllister F, Wolanski E, Done T, Spagnol S (2001) River plume
dynamics in the Central Great Barrier Reef. In: Wolanski E, ed. Coral Reef
Processes: Physics-Biology links in the Great Barrier Reef. Boca Raton: CRC
Press. pp 145–160.
65. King B, Zapata M, McAllister F, Wolanski E, Done T (2002) Modelling the
distribution of river plumes in the central and northern Great Barrier Reef shelf.
Technical report No. 44. TownsvilleQld: CRC Reef Research Centre.
66. Roy KJ, Smith SV (1971) Sedimentation and coral reef development in turbid
water: Fanning lagoon. Pac Sci 25: 234–248.
67. Rogers C (1983) Sub-lethal and lethal effects of sediments applied to common
Caribbean reef corals in the field. Mar Poll Bull 14: 378–382.
68. Page CA, Willis BL (2006) Distribution, host range and large-scale spatial
variability in black band disease prevalence on the Great Barrier Reef, Australia.
Dis Aquat Org 69: 41–51.
69. Bellwood DR, Hughes TP, Folke C, Nystrom M (2004) Confronting the coral
reef crisis. Nature 429: 827–833.
70. Larcombe P, Ridd PV, Prytz A, Wilson B (1995) Factors controlling suspended
sediment on inner-shelf coral reefs, Townsville, Australia. Coral Reefs 14:
163–171.
71. Reef & Rainforest Research Centre Ltd (2010) Reef Rescue Marine Monitoring
Program: Quality Assurance/Quality Control Methods and Procedures Manual.
Report prepared for the Great Barrier Reef Marine Park Authority. Reef &
Rainforest Research Centre Ltd, Cairns, 85 p. Available at http://www.rrrc.org.
au/mmp/mmp_pubs.html.
72. Furnas MJ, Mitchell AW, Skuza M (1995) Nitrogen and Phosphorus Budgets for
the Central Great Barrier Reef Shelf. Research Publication No. 36. Town-
svilleQld: Great Barrier Reef Marine Park Authority.
73. Parsons TR, Maita Y, Lalli CM (1984) A Manual of Chemical and Biological
Methods for SeawaterAnalysis, Oxford: Pergamon Press.
74. Underwood AJ (1997) Experiments in ecology: their logical design and
interpretation using analysis of variance. Cambridge: Cambridge University
Press.
75. Clarke KR, Warwick RM (1994) Change in Marine Communities: An
Approach to Statistical Analysis and Interpretation. 1st edition: Plymouth
Marine Laboratory, Plymouth, UK, 144 p. 2nd edition: PRIMER-E, Plymouth,
UK 172.
76. Carrascal LM, Galvan I, Gordo O (2009) Partial least squares regression as an
alternative to current regression methods used in ecology. Oikos 118: 681–690.
(DOI: 10.1111/j.1600-0706.2008.16881.x).
77. Rasheed MA, Unsworth RKF (2011) Long term climate associated dynamics of
a tropical seagrass meadow: implications for the future. Mar Ecol Prog Ser In
Press (doi: 10.3354/meps08925).
Environmental Drivers of Coral Disease
PLoS ONE | www.plosone.org 10 February 2011 | Volume 6 | Issue 2 | e16893