Movement behaviour of three South African inshore sparid ...
127
Movement behaviour of three South African inshore sparid species in rocky intertidal and shallow subtidal habitats Submitted in fulfilment of the requirements for the degree of Master of Science of Rhodes University, Grahamstown, South Africa By Peter Andrew Watt-Pringle August 2009
-
Upload
khangminh22 -
Category
Documents
-
view
0 -
download
0
Transcript of Movement behaviour of three South African inshore sparid ...

Movement behaviour of three South African inshore sparid species
in rocky intertidal and shallow subtidal habitats
Submitted in fulfilment of the requirements
for the degree of Master of Science of Rhodes University,
Grahamstown, South Africa
By
Peter Andrew Watt-Pringle
August 2009

Abstract
i
Abstract
This study investigated the movement behaviour of three inshore South African sparids –
blacktail (Diplodus sargus capensis), zebra (Diplodus cervinus hottentotus) and white
musselcracker (Sparodon durbanensis), popular inshore fishery species caught in appreciable
numbers along much of the South African coast. The first study component examined
movements of juveniles in a rocky intertidal nursery area at Schoenmakerskop near Port
Elizabeth. Juveniles in a single gully were tagged with Visible Implant Elastomer (VIE) and
resighted at the study site on snorkelling gear over a seven-month period. Tagged zebra and
musselcracker displayed limited movement between potential low tide refuges, being
observed repeatedly in the same gully over the full duration of the study. However, blacktail
displayed greater movements and were seen infrequently in the later period of the study,
probably having undergone an ontogenetic habitat shift to subtidal areas. There was evidence
that blacktail maintain use of their intertidal nursery over high tide, during which the other
two species moved into shallower areas adjacent to their low tide refuge.
The results of three national tagging programs were analysed to determine the movement
patterns of adolescent and adult fishes. The coast-wide ORI-WWF National Voluntary
Tagging Program and two dedicated research programs in marine protected areas (MPAs) at
De Hoop MPA and Tsitsikamma National Park (TNP) recorded few large-scale movements of
tagged adult blacktail, zebra and juvenile musselcracker. High spatial-resolution data from
the TNP suggested movements were usually on scales far smaller than one km. Together with
long periods at liberty for many recaptured individuals, this suggests these fishes are long-
term residents of small home range areas. However, tagged musselcracker over 600 mm fork-
length (adults) were observed to make large-scale movements, including some in excess of
800 km from Eastern Cape to KwaZulu-Natal waters. Predominantly eastward movements of
adults recaptured during the spawning season indicate seasonal spawning migrations that
occur in different regions of the coast. These enable the use of prevailing oceanographic
currents to disperse eggs and larvae to suitable rocky nursery habitat.

Abstract
ii
The third component of this study made use of high-resolution data on the temporal and
spatial distribution of catches by scientific angling in the TNP to examine the daily activity
patterns of the study species in relation to diel and tidal cycles, and habitat use. Blacktail
capture probability was correlated with the diurnal light cycle, with peaks close to twilight
suggesting elevated crepuscular foraging activity. Catches of blacktail, zebra and small
musselcracker were correlated with the tidal cycle, foraging peaking over high tide periods.
All three species used shallow inshore habitats extensively for foraging, blacktail showing a
preference for sandy areas, while zebra and small musselcracker preferred shallow reef.
Capture probability of larger musselcracker, however, was unrelated to habitat, possibly
evidence of increasing area and habitat use with an ontogenetic change in diet.
The lifetime movement patterns of these three species are discussed in relation to
conservation measures and their management in South African fisheries. Restricted
movement throughout post-settlement life for blacktail and zebra, and during the juvenile
phase for musselcracker, makes local populations vulnerable to overexploitation. At present,
MPAs probably play an important role in protecting local blacktail and zebra populations
from overexploitation, and limited post-settlement movements mean the degree of larval
dispersal between protected and adjacent areas will likely determine the effectiveness of
MPAs in enhancing fisheries for these species. By contrast, MPAs likely provide recruits to
fisheries for musselcracker during ontogenetic movements and dispersal from MPAs during
spawning migrations. MPAs only offer partial protection to adult musselcracker populations
in the spawning season, but this could nevertheless be significant under high levels of
exploitation.

Table of contents
iii
Table of contents
Abstract………………………………………………………………………………………..i
Acknowledgements ................................................................................................................... v
Chapter 1 - Introduction
1.1 Fish movement behaviour ................................................................................................. 1
1.2 Management of South African linefisheries ...................................................................... 2
1.3 Study species ..................................................................................................................... 3
1.3.1 Blacktail ............................................................................................................. 3
1.3.2 Zebra ................................................................................................................... 5
1.3.3 White musselcracker .......................................................................................... 6
1.4 Purpose of the present study .............................................................................................. 7
1.5 Thesis outline .................................................................................................................... 7
Chapter 2 – Methods and study sites
2.1 Methods for the study of fish movement behaviour ......................................................... 9
2.2 General methods and geographic location of the present study ...................................... 11
2.2.1 South African coastal marine environments and oceanography ......................... 11
2.3 Study components and sites ............................................................................................ 14
2.3.1 Movements of juvenile fishes ............................................................................. 14
2.3.2 Movements of larger fishes ................................................................................. 16
2.3.3 Study sites ........................................................................................................... 18
Chapter 3 - Movement of juveniles between low tide refuges in a rocky intertidal
nursery area
3.1 Introduction ..................................................................................................................... 21
3.2 Methods ........................................................................................................................... 22
3.2.1 Study site ............................................................................................................. 22
3.2.2 Experimental design ............................................................................................ 22
3.2.3 Tagging ................................................................................................................ 22
3.2.4 Movement observations ...................................................................................... 24
3.2.5 Water temperature ............................................................................................... 24
3.3 Results ............................................................................................................................. 25
3.3.1 Capture and tagging of fishes .............................................................................. 25
3.3.2 Survey effort ........................................................................................................ 25
3.3.3 Water temperatures at the study site ................................................................... 25
3.3.4 Observations of tagged fishes ............................................................................. 26
3.4 Discussion ....................................................................................................................... 30

Table of contents
iv
Chapter 4 - Movement patterns inferred from long-term tagging programs
4.1 Introduction ..................................................................................................................... 35
4.2 Methods ........................................................................................................................... 36
4.2.1 Fish tagging and tag recoveries ........................................................................... 36
4.2.2 Movement calculations and analysis ................................................................... 39
4.3 Results ............................................................................................................................. 41
4.3.1 Blacktail .............................................................................................................. 41
4.3.2 Zebra .................................................................................................................... 44
4.3.3 Musselcracker ...................................................................................................... 47
4.4 Discussion ....................................................................................................................... 52
Chapter 5 - Foraging activity and habitat-use patterns inferred from research angling
data
5.1 Introduction ..................................................................................................................... 59
5.2 Methods ........................................................................................................................... 60
5.2.1 Angling activities ................................................................................................ 60
5.2.2 Diurnal and tidal cycles ....................................................................................... 61
5.2.3 Habitat classification ........................................................................................... 62
5.2.4 Size-classes .......................................................................................................... 62
5.2.5 Season and water temperature ............................................................................. 62
5.2.6 Additional data preparation ................................................................................. 63
5.2.7 Statistical analysis ............................................................................................... 63
5.3 Results ............................................................................................................................. 66
5.3.1 Habitat classification ........................................................................................... 66
5.3.2 Capture probabilities ........................................................................................... 68
5.4 Discussion ....................................................................................................................... 76
Chapter 6 – General discussion ............................................................................................. 81
Appendix 1 – Tsitsikamma National Park research angling localities .............................. 92
References ............................................................................................................................. 93

Acknowledgements
v
Acknowledgements
I would like to thank my family – Mom, Dad, Rowan and Tim, for all their love and support
always. I love you all very much. I’d also like to say a big thank you to all of my friends,
particularly at the DIFS in Grahamstown, for their friendship and help over the past few
years. My supervisor, Paul Cowley, provided ample expertise during the undertaking of this
study. His patience in putting up with many late (or never-arriving!) and hopelessly verbose
submissions of chapters has been exemplary, and his enthusiasm for the subject of fish
conservation, ecology and behaviour has been greatly appreciated. Thanks Paul! In addition,
I would like to thank the following persons/institutions for their help over the course of this
study:
The Tsitsikamma anglers spent many long hours collecting data on fish movements and
behaviour – I hope this does your efforts justice! Also thanks to Bern Mackenzie and Warren
Potts for their discussion of the Tsitsikamma study site. In the same vein, thanks to all
anglers that contributed tagging or recovery data to the ORI and De Hoop tagging programs,
and therefore contributed in no small manner to this study. Dr Colin Attwood (UCT) and
Bruce Mann (ORI) are thanked for providing me with data from the De Hoop and ORI
tagging programs, respectively. A big thank you must go to all who assisted me with
practical- and field-work during this study – in particular Jessica Escobar-Porras, Russell
Chalmers, Kyle Smith, Lloyd Gillespie and Niall Vine, who gave considerable amounts of
their energy and time – cheers! Thanks to Ali Götz for his help with the Tsitsikamma tagging
database, and showing me how to ‘perform’ GLM’s! Margie Shaw’s help at the SAIAB
library is much appreciated. Mrs Ronel Gouws is thanked for providing hospitable
accommodation at Schoenies B ‘n B during my sampling trips. During the initial stages of
this study Prof Warwick Sauer provided me with free accommodation at his house in
Rebelsrus for fieldwork and this is appreciated. I would also like to thank Andrea
Bernatzeder for her generosity. My tuition and personal bursary was generously provided by
the South African Institute for Aquatic Biodiversity, with a big thanks to Dr Alan Whitfield,
who helped arranged this. Thank you also to the Rhodes University Joint Research
Commission, who provided project running expenses and conference attendance funding.
Lastly, I’d like to thank all the artists who recorded the music that kept me company (and
awake!) on many a late night at the office!

Chapter 1: Introduction
1
Chapter 1 - Introduction
1.1 Fish movement behaviour
Organism abundance changes in space and time with the addition of new individuals through
reproduction, loss due to death, and with displacement (movement). Individual and
population movements are thus an important component of their ecology and how they
interact with their environment. Fish are generally highly mobile animals capable of a wide
range of movement behaviours. They are important members of any aquatic ecosystem, as
consumers and/or food sources at all levels of food webs (Power 1990, Polunin & Pinnegar
2002), and agents of environmental change. This can be through physical alteration of their
environment (e.g. creation of coral sand by parrotfish (Scaridae; Ogden & Buckman 1973) or
through energy transfer between areas or habitats (e.g. ontogenetic shifts between distinct
habitats; Nagelkerken & Van Der Velde 2006). Fish movements govern where and when
these processes occur.
Fish movements can be described at various levels, ranging from individuals of solitary
species, groups of gregarious species to functional groups at the population level that include
successive ontogenetic life-history stages, stocks separated on spatial or temporal scales, or
entire populations. At a particular level, movements may be characterised in terms of their
direction, distance, duration and purpose. These can be on scales ranging from small daily
movements within a restricted home range or over successive tidal cycles, to large seasonal
inter-ocean migrations or nomadic wandering of individuals. Directed movements of fish are
determined by one or more of the following over a range of temporal scales: (i) food
availability, (ii) habitat providing suitable shelter, (iii) reproductive activities, (iv)
physiologically desirable conditions, (v) evasion of predators or competitors, or (vi) defence
of territory. Dingle (1996), describes movement behaviour of organisms in general in his
“taxonomy of movement”, which dichotomises as three categories, namely (i) home range or
resource directed movements (stasis, station keeping and ranging), (ii) movement not directly
responsive to home range or resources (migration) and (iii) movement not under control of the
organism (accidental displacement).

Chapter 1: Introduction
2
Knowledge of the movements of exploited fishery resources is essential for effective fisheries
management. However, management actions often fail to consider a stock’s location both in
space and time, and how this may affect its exploitation. Many exploited marine species
occupy spatially distinct areas at different stages of their lives (e.g. nursery areas or spawning
sites) that may result in greater vulnerability during these periods and require specific
management actions. Large movements of highly mobile species may take them successively
into areas under separate governance, necessitating transboundary cooperation between
nations for their effective management. Conversely, restricted movements of certain species
require management on more localised, area-specific scales. Additionally, movements of
many fishes impact populations of other species, affecting their physical distribution and
abundance and/or recruitment success (Connell 1998, Koster & Mollman 2000), and thus
need to be considered in holistic management actions. Knowledge of fish movements is
especially important to the use of no-take Marine Protected Areas (MPAs) implemented to
conserve ecosystem integrity, populations of particular species or to enhance fisheries
(Kramer & Chapman 1999). Fish cannot be adequately protected if they do not spend
sufficient time within a MPA, determined by their movement patterns, to reduce their chances
of capture. Conversely, movement across a MPA boundary is required for significant
enhancement of adjacent exploited populations via larval export, ontogenetic shifts or density-
dependent movements from protected populations (Gell & Roberts 2003).
1.2 Management of South African linefisheries
South Africa has a history of overexploitation of populations of marine linefish species
targeted in commercial and recreational fisheries. Output (bag- and size-limits) and input
(closed seasons) control measures are deemed ineffective because of poor enforcement, or the
regulations themselves not being limiting (Griffiths et al. 1999). The South African Marine
Living Resources Act of 1998 called for long-term management plans for all exploited
species, including Operational Management Plans (OMPs) specifying a set of clearly defined
decision rules for management action to be taken if necessary upon assessment of the
resource. The resultant Linefish Management Protocol (LMP) for each species defines (i) the
type of data required to assess the stock, (ii) the quantitative approach to be utilised, (iii)
appropriate biological reference points, (iv) long-term goals for the stock and (v) management
actions to be taken to achieve these goals (Griffiths et al. 1999). Whilst output controls are
still important in LMPs, the use of no-take MPAs is viewed as an effective complimentary
input management measure.

Chapter 1: Introduction
3
Currently, MPAs are probably the most effective form of management for long-lived species
exposed to intensive pressure by recreational fishermen along the South African coast
(Attwood et al. 1997a,b). In South Africa, where the rate of human-on-human crime and
poverty-alleviation are a major focus of government resource allocation, enforcement of
fisheries regulations is under-funded and under-staffed. Prosecution rates in courts already
full to capacity and fines for transgressors are insufficient to promote adherence to
regulations. Consequently, MPAs may be particularly effective in this situation as it is easier
to control fishing activities through area closure than monitoring compliance of individual
anglers.
1.3 Study species
Blacktail (Diplodus sargus capensis), zebra (Diplodus cervinus hottentotus) and white
musselcracker (Sparodon durbanensis) are three sympatric South African sparid (seabream)
species that are major constituents of South Africa’s temperate and subtropical inshore marine
ichthyofauna. Typical of many South African sparids, the study species are long-lived
(maximum age over 20 years), are confined to shallow inshore habitats and exploited
throughout their distribution along the South African coast (Buxton & Clarke 1991, Mann &
Buxton 1997). While subsistence and recreational fishermen target blacktail and zebra
mainly as food, white musselcracker also constitutes an important trophy target due to its
large size, particularly among spearfishermen (Mann et al. 1997). Although commonly
captured in many regions of the South African coast, catches of blacktail and musselcracker
have reportedly declined in certain areas (Booth 2000, Mann 2000c, Brouwer & Buxton
2002). Aspects of the basic biology of the three study species and further details on their
utilisation in South African fisheries are summarised below.
1.3.1 Blacktail
Blacktail (Diplodus sargus capensis) occurs along the entire South African coast and
extralimitally to northern Namibia and Mozambique (Heemstra & Heemstra 2004), and is
considered a subspecies of D. sargus, which occurs as several subspecies from the
Mediterranean around Africa to the Red Sea and Middle-East (www.fishbase.org). There
appears to be some taxonomic confusion as regards its status, Heemstra & Heemstra (2004)
referring to the South African form as D. capensis and mentioning possible differentiation
into further species at the western and eastern edges of its Southern African distribution.

Chapter 1: Introduction
4
It seems pertinent to regard the Southern African subspecies (or species) as a population
distinct from the other subspecies occurring further north on both African shores and in the
Mediterranean. Blacktail attain a maximum size of 450 mm FL, mass of 3 kg and age of over
20 years (Mann & Buxton 1997) and are a ubiquitous species generally found in shallow,
inshore marine habitats less than 15 metres deep (Mann 1992), although reportedly occurring
to depths of 40 metres (Heemstra & Heemstra 2004). Postflexion larval blacktail recruit into
sheltered rocky bays in large numbers (Strydom 2008) and developing juveniles utilise
shallow marine environments such as intertidal rockpools and gullies (Beckley 1982, 1985,
Smale & Buxton 1989), sandy beach surf zones (Lasiak 1981, Bennett 1989) and the lower
reaches of estuaries (Beckley 1983, Ter Morshuisen & Whitfield 1994) as nursery areas.
Larger fish occur in loosely aggregated shoals over most rocky bottom habitats, but are also
found in sandy areas (Lasiak 1984, Clark et al. 1996), particularly along the sand-reef
interface (R. Bennett & K. Smith, Department of Ichthyology & Fisheries Science, Rhodes
University, pers. comm.). They also enter estuaries and rocky intertidal gullies and are
associated with areas exposed to high wave action and turbulence in the breaker-zone, their
strong swimming ability allowing negotiation of the rough conditions.
Juvenile blacktail are exclusively carnivorous but a change in dentition with age results in
more vegetable matter being ingested (Christensen 1978). Adults consume a variety of
invertebrate prey, as well as macrophytes ingested incidentally to epiphytic diatoms (Joubert
& Hanekom 1980, Coetzee 1986, Mann & Buxton 1992). Blacktail are partial protandrous
hermaphrodites, females developing either directly from the immature phase or alternatively
from functional males – but not all male individuals change sex (Mann 1992, Mann & Buxton
1998). Fifty percent of juveniles three years old (approximately 210 mm FL in length) are
sexually mature (Mann & Buxton 1998) and the spawning season varies slightly in timing and
duration on different sections of the South African coast. Mann & Buxton (1998) reported the
spawning season runs from August to March on the Tsitsikamma coast, while Coetzee (1986)
suggested it occurs from October to December further east off St Croix Island in Algoa Bay,
and Joubert (1981) found spawning from July to September off KwaZulu-Natal. Blacktail is
one of the most regularly caught fish species along the South African coast. In most studies
of marine recreational shore anglers’ catches made in South Africa to date (apart from in
northern KwaZulu-Natal) blacktail has occurred in the top five species in terms of abundance
(e.g. Coetzee et al. 1989, Bennett 1991, Brouwer et al. 1997).

Chapter 1: Introduction
5
It is similarly in the top two species by number caught by scientific shore angling in both the
De Hoop Marine Protected Area and Tsitsikamma National Park (Bennett & Attwood 1991,
1993, Cowley et al. 2002). Larger individuals are also occasionally shot by spearfishermen
(van der Elst 1990).
1.3.2 Zebra
Zebra (Diplodus cervinus hottentotus) belongs to the same genus as blacktail, and is in certain
respects similar to it. It has a similar Southern African distribution to blacktail and the local
subspecies is also regarded as distinct. Elsewhere, other D. cervinus subspecies occur from
the Mediterranean Sea to north of Southern Africa (www.fishbase.org). Heemstra and
Heemstra (2004) refer to the southern African form as D. hottentotus, and it could in future be
regarded as a separate species. Zebra are found in a number of shallow nearshore marine
habitats along the South African coast, although they range to greater depths than blacktail,
commonly occuring to a depth of 25 metres (Mann 1992) and reaching depths in excess of
100 metres in certain areas (Heemstra & Heemstra 2004). Adult zebra attain a maximum
length of about 590 mm FL, mass of 6 kg and age of 33 years (Mann & Buxton 1997).
Juveniles are recorded from shallow Zostera (seagrass) beds and other habitat in estuaries, but
their major nursery area is intertidal rockpools and gullies (Beckley 1982, 1985, Smale &
Buxton 1989). Although subadults regularly enter the lower reaches of estuaries (Whitfield
1998), adults appear confined to rocky reef habitats, where larger individuals are associated
with high relief and rugosity (Mann 1992, Smith 2005). Adults are solitary, while subadults
and juveniles are commonly found together in small groups or associated with groups of
blacktail (Mann 1992).
Juvenile zebra have a carnivorous diet of copepods and other small animals similar to that of
juvenile blacktail (Christensen 1978, Mann & Buxton 1992) but with ontogenetic
development the diet becomes more specialised and polychaete worms become the dominant
prey, especially those found in association with stands of redbait (Pyura stolonifera) (Mann
1992). Zebra spawn in summer, with reproductively active individuals recorded from August
to December on the Tsitsikamma coast (Mann & Buxton 1998). Unlike blacktail, this species
is regarded as a functional gonochorist (rudimentary hermaphrodite capable of developing
into either sex from the immature state), and assumed to spawn as pairs matched in size in
spawning aggregations over shallow reefs throughout its distribution (Mann 2000b).

Chapter 1: Introduction
6
Zebra contribute far less to catches of South African recreational fishermen than blacktail, but
catches are regular and the species can form a significant proportion of catches in many areas
(Bennett & Attwood 1993). It makes good eating and, reaching a larger size than blacktail, is
also targeted in some areas by spearfishermen (van der Elst 1990).
1.3.3 White musselcracker
White musselcracker (Sparodon durbanensis), hereafter referred to as musselcracker, is an
endemic South African species occurring from St Helena Bay to central KwaZulu-Natal
(Booth 2000) in shallow inshore habitats. In contrast to the Diplodus species, musselcracker
can attain a length greater than 1000 mm FL, and mass of 23.5 kg (Buxton & Clarke 1991).
Juvenile musselcracker utilise intertidal rockpools (Beckley 1982, 1985, 1988) and gullies
(Smale & Buxton 1989) as nursery areas and larger juveniles and subadults are found over
shallow reefs (Buxton & Clarke 1991). Juveniles are usually found singly, but may also
associate as small conspecific groups (pers. obs.). This appears to be carried through into
adult life with adults occurring as single individuals or in small groups for most of the year
(Schoeman & Schoeman 1990). Although recorded from the lower reaches of some estuaries,
adult fish are usually associated with rocky substrates (Heemstra & Heemstra 2004) where
their favoured prey occurs. They are commonly found in exposed areas, even in shallow
water in the surf zone, but also occur to depths of at least 30m (Clarke 1988). Juveniles prey
on a variety of small intertidal organisms (Buxton & Clarke 1991), but from around 400 mm
FL they possess specialised crushing dentition and powerful jaws enabling consumption of a
wide variety of larger invertebrate prey such as molluscs, gastropods and the ascidian species
redbait (Pyura stolonifera).
Like zebra, musselcracker are also rudimentary hermaphrodites. During the spawning season
in spring and summer (September to January; Buxton & Clarke 1991) aggregations of mature
individuals occur (Clarke 1988, van Rooyen 1988). These aggregations are suggested to be
involved in reproductive activity (Schoeman, publishing date unknown), with a spawning
migration to KwaZulu-Natal reportedly taking place (Booth 2000). Musselcracker are an
important component of South African recreational fisheries, their large size and powerful
‘fighting ability’ making them a desirable trophy target for shore anglers and spearfishermen
alike. Angler surveys have shown musselcracker to be a major target of fishermen in some
regions (Mackenzie 2005) and during particular periods (Clarke & Buxton 1989).

Chapter 1: Introduction
7
Whilst this species is less important numerically than species such as blacktail and galjoen
(Dichistius capensis), in terms of biomass it contributes disproportionately to overall catches
due to its larger size (e.g. Pradervand & Hiseman 2006). There is some evidence to suggest a
decline in catches from historical levels in the Port Elizabeth area (Brouwer & Buxton 2002)
and historical heavy targeting on breeding aggregations appears to have reduced catches at
well-known musselcracker angling localities such as Mossel Bay substantially (Schoeman,
publishing date unknown).
1.4 Purpose of the present study
The aim of this study was to describe movement patterns of blacktail, zebra and
musselcracker on the South African coast, while its specific objectives were as follows:
i. Investigate how movement patterns change with ontogeny by quantifying these for
juvenile and adult fishes;
ii. Describe movement patterns of individuals along the South African coast at small
(local) and large (regional) spatial scales;
iii. Examine movements related to daily (diel and tidal foraging/activity patterns) and
seasonal (reproductive activity) cycles if apparent;
iv. Utilise knowledge of post-settlement movement patterns to make
recommendations for management of these species and future research directions.
1.5 Thesis outline
Contents of the various chapters in this thesis are outlined below:
• Chapter 1 describes fish movement behaviour in general and its importance from an
ecological and fisheries management perspective. The three study species are
introduced, their exploitation in South African fisheries discussed and the study aims
stated.

Chapter 1: Introduction
8
• Chapter 2 provides a general introduction to the methods of studying marine fish
movement behaviour and describes the study sites relating to the data chapters that
follow, including a description of South African nearshore marine environments and
general oceanographic patterns.
• Chapter 3 describes movement behaviour of juveniles of the three study species in
rocky intertidal nursery habitat at Schoenmakerskop on the Eastern Cape coast.
Results are presented for individuals tagged and resighted at the study site over a
seven-month period.
• Chapter 4 describes subadult and adult fish movements recorded by long-term tagging
studies in two South African MPAs – the Tsitsikamma National Park and De Hoop
MPA, as well as from the ORI-WWF National Voluntary Tagging Program. The two
MPA studies provide recapture and movement data at a fine- and medium-scale
resolution, respectively, whilst the ORI dataset provides information on a coast-wide
scale.
• Chapter 5 analyses scientific angling catches from long-term monitoring of protected
populations of the study species in the TNP to examine habitat use and associated diel
and tidally-related activity patterns.
• Chapter 6 integrates results and conclusions from Chapters 3-5 in terms of the
management of the study species from a conservation and fisheries management
perspective. Future research related to their movement behaviour and requiring
further study is discussed.

Chapter 2: Methods and study sites
9
Chapter 2 – Methods and study sites
2.1 Methods for the study of fish movement behaviour
Aquatic environments, especially marine habitats, present numerous challenges to the study
of fish movement behaviour due to the impracticalities of observing fish underwater.
Technological advances (e.g. SCUBA and Remotely Operated Vehicles) have increased
potential observation times, but these are still far less than in movement studies on terrestrial
animals. Traditionally, knowledge of marine fish movement patterns has been gathered from
observations of fish above the sea surface, such as capture localities in fishing activities (e.g.
Biden 1948). Movement patterns are inferred from the variation in catches over spatial and
temporal scales. Traditional knowledge of these has been transferred between generations of
fishermen and forms the basis for successful targeting of many exploited species. To
accurately quantify movement patterns, however, numerous scientific studies have been
conducted on marine fishes. These generally utilise some method of discriminating between
individuals or groups, through the application of identifiable marks (tags) recognisable upon
recovery of the fish (e.g. Moran et al. 2003, Brouwer et al. 2003). Movements of identifiable
individuals between successive recoveries are thus revealed; with data on a sufficient number
of individuals inferences can be made about movement behaviour at the population level.
Simple external tags identifiable above water (i.e. upon capture) are currently the predominant
tagging method in fish movement studies, as their application and detection is easy and
inexpensive, allowing unique tagging of many individuals.
Numerous forms of external tags exist for fishes (Emery & Wydowski 1987), but normally
consist of a subdermally attached tag protruding from the body of the fish and bearing a
unique identification code (e.g. plastic ‘dart’ or ‘spaghetti’ tags). Because they are by design
easily recognisable and interpretable, external tags allow reporting by the fishery and public
of tag recoveries, resulting in potentially greater geographical coverage. However, tag loss
(Fabrizio et al. 1999), potential negative effects on fish health and behaviour (Thorstad et al.
2004, Griffiths & Attwood 2005) and high levels of recovery under-reporting (Matlock 1981,
Brouwer 1997) may counteract these benefits. Alternatives to classic tag-release-recapture
techniques make repeated observations of tagged individuals’ positions to study short-term
movement patterns. Unique external marks identify individuals to underwater observers, but
use is limited by tag loss, practical constraints on observation time and observer-effected fish
behaviour (Kulbicki 1998).

Chapter 2: Methods and study sites
10
Nevertheless, a number of studies have successfully utilised methods such as freeze-branding
(Zeller & Russ 2000) and subdermally-placed dyes (Bell & Kramer 2000) or polymers
(Visible Implant Elastomer tagging - e.g. Annese & Kingsford 2005) to identify individual
fishes in order to study their movements. The latter two methods combine advantages of
external tagging methods (ease of detection) with those of internal tagging systems (improved
tag retention – see below), as they are placed wholly within the fish’s body but remain visible
to observers. Internal tags generally have superior tag retention rates to external tags because
they are protected from the external environment, but visual tag recognition is usually
impossible because the tag is obscured by body tissue. Examples include passive integrated
transponder- (Bruyndoncx et al. 2002) and coded wire tags (Buckley 1994), which currently
require expensive and/or cumbersome equipment for tag identification.
A number of studies have, however, made use of internal tags in the marine environment to
remotely track movements of fish through acoustic telemetry (e.g. Zeller 1997, Eristhee &
Oxenford 2001, Kaunda-Arara & Rose 2004). The implanted acoustic tag emits a signal of
particular frequency identifying the fish and its position, determined by a hydrophone
operated from above or beneath the water surface. Permanent ‘listening’ stations that detect
tagged individuals passing within range can also record positions remotely and arrays of these
can be established in particular layouts depending on the location and type of movement
behaviour under study (Kerwath et al. 2007b, Childs et al. 2008). However, telemetry is
prohibitively expensive for many studies and sea conditions can affect the accuracy of
measurements and practicality of data collection, and expose sensitive equipment to
environmental damage or destruction. Tag battery life and practical survey area size also
limit telemetry studies. Recent technological advances have resulted in the development and
use of archival data-storage tags (ADSTs) in movement studies on large marine animals,
including some fish species (Domeier et al. 2005, Neuenfeldt et al. 2007). Environmental
sensors in ADSTs measure ambient conditions at preset time intervals and write these to tag
memory. Recorded temperature, depth and timing of light intensity changes (as a proxy for
latitude and longitude) experienced by the fish over time enable its movements to be
calculated. Data are obtained either upon recovery of the tag or uploading of stored data from
the tag to a satellite when it is exposed above water. This occurs when the fish surfaces, or
tags can be programmed to detach and float to the surface after a predetermined period (pop-
up satellite tags; Gunn & Block 2001).

Chapter 2: Methods and study sites
11
Archival systems are presently limited to large-bodied fishes due to tag size, and are
expensive, but offer high-quality data for highly mobile fishes over scales beyond the scope
of telemetry studies.
2.2 General methods and geographic location of the present study
None of the aforementioned methods is all-encompassing in terms of data collected and
practical feasibility, and use of a particular technique is normally a trade-off between data
requirements and practical or financial constraints.
Historically, long-term data sets on fish movements have utilised simple external tags, which
even under low recovery rates provide data on many individuals because of the sheer numbers
tagged and available for recapture. The Oceanographic Research Institute’s (ORI) National
Voluntary Tagging Program (van der Elst & Bullen 1993) has recorded movements of fishes
along the South African coastline since the early 1980’s. This project and two subsidiary
scientific tagging programs in South African MPAs utilise relatively low-cost tags, applied by
volunteers and researchers and recovered over a wide geographic area, to gather data for
many fish species, including the three that are the focus of the present study. Recapture data
on subadult and adult fishes tagged in the three programs were analysed, and a dedicated
tagging study undertaken to examine movements of juvenile fishes in intertidal nursery areas.
Below, an introduction to the South African coastal environment as a general background to
later discussion, as well as descriptions of the study sites where the various study components
were located, is presented. Details on research methods employed for each component are
provided in the individual data chapters.
2.2.1 South African coastal marine environments and oceanography
South Africa has a coastline bordered by both the Atlantic and Indian Oceans, extending
approximately 3500 km (Figure 2.1). Two major current systems, the Benguela and Agulhas
Currents, are located off the west and east coasts, respectively. The Benguela Current flows
north along the continental land mass under the control of wind-driven processes (Kamstra
1985) and is characterised by cold, nutrient-rich upwelling that supports high levels of
primary production in the nearshore environment (Branch & Branch 1981). In contrast, the
Agulhas Current flows southeast along South Africa’s east coast from north of the
subcontinent, being driven by the Earth’s rotation and the associated Coriolis Force as Indian
Ocean water meets the continental landmass on the western edge of its basin.

Chapter 2: Methods and study sites
12
It is thus typical of a Western Boundary Current system (Lutjeharms 2006). It transports
warm tropical water southwards, and even though located some distance offshore has a major
influence on the nearshore environment of the South African east coast, whose waters are
warmer relative to those of similar latitude on the west coast.
Figure 2.1. Map of South Africa, showing the locations of major current systems and
associated inshore bioregions on the continental shelf.
The exact location where the two current systems converge varies, but generally the coast
west of Cape Point is regarded as Benguela-dominated and the coast east of Cape Agulhas as
Agulhas-dominated, with the area between impacted by both. As water temperature is a
major factor in the distribution of marine organisms (e.g. Rogers & Millner 1996), the
contrasting temperature regimes of the two currents significantly affect nearshore marine
ecosystems, with different species assemblages corresponding to prevailing temperatures in
areas under their influence.

Chapter 2: Methods and study sites
13
As mentioned above, the Benguela current provides cold, nutrient-rich water to the adjacent
nearshore environment and this supports highly productive foodwebs off the west coast,
characterised by high biomass but relatively few species (Branch & Branch 1981).
Off the northern section of the east coast, the continental shelf is only a few kilometres in
width (Lutjeharms 2006) and the adjacent Agulhas Current exerts an overriding influence on
the nearshore environment, warm waters allowing the formation of diverse tropical coral reef
ecosystems in the northern stretches and subtropical reef systems further south. South of East
London (33º2'S, 27º55'E), however, the continental shelf width broadens, reducing the effect
of the current on nearshore waters. Here, more temperate ecosystems are found. South and
west of Algoa Bay, the continental shelf is wide and shallow in the area known as the Agulhas
Banks, the shelf break lying 240 km from shore at its widest extent (Lutjeharms 2006). The
Agulhas Current flow tracks the path of the shelf break away from shore and has even less
influence on the nearshore environment along this stretch of the coast, here more strongly
influenced by coastline topography and resulting features such as localised wind-driven
upwelling (Schumann 1999) and coastal trapped waves (Schumann & Brink 1990). This
temperate region is characterised by high levels of endemicity for many taxa (Turpie et al.
2000).
South African marine areas have been categorised as comprising biogeographic provinces (or
bioregions) based on their characteristic faunal communities, which can be seen to generally
follow the pattern of influence of the Benguela and Agulhas currents (Sink et al. 2004, Figure
2.1). Associated oceanographic conditions not only shape faunal distributions, but also in
many cases the reproductive strategies of particular species. The proximity to shore of
southward-moving Agulhas Current flow drives inshore current patterns on the east coast,
resulting in the early life-history stages of marine organisms (eggs and planktonic larvae)
potentially being transported great distances from their origin. This has shaped the
reproductive strategies of many coastal species reproducing in this region; spawning takes
place ‘upstream’ of juvenile nursery areas and adult habitat on the east coast, with the
southward transport of developing eggs and larvae to these being facilitated by southwesterly
inshore currents. Fish species known to make use of this strategy include the geelbek
(Atractoscion aequidens), red steenbras (Petrus rupestris) and white steenbras (Lithognathus
lithognathus); Hutchings et al. 2002).

Chapter 2: Methods and study sites
14
2.3 Study components and sites
Juvenile movements were examined in a dedicated field study at Schoenmakerskop, near Port
Elizabeth in the Eastern Cape (Figure 2.2), while existing long-term tagging datasets were
analysed to quantify adult movements. The latter included dedicated tagging programs
located in two MPAs on the South African east coast, namely De Hoop MPA and
Tsitsikamma National Park (Figure 2.2).
Figure 2.2. Study site locations on the South African coast.
1 – De Hoop MPA; 2 – Tsitsikamma National Park MPA; 3 – Schoenmakerskop.
2.3.1 Movements of juvenile fishes
Rocky intertidal habitats provide unique opportunities to study fish movement behaviour.
Rockpools and gullies constituting discrete submerged areas at low tide are readily accessible
to researchers and movements are easily quantified. Juveniles of the study species form part
of the transient intertidal fish community (Gibson & Yoshiyama 1999), occupying this zone
for an extended, but temporary, period as a nursery area (Smale & Buxton 1989).
Observations of tagged juveniles in intertidal habitat connected at high tide, but separated as
discrete areas at low tide, were made to examine movement between low tide refuges over
time.
25⁰20⁰
35⁰
30⁰
E
S
IndianOcean
N

Chapter 2: Methods and study sites
15
Study site
The study site comprised an approximately 500m long stretch of rocky coastline situated
alongside the village of Schoenmakerskop (34°02’S; 25°33’E), west of Port Elizabeth on the
Eastern Cape coast (Area 3 in Figure 2.2) and adjacent to the Sardinia Bay Marine Reserve.
The bedrock on this section of the coast consists of parallel fault lines (Smale & Buxton
1989), resulting in the intertidal zone consisting of numerous eroded gullies, coves and
shallow areas that contain water even at low tide. Smale & Buxton (1989) studied occurrence
of juvenile fishes in intertidal gullies (in their study termed ‘subtidal’ gullies) in this area.
That study and preliminary observations confirmed juveniles of the study species as common
in intertidal habitats at the study site. Discrete rockpools were uncommon, but a number of
gullies, permanently connected to the sea, were well protected from wave action over low tide
and provided areas suitable for observing fish movements. Four intertidal gully areas were
chosen in which to quantify movements of tagged fishes (Figure 2.3). Individual areas were
adjacent to others but isolated at spring low tide (SLT); although the seaward ends of some
gullies were open to the sea they did not connect directly to neighbouring gully areas. The
four areas were named (from east to west) Gully 1, Tagging Gully, Channel and Gully 4.
Figure 2.3. Aerial image of the Schoenmakerskop juvenile movement study site taken at low
tide (photo courtesy Google Earth®
).
N

Chapter 2: Methods and study sites
16
Areas differed in their physical characteristics, all having both deep (> 1.5 m) and shallow (<
0.3 m) regions of differing extent at SLT. Gully 1 comprised a large shallow area with coarse
sand and mussel shell-covered bottom, connected by a narrow channel to a deep pool-like
opening to the sea bordered by rock walls and large boulders; Tagging Gully was relatively
deep (up to 2 m), wide (~ 10 m) and straight with a bottom comprising medium-sized
boulders (0.5-1 m in diameter) and partially open to the sea at only one end; Channel was
separated from Tagging Gully by a narrow rocky ridge that created an overhang (0.7 m deep)
on its eastern side. The remainder of Channel comprised a narrow, shallow gully and
adjoining broad, shallow area with pebble-covered bottom. Breaks in the rocky wall between
the gully and the sea created deeper (~1 m) channels through which water surged; Gully 4
comprised a series of three parallel gullies of varying depth and width approximately 75
metres to the west of Channel. The outermost gully was deep (~2m) and broad (~8 m) with
steep rocky walls and sandy bottom, whilst the two inner gullies were shallower (0.4-1 m) and
characterised by crevices and overhangs in their rocky walls, and sand bottoms interspersed
with small boulders. These two gullies converged in a joint opening to the sea that formed a
wide, deep pool with a rocky bottom.
Snorkelling observations suggested the intertidal communities in the four areas were broadly
similar, and numerous juveniles of the study species in all four areas suggested that
comparably they had similar suitability as nursery habitats. Apart from the study species, the
fish community consisted mainly of resident intertidal blennies (Blennidae), klipvisse
(Clinidae), gobies (Gobiidae) and the longsnout pipefish (Syngnathus temminckii), as well as
transient juveniles of subtidal species such as two-tone fingerfin (Chirodactylus
brachydactylus), mullets (Mullidae) and sparids, including strepie (Sarpa salpa), John Brown
(Gymnocratophus curvidens), Cape stumpnose (Rhabdosargus holubi) and white steenbras
(Lithognathus lithognathus).
2.3.2 Movements of larger fishes
Data on movements of tagged individuals recovered from long-term national tagging
programs were analysed to examine subadult and adult movement behaviour. The De Hoop
MPA (DH - Bennett & Attwood 1991, 1993) and Tsitsikamma National Park (TNP - Cowley
et al. 2002) tagging programs complimented the ORI-WWF National Voluntary Tagging
Program (ORI), but methodological differences between all three resulted in each being
separately analysed.

Chapter 2: Methods and study sites
17
Whilst ORI mostly utilises volunteer members to tag fishes opportunistically along the entire
South African coastline, the MPA programs make use of experienced scientific angling teams
(Attwood & Cowley 2005) that visit study sites on dedicated fieldtrips. Table 2.1 summarises
attributes of the three programs and brief descriptions of the MPA study sites are given in the
sections below (for ORI see section on South African coast above). Further details of
angling, tagging and recapture procedures are described in Chapter 4.
Table 2.1. South African tagging programs providing data on movements of the three study
species.
Tagging Acronym Area Date Tagging Basic Biological Recaptures Spatial
Program of Information Information resolution
inception recorded recorded of locations
ORI-WWF ORI Entire SA 1982 Voluntary Tag number Species Fisheries > 1 km
National coast & Date Length Public
Tagging Scientific Location
Program members
De Hoop DH De Hoop 1987 Scientific Tag number Species MPA site MPA site
MPA MPA personnel Date Length Scientific 3.5 km (≤ 1998)
Tagging Location personnel 100 m (≥ 1999)
Program Angler effort
Other areas Other areas
Fisheries > 1 km
Public
Tsitsikamma TNP Tsitsikamma 1995 Scientific Tag number Species MPA site MPA site
National Park National personnel Date Length Scientific ≥ 5 m
Shore-angling Park MPA Location Capture time personnel
Program Angler effort Bait
Water Tag-scars Other areas Other areas
temperature Fisheries > 1 km
Public

Chapter 2: Methods and study sites
18
2.3.3 Study sites
ORI
Tagging of fishes in the ORI program took place opportunistically along the South African
coastline in accordance with angling activities of members. Thus tagging effort was excluded
from certain protected, private, remote or otherwise inaccessible areas, and higher in some
areas with good accessibility (e.g. close to urban centres and popular holiday resorts) than
others.
DH
The De Hoop MPA is located in the Western Cape Province within the Agulhas inshore
bioregion. Scientific angling took place at two 3.4 km long sites 11 kilometres apart within
the MPA, at Koppie Alleen and Lekkerwater (Figure 2.4). The shoreline at both sites is
composed of rocky wave-cut platforms extending into the surf-zone, interspersed with
stretches of sandy beach (Bennett & Attwood 1991). Subtidal habitats comprise low-relief
reefs lying exclusively within the surf-zone at depths less than six metres that periodically
become inundated with sand, and thus constitute a highly dynamic environment (Bennett &
Attwood 1991).
Figure 2.4. De Hoop MPA on the southwestern Cape coast showing locations of research
angling areas at Koppie Alleen and Lekkerwater
Struisbaai
Arniston
WitsandBreede River
De Hoop
Vlei
Heuningnes
River
Koppie
Alleen
Lekkerwater
Research Angling
Areas
De Hoop
MPA0 10 20 km
20⁰ 15’ 30’ 45’E
45’
34⁰30’
S
N

Chapter 2: Methods and study sites
19
West of the Koppie Alleen study site the MPA extends a further 18 km, and from the
Lekkerwater site 10 km eastwards; in total a 46 km stretch where normal fishing activities
were prohibited over most of the study period. However, prior to 1986 and establishment of
the MPA, fishing effort was much higher at Koppie Allen than Lekkerwater, which was
situated on private land (Bennett & Attwood 1991). Bennett & Attwood (1993) recorded 33
species at the two study sites during scientific angling in the MPA, with galjoen (Dichistius
capensis) (~57%) and blacktail (~33%) together comprising over 90% of catches.
TNP
Tsitsikamma National Park is Africa’s oldest MPA, having been proclaimed in 1964. It
straddles the border of the Western and Eastern Cape Provinces (Figure 2.2) and protects a 76
km stretch of coastline between the Groot River (West) (33º59’S, 23º34’E) and Groot River
(East) (34º04’S, 24º12’E) (Figure 2.5). The main research angling area comprised an
approximately 2.8 km stretch of predominantly rocky coastline close to the western boundary
of the MPA between the Klip and Bloukrans Rivers (Figure 2.5).
Figure 2.5. Tsitsikamma National Park MPA showing locations of research angling areas.
The larger area to the west is the Bloukrans study site, the smaller area the Lottering site.
At the Bloukrans site, steep cliffs rise above rocky promontories and ledges projecting into
the sea, resulting in shore topography consisting of deep rocky coves, pebble beaches, sandy
bays and areas of scattered rocky outcrops. A number of subtidal habitats exist, with both
rocky (including deep, high-profile reef, rocky gullies and shallow, low-profile reef or
boulder-beds) and sandy (e.g. banks in vicinity of the river mouths) habitats as well as the
transitional habitats between these all lying close to shore.
Nature’s
Valley
Plettenberg
Bay
Keurboom’s
Estuary
Research Angling
Areas
Tsitsikamma National
Park MPA0 10 20 km
34⁰00’
30’ 45’ 24⁰ 00’ 15’
S
E
N

Chapter 2: Methods and study sites
20
Research angling and tagging was also undertaken at a second site in the vicinity of the
Lottering River Mouth (Lottering Site) from 1998 to 2000. Subtidal habitat here comprised
predominantly sandy substrate in the surfzone off the rocky shore. In total 119 marine fish
species have been identified from the Tsitsikamma National Park, but research angling only
recorded 58 of these (Wood et al. 2000). Blacktail (~24%) and galjoen (~11%) were again
the two most abundant species recorded.

Chapter 3: Movement of juveniles between low tide refuges
21
Chapter 3 - Movement of juveniles between low tide refuges in a rocky intertidal
nursery area
3.1 Introduction
Movement studies on small juvenile fishes have presented a problem for researchers due to
difficulties in utilising traditional tagging methods. Use of commonly used external tags is
usually impossible because the fish is too small to carry the tag. Movement studies on
juvenile marine fish are nevertheless important for a number of reasons. Many marine
species inhabit specific habitats during the juvenile stages (nursery areas) prior to life in adult
habitats. Nursery areas may comprise a limited subset of adult habitats (e.g. shallower areas
or microhabitats of subtidal reefs; Henriques & Almada 1998, Tupper 2007) or be spatially
distinct areas (e.g. estuaries; Gillanders 2002, Kupschus 2003) providing, inter alia, refuge
from predation and environmental perturbation, as well as rich food resources (e.g. Kamenos
et al. 2004). Knowledge of juvenile fishes’ use of nursery areas is important from an
ecological and management perspective. Within nursery areas juveniles are significant
consumers and prey, and important in energy transfer within local foodwebs (Teo & Able
2003). Upon movement to adult habitat or falling prey to transient predators, they also
transfer energy to external areas. As they are often located in shallow nearshore habitats (e.g.
estuaries, mangrove stands and seagrass beds), nursery areas of many economically important
marine species are particularly vulnerable to anthropogenic impacts such as pollution or
fishing pressure, which can have serious negative consequences for adult populations and thus
certain fisheries (Beck et al. 2001).
Blacktail, zebra and musselcracker utilise the intertidal zone of rocky shores as a nursery area
(Chapter 1). Numerous studies have examined rocky intertidal fish movements (reviewed by
Gibson 1999). However, these almost exclusively involved resident intertidal species for
which large-scale movements are uncharacteristic, these fishes possessing morphological (e.g.
small, cylindrically-shaped bodies and modified fins for attachment to rocks) and behavioural
(e.g. litho-taxis) adaptations to sedentary lifestyles (Gibson & Yoshiyama 1999). Few
“transient” (Gibson & Yoshiyama 1999) rocky intertidal species’ movement patterns have
been reported, but existing studies focused on species that move into the intertidal zone to
feed over high tide (van der Veer et al. 1992, Rangeley & Kramer 1995). Juvenile sparids are
thought to utilise this habitat similarly to resident species, inhabiting them for extended
periods during the juvenile phase (Beckley 1982, Smale & Buxton 1989).

Chapter 3: Movement of juveniles between low tide refuges
22
The aim of the present study was to examine movement behaviour of juvenile blacktail, zebra
and musselcracker in a rocky intertidal nursery area through quantifying use of discrete areas
as low tide refuges by tagged individuals, and thus examine movements between adjacent
areas in the intertidal zone.
3.2 Methods
3.2.1 Study site
The study took place at Schoenmakerskop near Port Elizabeth on the Eastern Cape coast (see
Chapter 2).
3.2.2 Experimental design
Juvenile fishes were marked with unique external tags in a single area of the study site
(Tagging Gully – see Chapter 2) over a two-day period. Subsequent observations on their
utilisation of discrete low tide areas at the study site were made on bi-weekly fieldtrips
between January and August 2006 to quantify long-term movements.
3.2.3 Tagging
Elastomer, widely known by the acronym VIE (Visible Implant Elastomer), was used as the
tagging method. VIE is a silicon-based plastic injected in liquid form into the fish’s body
surface, quickly hardening to form a flexible, solid, biologically inert and highly visible tag
(Northwest Marine Technology, Inc. 2008). A range of available colours and suitable tag
locations enables VIE tagging to uniquely identify large numbers of small fishes (e.g. Beukers
et al. 1995, Frederick 1997, Griffiths 2002), including sparids (Doupe et al. 2003, Astorga et
al. 2005). Mortality rates are lower and tag-retention rates equivalent to, or better than, other
external tagging methods for small fishes (Malone et al. 1999, Brennan et al. 2005), studies
reporting tag retention rates in excess of 80 percent over periods greater than one year
(Catalano et al. 2001, Fitzgerald et al. 2004). The heavy body scaling of sparids of the size
under investigation precluded the use of many body locations (cf Astorga et al. 2005) for
successful tag resighting.

Chapter 3: Movement of juveniles between low tide refuges
23
Kerwath et al. (2006) placed VIE tags in the caudal fin of adult roman (Chrysoblephus
laticeps), reporting good in-situ tag visibility and high tag-retention rates. After laboratory
trials proved successful the caudal fin was selected as the most suitable location for VIE
tagging of fishes in the present study. Ultra-light angling tackle, and a baited steel-frame
rectangular fish-trap (500 mm x 750 mm with funnel entrances), were used to capture juvenile
fishes. Small (size 18-12) debarbed hooks baited with sand-mussel (Donax serra) or
polychaete worms proved effective and did not cause large mouth-wounds. The trap was
baited with pilchard (Sardinops sagax). Fishing took place over spring low tide on two
successive days in January 2006. Captured individuals were anaesthetised in a 0.4 ml.l-1
2-
phenoxyethanol-fresh seawater solution (Kerwath et al. 2006) in a bucket, cooled with sealed
ice-bags to maintain ambient water temperature, and then placed on a seawater-soaked sponge
to minimise body damage during tagging. Because manipulation of the fish was necessary a
damp gardening glove was worn during tagging. VIE was injected into the connective tissue
along a caudal fin ray with an insulin syringe (0.33 mm/29-guage hypodermic needle) (Figure
3.1).
Figure 3.1. Photograph showing the position of VIE tag along caudal fin ray of a juvenile
blacktail.

Chapter 3: Movement of juveniles between low tide refuges
24
Tags approximately five millimetres long were applied by inserting the needle as distally as
possible alongside a caudal fin ray and threading it along the ray proximal to the caudal
pterygiophores. During subsequent needle withdrawal liquid VIE was injected, filling the
needle insertion space (Kerwath 2005). Tag injection ended short of the needle entry site to
prevent VIE leakage from the fin surface, which increases the chances of tag loss (S.
Kerwath, Marine & Coastal Management, pers. comm.). Tags were placed in either one or
both of the upper and lower lobes of the caudal fin, were visible from both sides of the fish
and from a distance in excess of two metres underwater. Following tagging, fishes were
placed in a bucket of cool seawater with air stone circulation and upon complete recovery
released back into Tagging Gully. Before tagging of further individuals the hypodermic
needle was sterilised in 95% ethanol to minimise the risk of infection.
3.2.4 Movement observations
Tagged individuals were resighted during fifteen-minute underwater surveys of each of four
areas in the study site (Chapter 2). These were conducted on standard snorkelling equipment
during bi-weekly sampling trips of two to four consecutive days over spring tide periods.
During surveys, each area was actively searched for tagged fishes, the presence of which was
recorded on a dive-slate. Surveys were initiated in one of the two outer areas (Gully 1 and 4)
within one to half an hour before low tide, progressing in turn to each adjacent area in the
appropriate direction until all four areas had been surveyed. On successive days initial
surveys alternated between Gully 1 and 4 to vary survey direction across the study site during
each trip. When conditions allowed, subtidal areas adjoining the intertidal survey areas were
also explored for tagged fishes and during particularly calm conditions on the final sampling
trip, observations were made in Tagging Gully, Channel and adjoining inshore areas during
the incoming tide-phase.
3.2.5 Water temperature
Underwater Temperature Loggers (Vemco®) were placed in two areas (Gully 4 and Tagging
Gully) to monitor water temperature over the study period. The instruments were placed
under large boulders in the gullies and were between 0.5 and 1.0 m below the water surface.

Chapter 3: Movement of juveniles between low tide refuges
25
3.3 Results
3.3.1 Capture and tagging of fishes
A total of 12 blacktail, 12 zebra and 6 musselcracker of lengths 82-172 mm FL were captured,
tagged and returned to Tagging Gully on 16 and 17 January 2006 (Table 3.1).
Table 3.1. Juvenile sparids tagged with VIE at the Schoenmakerskop study site
Two juvenile musselcracker were the only fish caught in the baited fish trap; all others were
caught on baited hooks. A further two blacktail, three zebra and one musselcracker were
tagged but died from effects of the anaesthetic on the first day of tagging.
3.3.2 Survey effort
A total of 13 survey trips were made to the study site over spring tide periods from 21 January
to 25 August 2006, a total of 37 days. No surveys were undertaken between 12 July and 23
August due to rough water conditions.
3.3.3 Water temperatures at the study site
Average daily temperatures recorded by the two temperature loggers were similar over the
study period (average difference between readings of 0.4 ± 0.1°C). Average daily water
temperature was 17.4 ± 2.2 °C, but temperatures ranged from 9.96 oC to 22.86 °C. There was
a slight decrease in average daily temperatures and diurnal temperature range with seasonal
progression to autumn and then winter. However, sudden drops in water temperature (from
~20 to 10-13 oC) occurred frequently during the first two months of the study period, but only
on one survey date (17 February – Figure 3.2).
Species Number tagged Average length (mm FL) Length range (mm FL)
Blacktail 12 105.3 82 - 123
Zebra 12 128.5 106 - 172
Musselcracker 6 112.5 90 - 137

Chapter 3: Movement of juveniles between low tide refuges
26
0
5
10
15
20
25
18-J
an
21-J
an
22-J
an
29-J
an
30-J
an
31-J
an
1-F
eb
14-F
eb
15-F
eb
16-F
eb
17-F
eb
17-M
ar
18-M
ar
19-M
ar
30-M
ar
31-M
ar
1-A
pr
12-A
pr
13-A
pr
27-A
pr
28-A
pr
29-A
pr
12-M
ay
13-M
ay
14-M
ay
29-M
ay
30-M
ay
12-J
un
13-J
un
14-J
un
28-J
un
29-J
un
11-J
ul
12-J
ul
23-A
ug
24-A
ug
25-A
ug
Survey date (2006)
Wate
r te
mp
era
ture
(oC
)
Figure 3.2. Daily average water temperature and range (depicted by error bars) at the
Schoenmakerskop study site on survey dates.
3.3.4 Observations of tagged fishes
Tagged individuals of all three species showed high initial frequency of observations at the
study site (up to two months post-tagging), but this translated into long-term regular
observations for zebra and musselcracker only, with only a single tagged blacktail regularly
observed after a period of three months (Table 3.2). Only two tagged fishes (both blacktail)
were not observed at least once post-tagging. By the end of the seven-month study period a
high proportion of tagged zebra (67%) and musselcracker (50%), but not blacktail (8%) were
still observed in the study area. Tagged blacktail were only regularly observed in the first two
months of the study, after which few were seen (Figure 3.3). By contrast, the proportion of
tagged zebra and musselcracker observed remained high for a longer period, with many still
observed upon termination of the seven-month study (Figure 3.3), although this was more
pronounced for zebra. Little movement between areas was detected for most tagged fishes,
but blacktail displayed a greater inclination to move than the other two species. Only one
tagged blacktail (#1) was regularly observed but showed strong fidelity to Tagging Gully,
while four of the other nine moved to one of the other gullies and one was observed in both
neighbouring gullies (Table 3.3). None were observed to move to the area furthest from
Tagging Gully (Gully 4) and only two to Gully 1, but movements between the Tagging Gully
and Channel areas were comparatively frequent.

Chapter 3: Movement of juveniles between low tide refuges
27
Table 3.2. Numbers of tagged juvenile sparids resighted at Schoenmakerskop study site at
monthly intervals post-tagging.
*No data for 6 month post-tagging period due to no surveys between 12 July and 23 August due to poor weather
conditions
Figure 3.3. Proportion of tagged juveniles of the three study species recorded during each
sampling trip.
Months post-tagging Blacktail Zebra Musselcracker
0 10 12 6
1 9 11 5
2 5 11 5
3 2 11 5
4 1 11 5
5 1 11 4
7* 1 8 3
Sampling trip
Jan Feb1 Feb2 Mar1 Mar2 Apr1 Apr2 May1 May2 Jun1 Jun2 Jul1 Jul2 Aug1 Aug2 Sept
% t
ag
ged
in
div
idu
als
ob
se
rved
0
20
40
60
80
100
Zebra
Blacktail
Musselcracker
Pro
po
rtio
n o
f t
ag
ged i
nd
ivid
uals
ob
serv
ed
(%
)

Chapter 3: Movement of juveniles between low tide refuges
28
Table 3.3. Tagged blacktail resighted in different areas at low tide at the study site.
TG – Tagging Gully, Ch – Channel, G – Gully 1. Superscripts refer to the number of
observations in the particular area if fish was observed in more than one.
Large numbers of juvenile blacktail accumulated in extremely shallow rockpools on one
survey date that coincided with a sudden drop in water temperature (i.e. 17 February, during
Sampling trip Feb2 in Figure 3.2). Eight of the twelve tagged blacktail were observed in
pools directly inshore of the survey areas, after having been largely absent in previous
surveys. Observed frequency of movements of juvenile zebra and musselcracker between
survey areas were lower than for blacktail, tagged individuals generally being observed more
frequently and over a greater proportion of the study period (Tables 3.4 & 3.5). One zebra
(#9) moved to Channel early in the study, where it remained for the remainder of the study
period, and one musselcracker (#3) was only seen once, in Channel. Apart from these fishes,
all tagged individuals were observed over low tide in Tagging Gully. However, some were
infrequently observed but nevertheless still alive (confirmed by sporadic observations after
long periods of absence). Low resighting rate appeared to be related to fish size, as three of
the four zebra with lowest resighting rates were the largest individuals tagged (Table 3.4).
Unfortunately the significance of this could not be assessed with much statistical power due to
low sample size. One of these fish was observed in subtidal habitat outside of Tagging Gully.
Fish # FL (mm) Tagging date Number of Observation Areas observed
days observed period (days)
1 113 16 Jan 06 12 222 TG11
; Ch1
2 110 16 Jan 06 0 - -
3 105 16 Jan 06 2 61 TG
4 111 16 Jan 06 4 63 TG
5 82 16 Jan 06 4 119 TG2; Ch
1; G
1
6 89 16 Jan 06 2 32 G1
7 116 16 Jan 06 6 87 TG3; Ch
3
8 105 16 Jan 06 3 32 TG
9 95 16 Jan 06 2 87 TG
10 111 16 Jan 06 0 - -
11 104 17 Jan 06 2 14 Ch
12 123 17 Jan 06 4 60 Ch3; TG
1

Chapter 3: Movement of juveniles between low tide refuges
29
Table 3.4. Tagged zebra resighted in different areas at low tide at the study site.
TG – Tagging Gully, Ch – Channel, G1 – Gully. Superscripts refer to the number of
observations in the particular area if fish was observed in more than one.
Table 3.5. Tagged musselcracker resighted in different areas at low tide at the study site.
TG – Tagging Gully, Ch – Channel, G1 – Gully. Superscripts refer to the number of
observations in the particular area if fish was observed in more than one.
Fish # FL (mm) Tagging date Number of Observation Areas observed
days observed period (days)
1 136 16 Jan 06 30 178 TG29
; Ch1
2 128 16 Jan 06 21 221 TG
3 140 16 Jan 06 2 164 TG
4 123 16 Jan 06 3 5 TG
5 115 16 Jan 06 15 222 TG
6 106 16 Jan 06 27 222 TG
7 122 16 Jan 06 30 222 TG29
; Ch1
8 115 16 Jan 06 30 222 TG
9 125 17 Jan 06 32 221 Ch31
; TG1
10 119 17 Jan 06 33 221 TG
11 141 17 Jan 06 12 221 TG
12 172 17 Jan 06 1 163 TG
Fish # FL (mm) Tagging date Number of Observation Areas observed
days observed period (days)
1 137 16 Jan 06 15 149 TG
2 96 16 Jan 06 6 178 TG
3 102 17 Jan 06 1 13 Ch
4 132 17 Jan 06 23 221 TG
5 118 17 Jan 06 22 221 TG
6 90 17 Jan 06 9 177 TG

Chapter 3: Movement of juveniles between low tide refuges
30
Opportunistic observations made during the incoming tide, between 23 and 25 August at the
end of the study period, revealed use of both Tagging Gully and Channel during this period
(Table 3.6). These mostly comprised individuals recorded over low tide that also made use of
shallower regions inshore of the two gullies as these became inundated with water. However,
a further two blacktail unobserved at low tide since early in the study were also observed over
this high water period.
Table 3.6. Numbers of tagged juveniles observed over the incoming tide at the end of the
study period. Superscript indicates the individuals sighted; gul – normal observation gully, sh
– shallow area inshore of observation gully.
3.4 Discussion
An important requirement of tagging studies is that the tag does not cause unnatural behaviour
in the individuals under study, as this limits interpretability of results at a general population
level. Tagged fishes were observed swimming naturally soon after tagging, and one tagged
white musselcracker was recaptured three times within two days of being tagged. This
suggests tagging-induced effects on behaviour were negligible. The high numbers of tagged
individuals observed over the remainder of the study also suggests tagging-induced mortality
following release did not occur. An important observation for future studies however, was
the death of some fishes during tagging. It is likely that elevated temperature of the
anaesthetic solution due to hot weather was the cause of mortalities (Weyl et al. 1996), as the
tagging procedure was identical to that practised successfully in prior laboratory and field
trials. After cooling the anaesthetic solution with sealed ice bags no further mortalities
occurred. While no formal study was undertaken on VIE tag-loss rates over the study period,
it is a widely used method that has shown generally high tag-retention rates in small fishes
(see Methods).
Sampling date 23 Aug 06 24 Aug 06 25 Aug 06
Area Tagging Gully Channel Tagging Gully Channel Tagging Gully Channel
Region gul sh gul sh gul sh gul sh gul sh gul sh
Blacktail 2#1,5
- 1#10
- - - 1#5
- 1#1
- 1#5
-
Zebra 3#5,6,7
2#10,11
- - 1#5
2#7,11
- - 2#6,7
2#8,11
- -
Musselcracker - 1#3
- - 1#4
- - - - - 1#3
-

Chapter 3: Movement of juveniles between low tide refuges
31
Over repeated sampling trips tag condition was subjectively assessed, and only one fish was
observed to acquire partial tag damage, which did not progress to full tag loss. For these
reasons tag-loss was not considered a potential explanation for absence of individuals in
surveys. Results showed long-term association of tagged individuals to restricted areas within
the intertidal zone. Tagged blacktail showed the greatest propensity for movement and
appeared to cease use of the intertidal zone over low tide from early in the study period. This
was likely due to an ontogenetic shift to nearby subtidal habitat with growth, which is
supported by data from previous studies. In this study, only three individuals less than 100
mm (total length) were tagged, but Christensen (1978) found juveniles departed the intertidal
zone at a size similar to this (90 mm SL) and previous studies in rockpools collected blacktail
primarily smaller than this (Beckley 1985, 2000, Bennett 1987, Burger 1990). Although
Smale & Buxton (1989) recorded larger blacktail in gullies, juveniles over 100 mm were
uncommonly collected in their study in this area. Juvenile blacktail 100-150 mm TL are,
however, common on shallow subtidal reefs (Burger 1990, Mann 1992, Fennessy & Chater
1998). The present study thus tagged individuals likely approaching the size at which
ontogenetic movement to subtidal reefs occurs. The influx of blacktail in the ‘tag-size’ cohort
into the intertidal zone on one study date appeared driven by a sudden drop in water
temperature linked to cold-water upwelling. The resighting of most tagged individuals during
this event suggests they remained in subtidal areas in close proximity to the study site and
were thus able to return to familiar areas that were utilised as smaller juveniles.
In contrast to blacktail, most tagged zebra and musselcracker showed long-term fidelity to
specific areas used over low tide. While no tagged fishes were observed on all survey dates,
for most regularly-sited individuals this was likely due to being occasionally overlooked on
surveys rather than absence from survey areas (see later discussion on irregularly observed
individuals). Visual census methods may be biased by observer-mediated behaviour of
particular species or individuals (Kulbicki 1998), although this was not noted and most
individuals seemed unconcerned by observer presence. It is possible, however, that certain
individuals were generally less active over low tide and thus less conspicuous, although the
survey areas were thoroughly searched. Occupation of small, stable home ranges over low
tide is a feature of resident intertidal taxa (Gibson 1999, Griffiths 2003a,b) and strong site
fidelity within nursery areas has been recorded for juveniles of several marine fish species
(Ross & Lancaster 2002, Watson et al. 2002, Burrows et al. 2004).

Chapter 3: Movement of juveniles between low tide refuges
32
Use of specific areas can be mediated by the tidal cycle (Pottoff & Allen 2003, Teo & Able
2003, Dorenbosch et al. 2004) and tagged fishes were theoretically able to move between
several different low tide refuges during high tide. The observed use of a single low tide
refuge suggests either stasis within it over high tide, or active return to it from adjoining areas
used during high tide. The limited observations at high tide suggested both of these
behaviours may occur; use of shallower areas over flood tide was noted for some individuals
(Table 3.6), while other individuals continued to utilise the low tide refuge during this time
and perhaps over the full tidal cycle. The restricted low tide refuge area thus probably
constitutes the “core” area (Kramer & Chapman 1999) of a larger home range incorporating
adjoining areas sometimes utilised during high water periods (e.g. during the large tidal
amplitudes associated with spring tides). This would allow the use of similar depth
throughout the tidal cycle and an associated reduction in predation risk and exposure to
turbulent conditions over high tide. Many resident intertidal fishes make such tidally-related
movements (Green 1971, Gibson 1984, 1999), the magnitude of these being constrained by
the need to remain within the vicinity of the low tide refuge to allow an easy return to it as the
tide drops (Green 1971).
Individual juvenile zebra and musselcracker thus appear to utilise only a fraction of available
nursery habitat. Familiarity with a restricted area of the intertidal zone probably facilitates
quick escape from aerial and aquatic predators (Gibson 1999), as well as knowledge of the
location of food resources (Kramer & Chapman 1999). Familiarity with the ‘layout’ of their
immediate surroundings is probably also advantageous for expedient retreat to shelter (e.g.
shallower areas) during rougher water conditions associated with high tide or storm events.
Aggressive interactions between conspecifics or with other species were not observed during
the present study and it did not appear that territories were established, as has been observed
in juveniles of other species (Kudoh & Yamaoka 1998, Bell & Kramer 2000). The patchy
distribution of suitable rocky intertidal nursery areas along the South African coast may have
lead to the evolution of non-agonistic behaviour during the juvenile phase, facilitating
maximum use of this potentially limiting resource. Christensen (1978) found limited resource
competition between juvenile blacktail and zebra in the intertidal zone resulting from different
temporal utilisation of this habitat (blacktail leaving at smaller size) and utilisation of
different food resources, the degree of dietary overlap decreasing with growth.

Chapter 3: Movement of juveniles between low tide refuges
33
The sporadic observations of most blacktail and certain zebra and musselcracker were
considered unlikely to be due to general overlooking of these individuals. As already
discussed for blacktail, it is probable that rare observations were instead the result of a habitat
shift linked to growth. Under this hypothesis, rare observations in the low tide refuge were
indicative of a maintained association with it during the ontogenetic shift. Observations of
blacktail returning to the survey areas over the incoming tide, as well as the observation of a
rarely-resighted zebra individual in adjacent subtidal areas during low tide provides evidence
for this. It also provides evidence that for these fishes the ontogenetic shift to adult habitat
occurs via a ‘stepping-stone’ process. A gradual (subtidal) extension of the juvenile home
range and concomitant reduction in use of the (intertidal) nursery area leads to final
establishment of the adult home range separate from the nursery area (Appeldoorn et al.
1997). From a core area within the intertidal zone (the low tide refuge), opportunistic
exploration of subtidal areas during suitable conditions could initiate this process. These most
likely occur over low tide, in temporal opposition to the high tide influx of predators in
shallow nearshore areas (e.g. Rangely & Kramer 1995) and when sea conditions are generally
calmer than during high tide, and would then have also coincided with low tide intertidal
surveys. Such a process allows the fish a well-known refuge to return to during the
potentially dangerous transition to subtidal life, but with increasing familiarity with subtidal
areas, use of the intertidal zone concomitantly decreases and the core area of the home range
eventually shifts permanently to the subtidal.
A similar gradual shift to adult home range through increased temporary excursions away
from the nursery area has been suggested by a study on estuarine-dependent spotted grunter
(Pomadasys commersonnii), with the frequency and duration of excursions to adult marine
habitats increasing upon sexual maturity (Childs 2005, Childs et al. 2008). Some adult
P.commersonnii also maintain an association with their nursery area into adult life. Subadults
and adults of all three study species are known to utilise extremely shallow areas during high
tide (Biden 1948, Christensen 1978, Clarke 1988, Mann 1992) and some individuals therefore
probably maintain an association with their intertidal nursery areas throughout life. Future
study therefore needs to quantify typical dispersal distances for juveniles to adult habitat. The
observed smaller size at which blacktail leave the intertidal zone has possibly evolved due to
their greater abundance and shoaling behaviour conferring protection against predation in
subtidal habitats. Alternatively, their greater abundance in the intertidal zone may necessitate
earlier dispersal due to intraspecific competition.

Chapter 3: Movement of juveniles between low tide refuges
34
Although the rocky intertidal zone appears to form their predominant nursery habitat,
juveniles of all three species are also found in other habitats (see Chapter 1). The relative
importance of these to adult populations should be estimated by future studies. The rocky
intertidal zone may represent a critical habitat (Beck et al. 2001) that contributes
disproportionately to recruitment to adult populations. This can occur through increased
juvenile survival during occupation of the nursery area (e.g. reduced predation), as well as
upon movement to adult habitat (enhanced growth in critical habitat leading to better
individual condition and survival). As proximity of nursery areas and adult habitat influences
the scale of ontogenetic movement (Appeldoorn et al. 1997) this may also be an important
factor determining the importance of particular nursery areas to adult populations. In regions
where nurseries and adult habitat are widely separated, the gradual ontogenetic shift could be
replaced by directed movements of greater magnitude between these, or alternatively result in
shift to closer, but less productive habitats. Both of these would be expected to result in lower
survival rates and proportionally less contribution to adult populations.
The development of biochemical techniques discriminating past nursery environments of
individuals (e.g. elemental fingerprinting of otoliths (Kerr et al. 2007, Fodrie & Levin 2008))
will hopefully enable this in future studies. Due to the proximity of many South African
rocky intertidal areas to human coastal developments, they will likely come under increasing
pressure from anthropogenic impacts (Crowe et al. 2000). Point-source pollution events (e.g.
oil (Barber et al. 1995) or chemical spills) are a potential threat on local scales and could
negatively affect local adult populations that receive recruits from impacted nursery areas.
Perhaps a greater threat is that posed by chronic sub-lethal exposure of juveniles to chemical
compounds affecting their reproductive development (endocrine-disrupting chemicals: EDCs;
Porte et al. 2006) and thus having potential knock-on effects in local adult populations. Such
chemicals are found in run-off from motor oil and sewage that can accumulate in the intertidal
zone (Crowe et al. 2000). Establishing the relative importance of different nursery habitats
for these species should be undertaken so that adequate protection of critical habitats can be
implemented and contingency plans for potential impacts explored.

Chapter 4: Movement patterns inferred from long-term tagging programs
35
Chapter 4 - Movement patterns inferred from long-term tagging programs
4.1 Introduction
Studies on fish movement generally take either of two divergent approaches – short-term,
intensive studies on a few individuals that allow fine-scale movement patterns to be
investigated, often through sophisticated technology such as telemetry; or long-term studies
on many individuals utilising less-specialised techniques that yield information which,
although limited at the individual level, in combination lead to an understanding of population
movements. The latter approach makes use of relatively simple inexpensive technology that
is easy to apply, enabling public and commercial entities (e.g. fisheries) to participate in data
collection, thereby greatly increasing the geographic extent and volume of data that can be
collected to study highly mobile species. Large juveniles and adults of the three study species
are potentially highly mobile and live in exposed shallow-water habitats that preclude the use
of acoustic telemetry methods and underwater observation to investigate their movements.
Therefore, the most suitable methods to assess their movement patterns rely on external marks
that are visible upon subsequent recapture.
External plastic dart tags, inserted into the dorsal musculature, have been successfully used to
study the movements of several South African coastal fish species (e.g. Buxton & Allen 1989,
Attwood & Bennett 1994, Cowley et al. 2002, Griffiths & Wilke 2002, Brouwer et al. 2003,
Kerwath et al. 2007a). This tagging method, adopted by the ORI-WWF National Voluntary
Tagging program (ORI) and its subsidiary research tagging projects (see Chapter 2), has also
been applied on adolescent and adult blacktail, zebra and musselcracker. Some information on
the movement behaviour of these species has been published in the scientific literature and
indicates high levels of residency and site fidelity for blacktail, zebra and immature
musselcracker (Bennett & Attwood 1991, Mann 2000b,c, Booth 2000, Cowley et al. 2002),
but larger movements for adult musselcracker (Mann 1999, Booth 2000). This study expands
on these earlier investigations by describing the movement behaviour of the three study
species in relation to (i) changes in age/size, (ii) location on the South African coastline, and
iii) seasonal and/or reproductive cycles. This was achieved through the analysis of mark-
recapture data obtained from ORI and two subsidiary research tagging projects in the De
Hoop (DH) and Tsitsikamma National Park (TNP) marine protected areas.

Chapter 4: Movement patterns inferred from long-term tagging programs
36
4.2 Methods
A description of the South African coastal environment and the study sites, as well as general
methods for the respective tagging programs are given in Chapter 2.
4.2.1 Fish tagging and tag recoveries
ORI
The number of active ORI participants varied from approximately 300 to 600 per year (Bullen
et al. 2008). Anglers did not follow a standardised technique, but recorded the following
information on fish that were tagged: angler’s name; tag number; date; locality; length and
measurement index (e.g. TL or FL). Two types of plastic dart tags (Hallprint™, Australia)
were used. Type-A tags (114 mm long x 1.6 mm wide) were generally used only for large
fishes (i.e. adult musselcracker) and shorter Type-D tags (85 mm length) for fishes less than
600 mm TL. Tags inscribed with a unique alphanumeric code and the ORI postal address
were inserted with a stainless steel applicator into the dorsal musculature and anchored
between two inter-neural spines. Tagging localities were recorded on the ORI database as
their distance (in kilometres) south of the South African/Mozambique border. Information
obtained from fish recaptured by recreational and commercial fishermen, or recovered by
other members of the public, was returned via mail to ORI. This included recapture date,
locality, fish length (and/or weight) and whether the fish was released or not.
DH
Research teams of 4-6 experienced anglers visited De Hoop MPA on five-day trips to tag and
record biological information on the nearshore fish community from one year prior to its
proclamation in 1988 (Bennett & Attwood 1991). Initially, monthly trips alternated between
two sites (Koppie Alleen and Lekkerwater, see Chapter 2), but from 1994 a two-month
interval was established, resulting in three trips made annually to each site. Anglers fished
from the shore for extended periods between sunrise and sunset using standard shore-angling
gear and varied bait and tackle according to angling-locality characteristics, conditions and
personal preferences. To minimise stress, captured fishes were processed swiftly and
carefully, using flexible vinyl slings incorporating a rigid central baton and attached
measuring tape to land, carry and measure fishes with minimum contact. Fish total length
was measured to the nearest millimetre.

Chapter 4: Movement patterns inferred from long-term tagging programs
37
Fishes of suitable size (larger than ~250 mm TL) were tagged with the Type-D plastic dart
tags (see above) and returned to the sea. Prior to 1999 no site-specific tagging localities were
recorded, but from 1999 each site was demarcated with numbered flags partitioning it into
one hundred metre stretches (Attwood & Cowley 2005). The capture localities of tagged and
recaptured fishes were thereafter recorded as the number of the flag closest to the point of
capture. Information on recaptured fishes made at the research sites were recorded as in
tagging operations. However, after 1998, no blacktail were tagged, so for this species the
only locality information considered was the site of tagging and/or recapture (i.e. Koppie
Alleen or Lekkerwater). Tags fouled by epiphyte growth (Figure 4.1) were cleaned and if
necessary replaced with a new tag, and all recaptured fish were released. Fish recaptured
outside the MPA were reported to ORI by members of the public as described above.
TNP
Scientific shore-angling began at the Bloukrans study site in January 1995, with monthly trips
to the study site by a small research angling team (Cowley et al. 2002). From 1998 teams of
4-6 anglers, mostly comprising a core group of experienced researchers, visited the site every
two months on trips of three to five days. However, from 2004 to 2006 fieldtrips were
undertaken quarterly and thereafter biannually (i.e. summer and winter trips). Between 1998
and 2000, research angling also took place at a separate site close to the Lottering River
mouth during each trip. Tagging and recapture operations were similar to those at De Hoop,
except measurements were expressed as fork length, and additional information on angling
activities was recorded (see Table 2.1). All angling localities were named and their position
recorded with a GPS (Geographical Positioning System). All the sites in the Bloukrans study
area were geo-referenced and incorporated into GIS (Geographical Information System),
enabling tagging and recapture positions to be accurately mapped. In the TNP, the presence
of characteristic ‘tag scars’ on (re)captured fishes was also noted (Figure 4.2).

Chapter 4: Movement patterns inferred from long-term tagging programs
38
Figure 4.1. Recaptured musselcracker carrying tag fouled by epiphyte growth.
Figure 4.2. Distinctive tag scar on body of recaptured musselcracker.

Chapter 4: Movement patterns inferred from long-term tagging programs
39
4.2.2 Movement calculations and analysis
Summary tagging, recapture and movement data on the three study species is provided by
ORI in the form of data reports for each species on request (Bullen & Mann 2005a,b,c).
However, for this study raw data on all tagged and recovered tagged fishes was obtained from
ORI to enable separate analysis of data from the three tagging programs. Movement
calculations differed in the case of each particular program, as described below
ORI
Attwood & Cowley (2005) questioned the accuracy (one kilometre precision) of tagging and
recapture positions reported to ORI, stating that in some cases these may be out by as much as
five kilometres. Therefore, movements (calculated as the distance between reported positions
of recapture and tagging) were grouped into five kilometre ‘bins’, which was felt to be a more
appropriate spatial resolution, for analysis. However, maximum and average movements
were calculated from the raw distances (i.e. one kilometre scale).
DH
Movements of all blacktail and other fishes tagged prior to 1999 subsequently recaptured
within the MPA were classified either as ‘zero displacements’, if tagged and recaptured at the
same site, or as 11 km (the distance between the two tagging sites) if recaptured at the other
site. Fishes tagged and recaptured after 1999 with flag positions at tagging and recapture sites
were analysed at a 100 m resolution. Recaptures made outside the MPA and reported via ORI
were grouped into five kilometre bins as for ORI data.
TNP
Movements of fishes recaptured at the study site were calculated in ARCVIEW GIS 3.2
(ESRI Ltd) using the measuring tool, and taken as the shortest possible route between the
tagging and recapture localities (see Figure 4.3). In the example shown a fish tagged at
Sandgatte (SG) was recaptured at Stomp (ST). The thick line indicates the shortest possible
route (a distance of ~243 m), while the thin line represents a longer alternative route.
Measured distances were expressed to the nearest five metres and grouped into 100 m bins for
analysis. Tag recoveries made outside the study site were analysed as in the other two
programs.

Chapter 4: Movement patterns inferred from long-term tagging programs
40
Figure 4.3. Mapped section of the TNP Bloukrans site demonstrating the calculation of the
minimum distance moved using the measurement tool in ARCVIEW GIS 3.2.
Analysis of combined data
For TNP and DH total numbers of fish tagged and recaptured were pooled for separate study
sites, and recapture rates derived from these. Recapture rates were calculated as the total
number of recaptured individuals as a percentage of individuals tagged and released; multiple
recaptures of the same individual therefore did not contribute to this value. Movements
recorded from all three programs were analysed on a combined scale of five kilometres.
Therefore all within-site movements in the MPAs fell within the 0-5 km bin, and between-site
movements (DH) in the 10-15 km bin (there were no between site movements in TNP).
Unless measured as being larger than 500 m, all MPA within-site movements were recorded
as ‘zero displacements’, as were ORI recaptures recorded at the tagging locality (i.e. as 0 km
movement). The effects on movement patterns of time at liberty, fish size, and (for
musselcracker) season of recapture were also analysed. Spearman rank correlation was used
to investigate the relationship between distance moved and (i) days at liberty, and (ii) fish
length. Differences in the proportion and magnitude of movements in an easterly or westerly
direction were also assessed. All lengths were analysed as fork length (FL). Lengths reported
as total length were converted to FL using conversions given in Mann (2000a,b) and Booth
(2000) prior to analysis. Similarly, in cases where size was reported only as weight,
published length-weight relationships for each species were used to estimate FL.

Chapter 4: Movement patterns inferred from long-term tagging programs
41
In the few cases where no size was reported, estimates of FL at recovery were derived from
the species’ von Bertalanffy growth equation based on time at liberty and recorded length at
tagging.
4.3 Results
4.3.1 Blacktail
A total of 7382 blacktail were tagged in the three programs between 1984 and 2007, with an
overall recapture rate of 2.6% (Table 4.2). Recapture rates differed between the three
programs, but the only significant difference was a lower rate in TNP compared to DH (two-
tailed proportions test, p = 0.002). Recaptured blacktail rarely moved from the tagging
locality, with 91% displaying zero displacement at recapture (Table 4.1). Of the individuals
that moved, there was no favoured direction of displacement (eight versus nine individuals
moved east and west, respectively; Figure 4.4). Both TNP and DH had a single individual
that moved more than 100 km (139 and 145 km, respectively), which inflated their average
movement values greatly, as well as the overall average (Table 4.1).
Table 4.1. Summary of movement data for blacktail tagged and recaptured along the South
African coast, 1984-2007.
The high-resolution displacement distances obtained from the TNP for fish recaptured
between 0 and 2715 days (average = 365 days) after tagging suggest that movements are
generally considerably less than 1 km. A total of 38% were recaptured at the tagging locality,
while a cumulative percentage of 68% were recaptured within 100 m, and almost 90% within
500 m, of the tagging locality (Figure 4.5).
Tagging Number Number Recapture Zero Average & Average &
program of fish of fish rate displacement {maximum} {maximum}
tagged recaptured (%) (%) movement days at
{tag-scars} in km liberty
ORI 1883 39 2.07 77.50 1.60 {19} 190 {1028}
DH 3610 122 3.38 94.93 1.47 {139} 283 {2016}
TNP 1889 31 {38} 1.64 87.87 4.27 {145} 365 {2715}
Total 7382 192 2.60 90.57 1.97 {145} 277 {2715}

Chapter 4: Movement patterns inferred from long-term tagging programs
42
Figure 4.4. Movements of 192 blacktail recaptured along the South African coast (combined
programs). Negative values represent displacements in a westerly, and positive values an
easterly, direction.
Similar site fidelity for blacktail was recorded at DH. Of 138 recapture events, only two
(1.6%) were outside the MPA boundary and only five (4.1%) movements were recorded
between the tagging sites within the MPA, located 11 km apart. A further individual was
recovered elsewhere in the MPA at least nine kilometres from its tagging site. In total, more
than 94% of recorded DH movements were within the two 3.4 km wide tagging sites.
Average time at liberty was high in all three tagging programs (Table 4.1) but significantly
higher in both MPAs than in the ORI program (Kruskal-Wallis ANOVA, p = 0.0128),
individual fish recorded as being resident at TNP and DH for over 7 and 5.5 years,
respectively. The distance moved by individuals in the combined programs was not
significantly related to time at liberty (Spearman R = 0.088, p = 0.2, Figure 4.6), or to fish
size (Spearman R = 0.014, p = 0.839, Figure 4.7). Several individuals (n = 18; 9%) were
recaptured twice and one fish on three occasions. Most multiple recaptures (83%) were made
at their respective sites in DH and the two recorded from TNP also exhibited limited
movements.
0
10
20
30
40
50
60
70
80
90
100
>-55 -50 -45 -40 -35 -30 -25 -20 -15 -10 -5 0 5 10 15 20 25 30 35 40 45 50 >55
Movement (km)
Recap
ture
fre
qu
en
cy (
%)

Chapter 4: Movement patterns inferred from long-term tagging programs
43
Figure 4.5. Proportion of TNP blacktail movements recorded within 100 m increments from
the tagging locality (n = 31).
Figure 4.6. Blacktail movements (n = 192) relative to time at liberty
(combined programs; scale not preserved for largest movements - depicted at 50 km).
0
10
20
30
40
50
60
70
80
90
100
1 2 3 4 5 6 7 8 9 10 11 12 13 14 15 >15
100 m displacement bin
Recap
ture
fre
qu
en
cy (
%)
0
5
10
15
20
25
30
35
40
45
50
0 500 1000 1500 2000 2500 3000
Days at liberty
Ob
serv
ed
mo
vem
en
t (k
m)

Chapter 4: Movement patterns inferred from long-term tagging programs
44
Figure 4.7. Blacktail movements (n = 192) relative to length at recapture (combined
programs; scale not preserved for largest movements - depicted at 50 km).
4.3.2 Zebra
Of the 2126 zebra tagged along the South African coastline, 58 were recaptured (Table 4.3).
Although TNP had a lower overall recapture rate than both DH and ORI, this difference was
not significant at α = 0.05 (two-tailed proportions test, p = 0.0504 and 0.057, respectively).
Table 4.2. Summary of movement data for zebra tagged and recaptured along the South
African coast, 1984-2007.
0
5
10
15
20
25
30
35
40
45
50
150 175 200 225 250 275 300 325 350 375 400 425
Length at recapture (mm FL)
Ob
serv
ed
mo
vem
en
t (k
m)
Tagging Number Number Recapture Zero Average & Average &
program of fish of fish rate displacement {maximum} {maximum}
tagged recaptured (%) (%) movement days at
{tag-scars} in km liberty
ORI 486 16 3.29 68.75 1.86 {11} 217 {1399}
DH 1195 36 3.01 94.59 1.70 {52} 200 {550}
TNP 445 6 {12} 1.34 85.71 0.14 {1.5} 189 {437}
Total 2126 58 2.73 84.75 1.63 {52} 203 {1399}

Chapter 4: Movement patterns inferred from long-term tagging programs
45
Zebra rarely moved from their tagging locality, with 85% of recaptures zero displacements.
A few fish recaptured in the ORI program revealed small movements, with a maximum
reported distance of 11 km, but over the combined programs only one fish moved further than
15 km. Five of the seven observed ‘non-zero’ movements were to areas west of the tagging
locality (Figure 4.8), but whether this was evidence of a true directional movement pattern
was equivocal due to the small sample size.
Figure 4.8. Movements of 58 zebra recaptured along the South African coast (combined
programs). Negative values represent displacements in a westerly, and positive values an
easterly, direction.
At DH, 35 fish (97%) were recaptured within the MPA, of which only one fish moved the 11
km between the two tagging sites. An additional fish moved 52 km west of its tagging site.
Eight higher spatial-resolution DH movements recorded after 1998 indicated that zebra
movements were generally on a scale smaller than the 3.4 km extent of the DH tagging sites.
Six (75%) were recaptured at their tagging locality (i.e. movement ≤ 100 m), one at an
immediately adjacent locality (i.e. movement ≤ 200 m), and the remaining one moved
between 2 and 2.2 km. Recaptured zebra from the TNP also exhibited extremely restricted
movements, with four of seven (57%) recaptures at the original tagging locality (Figure 4.9).
0
10
20
30
40
50
60
70
80
90
100
>-55 -50 -45 -40 -35 -30 -25 -20 -15 -10 -5 0 5 10 15 20 25 30 35 40 45 50 >55
Movement (km)
Recap
ture
fre
qu
en
cy (
%)

Chapter 4: Movement patterns inferred from long-term tagging programs
46
Figure 4.9. Proportion of TNP zebra movements recorded within 100 m increments from the
tagging locality (n = 7).
Similar to blacktail, as the majority of recaptures were zero displacements there was no clear
trend of zebra movements with either time at liberty or size at recapture (Figures 4.10 and
4.11). There were no significant differences in average time at liberty between programs
(Kruskal-Wallis ANOVA, p = 0.268). A fair proportion of recaptures (13.6%) were made
over a year after tagging, mostly zero displacements.
Figure 4.10. Observed zebra movements (n = 58) relative to time at liberty (combined
programs).
0
10
20
30
40
50
60
70
80
90
100
1 2 3 4 5 6 7 8 9 10 11 12 13 14 15 >15
100m displacement bin
Recap
ture
fre
qu
en
cy (
%)
0
10
20
30
40
50
60
0 200 400 600 800 1000 1200 1400 1600
Days at liberty
Ob
serv
ed
mo
vem
en
t (k
m)

Chapter 4: Movement patterns inferred from long-term tagging programs
47
Figure 4.11. Observed zebra movements (n = 58) relative to length at recapture (combined
programs).
4.3.3 Musselcracker
Of 1782 musselcracker tagged along the South African coast, 60 were recaptured. DH
recapture rates were lower than in both TNP and ORI, although only significantly lower than
ORI (Table 4.4; two-tailed proportions test, p = 0.041). Most (66%) recaptured
musselcracker revealed limited movements (‘zero displacements’), while some (12%) moved
between 5 and 25 km either east or west of their tagging locality. Additionally, an even
greater proportion (22%) moved distances in excess of 80 km, predominately in an easterly
direction (Figure 4.12).
Table 4.3. Summary of movement data for musselcracker tagged and recaptured along the
South African coast, 1984-2007.
Tagging Number Number Recapture Zero Average & Average &
program of fish of fish rate displacement {maximum} {maximum}
tagged recaptured (%) (%) movement days at
{tag-scars} in km liberty
ORI 821 33 4.02 62.50 96.78 {843} 632 {2313}
DH 393 7 1.78 57.14 50.00 {181} 919 {2409}
TNP 568 20 {10} 3.52 77.27 19.95 {209} 352 {1979}
Total 1782 60 3.37 65.57 63.70 {843} 564 {2409}
0
10
20
30
40
50
60
200 225 250 275 300 325 350 375 400
Length at recapture (mm FL)
Ob
serv
ed
mo
vem
en
t (k
m)
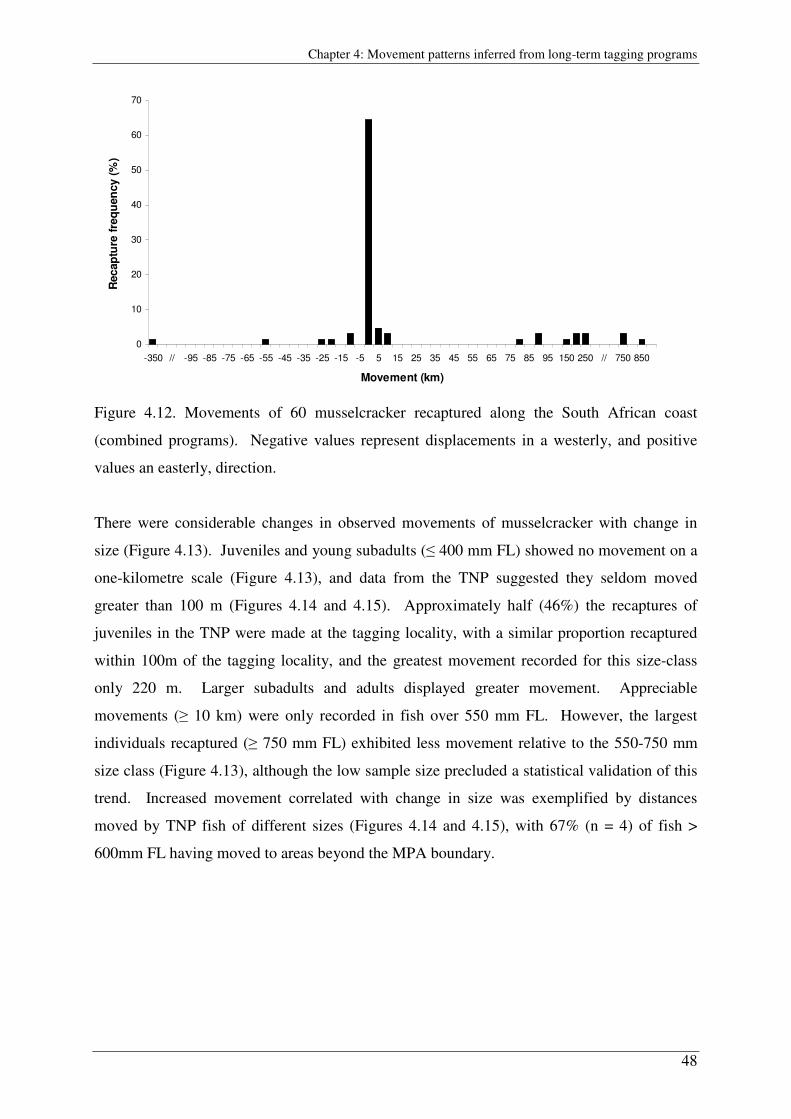
Chapter 4: Movement patterns inferred from long-term tagging programs
48
Figure 4.12. Movements of 60 musselcracker recaptured along the South African coast
(combined programs). Negative values represent displacements in a westerly, and positive
values an easterly, direction.
There were considerable changes in observed movements of musselcracker with change in
size (Figure 4.13). Juveniles and young subadults (≤ 400 mm FL) showed no movement on a
one-kilometre scale (Figure 4.13), and data from the TNP suggested they seldom moved
greater than 100 m (Figures 4.14 and 4.15). Approximately half (46%) the recaptures of
juveniles in the TNP were made at the tagging locality, with a similar proportion recaptured
within 100m of the tagging locality, and the greatest movement recorded for this size-class
only 220 m. Larger subadults and adults displayed greater movement. Appreciable
movements (≥ 10 km) were only recorded in fish over 550 mm FL. However, the largest
individuals recaptured (≥ 750 mm FL) exhibited less movement relative to the 550-750 mm
size class (Figure 4.13), although the low sample size precluded a statistical validation of this
trend. Increased movement correlated with change in size was exemplified by distances
moved by TNP fish of different sizes (Figures 4.14 and 4.15), with 67% (n = 4) of fish >
600mm FL having moved to areas beyond the MPA boundary.
0
10
20
30
40
50
60
70
-350 // -95 -85 -75 -65 -55 -45 -35 -25 -15 -5 5 15 25 35 45 55 65 75 85 95 150 250 // 750 850
Movement (km)
Recap
ture
fre
qu
en
cy (
%)

Chapter 4: Movement patterns inferred from long-term tagging programs
49
Figure 4.13. Observed musselcracker movements (n = 60) with length at recapture (combined
programs).
Figure 4.14. Proportion of observed movements of juvenile (---) and adult (___
) musselcracker
in the TNP that fell within a given distance from the tagging locality (n = 13 (juveniles); 9
(adults), including multiple recaptures). Note non-linearly increasing distance scale.
0
100
200
300
400
500
600
700
800
900
200 300 400 500 600 700 800 900 1000
Recapture length (mm FL)
Mo
vem
en
t (k
m)
0
10
20
30
40
50
60
70
80
90
100
0 25 50 75 100 250 500 750 1000 10000 100000 1000000
Observed movement (m - log scale from 1000 m)
Cu
mu
lati
ve p
rop
ort
ion
of
recap
ture
s (
%)

Chapter 4: Movement patterns inferred from long-term tagging programs
50
Figure 4.15. Observed musselcracker movements (n = 22, including multiple recaptures) with
change in length from the TNP. Note non-linearly increasing distance scale.
Across all three programs nearly 70% (n = 19) of recaptured musselcracker ≥ 550 mm FL
showed movement from their tagging locality (Figure 4.15), which could be characterised as
either (i) limited movements with no trend in direction or seasonality, or (ii) large eastwards
movements predominantly during the spring and summer spawning season (August to
January; Table 4.4).
Table 4.4. Movements of musselcracker ≥ 550 mm FL recaptured along the South African
coast (n = 28).
Movement Number of fish Distance moved FL (mm) Recaptured
recaptured in spawning
season
Number {% of total} Min Max Avg. Min Max Avg. %
Zero 9 {32.14} n/a n/a n/a 554 920 707 77.78
East 13 {46.43} 7 843 265.8 567 840 666.6 84.62
West 6 {21.43} 8 311 71.2 554 820 672.1 50
1
10
100
1000
10000
100000
1000000
200 300 400 500 600 700 800 900
Length at recapture (mm FL)
Ob
serv
ed
mo
vem
en
t (l
og
(y+
1)
m)

Chapter 4: Movement patterns inferred from long-term tagging programs
51
Based on the magnitude and direction of all movements greater than 10 km, two trends were
apparent. Firstly, there was a greater frequency of eastward movements, predominantly
recorded during the spawning season and of greater magnitude than westward movements
(Figure 4.16). Secondly, recapture areas of fish tagged at different sites along the coast were
geographically distinct (Figure 4.16, see discussion). Although a high proportion of eastward
movements were observed during the spawning season (August to January - Table 4.4), this
was not significantly higher than the proportions of zero displacements and westward
movements observed over this period (two-tailed proportions test, p = 0.284).
Figure 4.16. Location and magnitude of large-scale movements (> 10 km) recorded for
musselcracker along the South African coast. All movement localities are coastal, with their
position described by an imaginary line perpendicular to the coastal orientation and meeting
the origin (tagging locality) or tip (tag recovery locality) of the respective arrows.
Eastern Cape
KwaZulu-Natal
Western Cape
Durban
East London
Algoa BayCape St
Francis
Tsitsikamma MPAMossel
BayDe Hoop MPA
Cape Town
N

Chapter 4: Movement patterns inferred from long-term tagging programs
52
4.4 Discussion
This study made use of movement data, albeit at different spatial resolutions, from three
tagging programs that spanned periods exceeding 10 years and covered the entire South
African distribution of blacktail, zebra and musselcracker. This allowed for a good appraisal
of the movement behaviour and dispersal of these species. Overall recapture rates were low
(< 4%), and significantly lower for blacktail tagged in the TNP in comparison to DH. Both of
these were highly structured scientific projects with trained scientists applying tags. The
TNP, unlike the DH coastline, is characterised by steep cliffs and a rugged rocky intertidal
zone, and it is therefore proposed that higher levels of tag loss, resulting from increased
contact with rocks, occurred in the TNP. Additionally, greater amounts of epiphyte growth
on tags (Figure 4.1) were recorded on fish from rocky habitats (P. Cowley, South African
Institute for Aquatic Biodiversity, pers. comm.). Griffiths & Attwood (2005) suggested
fouled tags might alter a fishes’ behaviour and/or health, and ultimately result in reduced
recapture rates. High levels of tag loss in the TNP were confirmed by fish bearing
characteristic tag scars (Figure 4.2, Tables 4.1, 4.2 and 4.3). If these individuals were
considered normal recaptures, overall recapture rates from the TNP would have been
substantially higher and closer to the other programs. Unfortunately, tag scars were
unreported for DH and ORI, making comparisons of tag loss rates impossible.
In contrast to blacktail, white musselcracker in DH had the lowest overall recapture rate. This
was likely due to the higher average size of musselcracker tagged in DH than in the other
programs. Juvenile (< 400 mm FL) musselcracker were rarely caught at DH relative to larger
fish, leading to less of these resident individuals being tagged and recaptured than in other
programs. The ORI program utilised predominantly volunteer anglers to tag fishes at varying
localities along the South African coastline, whilst the MPA programs (TNP and DH) used
experienced scientific personnel (Attwood & Cowley 2005). The chances of recovering
resident fishes (zero displacement) from MPA programs were proportionally higher than the
ORI program due to standardised recapture effort and 100% reporting rates. Unquantified
levels of ‘patchily’-distributed recapture effort and unknown reporting rates outside of the
MPA sites thus complicated analysis of coastwide movement patterns. Consequently, the
high frequency of zero displacements may need to be considered with caution, as the majority
were recorded from the MPA programs, which are characterised by high levels of recovery
effort centred on the research site (i.e. zero-displacements) versus outside areas.

Chapter 4: Movement patterns inferred from long-term tagging programs
53
However, the DH data allowed for comparison of recapture rates ‘within’ versus ‘between’
sites, and together with high spatial-resolution results from the TNP confirmed the
predominance of highly restricted movements. Non-reporting of tag-recoveries has been
recorded in several South African studies (Attwood & Bennett 1994, Brouwer 1997,
Lamberth 1997 cited in Attwood & Cowley 2005, Kerwath 2005) and been ascribed to (i)
ignorance and fear of prosecution for illegal fishing activities (e.g. fishing in an MPA), (ii) the
desire to keep fishing spots unknown to others, or (iii) simply forgetting to post the tag and
recapture information to ORI. Additionally, Brouwer (1997) reported that many fishermen
gave recovered tags to angling clubs or fishing tackle shops that subsequently failed to report
them to ORI. The vagaries of the South African postal system may also have resulted in the
non-recording of tag returns. Recently, tags bearing a mobile phone number have been used
in the Addo National Park, enabling fisherman to immediately report recaptures and provide
additional data to scientists. Although preliminary, this has proved to be successful (P.
Cowley, South African Institute for Aquatic Biodiversity, pers. comm.) and will hopefully
result in increased reporting rates in future studies. Movement distances recorded in the ORI
database might be in error because localities are sometimes reported as that of the closest
town, or as access points to areas with widely-distributed fishing sites. Such errors may
significantly influence the results of studies on resident species that display limited
movements. If a potential reporting error of 5 km (Attwood & Cowley 2005) were taken into
account in this study, more than 50% of blacktail and 80% of zebra movements may have
been zero displacements on a one-kilometre scale. Correspondingly, however, certain zero
displacements could have misrepresented movements of up to 5 km.
All three species displayed limited movement over long periods. Blacktail and zebra showed
extreme residency throughout adolescent and adult life. Similarly, juveniles and young
subadult musselcracker were extremely resident, but older individuals displayed both resident
and dispersal behaviours, with movements of up to 850 km observed. The limited movement
of blacktail, zebra and juvenile musselcracker over relatively long periods was indicative of
strong site-fidelity and temporally stable home ranges of limited extent. Although these could
not be directly quantified, home ranges are characteristic of numerous reef fish species, both
in temperate (Matthews 1990, Lowry & Suthers 1998, Lowe et al. 2003) and tropical areas
(Zeller 1997, Eristhee & Oxenford 2001, Meyer et al. 2000, Meyer & Holland 2005), and
would be expected for resident blacktail and zebra.

Chapter 4: Movement patterns inferred from long-term tagging programs
54
The small-scale movements observed in the TNP suggested home ranges of these fishes
spanned alongshore distances of between 10 and 100 m. Kramer & Chapman (1999)
provided a prediction of the linear extent of home ranges of resident reef fishes from their
length (as a proxy for size). From this, home ranges for average-sized blacktail and zebra
(305 and 275 mm FL respectively) recaptured in the TNP were predicted as 123 m and 96 m.
Approximately 70% of observed movements fell within this range. Similarly, average-sized
musselcracker (281 mm) recaptured in the TNP were predicted to have a home range of 101
m and over 90% of recaptured juveniles were within 75 m of their tagging locality. This is
not incongruent with the larger home range prediction as this is based on studies of sometimes
widely different species. Individual fish may also have smaller (or larger) home ranges than
those characteristic of their species because home range size may be determined by localised
environmental characteristics (e.g. habitat features such as reef rugosity).
In addition, it is possible that the recorded angling locality only represented a smaller portion
(i.e. a foraging area) of the extended home range of recaptured individuals. Small recapture
displacements on a plane parallel to shore may have comprised a smaller component of home
ranges that extend in a direction perpendicular to the shore. Individuals with home ranges
centred offshore may have made periodic inshore excursions (e.g. during high tide periods) to
feed or for other activities (Gibson 2003). Biden (1948) referred to blacktail moving to sandy
areas “an hour before high tide” to feed. Similarly, Krull (1999) reported that blacktail move
into gullies and similar areas during high tide. The advantages of small, well-established
home ranges in the dynamic physical conditions of their nearshore habitats are apparent for
these fishes. Knowledge of their home range area enables efficient refuge from predators,
foraging, resting, retreat from strong water currents or movement back to these after
displacement. Life in shallow water often exposes these fishes to rough water conditions (e.g.
in narrow rocky gullies and areas where waves break onto reefs). In this turbulent ‘white
water’ sight alone is unlikely to be successful for navigation, but in combination with sight
and the lateral-line system intimate knowledge of the home range area layout probably
facilitates efficient obstacle avoidance.
Chapter 4: Movement patterns inferred from long-term tagging programs
55
Blacktail and zebra occasionally made comparatively large movements, with approximately
4% of DH blacktail moving at least 11 kilometres between the two tagging sites. Attwood &
Cowley (2005) proposed two models of movement for the generally resident galjoen
(Dichistius capensis), which might be considered applicable to blacktail and zebra. Their
“tourist” model predicts fish are resident in a particular area, but make periodic movements to
one or more alternative sites along the coast where they reside for varying periods of time
before returning to one of the other areas. The alternative “polymorphic” model predicts that
the population consists of both resident and nomadic individuals. However, the observed
frequency and magnitude of large blacktail and zebra movements was lower than those of
galjoen. Lack of movement at second recapture, following initial movement, for one DH and
one ORI blacktail suggested permanent establishment of a new home range. There are
numerous possible reasons for fishes to abandon their home range, not least of which the
stress of capture and tagging resulting in vacation of the thereafter ‘unsafe’ home range
(Thorstad et al. 2004). Other potential reasons include ontogenetic migration, displacement
by severe sea conditions or competitive processes within an established home range (Kramer
& Chapman 1999). There was no relationship between displacement and fish size, so it is
likely that the few observed large movements for blacktail and zebra were not linked to
ontogenetic factors.
Most of the larger musselcracker (> 550 mm FL) made substantial movements. These fish are
powerful swimmers and movements of a few kilometres could easily have been made during
the course of normal daily activities. However, many large fish exhibited residency for
considerable periods, suggesting that they also had relatively small core home range areas.
Following predictions of Kramer & Chapman (1999), a 550 mm FL fish would have a home
range close to 500 m in width, while at 800 mm a home range of over 1 km would be
expected. Habitat structure (continuity and connectivity) has been shown to influence the
distribution (Nanami & Nishihira 2002) as well as the occurrence and scale of daily
movements of fishes (Pittman et al. 2007, Chateau & Wantiez 2008, Nagelkerken et al.
2008). It is probable that in areas where the distribution of reefs supporting sufficient prey is
patchy large musselcracker make movements between reefs separated by a few kilometres or
more during daily feeding activities, while in areas of continuous reef habitat movements are
more restricted. This may have explained movements of intermediate distance, but cannot
account for those of larger extent (> 10 km).

Chapter 4: Movement patterns inferred from long-term tagging programs
56
Booth (2000) suggested this species undertakes a spawning migration from Southern and
Eastern Cape waters to Transkei and KwaZulu-Natal waters. Observed movements of fish
tagged from Algoa Bay eastwards recaptured on the central KwaZulu-Natal coastline during
the spawning season supported this hypothesis. Such movements were also corroborated by
data from shore-angler catch records in KwaZulu-Natal, with musselcracker catches on this
section of the coast predominantly occurring between July and November (P. Pradervand,
Oceanographic Research Institute, unpublished data). The two tagged fish recaptured
between Algoa Bay and KwaZulu-Natal were caught outside this period (late February and
April), and were likely fish ‘in transit’ between these regions. KwaZulu-Natal anglers and
spearfishermen refer to an annual musselcracker “run” that begins between late June and
August and ends between late November and December, depending on the year (Fishing
reports - The Mercury; 2004-2007, Monthly spearfishing reports – www.spearfishingsa.co.za;
2001-2007). Evidently, large numbers of musselcracker undertake a spawning migration to
KwaZulu-Natal waters each year. However, during the spawning season musselcracker are
also targeted and captured throughout their distributional range, particularly in Mossel Bay
(Joubert 1980, van Rooyen 1987, Schoeman, publishing date unknown) and Algoa Bay
(Clarke & Buxton 1989, Coetzee & Baird 1981). The KwaZulu-Natal migration must
therefore only be undertaken by a proportion of the breeding musselcracker population.
Observed movements of fish tagged at different localities along the coast (Figure 4.16) may
represent distinct spawning areas for fish resident in particular regions outside of the
spawning season, with (i) fish from Algoa Bay eastwards moving up the Transkei coast to
central KwaZulu-Natal, (ii) fish from other Eastern Cape regions moving eastwards towards
Algoa Bay, and (iii) Western Cape fish moving eastwards to a locality west of Tsitsikamma
(possibly representatives of the well-known Mossel Bay aggregations). Nearshore
oceanography supports this hypothesis. Off KwaZulu-Natal and the Transkei the Agulhas
Current lies close inshore, and many species have evolved life-histories that utilise
southward-moving inshore currents in this area to transport eggs and larvae to nursery areas in
the Eastern and Western Cape (Hutchings et al. 2002). These species include the white
steenbras (Lithognathus lithognathus; Bennett 1993), red steenbras (Petrus rupestris; Smale
1988) and geelbek (Atractoscion aequidens; Griffiths & Hecht 1995). Musselcracker eggs
and larvae spawned off central KwaZulu-Natal would be transported southwards and
settlement-stage larvae located off the Eastern Cape coast, where large areas of suitable rocky
nursery habitat exist.

Chapter 4: Movement patterns inferred from long-term tagging programs
57
Lutjeharms et al. (1986) reported that recoveries of drift card releases from the South African
east coast were highest from those made west of Algoa Bay, these moving in both easterly
and westerly directions, while cards released further east off the Eastern Cape coast (e.g. off
East London) generally became entrained in the Agulhas current and displaced offshore with
its passage along the shelf-break. Similarly, Hutchings et al. (2002) suggested that, due to
complex water circulation in this region, eggs and larvae spawned here are as likely to be
displaced far offshore as southeastwards onto the Agulhas Bank. The region immediately east
of Algoa Bay may therefore represent a physical obstruction to successful spawning and
consequently necessitate the spawning migration of this species to KwaZulu-Natal waters.
While this hypothesis seems counterintuitive to that of larval drift from KwaZulu-Natal to
Eastern Cape waters, when they reach this region larvae have probably developed sufficient
swimming abilities to avoid offshore displacement, maintaining a nearshore position until
settlement.
Similarly, the use of more southerly spawning areas along the Eastern and Western Cape
coasts is driven by local oceanographic conditions. West of Algoa Bay the Agulhas current
lies a considerable distance offshore, located furthest away in the Agulhas Banks region, and
does not affect inshore conditions to the same extent as further east. Drift of eggs and larvae
spawned here is more likely to be affected by nearshore oceanography driven by coastline
topography and prevailing wind regimes (Schumann 1999, Hutchings et al. 2002). Recovered
surface drift cards released east of Cape Agulhas on the Agulhas Banks show retention in this
region and movement onshore with prevalent southerly summer winds (Shannon & Chapman
1983). In contrast, drift card releases west of Cape Agulhas moved around the Cape
Peninsula under prevailing winds and currents and became entrained in the west coast
upwelling system (Lutjeharms et al. 1986). If pelagic eggs and early larval stages are
considered similarly passive particles, spawning in Western and Eastern Cape waters east of
Cape Agulhas would lead to retention of eggs and developing larvae in this region,
minimising loss to unsuitable Benguela Current waters located west of the Cape Peninsula. It
is hypothesised that this would also be a physically less-demanding strategy for fish resident
in these waters than to undertake a spawning migration to KwaZulu-Natal.

Chapter 4: Movement patterns inferred from long-term tagging programs
58
The eastward migrations of musselcracker and several other coastal fish species to KwaZulu-
Natal during the winter months coincide with reduced water temperatures, reduced southward
current speeds and increased northeasterly inshore countercurrents (Schumann 1988), thereby
providing suitable conditions for the establishment of a seasonal extension of their normal
distributional ranges (Garratt 1988, van der Elst 1988b, Beckley & van der Lingen 1999).
Observed musselcracker movements to KwaZulu-Natal would certainly fit this hypothesis,
and it could be argued that these are therefore not driven by spawning activity per se, but
rather by physiologically suitable conditions resulting in a seasonal range expansion (Clarke
1988). However, musselcracker arrive in KwaZulu-Natal later than species traditionally
regarded as winter migrants and stay well into the summer months during warmer water
conditions (P. Pradervand, Oceanographic Research Institute, unpublished data). This would
appear to refute the range extension hypothesis, although the seasonal temperature changes on
this section of the coast may facilitate the migration process and may have been involved in
its evolution.
It must be noted that hypothesised musselcracker spawning migration patterns are at present
based on very limited recapture data and need to be further examined. This could be achieved
by examination of standardised CPUE data; however, at present, only the two widely
separated DH and TNP studies provide estimates of effort for reliable abundance estimates
from tagging data. Because no effort data is available from the ORI tagging database, the
numbers of musselcracker tagged in various regions of the coast at particular times cannot be
reliably used for this purpose due to potential spatial and temporal biases (e.g. increased effort
in certain areas over holiday seasons). Dynamics of reproductive movements (i.e. exact
timing; demographic and social characteristics; relation to potential environmental and
biological driving factors; exact localities and frequency of spawning; degree of spawning site
fidelity and natal homing; potential stock segregation) could be investigated through genetic
studies, otolith microchemistry and/or archival tagging of adults. Given this species’ large
size, the use of archival data storage tags should be feasible. Natural tags can potentially also
be used to uncover temporal patterns in area use of individuals. For example, movement to
warmer KwaZulu-Natal waters should be reflected in 18
Oxygen stable isotope levels, related
to ambient water temperatures (Weidman & Millner 2000, Stephenson et al. 2001), deposited
in otoliths and possibly scales (allowing non-lethal sampling; Perga & Gerdeux 2001,
Kennedy et al. 2005) of individual fishes.

Chapter 5: Foraging activity and habitat use inferred from research angling
59
Chapter 5 - Foraging activity and habitat-use patterns
inferred from research angling data
5.1 Introduction
The South African shallow inshore marine environment is characterised by dynamic wave
action and associated high-energy conditions. The turbulent conditions within these areas
make underwater visual census, videography or even remote recording of fish behaviour (e.g.
acoustic telemetry) practically impossible. Consequently, studies on the behavioural ecology
of resident species within these areas, such as those under investigation here, are extremely
difficult. Resident species with relatively small home ranges often have a strong temporal
component to their behaviour (Pittman & McAlpine 2003). For example, endogenous
circadian rhythms (Boujard & Leatherland 1994) and exogenous environmental factors such
as the daily tidal (Gibson 2003) and light cycles (McFarland 1986, Helfman 1993) often
influence activity patterns and associated behaviour of many fish species.
Foraging can comprise the dominant behaviour of fish during periods of activity (Matsumoto
2001). The three study species have been described as searchers (Mann 1992, Clarke 1988),
whereby they actively seek out prey (Hughes 1980). There is thus a direct link between their
foraging behaviour, activity patterns and movements between areas in search of food. Whilst
their dietary composition (Buxton & Clarke 1991, Mann & Buxton 1992) and habitat
preferences (Clarke 1988, Mann 1992) have previously been described, these did not examine
foraging behaviour beyond brief descriptive observations. The use of baited fishing gear to
catch fishes has an implicit relationship to their foraging activities. Whilst it may thus be
regarded as a biased sampling method for studies on the temporal abundance of fishes, it
potentially provides a method of studying their foraging behaviour and activity patterns with
respect to temporal rhythms and habitat preferences. Long-term research angling data from
the Tsitsikamma National Park (TNP) recorded catches of resident reef fishes at a high spatial
and temporal resolution and presented an opportunity to test whether standardised research
angling data can be used to infer foraging activity patterns of the study species.

Chapter 5: Foraging activity and habitat use inferred from research angling
60
The majority of studies on fish foraging behaviour make direct observations on the animals
(e.g. Nanami & Yamada 2008), or spatial and temporal analysis of gut contents (e.g. Bromley
et al. 1997, Hibino et al. 2006). Predominant sea conditions precluded underwater
observation of fishes at the study site, and incorporating gut content analysis would have
required sacrificing large numbers of resident reef fishes in a MPA proclaimed to conserve
their populations, and was not considered. Capture rates (catch per unit effort) on baited
sampling gear are often used to infer fish abundance and distribution, but while numerous
studies have studied fish behaviour towards baited gear (e.g. Grimes et al. 1982, Fernö &
Huse 1983, Løkkeborg et al. 1989), there have only rarely been reciprocal studies using
baited gear to study their foraging behaviour (Hall et al. 1990, Løkkeborg 1998). To what
extent observed variation in fish capture is attributable to their natural foraging patterns
determines the validity of this method. Both ability of fish to detect bait and likelihood of
them consuming it may be affected by a number of factors in addition to natural foraging
patterns. According to Stoner (2004), these factors include strength and direction of water
currents (influencing olfactory detection), water clarity (affecting visual detection and
identification of bait and/or angling disturbance), availability of natural prey (trade-offs
between preferred food and search time) and fish satiation level (hungry individuals more
likely to consume “unnatural” bait). Data collected from research shore-angling in the TNP
included time and locality of capture, thereby providing information on the association with
diurnal light and tidal cycles as well as specific habitat. This study made use of catch data to
infer (i) foraging activity patterns in relation to time of day and/or tidal phase, and (ii) habitat
use of the study species, by examining the effects of these factors on probability of capture on
baited fishing gear.
5.2 Methods
Details of the Bloukrans study site and research angling activities are described in Chapters 2
and 4. Supplementary information is provided below.
5.2.1 Angling activities
Six years of TNP catch and effort data from late 2001 to the end of 2007 were analysed. All
angling localities were named and georeferenced (see Chapter 4). The generally rocky
coastline resulted in these being stable in terms of subtidal habitat throughout the study
period. Anglers only fished during daylight hours, generally starting within an hour after
sunrise and finishing within an hour of sunset.

Chapter 5: Foraging activity and habitat use inferred from research angling
61
They were not constrained to fish particular localities, moving between these throughout the
day. Periods spent fishing continuously by individual anglers at each locality were recorded
and designated unique angling ‘stations’. Recorded information included the station locality,
start and end times, as well as capture times and fork length (to the nearest millimetre) of all
fishes caught. Bait and tackle set-ups, including hook sizes, varied between anglers. The
dominant bait species included pilchard (Sardinops sagax), redbait (Pyura stolonifera),
chokka squid (Loligo vulgaris reynaudii), octopus (Octopus vulgaris), polychaete worms
(Marphysa spp., Pseudonereis variegata), sand mussel (Donax serra) and pink prawn
(Haliposoides triarthrus).
5.2.2 Diurnal and tidal cycles
Angling effort and fish capture times were categorised according to the diurnal (light) and
tidal cycles. The daily light cycle was divided into six light-phase categories standardised
around times of sunset and sunrise (instead of equal division of the entire day, which varied in
length with season), as they are important initiators of activity and behaviour in many diurnal
fish species. This resulted in the following six light-phase categories:
1. Dawn (0-2 hrs after sunrise)
2. Morning (2-4 hrs after sunrise)
3. Noon(1) (4 hrs after sunrise to mid-day)
4. Noon(2) (mid-day to 4 hrs before sunset)
5. Afternoon (4-2 hrs before sunset)
6. Dusk (2-0 hrs before sunset)
The tidal cycle was similarly divided into eight categories in relation to high and low tide.
‘High’ and ‘Low’ were standardized as one-hour periods between thirty minutes before and
after high and low tide, respectively. The remaining tidal period was divided into six equal
sections, giving the following ordered tide-phase categories [based on those of Braune &
Gaskin (1982)]:
1. High (High)
2. Slow-ebb 1 (SE1)
3. Fast-ebb (FE)
4. Slow-ebb 2 (SE2)
5. Low (Low)
6. Slow-flood 1 (SF1)
7. Fast-flood (FF)
8. Slow-flood 2 (SF2)

Chapter 5: Foraging activity and habitat use inferred from research angling
62
5.2.3 Habitat classification
Physical conditions limited the use of traditional quantitative techniques (e.g. underwater
transect surveys) to describe habitat at most angling localities. An indirect two-tiered
approach was therefore used to classify these to broad habitat categories – namely sandy,
shallow reef and deep reef habitats. Firstly, experienced research anglers’ knowledge of
angling localities was utilised to assign them a broad habitat type. Anglers’ knowledge of
habitat at particular localities had been acquired during opportunistic above- and below-water
observations during exceptionally calm water conditions, and angling activities (e.g.
frequency of snagging on reefs versus sand-dominated areas). Secondly, overall species catch
composition at localities functioned as a proxy for habitat and therefore a method of
corroborating angler habitat classifications. All main localities’ species compositions were
analysed for similarity using cluster analysis (group-averaged Bray & Curtis distances) on
square-root transformed relative abundances of individual species. Occurrence of indicator
species, generally restricted to specific habitats, at sites within the resulting clusters identified
their habitat type. Localities that could not satisfactorily be assigned a habitat type using
these methods were not included in subsequent capture probability analyses.
5.2.4 Size-classes
All captured individuals of the study species were assigned to a size-class based on their
recorded length. Blacktail were classified as small, medium or large, corresponding to fish of
length < 250, 250-299 and > 300 mm FL, respectively, zebra either small or large (< 300 mm
versus > 300 mm FL), and musselcracker small or medium (< 400 and 400-599 mm FL).
Larger musselcracker (> 600 mm FL) were rarely caught during the study period.
5.2.5 Season and water temperature
Months during which sampling took place were assigned the following seasons:
1. Summer (December to February)
2. Autumn (March to May)
3. Winter (June to August)
4. Spring (September to November)

Chapter 5: Foraging activity and habitat use inferred from research angling
63
Daily water temperature was recorded by a permanently-moored underwater temperature
recorder (depth 20 m) within 30 km of the study site, the temperature anomaly being
expressed as ‘relative water temperature’, defined as the difference from average water
temperatures recorded for the corresponding season at the study site over recent years (M.
Roberts, Marine and Coastal Management, unpublished data).
5.2.6 Additional data preparation
Each angling station was divided into portions in relation to periods falling within the light-
and tide-phase categories. As anglers sometimes fished localities concurrently, the total effort
at a particular angling locality during each light- or tide-phase on each day was the sum of all
station portions fished concurrently there. All fish caught at each angling locality were
similarly assigned to a light- and tide-phase category to quantify capture success or failure for
the particular species’ length class for each category on each day.
5.2.7 Statistical analysis
For each size class of each species, effects of habitat-type, light-phase, tide-phase, season,
relative water temperature and angling effort on probability of capture were analysed with
hierarchical logistic regression (Snijders & Bosker 1999, Lee & Nelder 2001). Observed data
were the binary outcomes of whether at least one fish was caught during a particular period in
a particular locality (1), or not (0). This was expected to follow the single-trial binomial
distribution (Bernoulli distribution), and related to a linear combination of the explanatory
variables through the logit link function (McCullagh & Nelder 1989). Spatial and temporal
coverage of angling effort was highly variable and localities were fished repeatedly over
variable categories on the same or different days to others. Unrecorded environmental
variables that varied between angling days potentially influenced both angling operations and
fish foraging behaviour, and the indirect habitat classification method used also potentially
resulted in unquantified small-scale habitat characteristics of particular localities influencing
capture probability. Failure to consider the resulting relatedness of data collected on the same
day or at the same locality during analyses would constitute (respectively) temporal and
spatial pseudoreplication (Hurlbert 1984), potentially bias model parameter estimates and
possibly lead to incorrect statistical inference (Millar & Anderson 2004). Hierarchical
generalized linear models (HGLMs - Lee & Nelder 2001) were therefore used to account for
relatedness of the data.

Chapter 5: Foraging activity and habitat use inferred from research angling
64
In HGLMs, random effects incorporate correlation between observations at each level of a
nested hierarchy. In this case random effects were included for each angling day and angling
locality; the resulting hierarchy consisting of individual observations within each particular
angling day and locality. HGLMs compare the residual of each observation to the mean of all
observations for its higher levels (i.e. its specific angling day and locality), as well as that of
the overall population of observations as in normal regression (Snijders & Bosker 1999).
Zero values dominated the observed data set (ca 85% of medium-size blacktail observations,
the most abundant species caught) and therefore binary capture probability was preferred to
capture rate as the measure of foraging activity. As angling trips always coincided with
spring tide periods, light- and tide-phases were highly correlated (Figure 5.1) and were only
included as explanatory variables in separate analyses.
Selection of final models utilised the Akaike Information Criterion (AIC; Akaike 1981), in
comparison of alternative simple logistic models, to arrive at a final model that was then
analysed with hierarchical logistic regression. AIC is based on the amount of observed
variation explained by a model and its number of parameters, which exert opposing influences
on the AIC score, the best-fitting model of the data giving the lowest AIC score. AIC scores
were calculated for models containing all main effect combinations as well as first-order
interactions of the explanatory variables. As the main variables of interest, light or tide-
phase, together with habitat, were always retained in final models. In the final hierarchical
analysis, control factors (season and relative water temperature) included by AIC but not
significant at α-level 0.1 were dropped from the final model. Significance of all explanatory
variables was assessed at α-levels of 0.05 and 0.1 with global Wald tests. Significance at α of
0.05 of differences between predicted means of different categories of significant variables
was assessed by comparison of the standard error of the difference between means to their
respective 95% confidence intervals (Brandstätter 1999). Because separate analyses were
carried out for each size-class, differences between these could not be directly assessed within
species. In cases where both light- and tide-phase were significant variables, p-values for
other factors presented are from models containing light-phase (in all cases, whether light- or
tide-phase constituted the relevant variable did not change overall significance of other
variables, except where these were involved in interactions with light- or tide-phase). All
statistical analyses were carried out with GenStat (11th edition trial version, VSN
International, 2008).

Chapter 5: Foraging activity and habitat use inferred from research angling
65
Figure 5.1. Proportion of total angling time in each light-phase category, corresponding to
different tide-phase levels, showing the correlation between these two factors.
Dawn
High SE1 FE SE2 Low SF1 FF SF20
10
20
30
40
50
Morning
High SE1 FE SE2 Low SF1 FF SF20
10
20
30
40
50
Noon(1)
High SE1 FE SE2 Low SF1 FF SF20
10
20
30
40
50
Noon(2)
High SE1 FE SE2 Low SF1 FF SF2
Perc
en
tag
e t
ota
l an
gli
ng
tim
e
0
10
20
30
40
50
Afternoon
High SE1 FE SE2 Low SF1 FF SF20
10
20
30
40
50
Dusk
High SE1 FE SE2 Low SF1 FF SF20
10
20
30
40
50
Tide-phase category

Chapter 5: Foraging activity and habitat use inferred from research angling
66
5.3 Results
5.3.1 Habitat classification
A combination of angler knowledge and species composition analysis (Figures 5.2 and 5.3)
resulted in most angling localities being assigned a habitat type. The indicator species chosen
as representative of each habitat type were dusky kob (Argyrosomus japonicus) and lesser
guitarfish (Rhinobatos annulatus) for sandy habitats; two-tone fingerfin (Chirodactylus
brachydactylus) and klipvisse (Clinus spp.) for shallow reef habitats; and roman
(Chrysoblephus laticeps) and Poroderma catshark spp. for deep reef habitats (Figure 5.3).
Figure 5.3. Results of the cluster analysis of species composition at Bloukrans angling
localities and resulting habitat classification. Codes refer to the name of localities as used by
anglers (e.g. BB corresponds to “Boulder Bay”, and LK to “Losklippe”; See Appendix 1).

Chapter 5: Foraging activity and habitat use inferred from research angling
67
Figure 5.4. Overall catch per unit effort of indicator species in classified habitat types at
Bloukrans.
Figure 5.4. Distribution of analysed angling localities and their habitat type at Bloukrans
(habitat colours: yellow = sand, light blue = shallow reef, dark blue = deep reef).
Dusky kob (Argyrosomus japonicus )
0
1
2
3
4
5
Sand Shallow reef Deep reef
Overa
ll C
PU
E (
fish
.100h
r-1)
Lesser guitarfish (Rhinobatos annulatus )
0
1
2
3
4
5
Sand Shallow reef Deep reef
Overa
ll C
PU
E (
fish
.100h
r-1)
Twotone fingerfin (Chirodactylus brachydactylus )
0.0
0.2
0.4
0.6
0.8
1.0
1.2
Sand Shallow reef Deep reef
Overa
ll C
PU
E (
fish
.100h
r-1)
Clinus spp.
0
2
4
6
8
10
12
Sand Shallow reef Deep reefO
vera
ll C
PU
E (
fish
.100h
r-1)
Roman (Chrysoblephus laticeps )
0
2
4
6
8
10
12
Sand Shallow reef Deep reef
Overa
ll C
PU
E (
fish
.100h
r-1)
Poroderma spp.
0
1
2
3
4
5
Sand Shallow reef Deep reef
Overa
ll C
PU
E (
fish
.100h
r-1)
N

Chapter 5: Foraging activity and habitat use inferred from research angling
68
5.3.2 Capture probabilities
Data from 132 days, amounting to 4916 hours of angling at the different localities, was
analysed with hierarchical logistic regression. Predicted effects of the explanatory variables
on mean capture probabilities of different size-classes of each species are presented below.
Angling effort was a highly significant factor in all analyses (p < 0.001), and is not
additionally described. All figures depict the predicted mean probability of capturing at least
one individual of the relevant size-class during one hour’s angling at different values (or
levels) of the explanatory variable at marginal (weighted) levels of other explanatory
variables, apart from relative water temperature, which was standardised at 0 in predictions
for all other variables.
Blacktail
Main and first-order interactive effects of the explanatory variables on mean capture
probabilities of blacktail are summarised in Table 5.1. All size-classes were significantly
more likely to be caught over sand than other habitats (Figure 5.5a) and least likely over deep
reef, with shallow reef having intermediate capture probabilities. Capture probability was
significantly correlated to light-phase (Figure 5.5b), although this was most apparent for
medium-sized fish. Blacktail were most likely to be caught in periods closest to twilight
(dawn and dusk), although for small individuals morning had similar capture probability to
these periods and there was a significant minimum in probability of capture in the afternoon.
Analysis of tide-phase effects on capture probability was only significant for large fish
(Figure 5.5c), indicating that the less significant dawn and dusk peaks in capture probability
for this size-class (Table 5.1) may have been influenced by tidal effects. Large fish were
significantly more likely to be caught over high tide-phases (SF2 to SE1) than low and fast-
flood categories. There was a significant effect of season for all sizes (Figure 5.5d), with
peaks in autumn and lowest capture probabilities in spring and summer. For medium-sized
fish this translated into a significant interaction with habitat type, with higher capture
probabilities over sand relative to other habitats being driven by differences in summer and
autumn (Figure 5.5h). Relative water temperature was also a significant predictor for all size-
classes (Figure 5.5e-g), generally having a negative relationship with capture probability.
However, for large fish, this relationship was seasonal (Figure 5.5f), being insignificant in
summer.

Chapter 5: Foraging activity and habitat use inferred from research angling
69
There was also a significant interaction between the effects of relative water temperature and
light-phase for large fish (Figure 5.5g), indicating significant increases in capture probability
during the dawn and noon(2) phases, but not during dusk or morning, during low relative
temperatures.
Table 5.1. Effects of explanatory variables on mean probability of capturing blacktail
* explanatory variable involved in significant interaction (see bottom section of table)
Size-class Small Medium Large
Explanatory p Differences p Differences p Differences
variable {Wald, d.f.} between pairs {Wald, d.f.} between pairs {Wald, d.f.} between pairs
(αααα = 0.05) (αααα = 0.05) (αααα = 0.05)
Habitat 0.001 Sand > Shallow reef < 0.05* Sand > Shallow < 0.001 Sand > Shallow
{14.87, 2} > Deep reef reef {25.05, 2} reef
Sand > Deep reef > Deep reef
Light-phase 0.018 Dawn > Afternoon < 0.001 Dawn > Morning < 0.05* Dawn > Noon(1)
{13.61, 5} Dusk > Afternoon {35.96, 5} to Afternoon Dusk > Noon(1)
Morning > Afternoon Dusk > Morning
to Afternoon
Tide-phase 0.688 ns 0.232 ns 0.025 High > FF
{4.77, 7} {9.30, 7} {16.01, 7} High > Low
SE1 > FF
SE1 > Low
SF2 > FF
SF2 > Low
Season 0.025 Autumn > Summer < 0.05* Autumn > Summer < 0.05* Autumn > Summer
{9.36, 3} Autumn > Winter Winter > Summer Autumn > Winter
Autumn > Spring Winter > Spring Autumn > Spring
Relative 0.048 n/a 0.048 n/a < 0.05* n/a
water {3.92, 1} {3.91, 1}
temperature
* Variable p Interaction p Interaction p Interaction
interactions {Wald, d.f.} {Wald, d.f.} {Wald, d.f.}
0.019 Habitat x Season 0.068 Light-phase x
{15.15, 6} {10.68, 5} Relative water
temperature
0.032 Season x Relative
{8.32, 3} water temperature

Chapter 5: Foraging activity and habitat use inferred from research angling
70
Figure 5.5.a-f. Mean capture probabilities of TNP blacktail predicted by differences in (a)
habitat type, (b) light-phase, (c) tide-phase, (d) season and relative water temperature for (e)
small and medium size-classes, (f) large fish in different seasons. Error bars represent
approximate 95% confidence limits.
Season
Summer Autumn Winter Spring
0.00
0.05
0.10
0.15
0.20(d)
Tide-phase category
High SE1 FE SE2 Low SF1 FF SF2
Me
an
pro
ba
bil
ity
of
ca
ptu
re
0.00
0.02
0.04
0.06
0.08
0.10
0.12
0.14
0.16
0.18(c)
(e)
Relative water temperature (oC)
-6 -4 -2 0 2
Mean
pro
bab
ilit
y o
f cap
ture
0.00
0.02
0.04
0.06
0.08
0.10
0.12
0.14
0.16Small Medium (f)
Relative water temperature (oC)
-6 -4 -2 0 2
0.00
0.02
0.04
0.06
0.08
0.10
0.12
0.14
0.16Summer Autumn
Winter Spring
Light-phase category
Dawn Morning Noon(1) Noon(2) Afternoon Dusk
0.00
0.05
0.10
0.15
0.20
0.25(b)
Habitat type
Sand Shallow reef Deep reef
Me
an
pro
ba
bil
ity
of
cap
ture
0.00
0.05
0.10
0.15
0.20
0.25(a)Medium LargeSmall

Chapter 5: Foraging activity and habitat use inferred from research angling
71
Figure 5.5.g-h. Mean capture probabilities of TNP blacktail predicted by interactions between
(f) light-phase and relative water temperature for large fish and (h) habitat and season for
medium fish. Error bars represent approximate 95% confidence limits
Zebra
Main effects of the explanatory variables (no interactions were detected) on mean capture
probabilities of the two zebra size-classes are summarised in Table 5.2. Mean probability of
capturing zebra was significantly lower in deep reef habitat (Figure 5.6a); for small fish only
significantly lower than over shallow reef, but for large fish lower than both shallow reef and
sandy habitats. Light-phase had different effects for the two size-classes (Figure 5.6b). Small
fish capture probability steadily increased from dawn until noon(2), followed by a drop in the
afternoon period but a significant peak during dusk. For large fish, although overall effect of
light-phase was only significant at α-level of 0.1 (p = 0.6), there was a significant (p < 0.05)
minimum capture probability in the afternoon period, followed by a peak during dusk. For
both size-classes, capture probability was significantly higher in winter and autumn than
spring and summer (Figure 5.6d). Tide-phase had significant effects for large fish only
(Figure 5.6c), with peaks during fast-ebb and slow-flood 1 periods compared to the fast-flood
and slow–flood 2 periods. Relative water temperature (with a negative relationship) was only
significant for large fish.
(g)
Relative water temperature (oC)
-6 -4 -2 0 2
Me
an
pro
ba
bil
ity o
f c
ap
ture
0.00
0.10
0.20
0.30
0.40Dawn Morning
Noon(1) Noon(2)
Afternoon
Dusk
Habitat type
Sand Shallow reef Deep reef
0.00
0.10
0.20
0.30
0.40
0.50
0.60(h)Summer
Autumn
WinterSpring

Chapter 5: Foraging activity and habitat use inferred from research angling
72
Table 5.2. Effects of explanatory variables on mean probability of capturing zebra
Figure 5.6.a-b. Mean capture probabilities of TNP zebra predicted by differences in (a) habitat
type, (b) light-phase
Small Large
Explanatory p Differences p Differences
variable {Wald, d.f.} between pairs {Wald, d.f.} between pairs
(αααα = 0.05) (αααα = 0.05)
Habitat 0.013 Shallow reef > Deep reef < 0.001 Shallow reef > Deep reef
{8.72, 2} {19.56, 2} Sand > Deep reef
Light-phase 0.034 Dusk > Dawn < 0.06 Dawn > Afternoon
{12.05, 5} Dusk > Morning {10.60, 5} Morning > Afternoon
Dusk > Afternoon Noon(1) > Afternoon
Noon(2) > Dawn Dusk > Afternoon
Tide-phase 0.544 ns 0.08 FE > FF
{4.77, 7} {19.70, 7} SE2 > FF
SF1 > FF
FE > SF2
SE2 > SF2
SF1 > SF2
Season < 0.001 Winter > Summer < 0.001 Winter > Summer
{16.45, 3} Winter > Spring {24.57, 3} Winter > Spring
Autumn > Summer Autumn > Summer
Autumn > Spring
Relative 0.147 n/a < 0.002 n/a
water temperature {2.11, 1} {9.98, 1}
Habitat type
Sand Shallow reef Deep reef
Me
an
pro
ba
bil
ity
of
ca
ptu
re
0.00
0.01
0.02
0.03
0.04(a)Small Large
Light-phase category
Dawn Morning Noon(1) Noon(2) Afternoon Dusk
0.00
0.01
0.02
0.03
0.04
0.05
0.06(b)

Chapter 5: Foraging activity and habitat use inferred from research angling
73
Figure 5.6.c-e. Mean capture probabilities of TNP zebra predicted by differences in (c) tide-
phase, (d) season and (e) relative water temperature for fish. Error bars represent approximate
95% confidence limits
Musselcracker
Main and first-order interactive effects of the explanatory variables on mean capture
probabilities of the two musselcracker size-classes are summarised in Table 5.3. Habitat only
had significant effects on mean capture probability of small fish (Figure 5.7a), being highest
over shallow reef, followed by sandy habitat and then deep reef. There were no significant
effects of light-phase (Figure 5.7b) or tide-phase (Figure 5.7c). Although the AIC included a
significant interaction between habitat type and tide-phase for small fish and this seemed to
indicate a trend for higher capture probability over high tide-phases in the predominant
shallow reef habitat (Figure 5.7e), this effect was insignificant at an α-level of 0.1 (Table 5.5).
(e)
Relative water temperature (oC)
-6 -4 -2 0 2
Mea
n p
rob
ab
ilit
y o
f c
ap
ture
0.00
0.01
0.02
0.03
0.04
Season
Summer Autumn Winter Spring
0.00
0.01
0.02
0.03
0.04
0.05(d)
Tide-phase category
High SE1 FE SE2 Low SF1 FF SF2
Mean
pro
bab
ilit
y o
f cap
ture
0.00
0.01
0.02
0.03
0.04
0.05(c)

Chapter 5: Foraging activity and habitat use inferred from research angling
74
Table 5.3. Effects of explanatory variables on mean probability of capturing musselcracker
* explanatory variable involved in significant interaction (see bottom section of table)
Capture probability of medium-sized fish was higher in autumn and winter than summer and
spring (Figure 5.7d). Seasonal effects interacted with those of relative water temperature for
small fish (Figure 5.7f), the positive relationship during other seasons becoming strongly
negative during spring.
Small Medium
Explanatory p Differences p Differences
variable {Wald, d.f.} between pairs {Wald, d.f.} between pairs
(αααα = 0.05) (αααα = 0.05)
Habitat < 0.05* Shallow reef > Deep reef 0.278 ns
Shallow reef > Sand {2.54, 2}
Sand > Deep reef
Light-phase 0.114 ns 0.861 ns
{8.87, 5} {1.91, 5}
Tide-phase 0.313 ns 0.737 ns
{8.23, 7} {4.37, 7}
Season > 0.05* ns < 0.001 Autumn > Summer
{21.44, 3} Winter > Summer
Winter > Spring
Relative < 0.05* n/a > 0.05 n/a
water temperature {2.2, 1}
* Variable p Interaction p Interaction
interactions {Wald, d.f.} {Wald, d.f.}
0.049 Season x Relative water
{7.86, 3} temperature
0.213 Habitat x Tide
{17.86, 14}

Chapter 5: Foraging activity and habitat use inferred from research angling
75
Figure 5.7. Mean capture probabilities of TNP musselcracker predicted by differences in (a)
habitat type, (b) light-phase, (c) tide-phase, (d) season and interactions between (e) habitat
and tide-phase, (f) season and relative water temperature for the small size-class. Error bars
represent approximate 95% confidence limits.
Relative water temperature (oC)
-6 -4 -2 0 2 4
0.00
0.02
0.04
0.06
0.08
0.10
0.12
(f)Summer
Winter
Autumn
Spring
Tide-phase category
High SE1 FE SE2 Low SF1 FF SF2
Mean
pro
bab
ilit
y o
f cap
ture
0.00
0.02
0.04
0.06
0.08
0.10
0.12
0.14(e)Sand Shallow reef
Deep reef
Season
Summer Autumn Winter Spring
0.00
0.01
0.02
0.03
0.04
0.05
0.06(d)
Tide-phase category
High SE1 FE SE2 Low SF1 FF SF2
Mea
n p
rob
ab
ilit
y o
f c
ap
ture
0.00
0.01
0.02
0.03
0.04
0.05(c)
Light-phase category
Dawn Morning Noon(1) Noon(2) Afternoon Dusk
0.00
0.01
0.02
0.03
0.04
0.05(b)
Habitat type
Sand Shallow reef Deep reef
Mea
n p
rob
ab
ilit
y o
f ca
ptu
re
0.00
0.02
0.04
0.06
0.08(a)SmallLarge

Chapter 5: Foraging activity and habitat use inferred from research angling
76
5.4 Discussion
This study used an indirect method (probability of capturing individuals on baited angling
gear) to examine foraging activity of resident fishes in relation to temporal and spatial factors.
The large TNP data set spanning several years incorporated data over the full range of
environmental conditions affecting angling operations and fish foraging behaviour. However,
due to the varying degree of concurrent data collection both spatially and temporally, further
attempts to reduce the influence of unquantified factors were necessary. HGLMs are a form
of generalized linear mixed model (GLMM). GLMMs have been used in a number of
ecological studies (e.g. Legge 2000, Brandão et al. 2004, Aukema et al. 2005), as well as to
standardise catch rates in fisheries science (Millar & Willis 1999, Venables & Dichmont
2004, Helser et al. 2004). However, accuracy of standard quasilikelihood estimation methods
used in GLMMs to model binary count data have been questioned (Rodriguez & Goldman
2001, Breslow 2005), and in the software used, HGLMs allowed more accurate Laplace
approximations in estimation of the mean model (Raudenbush et al. 2000) than standard
GLMMs.
Effects of three factors potentially affecting performance of baited gear – individual angler
experience, hook size and bait species (Attwood 2003), were not analysed and assumed to
randomly impact capture probabilities with respect to analysed factors. The majority of
angling was undertaken by a core group of experienced research anglers, reducing individual
angler effects. The three study species were all readily captured on the full range of baits
used in the study and anglers varied their use of bait and hook sizes, and therefore impacts of
these were also likely to be minimal. These potential uncertainties notwithstanding, clear
trends in the results suggest methods were successful in detecting some natural behaviour
patterns of the study species. These potentially arose from changes in both general and
foraging activity levels. Within this relatively small study area (ca 3 km of coastline), capture
probability varied significantly with habitat for all three study species. Effects differed
between the species, and sometimes between their size-classes. Tagging studies indicated that
few large-scale movements occurred within the study site (see Chapter 4) and appear to
discount large-scale daily foraging ‘migrations’ between different habitats, as have been
recorded for numerous marine fish species (Hobson 1973, Meyer & Holland 2005, Unsworth
et al. 2007). Therefore, observed differences in capture probability were likely to be a
function of both the relative abundance of resident individuals living within particular areas
and foraging within particular habitats.

Chapter 5: Foraging activity and habitat use inferred from research angling
77
Juvenile musselcracker are highly resident and Clarke (1988) found that shallow inshore reefs
function as a nursery area after initial use of intertidal areas. If, as suggested earlier (Chapter
3), the ontogenetic shift to subtidal areas occurs via spending progressively more time in areas
immediately adjacent to intertidal nurseries, home ranges would initially be established in
shallow reef habitat, progressing deeper with increase in age and size. The observed lack of
significant habitat differences for larger medium-sized musselcracker, suggests increasing
incorporation of deep reef and sandy areas into the home range of older fish, thereby
providing further evidence of this ontogenetic habitat shift. Buxton & Clarke (1991) reported
differences in preferred prey of musselcracker corresponding in size to the small and medium
size-classes studied here, with concomitant development of heavy adult dentition and greater
consumption of larger invertebrate prey with increasing size/age. This, together with
increased energy requirements of larger individuals, probably necessitates use of a wider
variety of habitats during foraging, implying increased home range area and movement with
growth, as was found in results from tagging studies (see Chapter 4).
Mann (1992) and Mann & Buxton (1992) examined habitat use and diet of blacktail and zebra
in a similar area to this study, finding them abundant in shallow inshore reef environments
(less than 10m deep), particularly those exposed to direct wave action. Habitat types
categorised in this study all fell within this depth range and, although “deep” reef habitat was
generally less exposed to breaking wave action, it is considered all probably fell into the
exposed inshore reef category of Mann’s study. He, however, made use of underwater counts
of abundance and water conditions limited effective estimates in very shallow habitats in the
surf zone exposed to heavy wave action - effectively sampled in this study. The present
results likely indicate preferential foraging in these shallow habitats and suggests daily
activity of these fishes may be greatest in very shallow areas within the shallow inshore zone.
Mann (1992) noted the ability of these fishes to enter shallow turbulent waters. Dominant
prey items of these fishes are relatively small invertebrates (Mann & Buxton 1992) and such
habitats should increase chances of prey being exposed (e.g. through dislodging from shelter
in rock crevices, or macroalgae, by water movement) making them desirable foraging areas.
Preference for sand habitat by blacktail may be a function of its generalist diet leading it to
preferentially forage in disturbed sandy areas for a variety of small invertebrate prey, as has
been observed for other species (Hall et al. 1996).

Chapter 5: Foraging activity and habitat use inferred from research angling
78
Conversely, zebra preferentially consume polychaete worms common in filter-foraging
invertebrate colonies attached to rocks in the wave zone (Mann & Buxton 1992), which may
explain their peak capture probabilities in shallow reef habitat. It is not clear what drove
observed higher capture probabilities of medium-sized blacktail over sand (relative to other
habitats) in summer and autumn versus during winter and spring. Although Mann & Buxton
(1992) found seasonal differences in diet composition of blacktail, this was mainly for small
juveniles and thus an unlikely causative factor. It is hypothesised that reproductive behaviour
caused the observed differences. Blacktail reproduction peaks at times corresponding to late
winter and spring in this study (Mann & Buxton 1997) and observed differences could thus
have been a function of habitat use in relation to social reproductive interactions (e.g.
spawning activity over reef habitat versus sandy areas), but further investigation of this was
beyond the scope of this study.
The highly dynamic shallow environments favoured by blacktail, zebra and juvenile
musselcracker for foraging were unlikely suitable for position maintenance on even a semi-
permanent basis, and foraging activities here likely took the form of periodic movement into
and out of particular areas with successive wave cycles. Therefore, these fish were not
permanently utilising these areas, but selectively for foraging at certain periods, and these
were in some cases related to environmental cycles. Light-phase potentially affected foraging
activity of the study species through its effects on daily activity rhythms (McFarland 1986,
Reebs 2002), and tide-phase through intertidal and shallow inshore areas becoming
periodically more accessible for foraging during inundation at high tide. Unfortunately these
two factors were temporally correlated (Figure 5.1), limiting discrimination of their respective
effects on capture probabilities in analysis, through unmodelled variation from one factor
likely reducing confidence around parameter estimates of the other. However, some effects
were clearly significant in isolation from the other factor. Peaks during dawn and dusk for
medium blacktail were distinct and likely a function of the proximity of these periods to
sunrise and sunset. Increased crepuscular activity and foraging have been described for
numerous marine fish species in both temperate and tropical environments (Hobson et al.
1981, Helfman 1993, Lowry & Suthers 1998, Løkkeborg et al. 2000). Significant minimum
capture probability for small blacktail during the afternoon is difficult to explain in relation to
the light cycle, but this pattern of a distinct drop in afternoon captures followed by significant
increases at dusk was also observed in both zebra size-classes.

Chapter 5: Foraging activity and habitat use inferred from research angling
79
The large proportion of afternoon angling over periods of maximum onshore tidal flow (fast-
flood and slow-flood 2; Figure 5.1) possibly explains this. Strong tidal currents may
compound already rough conditions in favoured shallow foraging habitat to create conditions
untenable for foraging. Although not always statistically significant, reductions in capture
probability during fast-flood compared with phases immediately before and after for medium-
sized and large blacktail and small zebra, and minimum capture probability of small blacktail
and large zebra during fast-flood and slow-flood 2 (see relevant figures) support this
conclusion. Increased capture probabilities over high tide of medium and large blacktail
likely incorporates movement into shallow areas inundated at high tide to feed on intertidal
food resources (Biden 1948, Mann 1992). Tidally related foraging behaviour has been
described for many marine fish species, which either make directed movements into particular
areas to feed (Carlisle 1961, Craig 1996, Beyst et al. 2002) or display tidally induced activity
or behaviour patterns within normally utilised areas (Zeller 2002). Tidal ‘migrations’ usually
described are large-scale shifts in position during particular phases of the tide, whereas any
tidally related foraging movements of blacktail are more likely to comprise short excursions
into submerged intertidal habitat from slightly deeper areas as conditions allow (e.g. between
rough wave sets). In their favoured shallow reef habitat, small musselcracker foraging
activity also appeared to increase over high tide, which may also indicate foraging in
inundated shallow areas on the high tide for these fishes.
Although not of primary interest, season and relative water temperature were included in
analyses to control for their effects on capture probabilities and in most cases were found to
have significant effects. A host of factors potentially drove observed seasonal variations in
foraging activity, including reproductive activity, prey ecology and water temperature
(affecting metabolic rate). Effects of relative water temperature were analysed as this was
thought to have relevance to daily variations in capture probability. The generally negative
relationship between relative water temperature and capture probabilities of all fishes (apart
from small musselcracker) indicated elevated water temperature may have a suppressive
effect on foraging activity in these species. The relationship was not found for large blacktail
in summer, however, possibly indicating susceptibility to seasonal upwelling and associated
sharp declines in water temperature. Upwelling affects resident reef fish behaviour along this
stretch of coastline (Hanekom et al. 1989, 1997), fish sheltering in crevices and ceasing to
feed (Buxton & Smale 1997).

Chapter 5: Foraging activity and habitat use inferred from research angling
80
Larger blacktail may be more adversely affected by temperature than smaller individuals, or
alternatively be more capable of temporary movement away from the immediate vicinity of
small-scale upwelling to escape its effects.
An improved understanding of these fishes’ behaviour has important implications for fisheries
management. In addition to contributing to a better fundamental understanding of their
ecology, these results highlight the need to consider small-scale spatial and temporal effects
on capture probabilities when utilising baited gear as a sampling method for studying resident
fish species. Surveys using baited gear have been widely used to examine fish abundance,
particularly in relation to the protective effects of MPAs (e.g Alcala & Russ 1990, Bennett &
Attwood 1991, 1993, Millar & Willis 1999). Studying the unexploited populations within
MPAs has also been advocated for assessing natural population parameters and variability for
fishery species for more realistic stock assessments. South Africa’s Linefish Management
Protocols (LMPs – see Chapter 1) require periodic assessment of populations of linefish
species in order to gauge the effectiveness of management measures. Long-term monitoring
of fishery-independent measures of abundance such as CPUE in scientific surveys is an
integral part of such assessments. In the TNP blacktail has also been highlighted as a
potential indicator species for long-term monitoring of an inshore ecosystem (Götz et al.
2008). The significant variations in capture probability of the study species in relation to the
spatial and temporal factors analysed in this study, due to their behaviour, need to be
considered when analysing data from fishery independent abundance surveys. Knowledge of
natural foraging activity rhythms might also be exploited to design more efficient sampling
protocols in multispecies assessments, e.g. targeting specific species during times of the day
when they are known to exhibit peak foraging activity.

Chapter 6: General discussion
81
Chapter 6 – General discussion
In this study blacktail, zebra and musselcracker displayed both similar and divergent patterns
of post-settlement movement, depending on the life-history stage under investigation. As
juveniles, all three species are resident to restricted areas of rocky intertidal nursery habitat.
Although morphologically adapted to undertake large-scale movements within contiguous
rocky habitat, they exhibited movement behaviour characteristic of resident intertidal species.
The dynamic nature of South Africa’s east coast probably necessitates this. The physical
stability of rocky shores (cf. sandy areas or estuaries that form the main nursery areas of many
other inshore species) counters the inherent instability of conditions associated with strong
wave and tidal action in this environment. Within structurally stable rocky intertidal habitat,
restricted movement and long-term site fidelity afford developing juveniles the best chances
of avoiding accidental displacement to hazardous areas such as the subtidal zone, that has
high predator abundance, or stranding in upshore areas with inadequate water levels at low
tide. High levels of movement over a large area would conceivably decrease individuals’
ability to sufficiently familiarise themselves with the physical layout of their environment to
take expedient shelter from strong tidal currents and rough seas impinging on the intertidal
zone.
The tidal cycle may necessitate some movement perpendicular to the shore in response to the
rise and fall of water levels, and this also appears to follow a repetitive, restricted pattern
within a small area immediately adjacent to the low tide refuge. Thus, an individual
juvenile’s home range comprises a core area centred on the low tide refuge but including
adjacent areas utilised over high tide. The likely mechanism by which these species
accomplish ontogenetic shifts in area and habitat use is similarly facilitated by the tidal cycle.
Although not explicitly quantified in the present study, movements of small juveniles are
restricted within small intertidal pools on the periphery of gullies during low tide; these likely
constituting their core home range areas (pers. obs.). Under this hypothesis, with ontogenetic
development (i.e. increased body size and improved swimming capabilities) the home range
increasingly incorporates deeper areas immediately adjacent to the low tide refuge, through
progressively extended explorations of these at high tide when rockpools become connected
to these areas. Such areas with suitable physical characteristics for larger individuals (e.g.
deeper water, greater area, increased shelter and greater prey abundance/size) become the low
tide refuge that constitutes the core area of their expanded home range.

Chapter 6: General discussion
82
It follows that use of previously utilised areas is maintained during movement away from the
low tide refuge over high tide as previously described. A similar process facilitates the
ontogenetic shift to subtidal habitats adjacent to the intertidal zone, these being initially
explored on temporary excursions and ultimately replacing the low tide refuge as the core
home range area. Use of the (previously-utilised) intertidal home range core area is now
restricted to high tide periods. Thus, with ontogenetic development there is a simultaneous
expansion and shift in location of the core area of the home range, from small intertidal rock
pools to semi-bounded intertidal gullies to subtidal inshore habitats that form the final
location of adult home range cores. Juvenile blacktail leave the intertidal zone at smaller size
than zebra and musselcracker, probably facilitated by their greater propensity to shoal
functioning as an anti-predation mechanism.
Utilisation of restricted home range areas continues in subadult and adult life. Within their
home ranges adult blacktail and zebra utilise habitats differentially for foraging, which is
linked to both the diurnal and tidal cycles. Both species preferentially forage in shallow
habitats along the sea/shore interface, blacktail having a preference for sandy areas close to
reefs, whereas zebra preferentially forage in shallow rocky areas. Blacktail foraging activity
peaks around twilight periods, and but also follows the tidal cycle, peaking over high tide
when these fish are able to enter the intertidal zone. Both blacktail and zebra tend to forage
less over periods of maximal onshore tidal flow, however. Foraging within the intertidal zone
likely represents continued association with their specific intertidal nursery area for many
individuals.
Thus, when considered together with the small size of their long-term adult home ranges,
many blacktail and zebra appear likely to remain within an extremely restricted nearshore
area throughout their lives. Data gathered in this study at different stages of ontogenetic
development suggest that typical post-settlement lifetime movements for these fishes occur
within a few hundred metres of where they initially settle. Although large zebra are
sometimes found in deeper areas (Mann 1992, Heemstra & Heemstra 2004), this may only be
in areas where deep reef habitat is located close to shore (i.e. not necessitating a large-scale
ontogenetic shift from intertidal nursery areas). Musselcracker are initially restricted to small
areas of shallow reef habitats within the subtidal zone. With maturation, however, they begin
to utilise other habitats in daily foraging activities, probably facilitated by the development of
heavier dentition enabling the consumption of larger invertebrate prey.

Chapter 6: General discussion
83
With continued growth, musselcracker exhibit the potential to disperse large distances,
including a seasonal long-distance directed migration related to reproductive activity.
Seasonal targeting and recorded movements of tagged adult musselcracker suggest different
spawning areas along the coast. The location of these has probably evolved to take advantage
of prevailing oceanographic currents to maximise transport of eggs and larvae, produced in
spawning aggregations, to areas of the coast with suitable rocky intertidal nursery habitat.
Spawning in KwaZulu-Natal waters (that this species does not frequent outside the spawning
season) probably constitutes the best means of ensuring adequate larval supply to areas east of
Algoa Bay, where the nearshore environment is considerably impacted by southwest Agulhas
Current flow. This ‘up-current’ strategy is utilised by several other South African reef fish
species. However, the dynamics of musselcracker spawning migrations (e.g. stock
segregation, spawning site fidelity of individuals, degree of natal homing, makeup of
spawning aggregations in terms of geographic origin of individual fish, aggregation size and
frequency and location of spawning events) are unlikely to be fully understood until a range
of techniques are utilised for its study.
Our present knowledge of the lifetime movement behaviour of the three study species as
described in this study can be graphically depicted in Figure 6.1, showing the location and
scale of ontogenetic, daily and (in the case of adult musselcracker) seasonal reproductive
movements (Figure 6.2).

Chapter 6: General discussion
84
Figure 6.1. Stylised representation of characteristic lifetime movement behaviour for the three
study species. Home range area and the number of different habitats utilised increases with
age. Ontogenetic habitat is characterised by a gradual progression in the location of the home
range core area from intertidal nursery habitats (initially rockpools and later intertidal gullies)
to shallow subtidal and slightly deeper inshore reefs. However, mature fish maintain contact
with their intertidal nursery during feeding excursions away from their core home range.
Seasonal spawning migrations of musselcracker take place on much larger scales, and are
depicted in Figure 6.2. (Zebra illustration copyright South African Institute for aquatic
Biodiversity and NISC).

Chapter 6: General discussion
85
Figure 6.2. Representation of hypothesised annual spawning migrations of musselcracker
along the South African east coast. Migration paths are generally eastwards, with major
spawning grounds in the vicinity of Mossel Bay, Algoa Bay and central KwaZulu-Natal
visited by fish resident on different areas of the coast. Prevailing currents disperse eggs and
developing larvae to the Eastern and Western Cape where suitable rocky intertidal nursery
habitat is present. Note that migration paths are a stylised representation of the general
direction of coastal alongshore movements (i.e. not depicting offshore movements).
Implications for management in South African fisheries
Management strategies for conservation and sustainable utilisation of exploited marine
species need to recognise dynamics of their movement behaviour (Acosta 1999, Attwood &
Cowley 2005). Their location in time and space affects patterns of exploitation of individuals
or populations and effectiveness of particular management measures (e.g. Flynn et al. 2006).
The study species are appreciably exploited in South African shore fisheries and potentially
vulnerable to over-exploitation.
Fish origin & direction of
movement along the coast
Migratory path
Spawning area
Egg & larval drift

Chapter 6: General discussion
86
This is especially relevant given populations of many other targeted species have been
severely depleted (Mann 2000a) and they will be exposed to increasing fishing effort until
significant recovery of these stocks, as already recorded by Bennett et al. (1994) for blacktail
in the southwestern Cape. Under prevailing local and global economic conditions, high
poverty levels and associated poor food security of many South African households
exacerbates this situation. Consequently, South African coastal fish populations will be
exposed to increasing pressure from subsistence fishers (Branch et al. 2002, Mann et al.
2003).
When resident juveniles, large numbers of all three species are vulnerable to other
anthropogenic impacts on the rocky intertidal zone. These could result from either point-
source pollution or chronic exposure to compounds affecting growth or future reproductive
development. The consequences will become more pervasive with increased coastal
development, unless this is properly regulated (Thompson et al. 2002). Existing rocky
intertidal nurseries may also be affected by anthropogenically-induced climate change.
Rising sea levels linked to global warming would be expected to change the characteristics of
many rocky intertidal nursery areas on local or regional scales. If this results in a decrease in
their extent, detrimental effects on overall juvenile survival would be expected. Climate-
induced changes in weather patterns may also result in increased storm activity and/or rough
sea events that reduce the suitability of many areas as nurseries through regular ‘flushing out’
of this habitat. In regard to the above, it is therefore necessary to determine the importance of
the rocky intertidal zone as a ‘critical habitat’ for these species.
Upon entering subtidal habitats larger juveniles and subadults should in theory be exempt
from fishing mortality until they reach minimum retainable size, but lack of law enforcement
renders this assumption questionable, particularly where coastal resources are primarily
exploited for food. Subadult musselcracker could be particularly vulnerable due to their
relatively large size constituting a sizeable catch. As adult recruits appear to be derived
predominantly from adjacent nursery areas, the above impacts on juveniles potentially have
significant knock-on effects on local adult populations, either in recruitment failure or
reduced fitness of recruits. As adults, long-term residency of blacktail and zebra to restricted
areas increases their vulnerability to localised population depletion (Gunderson et al. 2008).

Chapter 6: General discussion
87
Assuming equal catchability, site-attached species experience higher total mortality in
intensely exploited areas than more mobile species that become periodically less vulnerable to
exploitation when outside that area. Effects on a resident species’ overall population
therefore depend on both the distribution and level of exploitation over its range. On
localised scales, considerable impacts by even moderate fishing pressure could result from
these species’ low intrinsic population growth rates. Attwood (2003) theorised that natural
refuges from fishing pressure on the South African coast (e.g. privately-owned or otherwise
inaccessible areas) may be important for population maintenance in another predominantly
resident species (galjoen, Dichistius capensis). Similarly, the national ban on off-road
vehicles on South African beaches instituted in 2001 has probably created a number of
inaccessible areas, thereby reducing fishing pressure on resident populations (P. Cowley,
South African Institute for Aquatic Biodiversity, pers. comm.). Such areas remain as pockets
of high population density that buffer effects of exploitation in other areas; either through
density-dependent movements or supply of recruits in larval dispersal. However, propensity
for site-attachment may conceivably counteract density-dependent processes, for example
when social benefits of conspecifics presence are important to behaviour (Shumway 1999).
In the present study, observed rates of tagged blacktail movement from protected areas (with
high population density) to adjacent exploited areas of lower population densities were
negligible (Chapter 4), indicating density-dependent processes may not increase this species
propensity for movement.
In contrast to the Diplodus species, musselcracker reproductive movements confer a pattern
of exploitation pressure that differs between the spawning season and other times of the year.
Targeting of musselcracker during the spring and summer spawning seasons by both shore-
anglers (Clarke & Buxton 1989) and spearfishermen (van Rooyen 1987) is well known.
Targeting of fish spawning aggregations can result in severe population declines from
increased catchability, due to associated behaviour (e.g. elevated feeding rates) and
population concentration (Garratt 1996, Sadovy & Domeier 2005), or disruptive effects on
reproductive behaviour (Sadovy 1996). Musselcracker appear more easily caught in the
spawning season due to their clumped distribution. Aggregating fish’s behaviour also makes
them less aware of spearfishermen (van Rooyen 1987). Temporal catch restrictions (i.e.
closed seasons) for species with changing seasonal catchability have been used with success
in the management of some exploited species.

Chapter 6: General discussion
88
For example, it appears closed seasons have benefited seasonally migrating South African elf
(Pomatomus saltatrix) stocks (van der Elst 1988a). A similar restriction for musselcracker,
however, would be difficult to implement given that it constitutes a ‘compensatory’ catch
during closed seasons of other species (elf and galjoen) Clarke & Buxton (1989).
South African shore and estuarine fisheries are characterised by poor compliance with
regulations and inadequate enforcement levels (Brouwer et al. 1997, Hauck & Kroese 2006,
Smith et al. 2007) and present catch restrictions are likely ineffectual as management
measures for these species in many areas of the coast (Cowley et al. 2002). Alternative
management measures should thus be considered, one of which is the use of no-take marine
protected areas. No-take MPAs have been promulgated globally both for conservation of
exploited populations and their potential enhancement in adjacent areas (Polunin & Roberts
1993, Russ 2002, Gell & Roberts 2003), and South Africa has highlighted the value of MPAs
as a tool in management of its exploited fish populations (Bennett & Attwood 1991, 1993,
Attwood et al. 1997a,b), including the study species Bennett & Attwood 1991, Cowley et al.
2002).
Movements at an individual or population level greatly influence protective and fishery-
enhancement effects of MPAs (Kramer & Chapman 1999, Munro 2000). Their high degree
of site-fidelity suggests even small, well-protected areas will protect considerable numbers of
blacktail and zebra from fishing pressure, as for other sedentary species (Willis et al. 2001,
2003, Kerwath et al. 2007a,b). Although fisheries enhancement from post-settlement
movement to exploited areas through ontogenetic (Appeldoorn et al. 1997) or density-
dependent (Abesamis & Russ 2005) spillover is therefore probably limited, MPAs may buffer
or even enhance adjacent fisheries by supplying recruits via export of pelagic eggs and larvae
(Tilney et al. 1996, Attwood et al. 2002, Domeier 2004). They also function as areas where
genetic integrity of the stock is preserved, as intensive exploitation may be expected to lower
genetic diversity through the removal of locally-adapted genotypes. To ensure significant
enhancement of exploited populations siting of future MPAs should therefore consider local
oceanographic currents and larval dispersal dynamics. Under intense outside exploitation
levels, MPAs may require significant self-recruitment (Cowen 2002, Swearer et al. 2002) for
population maintenance (Hastings & Botsford 2006) or the creation of MPA networks located
to maximise both dispersal between protected populations and to exploited areas (Palumbi
2003, Leis 2005).

Chapter 6: General discussion
89
Conversely, if larval export rates are low (Jones et al. 1999, 2005) fishery enhancement for
highly resident species from single, large MPAs is unlikely to match yield lost to the fishery
in closing the area to exploitation (Carr & Reed 1993). However, this may be offset by
management benefits of large MPAs valuable to fisheries, such as protection from overall
stock collapse, providing biological reference points for fishery assessments (Attwood 2003)
and ecosystem-based benefits to other species (Ecosystem Principles Advisory Panel 1999).
Adequately enforced no-take MPAs incorporating suitable habitats will protect resident
juvenile and subadult musselcracker populations. However, large-scale movements of older
fish take them into exploited areas and MPAs therefore only provide temporary protection for
adult populations. In contrast to the Diplodus species, ontogenetic spillover from MPAs may
play an important role in providing recruits to fisheries targeting musselcracker. MPAs
protecting large contiguous areas of suitable juvenile nursery habitat, such as the Tsitsikamma
National Park, appear most effective for this and are particularly relevant given potential
anthropogenic impacts on unprotected nursery areas. Large MPAs probably also protect (and
therefore maintain) significant adult populations outside the spawning season more effectively
than small (e.g. less than five kilometre wide) MPAs, given these large fish’s potential for
large-scale movements. However, even small MPAs could also significantly reduce total
fishing effort on this species, particularly on migratory aggregations that move through them.
If fishing activity significantly affects spawning behaviour, MPAs could also provide areas
where spawning can take place undisturbed.
The suitability of no-take MPAs as fisheries management tools has recently been debated
(Kaiser 2005, Gardmark et al. 2006). However, South Africa’s lack of voluntary adherence to
fishing regulations and adequate enforcement makes use of MPAs the only viable option for
sustainable utilisation of these and other endemic reef species at present. Importantly this
should be seen from conservation and ecosystem-based management perspectives in addition
to that of fisheries-enhancement (Jones 2007). While populations of the study species are not
presently regarded as ‘collapsed’ or ‘threatened’, restricted movements of individuals during
at least part of their post-settlement life make them vulnerable to localised depletion under
even moderate exploitation rates. In many areas exploitation pressure is intense, and as
angling participation increases local declines will be further manifested at the population
level.

Chapter 6: General discussion
90
Given the current lack of basic information on larval dispersal and resulting population
connectivity and stock segregation, it is pertinent that the important (and varying) roles
existing MPAs may currently play in maintenance of exploited stocks of these and other
species are upheld. When the overall benefits of MPAs are considered, recent claims to re-
open sections of existing MPAs for “restricted access” fishing (Sunde & Isaacs 2008) are not
only unjustifiable on any biological basis, but would constitute flagrant disregard for the
precautionary approach to fisheries management (FAO 1995). The demonstrated
effectiveness of Marine Protected Areas in protecting exploited populations from overfishing
and increasing biomass of resident species also offer a prime opportunity for educating
fishermen on the merits of adhering to regulations through demonstrating their effects on
population and average fish size. With South Africa’s under-resourced enforcement capacity
it is imperative that effective public education programs are instituted to instil a more
sustainable attitude towards the use of coastal resources.
At a broader level, all management decisions should be based upon a sound knowledge on the
status of an exploited species in a particular area and how local populations are responding to
fishing pressure and present management strategies. Periodic assessments of exploited
populations are required in South Africa’s Linefish Management Protocols to assess the
effectiveness of particular management actions (see Chapter 1), and long-term monitoring of
protected and exploited populations is required to provide reference points on which to
determine trends. Catch per unit effort (CPUE), based on research angling surveys, is
currently used as a method of determining popuation abundance in monitoring studies of
shorefishery species (Götz et al. 2008). However, the results presented in Chapter 5 highlight
the necessity of ensuring such studies take spatial and temporal factors influencing the
foraging behaviour of the study species into account when undertaking such assessments, as
they will affect catchability and thus the interpretation of results of population assessments
based on CPUE.
Although the maintenance of a well-managed network of MPAs may resolve the long-term
conservation needs of the study species, more research is required to fill present knowledge
gaps. For example, future studies quantifying the relative contribution distinct nursery
habitats make to adult populations, and how these and habitat connectivity affect the timing
and magnitude of ontogenetic movements should be undertaken.

Chapter 6: General discussion
91
A better understanding of musselcracker spawning migrations is also necessary to understand
their population dynamics. Recent advances in population genetics (Nielsen et al. 2005,
Jamandre et al. 2007) and the use of chemical signatures, retained in hard tissues such as
otoliths and reflecting past environment conditions experienced by individuals, offer potential
methods to examine both these questions. A major unresolved area of these species’ lifetime
movement patterns, as for most marine fishes, is the dispersal dynamics of their pelagic eggs
and larvae. Previously-assumed high levels of population connectivity maintained through
long-distance passive dispersal of these life-history stages are currently being questioned by
results of recent studies on small-scale oceanographic circulation (James et al. 2002) and pre-
settlement stage larval fish swimming abilities (Leis & Carson-Ewart 1997) and behaviour
(Leis 2002). At the functional population level, low post-settlement movement of blacktail
and zebra suggests major population connectivity only occurs via larval dispersal. Spawning
migration patterns of musselcracker make use of South Africa’s east and south coast
oceanographic regimes for dispersal and retention of settlement-stage larvae to regions with
large areas of rocky intertidal nursery habitat, but the dynamics of larval dispersal from
different regions of the coast remain unquantified.
In particular, the possible existence of separate musselcracker stocks, maintained through
natal homing in spawning migrations and larval dispersal trajectories, should be investigated.
If present these may require different management strategies. The possible stock, or even
species, differentiation in southern African blacktail (and possibly zebra) populations (Mann
2000c, Heemstra & Heemstra 2004) also requires investigation. In addition to answering
these questions, the rapidly expanding use of genetic analyses involving microsatellite DNA
markers (e.g. Curley & Gillings 2009), together with studies utilising natural and artificial
biochemical tagging of larval otoliths (Campana 2005, Elsdon et al. 2008) will hopefully lead
to direct estimates of dispersal and population connectivity for these species in future studies.
This will enable better-informed management strategies for their conservation and sustainable
human use to be formulated.

Appendix 1: Tsitsikamma research angling localities
92
Appendix 1 – Tsitsikamma National Park research angling localities
Locality code Angler locality name Habitat type
BB Boulder Bay Shallow rocky reef
BKB Bloukrans Bank Sand-dominated
CLL Clinton's Rock Left Shallow rocky reef
CLR Clinton's Rock Right Shallow rocky reef
CR Cormorant Rock Sand-dominated
DG Deep Gully Sand-dominated
DSG Dogshark Gully Unclassified
FO Far Out Unclassified
GT Gate Deep rocky reef
HR Hut Rock Unclassified
HT High Tide Beach & Bank Shallow rocky reef
JSB Jan se Bank Deep rocky reef
KR Klip River Bank Sand-dominated
LK Losklippe Shallow rocky reef
MIL Mother-in-Law's Deep rocky reef
OB Otter Bank Deep rocky reef
OG Otter Gully Shallow rocky reef
PS Pigsty Shallow rocky reef
PT Point Shallow rocky reef
PUL Pulpit Shallow rocky reef
RIF Riff Deep rocky reef
RIFR Riff Right Deep rocky reef
SB Santer Bank Deep rocky reef
SB2 Santer Bank 2 Deep rocky reef
SB3 Santer Bank 3 Deep rocky reef
SB4/5 Santer Bank 4 & 5 Deep rocky reef
SBS Santer Bank Sloep Deep rocky reef
SG Sandgatte Sand-dominated
V Vee Sand-dominated
WF Waterfall Shallow rocky reef

References
93
References
Abesamis, R.E. & Russ, G.R. 2005. Density-dependent spillover from a marine reserve:
Long-term evidence. Ecological Applications 15(5): 1798-1812
Acosta, C.A. 1999. Benthic dispersal of Caribbean spiny lobsters among insular habitats:
Implications for the conservation of exploited marine species. Conservation Biology
13(3): 603-612
Akaike, H. 1981. Liklihood of a model and information criteria. Journal of Econometrics 16:
3-14
Alcala, A.C. & Russ, G.R. 1990. A direct test of the effects of protective management on
abundance and yield of tropical marine resources. ICES Journal of Marine Science
47(1): 40-47
Annese, D.M. & Kingsford, M.J. 2005. Distribution, movements and diet of nocturnal fishes
on temperate reefs. Environmental Biology of Fishes 72(2): 161-174
Appeldoorn, R.S., Recksiek, C.M., Hill, R.L., Pagan, F.E. & Dennis, G.D. 1997. Marine
protected areas and reef fish movement: The role of habitat in controlling ontogenetic
migration. Proceedings of the 8th International Coral Reef Symposium 2: 1917-1922
Astorga, N., Afonso, J.M., Zamorano, M.J., Montero, D., Oliva, V., Fernandez, H. &
Izquierdo, M.S. 2005. Evaluation of visible implant elastomer tags for tagging
juvenile gilthead seabream (Sparus auratus L.); effects on growth, mortality, handling
time and tag loss. Aquaculture Research 36(8): 733-738
Attwood, C.G. 2003. Dynamics of the fishery for galjoen Dichistius capensis, with an
assessment of monitoring methods. African Journal of Marine Science 25: 311-330
Attwood, C.G. & Bennett, B.A. 1994. Variation in dispersal of galjoen (Coracinus capensis)
(Teleostei: Coracinidae) from a marine reserve. Canadian Journal of Fisheries and
Aquatic Sciences 51(6): 1247-1257
References
94
Attwood, C.G., Harris, J.M. & Williams, A.J. 1997a. International experience of marine
protected areas and their relevance to South Africa. South African Journal of Marine
Science 18: 311-332
Attwood, C.G., Mann, B.Q., Beaumont, J. & Harris, J.M. 1997b. Review of the state of
marine protected areas in South Africa. South African Journal of Marine Science 18:
341-367
Attwood, C.G., Allen, J. & Claassen, P.J. 2002. Nearshore surface patterns in the
Tsitsikamma National Park, South Africa. South African Journal of Marine Science
24: 151-160
Attwood, C.G. & Cowley, P.D. 2005. Alternate explanations of the dispersal pattern of
galjoen Dichistius capensis. African Journal of Marine Science 27(1): 141-156
Aukema, B.H., Werner, R.A., Haberkern, K.E., Illman, B.L., Clayton, M.K. & Raffa, K.F.
2005. Quantifying sources of variation in the frequency of fungi associated with
spruce beetles: Implications for hypothesis testing and sampling methodology in bark
beetle-symbiont relationships. Forest Ecology and Management 217: 187-202
Barber, W.E., Lyman, L.M., Wallace, P.E. & Mark, V. 1995. Effect of the Exxon Valdez oil
spill on intertidal fish: A field study. Transactions of the American Fisheries Society
124(4): 461-476
Beck, M.W., Heck, K.L.J., Able, K.W., Childers, D.L., Eggleston, D.B., Gillanders, B.M.,
Halpern, B.S., Hays, C.G., Hoshino, K., Minello, T.J., Orth, R.J., Sheridan, P.F. &
Weinstein, M.P. 2006. The identification, conservation, and management of estuarine
and marine nurseries for fish and invertebrates. Bioscience 51(8): 633-641
Beckley, L.E. 1982. The occurrence of marine linefish juveniles in tidal pools near Port
Elizabeth. SANCOR Marine Linefish Workshop: 101-104
Beckley, L.E. 1983. The ichthyofauna associated with Zostera capensis Setchell in the
Swartkops estuary, South Africa. South African Journal of Zoology 18: 15-24

References
95
Beckley, L.E. 1985. The fish community of East Cape tidal pools and an assessment of the
nursery function of this habitat. South African Journal of Zoology 20(1): 21-27
Beckley, L.E. 1988. Notes on the biology of juvenile Sparodon durbanensis (Pisces:
Sparidae) from tidal pools in the Eastern Cape, South Africa. South African Journal of
Zoology 21(3): 66-68
Beckley, L.E. 2000. Species composition and recruitment of tidal pool fishes in KwaZulu-
Natal, South Africa. African Zoology 35(1): 29-34
Beckley, L.E. & van der Lingen, C. 1999. Biology, fishery and management of sardine
(Sardinops sagax) in southern African waters. Marine and Freshwater Research 50:
955-978
Bell, T. & Kramer, D.L. 2000. Territoriality and habitat use by juvenile blue tangs,
Acanthurus coeruleus. Environmental Biology of Fishes 58(4): 401-409
Bennett, B.A. 1987. The rock-pool community of Koppie Alleen and an assessment of the
importance of Cape rock-pools as nurseries for juvenile fish. South African Journal of
Zoology 22(1): 25-32
Bennett, B.A. 1989. The fish community of a moderately exposed beach on the southwestern
Cape coast of South Africa and an assessment of this habitat as a nursery for juvenile
fish. Estuarine, Coastal and Shelf Science 28(3): 293-305
Bennett, B.A. 1991. Long-term trends in the catches by shore anglers in False Bay.
Transactions of the Royal Society of South Africa 47(4-5): 683-690
Bennett, B.A. 1993. Aspects of the biology and life history of white steenbras Lithognathus
lithognathus in Southern Africa. South African Journal of Marine Science 13: 83-96
Bennett, B.A. & Attwood, C.G. 1991. Evidence for recovery of a surf-zone fish assemblage
following the establishment of a marine reserve on the southern coast of South Africa.
Marine Ecology Progress Series 75(2-3): 173-181

References
96
Bennett, B.A. & Attwood, C.G. 1993. Shore-angling catches in the De Hoop Nature Reserve,
South Africa, and further evidence for the protective value of marine reserves. South
African Journal of Marine Science 13: 213-222
Bennett, B.A., Attwood, C.G. & Mantel, J.D. 1994. Teleost catches by three shore-angling
clubs in the south-western Cape, with an assessment of the effect of restrictions
applied in 1985. South African Journal of Marine Science 14: 11-18
Beukers, J.S., Jones, G.P. & Buckley, R.M. 1995. Use of implant microtags for studies on
populations of small reef fish. Marine Ecology Progress Series 125: 61-66
Beyst, B., Vanaverbeke, J., Vincx, M. & Mees, J. 2002. Tidal and diurnal periodicity in
macrocrustaceans and demersal fish of an exposed sandy beach, with special emphasis
on juvenile plaice Pleuronectes platessa. Marine Ecology Progress Series 225: 263-
274
Biden, C. L. 1948. Sea-angling fishes of the Cape: A natural history of some of the principal
fishes caught by sea anglers and professional fishermen in Cape waters. Juta, Cape
Town. 304pp
Booth, A.J. 2000. White musselcracker. In Mann, B.Q. (Ed) Southern African marine linefish
status reports. Oceanographic Research Institute Special Publication No. 7: 189-190
Boujard, T. & Leatherland, J.F. 1992. Circadian rhythms and feeding time in fishes.
Environmental Biology of Fishes 35: 109-131
Branch, G. & Branch, M. 1981. The living shores of Southern Africa. Struik, Cape Town.
272pp
Branch, G.M., Hauck, M., Siquana'Ndulo, N. & Dye, A.H. 2002. Defining fishers in the
South African context: Subsistence, artisanal and small-scale commercial sectors.
South African Journal of Marine Science 24: 475-487

References
97
Brandão, A., Butterworth, D.S., Johnston, S.J. & Glazer, J.P. 2004. Using a GLMM to
estimate the somatic growth rate trend for male South African west coast rock lobster,
Jasus lalandii. Fisheries Research 70: 339-349
Brandstätter, E. 1999. Confidence intervals as an alternative to significance testing. Methods
of Psychological Research Online 4(2): 33-46
Braune, B.M. & Gaskin, D.E. 1982. Feeding ecology of nonbreeding populations of larids off
Deer Island, New Brunswick. Auk 99: 67-76
Brennan, N.P., Leber, K.M., Blankenship, H.L., Ransier, J.M. & DeBruler, R.J. 2005. An
evaluation of coded wire and elastomer tag performance in juvenile common snook
under field and laboratory conditions. North American Journal of Fisheries
Management 25: 437-445
Breslow, N. 2005. Wither PQL? Proceedings of the second Seattle symposium in
biostatistics: Analysis of correlated data: 1-22
Bromley, P.J., Watson, T. & Hislop, J.R.G. 1997. Diel feeding patterns and the development
of food webs in pelagic 0-group cod (Gadus morhua L.), haddock (Melanogrammus
aeglefinus L.), whiting (Merlangius merlangus L.), saithe (Pollachius virens L.), and
Norway pout (Trisopterus esmarkii Nilsson) in the northern North Sea. ICES Journal
of Marine Science 54(5): 846-853
Brouwer, S.L. 1997. An assessment of the South African east coast linefishery from Kei
Mouth to Stil Bay. MSc Thesis, Rhodes University. 123pp
Brouwer, S.L., Mann, B.Q., Lamberth, S.J., Sauer, W.H.H. & Erasmus, C. 1997. A survey of
the South African shore-angling fishery. South African Journal of Marine Science 18:
165-177
Brouwer, S.L. & Buxton, C.D. 2002. Catch and effort of the shore and skiboat linefisheries
along the South African Eastern Cape coast. South African Journal of Marine Science
24: 341-354

References
98
Brouwer, S.L., Griffiths, M.H. & Roberts, M.J. 2003. Adult movement and larval dispersal of
Argyrozona argyrozona (Pisces: Sparidae) from a temperate marine protected area.
African Journal of Marine Science 25: 395-402
Bruyndoncx, L., Knaepkens, G., Meeus, W., Bervoets, L. & Eens, M. 2002. The evaluation
of passive integrated transponder (PIT) tags and visible implant elastomer (VIE)
marks as new marking techniques for the bullhead. Journal of Fish Biology 60(1):
260-262
Buckley, R.M., West, J.E. & Doty, D.C. 1994. Internal micro-tag systems for marking
juvenile reef fishes. Bulletin of Marine Science 55(2): 850-859
Bullen, E. & Mann, B.Q. 2005a. Sedgwick's/ORI/WWF Tagging Programme: Summary of
blacktail (Diplodus sargus capensis) tagged in South Africa (1984-2005),
Oceanographic Research Institute Data Report 11. 26pp
Bullen, E. & Mann, B.Q. 2005b. Sedgwick's/ORI/WWF Tagging Programme: Summary of
zebra (Diplodus cervinus hottentotus) tagged in South Africa (1984-2005),
Oceanographic Research Institute Data Report 12. 24pp
Bullen, E. & Mann, B.Q. 2005c. Sedgwick's/ORI/WWF Tagging Programme: Summary of
white musselcracker (Sparodon durbanensis) tagged in South Africa (1984-2005),
Oceanographic Research Institute Data Report 13. 23pp
Bullen, E., Mann, B.Q. & Everett, B. 2008. Tagging News 21: p2
Burger, L.F. 1990. The distribution patterns and community structure of the Tsitsikamma
rocky littoral ichthyofauna. MSc Thesis, Rhodes University. 116pp
Burrows, M.T., Gibson, R.N., Robb, L. & Maclean, A. 2004. Alongshore dispersal and site
fidelity of juvenile plaice from tagging and transplants. Journal of Fish Biology 65(3):
620-634

References
99
Buxton, C.D. & Allen, J.C. 1989. Mark and recapture studies of two reef sprids in the
Tsitsikamma Coastal National Park. Koedoe 32(1): 39-45
Buxton, C.D. & Garratt, P.A. 1990. Alternative reproductive styles in seabeam (Pisces:
Sparidae). Environmental Biology of Fishes 28(1-4): 113-124
Buxton, C.D. & Clarke, J.R. 1991. The biology of the white musselcracker Sparodon
durbanensis (Pisces: Sparidae) on the Eastern Cape coast, South Africa. South African
Journal of Marine Science 10: 285-296
Buxton, C.D. & Smale, M.J. 1997. Abundance and distribution patterns of three temperate
marine reef fish (Teleosei: Sparidae) in exploited and unexploited areas off the
southern Cape coast. Journal of Applied Ecology 26(2): 441-451
Campana, S.E. 2005. Otolith science entering the 21st century. Marine and Freshwater
Research 56(5): 485-495
Carlisle, D.B. 1961. Intertidal territory in fish. Animal Behaviour 9: 106-107
Carr, M.H. & Reed, D.C. 1993. Conceptual issues relevant to marine harvest refuges:
Examples from temperate reef fishes. Canadian Journal of Fisheries and Aquatic
Sciences 50(9): 2019-2028
Catalano, M.J., Chipps, S.R., Bouchard, M.A. & Wahl, D.H. 2001. Evaluation of injectable
fluorescent tags for marking centrarchid fishes: Retention rate and effects on
vulnerability to predation. North American Journal of Fisheries Management 21: 911-
917
Chateau, O. & Wantiez, L. 2008. Movement patterns of four coral reef fish species in a
fragmented habitat in New Caledonia: Implications for the design of marine protected
area networks. ICES Journal of Marine Science 66(1): 50-55

References
100
Childs, A.-R. 2005. Movement patterns of spotted grunter, Pomadasys commersonnii
(Haemulidae), in a highly turbid South African estuary. MSc Thesis, Rhodes
University. 152pp
Childs, A.-R., Cowley, P.D., Næsje, T.F., Booth, A.J., Potts, W.M., Thorstad, E.B. & Økland,
F. 2008. Do environmental factors influence the movement of estuarine fish? A case
study using acoustic telemetry. Estuarine, Coastal and Shelf Science 78: 227-236
Christensen, M.S. 1978. Trophic relationships in juveniles of three species of Sparid fishes in
the South African marine littoral. NOAA Fishery Bulletin 76(2): 389-401
Clapp, D.F., Clark, R.D.J. & Diana, J.S. 1990. Range, activity, and habitat of large, free-
ranging brown trout in a Michigan stream. Transactions of the American Fisheries
Society 119(6): 1022-1034
Clark, B.M., Bennett, B.A. & Lamberth, S.J. 1996. Temporal variations in surf zone fish
assemblages from False Bay, South Africa. Marine Ecology Progress Series 131(1-3):
35-47
Clarke, J.R. 1988. Aspects of the biology of the musselcracker, Sparodon durbanensis, and
the bronze bream, Pachymetopon grande, (Pisces : Sparidae), with notes on the
Eastern Cape recreational rock-angling and spear fisheries. MSc Thesis, Rhodes
University. 141pp
Clarke, J.R. & Buxton, C.D. 1989. A survey of the recreational rock-angling fishery at Port
Elizabeth, on the south-east coast of South Africa. South African Journal of Marine
Science 8: 183-194
Coetzee, P.S. 1986. Diet composition and breeding cycle of blacktail, Diplodus sargus
capensis (Pisces: Sparidae), caught off St. Croix Island, Algoa Bay, South Africa.
South African Journal of Zoology 21(3): 237-243

References
101
Coetzee, P.S. & Baird, D. 1981. Catch composition and catch per unit effort of anglers'
catches off St Croix Island, Algoa Bay. South African Journal of Wildlife Research
11(1): 14-20
Coetzee, P.S., Baird, D. & Tregoning, C. 1989. Catch statistics and trends in the shore
angling fishery of the east coast, South Africa, for the period 1959-1982. South
African Journal of Marine Science 8: 155-171
Connell, S.D. 1996. Effects of predators on growth, mortality and abundance of a juvenile
reef-fish: Evidence from manipulations of predator and prey abundance. Marine
Ecology Progress Series 169: 251-261
Cowen, R.K. 2002. Larval dispersal and retention and consequences for population
connectivity. In Sale, P.F. (Ed.) Coral reef fishes - Dynamics and diversity in a
complex ecosystem. Academic Press, London: 149-170
Cowley, P.D., Brouwer, S.L. & Tilney, R.L. 2002. The role of the Tsitsikamma National
Park in the management of four shore- angling fish along the South-Eastern Cape
coast of South Africa. South African Journal of Marine Science 24: 27-35
Craig, P.C. 1996. Intertidal territoriality and time-budget of the surgeonfish, Acanthurus
lineatus, in American Samoa. Environmental Biology of Fishes 46: 27-36
Crowe, T.P., Thompson, R.C. & Hawkins, S.J. 2000. Impacts of anthropogenic stress on
rocky intertidal communities. Journal of Aquatic Ecosystem Stress and Recovery 7:
273-297
Curley, B.G. & Gillings, M.R. 2009. Population connectivity in the temperate damselfish
Parma microlepis: Analyses of genetic structure across multiple spatial scales. Marine
Biology 156(3): 381-393
Dingle, H. 1996. Migration: The biology of life on the move. Oxford University Press, New
York: 474pp

References
102
Domeier, M.L. 2004. A potential larval recruitment pathway originating from a Florida
marine protected area. Fisheries Oceanography 13(5): 287-294
Domeier, M.L., Kiefer, D., Nasby-Lucas, N., Wagschal, A. & O'Brien, F. 2005. Tracking
Pacific bluefin tuna (Thunnus thynnus orientalis) in the northeast Pacific with an
automated algorithm that estimates latitude by matching sea-surface-temperature data
from satellites with temperature data from tags on fish. Fishery Bulletin 103(2): 292-
306
Dorenbosch, M., Verweij, M.C., Nagelkerken, I., van der Velde, G. & Jiddawi, N. 2004.
Homing and daytime tidal movements of juvenile snappers (Lutjanidae) between
shallow-water nursery habitats in Zanzibar, western Indian Ocean. Environmental
Biology of Fishes 70(3): 203-209
Doupe, R.G., Partridge, G.J. & Lymbery, A.J. 2003. Visible implant fluorescent elastomer
tags as pedigree markers for applied aquaculture: An evaluation using black bream
Acanthopagrus butcheri. Aquaculture Research 34: 681-683
Ecosystem Principles Advisory Panel 1999. Ecosystem-based fishery management.,
National Marine Fisheries Service, Washington, D.C.
Elsdon, T.S., Wells, B.K., Campana, S.E., Gillanders, B.M., Jones, C.M., Limburg, K.E.,
Secor, D.H., Thorrold, S.R. & Walther, B.D. 2008. Otolith chemistry to describe
movements and life-history parameters of fishes: Hypotheses, assumptions, limitations
and inferences. Oceanography and Marine Biology: An Annual Review 46: 297-330
Emery, L. & Wydoski, R. 1987. Marking and tagging of aquatic animals: An indexed
bibliography. United States Department of the Interior, Fish and Wildlife Service,
Washington, D.C. 57pp
Eristhee, N. & Oxenford, H.A. 2001. Home range size and use of space by Bermuda chub
Kyphosus sectatrix (L.) in two marine reserves in the Soufriere Marine Management
Area, St Lucia, West Indies. Journal of Fish Biology 59(SUPPL. A): 129-151

References
103
Fabrizio, M.C., Nichols, J.D., Hines, J.E., Swanson, B.L. & Schram, S.T. 1999. Modeling
data from double-tagging experiments to estimate heterogeneous rates of tag shedding
in lake trout (Salvelinus namaycush). Canadian Journal of Fisheries and Aquatic
Sciences 56(8): 1409-1419
FAO 1995. Precautionary approach to fisheries. Part 1: Guidelines on the precautionary
approach to capture fisheries and species introductions, FAO Fisheries Technical
Paper 350. FAO, Rome. 52pp
Fennessy, S.T. & Chater, S.C. 1998. Fish species composition and abundance on a
subtropical, artificial reef on the east coast of South Africa. South African Journal of
Zoology 33(3): 147-155
Fernö, A. & Huse, I. 1983. The effect of experience on the behaviour of cod (Gadus morhua
L.) towards a baited hook. Fisheries Research 2(1): 19-28
Fitzgerald, J.L., Sheehan, T.F. & Kocik, J.F. 2004. Visibility of visual implant elastomer tags
in Atlantic salmon reared for two years in marine net-pens. North American Journal of
Fisheries Management 24(1): 222-227
Flynn, L., Punt, A.E. & Hilborn, R. 2006. A hierarchical model for salmon run reconstruction
and application to the Bristol Bay sockeye salmon (Oncorhynchus nerka) fishery.
Canadian Journal of Fisheries and Aquatic Sciences 63: 1564-1577
Fodrie, F.J. & Levin, L.A. 2008. Linking juvenile habitat utilization to population dynamics
of California halibut. Limnology and Oceanography 53(2): 799-812
Frederick, J.L. 1997. Evaluation of fluorescent elastomer injection as a method for marking
small fish. Bulletin of Marine Science 61(2): 399-408
Gardmark, A., Jonzen, N. & Mangel, M. 2006. Density-dependent body growth reduces the
potential of marine reserves to enhance yields. Journal of Applied Ecology 43(1): 61-
69

References
104
Garratt, P.A. 1996. Threatened fishes of the world: Polysteganus undulosus Regan, 1908
(Sparidae). Environmental Biology of Fishes 45(4): 362
Garratt, P.A. 1988. Notes on seasonal abundance and spawning of some important offshore
linefish in Natal and Transkei waters, southern Africa. South African Journal of
Marine Science 7: 1-8
Gell, F.R. & Roberts, C.M. 2003. Benefits beyond boundaries: The fishery effects of marine
reserves. Trends in Ecology and Evolution 18(9): 448-455
Gibson, R.N. 1984. Hydrostatic pressure and the rhythmic behaviour of intertidal marine
fishes. Transactions of the American Fisheries Society 113(4): 479-483
Gibson, R.N. 1999. Movement and homing in intertidal fishes. In Horn, M.H., Martin,
K.L.M. & Chotkowski, M.A. (Eds.) Intertidal fishes: Life in two worlds. Academic
Press, San Diego: 97-125
Gibson, R.N. 2003. Go with the flow: Tidal migration in marine animals. Hydrobiologia 503:
153-161
Gibson, R.N. & Yoshiyama, R.M. 1999. Intertidal fish communities. In Horn, M.H., Martin,
K.L.M. & Chotkowski, M.A. (Eds.) Intertidal fishes: Life in two worlds. Academic
Press, San Diego: 264-296
Gillanders, B.M. 2002. Connectivity between juvenile and adult fish populations: Do adults
remain near their recruitment estuaries? Marine Ecology Progress Series 240: 215-223
Götz, A., Cowley, P.D. & Winker, H. 2008. Selected fishery and population parameters of
eight shore-angling species in the Tsitsikamma National Park no-take marine reserve.
African Journal of Marine Science 30(3): 519-532
Green, J.M. 1971. High tide movements and homing behaviour of the tidepool sculpin
Oligocottus maculosus. Journal of the Fisheries Research Board of Canada 28: 383-
389
References
105
Griffiths, M.H. & Hecht, T. 1995. On the life-history of Atractoscion aequidens, a migratory
sciaenid off the east coast of southern Africa. Journal of Fish Biology 47(6): 962-985
Griffiths, M.H., Attwood, C. & Thomson, R. 1999. New management protocol for the South
African linefishery. South African Network for Coastal and Oceanic Research -
Occasional Report December(5): 145-156
Griffiths, M.H. & Wilke, C.G. 2002. Long-term movement patterns of five temperate-reef
fishes (Pisces:Sparidae): Implications for marine reserves. Marine and Freshwater
Research 53: 233-244
Griffiths, M.H. & Attwood, C.G. 2005. Do dart tags suppress growth of dusky kob
Argyrosomus japonicus? African Journal of Marine Science 27(2): 505-508
Griffiths, S.P. 2002. Retention of visible implant tags in small rockpool fishes. Marine
Ecology Progress Series 236: 307-309
Griffiths, S.P. 2003a. Homing behaviour of intertidal rockpool fishes in south-eastern New
South Wales, Australia. Australian Journal of Zoology 51(4): 387-398
Griffiths, S.P. 2003b. Rockpool ichthyofaunas of temperate Australia: Species composition,
residency and biogeographic patterns. Estuarine, Coastal and Shelf Science 58(1):
173-186
Grimes, C.B., Able, K.W. & Turner, S.C. 1982 . Direct observation from a submersible
vessel of comercial longlines for tilefish. Transactions of the American Fisheries
Society 111(1): 94-98
Gunderson, D.R., Parma, A.M., Hilborn, R., Cope, J.M., Fluharty, D.L., Miller, M.L., Vetter,
R.D., Heppell, S.S. & Greene, H.G. 2008. The challenge of managing nearshore
rocky reef resources. Fisheries 33(4): 172-179

References
106
Gunn,J. & Block, B.A. 2001. Advances in acoustic, archival and satellite tagging of tunas. In
Block, B.A. & Stevens, E.D. (Eds.) Tuna physiology, ecology and evolution.
Academic Press, San Diego: 127-264
Hall, S.J., Raffaelli, D., Basford, D.J., Robertson, M.R. & Fryer, R. 1990. The feeding
relationships of the larger fish species in a Scottish sea loch. Journal of Fish Biology
37: 775-791
Hall, S.J., Tuck, I.D., Robertson, M.R., Basford, D.J. & Heaney, S.D. 1996. Patch
exploitation by small gadoids: Evidence for an assymetric tidal effect. Journal of Fish
Biology 48: 996-1005
Hanekom, N., Hutchings, L., Joubert, P.A. & van der Byl, P.C.N. 1989. Sea temperature
variations in the Tsitsikamma Coastal national park, with notes on the effect of cold
conditions on some fish populations. South African Journal of Marine Science 8: 143-
153
Hanekom, N., Mann-Lang, J.B., Mann, B.Q. & Carinus, T.V.Z. 1997. Shore-angling catches
in the Tsitsikamma National Park, 1989-1995. Koedoe 40(2): 37-56
Hastings, A. & Botsford, L.W. 2006. Persistence of spatial populations depends on returning
home. Proceedings of the National Academy of Sciences of the United States of
America 103(15): 6067-6072
Hauck, M. & Kroese, M. 2006. Fisheries compliance in South Africa: A decade of challenges
and reform 1994-2004. Marine Policy 30(1): 74-83
Heemstra, P. C. & Heemstra, E. 2004. Coastal fishes of southern Africa. NISC,
Grahamstown. 488pp
Helfman, G.S. 1993. Fish behaviour by day, night and twilight. In Pitcher, T.J. (Ed.)
Behaviour of Teleost Fishes. Chapman & Hall, London: 479-512

References
107
Helser, T.E., Punt, A.E. & Methot, R.D. 2004 . A generalized linear mixed model analysis of
a multi-vessel fishery resource survey. Fisheries Research 70: 251-264
Henriques, M. & Almada, V.C. 1998. Juveniles of non-resident fish found in sheltered rocky
subtidal areas. Journal of Fish Biology 52(6): 1301-1304
Hibino, M., Ohta, T., Isoda, T., Nakayama, K. & Tanaka, M. 2006. Diel and tidal changes in
the distribution and feeding habits of Japanese temperate bass Lateolabrax japonicus
juveniles in the surf zone of Ariake Bay. Ichthyological Research 53: 129-136
Hobson, E.S. 1973. Diel feeding migrations in tropical reef fishes. Helgoland Marine
Research 24(1): 361-370
Hobson, E.S., McFarland, W.N. & Chess, J.R. 1981. Crepuscular and nocturnal activities of
Californian nearshore fishes, with consideration of their scotopic visual pigments and
the photic environment. Fishery Bulletin 79(1): 1-30
Hughes, R.N. 1980. Optimal foraging theory in the marine context. Oceanography and
Marine Biology: An Annual Review 18: 423-481
Hurlbert, S.H. 1984. Pseudoreplication and the design of ecological field experiments.
Ecological Monographs 54(2): 187-211
Hutchings, L., Beckley, L.E., Griffiths, M.H., Roberts, M.J., Sundby, S. & van der Lingen, C.
2002. Spawning on the edge: Spawning grounds and nursery areas around the
Southern African coastline. Marine and Freshwater Research 53(2): 307-318
Jamandre, B.W., Shen, K.N. & Tzeng, W.N. 2007. Larval dispersal and genetic structure of
American eels Anguilla rostrata as revealed by microsatellite DNA. Journal of the
Fisheries Society of Taiwan 34(1): 143
James, M.K., Armsworth, P.R., Mason, L.B. & Bode, L. 2002. The structure of reef fish
metapopulations: Modelling larval dispersal and retention patterns. Proceedings of the
Royal Society of London - B: Biological Sciences 269(1505): 2079-2086

References
108
Jones, G.P., Milicich, M.J., Emslie, M.J. & Lunow, C. 1999. Self-recruitment in a coral reef
fish population. Nature 402: 802-804
Jones, G.P., Planes, S. & Thorrold, S.R. 2005. Coral reef fish larvae settle close to home.
Current Biology 15: 1314-1318
Jones, P.J.S. 2007. Point-of-View: Arguments for conventional fisheries management and
against no-take marine protected areas: Only half of the story? Reviews in Fish
Biology and Fisheries 17: 31-43
Joubert, C.S.W. 1981. Aspects of the biology of five species of inshore reef fish on the Natal
Coast, South Africa. Oceanographic Research Institute Investigational Report(51): 1-
16
Joubert, C.S.W. & Hanekom, P.B. 1980. A study of feeding in some inshore reef fish of the
Natal coast, South Africa. South African Journal of Zoology 15(4): 261-274
Joubert, F. 1980. The great sea-angling manual. Perskor, Johannesburg. 307pp
Kaiser, M.J. 2005. Are marine protected areas a red herring or fisheries panacea? Canadian
Journal of Fisheries and Aquatic Sciences 62: 1194-1199
Kamenos, N.A., Moore, G.P. & Hall-Spencer, J.M. 2004. Small-scale distribution of juvenile
gadoids in shallow inshore waters; what role does maerl play? ICES Journal of
Marine Science 61: 422-429
Kamstra, F. 1985. Environmental features of the southern Benguela with special reference to
the wind stress. In Shannon, L.V. (Ed.) South African Ocean Colour and Upwelling
experiment. Sea Fisheries Research Institute, Cape Town: 13-27
Kaunda-Arara, B. & Rose, G.A. 2004. Homing and site fidelity in the greasy grouper
Epinephelus tauvina (Serranidae) within a marine protected area in coastal Kenya.
Marine Ecology Progress Series 277: 245-251

References
109
Kennedy, B.P., Chamberlain, C.P., Blum, J.D., Nislow, K.H. & Folt, C.L. 2005. Comparing
naturally occurring stable isotopes of nitrogen, carbon, and strontium as markers for
the rearing locations of Atlantic salmon (Salmo salar). Canadian Journal of Fisheries
and Aquatic Sciences 62: 48-57
Kerr, L.A., Secor, D.H. & Kraus, R.T. 2007. Stable isotope (δ13
C and δ18
O) and Sr/Ca
composition of otoliths as proxies for environmental salinity experienced by an
estuarine fish. Marine Ecology Progress Series 349: 245-253
Kerwath, S.E. 2005. Empirical studies of fish movement behaviour and their application in
spatially explicit models for marine conservation. PhD Thesis, Rhodes University.
212pp
Kerwath, S.E., Götz, A., Wilke, C.G., Attwood, C.G. & Sauer, W.H.H. 2006. A comparative
evaluation of three methods used to tag South African linefish. African Journal of
Marine Science 28(3&4): 637-643
Kerwath, S.E., Götz, A., Attwood, C.G., Cowley, P.D. & Sauer, W.H.H. 2007a. Movement
pattern and home range of Roman Chrysoblephus laticeps. African Journal of Marine
Science 29(1): 93-103
Kerwath, S.E., Götz, A., Attwood, C.G., Sauer, W.H.H. & Wilke, C.G. 2007b. Area
utilisation and activity patterns of roman Chrysoblephus laticeps (Sparidae) in a small
marine protected area. African Journal of Marine Science 29(2): 259-270
Koster, F.W. & Mollmann, C. 2000. Trophodynamic control by clupeid predators on
recruitment success in Baltic cod? ICES Journal of Marine Science 57(2): 310-323
Kramer, D.L. & Chapman, M.R. 1999. Implications of fish home range size and relocation
for marine reserve function. Environmental Biology of Fishes 55(1-2): 65-79
Krull, B. 1999. Blacktail: The light-tackle fisherman's friend. The Fishing Journal 2(3): 3-4

References
110
Kudoh, T. & Yamaoka, K. 1998. Territory established location and foraging behaviour of
juveniles of red sea bream Pagrus major and crimson sea bream Evynnis japonica.
Nippon Suisan Gakkaishi 64(1): 16-25
Kulbicki, M. 1998. How the aquired behaviour of commercial reef fishes may influence the
results obtained from visual censuses. Journal of Experimental Marine Biology and
Ecology 222(1-2): 11-30
Kupschus, S. 2003. Development and evaluation of statistical habtiat suitability models: An
example based on juvenile spotted seatrout Cynoscion nebulosus. Marine Ecology
Progress Series 265: 197-212
Lamberth, S.J. 1997. The distribution of total catch and effort between all sectors of the
linefishery in the south-western Cape. Final Project Report, Unpublished Linefish
Working Group Report. Marine and Coastal Management, Department of
Environmental Affairs and Tourism: 22pp
Lasiak, T.A. 1981. Nursery grounds of juvenile teleosts: Evidence from the surf zone of
King's Beach, Port Elizabeth. South African Journal of Science 77: 388-390
Lasiak, T.A. 1984. Structural aspects of the surf-zone fish assemblage at King's Beach, Algoa
Bay, South Africa: Short-term fluctuations. Estuarine, Coastal and Shelf Science
18(3): 347-360
Lee, Y. & Nelder, J.A. 2001. Hierarchical generalised linear models: A synthesis of
generalised linear models, random-effect models and structured dispersions.
Biometrika 88(4): 987-1006
Legge, S. 2000. The effect of helpers on reproductive success in the laughing kookaburra.
The Journal of Animal Ecology 69(4): 714-724
Leis, J.M. 2002. Pacific coral-reef fishes: The implications of behaviour and ecology of
larvae for biodiversity and conservation, and a reassessment of the open population
paradigm. Environmental Biology of Fishes 65(2): 199-208

References
111
Leis, J.M. 2005. What does larval biology tell us about the design and efficacy of marine
protected areas? Aquatic Protected Areas: What works best and how do we know?
Proceedings of the World Congress on Aquatic Protected Areas, Cairns, August 2002:
170-180
Leis, J.M. & Carson-Ewart, B.M. 1997. In situ swimming speeds of the late pelagic larvae of
some Indo-Pacific coral-reef fishes. Marine Ecology Progress Series 159: 165-174
Lowe, C.G., Topping, D.T., Cartamil, D.P. & Papastamatiou, Y.P. 2003. Movement patterns,
home range, and habitat utilization of adult kelp bass Paralabrax clathratus in a
temperate no-take marine reserve. Marine Ecology Progress Series 256: 205-216
Lowry, M.B. & Suthers, I.M. 1998. Home range, activity and distribution patterns of a
temperate rocky-reef fish, Cheilodactylus fuscus. Marine Biology 132: 569-578
Løkkeborg, S. 1998. Feeding behaviour of cod, Gadus morhua: Activity rhythm and
chemically mediated food search. Animal Behaviour 56: 371-378
Løkkeborg, S., Bjordal, A. & Fernö, A. 1989. Responses of cod (Gadus morhua) and
haddock (Melanogrammus aeglefinus) to baited hooks in the natural environment.
Canadian Journal of Fisheries and Aquatic Sciences 46(9): 1478-1483
Løkkeborg, S., Skajaa, K. & Fernö, A. 2000. Food-search strategy in ling (Molva molva L.):
Crepuscular activity and use of space. Journal of Experimental Marine Biology and
Ecology 247: 195-208
Lutjeharms, J. R. E. 2006. The Agulhas Current. Springer-Verlag, Berlin. 329pp
Lutjeharms, J.R.E., Baird, D. & Hunter, I.T. 1986. See-oppervlak dryfgedrag aan die Suid-
Afrikaanse suidkus in 1979. South African Journal of Science 82(6): 324-326
Mackenzie, B.L. 2005. An assessment of the shore baitfishery in the Eastern Cape. MSc
Thesis, Rhodes University. 115pp

References
112
Malone, J.C., Forrester, G.E. & Steele, M.A. 1999. Effects of subcutaneous microtags on the
growth, survival, and vulnerability to predation of small reef fishes. Journal of
Experimental Marine Biology and Ecology 237(2): 243-253
Mann, B.Q. 1992. Aspects of the biology of two inshore sparid fishes (Diplodus sargus
capensis and Diplodus cervinus hottentotus) off the south east coast of South Africa.
MSc Thesis, Rhodes University. 124pp
Mann, B.Q. 1999. Species highlights - white musselcracker. Tagging News 12: p7
Mann, B.Q. 2000a. Southern African marine linefish status reports. Oceanographic Research
Institute Special Publication No. 7: 257pp
Mann, B.Q. 2000b. Zebra. In Mann, B.Q. (Ed.) Southern African marine linefish status
reports. Oceanographic Research Institute Special Publication No. 7: 147-148
Mann, B.Q. 2000c. Blacktail. In Mann, B.Q. (Ed.) Southern African marine linefish status
reports. Oceanographic Research Institute Special Publication No. 7: 149-150
Mann, B.Q. & Buxton, C.D. 1992. Diets of Diplodus sargus capensis and D.cervinus
hottentotus (Pisces: Sparidae) on the Tsitsikamma coast, South Africa. Koedoe 35(2):
27-36
Mann, B.Q. & Buxton, C.D. 1997. Age and growth of Diplodus sargus capensis and D.
cervinus hottentotus (Sparidae) on the Tsitsikamma Coast, South Africa. Cybium
21(2): 135-147
Mann, B.Q., Scott, G.M., Mann-Lang, J.B., Brouwer, S.L., Lamberth, S.J., Sauer, W.H.H. &
Erasmus, C. 1997. An evaluation of participation in and management of the South
African spearfishery. South African Journal of Marine Science 18: 179-193
Mann, B.Q. & Buxton, C.D. 1998. The reproductive biology of Diplodus sargus capensis
and D. cervinus hottentotus (Sparidae) off the south-east cape coast, South Africa.
Cybium 22(1): 31-47

References
113
Mann, B.Q., McDonald, A.M., Sauer, W.H.H. & Hecht, T. 2003. Evalustion of participation
in and management of the Transkei shore linefishery. African Journal of Marine
Science 25: 79-97
Matlock, G.C. 1981. Nonreporting of recaptured tagged fish by saltwater recreational boat
anglers in Texas. Transactions of the American Fisheries Society 110(1): 90-92
Matsumoto, K. 2001. Overlapping territory of a benthophagous fish, Goniistius zonatus
(Teleostei: Cheilodactylidae). Ecological Research 16: 715-726
Matthews, K.R. 1990. A telemetric study of the home ranges and homing routes of copper
and quillback rockfishes on shallow rocky reefs. Canadian Journal of Zoology 68(11):
2243-2250
McCullagh, P. & Nelder, J. A. 1989. Generalized linear models. Chapman & Hall/CRC,
Boca Raton. 511pp
McFarland, W.N. 1986. Light in the sea - correlations with behaviors of fishes and
invertebrates. American Zoology 26: 389-401
Meyer, C.G., Holland, K.N., Wetherbee, B.M. & Lowe, C.G. 2000. Movement patterns,
habitat utilization, home range size and site fidelity of whitesaddle goatfish,
Parupeneus porphyreus, in a marine reserve. Environmental Biology of Fishes 59(3):
235-242
Meyer, C.G. & Holland, K.N. 2005. Movement patterns, home range size and habitat
utilization of the bluespine unicornfish, Naso unicornis (Acanthuridae) in a Hawaiian
marine reserve. Environmental Biology of Fishes 73: 201-210
Millar, R.B. & Willis, T.J. 1999. Estimating the relative density of snapper in and around a
marine reserve using a log-linear mixed-effects model. Australian and New Zealand
Journal of Statistics 41(4): 383-394

References
114
Millar, R.B. & Anderson, M.J. 2004. Remedies for pseudoreplication. Fisheries Research 70:
397-407
Moran, M., Burton, C. & Jenke.J. 2003. Long-term movement patterns of continental shelf
and inner gulf snapper (Pagrus auratus, Sparidae) from tagging in the Shark Bay
region of Western Australia. Marine and Freshwater Research 54(8): 913-922
Munro, J.L. 2000. Outmigration and movement of tagged coral reef fish in a marine fishery
reserve in Jamaica. Proceedings of the Gulf Caribbean Fisheries Institute 51: 557-568
Nagelkerken, I. & van der Velde, G. 2006. Are Caribbean mangroves important feeding
grounds for juvenile reef fish from adjacent seagrass beds? Marine Ecology Progress
Series 274: 143-151
Nagelkerken, I., Bothwell, J., Nemeth, R.S., Pitt, J.M. & van der Velde, G. 2008. Interlinkage
between Caribbean coral reefs and seagrass beds through feeding migrations by grunts
(Haemulidae) depends on habitat accessibility. Marine Ecology Progress Series 368:
155-164
Nanami, A. & Nishihira, M. 2002. The structures and dynamics of fish communities in an
Okinawan coral reef: Effects of coral-based habitat structures at sites with rocky and
sandy sea bottoms. Environmental Biology of Fishes 63: 353-372
Nanami, A. & Yamada, H. 2008. Foraging rates and substratum selection in foraging activity
of checkered snapper Lutjanus decussatus (Lutjanidae) in an Okinawan coral reef.
Journal of Fish Biology 73: 1484-1488
Neuenfeldt, S., Hinrichsen, H.H., Nielsen, A. & Andersen, K.H. 2007. Reconstructing
migrations of individual cod (Gadus morhua L.) in the Baltic Sea by using electronic
data storage tags. Fisheries Oceanography 16(6): 526-535
Nielsen, E.E., Gronkjaer, P., Meldrup, D. & Paulsen, H. 2005. Retention of juveniles within
a hybrid zone between North Sea and Baltic Sea Atlantic cod (Gadus morhua).
Canadian Journal of Fisheries and Aquatic Sciences 62(10): 2219-2225

References
115
Northwest Marine Technology, I. 2008. Visible implant elastomer tag project manual.
Guidelines on planning and conducting projects using VIE and associated equipment.
28pp
Ogden, J.C. & Buckman, N.S. 1973. Movements, foraging groups, and diurnal migrations of
the striped parrotfish Scarus croicensis Bloch (Scaridae). Ecology 54(3): 589-596
Palumbi, S.R. 2003. Population genetics, demographic connectivity, and the design of marine
reserves. Ecological Applications 13(1,SUPPL.): S146-S158
Perga, M.E. & Gerdeaux, D. 2001. Using the 13
C and 15
N of whitefish scales for retrospective
ecological studies: Changes in isotope signatures during the restoration of Lake
Geneva, 1980-2001. Journal of Fish Biology 63: 1197-1207
Pittman, S.J. & McAlpine, C.A. 2003. Movements of marine fish and decapod crustaceans:
Process, theory and application. Advances in Marine Biology 44: 205-294
Pittman, S.J., Caldow, C., Hile, S.D. & Monaco, M.E. 2007. Using seascape types to explain
the spatial patterns of fish in the mangroves of SW Puerto Rico. Marine Ecology
Progress Series 348: 273-284
Polunin, N.V.C. & Roberts, C.M. 1993. Greater biomass and value of target coral-reef fishes
in two small Caribbean marine reserves. Marine Ecology Progress Series 100(1-2):
167-176
Polunin, N.V.C. & Pinnegar, J.K. 2002. Trophic ecology and the structure of marine food
webs. In Hart, P.J.B. & Reynolds, J.D. (Eds.) Handbook of Fish Biology and
Fisheries, Volume 1: Fish Biology: 301-320
Porte, C., Janer, G., Lorusso, L.C., Ortiz-Zarragoitia, M., Cajaraville, M.P., Fossi, M.C. &
Canesi, L. 2006. Endocrine disruptors in marine organisms: Approaches and
perspectives. Comparative Biochemistry and Physiology Part C: Pharmacology,
Toxicology and Endocrinology 143: 303-315

References
116
Pottoff, M.T. & Allen, D.M. 2003. Site fidelity, home range, and tidal migrations of juvenile
pinfish, Lagodon rhomboides, in salt marsh creeks. Environmental Biology of Fishes
67(3): 231-240
Power, M.E. 1990. Effects of fish in river food webs. Science 250(4982): 811-814
Pradervand, P. & Hiseman, R. 2006. An analysis of the recreational shore fishery in the
Goukamma Marine Protected Area. African Zoology 41(2): 275-289
Rangeley, R.W. & Kramer, D.L. 1995. Use of rocky intertidal habitats by juvenile pollock
Pollachius virens. Marine Ecology Progress Series 126: 9-17
Raudenbush, S.W. 2000. Maximum likelihood for generalized linear models with nested
random effects via highorder, multivariate Laplace approximation. Journal of
Computational and Graphical Statistics 9: 141-157
Reebs, S.G. 2002. Plasticity of diel and circadian activity rhythms in fishes. Reviews in Fish
Biology and Fisheries 12: 349-371
Rodriguez, G. & Goldman, N. 2001. Improved estimation procedures for multilevel models
with binary response: A case-study. Journal of the Royal Statistical Society: Series A
(Statistics in Society) 164: 339-355
Rogers, S.I. & Millner, R.S. 1996. Factors affecting the annual abundance and regional
distribution of English inshore demersal fish populations: 1973-1995. ICES Journal of
Marine Science 53(6): 1094-1112
Ross, S.W. & Lancaster, J.E. 2002. Movements and site fidelity of two juvenile fish species
using surf zone nursery habitats along the southeastern North Carolina coast.
Environmental Biology of Fishes 63(2): 161-172
Russ, G.R. 2002. Yet another review of marine reserves as reef fishery management tools. In
Sale, P.F. (Ed.) Coral reef fishes - Dynamics and diversity in a complex ecosystem.
Academic Press, London: 421-443

References
117
Sadovy, Y.J. 1996. Reproduction of reef fishery species. In Polunin, N.V.C. & Roberts, C.M.
(Eds.) Reef Fisheries. Chapman & Hall, London: 15-59
Sadovy, Y.J. & Domeier, M.L. 2005. Are aggregation-fisheries sustainable? Reef fish
fisheries as a case study. Coral Reefs 24: 254-262
Schoeman, E. Uknown publishing date. Seehengel in Suid-Kaap, Mosselbaai 100pp
Schoeman, F. & Schoeman, S. 1990. Strike! The book on salt water fishing in southern
Africa, Somerset West. 616pp
Schumann, E.H. 1988. Physical oceanography off Natal. In Schumann, E.H. (Ed.) Coastal
ocean studies off Natal, South Africa. Springer, Berlin: 101-130
Schumann, E.H. 1999. Wind-driven mixed layer and coastal upwelling processes off the
south coast of South Africa. Journal of Marine Research 57(4): 671-691
Schumann, E.H. & Brink, K.H. 1990. Coastal-trapped waves off the coast of South Africa:
Generation, propagation and current structures. Journal of Physical Occeanography
20: 1206-1218
Shannon, L.V. & Chapman, P. 1983. Suggested mechanism for the chronic pollution by oil
of beaches east of Cape Agulhas, South Africa. South African Journal of Marine
Science 1: 231-244
Shumway, C.A. 1999. A neglected science: Applying behavior to aquatic conservation.
Environmental Biology of Fishes 55: 183-201
Sink, K., Harris, J. & Lombard, A.T. 2004. Appendix 1: South African marine bioregions,
South African National Spatial Biodiversity Assessment 2004: Technical Report
Volume 4: Marine Component. South African National Biodiversity Institute,
Pretoria: 97-109

References
118
Smale, M.J. 1988. Distribution and reproduction of the reef fish Petrus rupestris (Pisces:
Sparidae) off the coast of South Africa. South African Journal of Zoology 23(4): 272-
287
Smale, M.J. & Buxton, C.D. 1989. The subtidal gully fish community of the Eastern Cape
and the role of this habitat as a nursery area. South African Journal of Zoology 24(1):
58-67
Smith, M.K.S. 2005. Towards a new approach for coastal governance with an assessment of
the Plettenberg bay nearshore linefisheries. MSc Thesis, Rhodes University. 218pp
Smith, M.K.S., King, C.M., Sauer, W.H.H. & Cowley, P.D. 2007. Development of fishery
indicators for local management initiatives - a case study for Plettenberg Bay, South
Africa. African Journal of Marine Science 29(3): 511-525
Snijders, T. A. B. & Bosker, R. J. 1999. Multilevel analysis: An introduction to basic and
advanced multilevel modeling. Sage Publications, Thousand Oaks. 266pp
Stephenson, P.C., Edmonds, J.S., Moran, J.M. & Caputi, N. 2001. Analysis of stable isotope
ratios to investigate stock structure of red emperor and Rankin cod in northern
Western Australia. Journal of Fish Biology 58: 126-144
Stoner, A.W. 2004. Effects of environmental variables on fish feeding ecology: Implications
for the performance of baited fishing gear and stock assessment. Journal of Fish
Biology 65: 1445-1471
Strydom, N.A. 2008. Utilization of shallow subtidal bays associated with warm temperate
rocky shores by the late-stage larvae of some inshore fish species, South Africa.
African Zoology 43(2): 256-269
Sunde, J. & Isaacs, M. 2008. Marine conservation and coastal communities: Who carries the
costs? A study of marine protected areas and their impact on traditional small-scale
fishing communities in South Africa, SAMUDRA Monograph International Collective
in Support of Fishworkers, Chennai, India. 49pp

References
119
Swearer, S.E., Shima, J.S., Hellberg, M.E., Thorrold, S.R., Jones, G.P., Robertson, D.R.,
Morgan, S.G., Selkoe, K.A., Ruiz, G.M. & Warner, R.R. 2002. Evidence of self-
recruitment in demersal marine populations. Bulletin of Marine Science 70(1): 251-
271
Teo, S.L.H. & Able, K.W. 2003. Habitat use and movement of the mummichog (Fundulus
heteroclitus) in a restored salt marsh. Estuaries 26(3): 720-730
Ter Morshuizen, L.D. & Whitfield, A.K. 1994. The distribution of littoral fish associated
with eelgrass Zostera capensis beds in the Kariega Estuary, a southern African system
with a reversed salinity gradient. South African Journal of Marine Science 14: 95-105
Thompson, R.C., Crowe, T.P. & Hawkins, S.J. 2002. Rocky intertidal communities: Past
environmental changes, present status and predictions for the next 25 years.
Environmental Conservation 29(2): 168-191
Thorstad, E.B., Hay, C.J., Næsje, T.F., Chanda, B. & Økland, F. 2004. Effects of catch-and-
release angling on large cichlids in the subtropical Zambezi River. Fisheries Research
69: 141-144
Tilney, R.L., Nelson, G., Radloff, S.E. & Buxton, C.D. 1996. Ichthyoplankton distribution
and dispersal in the Tsitsikamma National Park Marine Reserve, South Africa. South
African Journal of Marine Science 17: 1-14
Tupper, M. 2007. Identification of nursery habitats for commercially valuable humphead
wrasse Cheilinus undulatus and large groupers (Pisces: Serranidae) in Palau. Marine
Ecology Progress Series 332: 189-199
Turpie, J.K., Beckley, L.E. & Katua, S.M. 2000. Biogeography and the selection of priority
areas for conservation of South African coastal fishes. Biological Conservation 92:
59-72

References
120
Unsworth, R.K.F., Bell, J.J. & Smith, D.J. 2007. Tidal fish connectivity of reef and sea grass
habitats in the Indo-Pacific. Journal of the Marine Biological Association of the
United Kingdom 87: 1287-1296
van der Elst, R.P. 1988a. A success story in conservation. Bulletin of The South African
Association for Marine Biological Research 16: 16-17
van der Elst, R.P. 1988b. Shelf ichthyofauna off Natal. In Schumann, E.H. (Ed.) Coastal
ocean studies off Natal, South Africa. Springer, Berlin: 209-225
van der Elst, R. P. 1990. A guide to the common sea fishes of Southern Africa. 212pp
van der Elst, R.P. & Bullen, E. 1993. ORI/Sedgwicks marine linefish tagging project yields
results. Oceanographic Research Institute Special Publication 2: 64-67
van der Veer, H.W., Witte, J.I.J., Beumkes, H.A., Dapper, R., Jongejan, W.P. & van der
Meer, J. 1992. Intertidal fish traps as a tool to study long-term trends in juvenile
flatfish populations. Netherlands Journal of Sea Research 29(1-3): 119-126
van Rooyen, P. 1988. Diving and spearfishing in South Africa. Southern, Johannesburg.
157pp
Venables, W.N. & Dichmont, C.M. 2004. GLMs, GAMs and GLMMs: An overview of
theory for applications in fisheries research. Fisheries Research 70: 319-337
Watson, M., Munro, J.L. & Gell, F.R. 2002. Settlement, movement and early juvenile
mortality of the yellowtail snapper Ocyurus chrysurus. Marine Ecology Progress
Series 237: 247-256
Weidman, C.R. & Millner, R. 2000. High-resolution stable isotope records from North
Atlantic cod. Fisheries Research 40: 327-342

References
121
Weyl, O.L.F., Kaiser, H. & Hecht, T. 1996. On the efficacy and mode of action of 2-
phenoxyethanol as an anaesthetic for goldfish, Carassius auratus (L.), at different
temperatures and concentrations. Aquaculture Research 27(10): 757-564
Whitfield, A. K. 1998. Biology and ecology of fishes in Southern African estuaries. J.L.B.
Smith Institute of Ichthyology, Grahamstown. 223pp
Willis, T.J., Parsons, D.M. & Babcock, R.C. 2001. Evidence for long-term site fidelity of
snapper (Pagrus auratus) within a marine reserve. New Zealand Journal of Marine
and Freshwater Research 35: 581-590
Willis, T.J., Millar, R.B. & Babcock, R.C. 2003. Protection of exploited fish in temperate
regions: High density and biomass of snapper Pagrus auratus (Sparidae) in northern
New Zealand marine reserves. Journal of Applied Ecology 40(2): 214-227
Wood, A.D., Brouwer, S.L., Cowley, P.D. & Harrison, T.D. 2000. An updated checklist of
the ichthyofaunal species assemblage of the Tsitsikamma National Park, South Africa.
Koedoe 43(1): 83-98
Zeller, D.C. 1997. Home range and activity patterns of the coral trout Plectropomus
leopardus (Serranidae). Marine Ecology Progress Series 154: 65-77
Zeller, D.C. 2002. Tidal current orientation of Plectropomus leopardus (Serranidae). Coral
Reefs 21: 183-187
Zeller, D.C. & Russ, G.R. 2000. Population estimates and size structure of Plectropomus
leopardus (Pisces: Serranidae) in relation to no-fishing zones: Mark-release-
resighting and underwater visual census. Marine and Freshwater Research 51(3):
221-228