The effect of temperature and humidity changes on insects ...

Seasonal pattern of mortality and relationships between mortality and temperature-humidity index in dairy cows A. Vitali ,* M. Segnalini ,* L. Bertocchi ,† U. Bernabucci ,* A. Nardone ,* and N. Lacetera *1
* Dipartimento di Produzioni animali, Università della tuscia, Viterbo, Italy † Istituto zooprofilattico Sperimentale Lombardia and emilia Romagna, Brescia, Italy
ABSTRACT
The 2 studies described investigated seasonal varia-tions of mortality and temperature-humidity index (THI)–mortality relationships in dairy cows. Mortality data were extracted from the Italian Bovine Spongi-form Encephalopathy databases, which contain records on cows older than 24 mo that died on a farm from all causes (98% of total records), were slaughtered in an emergency state, or were sent for normal slaughter but were sick in the preslaughter inspection (2% of total records). Both studies evaluated mortality data dur-ing a 6-yr period (2002 to 2007). The seasonal pattern study was conducted throughout Italy and was based on 320,120 deaths. An association between season and deaths was found for all 6 yr. Summer and spring were the seasons with the highest and lowest frequency of deaths (15,773.3 ± 2,861 and 11,619.3 ± 792.3), respec-tively, and within summer months, the number of deaths in July and August (5,435 ± 284 and 5,756 ± 676.2, respectively) was higher than in June (4,839 ± 344.8). The THI–mortality relationships study was carried out only for deaths (51,240) reported for the Lombardia and Emilia Romagna regions. For this study, the mor-tality databases were integrated with THI data, which were calculated by using data from 73 weather stations. Each farm where deaths were recorded was assigned the THI values (maximum and minimum) calculated at the closest weather station for each day the events (deaths) were reported. Analysis of data indicated that approxi-mate THI values of 80 and 70 were the maximum and minimum THI, respectively, above which the number of deaths in dairy farms starts to increase. Maximum and minimum THI values of 87 and 77 were the upper criti-cal THI above which the risk of death for dairy cows becomes maximum. This study defined quantitative relationships between mortality risk and THI in dairy cows and may help to provide emergency interventions and mitigation measures, which may ensure survival
of dairy cows and reduce replacement costs associated with heat stress-related mortality. Key words: dairy cow , mortality , season , temperature-humidity index
INTRODUCTION
Studies aimed at assessing seasonal changes of mor-tality in domestic ruminants are limited. Recently, Dechow and Goodling (2008) reported that the propor-tion of culling and deaths from all causes in transi-tion dairy cows was higher during the hottest calving months. Furthermore, in a 2-yr study in California, Stull et al. (2008) reported that the relationship be-tween dairy cow mortality from all causes and monthly average daily temperatures was U-shaped. In an Indian study, Purusothaman et al. (2008) reported an increase of mortality in Mecheri sheep in summer.
Another series of studies or reports on the effects of temperatures on farm animal mortality described an increase of deaths during extreme weather events. Hahn and Mader (1997), Xin and Puma (2001), and Hahn et al. (2002) described the effect on livestock from a week-long heatwave in the mid-central United States during July 1995. Furthermore, Hahn and Mader (1997) indicated that the risk of death for cows exposed to high temperatures was particularly high with little or no nighttime recovery. Those authors defined night-time recovery on the basis of the number of hours with temperature-humidity index (THI) <72. Finally, dur-ing the severe and prolonged heatwaves that occurred in Europe during the summer of 2003, over 35,000 people, and thousands of pigs, poultry, and rabbits died in the French regions of Brittany and Pays-de-la-Loire (http://lists.envirolink.org/pipermail/ar-news/week-of-Mon-20030804/004707.html).
The THI incorporates the effects of both temperature and relative humidity and is commonly used to quan-tify the degree of heat stress on dairy cattle (NOAA, 1976). Several studies documented negative relation-ships between THI and productive and reproductive performances in dairy cows (Bouraoui et al., 2002; García-Ispierto et al., 2007). Conversely, the relation-
J. Dairy Sci. 92 :3781–3790doi: 10.3168/jds.2009-2127 © american Dairy Science association, 2009 .
3781
Received February 13, 2009. Accepted April 17, 2009. 1 Corresponding author: [email protected]
ships between THI and mortality in dairy cows have not been established previously. Yet, even if experimen-tal evidence supporting categorization of THI values in hazard levels were not clear, Silanikove (2000) reported that a THI of 80 would be the upper critical THI above which most domestic ruminants enter in a noxious stage, which was defined as a stage compromising their survival.
The 2 studies described were aimed at investigating seasonal variations of mortality and THI–mortality relationships in dairy cows.
MATERIALS AND METHODS
The studies described below (seasonal pattern and THI–mortality relationships study) were conducted on mortality data collected during a 6-yr period (2002 to 2007). The seasonal pattern study was conducted throughout Italy. The THI–mortality relationship
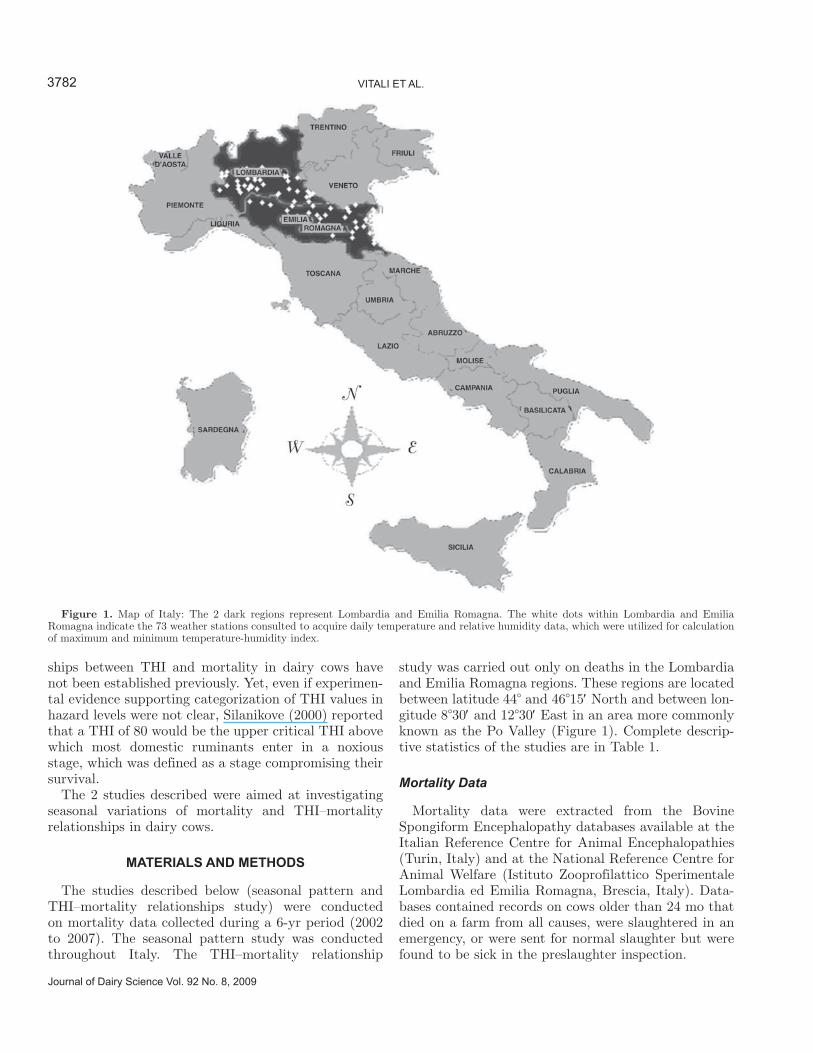
study was carried out only on deaths in the Lombardia and Emilia Romagna regions. These regions are located between latitude 44° and 46°15′ North and between lon-gitude 8°30′ and 12°30′ East in an area more commonly known as the Po Valley (Figure 1). Complete descrip-tive statistics of the studies are in Table 1.
Mortality Data
Mortality data were extracted from the Bovine Spongiform Encephalopathy databases available at the Italian Reference Centre for Animal Encephalopathies (Turin, Italy) and at the National Reference Centre for Animal Welfare (Istituto Zooprofilattico Sperimentale Lombardia ed Emilia Romagna, Brescia, Italy). Data-bases contained records on cows older than 24 mo that died on a farm from all causes, were slaughtered in an emergency, or were sent for normal slaughter but were found to be sick in the preslaughter inspection.
Journal of Dairy Science Vol. 92 No. 8, 2009
VItaLI et aL.3782
Figure 1. Map of Italy: The 2 dark regions represent Lombardia and Emilia Romagna. The white dots within Lombardia and Emilia Romagna indicate the 73 weather stations consulted to acquire daily temperature and relative humidity data, which were utilized for calculation of maximum and minimum temperature-humidity index.
A qualitative analysis of the databases revealed that 98% of the deaths reported were cows that died on a farm and 2% were cows that died at the slaughterhouse. In the studies described below, no distinction is made between the categories of deaths. For each death re-ported, the databases provided cow identification num-ber (official ear tag), date of death, the identification number of the farm where the cow was before death, and the region where the farm was located.
For the 6-yr period, the databases recorded 320,120 deaths, and the number of farms involved (farms where at least 1 death was reported in the years 2002 to 2007) ranged from 26,822 (year 2003) and 21,392 (year 2006).
Seasonal Pattern Study
The seasonal pattern of mortality was studied by utilizing all 320,120 deaths reported in the databases. The months of December, January, and February were defined as winter; March, April, and May as spring; June, July, and August as summer; and September, October, and November as fall.
The chi-square goodness of fit was used to compare observed seasonal deaths with deaths expected under the assumption that deaths would be randomly distrib-uted throughout the seasons. If differences calculated by the chi-square goodness of fit were significant, the seasons with the highest and lowest frequencies of deaths were tested to evaluate differences from the average of all seasons combined (Sheth et al., 1999). In practice, the overall mean was set at a relative risk (RR) of 1, and the seasonal variation in the number of deaths was expressed as the difference in RR between the seasons with the highest and lowest mortality.
The same chi-square goodness of fit analysis was carried out for mortality rates. Calculation of the
seasonal mortality rate was carried out by taking into consideration cow numbers (all cows), which was obtained for each year from the National Insti-tute of Statistics (ISTAT, http://www.istat.it/dati/dataset/20080630_00/). It was assumed that deaths were randomly distributed throughout the seasons or that cow numbers did not vary with season. The latter assumption was supported from the analysis of data relative to monthly cow numbers, which were obtained for a restricted number of farms (approximately 2,300; 10% of total farms). Monthly data of cow numbers were provided by the Italian Animal Breeders Association. This analysis indicated that overall seasonal variation of the number of cows was below 2.5%, and that no significant seasonality was observed for this parameter (data not shown).
Finally, an ANOVA was carried out to compare the number of deaths among summer months. Data were reported as least squares means ± SE, and differ-ences between means were considered significant at P < 0.05.
THI–Mortality Relationships Study
This study used data on deaths from dairy farms located in the Po Valley (Figure 1). The main reasons for limiting the THI–mortality relationships study to this geographic area were the high concentration of dairy farms (approximately 60% of the Italian dairy cow population) and the large number of weather sta-tions, which enabled us to obtain temperature and rela-tive humidity data. Furthermore, dairy farms located in this area were highly homogeneous for the production system adopted (intensive), number and genetic merit of cows, average milk yield per cow, and for stall design and management (total confinement free stall housing with no time at pasture, TMR as feeding practices, and year-round calving patterns).
3783SeaSON-ReLateD MORtaLItY IN DaIRY COWS
Journal of Dairy Science Vol. 92 No. 8, 2009
Table 1. Descriptive statistics of seasonal and environmental studies conducted in Italy
Study period (years) 2002 to 2007Seasonal pattern study: Geographic area Entire territory of Italy Deaths, n 320,120 Farms, n (range)1 26,822 (year 2003) to 21,392 (year 2006) Cows, n (range)2 1,913,424 (year 2003) to 1,821,370 (year 2006)THI-mortality relationships study: Geographic area Lombardia and Emilia Romagna regions (latitude 44° to 46°15′ North and longitude 8°30′
to 12°30′ East) Deaths, n 51,240 Farms, n (range)1 2,526 (year 2003) to 2,008 (year 2007) Cows, n (range)2 293,065 (year 2006) to 239,346 (year 2002) Weather stations consulted, n 73 Weather station-farms distance, km 8.85 ± 5.23
1Number of farms where at least 1 death was recorded. The 2 values indicate the maximum and minimum number of farms involved in the 6-yr period.2The 2 values indicate the maximum and minimum number of cows present on the farms involved in the study during the 6-yr period.

After calculating several thousand distances, meteo-rological data from 73 weather stations were utilized to calculate and attribute THI values to 2,291 ± 189 (mean ± SD) dairy farms. The distance between weather sta-tions and farms was 8.85 ± 5.23 km (Figure 1).
The daily maximum and minimum THI on the day of a death were calculated using the following formula (Kelly and Bond, 1971):
THI = (1.8 × AT + 32) – (0.55 – 0.55 × RH)
× [(1.8 × AT + 32) – 58],
where AT is the ambient temperature (°C), and RH the relative humidity as a fraction of the unit. With respect to the original equation, this formula includes terms (1.8 × AT + 32) that account for conversion of temperature data from degrees Celsius (°C) to degrees Fahrenheit (°F). Such conversion was needed because most of literature data reported the THI calculated by measuring ambient temperature on the Fahrenheit scale. Maximum AT and minimum RH were utilized for cal-culation of maximum THI, whereas minimum AT and maximum RH were utilized for calculation of minimum THI. Ambient temperature and RH at the weather sta-tions were recorded at a height of 2 m by using mercury thermometers and psychrometers, respectively. In the 6-yr period, mean values and standard deviations of maximum and minimum AT were 19 ± 9°C and 9 ± 7°C, respectively; mean values and standard deviations of maximum and minimum RH were 93 ± 6% and 55 ± 14%, respectively.
A Kolmogorov-Smirnov test indicated that the frequency of maximum THI values was normally dis-tributed (Figure 2a). The same distribution was ob-served when plotting the absolute number of deaths attributed to each value of the maximum THI (Figure 2b). A similar outcome was found by plotting the data (number of registrations of THI values or number of deaths) considering the minimum THI (data not shown). Therefore, before the analysis, the number of deaths associated with each THI value was adjusted (AND, adjusted number of deaths) for the number of times each THI value was present in the databases. In practice, the number of deaths recorded at a given THI was divided by number of times that the given THI was represented in the databases. Finally, before the analysis, values of the AND were multiplied by 1,000 for ease of interpretation.
The analysis of the relationships between the adjusted number of deaths and THI was carried out by using two approaches. The first approach was based on calcula-tion of a 2-phase linear regression procedure (Nickerson et al., 1989), which detected an inflection point, if one
existed, in the relationship between the independent (maximum or minimum THI) and dependent variable (AND). This technique was chosen after plotting the data and after considering that they may have been divided in 2 distinct segments.
The second approach was based on the ANOVA. For this purpose, values of maximum and minimum THI reported were grouped into 7 and 6 categories, respec-tively. The 7 categories grouping maximum THI values were 30 to 74, 75 to 77, 78 to 80, 81 to 83, 84 to 86, 87 to 89, and 90 to 92; the 6 categories grouping minimum THI values were 9 to 64, 65 to 67, 68 to 70, 71 to 73, 74 to 76, and 77 to 79. Then, each category of maximum and minimum THI was assigned the sum of the AND recorded for each THI value included in that category.
The first category of maximum THI (30 to 74) grouped THI values below 74, which several authors indicated as the upper critical THI for dairy cows (Kadzere et al., 2002; West, 2003). The remaining 6 categories were 3-unit arbitrary categories. Similarly, the first category of minimum THI (9 to 64) grouped THI values below 64, which some authors indicated as the critical mini-mum THI during heat stress that provides a margin of safety to reduce the effects of heat stress on production in dairy cows (West et al., 2003). The remaining cat-egories (5) were 3-unit arbitrary categories.
The AND for each of the 7 or 6 categories was ana-lyzed by ANOVA (GLM procedure). Data were reported as least squares means ± SE, and differences between means were considered significant at P < 0.05. Finally, the Pearson correlations between maximum and mini-mum THI values were calculated.
RESULTS
Seasonal Pattern Study
A significant association between seasonality and deaths was found for all the 6 years of the study (P < 0.001). Results of the RR analysis for the seasons with the highest and lowest frequency of deaths are in Table 2. With the exception of 2007, summer and spring were the seasons with the highest and lowest frequency of deaths, respectively. The RR for summer varied be-tween 1.07 (year 2005; P < 0.001) and 1.39 (year 2003; P < 0.001); that for spring ranged from 0.83 (year 2003; P < 0.001) to 0.93 (years 2005; P < 0.001). In terms of deaths, the largest difference between the season with the highest (summer) and with the lowest frequency (spring) was recorded for the year 2003. In this year, compared with spring, the number of deaths during summer was approximately 67% higher. For the year 2007, the highest and lowest frequencies of deaths were recorded in fall and winter, respectively. Considering
Journal of Dairy Science Vol. 92 No. 8, 2009
VItaLI et aL.3784

the entire period (2002 to 2007), the RR for summer and spring seasons was 1.18 (P < 0.001) and 0.87 (P < 0.001), respectively; compared with spring, the overall number of deaths during summer was approximately 36% higher.
Results did not change when considering values of the mortality rate (data not shown). Annual mortal-ity rate ranged from 2.6% (year 2005) to 3.3% (year 2003). The largest difference (P < 0.001) between the 2 seasons was recorded in the year 2003 (0.68 and 1.14% for spring and summer, respectively). Considering the overall 6-yr period, mortality rates for summer and spring were 0.85 and 0.62%, respectively (P < 0.001).
The ANOVA for the number of deaths registered within the summer months revealed that the month of August had the highest mortality (5,756 ± 676.2 deaths), and that the number of deaths in July (5,435 ± 284) and August was higher (P < 0.05) than in June (4,839 ± 344.8). The number of deaths did not differ significantly between July and August.
THI–Mortality Relationships Study
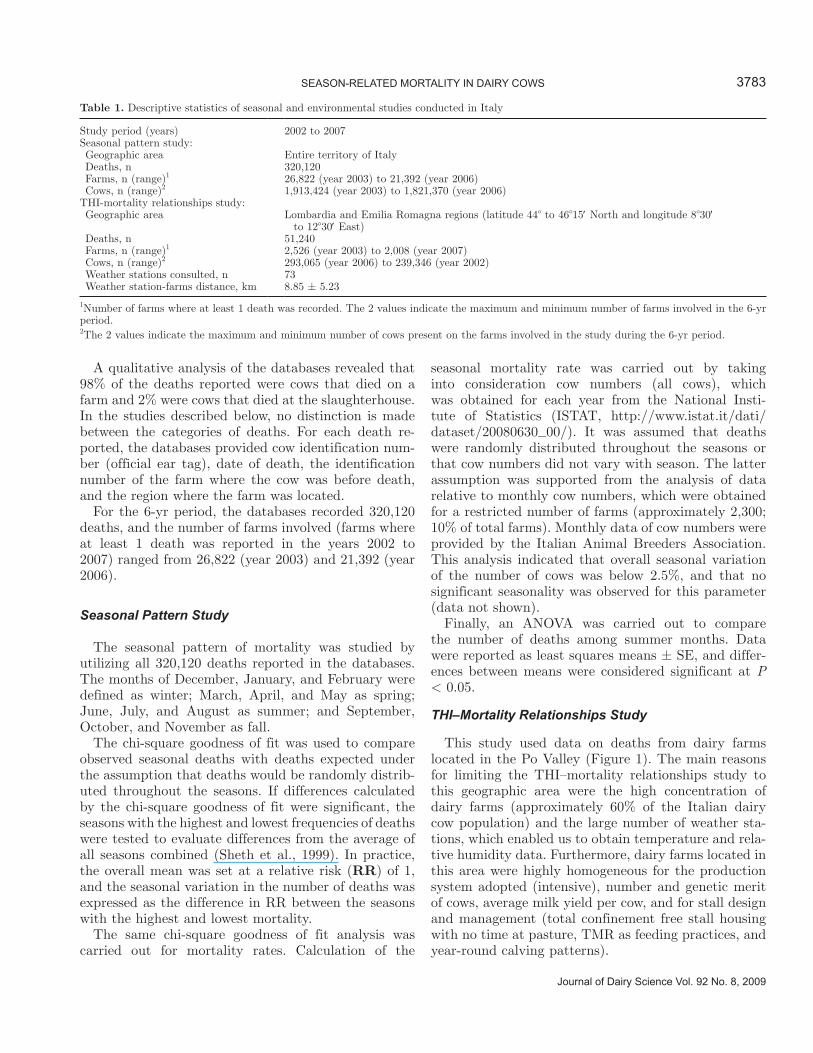
Results of the 2-phase regression analysis are in Fig-ure 3. The 2-phase regression computed with maximum THI as the independent variable (R2 = 0.968) indicated
3785SeaSON-ReLateD MORtaLItY IN DaIRY COWS
Journal of Dairy Science Vol. 92 No. 8, 2009
Figure 2. Frequencies of the maximum temperature-humidity index (THI) values recorded in the 6-yr period among the 73 weather stations (a) and the number of deaths attributed to each value of maximum THI (b).

a break point at 79.6 with a final loss of 2,157,931.2 (lowest total sum of square errors; Figure 3a). The model provided slope and intercept of 2 distinct regres-sion lines: the first line was AND = 443.04 – 0.5421E-04 × THI (R2 = 0.0119; F1,50 = 0.910; P = 0.5) below the break point (30 to 79.6 THI range); the second line was AND = −18,119 + 232.75 × THI (R2 = 0.838; F1,13 = 269.65; P = 0.001) above the break point (79.6 to 92 THI range).
The 2-phase regression calculated with minimum THI as the independent variable (R2 = 0.892) indicated a break point at 70.3 with a final loss of 3,415,833.9 (Fig-ure 3b). Also, the model provided slope and intercept of 2 distinct regression lines: the first line was AND = 464.38 – 0.1576 × THI (R2 = 0.0004; F1,62 = 0.930; P = 0.5) below the break point (9 to 70.3 THI range); the second line was AND = –16,886.77 + 246.73 × THI (R2 = 0.6151; F1,9 = 707.01; P = 0.001) above the break point (70.3 to 79 THI range).
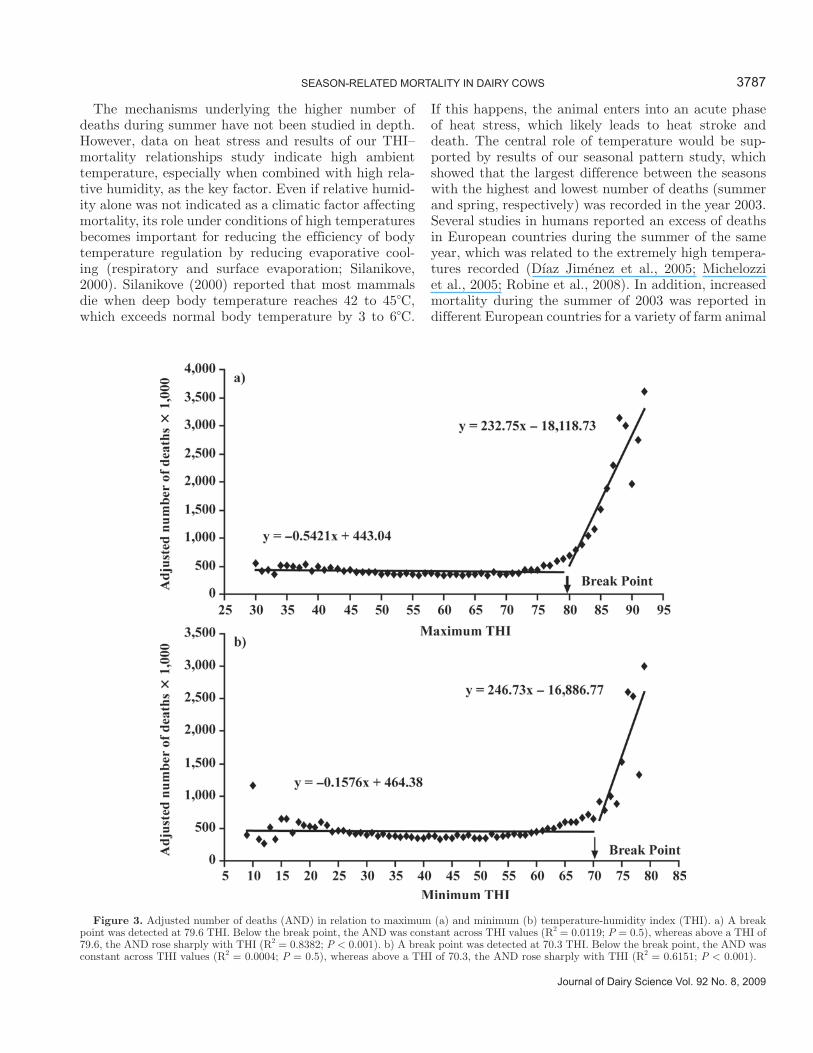
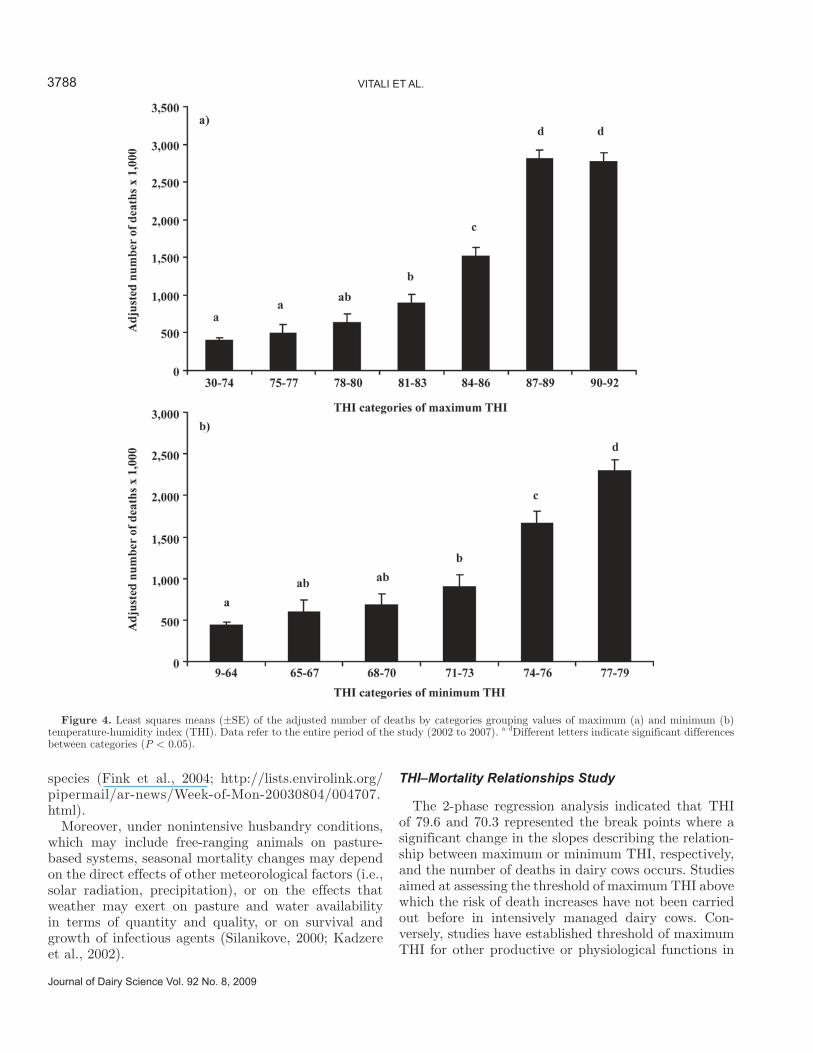
Results of the ANOVA are in Figure 4. Figure 4a re-ports results of the ANOVA carried out by considering the AND grouped according to categories of maximum THI. Compared with the THI category 30 to 74, the AND was significantly higher in the categories 81 to 83, 84 to 86, 87 to 89, and 90 to 92. Moreover, the AND did not differ between categories 87 to 89 and 90 to 92, and values of both these categories were significantly higher than those recorded in all the other categories.
Figure 4b reports results of the ANOVA carried out considering the AND grouped according to categories of minimum THI. Compared with the THI category 9 to 64, the AND was significantly higher in the categories 71 to 73, 74 to 76, and 77 to 79. Moreover, the AND of the category 77 to 79 was significantly higher than those recorded for all the other categories.
Results of the ANOVA did not change substantially when the analysis was carried out considering each sin-gle year separately (data not shown). Finally, a positive correlation was found between maximum and minimum THI value (r = 0.92; P = 0.0001).
DISCUSSION
Seasonal Pattern Study
Results of the seasonal pattern study showed a sig-nificant association between seasonality and deaths or mortality rate and indicated that a higher number of deaths should be expected during summer. Further-more, among summer months, the number of deaths was significantly higher in July and August.
These results support those found for neonatal or mature dairy cows, buffaloes, and sheep reared in different countries. A study carried out in California reported a higher incidence of deaths in calves born during summer, winter, or periods with extreme tem-peratures in general (Martin et al., 1975). Recently, in dairy cows, Dechow and Goodling (2008) reported that the unfavorable effect of calving on cow sur-vival was more pronounced during the hottest calv-ing months, and that among the hottest months, the highest incidence of deaths or culling was in August. In a recent retrospective 11-yr study, Purusothaman et al. (2008) reported that mortality from all causes in adult sheep was higher during the summer season. However, a cow study reported no seasonal variation of mortality in adults (Faye and Pérochon, 1995). Dif-ferent climatic characteristics of the geographic areas likely explain discrepancy among results found in the literature.
Journal of Dairy Science Vol. 92 No. 8, 2009
VItaLI et aL.3786
Table 2. Number of deaths and relative risk (RR; in parentheses) by season1
Year
Season
TotalWinter Spring Summer Fall
2002 12,562 11,775 (0.87) 15,652 (1.16) 14,180 54,1690.85 to 0.89 1.13 to 1.18
2003 13,850 13,077 (0.83) 21,830 (1.39) 14,106 62,8630.81 to 0.85 1.36 to 1.42
2004 13,095 11,947 (0.90) 15,020 (1.13) 13,264 53,3260.87 to 0.92 1.10 to 1.15
2005 11,930 11,063 (0.93) 12,773 (1.07) 11,982 47,7480.90 to 0.95 1.04 to 1.10
2006 11,529 10,579 (0.86) 14,200 (1.16) 12,778 49,0860.84 to 0.89 1.13 to 1.18
2007 11,259 (0.85) 11,275 15,165 15,229 (1.15) 52,9280.83 to 0.87 1.12 to 1.18
2002–2007 74,225 69,716 (0.87) 94,640 (1.18) 81,539 320,1200.86 to 0.88 1.17 to 1.20
1Relative risk and confidence interval (CI; given below number and RR) for seasons with the highest and lowest number of deaths compared with the average of deaths of all seasons combined. In all cases reported, RR was significant at P < 0.001.
The mechanisms underlying the higher number of deaths during summer have not been studied in depth. However, data on heat stress and results of our THI–mortality relationships study indicate high ambient temperature, especially when combined with high rela-tive humidity, as the key factor. Even if relative humid-ity alone was not indicated as a climatic factor affecting mortality, its role under conditions of high temperatures becomes important for reducing the efficiency of body temperature regulation by reducing evaporative cool-ing (respiratory and surface evaporation; Silanikove, 2000). Silanikove (2000) reported that most mammals die when deep body temperature reaches 42 to 45°C, which exceeds normal body temperature by 3 to 6°C.
If this happens, the animal enters into an acute phase of heat stress, which likely leads to heat stroke and death. The central role of temperature would be sup-ported by results of our seasonal pattern study, which showed that the largest difference between the seasons with the highest and lowest number of deaths (summer and spring, respectively) was recorded in the year 2003. Several studies in humans reported an excess of deaths in European countries during the summer of the same year, which was related to the extremely high tempera-tures recorded (Díaz Jiménez et al., 2005; Michelozzi et al., 2005; Robine et al., 2008). In addition, increased mortality during the summer of 2003 was reported in different European countries for a variety of farm animal
3787SeaSON-ReLateD MORtaLItY IN DaIRY COWS
Journal of Dairy Science Vol. 92 No. 8, 2009
Figure 3. Adjusted number of deaths (AND) in relation to maximum (a) and minimum (b) temperature-humidity index (THI). a) A break point was detected at 79.6 THI. Below the break point, the AND was constant across THI values (R2 = 0.0119; P = 0.5), whereas above a THI of 79.6, the AND rose sharply with THI (R2 = 0.8382; P < 0.001). b) A break point was detected at 70.3 THI. Below the break point, the AND was constant across THI values (R2 = 0.0004; P = 0.5), whereas above a THI of 70.3, the AND rose sharply with THI (R2 = 0.6151; P < 0.001).
species (Fink et al., 2004; http://lists.envirolink.org/pipermail/ar-news/Week-of-Mon-20030804/004707.html).
Moreover, under nonintensive husbandry conditions, which may include free-ranging animals on pasture-based systems, seasonal mortality changes may depend on the direct effects of other meteorological factors (i.e., solar radiation, precipitation), or on the effects that weather may exert on pasture and water availability in terms of quantity and quality, or on survival and growth of infectious agents (Silanikove, 2000; Kadzere et al., 2002).
THI–Mortality Relationships Study
The 2-phase regression analysis indicated that THI of 79.6 and 70.3 represented the break points where a significant change in the slopes describing the relation-ship between maximum or minimum THI, respectively, and the number of deaths in dairy cows occurs. Studies aimed at assessing the threshold of maximum THI above which the risk of death increases have not been carried out before in intensively managed dairy cows. Con-versely, studies have established threshold of maximum THI for other productive or physiological functions in
Journal of Dairy Science Vol. 92 No. 8, 2009
VItaLI et aL.3788
Figure 4. Least squares means (±SE) of the adjusted number of deaths by categories grouping values of maximum (a) and minimum (b) temperature-humidity index (THI). Data refer to the entire period of the study (2002 to 2007). a–dDifferent letters indicate significant differences between categories (P < 0.05).

dairy cows (i.e., milk yield and reproduction) that may be adversely affected from heat stress (Kadzere et al., 2002; West, 2003). However, Nienaber and Hahn (2007) indicated 79 as the threshold THI above which cows enter a danger state with respect to respiration rate. Furthermore, Silanikove (2000) indicated that a THI near 80 implied that most domestic ruminants would be in a noxious stage, and that at a THI >80 they enter into a stage defined as extreme. Our results support a THI of 80 as the critical value of maximum THI above which the degree of heat stress may become dangerous and may compromise survival.
Still less information is available on the upper critical values of minimum THI. Our data indicated that the lower THI values (9 to 35) were not associated with sig-nificant changes of the death rates. Our result supported the documented cold tolerance of cows (Johnson, 1987). Second, results of the 2-phase regression analysis repre-sent a contribution that pointed out the importance of the minimum THI during hot periods, and showed that it was an essential element for survival and not only for maintenance of milk yield and reproductive efficiency when severe heat challenges occurred (Hahn and Mad-er, 1997; West, 2003; Nienaber and Hahn, 2007). Our results indicated the existence of a minimum safe THI during a 24-h period, and that when the minimum THI was above the threshold the risk of death for dairy cows increased significantly. When minimum daily THI was >70, an increase of deaths occurred regardless of the maximum THI. On the other hand, the positive cor-relation between minimum and maximum THI would support the hypothesis that minimum THI above the threshold were likely associated with challenging maxi-mum THI, making the risk of death greatest. Finally, compared with a THI of 64, which was the minimum THI providing a margin of safety reducing the effects of heat stress on milk yield and reproductive efficiency in dairy cows (West et al., 2003), our results indicated that a safe minimum THI to reduce the risk of death would be approximately 6 units higher.
Results of the ANOVA supported those derived from the regression analysis. Such analysis indicated that THI values above the 2 breakpoints may be grouped into further hazard categories. The analysis by maxi-mum THI indicated that the number of deaths started to increase at a THI of 81 and became maximum between 87 and 92. Based on THI categories sug-gested from Nienaber and Hahn (2007) for individually penned feedlot cattle in the absence of wind, a THI of 84 should be considered the upper threshold THI above which animals enter an emergency state. An emergency state was defined as that in which a vicious cycle of rising body temperature starts and in which external aid is needed to save the animal (Silanikove, 2000). Our
results confirm that a THI of 84 placed cows in an emergency state, and indicated a THI category >84 from 84 to 86 THI, and 87 as the upper critical THI above which the risk of death for intensively managed dairy cows is maximum. Finally, the minimum THI at which the number of deaths started to increase was 71, and continued to a maximum in the range 77 to 79 THI. These results on hazard categories for minimum THI are novel.
These results, in conjunction with warnings of dan-gerous weather conditions, may be of help for dairy cow producers to provide emergency interventions to ensure survival of dairy cows, as well as to adopt miti-gation measures for reducing the adverse consequences of heat stress. In particular, reference values of both maximum and minimum THI were provided that may allow more effective utilization of cooling systems in intensively managed dairy farms. Above all, these find-ings indicated that during hot periods, the THI values recorded during the coolest part of the day may be critical for survival, and when the minimum THI is above a threshold the application of cooling measures may be totally justified.
CONCLUSIONS
Summer was the season with the highest risk of death for dairy cows, and THI of 80 and 70 were the values of maximum and minimum THI, respectively, above which the number of deaths starts to increase significantly. Furthermore, THI of 87 and 77 should be considered the upper maximum and minimum critical THI values, respectively, above which the risk of death for dairy cows under intensive management conditions becomes maximum. These findings may have a strategic value to dairy farm managers in deciding the applica-tion of mitigation measures, which may ensure survival of dairy cows and reduce replacement costs associated with heat stress-related mortality.
ACKNOWLEDGMENTS
This study was financially co-supported by MIPAF (CLIMANIMAL Project), EU (CIRCE Integrated Project # 036961), and Università degli Studi della Tuscia. The authors gratefully acknowledge Giuseppe Ru at the Reference Centre for Animal Encephalopa-thies (Turin, Italy) and Mariagrazia Guerini at Istituto Zooprofilattico Sperimentale Lombardia and Emilia Romagna (Brescia, Italy) for provision of the mortality data; Lombardia and Emilia Romagna Environmental Protection Agency and the Research Unit for Agricul-tural Climatology and Meteorology (CRA-CMA) for providing temperature and relative humidity data; and
3789SeaSON-ReLateD MORtaLItY IN DaIRY COWS
Journal of Dairy Science Vol. 92 No. 8, 2009

the Italian Animal Breeders Association for providing data of cow numbers.
REFERENCES
Bouraoui, R., M. Lahmar, A. Majdoub, M. Djemali, and R. Belyea. 2002. The relationship of temperature-humidity index with milk production of dairy cows in a Mediterranean climate. Anim. Res. 51:479–491.
Dechow, C. D., and R. C. Goodling. 2008. Mortality, culling by sixty days in milk, and production profiles in high- and low-survival Pennsylvania herds. J. Dairy Sci. 91:4630–4639.
Díaz Jiménez, J., C. Linares Gil, and R. García Herrera. 2005. Impact of extreme temperatures on public health. Rev. Esp. Salud Publica 79:145–157.
Faye, B., and L. Pérochon. 1995. Mortality of dairy cows in an ecopathologic survey in Brittany. Vet. Res. 26:124–131.
Fink, A. H., T. Brücher, A. Krüger, G. C. Leckebusch, J. G. Pinto, and U. Ulbrich. 2004. The 2003 European summer heatwaves and drought—Synoptic diagnosis and impacts. Weather 59:209–216.
García-Ispierto, I., F. López-Gatius, G. Bech-Sabat, P. Santolaria, J. L. Yániz, C. Nogareda, F. De Rensis, and M. López-Béjar. 2007. Climate factors affecting conception rate of high producing dairy cows in northeastern Spain. Theriogenology 67:1379–1385.
Hahn, G. L., and T. L. Mader. 1997. Heat waves in relation to thermoregulation, feeding behavior and mortality of feedlot cattle. Pages 563–571 in Proc. 5th International Symp. ASAE, St Joseph, MI.
Hahn, G. L., T. L. Mader, J. A. Harrington, J. A. Nienaber, and K. L. Frank. 2002. Living with climatic variability and potential global change: Climatological analyses of impacts on livestock performance. Pages 45–49 in Proc. 16th Intl. Congr. Biometeorol., Kansas City, MO. American Meteorological Society, Boston, MA.
Johnson, H. D. 1987. Bioclimate effects on growth, reproduction and milk production. Pages 35–57 in Bioclimatology and Adaptation of Livestock. H. D. Johnson, ed. Elsevier Science Publisher, Amsterdam, the Netherlands.
Kadzere, C. T., M. R. Murphy, N. Silanikove, and E. Maltz. 2002. Heat stress in lactating dairy cows: A review. Livest. Prod. Sci. 77:59–91.
Kelly, C. F., and T. E. Bond. 1971. Bioclimatic factors and their measurements. Page 7 in A Guide to Environmental Research in Animals. Natl. Acad. Sci., Washington, DC.
Martin, S. W., C. W. Schwabe, and C. E. Franti. 1975. Dairy calf mortality rate: The association of daily meteorological factors and calf mortality. Can. J. Comp. Med. 39:377–388.
Michelozzi, P., F. de Donato, L. Bisanti, A. Russo, E. Cadum, M. DeMaria, M. D’Ovidio, G. Costa, and C. A. Perucci. 2005. The impact of the summer 2003 heat waves on mortality in four Italian cities. Euro Surveill. 10:161–165.
Nickerson, D. M., D. E. Facey, and G. D. Grossman. 1989. Estimating physiological thresholds with continuous two-phase regression. Physiol. Zool. 62:866–877.
Nienaber, J. A., and G. L. Hahn. 2007. Livestock production system management responses to thermal challenges. Int. J. Biometeorol. 52:149–157.
NOAA. 1976. Livestock hot weather stress. US Department of Commerce, National Oceanic and Atmospheric Administration, National Weather Service Central Region. Regional Operations Manual Letter C-31–76.
Purusothaman, M. R., A. K. Thiruvenkadan, and K. Karunanithi. 2008. Seasonal variation in body weight and mortality rate in Mecheri adult sheep. Livest. Res. Rural Develop. 20, Issue 9, Article # 150. http://www.lrrd.org/lrrd20/9/thir20150.htm
Robine, J. M., S. L. Cheung, S. Le Roy, H. Van Oyen, C. Griffiths, J. P. Michel, and F. R. Herrmann. 2008. Death toll exceeded 70,000 in Europe during the summer of 2003. C. R. Biol. 331:171–178.
Sheth, T., C. Nair, J. Muller, and S. Yusuf. 1999. Increased winter mortality from acute myocardial infarction and stroke: The effect of age. J. Am. Coll. Cardiol. 33:1916–1919.
Silanikove, N. 2000. Effects of heat stress on the welfare of extensively managed domestic ruminants. Livest. Prod. Sci. 67:1–18.
Stull, C. L., L. L. McV. Messam, C. A. Collar, N. G. Peterson, A. R. Castillo, B. A. Reed, K. L. Andersen, and W. R. VerBoort. 2008. Precipitation and temperature effects on mortality and lactation parameters of dairy cattle in California. J. Dairy Sci. 91:4579–4591.
West, J. W. 2003. Effects of heat-stress on production in dairy cattle. J. Dairy Sci. 86:2131–2144.
West, J. W., B. G. Mullinix, and J. K. Bernard. 2003. Effects of hot, humid weather on milk temperature, dry matter intake, and milk yield of lactating dairy cows. J. Dairy Sci. 86:232–242.
Xin, H., and M. C. Puma. 2001. Cooling caged laying hens in high-rise house by fogging inlet air. Pages 244–249 in Proc. 6th Int. Symp. Am. Soc. Agric. Eng., St Joseph, MI. ASAE, St. Joseph, MI.
Journal of Dairy Science Vol. 92 No. 8, 2009
VItaLI et aL.3790
Copyright © 2022 FDOKUMEN