Reproductive biology of the planktonic copepod Temora stylifera
Upload
independentCategory
view
1download
0
Earth and Planetary Science Letters, 64 (1983) 33-43 33 Elsevier Science Publishers B.V., Amsterdam - Printed in The Netherlands
[6]
Seasonal changes in the isotopic composition of planktonic foraminifera collected in Panama Basin sediment traps
W.B. Curry l, R.C. Thunell 2 and S. Honjo 1 I Department of Geology and Geophysics, Woods Hole Oceanographic Institution, Woods Hole, MA 02543 (U.S.A.)
2 Department of Geology, University of South Carolina, Columbia, SC 29208 (U.S.A.)
Received September 1, 1982 Revised version received March 21, 1983
Isotopic analyses have been made on five species of planktonic foraminifera collected in two deployments of PARFLUX Mark II time-series sediment traps in the Panama Basin. The automated sampling system on the traps provided 4 one-month samples from 29 July to 16 November 1979 and 6 two-month samples from December 1979 to November 1980.
The 8180 values of Globigerinoides ruber and Globigerinoides sacculifer in this region are primarily affected by a low-salinity surface layer that forms during the early winter. These species each show a 1%0 total range in 8180. The 8 t80 values of the colder-water species Globorotalia menardii, Neogloboquadrina dutertrei, and Globorotalia theyeri show smaller seasonal changes in 8~80. The 813C values of G. ruber and G. sacculifer exhibit small seasonal changes (0.35 and 0.4%0 respectively) despite large seasonal changes in surface water productivity. The colder-water species exhibit only slightly larger changes in 6t3C (up to 0.55%0) throughout the year. All colder-water species exhibit min imum or near minimum 613C values during February and March, which is the period of maximum upwelling and primary productivity. Seasonal variations in the flux of foraminifera in the water column at this location will have only a small effect on the isotopic composition of the sediment assemblage; extreme values of 6180 and 613C do not occur during the periods which are associated with the high flux of foraminiferal tests.
1. Introduction
Isotopic analyses of planktonic foraminifera have become an increasingly important tool in paleoclimatologic studies of Late Pleistocene deep- sea cores ([1-5] among others). This microfossil group has proven most useful for paleoclimatie studies because it occurs over wide geographic regions and is preserved in sediments over large depth ranges. Although many spinose species are thought to precipitate their test out of isotopic equilibrium [6-11], the differences from equi- librium are usually small (-0.5%o) [10] and the gradients of change in 8180 parallel the equi- librium gradients [8]. Thus their utility for paleo- oceanographic investigations is well-documented.
Among the many factors that affect the isotopic
0021-821X/83/$03.00 © 1983 Elsevier Science Publishers B.V.
composition of planktonic foraminifera in sedi- ment samples is seasonal change in rate of produc- tion of the various species. B6 [12] first observed that a seasonal succession occurred in the planktonic foraminifera near Bermuda. Since then, Williams et al. [9] compared the changes in 8180 of planktonic foraminifera near Bermuda sampled biweekly in surface (0-10 m) plankton tows. Their investigation covered the succession of various species over an 18-month period and discovered that the 8~O values of the species closely followed variations in sea surface temperature, with the total range of temperature ( - 8°C) causing a total range of 8180 of greater than 1.5%o. By modeling the seasonal changes in 8180 from the changes in standing stock of the species, Williams et al. [9] were able to predict the isotopic composition of
34
the resultant sediment assemblage. These authors were the first to document that seasonal change in species abundance affects 81SO in the fossil record. Their model is potentially limited by lack of infor- mation 'regarding changes in flux of species to the deep ocean. Although the standing stock of the foraminiferal population must be related to the flux of empty tests to the seafloor, it is not clear that the ratio of standing stock versus flux is equal for all species; different growth rates and turnover times of various species of foraminifera will result in different fluxes to the deep ocean. Furthermore, seasonal changes in growth rate and turnover time of individual species will change their ratio of standing stock versus flux and affect the isotopic record in the sediment. Thus the prediction of sediment 8ISO from changes in standing stock alone may not be accurate.
One approach to understand the effects of sea- sonal changes in flux of planktonic foraminifera on sediment 61SO is to sample the foraminifera falling through the water column with sediment traps. 'Two attempts at this have been successful. Erez and Honjo [13] presented comparisons of 61sO values for plankton tow samples, sediment trap samples and box core samples from the Sargasso Sea. These authors observed changes in planktonic foraminiferal isotopic composition as the assemblage passes from living stages to the empty tests falling through the water column to the sediment assemblage. However, because they analyzed only a single trap deployment, it was not possible to determine the effects of seasonality on the foraminiferal samples. Deuser et al. [14] analyzed a series of six trap samples from the Sargasso Sea representing approximately 14 months of planktonic foraminiferal succession. In their data set, changes in relative abundance, flux and isotopic composition of planktonic for- aminiferal species respond to changes in near- surface hydrographic conditions. Their results sug- gest that seasonal changes in flux significantly alter fossil foraminiferal 8180 and 813C.
The purpose of this report is to identify sea- sonal changes in both 81sC and 8180 in planktonic foraminifera collected by sediment traps placed in the Panama Basin and relate the observed changes to physical and chemical changes in the upper
water column. By combining both changes in flux and changes in isotopic composition, it will be possible to determine the effects of seasonal pro- duction on the isotopic composition of the sedi- ment assemblage.
2. Methods
As part of the Particulate Flux Experiment (PARFLUX), time-series sediment traps (PARF- LUX MK II [15,16]) were deployed in the Panama Basin ( - 5 ° N , 82°W; see Table 1). The first de- ployment (PBI) began 29 July 1979 and sampled the flux of material at 2265 m water depth until 16 November 1979 [17,18]. This trap contained an automatic rotating cup sampling assembly which successfully collected 4 consecutive one-month in- terval samples. The second deployment (PB2) in- cluded PARFLUX MK II traps places at three depths in the water column (890, 2590, and 3560 m), each equipped to collect 6 two-month interval samples of the material flux. This sediment trap array was deployed 3 December 1979, the last sample was collected 2 December 1980 and the array was recovered March 1981 [16]. This investi- gation reports data from the PB 1 deployment, which collected samples from 2265 m, and the 890- and 2590-m samples of PB 2 deployment. (Comparison of foraminiferal data collected in sediment traps located at different depths in the water column is justified because of rapid trans- port of the particles to the deep ocean.)
Quantitative splits of the trap material were made using an Erez-Honjo sample splitter [19]. Each split was washed in 30% H202 solution buffered to pH 7.8 with NaOH. Quantitative as- sessment of flux of individual species in the size fractions 125-250 #m, 250-500/~m, and 500 /~m to 1 mm is presented in Thunell et al. [20]. Isotopic analyses were performed on specimens picked from the 250-500 /~m fraction. Analytical procedures followed those reported in Shackleton and Opdyke [2]. Isotopic composition is reported relative to the PDB (Pee Dee Belemnite) standard in 3 notation:
( 18 O J 16
a = . . . . - × 1 0 0 0 O)
(180/1~0)~ef
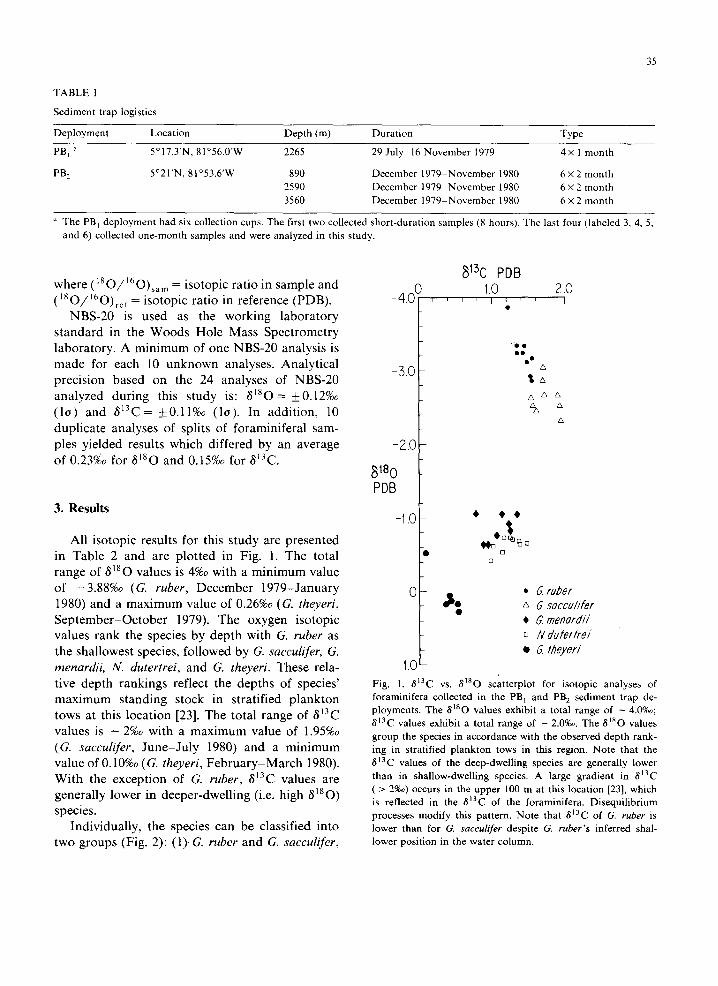
TABLE 1
Sediment trap logistics
35
Deployment Location Depth (m) Duration Type
PB~ a 5°17.3'N, 81°56.0'W 2265 29 July-16 November 1979 4 x 1 month
PB 2 5 ° 21 'N, 81 ° 53.6'W 890 December 1979 - November 1980 6 × 2 month 2590 December 1979-November 1980 6 × 2 month 3560 December 1979 November 1980 6 × 2 month
a The PB I deployment had six collection cups. The first two collected short-duration samples (8 hours). The last four (labeled 3, 4, 5, and 6) collected one-month samples and were analyzed in this study.
where ( ~ s O/16 O ) . . . . = isotopic ratio in sample and (ISO/160)ref = isotopic ratio in reference (PDB).
NBS-20 is used as the working laboratory standard in the Woods Hole Mass Spectrometry laboratory. A minimum of one NBS-20 analysis is made for each 10 unknown analyses. Analytical precision based on the 24 analyses of NBS-20 analyzed during this study is: 8180 -- +0.12%o ( lo) and 813C= +0.11%o (lo). In addition, 10 duplicate analyses of splits of foraminiferal sam- ples yielded results which differed by an average of 0.23%o for 8180 and 0.15%o for 813C.
3. Results
All isotopic results for this study are presented in Table 2 and are plotted in Fig. 1. The total range of 8~80 values is 4%o with a minimum value of -3.88%0 (G. ruber, December 1979-January 1980) and a maximum value of 0.26%o (G. theyeri, September-October 1979). The oxygen isotopic values rank the species by depth with G. ruber as the shallowest species, followed by G. sacculifer, G. menardii, N. dutertrei, and G. theyeri. These rela- tive depth rankings reflect the depths of species' maximum standing stock in stratified plankton tows at this location [23]. The total range of 8~3C values is - 2%0 with a maximum value of 1.95%o (G. sacculifer, June-July 1980) and a minimum value of O. 10%o (G. theyeri, February- March 1980). With the exception of G. ruber, 813C values are generally lower in deeper-dwelling (i.e. high 8180) species.
Individually, the species can be classified into two groups (Fig. 2): (1). G. ruber and G. sacculifer,
~13C PDB _400 . . . . 1.0 2.0
• I ~ T , ' I
-3.0
-2.0
8180 PDB
-1.0
'Q •
&
A A A
A
o Q
G ruber
A G soccuh'fer
G menard// o IIZ du/eHre/ • G theyer/
1.0 Fig. 1. 813C vs. 81So scatterplot for isotopic analyses of foraminifera collected in the PB 1 and PB 2 sediment trap de- ployments. The 8180 values exhibit a total range of - 4.0%0; 8~3C values exhibit a total range of - 2.0%~. The 8180 values group the species in accordance with the observed depth rank- ing in stratified plankton tows in this region. Note that the 813C values of the deep-dwelling species are generally lower than in shallow-dwelling species. A large gradient in 813C ( > 2%0) occurs in the upper 100 m at this location [23], which is reflected in the 813C of the foraminifera• Disequilibrium processes modify this pattern. Note that ~13C of G. tuber is lower than for G. sacculifer despite G. ruber's inferred shal- lower position in the water column.
36
TABLE 2
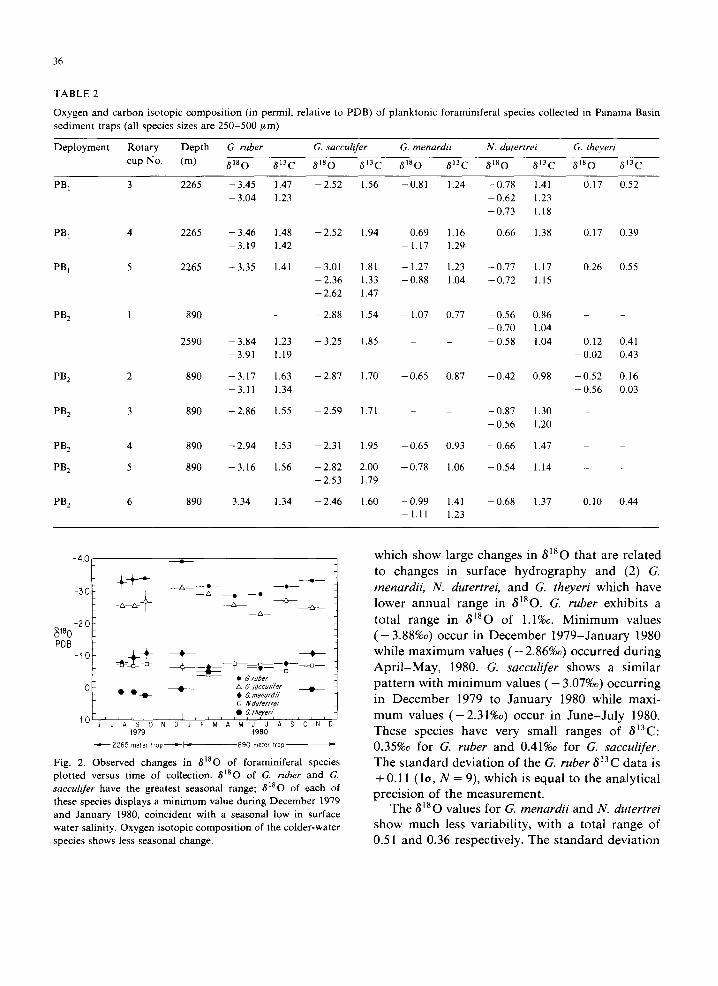
Oxygen and carbon isotopic composition (in permil, relative to PDB) of planktonic foraminiferal species collected in Panama Basin sediment traps (all species sizes are 250-500/~m)
Deployment Rotary Depth G. ruber G. sacculifer G. menardii N. dutertrei G. theyeri cup No. (m) 6180 •13 C 818 0 1~13 C (~lS O 613C (~18 O (~13 C ~18 O ~13 C
PB 1 3 2265 -3.45 1.47 -2.52 1 .56 -0.81 1.24 -0.78 1.41 0.17 0.52 - 3.04 1.23 - 0.62 1.23
-0.73 1.18
PB 1 4 2265 -3.46 1.48 -2.52 1.94 -0.69 1.16 -0.66 1.38 0.17 0.39 -3 .19 1.42 -1.17 1.29
PB t 5 2265 -3.35 1.41 -3.01 1.81 - 1.27 1.23 -0 .77 1.17 0.26 0.55 -2 .36 1.33 -0.88 1 .04 -0 .72 1.15 - 2.62 1.47
PB 2 1 890 - - -2 .88 1.54 - 1.07 0.77 -0 .56 0.86 - 0.70 1.04
2590 - 3.84 1.23 - 3.25 1.85 - - 0.58 1.04 -3.91 1.19
PB 2 2 890 -3.17 1.63 -2.87 1 .70 -0.65 0.87 -0 .42 0.98 -3.11 1.34
PB 2 3 890 -2 .86 1.55 -2.59 1.71 - -0 .87 1.30 - 0.56 1.20
PB 2 4 890 -2 .94 1.53 -2.31 1.95 -0.65 0.93 -0 .66 1.47
PB z 5 890 -3.16 1.56 -2 .82 2.00 -0.78 1.06 -0 .54 1.14 -2.53 1.79
PB 2 6 890 3.34 1.34 - 2.46 1.60 - 0.99 1.41 - 0.68 1.37 -1.11 1.23
0.12 0.41 - 0.02 0.43
-0 .52 0.16 -0.56 0.03
O.lO 0.44
-40 •
-30
~t80 -20
PDB -tO
- - o - - +4-+ _ _ ~ _ _ ~ - . -
_~_~_~- __i__-'--4-__~__
'
-4-~_~__--*---~=- ~'--~- • G tuber
H _ t ~ • ~ G saccul/)ter + G menard/7
[] Nd#ler/fe/
J ~ I l b ~ • G theyefl l i i i l L
~ I 0 I d I A l S~ 0 N D d F M A M J J A S 0 N D t979 t980
-" 'e~ 2265 meier trap---m'-I '~ 890 meter t r o p - -
Fig. 2. Observed changes in 8]80 of foraminiferal species plotted versus time of collection. 8180 of G. ruber and G. sacculifer have the greatest seasonal range; 8180 of each of these species displays a minimum value during December 1979 and January 1980, coincident with a seasonal low in surface water salinity. Oxygen isotopic composition of the colder-water species shows less seasonal change.
w h i c h s h o w l a rge c h a n g e s in 8180 t h a t a re r e l a t e d
to c h a n g e s in s u r f a c e h y d r o g r a p h y a n d (2) G.
menardii, N. dutertrei, a n d G. theyeri w h i c h h a v e
l o w e r a n n u a l r a n g e in 6~80. G. ruber e x h i b i t s a
t o t a l r a n g e in ~180 o f 1.1%o. M i n i m u m v a l u e s
( - 3.88%o) o c c u r in D e c e m b e r 1 9 7 9 - J a n u a r y 1980
w h i l e m a x i m u m v a l u e s ( - 2.86%o) o c c u r r e d d u r i n g
A p r i l - M a y , 1980. G. sacculifer s h o w s a s i m i l a r
p a t t e r n w i t h m i n i m u m v a l u e s ( - 3.07%0) o c c u r r i n g
in D e c e m b e r 1979 to J a n u a r y 1980 whi l e m a x i -
m u m v a l u e s ( - 2 . 3 1 % o ) o c c u r in J u n e - J u l y 1980.
T h e s e s p e c i e s h a v e v e r y s m a l l r a n g e s o f 6~3C:
0.35%o for G. tuber a n d 0.41%o for G. sacculifer. T h e s t a n d a r d d e v i a t i o n o f t he G. tuber 8~3C d a t a is
+ 0.11 (1o, N = 9), w h i c h is e q u a l to t he a n a l y t i c a l
p r e c i s i o n o f t he m e a s u r e m e n t .
T h e 8~80 v a l u e s fo r G. menardii a n d N. dutertrei s h o w m u c h less va r i ab i l i t y , w i t h a to t a l r a n g e o f
0.51 a n d 0.36 r e spec t ive ly . T h e s t a n d a r d d e v i a t i o n
37
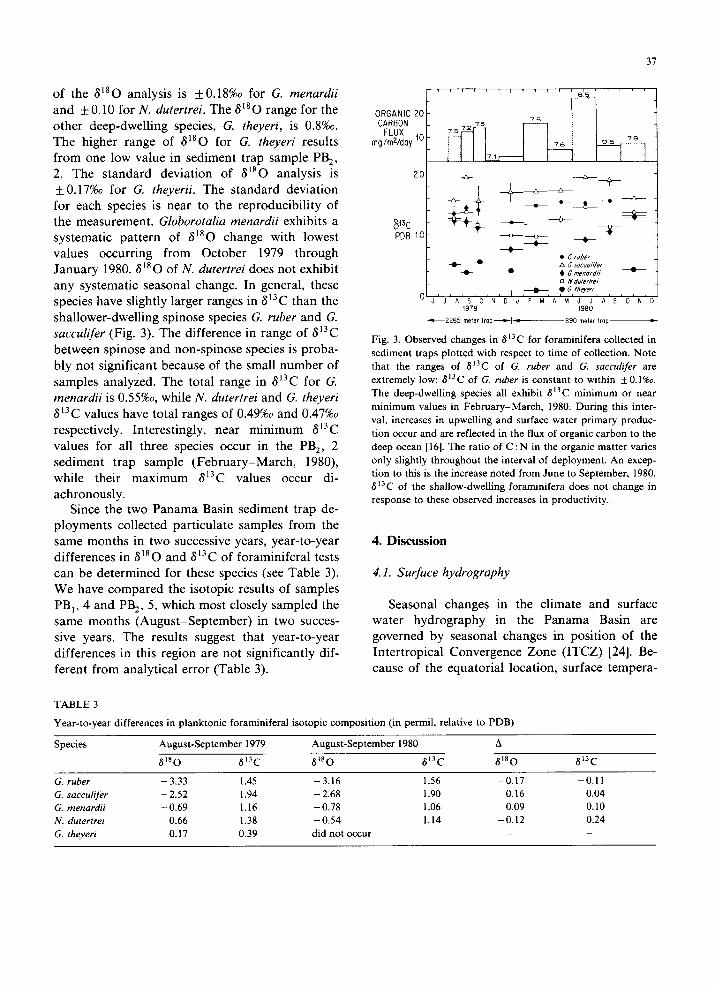
of the 8180 analysis is +0.18%o for G. menardii and +0.10 for N. dutertrei. The 8180 range for the other deep-dwelling species, G. theyeri, is 0.8%o. The higher range of 8180 for G. theyeri results from one low value in sediment trap sample PB 2, 2. The standard deviation of 8~80 analysis is + 0.17%o for G. theyerii. The standard deviation for each species is near to the reproducibility of the measurement. Globorotalia menardii exhibits a systematic pattern of 8180 change with lowest values occurring from October 1979 through January 1980. 8180 of N. dutertrei does not exhibit any systematic seasonal change. In general, these species have slightly larger ranges in 813C than the shallower-dwelling spinose species G. ruber and G. sacculifer (Fig. 3). The difference in range of 813C between spinose and non-spinose species is proba- bly not significant because of the small number of samples analyzed. The total range in 813C for G. menardii is 0.55%o, while N. dutertrei and G. theyeri 813C values have total ranges of 0.49%o and 0.47%o respectively. Interestingly, near minimum 813C values for all three species occur in the PB 2, 2 sediment trap sample (February-March, 1980), while their maximum 813C values occur di- achronously.
Since the two Panama Basin sediment trap de- ployments collected particulate samples from the same months in two successive years, year-to-year differences in 8180 and 813C of foraminiferal tests can be determined for these species (see Table 3). We have compared the isotopic results of samples PB l, 4 and PB 2, 5, which most closely sampled the same months (August-September) in two succes- sive years. The results suggest that year-to-year differences in this region are not significantly dif- ferent from analytical error (Table 3).
ORGANIC 20 CARBON
FLUX mg/mZ~oy 10
I 8.5
7572 75
76 , 95 78 ,
-- i
2.0 ~_ ~ _ @ _
PDB 1.0 o - - t 0
0 ~ f ~ e f
~ /k G S~CC(I///ef -e~ ~ • G menordl?' ~ - -
o li~ du/eftre/
, , ~ ~ ~ l , ~ ~ • 6/heyen J J A S 0 N D J F M A ' M ' J ' J t A ' S ~ O ' N '
1979 1980
-"¢--~2265 meier trop-~,'--I - [ 890 meter trop
Fig. 3. Observed changes in 813C for foraminifera collected in sediment traps plotted with respect to time of collection. Note that the ranges of 813C of G. ruber and G. sacculifer are extremely low; 813C of G. tuber is constant to within +0.1%o. The deep-dwelling species all exhibit 8J3C minimum or near minimum values in February-March, 1980. During this inter- val, increases in upwelling and surface water primary produc- tion occur and are reflected in the flux of organic carbon to the deep ocean [16]. The ratio of C : N in the organic matter varies only slightly throughout the interval of deployment. An excep- tion to this is the increase noted from June to September, 1980. 813C of the shallow-dwelling foraminifera does not change in response to these observed increases in productivity.
4. Discussion
4.1. Surface hydrography
Seasonal changes in the climate and surface water hydrography in the Panama Basin are governed by seasonal changes in position of the Intertropical Convergence Zone (ITCZ) [24]. Be- cause of the equatorial location, surface tempera-
TABLE 3
Year-to-year differences in planktonic foraminiferal isotopic composition (in permil, relative to PDB)
Species August-September 1 9 7 9 August-September 1980 A
8180 813C 8t80 813C 8 1 8 0 813C
G. ruber -3.33 1.45 -3.16 1.56 -0 .17 -0.11 G. sacculifer - 2.52 1.94 - 2.68 1.90 0.16 0.04 G. menardii - 0.69 1.16 - 0.78 1.06 0.09 0.10 N. dutertrei - 0.66 1.38 - 0.54 1.14 - 0.12 0.24 G. theyeri 0.17 0.39 did not occur - -
38
tures are high (> 26°C) and have a very low seasonal range. Seasonal changes in precipitation are quite high, and are directly related to the position of the ITCZ. Seasonal changes in precipi- tation (both at the trap location and in the Pan- ama Bight drainage basin) result in large seasonal changes in surface water salinity (> 3%~) [24]. The same processes of evaporation and precipitation will result in parallel changes in surface water 8180.
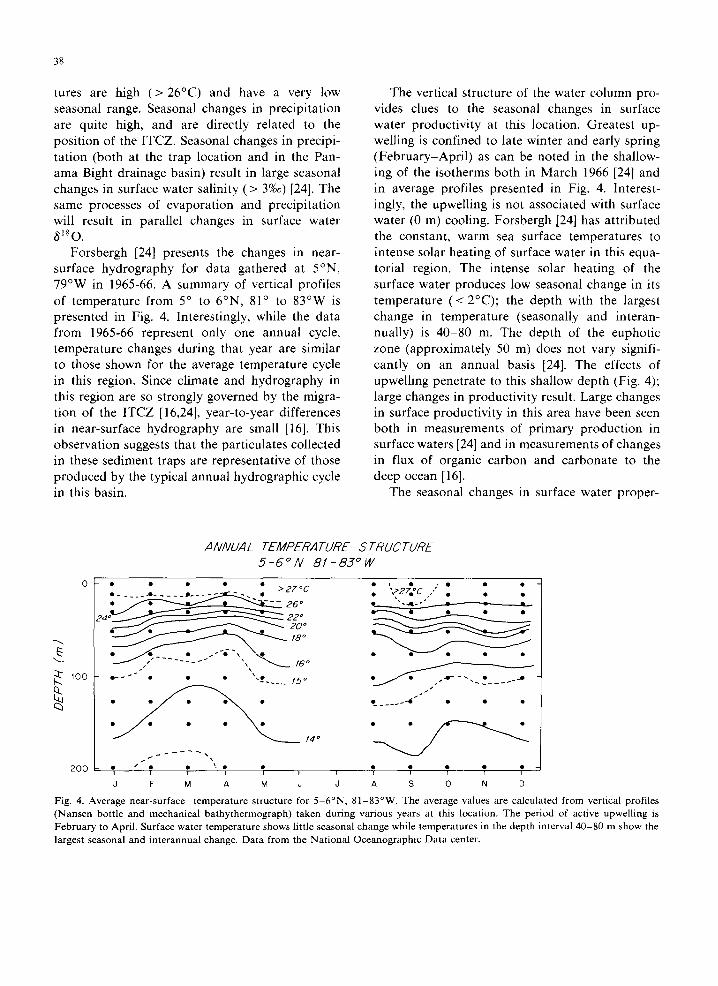
Forsbergh [24] presents the changes in near- surface hydrography for data gathered at 5°N, 79°W in 1965-66. A summary of vertical profiles of temperature from 5 ° to 6°N, 81 ° to 83°W is presented in Fig. 4. Interestingly, while the data from 1965-66 represent only one annual cycle, temperature changes during that year are similar to those shown for the average temperature cycle in this region. Since climate and hydrography in this region are so strongly governed by the migra- tion of the ITCZ [16,24], year-to-year differences in near-surface hydrography are small [16]. This observation suggests that the particulates collected in these sediment traps are representative of those produced by the typical annual hydrographic cycle in this basin.
The vertical structure of the water column pro- vides clues to the seasonal changes in surface water productivity at this location. Greatest up- welling is confined to late winter and early spring (February-April) as can be noted in the shallow- ing of the isotherms both in March 1966 [24] and in average profiles presented in Fig. 4. Interest- ingly, the upwelling is not associated with surface water (0 m) cooling. Forsbergh [24] has attributed the constant, warm sea surface temperatures to intense solar heating of surface water in this equa- torial region. The intense solar heating of the surface water produces low seasonal change in its temperature (< 2°C); the depth with the largest change in temperature (seasonally and interan- nually) is 40-80 m. The depth of the euphotic zone (approximately 50 m) does not vary signifi- cantly on an annual basis [24]. The effects of upwelling penetrate to this shallow depth (Fig. 4); large changes in productivity result. Large changes in surface productivity in this area have been seen both in measurements of primary production in surface waters [24] and in measurements of changes in flux of organic carbon and carbonate to the deep ocean [16].
The seasonal changes in surface water proper-
tO0
200
ANNUAL TEMPERATURE STRUCTURE 5 - 6 °N 8 1 - 8 3 °W
>27°C
. . . . . f 5 °
/ 4 °
• / ~ o , , ; ; ; ,
d F M A M J
I
. o , • ,
A S 0 N D
Fig. 4. Average near-surface temperature structure for 5 -6°N, 81-83°W. The average values are calculated from vertical profiles (Nansen bottle and mechanical bathythermograph) taken during various years at this location. The period of active upwelling is February to April. Surface water temperature shows little seasonal change while temperatures in the depth interval 40-80 m show the largest seasonal and interannual change. Data from the National Oceanographic Data center.
ties that will most affect isotopic composition of planktonic foraminiferal tests are:
(1) Small changes in sea surface temperature because the heating of tropical surface water by the sun tends to overcome the cooling from up- welling.
(2) Large changes in surface water salinity (and 81s0 water) that result from large seasonal changes in precipitation. Surface water salinity changes approximately 3%0 [24] which is equivalent to a change in 6180 water of -0.8%0 in this region [23]. Lowest surface water salinity occurs in the winter (November/December), with the low-salin- ity surface layer mixed down to - 30 m [24].
(3) Seasonal changes in advection of nutrient- rich deeper waters to the euphotic zone causing large changes in primary production which may affect planktonic foraminiferal 813C. Highest primary production occurs in February and March [24].
(4) The depth interval 40-80 m has the largest seasonal changes in temperature.
4.2. Relationship of planktonic foraminiferal iso- topic composition to near-surface hydrography
The oxygen isotopic compositions of the two- shallow-dwelling species appear to be most di- rectly affected by changing near-surface hydrogra- phy. Lowest 3180 values occur in samples col- lected during December 1979 and January 1980 for both G. ruber and G. sacculifer. The seasonal ranges of 8180 for these species are 1.1%o and 0.9%o respectively, similar in magnitude to the calculated seasonal range of 8180 of surface water, which would equal -0.8%o for a 3%o salinity change. In addition, temperature in the upper 20 m exhibits little seasonal range (Fig. 4). The coin- cidence of lowest 8180 in the planktonic for- aminifera with lowest surface salinity suggests that the 6180 of these species are dominantly affected by changes in surface water 8180.
G. menardii and N. dutertrei (and possibly G. theyeri) exhibit almost no seasonal change in 8180 and their 8~80 values for December 1979 to January 1980 do not show any large effects of the low-salinity (low 8180) surface layer. The 6180 changes in G. menardii may be an exception to this
39
observation. Lowest 6180 values of this species occur during the interval of low surface salinity, but the effect appears to be less in magnitude. In contrast to G. ruber and G. sacculifer, which ap- pear to live and secrete their tests above the ther- mocline within the mixed layer, these species tend to live either on the thermocline (G. menardii, N. dutertrei) or at the base of the thermocline (G. theyeri) in the Panama Basin [23]. Low seasonal change in 61So of the deep-dwelling species must be the result of each species calcifying within a narrow temperature range, possibly adjusting their depth habitat to accommodate this preference [10,23]. Other evidence suggests that this hypothe- sis may be correct. In an Indian Ocean core-top study, N. dutertrei was found to have 6180 values which suggested that it secreted its test at a rela- tively constant temperature (approximately 22-23°C) over a wide range of salinity [21]. In this location, N. dutertrei appears to be secreting its test at a lower temperature (approximately 19°C), with only a small amount of seasonal change.
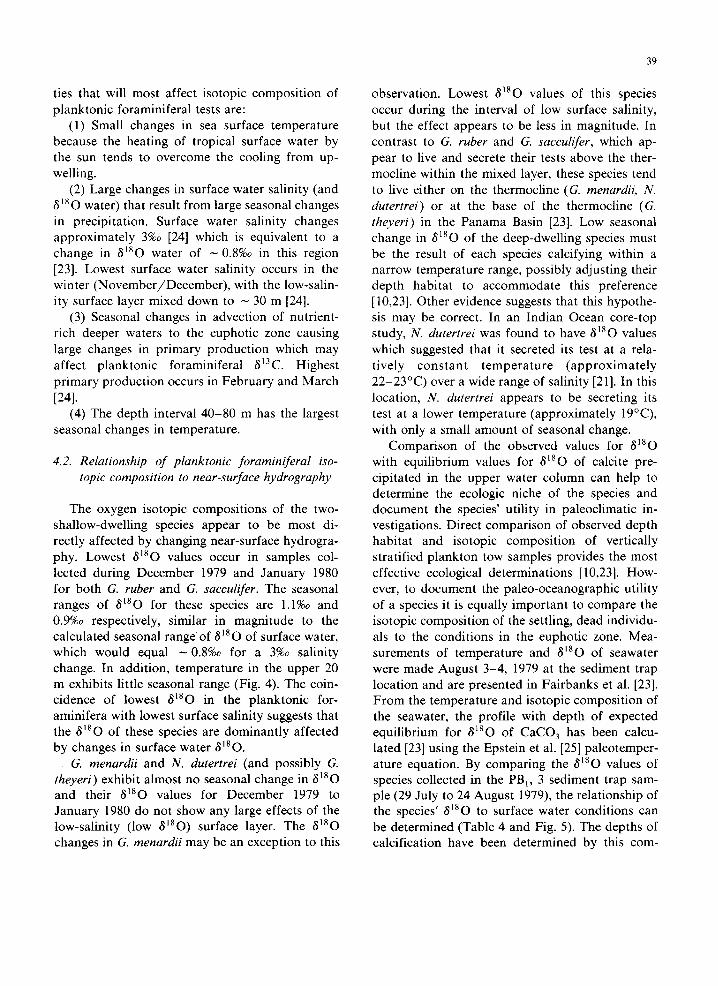
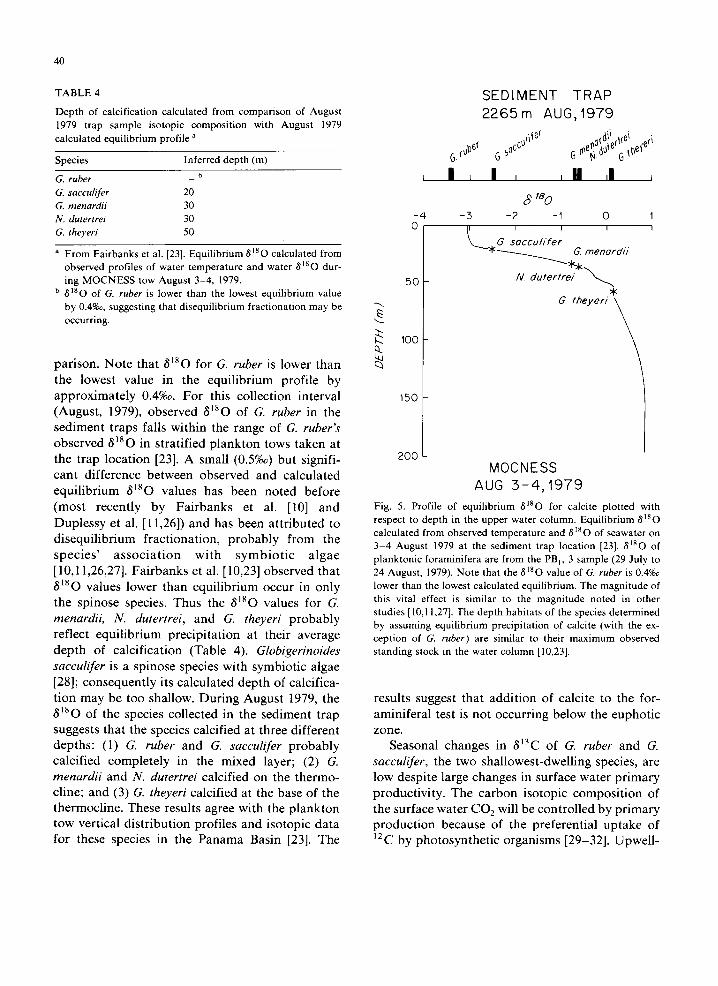
Comparison of the observed values for 6180 with equilibrium values for 81So of calcite pre- cipitated in the upper water column can help to determine the ecologic niche of the species and document the species' utility in paleoclimatic in- vestigations. Direct comparison of observed depth habitat and isotopic composition of vertically stratified plankton tow samples provides the most effective ecological determinations [10,23]. How- ever, to document the paleo-oceanographic utility of a species it is equally important to compare the isotopic composition of the settling, dead individu- als to the conditions in the euphotic zone. Mea- surements of temperature and 8180 of seawater were made August 3-4, 1979 at the sediment trap location and are presented in Fairbanks et al. [23]. From the temperature and isotopic composition of the seawater, the profile with depth of expected equilibrium for 6180 of CaCO 3 has been calcu- lated [23] using the Epstein et al. [25] paleotemper- ature equation. By comparing the 81So values of species collected in the PBI, 3 sediment trap sam- ple (29 July to 24 August 1979), the relationship of the species' 81So to surface water conditions can be determined (Table 4 and Fig. 5). The depths of calcification have been determined by this com-
40
TABLE 4
Depth of calcification calculated from comparison of August 1979 trap sample isotopic composition with August 1979 calculated equilibrium profile a
Species Inferred depth (m) b G. ruber
G. sacculifer 20 G. menardii 30 N. dutertrei 30 G. theyeri 50
a From Fairbanks et al. [23]. Equilibrium 8180 calculated from observed profiles of water temperature and water 8~80 dur- ing MOCNESS tow August 3-4, 1979.
b dis O of G. ruber is lower than the lowest equilibrium value by 0.4%~, suggesting that disequilibrium fractionation may be occurring.
par ison. No te that 6180 for G. ruber is lower than the lowest value in the equi l ibr ium prof i le by a pp r ox ima te ly 0.4%°. F o r this col lect ion interval (August , 1979), observed 6180 of G. ruber in the sed iment t raps falls within the range of G. ruber's observed 6180 in s t ra t i f ied p l ank ton tows taken at the t rap loca t ion [23]. A small (0.5%o) but signifi- cant difference be tween observed and ca lcula ted equi l ib r ium 6180 values has been no ted before (most recent ly by F a i r b a n k s et al. [10] and Duplessy et al. [11,26]) and has been a t t r ibu ted to d i sequ i l ib r ium frac t ionat ion , p r o b a b l y f rom the s p e c i e s ' a s s o c i a t i o n wi th s y m b i o t i c a l g a e [10,11,26,27]. F a i r b a n k s et al. [10,23] observed that 6180 values lower than equi l ibr ium occur in only the spinose species. Thus the 6180 values for G. menardii, N. dutertrei, and G. theyeri p r o b a b l y reflect equi l ib r ium prec ip i ta t ion at their average dep th of calc i f icat ion (Table 4). Globigerinoides sacculifer is a spinose species with symbiot ic algae [28]; consequent ly its ca lcula ted dep th of calcif ica- t ion may be too shallow. Dur ing Augus t 1979, the 6180 of the species col lected in the sediment t rap suggests that the species calcif ied at three di f ferent depths : (1) G. ruber and G. sacculifer p r o b a b l y calcif ied comple te ly in the mixed layer; (2) G. menardii and N. dutertrei calcif ied on the thermo- cline; and (3) G. theyeri calcif ied at the base of the thermocl ine. These results agree with the p l ank ton tow vert ical d i s t r ibu t ion profi les and isotopic da ta for these species in the P a n a m a Basin [23]. The
I
- /
0
50
100
150
200
6.~o bd
! ,
S E D I M E N T T R A P
2 2 6 5 m AUG, 1 9 7 9
c~/i ~d , ,~ ~¢~ " . .
I , , U , I ,
8 ' 8 0 -3 -2 - I 0 1
I [ I I
G soccu//fer ~ ~ ' - ~ ~k rnenar dl)
dutertrei ~ :¢
6. theyeri
M O C N E S S AUG : 5 - 4 , 1 9 7 9
Fig. 5. Profile of equilibrium 8'80 for calcite plotted with respect to depth in the upper water column. Equilibrium 6180 calculated from observed temperature and 6180 of seawater on 3-4 August 1979 at the sediment trap location [23]. 8180 of planktonic foraminifera are from the PB,, 3 sample (29 July to 24 August, 1979). Note that the 8180 value of G. ruber is 0.4%° lower than the lowest calculated equilibrium. The magnitude of this vital effect is similar to the magnitude noted in other studies [10,11,27]. 'The depth habitats of the species determined by assuming equilibrium precipitation of calcite (with the ex- ception of G. ruber) are similar to their maximum observed standing stock in the water column [10,23].
resul ts suggest that add i t i on of calcite to the for- amini fera l test is not occurr ing be low the euphot ic zone.
Seasonal changes in 613C of G. ruber and G. sacculifer, the two shal lowest-dwel l ing species, are low despi te large changes in surface water p r imary product iv i ty . The ca rbon isotopic compos i t ion of the surface water CO 2 will be cont ro l led by p r ima ry p roduc t ion because of the preferent ia l up take of 12C by pho tosyn the t i c organisms [29-32]. Upwel l -
ing of water lower in 8~3C and higher in nutrients presumably will lower surface water 813C and increase productivity until all the limiting nutri- ents are depleted. 813C of the foraminifera has the potential to record upwelling and may provide a tool for reconstructing paleoproductivity.
In this data set, however, the surface dwelling species do not change 813C significantly (Fig. 3) despite large changes in the flux of organic carbon from the surface waters [16]. At least two possible conclusions can be drawn from this observation. First, the surface dwelling species may not be recording the changes in 813C of ECO 2 because of vital effects such as introduction of metabolic CO 2 into test calcite [5]. However, the incorporation of metabolic CO 2 might be expected to introduce noise into this data set. To the contrary, the 8~3C values are very constant throughout the year. Al- ternatively, primary productivity may be rapid enough to maintain a depleted phosphorus con- centration in the warm, surface mixed layer. Input of nutrient-rich, low-813C water into the euphotic zone should be accompanied by a rapid rise in primary production and carbon fixation. This tendency to deplete surface water [P] will keep the 8~3C of ZCO 2 in the warm, surface mixed layer at its fixed, nutrient-depleted value of - 2%o. There- fore, species living within the mixed layer ( G. ruber, G. sacculifer) may not show seasonal changes in 8~3C despite the large changes in surface water production. In contrast, species living below the mixed layer, on the thermocline, are not living in nutrient-depleted water and may be influenced by changes in the relationship between the thermo- cline and the 613C (nutrient) vertical profile. In
41
this regard, it is interesting to note that the lowest observed 813C values for both N. dutertrei and G. theyeri occur in sample PB2, 2 (February-March, 1980), which coincides with the period of active upwelling. The low 813C signal from upwelling of nutrient-rich, ~3C-depleted water may be recorded in the calcite of the primary producers and not be seen in those taxa farther along the food chain. While we suggest that this model may explain the lack of change in 813C of shallow-dwelling species in this data set, we consider the results preliminary and note that this model requires the analysis of both the planktonic foraminiferal and coc- colithophorid 813C before it can be confirmed.
4.3. Effect o f changing f lux on average for- aminiferal composition
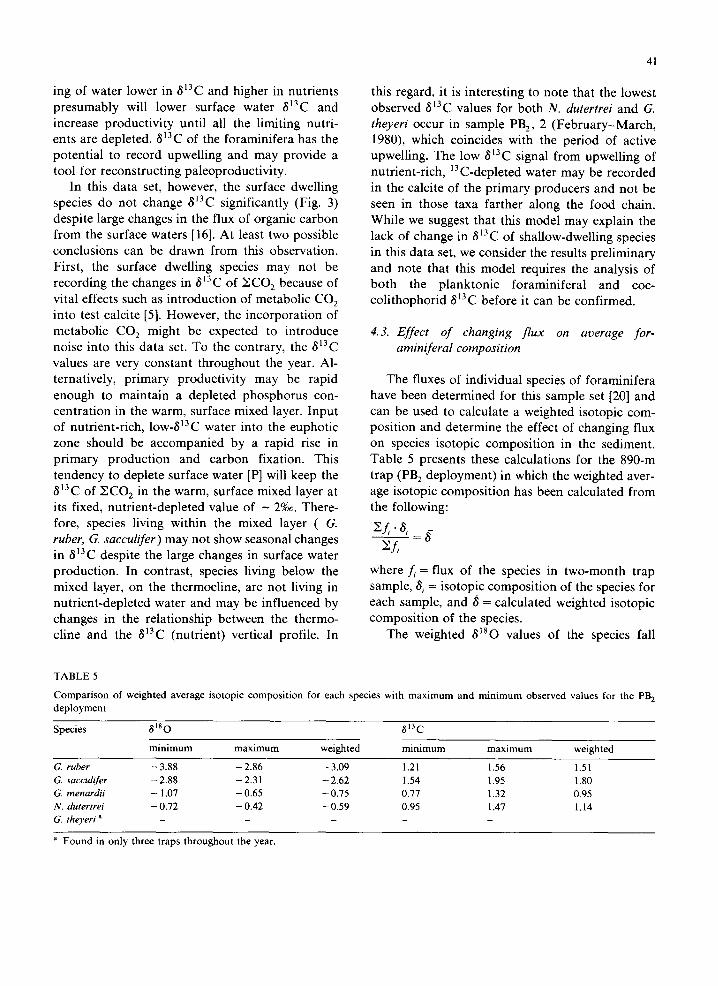
The fluxes of individual species of foraminifera have been determined for this sample set [20] and can be used to calculate a weighted isotopic com- position and determine the effect of changing flux on species isotopic composition in the sediment. Table 5 presents these calculations for the 890-m trap (PB 2 deployment) in which the weighted aver- age isotopic composition has been calculated from the following:
Y4," 8, g
yf, where f, = flux of the species in two-month trap sample, 8 i = isotopic composition of the species for each sample, and g = calculated weighted isotopic composition of the species.
The weighted 8180 values of the species fall
TABLE 5
Comparison of weighted average isotopic composition for each species with maximum and minimum observed values for the PB z deployment
Species 8 is 0 813 C
minimum maximum weighted m i n i m u m maximum weighted
G. ruber - 3.88 - 2.86 - 3.09 1.21 1.56 1.51 G. sacculifer - 2.88 - 2.31 - 2.62 1.54 1.95 1.80 G. menardii - 1.07 - 0.65 - 0.75 0.77 1.32 0.95 N. dutertrei - 0.72 - 0.42 - 0.59 0.95 1.47 1.14 G. theyeri a . . . . .
a Found in only three traps throughout the year.
42
near the middle of their range of 6~SO. Two excep- tions to this observation are : (1) the weighted 6180 of G. ruber is unaffected by the extremely low values during February-March 1980 because its flux during this interval is less than 1% of its yearly flux and (2)G. menardii has a low flux to the deep ocean when its 6180 values are at a minimum. The weighted 613C for G. ruber and G sacculifer cannot be very different from their max- ima and minima because these species show very little change in 6~3C regardless of season or flux. The flux of G. ruber is low during intervals when its 613C is low; hence its weighted average is nearly identical to its maximum observed 813C values. Globorotalia menardii weighted 613C values are biased toward low values because of low fluxes during the interval when its highest 813C occurs (October 1979-January 1980).
5. Conclusions
(1) The oxygen isotopic composition of G. ruber and G. sacculifer appear to be governed by changes in near-surface hydrography. A low-salinity surface layer during winter lowers the 8180 of surface seawater by about 0.8%0 which can be seen in the 6180 of individuals collected at this time. Globoro- talia menardiL N. dutertrei and G. theyeri show lower seasonal changes in 8180 similar to the pattern noted in colder-water species at other loca- tions [14]. The small seasonal change in 8180 of the species supports a hypothesis of temperature dependence regulating their position in the water column [23].
(2) Comparison of observed 6~SO of species collected in the sediment traps during August, 1979 with the equilibrium profile observed for August 1979 shows: (a) that 3180 of G. ruber is 0.4%~ lower than the lowest equilibrium value; (b) that G. menardii and N. dutertrei are calcifying on the thermocline ( - 3 0 m); (c) that G. theyeri is calcifying at the base of the thermocline ( - 50 m); and (d) that G. sacculifer appears to be living within the mixed layer.
(3) The carbon isotopic composition of G. ruber and G. sacculifer show very little seasonal change
despite large changes in upwelling intensity and
factor of two changes in the flux of organic carbon from the surface water. Two reasons for this lack of seasonal change in 813C of near-surface dwell- ing species are possible; (a) vital effects may be masking the 613C signal or (b) photosynthetic organisms fix 12C rapidly enough to deplete the nutrient concentration of the warm, surface mixed layer, and maintain a nearly constant 613C value of - 2%o. Species living on the thermocline exhibit larger changes in 613C and minimum 613C values during the period of greatest upwelling (Febru- ary-March) . None of the species analyzed exhibits large changes in 613C and, because of the small number of observations, the differences in range of 813C between species may not be significant.
Acknowledgements
This manuscript benefited from reviews by L.D. Keigwin, G.P. Lohmann, E.T. Bunce, R.G. Fair- banks, and J.P. Kennett. We thank R.G. Fair- banks for useful discussions and for providing us with a preprint of his study of planktonic for- aminiferal standing stock in the Panama Basin. This study was funded by NSF grants OCE 81- 10161 (to W.B.C. and R.C.T.) and OCE 80-25225 (to S.H.). This is Woods Hole Oceanographic In- stitution Contribution No 5210, and Belle Baruch Institute of Marine Biology and Coastal Research Contribution No. 482.
References
1 C. Emiliani, Paleotemperature analysis of Caribbean cores P6304-8 and P6304-9 and a generalized paleotemperature curve for the past 425,00 years, J. Geol. 74, 109, 1966.
2 N.J. Shackleton and N.D. Opdyke, Oxygen isotope and paleomagnetic stratigraphy of equatorial Pacific core V28- 238: oxygen isotope temperatures and ice volumes on a 105 year and 10 6 year scale, Quaternary Res. 3, 39, 1973,
3 N.J. Shackleton and N.D. Opdyke, Oxygen-isotope and paleomagnetic stratigraphy of Pacific core V28-239; Late Pliocene to Latest Pleistocene, Geol. Soc. Am. Mere. 145, 449, 1976.
4 J.D. Hayes, J. Imbrie and N.D. Shackleton, Variations in the earth's orbit: pacemaker of the ice ages, Science 194, 1121, 1976.
5 W.H. Berger, J.S. Killingley and E. Vincent, Stable isotopes in deep-sea carbonates: box core ERDC-92, west equatorial Pacific, Oceanol. Acta 1,203, 1978.
6 N.J. Shackleton, J.D.H. Wiseman and H.A. Buckley, Non- equilibrium isotopic fractionation between seawater and planktonic foraminifera, Nature 242, 177, 1973.
7 C. Vergnaud Grazzini, Nonequilibrium isotopic composi- tions of shells of planktonic foraminifera in the Mediter- ranean Sea, Palaeogeogr., Palaeoclimatol., Palaeoecol. 20, 263, 1976.
8 D.F. Williams, A.W.H. B+ and R.G. Fairbanks, Seasonal oxygen isotopic variations in living planktonic foraminifera off Bermuda, Science 207, 447, 1979.
9 D.F. Williams, A.W.H. B+ and R.G. Fairbanks, Seasonal stable isotopic variations in living planktonic foraminifera from Bermuda plankton tows, Palaeogeogr., Palaeoclimatol., Palaeoecol. 33, 71, 1981.
10 R.G. Fairbanks, P.H. Wiebe and A.W.H. B& Vertical distri- bution and isotopic composition of living planktonic for- aminifera in the western North Atlantic, Science 207, 61, 1980.
11 J.-C. Duplessy, P.-L. Blanc and A.W.H. B& Oxygen-18 enrichment of planktonic foraminifera due to gametogenic calcification below the euphotic zone, Science 213, 1247, 1981.
12 A.W.H. Br, Ecology of Recent planktonic foraminifera, 2. Bathymetric and seasonal distributions in the Sargasso Sea off Bermuda, Micropaleontology 6 (1960) 373.
13 J. Erez and S. Honjo, Comparison of isotopic composition of planktonic foraminifera in plankton tows, sediment traps, and sediments, Palaeogeogr., Palaeoclimatol., Palaeoecol. 33, 129, 1981.
14 W.G. Deuser, E.H. Ross, C. Hemleben and M. Spindler, Seasonal changes in species composition, numbers, mass, size, and isotopic composition of planktonic foraminifera settling into the deep Sargasso Sea, Palaeogeogr., Palaeo- climatol., Palaeoecol. 33, 103, 1981.
15 S. Honjo, J.F. Connell and P.L. Sachs, Deep-ocean sedi- ment trap: design and function of PAR.FLUX Mark II, Deep-Sea Res. 27, 745, 1980.
16 S. Honjo, Seasonality and interaction of biogenic and litho- genic particulate flux at Panama Basin, Science 218, 883, 1982.
17 S. Honjo, D.W. Spencer and J.W. Farrington, Deep advec- tive transport of lithogenic particles in panama Basin, Sci- ence 216, 516, 1982.
18 S. Honjo, S.J. Manganini and J. Cole, Sedimentation of biogenic matter in the deep ocean, Deep-Sea R.es. 29, 609, 1982.
43
19 S. Honjo, Material fluxes and modes of sedimentation in the mesopelagic and bathypelagic zones, J. Mar. Res. 38, 53, 1980.
20 R.C. Thunell, W.B. Curry and S. Honjo, Seasonal variation in the flux of planktonic foraminifera: time series sediment trap results from the Panama Basin, Earth Planet. Sci. Lett. 64, 44-55, 1983 (this issue).
21 W.B. Curry and R.K. Matthews, Paleo-oceanographic util- ity of oxygen isotopic measurements on planktic for- aminifera: Indian Ocean core-top evidence, Palaeogeogr., Palaeoclimatol., Palaeoecol. 33, 173, 1981.
22 W.B. Curry and R.K. Matthews, Equilibrium ~O fractiona- tion in small size fraction planktic foraminifera: evidence from Recent Indian Ocean sediments, Mar. Micropaleontol. 6, 327, 1981.
23 R,.G. Fairbanks, M. Sverdlove, R. Free, P.H. Wiebe and A.W.H. Br, Vertical distribution and isotopic composition of living planktonic foraminifera from the Panama Basin, Nature 298, 841, 1982.
24 E.D. Forsbergh, On the climatology, oceanography and fisheries of the Panama Bight, Inter-Am. Trop. Tuna Comm., Bull. 14, 49, 1969.
25 S. Epstein, R. Buchsbaum, H. Lowenstam and H.C. Urey, Revised carbonate-water isotopic temperature scale, Geol. Soc. Am. Bull. 64, 1315, 1953.
26 J.-C. Duplessy, A.W.H. B+ and P.-L. Blanc, Oxygen and carbon isotopic composition and biogeographic distribution of planktonic foraminifera in the Indian Ocean, Palaeogeogr., Palaeoclimatol., Palaeoecol. 33, 9, 1981.
27 J. Erez, Vital effect on stable-isotope composition seen in foraminifera and coral skeletons, Nature 273, 199, 1979.
28 O.R. Anderson and A.W.H. Br, The ultrastructure of a planktonic foraminifer, Globigerinoides sacculifer (Brady) and its symbiotic dinoflagellates, J. Foram. Res. 6, 1, 1976.
29 P. Kroopnick, R,.F. Weiss and H. Craig, Total CO 2, 13C and dissolved oxygen-180 at GEOSECS II in the North Atlantic, Earth Planet. Sci. Lett. 16, 103, 1972.
30 P. Kroopnick, Correlations between 13C and CO 2 in surface waters and atmospheric CO 2, Earth Planet. Sci. Lett. 22, 397, 1974.
31 P. Kroopnick, Modeling the dissolved Oz-CO 2-13C system in the eastern equatorial Pacific, Deep-Sea Res. 21, 211, 1974.
32 P. Kroopnick, The distribution of 13C in the Atlantic Ocean, Earth Planet. Sci. Lett. 49, 469, 1980.
Copyright © 2022 FDOKUMEN