Morphoclines of living operculinid foraminifera based on quantitative characters
30
Morphoclines of living operculinid foraminifera based on quantitative characters Elza K. Yordanova and Johann Hohenegger Institut für Paläontologie, Geozentrum Universität Wien, Althanstrasse 14, A-1090 Wien, Österreich (Austria) email: [email protected], [email protected] ABSTRACT: Growth-independent test characters of the genera Operculina, Planoperculina, and Planostegina were investigated to de- termine relations to water depth in form of morphoclines. All characters describing test form – thickness, initial vector of the test spiral that is correlated to proloculus size, and radius expansion rate describing test contour – are correlated. The investigated Operculina and Planoperculina species (O. ammonoides, O. elegans, O. complanata, P. heterosteginoides) demonstrate significant morphoclines in these characters, which can be used for gradient estimation using regression analyses. Thick forms of Operculina with intensively coiled spirals predominate in shallow water (-20 to -40m); in the deeper parts of the euphotic zone (-120m) they transform into thin forms pos- sessing a weakly coiled spiral. Planoperculina heterosteginoides, with thin tests and therefore restricted to the deeper euphotic zone (starting at –80m), is the only symbiont-bearing larger foraminifer that can extend its distribution to just below the euphotic zone, where it develops extremely thin tests. Both Planostegina species, similar to shallow specimens of Planoperculina heterosteginoides in test form and thickness, do not show morphoclines and are thus restricted to depths between –30 and -90m (P. operculinoides) and –70 and –90m (P. longisepta). Chamber numbers, represented by the growth-independent parameters ‘chamber number of the first whorl’ and the ‘chamber number increase rate’ differ between Operculina species on the one hand and the Planostegina Planoperculina group on the other. Although both parameters are weakly correlated with characters describing test form, they do not show significant morphoclines either in the Operculina species or in the Planostegina Planoperculina group. INTRODUCTION Traits often change within a species in correspondence to geo- graphic distribution, which is known as a ‘cline’ (Huxley, 1939). This transformation represents either reactions of the characters to ecological gradients or it marks the hybrid zone between two species (e.g., Skelton 1993). Clines based on quantitative morphological, physiological, genetic, or behav- ioural characters can be expressed by continuously or stepwise changing functions (Futuyma 1998). They are affected in part by population genetic mechanisms such as gene flow, drift, and selection (e.g., Levinton 2001). The ‘cline’ concept, primarily used for morphological characters (Mayr 1963), was used in different context as geoclines, ecoclines, and chronoclines (Simpson 1961). Whittaker (1960) introduced the term ‘coeno- cline’ for organism communities continuously changing along an environmental gradient. In this article the term ‘morpho- cline’ is restricted to transitions of morphological characters within a species along an environmental factor. The correlation between morphoclines and environmental fac- tors can be used to estimate gradient values by the character state when direct measurements of the ecological factor are im- possible. This method, called ‘direct gradient analysis’ (e.g., Gauch 1982), is useful for estimating environmental parameters of historical and geological age. Regression analysis is the appropriate method of gradient esti- mation for quantitative morphological characters that change continuously with an environmental factor. Growth dependence of morphological characters often blurs the results of regression analyses, especially in species showing semelparity (reproduc- ing once during life time; e.g.,Valiela 1995) and reproducing contemporaneously. Test sizes of the larger foraminifer Marginopora kudakajimaensis, for example, continuously increase after reproduction in late spring until the following re- production in the next year (Fujita et al. 2000). Therefore, gradi- ent dependence of test size as an ecological factor cannot be measured using gradient values at different times. In that case, test characters (size) at different gradient values (water depth) have to be measured at the same time (within one month). The common method to avoid masking effects of growth de- pendence is the use of ratios between metric characters (Sokal and Rohlf 2000). Only in isometric growth, when the linear re- gression or correlation line runs through the origin (y = ax), do ratios (a = y/x) remain constant from small to large size (Zorn 1972, Raup and Stanley 1978), otherwise they change with growth (anisometric and allometric growth, Raup and Stanley 1978). Thickness/diameter-ratios of the symbiont-bearing foram- iniferal genus Amphistegina are correlated with water depth and were used for gradient determination (Hansen and Buchardt 1977, Larsen and Drooger 1977, Hallock 1979). In symbiont- bearing benthic species with hemispherical to lenticular tests, such as Amphistegina lobifera, A. lessonii, A. radiata, A. bicirculata and the calcarinids Neorotalia calcar, Calcarina gaudichaudii, C. hispida, and Baculogypsina sphaerulata, all linear regression lines between test thickness and diameter mea- sured in a population run through the origin (see Hallock 1979: fig. 1) and the ratios represented by the slope of the linear re- gression line remain constant. Larger foraminifera with thin-lenticular or planar tests also demonstrate test flattening with water depth (Hottinger 1977b, Pecheux 1995), but this cannot be expressed by simple ratios between thickness and size because linear regression lines do micropaleontology, vol. 50, no. 2, pp. 149-177, text-figures 1-19, tables 1-11, 2004 149
Transcript of Morphoclines of living operculinid foraminifera based on quantitative characters
Morphoclines of living operculinid foraminifera based onquantitative characters
Elza K. Yordanova and Johann HoheneggerInstitut für Paläontologie, Geozentrum Universität Wien, Althanstrasse 14, A-1090 Wien, Österreich (Austria)
email: [email protected], [email protected]
ABSTRACT:Growth-independent test characters of the generaOperculina, Planoperculina, andPlanosteginawere investigated to de-termine relations to water depth in form of morphoclines. All characters describing test form – thickness, initial vector of the test spiralthat is correlated to proloculus size, and radius expansion rate describing test contour – are correlated. The investigated Operculina andPlanoperculina species (O. ammonoides, O. elegans, O. complanata, P. heterosteginoides) demonstrate significant morphoclines inthese characters, which can be used for gradient estimation using regression analyses. Thick forms of Operculina with intensively coiledspirals predominate in shallowwater (�20 to �40m); in the deeper parts of the euphotic zone (�120m) they transform into thin forms pos-sessing a weakly coiled spiral. Planoperculina heterosteginoides, with thin tests and therefore restricted to the deeper euphotic zone(starting at –80m), is the only symbiont-bearing larger foraminifer that can extend its distribution to just below the euphotic zone, whereit develops extremely thin tests. Both Planostegina species, similar to shallow specimens of Planoperculina heterosteginoides in testform and thickness, do not show morphoclines and are thus restricted to depths between –30 and �90m (P. operculinoides) and –70 and–90m (P. longisepta). Chamber numbers, represented by the growth-independent parameters ‘chamber number of the first whorl’ andthe ‘chamber number increase rate’ differ between Operculina species on the one hand and the Planostegina Planoperculina group onthe other. Although both parameters are weakly correlated with characters describing test form, they do not show significantmorphoclines either in the Operculina species or in the Planostegina Planoperculina group.
INTRODUCTION
Traits often change within a species in correspondence to geo-graphic distribution, which is known as a ‘cline’ (Huxley,1939). This transformation represents either reactions of thecharacters to ecological gradients or it marks the hybrid zonebetween two species (e.g., Skelton 1993). Clines based onquantitative morphological, physiological, genetic, or behav-ioural characters can be expressed by continuously or stepwisechanging functions (Futuyma 1998). They are affected in partby population genetic mechanisms such as gene flow, drift, andselection (e.g., Levinton 2001). The ‘cline’ concept, primarilyused for morphological characters (Mayr 1963), was used indifferent context as geoclines, ecoclines, and chronoclines(Simpson 1961). Whittaker (1960) introduced the term ‘coeno-cline’ for organism communities continuously changing alongan environmental gradient. In this article the term ‘morpho-cline’ is restricted to transitions of morphological characterswithin a species along an environmental factor.
The correlation between morphoclines and environmental fac-tors can be used to estimate gradient values by the characterstate when direct measurements of the ecological factor are im-possible. This method, called ‘direct gradient analysis’ (e.g.,Gauch 1982), is useful for estimating environmental parametersof historical and geological age.
Regression analysis is the appropriate method of gradient esti-mation for quantitative morphological characters that changecontinuously with an environmental factor. Growth dependenceof morphological characters often blurs the results of regressionanalyses, especially in species showing semelparity (reproduc-ing once during life time; e.g.,Valiela 1995) and reproducingcontemporaneously. Test sizes of the larger foraminifer
Marginopora kudakajimaensis, for example, continuouslyincrease after reproduction in late spring until the following re-production in the next year (Fujita et al. 2000). Therefore, gradi-ent dependence of test size as an ecological factor cannot bemeasured using gradient values at different times. In that case,test characters (size) at different gradient values (water depth)have to be measured at the same time (within one month).
The common method to avoid masking effects of growth de-pendence is the use of ratios between metric characters (Sokaland Rohlf 2000). Only in isometric growth, when the linear re-gression or correlation line runs through the origin (y = ax), doratios (a = y/x) remain constant from small to large size (Zorn1972, Raup and Stanley 1978), otherwise they change withgrowth (anisometric and allometric growth, Raup and Stanley1978).
Thickness/diameter-ratios of the symbiont-bearing foram-iniferal genus Amphistegina are correlated with water depth andwere used for gradient determination (Hansen and Buchardt1977, Larsen and Drooger 1977, Hallock 1979). In symbiont-bearing benthic species with hemispherical to lenticular tests,such as Amphistegina lobifera, A. lessonii, A. radiata, A.bicirculata and the calcarinids Neorotalia calcar, Calcarinagaudichaudii, C. hispida, and Baculogypsina sphaerulata, alllinear regression lines between test thickness and diameter mea-sured in a population run through the origin (see Hallock 1979:fig. 1) and the ratios represented by the slope of the linear re-gression line remain constant.
Larger foraminifera with thin-lenticular or planar tests alsodemonstrate test flattening with water depth (Hottinger 1977b,Pecheux 1995), but this cannot be expressed by simple ratiosbetween thickness and size because linear regression lines do
micropaleontology, vol. 50, no. 2, pp. 149-177, text-figures 1-19, tables 1-11, 2004 149

not run through the origin and must be replaced by power re-gression functions (see fig. 2 in Hallock 1979). Hohenegger andothers (2000), in their comments on West Pacific nummulitidforaminifera, developed various methods to quantitatively mea-sure test characters beside the simple measurement of size andthickness. During investigation of living foraminifera, differentmorphoclines in nummulitid foraminifera - especially the groupof operculinid foraminifera - were observed but no statisticalanalysis was performed. This will be the target of the followingarticle.
SAMPLING AND INVESTIGATION METHODS
Living operculinid foraminifera were collected in 1996, 1997,and 1998 during cruises on the research vessel ‘Merulina’ ofSesoko Station, Tropical Biosphere Center, University of theRyukyus. Samples taken in 1996 originate from two paralleltransects NW and West of Sesoko Island, Okinawa, Japan(text-fig. 1), ranging with 10m depth intervals from the reefedge down to 100m (Hohenegger et al. 1999, Hohenegger andYordanova 2001a, b, Yordanova and Hohenegger 2002). Twosamples were taken in the upper 50m at each sampling point bySCUBA, one containing hard and the other soft substrate. Alldeeper, mostly sandy samples were dredged. Only two showeda higher proportion of firm substrate: macroids were abundantin one sample from 60m in the northern transect and rodolithspredominated in a southern transect sample from 90m. Addi-tional samples, also ranging in 10m depth intervals from 10mdown to 90m, were taken in 1998 and 1999 at the steep sandyslope north of Minna Island (text-fig. 1).
The separation of living larger foraminifera from the sedimentfollowed the method described in earlier papers (Hohenegger1994, Hohenegger et al. 1999). For the present morphometricinvestigation, only samples with abundant operculinid foram-
inifera were chosen (text-fig. 1) to obtain significant informa-tion about population structures. Measurements were performedin two ways. Test thickness was optically measured using theelectronic spindle Mitutuyo installed on the light microscopeNikon Optiphot 2 by focusing on the highest point of the test asopposed to the base plane. To minimize measurement errors,each specimen was measured four times at least. For investiga-tion of chamber form and order, three soft X-ray micrographs(Agfa Structurix D2) were taken from each specimen using aFaxitron 43855A. The first micrograph, with short exposuretime (5 minutes at 15kV) provided information about test con-tour and the peripheral chambers, while the second photographwith longer exposure time (15 to 20 minutes at 15kV) bright-ened the central test parts. A third micrograph with higher volt-age (15 to 20 minutes at 20kV) was necessary for all proloculusphotographs and for extremely thick tests. Combining these mi-crographs using graphic programs (Corel 9) enabled investiga-tion of internal test structures from the periphery to theproloculus. Based on these combined micrographs, measure-ments of the test spiral and chamber dimensions could be pro-cessed using the Kontron 400 Image Analyzing System.
Beside basic statistics performed in Microsoft Excel, the pro-gram packages Statgraphics Plus and SPSS 10 were used forcomplex statistical data analyses. Due to difficulties in separat-ing Operculina elegans from O. complanata in young individu-als, Operculina specimens <1mm could not be statisticallytreated, reducing the total number of processed individuals from1363 measured specimens to 980.
INVESTIGATED SPECIES
Species determination follows Hohenegger et al. (2000), whichis based on an ecological species concept (van Valen 1976,Hohenegger 2000). No distinction into subfamilies within the
150
Elza K. Yordanova and Johann Hohenegger: Morphoclines of living operculinid foraminifera based on quantitative characters
TEXT-FIGURE 1Mapof study areawith all stations sampled from1996 to 1999; full dots indicate stationswith operculinid foraminifera used formorphometric analysis.
151
Micropaleontology, vol. 50, no. 2, 2004
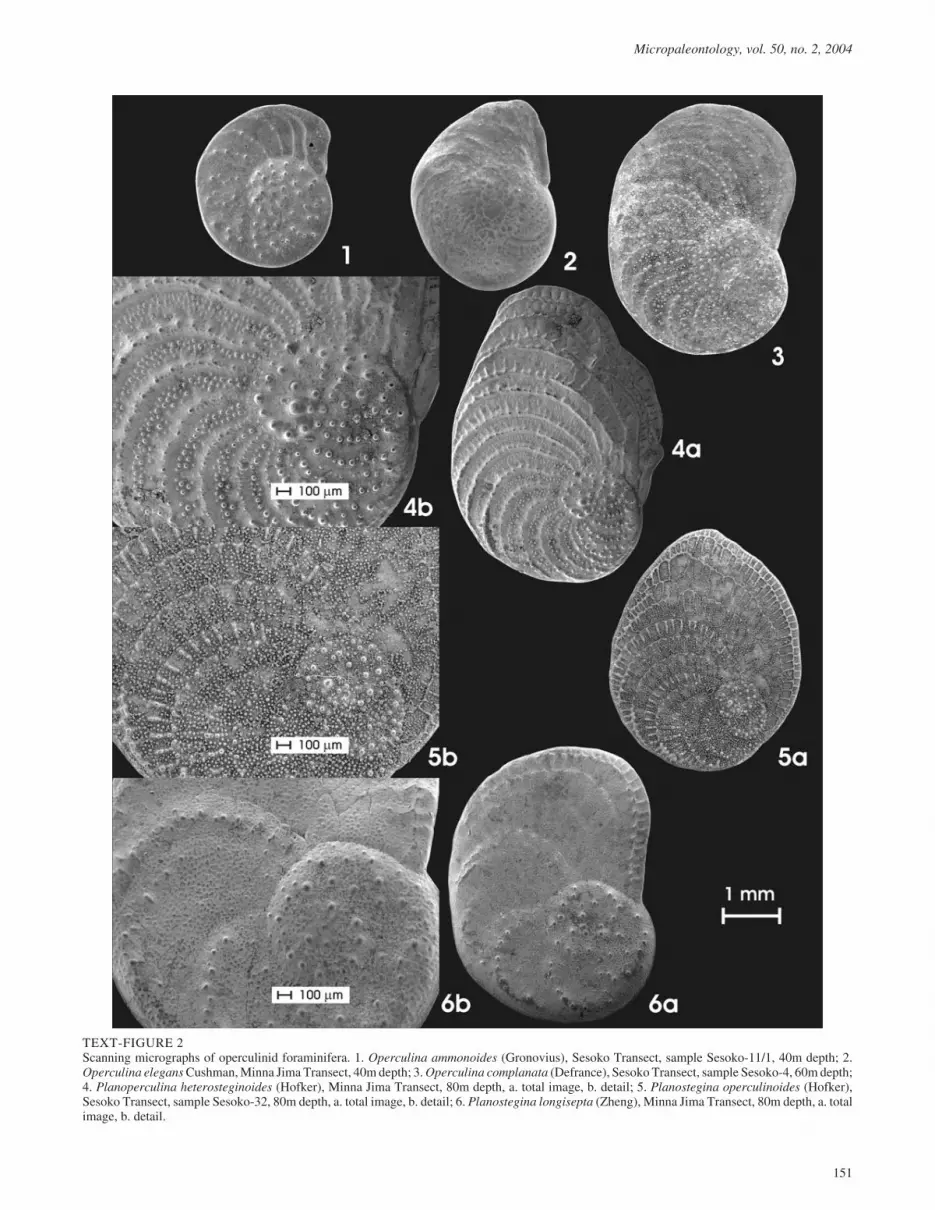
TEXT-FIGURE 2Scanning micrographs of operculinid foraminifera. 1. Operculina ammonoides (Gronovius), Sesoko Transect, sample Sesoko-11/1, 40m depth; 2.Operculina elegans Cushman, Minna Jima Transect, 40m depth; 3. Operculina complanata (Defrance), Sesoko Transect, sample Sesoko-4, 60m depth;4. Planoperculina heterosteginoides (Hofker), Minna Jima Transect, 80m depth, a. total image, b. detail; 5. Planostegina operculinoides (Hofker),Sesoko Transect, sample Sesoko-32, 80m depth, a. total image, b. detail; 6. Planostegina longisepta (Zheng), Minna Jima Transect, 80m depth, a. totalimage, b. detail.
Nummulitidae is exercised on the suprageneric level, but ac-cording to similar test construction the investigated specieswere grouped as operculinid foraminifera (Hottinger 1977a).Holzmann et al. (2003) demonstrate the complex phylogeny ofthe Nummulitidae, revealing a parallel evolution in the devel-opment of chamberlets based on molecular genetic analysis.
The present investigation concentrates on species distinguishedby planispirally, semi-involute to evolute coiled tests with orwithout chamberlets, characterized by the lack of trabeculae(thus excluding Nummulites) and no separation between a thicklenticular central part and flat final chambers in large individu-als as found in Heterostegina and Operculinella (Hohenegger etal. 2000). Therefore, the following six species (text-fig. 2) dem-onstrating similar test construction were treated:
Operculina ammonoides (Gronovius)
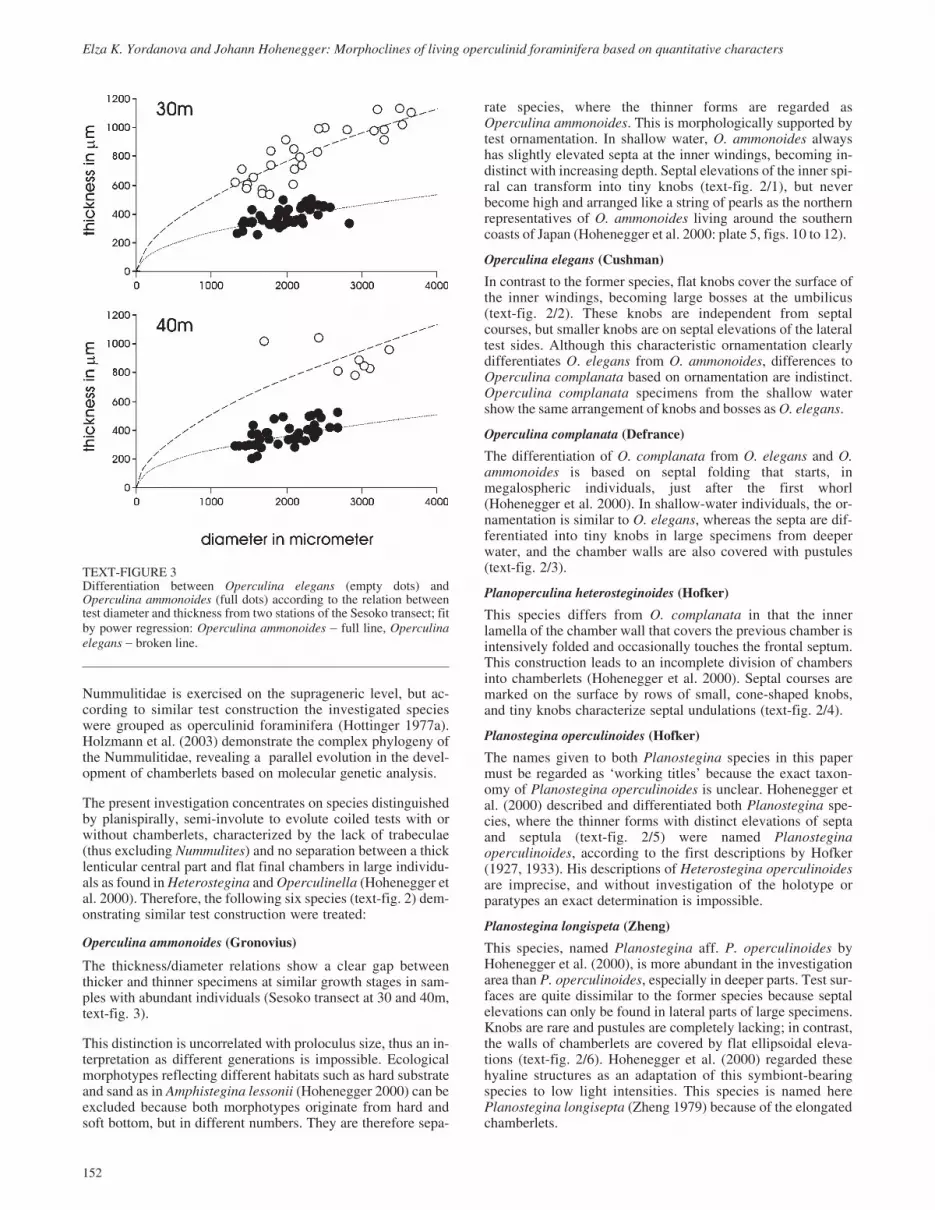
The thickness/diameter relations show a clear gap betweenthicker and thinner specimens at similar growth stages in sam-ples with abundant individuals (Sesoko transect at 30 and 40m,text-fig. 3).
This distinction is uncorrelated with proloculus size, thus an in-terpretation as different generations is impossible. Ecologicalmorphotypes reflecting different habitats such as hard substrateand sand as in Amphistegina lessonii (Hohenegger 2000) can beexcluded because both morphotypes originate from hard andsoft bottom, but in different numbers. They are therefore sepa-
rate species, where the thinner forms are regarded asOperculina ammonoides. This is morphologically supported bytest ornamentation. In shallow water, O. ammonoides alwayshas slightly elevated septa at the inner windings, becoming in-distinct with increasing depth. Septal elevations of the inner spi-ral can transform into tiny knobs (text-fig. 2/1), but neverbecome high and arranged like a string of pearls as the northernrepresentatives of O. ammonoides living around the southerncoasts of Japan (Hohenegger et al. 2000: plate 5, figs. 10 to 12).
Operculina elegans (Cushman)
In contrast to the former species, flat knobs cover the surface ofthe inner windings, becoming large bosses at the umbilicus(text-fig. 2/2). These knobs are independent from septalcourses, but smaller knobs are on septal elevations of the lateraltest sides. Although this characteristic ornamentation clearlydifferentiates O. elegans from O. ammonoides, differences toOperculina complanata based on ornamentation are indistinct.Operculina complanata specimens from the shallow watershow the same arrangement of knobs and bosses as O. elegans.
Operculina complanata (Defrance)
The differentiation of O. complanata from O. elegans and O.ammonoides is based on septal folding that starts, inmegalospheric individuals, just after the first whorl(Hohenegger et al. 2000). In shallow-water individuals, the or-namentation is similar to O. elegans, whereas the septa are dif-ferentiated into tiny knobs in large specimens from deeperwater, and the chamber walls are also covered with pustules(text-fig. 2/3).
Planoperculina heterosteginoides (Hofker)
This species differs from O. complanata in that the innerlamella of the chamber wall that covers the previous chamber isintensively folded and occasionally touches the frontal septum.This construction leads to an incomplete division of chambersinto chamberlets (Hohenegger et al. 2000). Septal courses aremarked on the surface by rows of small, cone-shaped knobs,and tiny knobs characterize septal undulations (text-fig. 2/4).
Planostegina operculinoides (Hofker)
The names given to both Planostegina species in this papermust be regarded as ‘working titles’ because the exact taxon-omy of Planostegina operculinoides is unclear. Hohenegger etal. (2000) described and differentiated both Planostegina spe-cies, where the thinner forms with distinct elevations of septaand septula (text-fig. 2/5) were named Planosteginaoperculinoides, according to the first descriptions by Hofker(1927, 1933). His descriptions of Heterostegina operculinoidesare imprecise, and without investigation of the holotype orparatypes an exact determination is impossible.
Planostegina longispeta (Zheng)
This species, named Planostegina aff. P. operculinoides byHohenegger et al. (2000), is more abundant in the investigationarea than P. operculinoides, especially in deeper parts. Test sur-faces are quite dissimilar to the former species because septalelevations can only be found in lateral parts of large specimens.Knobs are rare and pustules are completely lacking; in contrast,the walls of chamberlets are covered by flat ellipsoidal eleva-tions (text-fig. 2/6). Hohenegger et al. (2000) regarded thesehyaline structures as an adaptation of this symbiont-bearingspecies to low light intensities. This species is named herePlanostegina longisepta (Zheng 1979) because of the elongatedchamberlets.
152
Elza K. Yordanova and Johann Hohenegger: Morphoclines of living operculinid foraminifera based on quantitative characters
TEXT-FIGURE 3Differentiation between Operculina elegans (empty dots) andOperculina ammonoides (full dots) according to the relation betweentest diameter and thickness from two stations of the Sesoko transect; fitby power regression: Operculina ammonoides � full line, Operculinaelegans � broken line.

MORPHOMETRIC ANALYSES
To exclude character variability caused by growth (e.g., testsize), growth-independent morphological traits are used tocompare the tests.
Test thickness
In the case of thin-lenticular to plate-like tests, such as those inalmost all operculinid foraminifers, plots of test thicknessagainst diameter indicate allometric growth (Batschelet 1975,Sokal and Rohlf 2000) due to their differing growth rates(text-figs. 4 to 9). The function for allometric growth
y = axb (1)
is defined by the integration parameter a and the allometric pa-rameter b (Kant 1977).
Parameters of the allometric function can be inferred using dif-ferent growth states of a single individual. This is simplified inliving forms by measuring test characters during growth(Röttger and Hallock 1982). Using empty tests, thickness mea-surements at different growth states are possible only in ori-ented thin sections, especially when measuring involute tests.Due to lamellar test walls in hyaline foraminifera, where thewall of a new chamber partially or completely covers the older
153
Micropaleontology, vol. 50, no. 2, 2004
TABLE 1
Comparison of allometric constants b between test thickness and diameter based on the integrative constants a obtained as sample averages, species av-erages, and total averages, using the coefficient of determination as test parameter.
154
Elza K. Yordanova and Johann Hohenegger: Morphoclines of living operculinid foraminifera based on quantitative characters
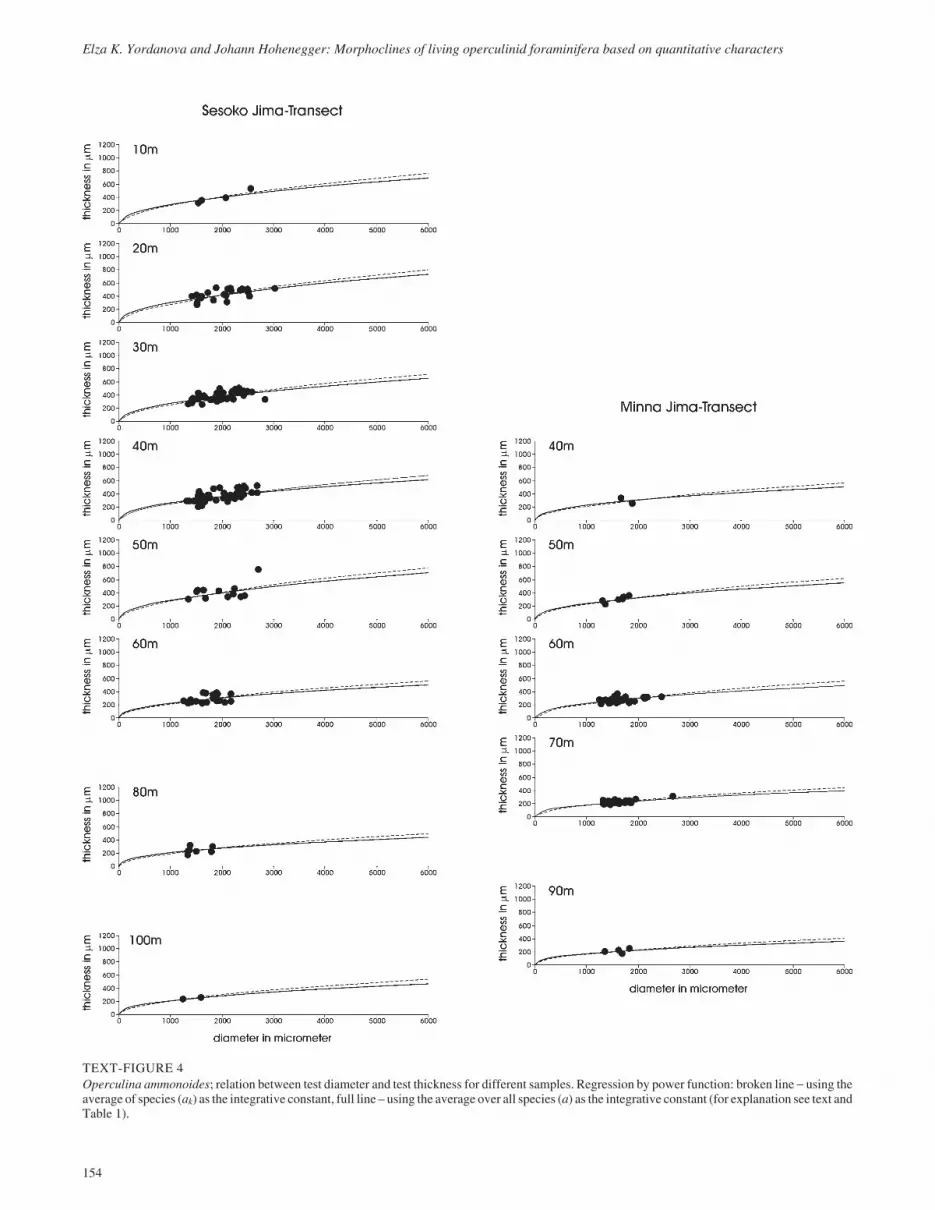
TEXT-FIGURE 4Operculina ammonoides; relation between test diameter and test thickness for different samples. Regression by power function: broken line � using theaverage of species (ak) as the integrative constant, full line – using the average over all species (a) as the integrative constant (for explanation see text andTable 1).
test parts, the correct thickness of a special growth state can beobtained by measuring thickness at the lamella belonging to theappropriate chamber (Hallock and Hansen 1979).
An easier way of estimating allometric growth is to use the pop-ulation samples consisting of individuals that represent differ-ent growth stages. Fitting by power regression curves yieldsparameters aj and bj of the allometric function that are represen-tative for sample j. This method is used in the following calcu-lations.
First, the integration constants aj between thickness and diame-ter were calculated for all j depth samples. Second, the averagedintegration parameters ak were calculated for each of the k spe-cies (Table 1) using the arithmetic means of samples weightedby specimen number njk (see Ferschl 1985):
ln / lna n n ak k jk
j
j m
jk��
�
�11
(2)
where j indicates the sample, m the number of samples, and kthe species .
155
Micropaleontology, vol. 50, no. 2, 2004
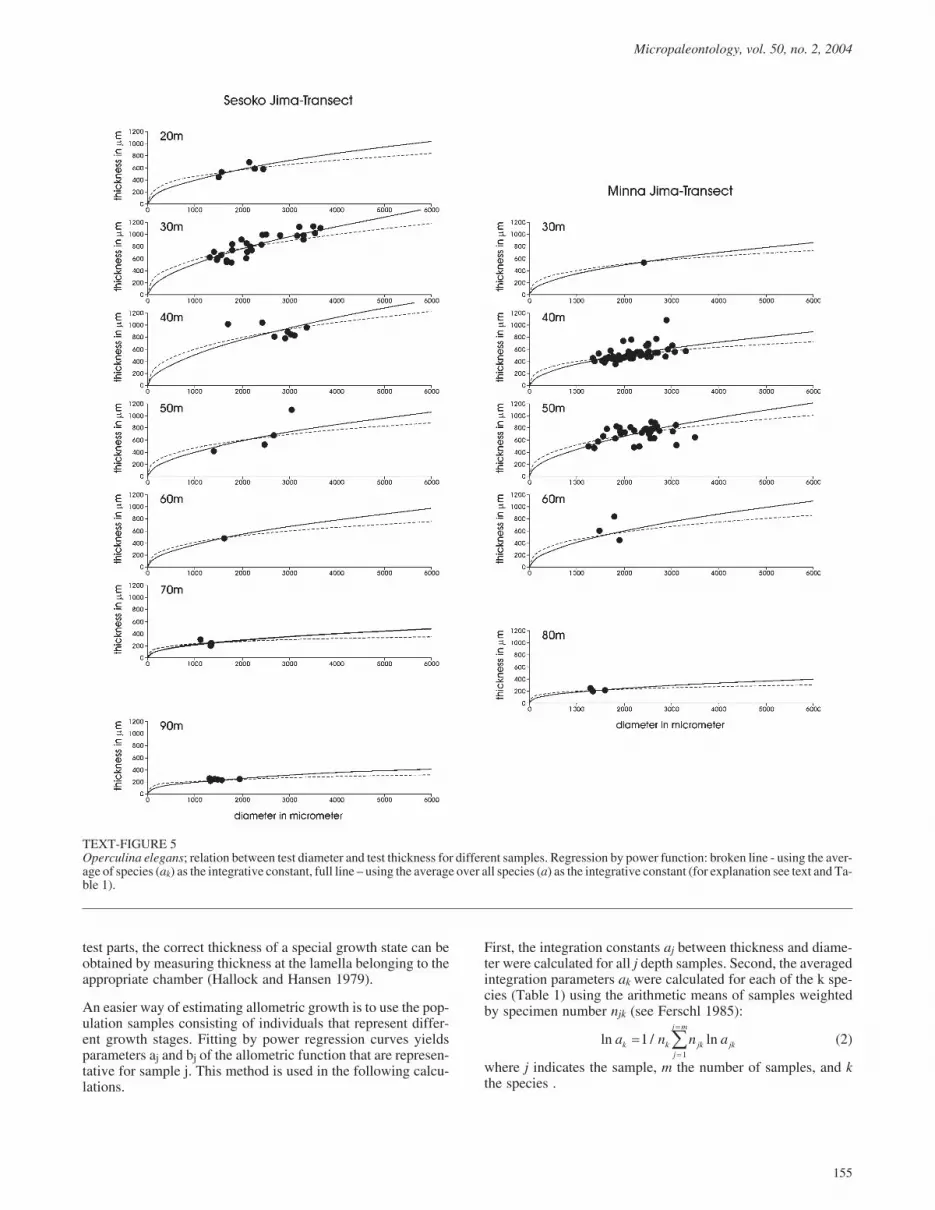
TEXT-FIGURE 5Operculina elegans; relation between test diameter and test thickness for different samples. Regression by power function: broken line - using the aver-age of species (ak) as the integrative constant, full line – using the average over all species (a) as the integrative constant (for explanation see text and Ta-ble 1).
156
Elza K. Yordanova and Johann Hohenegger: Morphoclines of living operculinid foraminifera based on quantitative characters
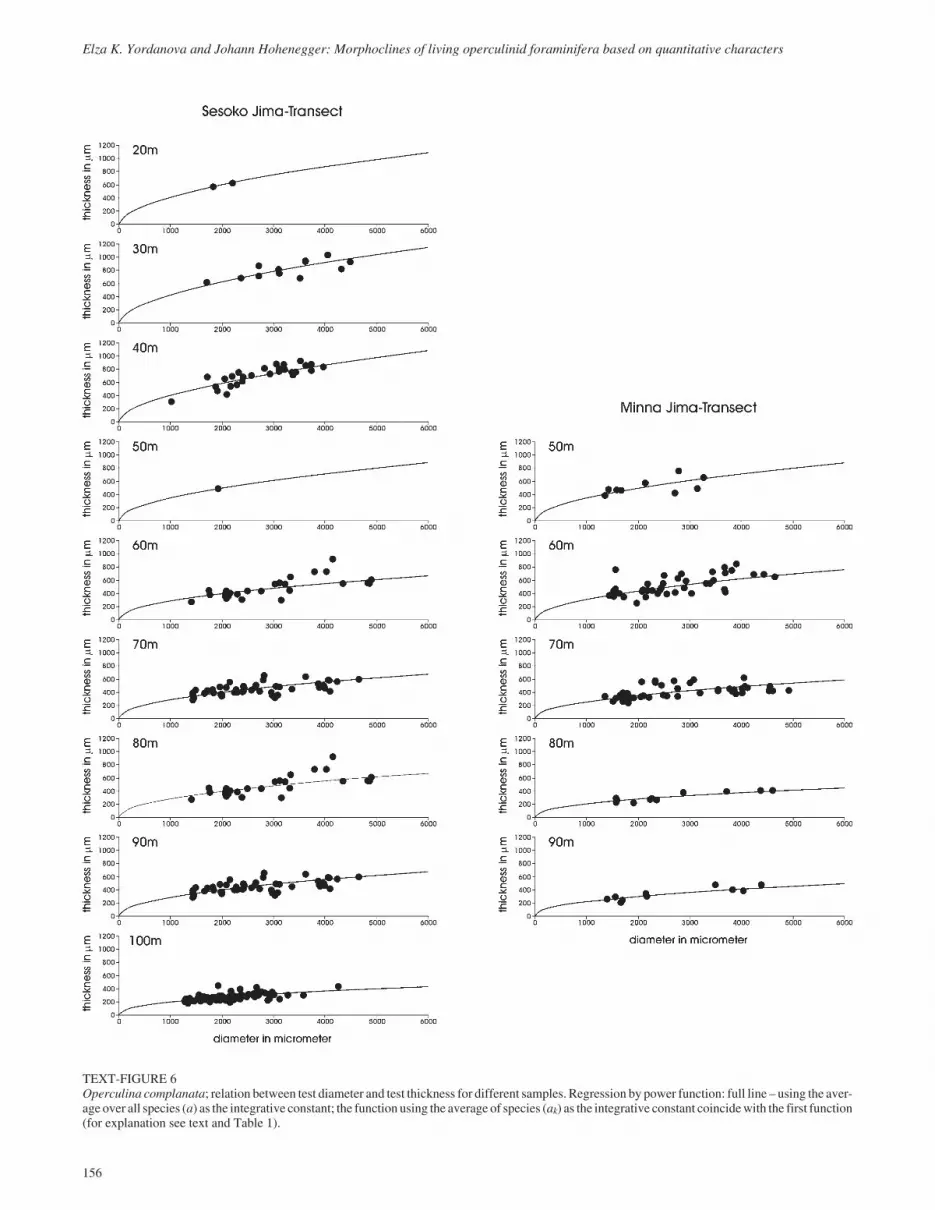
TEXT-FIGURE 6Operculina complanata; relation between test diameter and test thickness for different samples. Regression by power function: full line – using the aver-age over all species (a) as the integrative constant; the function using the average of species (ak) as the integrative constant coincidewith the first function(for explanation see text and Table 1).
157
Micropaleontology, vol. 50, no. 2, 2004
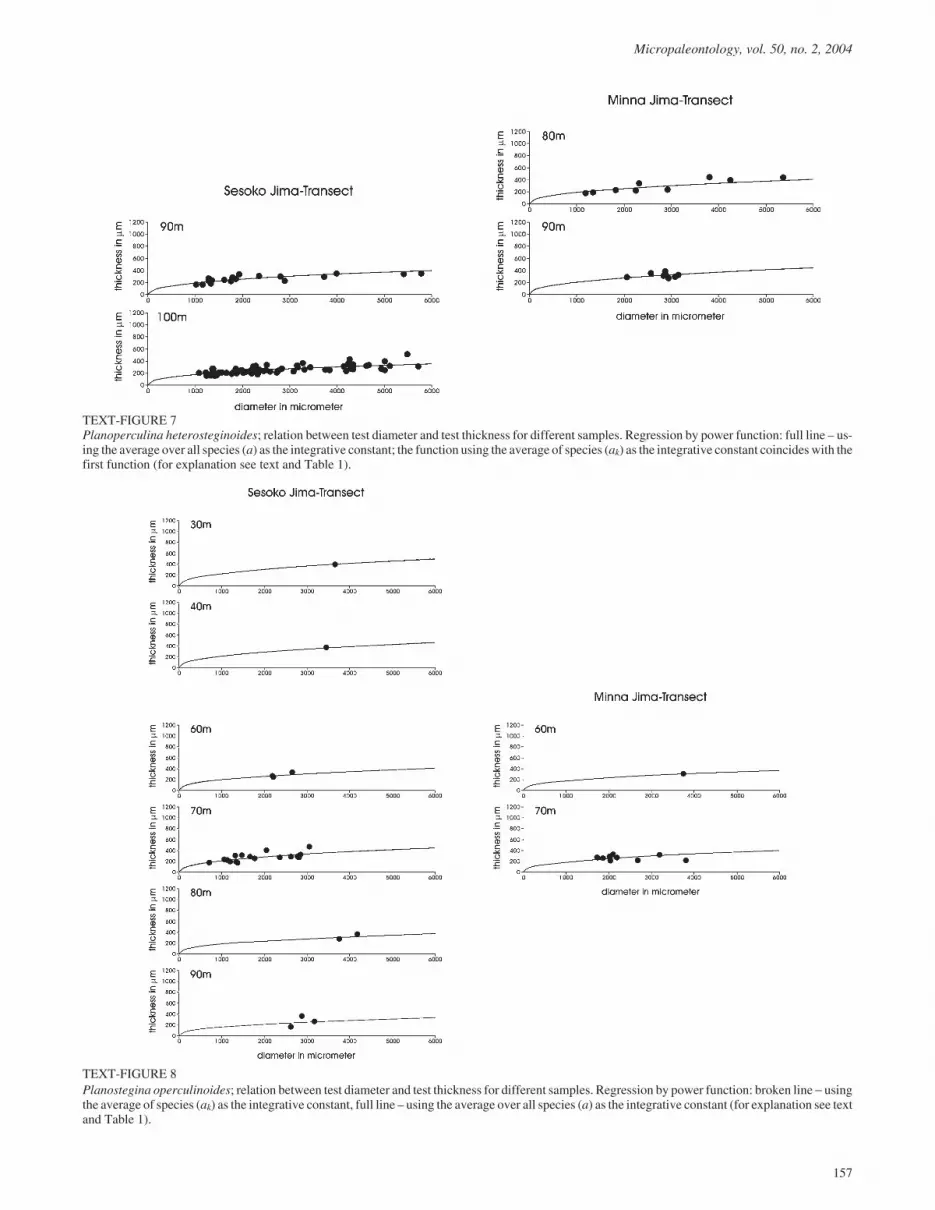
TEXT-FIGURE 7Planoperculina heterosteginoides; relation between test diameter and test thickness for different samples. Regression by power function: full line – us-ing the average over all species (a) as the integrative constant; the function using the average of species (ak) as the integrative constant coincides with thefirst function (for explanation see text and Table 1).
TEXT-FIGURE 8Planostegina operculinoides; relation between test diameter and test thickness for different samples. Regression by power function: broken line � usingthe average of species (ak) as the integrative constant, full line – using the average over all species (a) as the integrative constant (for explanation see textand Table 1).
Using the integration parameter ak, the allometric parametersbik can now be calculated for each individual i belonging to spe-cies k according to
b y a xik ik k ik� �(ln ln ) / ln (3)
Since the parameter ak is constant within, but dissimilar be-tween the species, dependences of thickness/diameter-relationsfrom the depth gradient are now expressed in a single variable,the allometric constants bik, and can be separately tested foreach species by regression analyses.
To compare growth-independent relations between test thick-ness and diameter over all species, the integration parameter aof the allometric function must be constant for all species. Thisis obtained by the equation
ln / lna n n ak k
k
k r
��
�
�11
(4)
with r indicating the number of species. Now, the allometricconstant b can be calculated for each specimen i by
b y a xi i i� �(ln ln ) / ln (5)
which is independent from the species. Not only can the depthdependence of the thickness/diameter-relation within species be
calculated, but comparison between all species and their depthdependence is also possible.
Table 1 demonstrates the correctness of this procedure by com-paring allometric functions between those samples that arecharacterized by a significant number of individuals (>18).These comparisons are based on
1) regression analyses between test thickness and diameter us-ing power functions for each sample j,
2) sample means of the allometric parameter bik, where
b n bj j ik
i
i n j
��
�
�11
/ (6)
using the integration parameter ak that is constant within a spe-cies
3) sample means of the allometric parameter b with
b n bj j i
i
i n j
��
�
�11
/ (7)
using the integration parameter a that is constant between allspecies.
Goodness of fit is proven by the coefficient of determination,which is the squared product-moment-correlation between em-pirical data and theoretical values, using the three allometric
158
Elza K. Yordanova and Johann Hohenegger: Morphoclines of living operculinid foraminifera based on quantitative characters
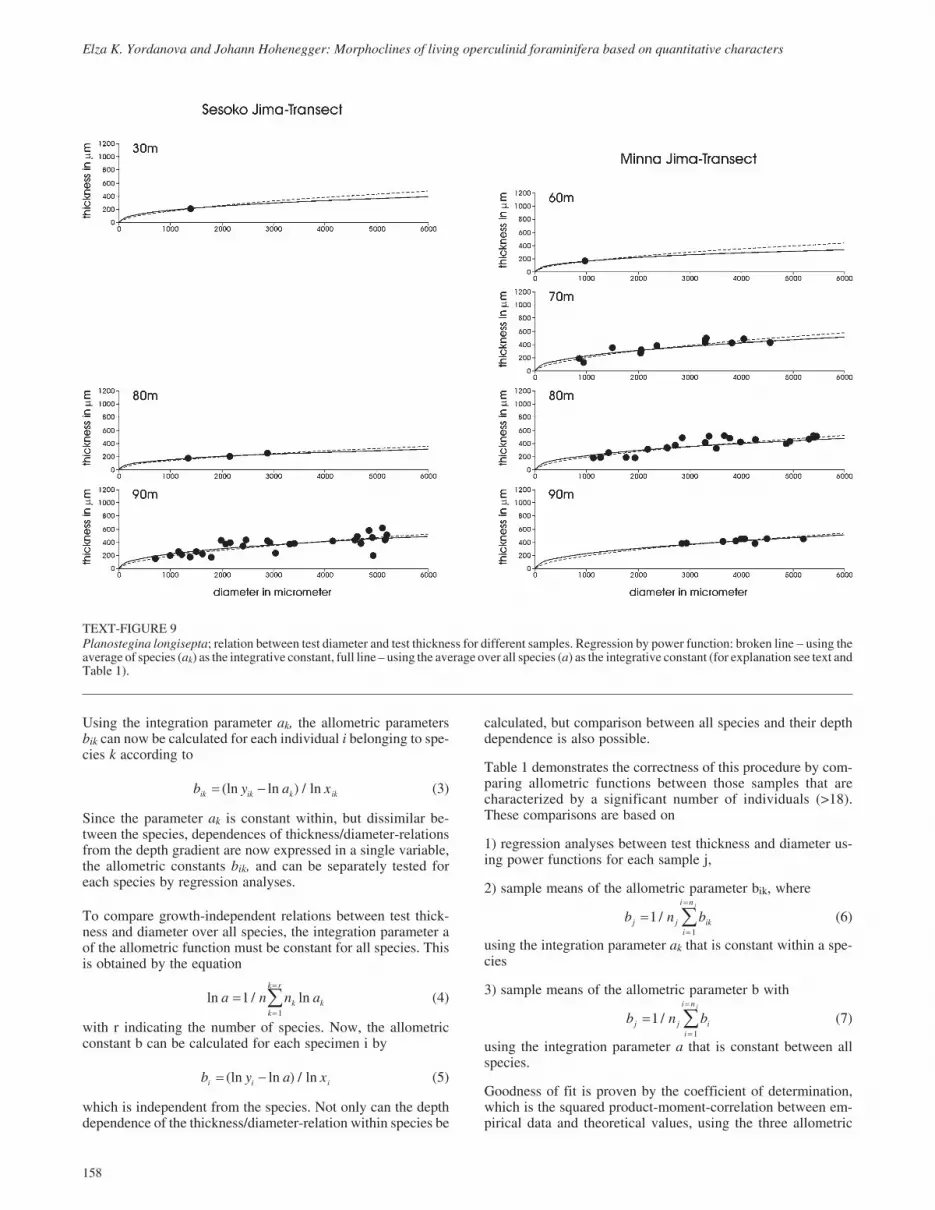
TEXT-FIGURE 9Planostegina longisepta; relation between test diameter and test thickness for different samples. Regression by power function: broken line � using theaverage of species (ak) as the integrative constant, full line – using the average over all species (a) as the integrative constant (for explanation see text andTable 1).
functions explained above. Except for Operculina elegans from50m at Minna Jima, all allometric functions fit significantly(Table 1). Although based on different methods, these fits are ofequal quality as indicated by the coefficient of determination.Sometimes they are slightly better using the integrative parame-ter a, which is identical over all species, compared to the regres-sion curve based on power functions (compare coefficients ofdetermination for Planostegina operculinoides in Table 1).
Using the overall constant integrative parameter a, the compari-son between the allometric parameters bj of samples allowstrends to be detected (Table 1). Especially in species with broaddepth ranges and many individuals (Operculina ammonoides,Operculina complanata), the decrease in sample parameters bjwith depth is obvious (Table 1). This trend is also visible in theallometric curves of text-figures 4 to 6, which become flatterwith increasing depth. The curves in text-figures 4 to 9 repre-sent on the one hand the allometric function averaged for sam-ples and based on the species-constant parameters ak (brokenlines in text-figs. 4 to 9), and on the other hand using parametera, which is constant in all species (full lines in text-figs. 4 to 9).
The allometric constant bi is thus used in the followingmorphometric analysis of operculinid foraminifera for thegrowth-independent indication of test thickness.
Test form
Operculinid foraminifers are distinguished by planspirallycoiled tests, where a modified logarithmic spiral models thecourse of the test margin (Hohenegger et al. 2000). The basiclogarithmic spiral
r r b� 0 exp( )� (8)
can be used as a model for the outer margin in manyplanspirally as well as trochospirally coiled tests (Raup 1966).In modified form
r r b� exp( exp( ))0 � (9)
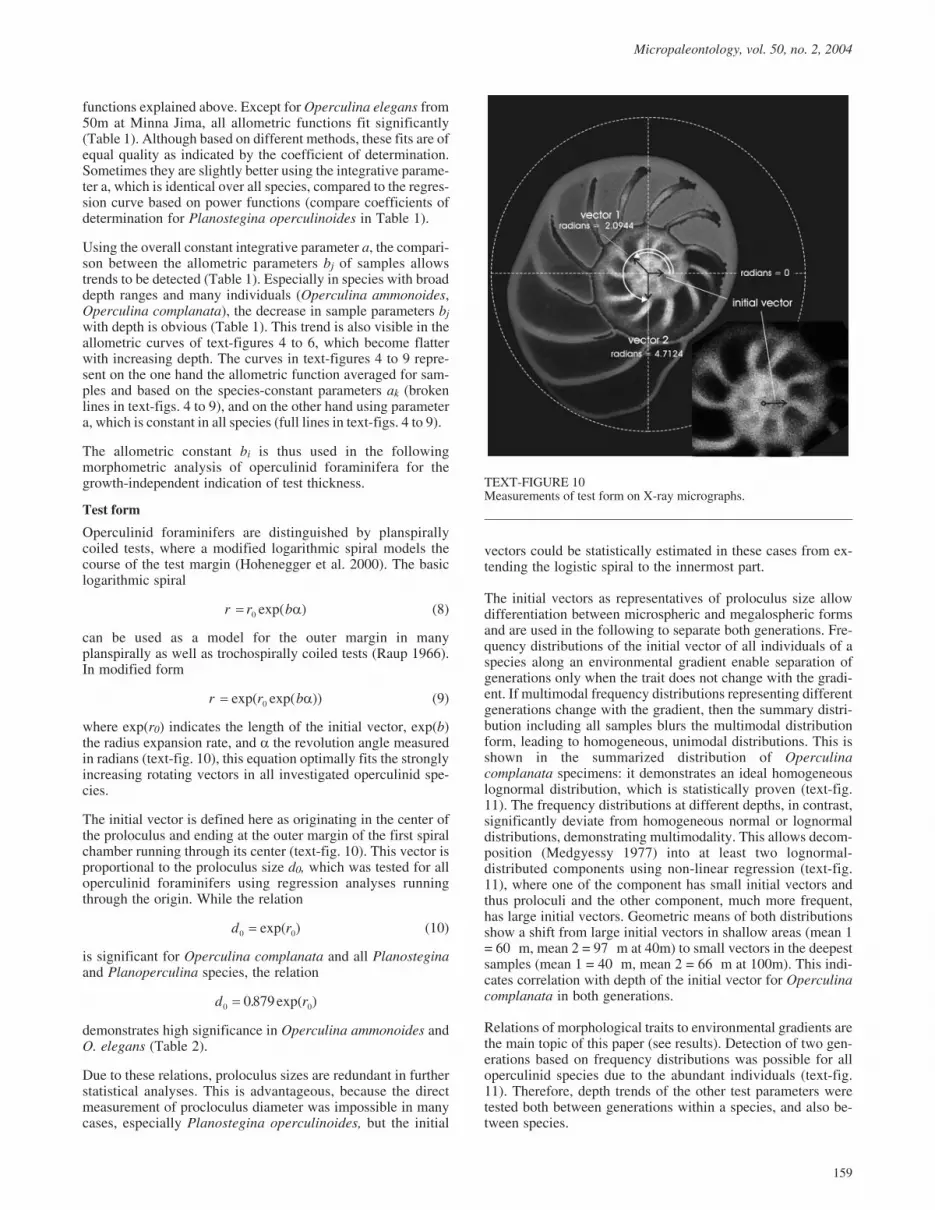
where exp(r0) indicates the length of the initial vector, exp(b)the radius expansion rate, and � the revolution angle measuredin radians (text-fig. 10), this equation optimally fits the stronglyincreasing rotating vectors in all investigated operculinid spe-cies.
The initial vector is defined here as originating in the center ofthe proloculus and ending at the outer margin of the first spiralchamber running through its center (text-fig. 10). This vector isproportional to the proloculus size d0, which was tested for alloperculinid foraminifers using regression analyses runningthrough the origin. While the relation
d r0 0� exp( ) (10)
is significant for Operculina complanata and all Planosteginaand Planoperculina species, the relation
d r0 00 879� . exp( )
demonstrates high significance in Operculina ammonoides andO. elegans (Table 2).
Due to these relations, proloculus sizes are redundant in furtherstatistical analyses. This is advantageous, because the directmeasurement of procloculus diameter was impossible in manycases, especially Planostegina operculinoides, but the initial
vectors could be statistically estimated in these cases from ex-tending the logistic spiral to the innermost part.
The initial vectors as representatives of proloculus size allowdifferentiation between microspheric and megalospheric formsand are used in the following to separate both generations. Fre-quency distributions of the initial vector of all individuals of aspecies along an environmental gradient enable separation ofgenerations only when the trait does not change with the gradi-ent. If multimodal frequency distributions representing differentgenerations change with the gradient, then the summary distri-bution including all samples blurs the multimodal distributionform, leading to homogeneous, unimodal distributions. This isshown in the summarized distribution of Operculinacomplanata specimens: it demonstrates an ideal homogeneouslognormal distribution, which is statistically proven (text-fig.11). The frequency distributions at different depths, in contrast,significantly deviate from homogeneous normal or lognormaldistributions, demonstrating multimodality. This allows decom-position (Medgyessy 1977) into at least two lognormal-distributed components using non-linear regression (text-fig.11), where one of the component has small initial vectors andthus proloculi and the other component, much more frequent,has large initial vectors. Geometric means of both distributionsshow a shift from large initial vectors in shallow areas (mean 1= 60 m, mean 2 = 97 m at 40m) to small vectors in the deepestsamples (mean 1 = 40 m, mean 2 = 66 m at 100m). This indi-cates correlation with depth of the initial vector for Operculinacomplanata in both generations.
Relations of morphological traits to environmental gradients arethe main topic of this paper (see results). Detection of two gen-erations based on frequency distributions was possible for alloperculinid species due to the abundant individuals (text-fig.11). Therefore, depth trends of the other test parameters weretested both between generations within a species, and also be-tween species.
159
Micropaleontology, vol. 50, no. 2, 2004
TEXT-FIGURE 10Measurements of test form on X-ray micrographs.
In the following regression analyses on water depth, the initialvectors as well as the radius expansion rates are used asgrowth-independent variables characterizing test form.
Chamber number
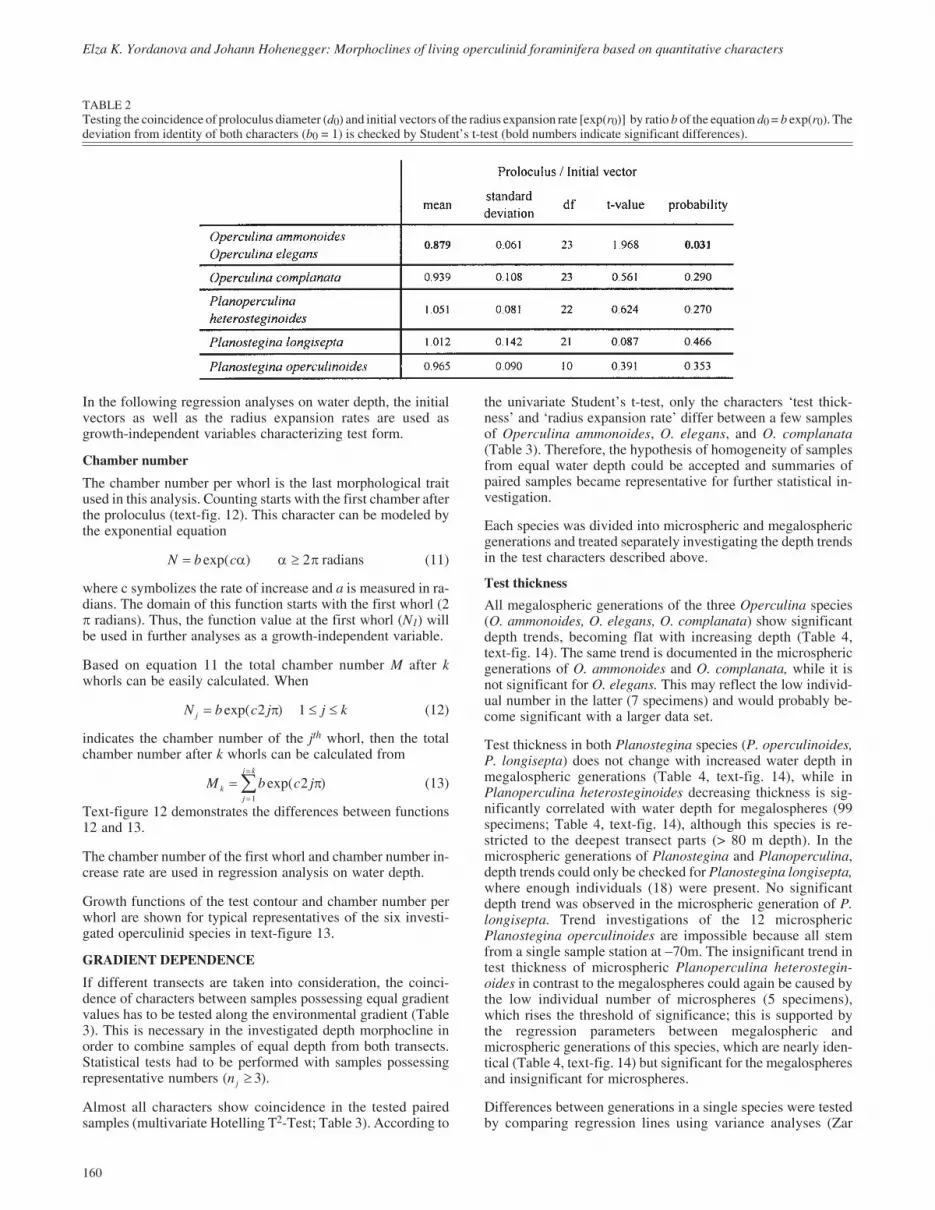
The chamber number per whorl is the last morphological traitused in this analysis. Counting starts with the first chamber afterthe proloculus (text-fig. 12). This character can be modeled bythe exponential equation
N b c� �exp( )� � �2 radians (11)
where c symbolizes the rate of increase and a is measured in ra-dians. The domain of this function starts with the first whorl (2� radians). Thus, the function value at the first whorl (N1) willbe used in further analyses as a growth-independent variable.
Based on equation 11 the total chamber number M after kwhorls can be easily calculated. When
N b c j j kj � � �exp( )2 1� (12)
indicates the chamber number of the jth whorl, then the totalchamber number after k whorls can be calculated from
M b c jk
j
j k
��
�
� exp( )21
� (13)
Text-figure 12 demonstrates the differences between functions12 and 13.
The chamber number of the first whorl and chamber number in-crease rate are used in regression analysis on water depth.
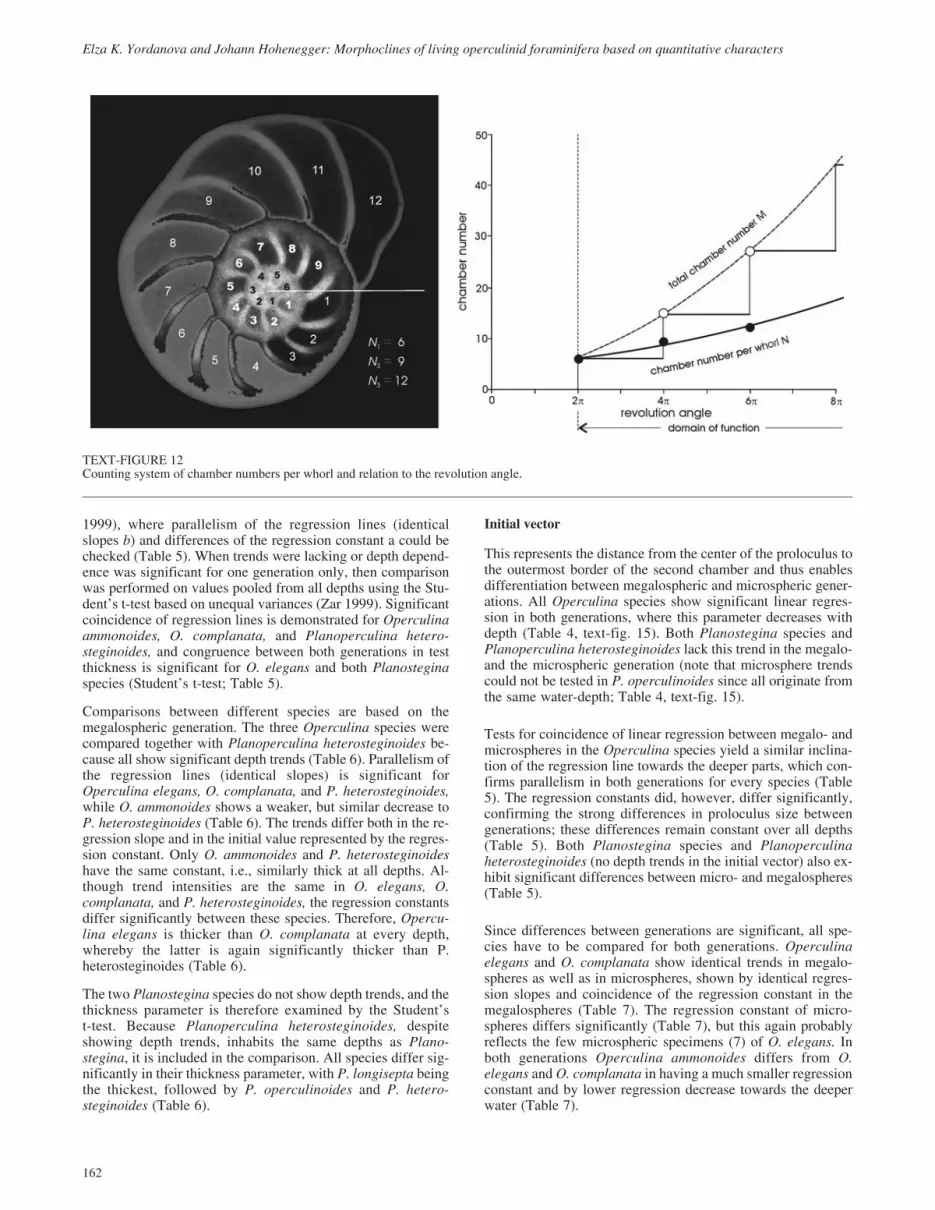
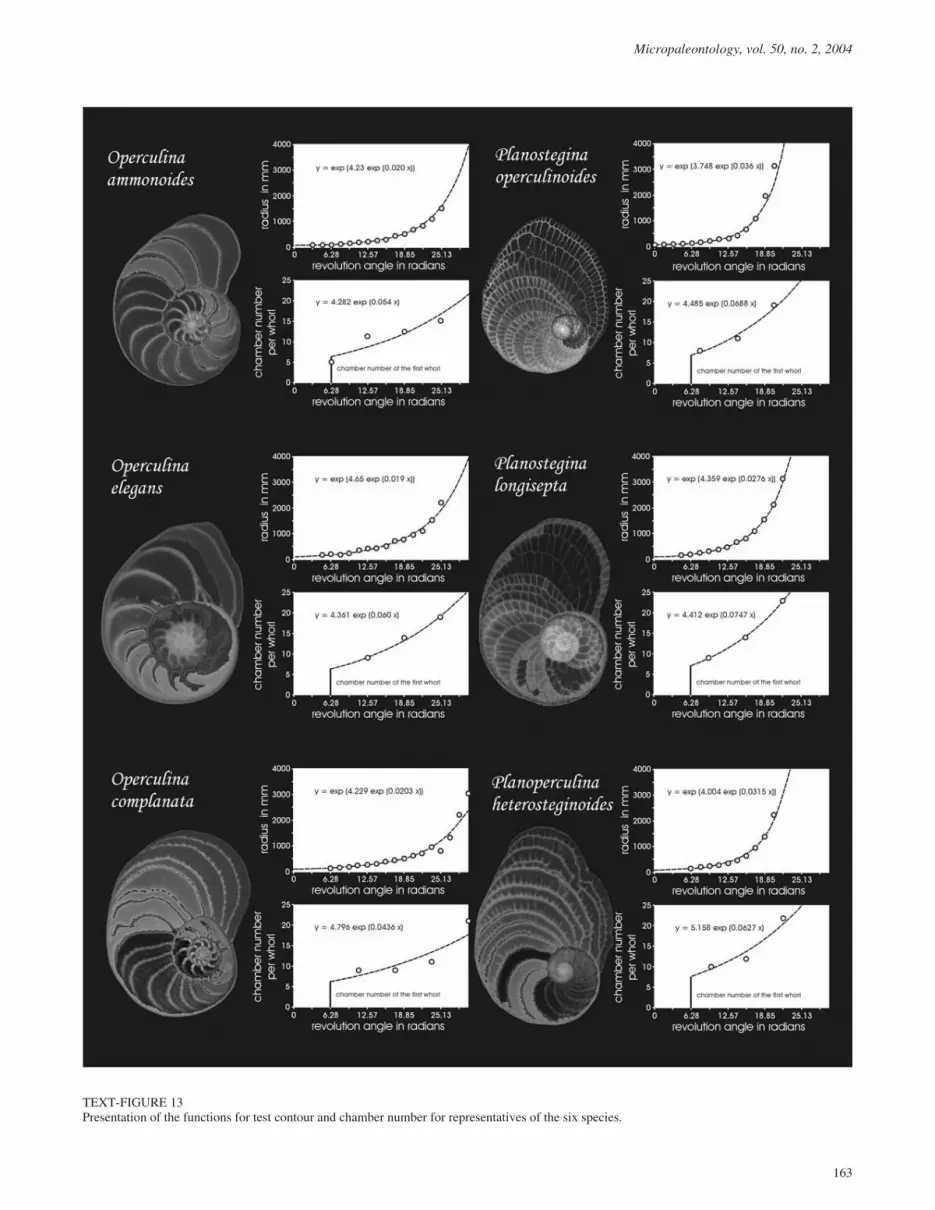
Growth functions of the test contour and chamber number perwhorl are shown for typical representatives of the six investi-gated operculinid species in text-figure 13.
GRADIENT DEPENDENCE
If different transects are taken into consideration, the coinci-dence of characters between samples possessing equal gradientvalues has to be tested along the environmental gradient (Table3). This is necessary in the investigated depth morphocline inorder to combine samples of equal depth from both transects.Statistical tests had to be performed with samples possessingrepresentative numbers (nj � 3).
Almost all characters show coincidence in the tested pairedsamples (multivariate Hotelling T2-Test; Table 3). According to
the univariate Student’s t-test, only the characters ‘test thick-ness’ and ‘radius expansion rate’ differ between a few samplesof Operculina ammonoides, O. elegans, and O. complanata(Table 3). Therefore, the hypothesis of homogeneity of samplesfrom equal water depth could be accepted and summaries ofpaired samples became representative for further statistical in-vestigation.
Each species was divided into microspheric and megalosphericgenerations and treated separately investigating the depth trendsin the test characters described above.
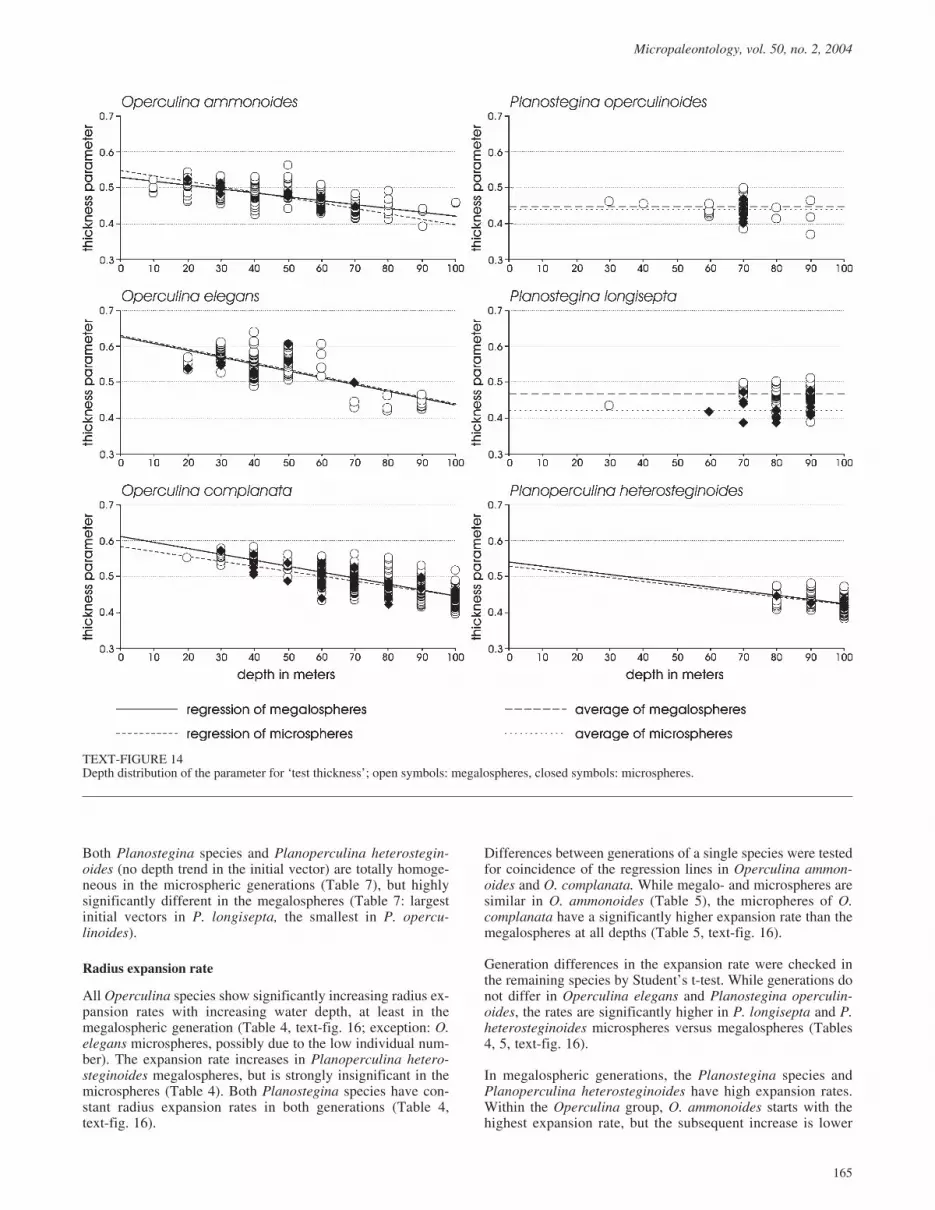
Test thickness
All megalospheric generations of the three Operculina species(O. ammonoides, O. elegans, O. complanata) show significantdepth trends, becoming flat with increasing depth (Table 4,text-fig. 14). The same trend is documented in the microsphericgenerations of O. ammonoides and O. complanata, while it isnot significant for O. elegans. This may reflect the low individ-ual number in the latter (7 specimens) and would probably be-come significant with a larger data set.
Test thickness in both Planostegina species (P. operculinoides,P. longisepta) does not change with increased water depth inmegalospheric generations (Table 4, text-fig. 14), while inPlanoperculina heterosteginoides decreasing thickness is sig-nificantly correlated with water depth for megalospheres (99specimens; Table 4, text-fig. 14), although this species is re-stricted to the deepest transect parts (> 80 m depth). In themicrospheric generations of Planostegina and Planoperculina,depth trends could only be checked for Planostegina longisepta,where enough individuals (18) were present. No significantdepth trend was observed in the microspheric generation of P.longisepta. Trend investigations of the 12 microsphericPlanostegina operculinoides are impossible because all stemfrom a single sample station at �70m. The insignificant trend intest thickness of microspheric Planoperculina heterostegin-oides in contrast to the megalospheres could again be caused bythe low individual number of microspheres (5 specimens),which rises the threshold of significance; this is supported bythe regression parameters between megalospheric andmicrospheric generations of this species, which are nearly iden-tical (Table 4, text-fig. 14) but significant for the megalospheresand insignificant for microspheres.
Differences between generations in a single species were testedby comparing regression lines using variance analyses (Zar
160
Elza K. Yordanova and Johann Hohenegger: Morphoclines of living operculinid foraminifera based on quantitative characters
TABLE 2Testing the coincidence of proloculus diameter (d0) and initial vectors of the radius expansion rate [exp(r0)] by ratio b of the equation d0 = b exp(r0). Thedeviation from identity of both characters (b0 = 1) is checked by Student’s t-test (bold numbers indicate significant differences).

161
Micropaleontology, vol. 50, no. 2, 2004
TEXT-FIGURE 11Differentiation of megalo- and microspheres using the initial vector length.
1999), where parallelism of the regression lines (identicalslopes b) and differences of the regression constant a could bechecked (Table 5). When trends were lacking or depth depend-ence was significant for one generation only, then comparisonwas performed on values pooled from all depths using the Stu-dent’s t-test based on unequal variances (Zar 1999). Significantcoincidence of regression lines is demonstrated for Operculinaammonoides, O. complanata, and Planoperculina hetero-steginoides, and congruence between both generations in testthickness is significant for O. elegans and both Planosteginaspecies (Student’s t-test; Table 5).
Comparisons between different species are based on themegalospheric generation. The three Operculina species werecompared together with Planoperculina heterosteginoides be-cause all show significant depth trends (Table 6). Parallelism ofthe regression lines (identical slopes) is significant forOperculina elegans, O. complanata, and P. heterosteginoides,while O. ammonoides shows a weaker, but similar decrease toP. heterosteginoides (Table 6). The trends differ both in the re-gression slope and in the initial value represented by the regres-sion constant. Only O. ammonoides and P. heterosteginoideshave the same constant, i.e., similarly thick at all depths. Al-though trend intensities are the same in O. elegans, O.complanata, and P. heterosteginoides, the regression constantsdiffer significantly between these species. Therefore, Opercu-lina elegans is thicker than O. complanata at every depth,whereby the latter is again significantly thicker than P.heterosteginoides (Table 6).
The two Planostegina species do not show depth trends, and thethickness parameter is therefore examined by the Student’st-test. Because Planoperculina heterosteginoides, despiteshowing depth trends, inhabits the same depths as Plano-stegina, it is included in the comparison. All species differ sig-nificantly in their thickness parameter, with P. longisepta beingthe thickest, followed by P. operculinoides and P. hetero-steginoides (Table 6).
Initial vector
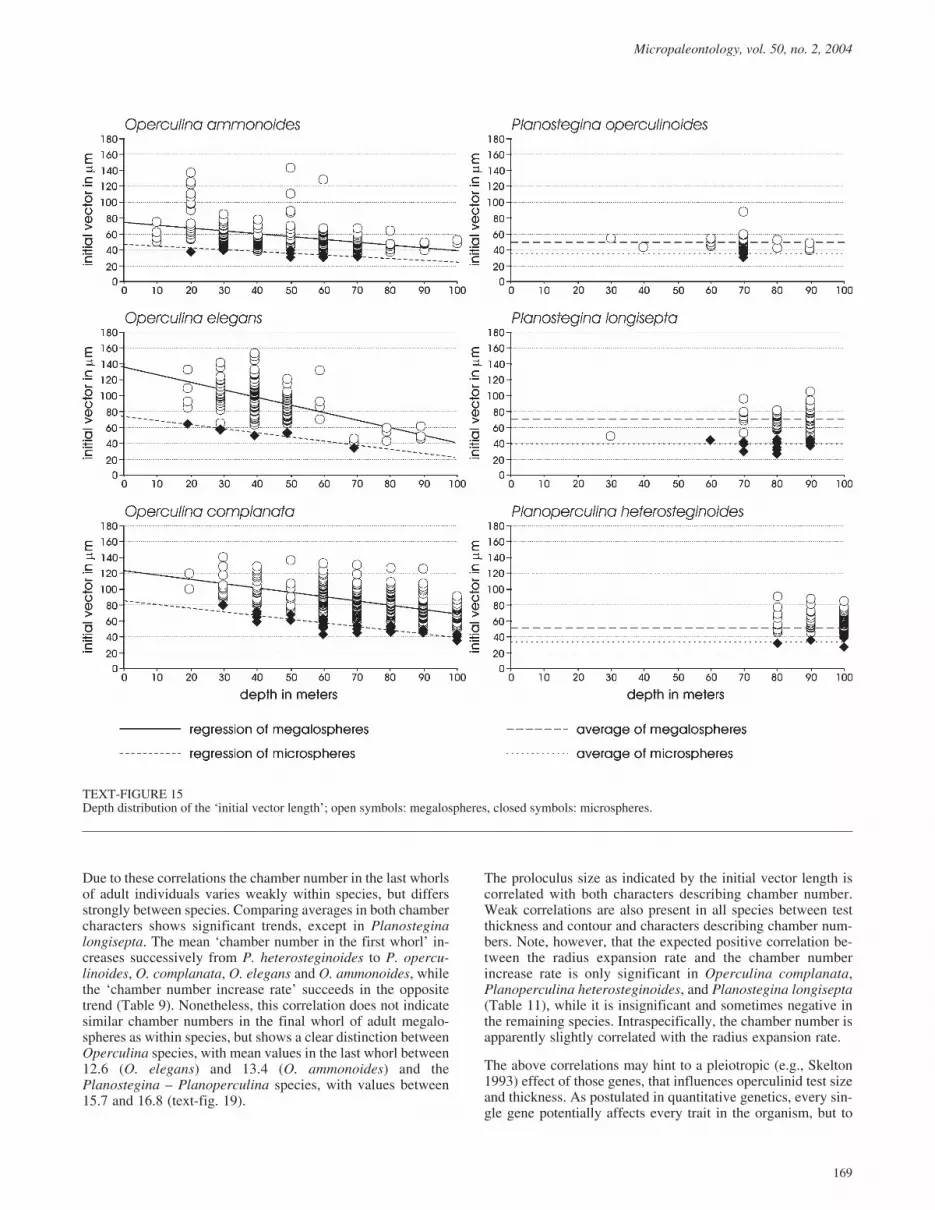
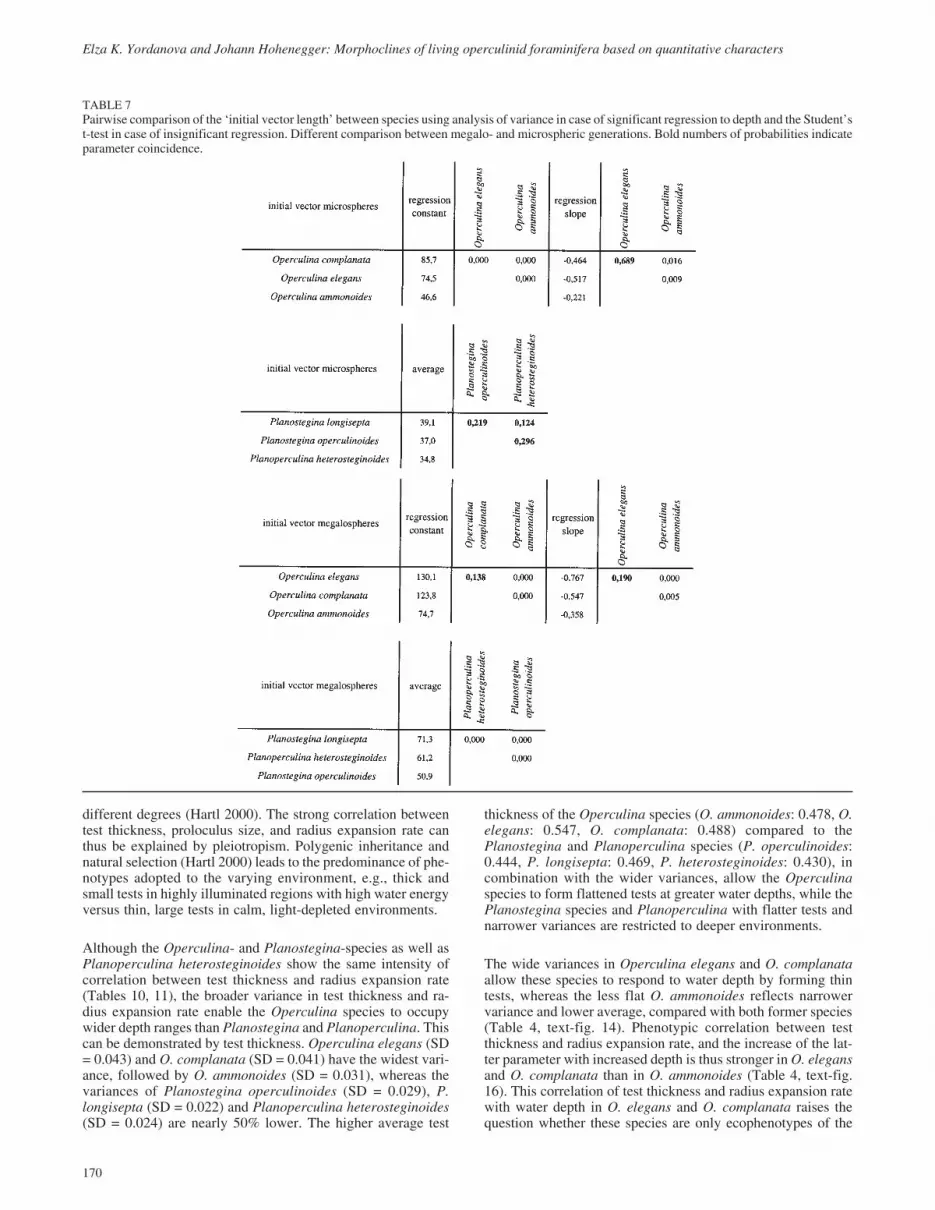
This represents the distance from the center of the proloculus tothe outermost border of the second chamber and thus enablesdifferentiation between megalospheric and microspheric gener-ations. All Operculina species show significant linear regres-sion in both generations, where this parameter decreases withdepth (Table 4, text-fig. 15). Both Planostegina species andPlanoperculina heterosteginoides lack this trend in the megalo-and the microspheric generation (note that microsphere trendscould not be tested in P. operculinoides since all originate fromthe same water-depth; Table 4, text-fig. 15).
Tests for coincidence of linear regression between megalo- andmicrospheres in the Operculina species yield a similar inclina-tion of the regression line towards the deeper parts, which con-firms parallelism in both generations for every species (Table5). The regression constants did, however, differ significantly,confirming the strong differences in proloculus size betweengenerations; these differences remain constant over all depths(Table 5). Both Planostegina species and Planoperculinaheterosteginoides (no depth trends in the initial vector) also ex-hibit significant differences between micro- and megalospheres(Table 5).
Since differences between generations are significant, all spe-cies have to be compared for both generations. Operculinaelegans and O. complanata show identical trends in megalo-spheres as well as in microspheres, shown by identical regres-sion slopes and coincidence of the regression constant in themegalospheres (Table 7). The regression constant of micro-spheres differs significantly (Table 7), but this again probablyreflects the few microspheric specimens (7) of O. elegans. Inboth generations Operculina ammonoides differs from O.elegans and O. complanata in having a much smaller regressionconstant and by lower regression decrease towards the deeperwater (Table 7).
162
Elza K. Yordanova and Johann Hohenegger: Morphoclines of living operculinid foraminifera based on quantitative characters
TEXT-FIGURE 12Counting system of chamber numbers per whorl and relation to the revolution angle.
163
Micropaleontology, vol. 50, no. 2, 2004
TEXT-FIGURE 13Presentation of the functions for test contour and chamber number for representatives of the six species.

164
Elza K. Yordanova and Johann Hohenegger: Morphoclines of living operculinid foraminifera based on quantitative characters
TABLE 3Testing the coincidence of characters at different depths between the Sesoko andMinna-Jima transect using the Student’s t-test andHotellingsT2 Test.
Both Planostegina species and Planoperculina heterostegin-oides (no depth trend in the initial vector) are totally homoge-neous in the microspheric generations (Table 7), but highlysignificantly different in the megalospheres (Table 7: largestinitial vectors in P. longisepta, the smallest in P. opercu-linoides).
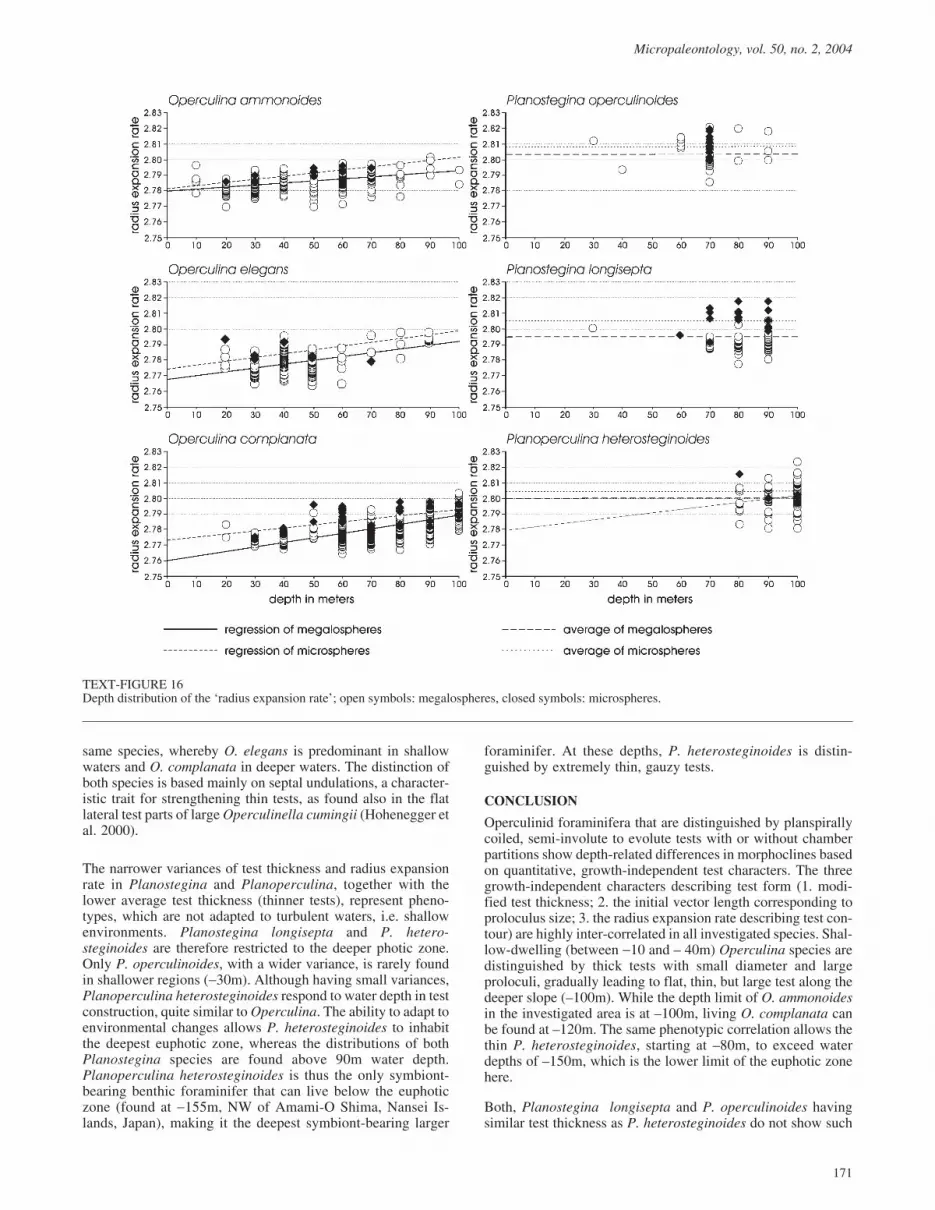
Radius expansion rate
All Operculina species show significantly increasing radius ex-pansion rates with increasing water depth, at least in themegalospheric generation (Table 4, text-fig. 16; exception: O.elegans microspheres, possibly due to the low individual num-ber). The expansion rate increases in Planoperculina hetero-steginoides megalospheres, but is strongly insignificant in themicrospheres (Table 4). Both Planostegina species have con-stant radius expansion rates in both generations (Table 4,text-fig. 16).
Differences between generations of a single species were testedfor coincidence of the regression lines in Operculina ammon-oides and O. complanata. While megalo- and microspheres aresimilar in O. ammonoides (Table 5), the micropheres of O.complanata have a significantly higher expansion rate than themegalospheres at all depths (Table 5, text-fig. 16).
Generation differences in the expansion rate were checked inthe remaining species by Student’s t-test. While generations donot differ in Operculina elegans and Planostegina operculin-oides, the rates are significantly higher in P. longisepta and P.heterosteginoides microspheres versus megalospheres (Tables4, 5, text-fig. 16).
In megalospheric generations, the Planostegina species andPlanoperculina heterosteginoides have high expansion rates.Within the Operculina group, O. ammonoides starts with thehighest expansion rate, but the subsequent increase is lower
165
Micropaleontology, vol. 50, no. 2, 2004
TEXT-FIGURE 14Depth distribution of the parameter for ‘test thickness’; open symbols: megalospheres, closed symbols: microspheres.

166
Elza K. Yordanova and Johann Hohenegger: Morphoclines of living operculinid foraminifera based on quantitative characters
TABLE 4Statistical parameters of test characters and their regression to depth. Significant regression indicated by bold numbers.

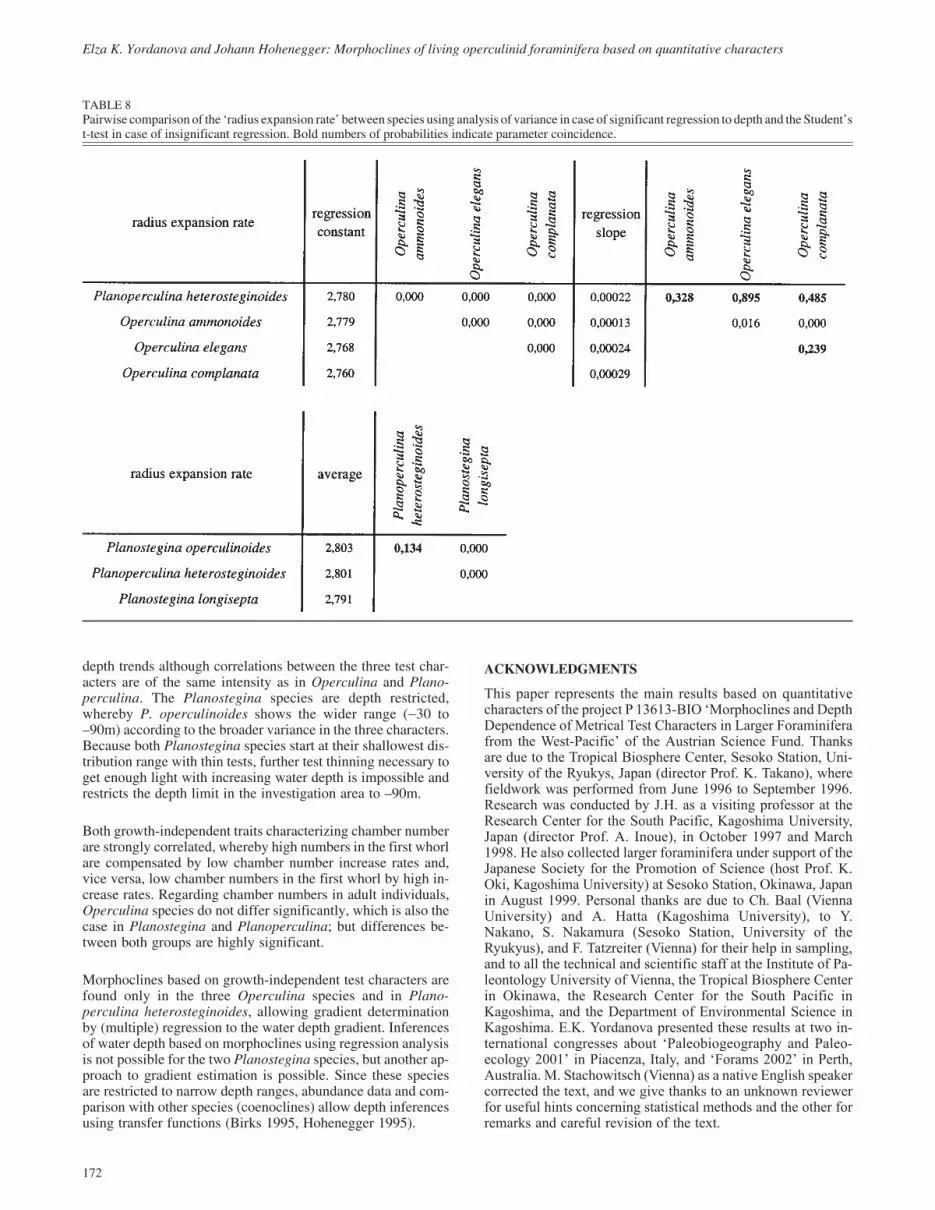
than in both other Operculina species (Table 8). Therefore, allOperculina species show similar expansion rates (~ 2,791) inthe deepest transect parts (text-fig. 16). The two Planosteginaspecies and Planoperculina heterosteginoides clearly differfrom the Operculina species by much higher expansion rates.Planostegina operculinoides and P. heterosteginoides are simi-lar, while P. longisepta has significantly lower expansion rates,but still higher than in all deep-living Operculina (Table 8,text-fig. 16).
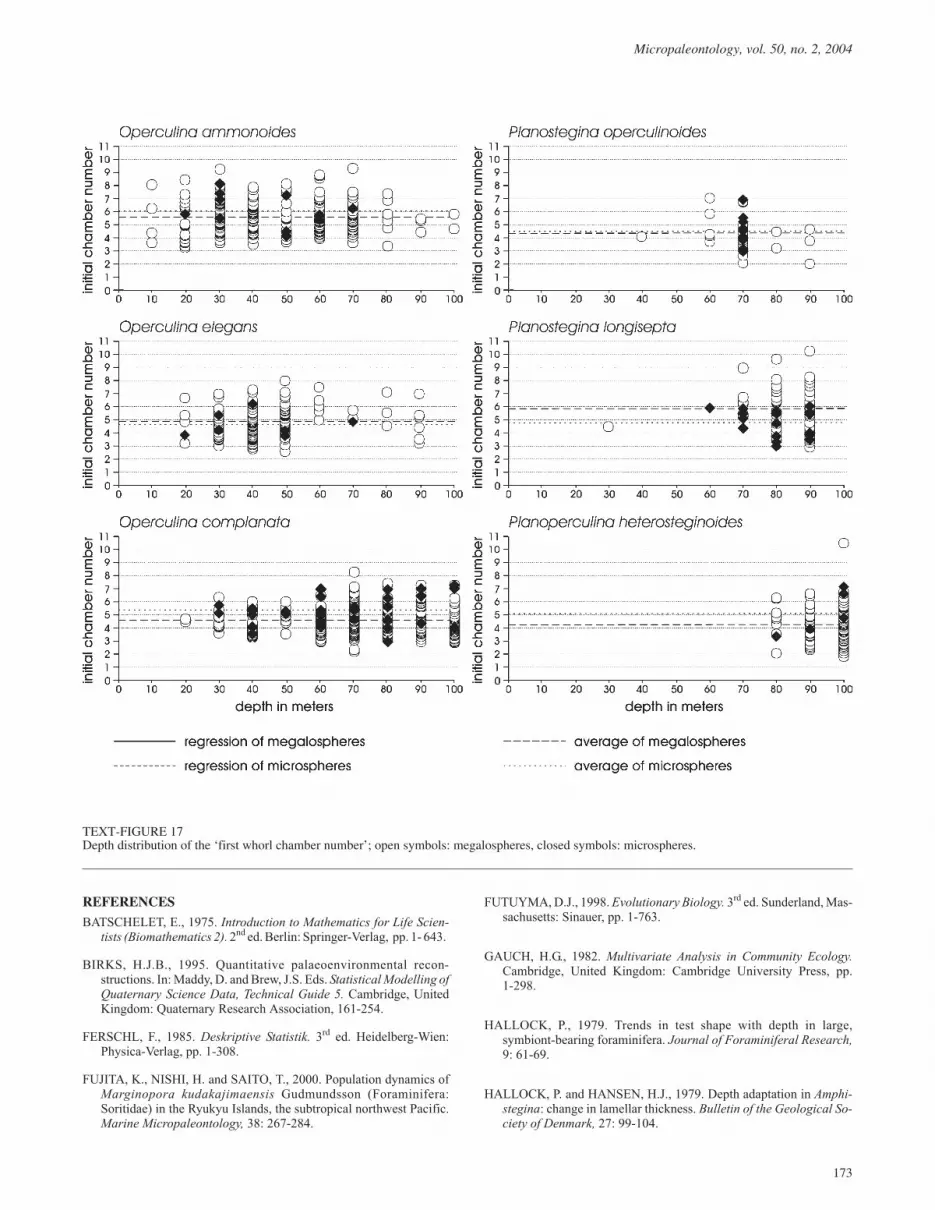
Chamber number of first whorl
This test character shows no depth trends in either Operculinaor in Planostegina and Planoperculina (Table 4, text-fig. 17).Differences between generations are only significant in O.complanata and P. longisepta (Table 5, text-fig. 17), wherebythe higher number is shown by microspheres of the former spe-cies and by megalospheres of the latter.
Comparing the megalospheric generations of all species (Stu-dent’s t-test) demonstrates coincidence of Planostegina longi-septa and Operculina ammonoides with significantly morechambers in the first whorl than the other species (Table 9).Planostegina operculinoides and Planoperculina heterostegin-oides show the fewest chambers. Operculina complanata andO. elegans are intermediate, but closer to the latter group (Table9).
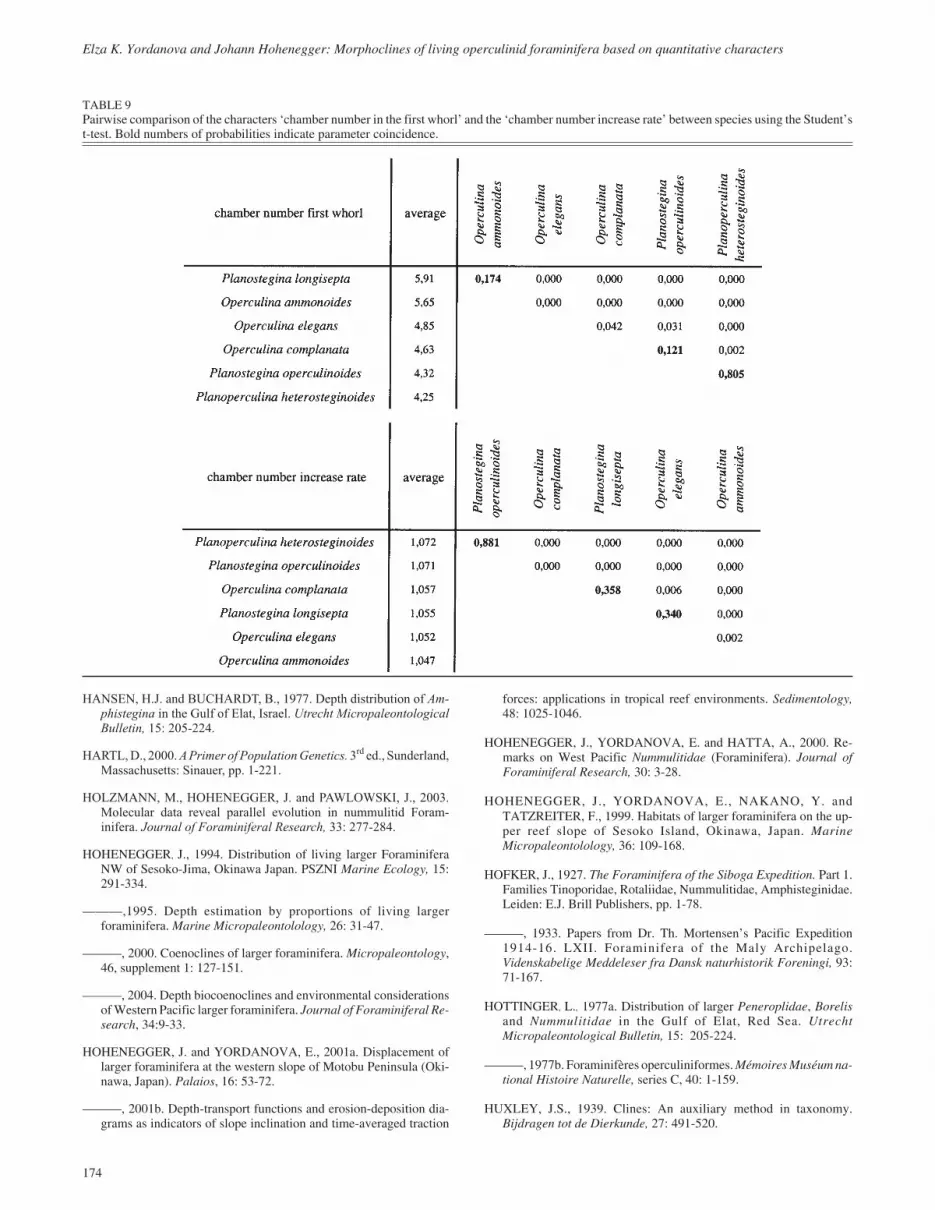
Chamber number increase rate
No significant trends in any species were detected in eithermegalospheres or microspheres (Table 4; text-fig. 18). Opercu-lina ammonoides and O. complanata show significant differ-ences between generations (Table 5), with higher rates in themegalospheres (Table 4, text-fig. 18).
Comparing the megalospheric generations of all species showsa clear coincidence of the increase rate between Planosteginaoperculinoides and Planoperculina heterosteginoides (Table9). Operculina complanata, O. elegans, and P. longisepta forma second group with nearly identical increase rates; O. ammon-oides has the lowest value (Table 9).
RELATIONS BETWEEN CHARACTERS
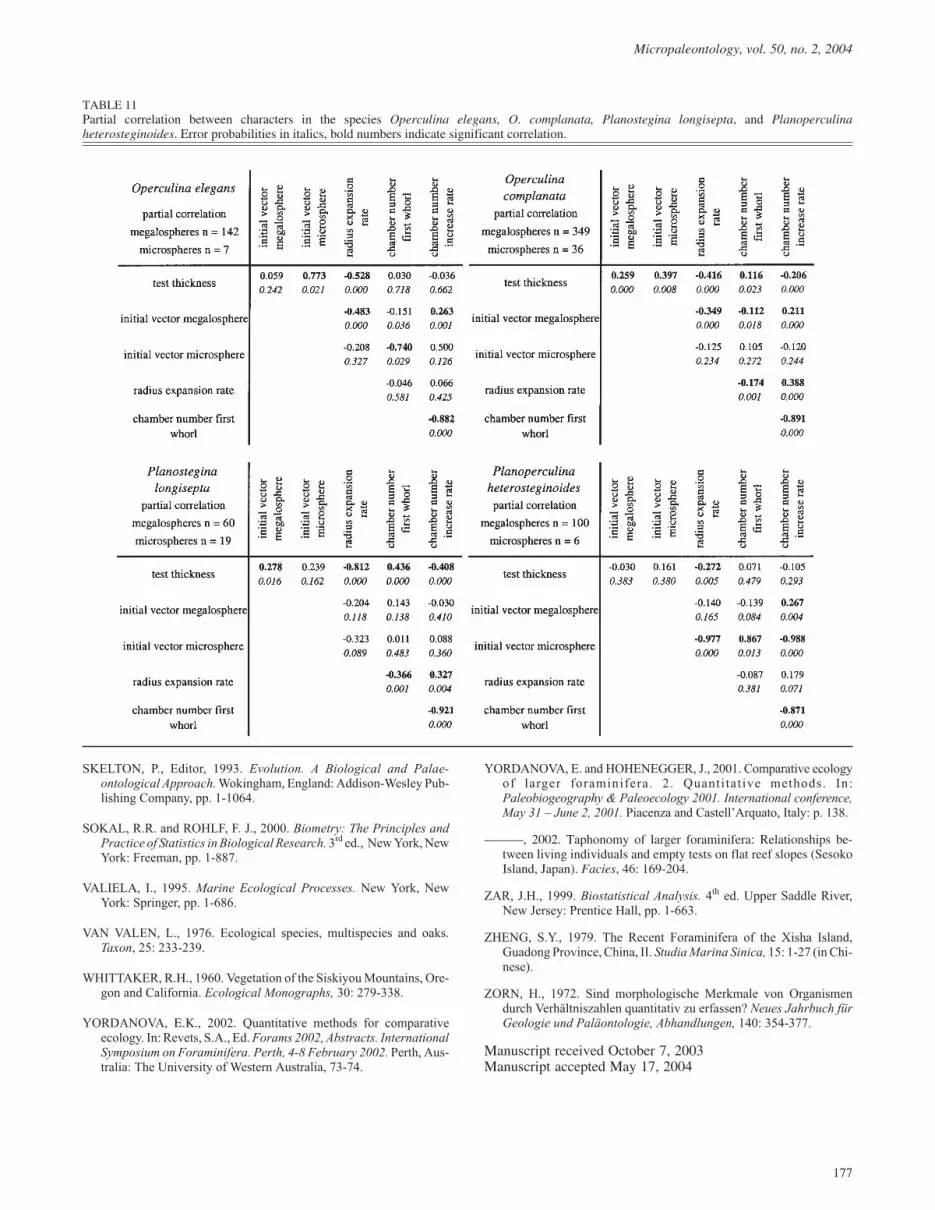
The five test characters studied above are not independent fromeach other, but related in different degrees. This can be testedfor every species by correlation analyses. Megalo- and micro-spheres differ within species only in the character ‘intital vectorlength’, and the generations are treated separately to test thecorrelation of the ‘initial vector’ with the remaining traits (Ta-bles 10, 11). Separate data sets for generations are unnecessaryfor correlation analyses between the remaining test charactersbecause these do not differ significantly within a species.
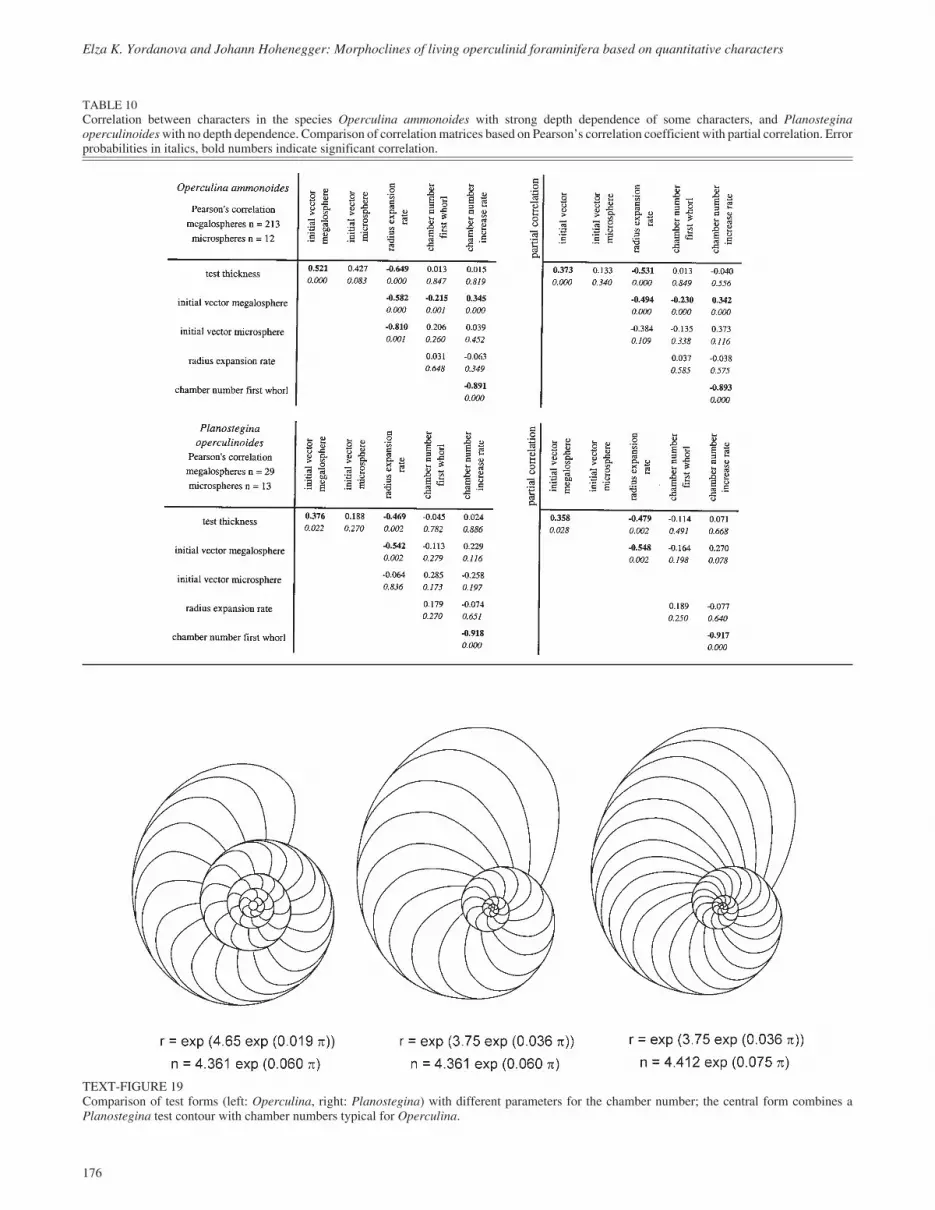
The several characters show similar trends, which may be af-fected by the relation to water depth. To eliminate this influ-ence, partial correlations (Zar 1999) were calculated instead ofthe product moment correlation. In order to demonstrate the ef-fects of excluding correlation with water depth, correlation ma-trices based on Pearson’s product moment correlation andpartial correlations are compared for two species: Operculinaammonoides shows significant depth dependence for test thick-ness, initial vector, and radius expansion rate, whereas all char-acters of Planostegina operculinoides are depth independent(Table 10). The correlations between characters that changewith depth remain significant, but with lower coefficient valuesin partial correlation, while coefficients and significance are not
affected in characters remaining unchanged with water depth(compare Planostegina operculinoides in Table 10).
In all species, correlations are significant between those charac-ters that describe a single growth function, e.g., ‘initial vectorlength’ and ‘radius expansion rate’ (negatively correlated) de-scribing the test contour, and ‘chamber number of the firstwhorl’, which is always highly-negatively correlated with the‘chamber number increase rate’ (Tables 10, 11), both describingthe chamber number. Such correlations are not surprising be-cause they reflect relations such as the larger the initial vector,the less intensive is the radius expansion rate. Similarly, themore chambers there are in the first whorl effects a lower in-crease in chamber numbers and vice versa.
While correlations are highly significant of the parameters de-scribing test contour on the one hand and chamber number onthe other, correlations between those two character groups areweak. Only the ‘initial vector’ shows higher - except in themicrospheric Planostegina longisepta (Table 11) – and some-times significantly negative correlations with the ‘chambernumber of the first whorl’ and a positive correlation with the‘chamber number increase rate’ in both generations (Tables 10,11). A smaller proloculus is thus correlated with more chambersin the first whorl and a lower increase in chamber number dur-ing growth in both generations; conversely, a larger proloculusis correlated with fewer chambers in the first whorl, combinedwith an increased chamber number in later whorls.
The most important, significant negative correlation is betweentest thickness and radius expansion rate, which applies to all
167
Micropaleontology, vol. 50, no. 2, 2004
TABLE 5Comparison of test characters between megalo- and micropheric genera-tions using analysis of variance in case of significant regression to depthand the Student’s t-test in case of insignificant regression.
species (Tables 10, 11). This means that the thicker the tests, thesmaller the test diameter, as reflected by lower radius expansionrates.
DISCUSSION
Based on morphometrics, the five investigated, growth-independent test characters are inter-correlated in all opercu-linid foraminifera, but to different degrees. These correlationsdo not depend on water depth, which represents a compositefactor of the single factors light and water movement. Waterdepth is the most important environmental factor affecting thedistribution of symbiont-bearing benthic foraminifera. By ex-cluding depth influence, partial correlations between the inves-tigated morphological characters confirm their importance as‘Bauplan’ constructions reflecting inter-correlations betweengenes.
Proloculus size, represented by the initial vector length, is nega-tively correlated with the test contour expansion rate in all spe-cies. Tight coiling is thus combined with large proloculi, eitherin megalo- or microspheres, while smaller proloculi in bothgenerations are correlated with loosely coiled spirals, resultingin larger test size diameter although cell volumes are identical.Expansion rates are always higher in the microspheric genera-tions (Operculina ammonoides, O. elegans, Planosteginaoperculinoides) and highly significant for the second group(Operculina complanata, P. longisepta, Planoperculinaheterosteginoides; Tables 4, 5). Test sizes differ strongly be-tween generations in all nummulitid foraminifera, wheremicrospheres or agamonts have longer life spans than themegalospheres (gamonts or schizonts) under continuouslyslower rates in chamber forming (Röttger 1972). Moreover,
those size differences correlates with higher radius expansionrates in agamonts, leading to loosely coiled spirals of the adult.
Test thickness and the expansion rate of the test were signifi-cantly negatively correlated in all investigated species (Tables10, 11). Thus, thicker tests and low expansion rates result insmaller test diameter, while higher expansion rates and thinnertests result in larger test diameter, although cell volumes remainidentical. This correlation expresses the functional relationshipbetween test thickness and diameter. Foraminifera with thickand smaller test diameter get enough light in highly illuminatedshallow areas, where they have to resist high water energy,while low light intensities at greater depths are compensated bythin tests with large surfaces. In deeper habitats, large sur-face/volume ratios are crucial for housing abundant symbioticmicroalgae in light-depleted environments (Hohenegger 2004).
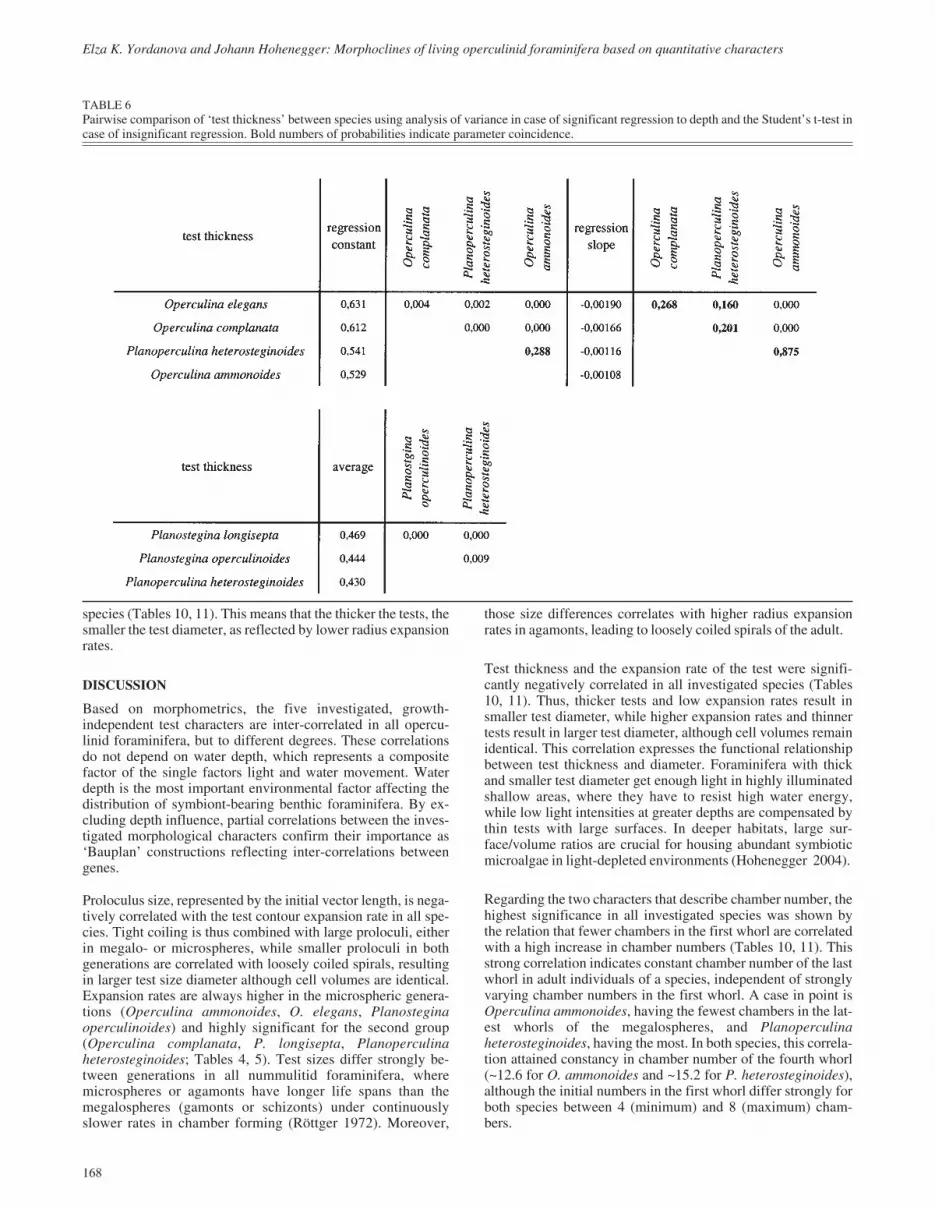
Regarding the two characters that describe chamber number, thehighest significance in all investigated species was shown bythe relation that fewer chambers in the first whorl are correlatedwith a high increase in chamber numbers (Tables 10, 11). Thisstrong correlation indicates constant chamber number of the lastwhorl in adult individuals of a species, independent of stronglyvarying chamber numbers in the first whorl. A case in point isOperculina ammonoides, having the fewest chambers in the lat-est whorls of the megalospheres, and Planoperculinaheterosteginoides, having the most. In both species, this correla-tion attained constancy in chamber number of the fourth whorl(~12.6 for O. ammonoides and ~15.2 for P. heterosteginoides),although the initial numbers in the first whorl differ strongly forboth species between 4 (minimum) and 8 (maximum) cham-bers.
168
Elza K. Yordanova and Johann Hohenegger: Morphoclines of living operculinid foraminifera based on quantitative characters
TABLE 6Pairwise comparison of ‘test thickness’ between species using analysis of variance in case of significant regression to depth and the Student’s t-test incase of insignificant regression. Bold numbers of probabilities indicate parameter coincidence.
Due to these correlations the chamber number in the last whorlsof adult individuals varies weakly within species, but differsstrongly between species. Comparing averages in both chambercharacters shows significant trends, except in Planosteginalongisepta. The mean ‘chamber number in the first whorl’ in-creases successively from P. heterosteginoides to P. opercu-linoides, O. complanata, O. elegans and O. ammonoides, whilethe ‘chamber number increase rate’ succeeds in the oppositetrend (Table 9). Nonetheless, this correlation does not indicatesimilar chamber numbers in the final whorl of adult megalo-spheres as within species, but shows a clear distinction betweenOperculina species, with mean values in the last whorl between12.6 (O. elegans) and 13.4 (O. ammonoides) and thePlanostegina – Planoperculina species, with values between15.7 and 16.8 (text-fig. 19).
The proloculus size as indicated by the initial vector length iscorrelated with both characters describing chamber number.Weak correlations are also present in all species between testthickness and contour and characters describing chamber num-bers. Note, however, that the expected positive correlation be-tween the radius expansion rate and the chamber numberincrease rate is only significant in Operculina complanata,Planoperculina heterosteginoides, and Planostegina longisepta(Table 11), while it is insignificant and sometimes negative inthe remaining species. Intraspecifically, the chamber number isapparently slightly correlated with the radius expansion rate.
The above correlations may hint to a pleiotropic (e.g., Skelton1993) effect of those genes, that influences operculinid test sizeand thickness. As postulated in quantitative genetics, every sin-gle gene potentially affects every trait in the organism, but to
169
Micropaleontology, vol. 50, no. 2, 2004
TEXT-FIGURE 15Depth distribution of the ‘initial vector length’; open symbols: megalospheres, closed symbols: microspheres.
different degrees (Hartl 2000). The strong correlation betweentest thickness, proloculus size, and radius expansion rate canthus be explained by pleiotropism. Polygenic inheritance andnatural selection (Hartl 2000) leads to the predominance of phe-notypes adopted to the varying environment, e.g., thick andsmall tests in highly illuminated regions with high water energyversus thin, large tests in calm, light-depleted environments.
Although the Operculina- and Planostegina-species as well asPlanoperculina heterosteginoides show the same intensity ofcorrelation between test thickness and radius expansion rate(Tables 10, 11), the broader variance in test thickness and ra-dius expansion rate enable the Operculina species to occupywider depth ranges than Planostegina and Planoperculina. Thiscan be demonstrated by test thickness. Operculina elegans (SD= 0.043) and O. complanata (SD = 0.041) have the widest vari-ance, followed by O. ammonoides (SD = 0.031), whereas thevariances of Planostegina operculinoides (SD = 0.029), P.longisepta (SD = 0.022) and Planoperculina heterosteginoides(SD = 0.024) are nearly 50% lower. The higher average test
thickness of the Operculina species (O. ammonoides: 0.478, O.elegans: 0.547, O. complanata: 0.488) compared to thePlanostegina and Planoperculina species (P. operculinoides:0.444, P. longisepta: 0.469, P. heterosteginoides: 0.430), incombination with the wider variances, allow the Operculinaspecies to form flattened tests at greater water depths, while thePlanostegina species and Planoperculina with flatter tests andnarrower variances are restricted to deeper environments.
The wide variances in Operculina elegans and O. complanataallow these species to respond to water depth by forming thintests, whereas the less flat O. ammonoides reflects narrowervariance and lower average, compared with both former species(Table 4, text-fig. 14). Phenotypic correlation between testthickness and radius expansion rate, and the increase of the lat-ter parameter with increased depth is thus stronger in O. elegansand O. complanata than in O. ammonoides (Table 4, text-fig.16). This correlation of test thickness and radius expansion ratewith water depth in O. elegans and O. complanata raises thequestion whether these species are only ecophenotypes of the
170
Elza K. Yordanova and Johann Hohenegger: Morphoclines of living operculinid foraminifera based on quantitative characters
TABLE 7Pairwise comparison of the ‘initial vector length’ between species using analysis of variance in case of significant regression to depth and the Student’st-test in case of insignificant regression. Different comparison between megalo- and microspheric generations. Bold numbers of probabilities indicateparameter coincidence.
same species, whereby O. elegans is predominant in shallowwaters and O. complanata in deeper waters. The distinction ofboth species is based mainly on septal undulations, a character-istic trait for strengthening thin tests, as found also in the flatlateral test parts of large Operculinella cumingii (Hohenegger etal. 2000).
The narrower variances of test thickness and radius expansionrate in Planostegina and Planoperculina, together with thelower average test thickness (thinner tests), represent pheno-types, which are not adapted to turbulent waters, i.e. shallowenvironments. Planostegina longisepta and P. hetero-steginoides are therefore restricted to the deeper photic zone.Only P. operculinoides, with a wider variance, is rarely foundin shallower regions (�30m). Although having small variances,Planoperculina heterosteginoides respond to water depth in testconstruction, quite similar to Operculina. The ability to adapt toenvironmental changes allows P. heterosteginoides to inhabitthe deepest euphotic zone, whereas the distributions of bothPlanostegina species are found above 90m water depth.Planoperculina heterosteginoides is thus the only symbiont-bearing benthic foraminifer that can live below the euphoticzone (found at �155m, NW of Amami-O Shima, Nansei Is-lands, Japan), making it the deepest symbiont-bearing larger
foraminifer. At these depths, P. heterosteginoides is distin-guished by extremely thin, gauzy tests.
CONCLUSION
Operculinid foraminifera that are distinguished by planspirallycoiled, semi-involute to evolute tests with or without chamberpartitions show depth-related differences in morphoclines basedon quantitative, growth-independent test characters. The threegrowth-independent characters describing test form (1. modi-fied test thickness; 2. the initial vector length corresponding toproloculus size; 3. the radius expansion rate describing test con-tour) are highly inter-correlated in all investigated species. Shal-low-dwelling (between �10 and – 40m) Operculina species aredistinguished by thick tests with small diameter and largeproloculi, gradually leading to flat, thin, but large test along thedeeper slope (–100m). While the depth limit of O. ammonoidesin the investigated area is at –100m, living O. complanata canbe found at –120m. The same phenotypic correlation allows thethin P. heterosteginoides, starting at –80m, to exceed waterdepths of –150m, which is the lower limit of the euphotic zonehere.
Both, Planostegina longisepta and P. operculinoides havingsimilar test thickness as P. heterosteginoides do not show such
171
Micropaleontology, vol. 50, no. 2, 2004
TEXT-FIGURE 16Depth distribution of the ‘radius expansion rate’; open symbols: megalospheres, closed symbols: microspheres.
depth trends although correlations between the three test char-acters are of the same intensity as in Operculina and Plano-perculina. The Planostegina species are depth restricted,whereby P. operculinoides shows the wider range (�30 to–90m) according to the broader variance in the three characters.Because both Planostegina species start at their shallowest dis-tribution range with thin tests, further test thinning necessary toget enough light with increasing water depth is impossible andrestricts the depth limit in the investigation area to –90m.
Both growth-independent traits characterizing chamber numberare strongly correlated, whereby high numbers in the first whorlare compensated by low chamber number increase rates and,vice versa, low chamber numbers in the first whorl by high in-crease rates. Regarding chamber numbers in adult individuals,Operculina species do not differ significantly, which is also thecase in Planostegina and Planoperculina; but differences be-tween both groups are highly significant.
Morphoclines based on growth-independent test characters arefound only in the three Operculina species and in Plano-perculina heterosteginoides, allowing gradient determinationby (multiple) regression to the water depth gradient. Inferencesof water depth based on morphoclines using regression analysisis not possible for the two Planostegina species, but another ap-proach to gradient estimation is possible. Since these speciesare restricted to narrow depth ranges, abundance data and com-parison with other species (coenoclines) allow depth inferencesusing transfer functions (Birks 1995, Hohenegger 1995).
ACKNOWLEDGMENTS
This paper represents the main results based on quantitativecharacters of the project P 13613-BIO ‘Morphoclines and DepthDependence of Metrical Test Characters in Larger Foraminiferafrom the West-Pacific’ of the Austrian Science Fund. Thanksare due to the Tropical Biosphere Center, Sesoko Station, Uni-versity of the Ryukys, Japan (director Prof. K. Takano), wherefieldwork was performed from June 1996 to September 1996.Research was conducted by J.H. as a visiting professor at theResearch Center for the South Pacific, Kagoshima University,Japan (director Prof. A. Inoue), in October 1997 and March1998. He also collected larger foraminifera under support of theJapanese Society for the Promotion of Science (host Prof. K.Oki, Kagoshima University) at Sesoko Station, Okinawa, Japanin August 1999. Personal thanks are due to Ch. Baal (ViennaUniversity) and A. Hatta (Kagoshima University), to Y.Nakano, S. Nakamura (Sesoko Station, University of theRyukyus), and F. Tatzreiter (Vienna) for their help in sampling,and to all the technical and scientific staff at the Institute of Pa-leontology University of Vienna, the Tropical Biosphere Centerin Okinawa, the Research Center for the South Pacific inKagoshima, and the Department of Environmental Science inKagoshima. E.K. Yordanova presented these results at two in-ternational congresses about ‘Paleobiogeography and Paleo-ecology 2001’ in Piacenza, Italy, and ‘Forams 2002’ in Perth,Australia. M. Stachowitsch (Vienna) as a native English speakercorrected the text, and we give thanks to an unknown reviewerfor useful hints concerning statistical methods and the other forremarks and careful revision of the text.
172
Elza K. Yordanova and Johann Hohenegger: Morphoclines of living operculinid foraminifera based on quantitative characters
TABLE 8Pairwise comparison of the ‘radius expansion rate’ between species using analysis of variance in case of significant regression to depth and the Student’st-test in case of insignificant regression. Bold numbers of probabilities indicate parameter coincidence.
REFERENCES
BATSCHELET, E., 1975. Introduction to Mathematics for Life Scien-tists (Biomathematics 2). 2nd ed. Berlin: Springer-Verlag, pp. 1- 643.
BIRKS, H.J.B., 1995. Quantitative palaeoenvironmental recon-structions. In: Maddy, D. and Brew, J.S. Eds. Statistical Modelling ofQuaternary Science Data, Technical Guide 5. Cambridge, UnitedKingdom: Quaternary Research Association, 161-254.
FERSCHL, F., 1985. Deskriptive Statistik. 3rd ed. Heidelberg-Wien:Physica-Verlag, pp. 1-308.
FUJITA, K., NISHI, H. and SAITO, T., 2000. Population dynamics ofMarginopora kudakajimaensis Gudmundsson (Foraminifera:Soritidae) in the Ryukyu Islands, the subtropical northwest Pacific.Marine Micropaleontology, 38: 267-284.
FUTUYMA, D.J., 1998. Evolutionary Biology. 3rd ed. Sunderland, Mas-sachusetts: Sinauer, pp. 1-763.
GAUCH, H.G., 1982. Multivariate Analysis in Community Ecology.Cambridge, United Kingdom: Cambridge University Press, pp.1-298.
HALLOCK, P., 1979. Trends in test shape with depth in large,symbiont-bearing foraminifera. Journal of Foraminiferal Research,9: 61-69.
HALLOCK, P. and HANSEN, H.J., 1979. Depth adaptation in Amphi-stegina: change in lamellar thickness. Bulletin of the Geological So-ciety of Denmark, 27: 99-104.
173
Micropaleontology, vol. 50, no. 2, 2004
TEXT-FIGURE 17Depth distribution of the ‘first whorl chamber number’; open symbols: megalospheres, closed symbols: microspheres.
HANSEN, H.J. and BUCHARDT, B., 1977. Depth distribution of Am-phistegina in the Gulf of Elat, Israel. Utrecht MicropaleontologicalBulletin, 15: 205-224.
HARTL, D., 2000. A Primer of Population Genetics. 3rd ed., Sunderland,Massachusetts: Sinauer, pp. 1-221.
HOLZMANN, M., HOHENEGGER, J. and PAWLOWSKI, J., 2003.Molecular data reveal parallel evolution in nummulitid Foram-inifera. Journal of Foraminiferal Research, 33: 277-284.
HOHENEGGER, J., 1994. Distribution of living larger ForaminiferaNW of Sesoko-Jima, Okinawa Japan. PSZNI Marine Ecology, 15:291-334.
———,1995. Depth estimation by proportions of living largerforaminifera. Marine Micropaleontolology, 26: 31-47.
———, 2000. Coenoclines of larger foraminifera. Micropaleontology,46, supplement 1: 127-151.
———, 2004. Depth biocoenoclines and environmental considerationsof Western Pacific larger foraminifera. Journal of Foraminiferal Re-search, 34:9-33.
HOHENEGGER, J. and YORDANOVA, E., 2001a. Displacement oflarger foraminifera at the western slope of Motobu Peninsula (Oki-nawa, Japan). Palaios, 16: 53-72.
———, 2001b. Depth-transport functions and erosion-deposition dia-grams as indicators of slope inclination and time-averaged traction
forces: applications in tropical reef environments. Sedimentology,48: 1025-1046.
HOHENEGGER, J., YORDANOVA, E. and HATTA, A., 2000. Re-marks on West Pacific Nummulitidae (Foraminifera). Journal ofForaminiferal Research, 30: 3-28.
HOHENEGGER, J., YORDANOVA, E., NAKANO, Y. andTATZREITER, F., 1999. Habitats of larger foraminifera on the up-per reef slope of Sesoko Island, Okinawa, Japan. MarineMicropaleontolology, 36: 109-168.
HOFKER, J., 1927. The Foraminifera of the Siboga Expedition. Part 1.Families Tinoporidae, Rotaliidae, Nummulitidae, Amphisteginidae.Leiden: E.J. Brill Publishers, pp. 1-78.
———, 1933. Papers from Dr. Th. Mortensen’s Pacific Expedition1914-16. LXII. Foraminifera of the Maly Archipelago.Videnskabelige Meddeleser fra Dansk naturhistorik Foreningi, 93:71-167.
HOTTINGER, L., 1977a. Distribution of larger Peneroplidae, Borelisand Nummulitidae in the Gulf of Elat, Red Sea. UtrechtMicropaleontological Bulletin, 15: 205-224.
———,1977b. Foraminifères operculiniformes.MémoiresMuséumna-tional Histoire Naturelle, series C, 40: 1-159.
HUXLEY, J.S., 1939. Clines: An auxiliary method in taxonomy.Bijdragen tot de Dierkunde, 27: 491-520.
174
Elza K. Yordanova and Johann Hohenegger: Morphoclines of living operculinid foraminifera based on quantitative characters
TABLE 9Pairwise comparison of the characters ‘chamber number in the first whorl’ and the ‘chamber number increase rate’ between species using the Student’st-test. Bold numbers of probabilities indicate parameter coincidence.

KANT, R., 1977. Die Integrationskonstante im allometrischenWachstum, eine konstruktionsmorphologische Analyse unterbesonderer Berücksichtigung des Ammonoideen-Gehäuses. NeuesJahrbuch für Geologie und Paläontologie, Abhandlungen, 154:263-289.
LARSEN, A.R., and DROOGER, C.W., 1977. Relative thickness of thetest in the Amphistegina species of the Gulf of Elat. UtrechtMicropaleontological Bulletin, 15: 225-239.
LEVINTON J.S., 2001. Genetics, Paleontology, and Macroevolution.2nd ed.. Cambridge, United Kingdom: Cambridge University Press,pp. 1-617.
MAYR, E., 1963. Animal Species and Evolution. Cambridge, Massa-chusetts: Harvard University Press, pp. 1-617.
MEDGYESSY, P., 1977. Decomposition of Superpositions of DensityFunctions and Discrete Distributions. Hilger, Bristol, UK, pp. 1-308.
PECHEUX,M.J.-F., 1995. Ecomorphology of a recent large foraminifer,Operculina ammonoides. Geobios, 28: 529-566.
RAUP, D.M., 1966. Geometric analysis of shell coiling: general prob-lems. Journal of Paleontology, 40: 1178-1190.
RAUP, D.M. and STANLEY, S.M., 1978. Principles of Paleontology.2nd ed. New York, New York: Freeman, pp. 1-481.
RÖTTGER, R., 1972. Analyse von Wachstumskurven von Hetero-stegina depressa (Foraminiferen: Nummilitidae). Marine Biology,17: 228-242.
RÖTTGER,R. andHALLOCK, P., 1982. Shape trends inHeterosteginadepressa (Protozoa, Foraminiferida). Journal of Foraminiferal Re-search, 12: 197-204.
SIMPSON, G.G., 1961. Principles of Animal Taxonomy. New York, NewYork: Columbia University Press, pp. 1-247.
175
Micropaleontology, vol. 50, no. 2, 2004
TEXT-FIGURE 18Depth distribution of the ‘chamber number increase rate’; open symbols: megalospheres, closed symbols: microspheres.
176
Elza K. Yordanova and Johann Hohenegger: Morphoclines of living operculinid foraminifera based on quantitative characters
TABLE 10Correlation between characters in the species Operculina ammonoides with strong depth dependence of some characters, and Planosteginaoperculinoides with no depth dependence. Comparison of correlation matrices based on Pearson’s correlation coefficient with partial correlation. Errorprobabilities in italics, bold numbers indicate significant correlation.
TEXT-FIGURE 19Comparison of test forms (left: Operculina, right: Planostegina) with different parameters for the chamber number; the central form combines aPlanostegina test contour with chamber numbers typical for Operculina.
SKELTON, P., Editor, 1993. Evolution. A Biological and Palae-ontological Approach. Wokingham, England: Addison-Wesley Pub-lishing Company, pp. 1-1064.
SOKAL, R.R. and ROHLF, F. J., 2000. Biometry: The Principles andPractice of Statistics in Biological Research. 3rd ed., New York, NewYork: Freeman, pp. 1-887.
VALIELA, I., 1995. Marine Ecological Processes. New York, NewYork: Springer, pp. 1-686.
VAN VALEN, L., 1976. Ecological species, multispecies and oaks.Taxon, 25: 233-239.
WHITTAKER, R.H., 1960. Vegetation of the Siskiyou Mountains, Ore-gon and California. Ecological Monographs, 30: 279-338.
YORDANOVA, E.K., 2002. Quantitative methods for comparativeecology. In: Revets, S.A., Ed. Forams 2002, Abstracts. InternationalSymposium on Foraminifera. Perth, 4-8 February 2002. Perth, Aus-tralia: The University of Western Australia, 73-74.
YORDANOVA, E. and HOHENEGGER, J., 2001. Comparative ecologyof larger foraminifera. 2. Quantitative methods. In:Paleobiogeography & Paleoecology 2001. International conference,May 31 – June 2, 2001. Piacenza and Castell’Arquato, Italy: p. 138.
———, 2002. Taphonomy of larger foraminifera: Relationships be-tween living individuals and empty tests on flat reef slopes (SesokoIsland, Japan). Facies, 46: 169-204.
ZAR, J.H., 1999. Biostatistical Analysis. 4th ed. Upper Saddle River,New Jersey: Prentice Hall, pp. 1-663.
ZHENG, S.Y., 1979. The Recent Foraminifera of the Xisha Island,Guadong Province, China, II. Studia Marina Sinica, 15: 1-27 (in Chi-nese).
ZORN, H., 1972. Sind morphologische Merkmale von Organismendurch Verhältniszahlen quantitativ zu erfassen? Neues Jahrbuch fürGeologie und Paläontologie, Abhandlungen, 140: 354-377.
Manuscript received October 7, 2003Manuscript accepted May 17, 2004
177
Micropaleontology, vol. 50, no. 2, 2004
TABLE 11Partial correlation between characters in the species Operculina elegans, O. complanata, Planostegina longisepta, and Planoperculinaheterosteginoides. Error probabilities in italics, bold numbers indicate significant correlation.

178