Protocol on Pollutant Release and Transfer Registers CM 7897
Upload
independentCategory
view
3download
0
Seasonal change of persistent organic pollutantconcentrations in air at Niigata area, Japan
Hitoshi Murayama a,*, Yuuya Takase b, Hideko Mitobe a, Hiroyuki Mukai a,Toshiharu Ohzeki a, Ken-ichi Shimizu b, Yoshie Kitayama c
a Niigata Prefectural Institute of Public Health and Environmental Sciences, 314-1 Sowa, Niigata, 950-2144, Japanb Niigata Graduate School of Natural Scientific Studies, Niigata University, 8050 Ikarashi-2-nocho, Niigata, 950-2181, Japan
c Department of Chemistry and Chemical Engineering, Faculty of Engineering, Niigata University,
8050 Ikarashi-2-nocho, Niigata, 950-2181, Japan
Received 4 September 2002; received in revised form 3 January 2003; accepted 20 January 2003
Abstract
The concentrations of persistent organic pollutants (POPs), such as HCB, a-, b-, c- and d-HCH, trans- and cis-
chlordane (t-CHL, c-CHL), DDE, DDD and DDT, in ambient air have been measured at five sampling points in
Niigata area, Japan (Niigata, Maki, Tsubame, Jouzo and Yahiko) during the period from September 1999 to Nov-
ember 2001. HCB, a-HCH, t-CHL and c-CHL showed higher concentrations than the other chemicals in all locations.
All the POPs except t-CHL and c-CHL collected at urban sites of the Niigata Plain was almost the same in their
concentration levels. Higher concentrations of t-CHL and c-CHL in residential areas should be attributed to the past
usage of the chemical as a termiticide. At Yahiko (remote site), most of the POPs showed lower concentrations than
those measured at the other sampling sites, although a-HCH and c-HCH were comparable with the concentrationsfound at the other sampling sites. All POPs except a-HCH and c-HCH tend to decrease 41–80% in their concentrationsfrom 2000 to 2001. The lower POPs concentrations in winter and the higher POPs concentrations in summer at every
sampling point can be partly explained by temperature differences. Applying the equation of the logarithm of the POP
partial pressure in air versus reciprocal temperature (lnPa ¼ m=T þ b) to our data, linear relations were observed. HCBgave a poor linearity and the smallest slope, while b-HCH, t-CHL and c-CHL gave good linearities and large slopes in
the equation. The results suggest that HCB level is influenced by not only the emission from terrestrial sources but the
global-scale background pollution. A peculiar observation is that b-HCH concentration measured in our study showedlarge temperature dependence, indicating there could be a source of contamination in the surrounding areas.
� 2003 Elsevier Science Ltd. All rights reserved.
Keywords: Persistent organic pollutants; Atmospheric concentration; Temperature dependency; Seasonal change
1. Introduction
Persistent organic pollutants (POPs), such as DDT,
chlordane and PCBs, remain in the environment and are
accumulated biologically through the food web. Human
health hazards and environmental damage have been
caused by POPs (Colborn et al., 1996; Tanabe, 2002).
With the evidence of global pollution by these sub-
stances and the consequent threats to the environment
and human, the international community adopted ‘‘The
Stockholm Convention on Persistent Organic Pollu-
tants’’ in May 2001. The convention stipulated the
global-scale measures necessary to reduce or eliminate
Chemosphere 52 (2003) 683–694
www.elsevier.com/locate/chemosphere
*Corresponding author. Tel.: +81-25-263-9416; fax: +81-25-
263-9410.
E-mail address: [email protected] (H. Murayama).
0045-6535/03/$ - see front matter � 2003 Elsevier Science Ltd. All rights reserved.
doi:10.1016/S0045-6535(03)00105-X
emissions resulting from intentional production or use
and unintentional production, as well as emissions from
stockpiles and waste. The use of POPs including PCBs
and organochlorine pesticides were prohibited in Japan
in the 1970s, although a great deal of PCB-containing
waste is still left untreated. A large amount of organo-
chlorine pesticides, such as DDT and hexachlorocyclo-
hexanes (HCHs), is held in storage in many places in
Japan even now. Some organochlorine pesticides are still
being used somewhere in the world (Li et al., 1996),
which could lead not only the environmental pollution
of the neighboring regions but also that of all over the
world. Therefore, urgent assessment for pollution con-
trol in each region is required to work out ways of
coping with it.
So far, many authors have reported on the environ-
mental pollution caused by POPs all over the world
(Bidleman et al., 1987, 1993; Ramesh et al., 1989; Hoff
et al., 1992a, 1998; Lane et al., 1992;Chernyak et al., 1995;
Pirrone et al., 1995; Oehme et al., 1996; Corts et al.,
1998; Halsall et al., 1998; Haugen et al., 1998; Eisen-
reich, 1999; Park et al., 2001). Highly volatile POPs,
such as hexachlorobenzene (HCB) and HCHs, have al-
ready caused pollution on a global scale, which is even
affecting the Polar Regions (Bidleman et al., 1993;
Oehme et al., 1996). According to Wania and Mackay
(1996), the mobility of POPs depends on the substance�sphysical and chemical properties. The more volatile the
POPs are, and the less octanol–air partition coefficient
they possess, the further they are capable of migrating.
Iwata et al. (1993) studied the POPs concentration in the
oceans. They concluded that higher the latitude, more
the concentration of HCHs. In contrast, DDT pollution
is more in tropical Asia, i.e. in low latitudes. In Japan,
there have been lots of studies (Kadokami, 1999) con-
ducted on the water environment, but very few (Nakano
et al., 1987) on the atmosphere, so little pertinent in-
formation is available.
Niigata area is located in the northwest coast of Main
Island of Japan. One side of the Niigata Plain looks
toward the Sea of Japan and the high mountain range
rises on the other side with the height of 2500 m or more.
It is a rainy and snowy season with strong north wind
from the Sea of Japan during November to February,
while a climate is mild from spring to autumn (March–
October) in Niigata. Since the most parts of the Niigata
Plain are used for rice paddies and fruit farms, various
pesticides have been used. Therefore, Niigata area is
very interesting place to investigate the seasonal change
of the concentrations of POPs in ambient air. In this
study, chemicals such as HCB, a-, b-, c- and d-HCH,trans- and cis-chlordane (t-CHL, c-CHL), p,p0-DDE,
p,p0-DDD and p,p0-DDT, were selected as the target
compounds for this study and the seasonal concen-
tration changes of these in the ambient air were in-
vestigated at various sampling points in the Niigata
Plain. The emission sources of POPs in the ambient air
were discussed by using the data of the POP concen-
trations of the samples collected at the different sampling
sites.
2. Experimental
2.1. Sampling sites
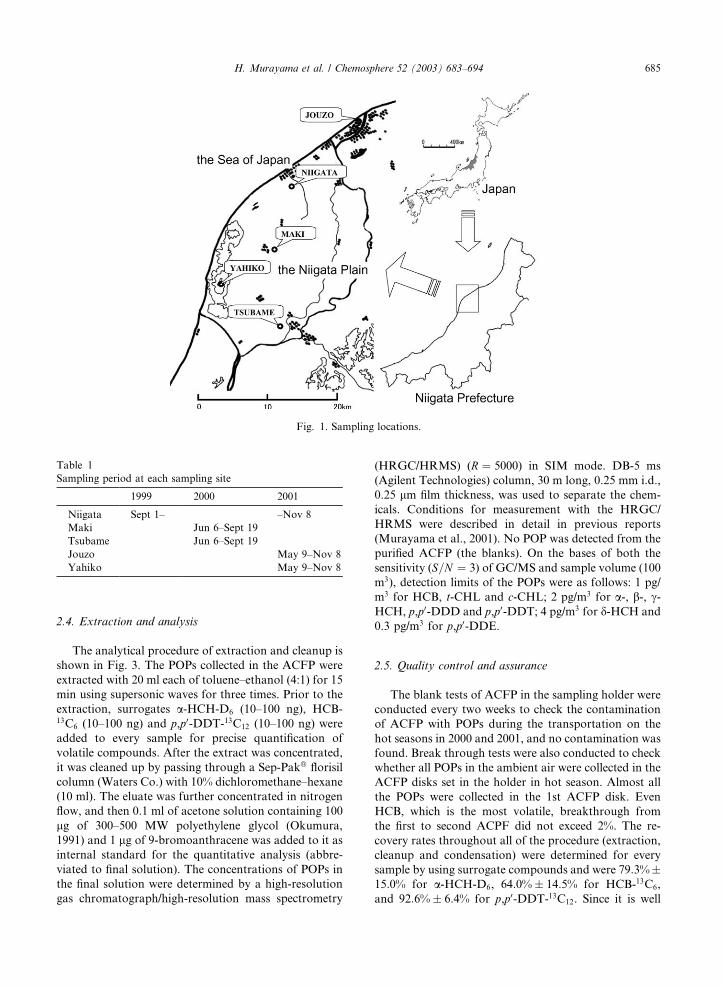
Fig. 1 shows the location of the five sampling sites,
Niigata, Maki, Tsubame, Jouzo and Yahiko, in the
Niigata Plain, Japan. These sites were chosen to be
representative of the atmospheric environment in
this area. Sampling apparatuses for Niigata, Maki and
Tsubame were set at the suburbs of Niigata city, Maki
town and Tsubame city, respectively. These sampling
sites are near to the region of paddy fields, vegetable
farms and fruit farms. The sampling site of Jouzo is
located in the downtown of Niigata city and is 5 km
away from the rural area. The sampling site of Yahiko
is located on the top of Mountain Yahiko at a height
of 586 m and is far from both urban and agricultural
areas.
2.2. Sampling term
Sampling period at each site is shown in Table 1.
Samplings of POPs in air were carried out every week
from September 1999 to October 2000 at Niigata site.
Every week from June to September 2000 at Maki and
Tsubame sites, and every week from May to November
2001 at Jouzo and Yahiko site.
2.3. Sampling method
Activated carbon filter paper (TOYOBO KF paper
P-175, JAPAN, abbreviated as ACFP) was used to
collect the POPs in the ambient air (Moriyama et al.,
1990). ACFP disk with 47 mm in a diameter was sub-
jected to soxhlet extraction with toluene and acetone
sequentially to remove the impurities, and then the sol-
vents were removed prior to the use. Two pieces of the
purified ACFP disk were set in a holder. Sampling ap-
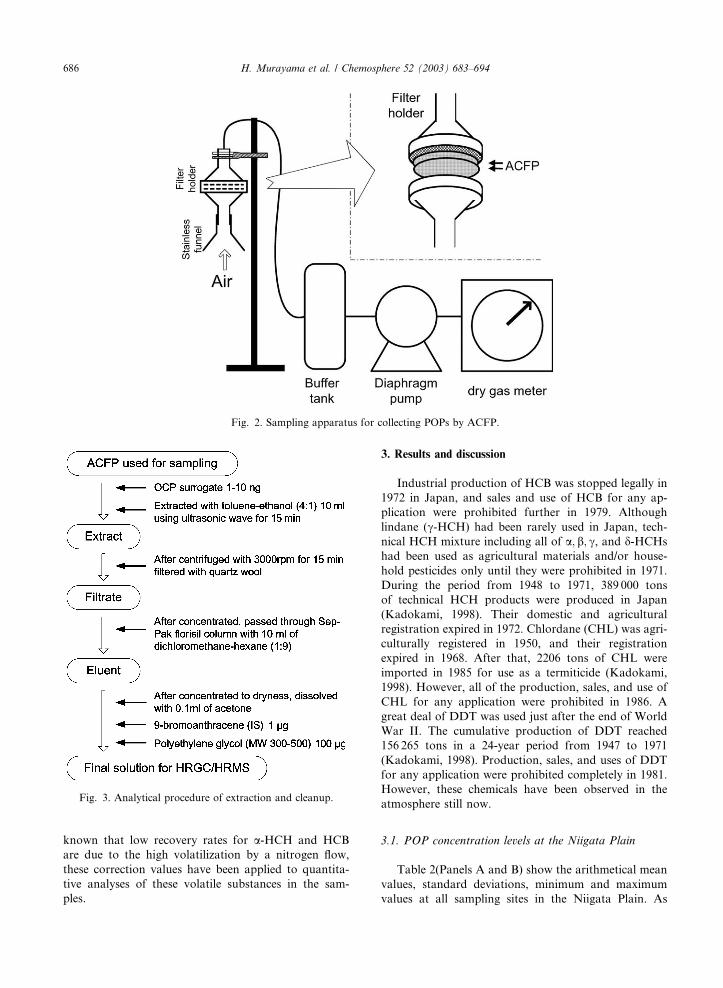
paratus is shown in Fig. 2. In front of the entrance of the
holder, a stainless funnel was connected to prevent rain.
The POPs were collected by passing the ambient air
through the ACFP disks in the holder for 7 days (100
m3) with 0.6 m3/h as described in the previous paper
(Mitobe et al., 2001). All of the samples were collected
every week by replacing the ACFP filters.
The sampling apparatus at Niigata site was set 1.5 m
above the ground. The sampling apparatuses in Maki,
Tsubame, Jouzo and Yahiko were set on the rooftop of
the building with the height of ca. 7 m.
684 H. Murayama et al. / Chemosphere 52 (2003) 683–694
2.4. Extraction and analysis
The analytical procedure of extraction and cleanup is
shown in Fig. 3. The POPs collected in the ACFP were
extracted with 20 ml each of toluene–ethanol (4:1) for 15
min using supersonic waves for three times. Prior to the
extraction, surrogates a-HCH-D6 (10–100 ng), HCB-13C6 (10–100 ng) and p,p0-DDT-13C12 (10–100 ng) were
added to every sample for precise quantification of
volatile compounds. After the extract was concentrated,
it was cleaned up by passing through a Sep-Pak� florisil
column (Waters Co.) with 10% dichloromethane–hexane
(10 ml). The eluate was further concentrated in nitrogen
flow, and then 0.1 ml of acetone solution containing 100
lg of 300–500 MW polyethylene glycol (Okumura,
1991) and 1 lg of 9-bromoanthracene was added to it asinternal standard for the quantitative analysis (abbre-
viated to final solution). The concentrations of POPs in
the final solution were determined by a high-resolution
gas chromatograph/high-resolution mass spectrometry
(HRGC/HRMS) (R ¼ 5000) in SIM mode. DB-5 ms
(Agilent Technologies) column, 30 m long, 0.25 mm i.d.,
0.25 lm film thickness, was used to separate the chem-icals. Conditions for measurement with the HRGC/
HRMS were described in detail in previous reports
(Murayama et al., 2001). No POP was detected from the
purified ACFP (the blanks). On the bases of both the
sensitivity (S=N ¼ 3) of GC/MS and sample volume (100m3), detection limits of the POPs were as follows: 1 pg/
m3 for HCB, t-CHL and c-CHL; 2 pg/m3 for a-, b-, c-HCH, p,p0-DDD and p,p0-DDT; 4 pg/m3 for d-HCH and0.3 pg/m3 for p,p0-DDE.
2.5. Quality control and assurance
The blank tests of ACFP in the sampling holder were
conducted every two weeks to check the contamination
of ACFP with POPs during the transportation on the
hot seasons in 2000 and 2001, and no contamination was
found. Break through tests were also conducted to check
whether all POPs in the ambient air were collected in the
ACFP disks set in the holder in hot season. Almost all
the POPs were collected in the 1st ACFP disk. Even
HCB, which is the most volatile, breakthrough from
the first to second ACPF did not exceed 2%. The re-
covery rates throughout all of the procedure (extraction,
cleanup and condensation) were determined for every
sample by using surrogate compounds and were 79:3%�15:0% for a-HCH-D6, 64:0%� 14:5% for HCB-13C6,
and 92:6%� 6:4% for p,p0-DDT-13C12. Since it is well
Fig. 1. Sampling locations.
Table 1
Sampling period at each sampling site
1999 2000 2001
Niigata Sept 1– –Nov 8
Maki Jun 6–Sept 19
Tsubame Jun 6–Sept 19
Jouzo May 9–Nov 8
Yahiko May 9–Nov 8
H. Murayama et al. / Chemosphere 52 (2003) 683–694 685
known that low recovery rates for a-HCH and HCB
are due to the high volatilization by a nitrogen flow,
these correction values have been applied to quantita-
tive analyses of these volatile substances in the sam-
ples.
3. Results and discussion
Industrial production of HCB was stopped legally in
1972 in Japan, and sales and use of HCB for any ap-
plication were prohibited further in 1979. Although
lindane (c-HCH) had been rarely used in Japan, tech-nical HCH mixture including all of a; b; c, and d-HCHshad been used as agricultural materials and/or house-
hold pesticides only until they were prohibited in 1971.
During the period from 1948 to 1971, 389 000 tons
of technical HCH products were produced in Japan
(Kadokami, 1998). Their domestic and agricultural
registration expired in 1972. Chlordane (CHL) was agri-
culturally registered in 1950, and their registration
expired in 1968. After that, 2206 tons of CHL were
imported in 1985 for use as a termiticide (Kadokami,
1998). However, all of the production, sales, and use of
CHL for any application were prohibited in 1986. A
great deal of DDT was used just after the end of World
War II. The cumulative production of DDT reached
156 265 tons in a 24-year period from 1947 to 1971
(Kadokami, 1998). Production, sales, and uses of DDT
for any application were prohibited completely in 1981.
However, these chemicals have been observed in the
atmosphere still now.
3.1. POP concentration levels at the Niigata Plain
Table 2(Panels A and B) show the arithmetical mean
values, standard deviations, minimum and maximum
values at all sampling sites in the Niigata Plain. As
Fig. 3. Analytical procedure of extraction and cleanup.
Fig. 2. Sampling apparatus for collecting POPs by ACFP.
686 H. Murayama et al. / Chemosphere 52 (2003) 683–694
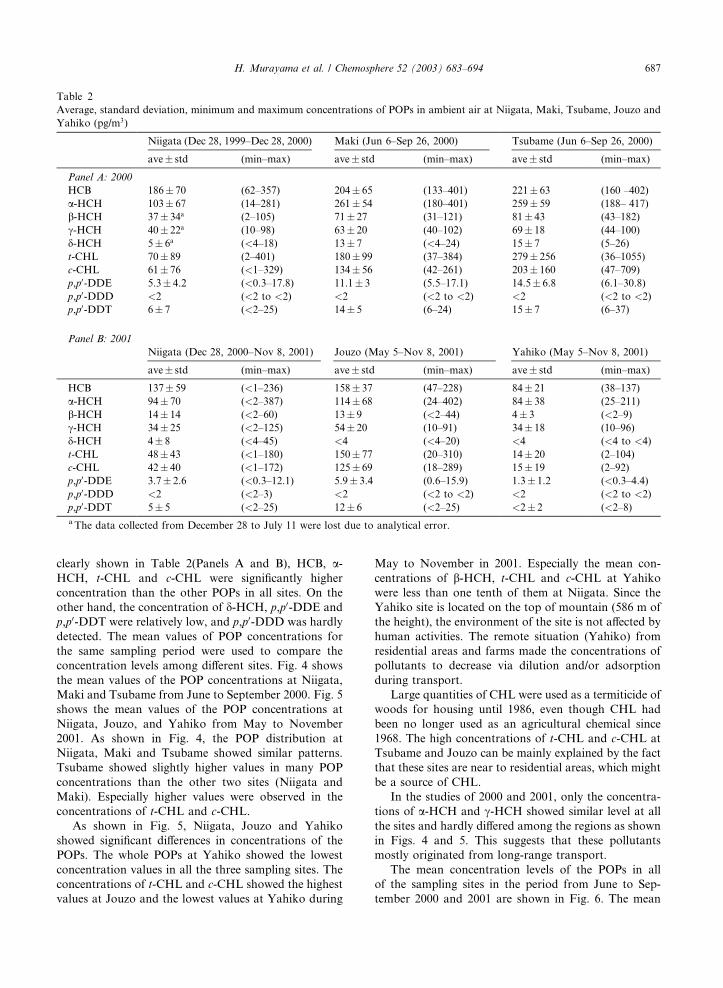
clearly shown in Table 2(Panels A and B), HCB, a-HCH, t-CHL and c-CHL were significantly higher
concentration than the other POPs in all sites. On the
other hand, the concentration of d-HCH, p,p0-DDE andp,p0-DDT were relatively low, and p,p0-DDD was hardly
detected. The mean values of POP concentrations for
the same sampling period were used to compare the
concentration levels among different sites. Fig. 4 shows
the mean values of the POP concentrations at Niigata,
Maki and Tsubame from June to September 2000. Fig. 5
shows the mean values of the POP concentrations at
Niigata, Jouzo, and Yahiko from May to November
2001. As shown in Fig. 4, the POP distribution at
Niigata, Maki and Tsubame showed similar patterns.
Tsubame showed slightly higher values in many POP
concentrations than the other two sites (Niigata and
Maki). Especially higher values were observed in the
concentrations of t-CHL and c-CHL.
As shown in Fig. 5, Niigata, Jouzo and Yahiko
showed significant differences in concentrations of the
POPs. The whole POPs at Yahiko showed the lowest
concentration values in all the three sampling sites. The
concentrations of t-CHL and c-CHL showed the highest
values at Jouzo and the lowest values at Yahiko during
May to November in 2001. Especially the mean con-
centrations of b-HCH, t-CHL and c-CHL at Yahiko
were less than one tenth of them at Niigata. Since the
Yahiko site is located on the top of mountain (586 m of
the height), the environment of the site is not affected by
human activities. The remote situation (Yahiko) from
residential areas and farms made the concentrations of
pollutants to decrease via dilution and/or adsorption
during transport.
Large quantities of CHL were used as a termiticide of
woods for housing until 1986, even though CHL had
been no longer used as an agricultural chemical since
1968. The high concentrations of t-CHL and c-CHL at
Tsubame and Jouzo can be mainly explained by the fact
that these sites are near to residential areas, which might
be a source of CHL.
In the studies of 2000 and 2001, only the concentra-
tions of a-HCH and c-HCH showed similar level at allthe sites and hardly differed among the regions as shown
in Figs. 4 and 5. This suggests that these pollutants
mostly originated from long-range transport.
The mean concentration levels of the POPs in all
of the sampling sites in the period from June to Sep-
tember 2000 and 2001 are shown in Fig. 6. The mean
Table 2
Average, standard deviation, minimum and maximum concentrations of POPs in ambient air at Niigata, Maki, Tsubame, Jouzo and
Yahiko (pg/m3)
Niigata (Dec 28, 1999–Dec 28, 2000) Maki (Jun 6–Sep 26, 2000) Tsubame (Jun 6–Sep 26, 2000)
ave� std (min–max) ave� std (min–max) ave� std (min–max)
Panel A: 2000
HCB 186� 70 (62–357) 204� 65 (133–401) 221� 63 (160 –402)
a-HCH 103� 67 (14–281) 261� 54 (180–401) 259� 59 (188– 417)
b-HCH 37� 34a (2–105) 71� 27 (31–121) 81� 43 (43–182)
c-HCH 40� 22a (10–98) 63� 20 (40–102) 69� 18 (44–100)
d-HCH 5� 6a (<4–18) 13� 7 (<4–24) 15� 7 (5–26)
t-CHL 70� 89 (2–401) 180� 99 (37–384) 279� 256 (36–1055)
c-CHL 61� 76 (<1–329) 134� 56 (42–261) 203� 160 (47–709)
p,p0-DDE 5.3� 4.2 (<0.3–17.8) 11.1� 3 (5.5–17.1) 14.5� 6.8 (6.1–30.8)
p,p0-DDD <2 (<2 to <2) <2 (<2 to <2) <2 (<2 to <2)
p,p0-DDT 6� 7 (<2–25) 14� 5 (6–24) 15� 7 (6–37)
Panel B: 2001
Niigata (Dec 28, 2000–Nov 8, 2001) Jouzo (May 5–Nov 8, 2001) Yahiko (May 5–Nov 8, 2001)
ave� std (min–max) ave� std (min–max) ave� std (min–max)
HCB 137� 59 (<1–236) 158� 37 (47–228) 84� 21 (38–137)
a-HCH 94� 70 (<2–387) 114� 68 (24–402) 84� 38 (25–211)
b-HCH 14� 14 (<2–60) 13� 9 (<2–44) 4� 3 (<2–9)
c-HCH 34� 25 (<2–125) 54� 20 (10–91) 34� 18 (10–96)
d-HCH 4� 8 (<4–45) <4 (<4–20) <4 (<4 to <4)
t-CHL 48� 43 (<1–180) 150� 77 (20–310) 14� 20 (2–104)
c-CHL 42� 40 (<1–172) 125� 69 (18–289) 15� 19 (2–92)
p,p0-DDE 3.7� 2.6 (<0.3–12.1) 5.9� 3.4 (0.6–15.9) 1.3� 1.2 (<0.3–4.4)
p,p0-DDD <2 (<2–3) <2 (<2 to <2) <2 (<2 to <2)
p,p0-DDT 5� 5 (<2–25) 12� 6 (<2–25) <2� 2 (<2–8)
a The data collected from December 28 to July 11 were lost due to analytical error.
H. Murayama et al. / Chemosphere 52 (2003) 683–694 687
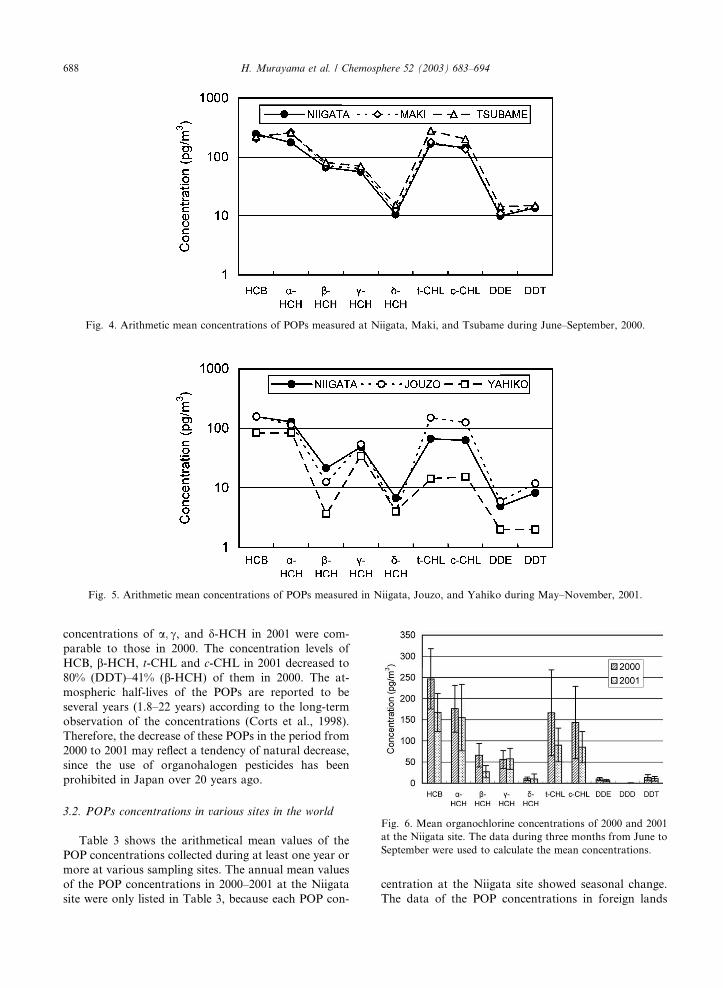
concentrations of a; c, and d-HCH in 2001 were com-
parable to those in 2000. The concentration levels of
HCB, b-HCH, t-CHL and c-CHL in 2001 decreased to
80% (DDT)–41% (b-HCH) of them in 2000. The at-
mospheric half-lives of the POPs are reported to be
several years (1.8–22 years) according to the long-term
observation of the concentrations (Corts et al., 1998).
Therefore, the decrease of these POPs in the period from
2000 to 2001 may reflect a tendency of natural decrease,
since the use of organohalogen pesticides has been
prohibited in Japan over 20 years ago.
3.2. POPs concentrations in various sites in the world
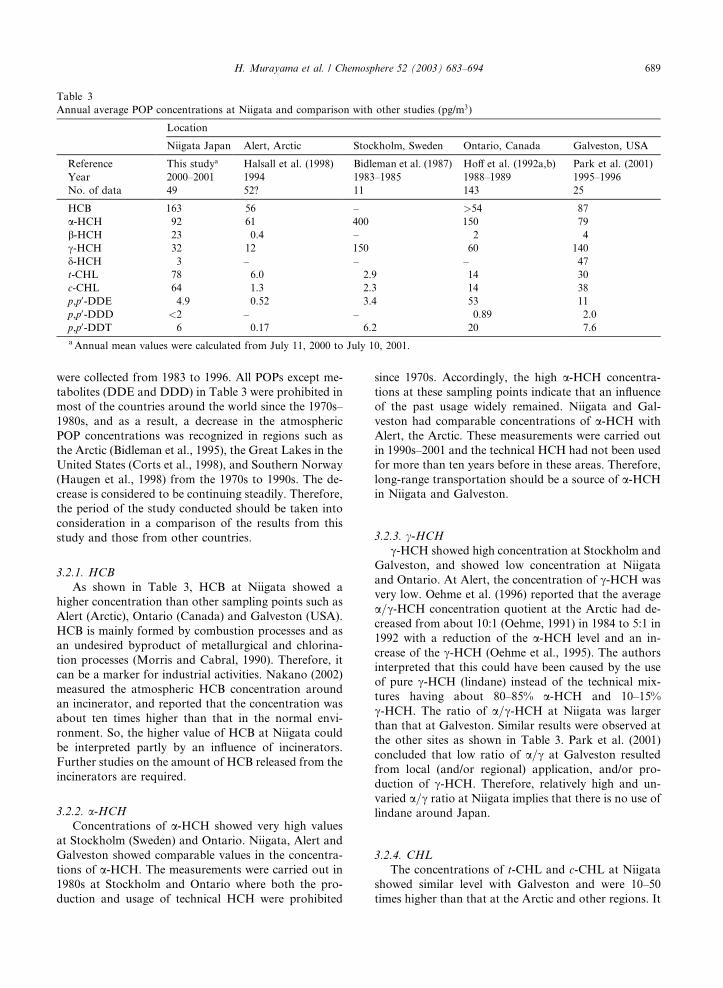
Table 3 shows the arithmetical mean values of the
POP concentrations collected during at least one year or
more at various sampling sites. The annual mean values
of the POP concentrations in 2000–2001 at the Niigata
site were only listed in Table 3, because each POP con-
centration at the Niigata site showed seasonal change.
The data of the POP concentrations in foreign lands
Fig. 4. Arithmetic mean concentrations of POPs measured at Niigata, Maki, and Tsubame during June–September, 2000.
Fig. 6. Mean organochlorine concentrations of 2000 and 2001
at the Niigata site. The data during three months from June to
September were used to calculate the mean concentrations.
Fig. 5. Arithmetic mean concentrations of POPs measured in Niigata, Jouzo, and Yahiko during May–November, 2001.
688 H. Murayama et al. / Chemosphere 52 (2003) 683–694
were collected from 1983 to 1996. All POPs except me-
tabolites (DDE and DDD) in Table 3 were prohibited in
most of the countries around the world since the 1970s–
1980s, and as a result, a decrease in the atmospheric
POP concentrations was recognized in regions such as
the Arctic (Bidleman et al., 1995), the Great Lakes in the
United States (Corts et al., 1998), and Southern Norway
(Haugen et al., 1998) from the 1970s to 1990s. The de-
crease is considered to be continuing steadily. Therefore,
the period of the study conducted should be taken into
consideration in a comparison of the results from this
study and those from other countries.
3.2.1. HCB
As shown in Table 3, HCB at Niigata showed a
higher concentration than other sampling points such as
Alert (Arctic), Ontario (Canada) and Galveston (USA).
HCB is mainly formed by combustion processes and as
an undesired byproduct of metallurgical and chlorina-
tion processes (Morris and Cabral, 1990). Therefore, it
can be a marker for industrial activities. Nakano (2002)
measured the atmospheric HCB concentration around
an incinerator, and reported that the concentration was
about ten times higher than that in the normal envi-
ronment. So, the higher value of HCB at Niigata could
be interpreted partly by an influence of incinerators.
Further studies on the amount of HCB released from the
incinerators are required.
3.2.2. a-HCH
Concentrations of a-HCH showed very high valuesat Stockholm (Sweden) and Ontario. Niigata, Alert and
Galveston showed comparable values in the concentra-
tions of a-HCH. The measurements were carried out in1980s at Stockholm and Ontario where both the pro-
duction and usage of technical HCH were prohibited
since 1970s. Accordingly, the high a-HCH concentra-
tions at these sampling points indicate that an influence
of the past usage widely remained. Niigata and Gal-
veston had comparable concentrations of a-HCH withAlert, the Arctic. These measurements were carried out
in 1990s–2001 and the technical HCH had not been used
for more than ten years before in these areas. Therefore,
long-range transportation should be a source of a-HCHin Niigata and Galveston.
3.2.3. c-HCH
c-HCH showed high concentration at Stockholm andGalveston, and showed low concentration at Niigata
and Ontario. At Alert, the concentration of c-HCH wasvery low. Oehme et al. (1996) reported that the average
a=c-HCH concentration quotient at the Arctic had de-creased from about 10:1 (Oehme, 1991) in 1984 to 5:1 in
1992 with a reduction of the a-HCH level and an in-
crease of the c-HCH (Oehme et al., 1995). The authorsinterpreted that this could have been caused by the use
of pure c-HCH (lindane) instead of the technical mix-tures having about 80–85% a-HCH and 10–15%
c-HCH. The ratio of a=c-HCH at Niigata was larger
than that at Galveston. Similar results were observed at
the other sites as shown in Table 3. Park et al. (2001)
concluded that low ratio of a=c at Galveston resultedfrom local (and/or regional) application, and/or pro-
duction of c-HCH. Therefore, relatively high and un-varied a=c ratio at Niigata implies that there is no use oflindane around Japan.
3.2.4. CHL
The concentrations of t-CHL and c-CHL at Niigata
showed similar level with Galveston and were 10–50
times higher than that at the Arctic and other regions. It
Table 3
Annual average POP concentrations at Niigata and comparison with other studies (pg/m3)
Location
Niigata Japan Alert, Arctic Stockholm, Sweden Ontario, Canada Galveston, USA
Reference This studya Halsall et al. (1998) Bidleman et al. (1987) Hoff et al. (1992a,b) Park et al. (2001)
Year 2000–2001 1994 1983–1985 1988–1989 1995–1996
No. of data 49 52? 11 143 25
HCB 163 56 – >54 87
a-HCH 92 61 400 150 79
b-HCH 23 0.4 – 2 4
c-HCH 32 12 150 60 140
d-HCH 3 – – – 47
t-CHL 78 6.0 2.9 14 30
c-CHL 64 1.3 2.3 14 38
p,p0-DDE 4.9 0.52 3.4 53 11
p,p0-DDD <2 – – 0.89 2.0
p,p0-DDT 6 0.17 6.2 20 7.6
aAnnual mean values were calculated from July 11, 2000 to July 10, 2001.
H. Murayama et al. / Chemosphere 52 (2003) 683–694 689
is well known that indoors are highly contaminated by
CHL after the extermination of termites (Leone et al.,
2000). In Columbia, South Carolina, and the United
States, where CHL was used as a termiticide, atmo-
spheric environmental concentrations of trans-CHL and
cis-CHL were 0.175 and 0.092 ng/m3, respectively, the
average values from August to December 1994 (Bidle-
man et al., 1998). These concentrations are the same as
those of our study at Jouzo and Tsubame. In Japan,
CHL had been used as a termiticide in residences until
1986. The atmospheric concentrations of CHL were
high at Jouzo (urban area), and low at Yahiko, located
in a remote area. We feel that CHL would still be re-
maining in the regions surrounding residential areas,
and be gradually emitted into the atmosphere from
woods.
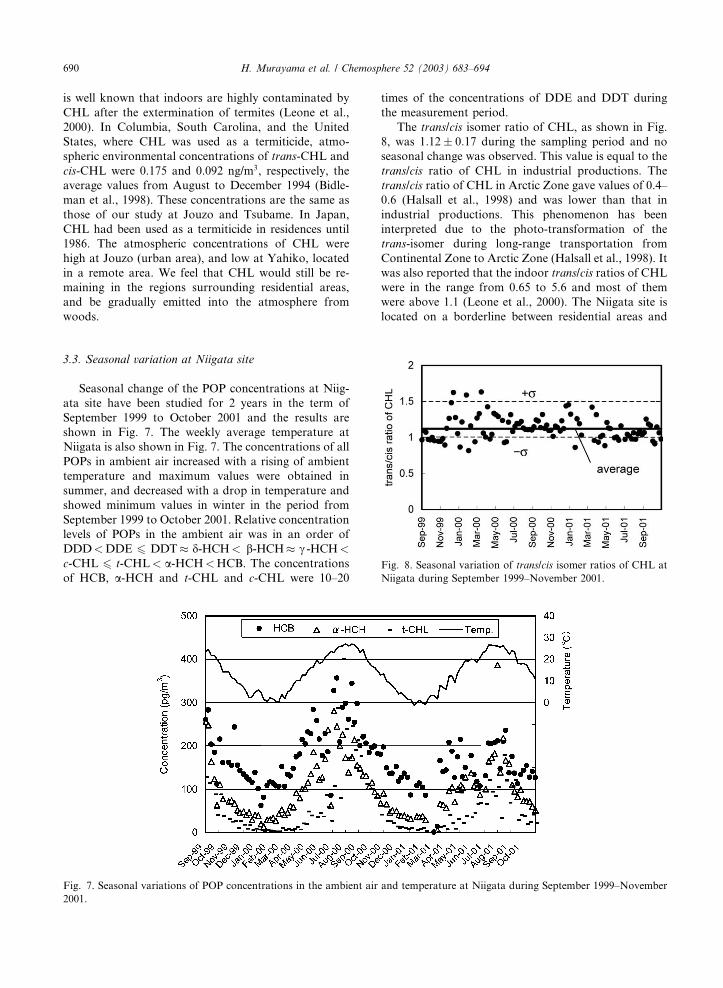
3.3. Seasonal variation at Niigata site
Seasonal change of the POP concentrations at Niig-
ata site have been studied for 2 years in the term of
September 1999 to October 2001 and the results are
shown in Fig. 7. The weekly average temperature at
Niigata is also shown in Fig. 7. The concentrations of all
POPs in ambient air increased with a rising of ambient
temperature and maximum values were obtained in
summer, and decreased with a drop in temperature and
showed minimum values in winter in the period from
September 1999 to October 2001. Relative concentration
levels of POPs in the ambient air was in an order of
DDD<DDE 6 DDT� d-HCH< b-HCH� c -HCH<c-CHL 6 t-CHL< a-HCH<HCB. The concentrationsof HCB, a-HCH and t-CHL and c-CHL were 10–20
times of the concentrations of DDE and DDT during
the measurement period.
The trans/cis isomer ratio of CHL, as shown in Fig.
8, was 1:12� 0:17 during the sampling period and noseasonal change was observed. This value is equal to the
trans/cis ratio of CHL in industrial productions. The
trans/cis ratio of CHL in Arctic Zone gave values of 0.4–
0.6 (Halsall et al., 1998) and was lower than that in
industrial productions. This phenomenon has been
interpreted due to the photo-transformation of the
trans-isomer during long-range transportation from
Continental Zone to Arctic Zone (Halsall et al., 1998). It
was also reported that the indoor trans/cis ratios of CHL
were in the range from 0.65 to 5.6 and most of them
were above 1.1 (Leone et al., 2000). The Niigata site is
located on a borderline between residential areas and
Fig. 7. Seasonal variations of POP concentrations in the ambient air and temperature at Niigata during September 1999–November
2001.
Fig. 8. Seasonal variation of trans/cis isomer ratios of CHL at
Niigata during September 1999–November 2001.
690 H. Murayama et al. / Chemosphere 52 (2003) 683–694
agricultural areas. Therefore, the major source of CHL
in ambient air in our study is probably wooden houses
contaminated by CHL.
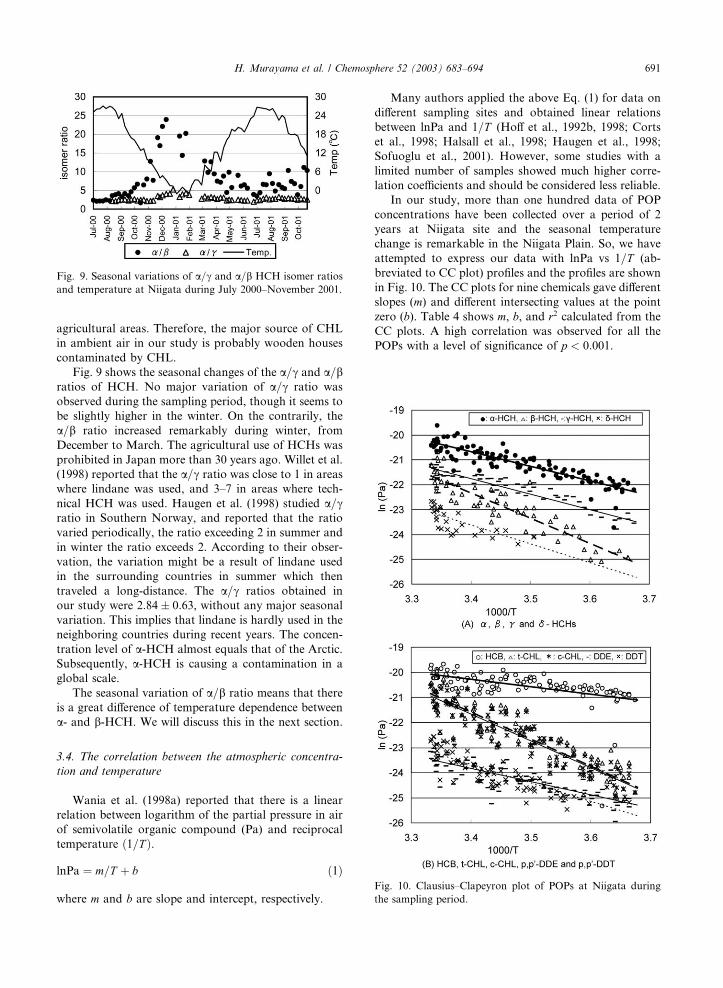
Fig. 9 shows the seasonal changes of the a=c and a=bratios of HCH. No major variation of a=c ratio wasobserved during the sampling period, though it seems to
be slightly higher in the winter. On the contrarily, the
a=b ratio increased remarkably during winter, from
December to March. The agricultural use of HCHs was
prohibited in Japan more than 30 years ago. Willet et al.
(1998) reported that the a=c ratio was close to 1 in areaswhere lindane was used, and 3–7 in areas where tech-
nical HCH was used. Haugen et al. (1998) studied a=cratio in Southern Norway, and reported that the ratio
varied periodically, the ratio exceeding 2 in summer and
in winter the ratio exceeds 2. According to their obser-
vation, the variation might be a result of lindane used
in the surrounding countries in summer which then
traveled a long-distance. The a=c ratios obtained inour study were 2:84� 0:63, without any major seasonalvariation. This implies that lindane is hardly used in the
neighboring countries during recent years. The concen-
tration level of a-HCH almost equals that of the Arctic.Subsequently, a-HCH is causing a contamination in a
global scale.
The seasonal variation of a=b ratio means that thereis a great difference of temperature dependence between
a- and b-HCH. We will discuss this in the next section.
3.4. The correlation between the atmospheric concentra-
tion and temperature
Wania et al. (1998a) reported that there is a linear
relation between logarithm of the partial pressure in air
of semivolatile organic compound (Pa) and reciprocal
temperature ð1=T Þ.
lnPa ¼ m=T þ b ð1Þ
where m and b are slope and intercept, respectively.
Many authors applied the above Eq. (1) for data on
different sampling sites and obtained linear relations
between lnPa and 1=T (Hoff et al., 1992b, 1998; Cortset al., 1998; Halsall et al., 1998; Haugen et al., 1998;
Sofuoglu et al., 2001). However, some studies with a
limited number of samples showed much higher corre-
lation coefficients and should be considered less reliable.
In our study, more than one hundred data of POP
concentrations have been collected over a period of 2
years at Niigata site and the seasonal temperature
change is remarkable in the Niigata Plain. So, we have
attempted to express our data with lnPa vs 1=T (ab-breviated to CC plot) profiles and the profiles are shown
in Fig. 10. The CC plots for nine chemicals gave different
slopes (m) and different intersecting values at the pointzero (b). Table 4 shows m, b, and r2 calculated from theCC plots. A high correlation was observed for all the
POPs with a level of significance of p < 0:001.
Fig. 9. Seasonal variations of a=c and a=b HCH isomer ratiosand temperature at Niigata during July 2000–November 2001.
Fig. 10. Clausius–Clapeyron plot of POPs at Niigata during
the sampling period.
H. Murayama et al. / Chemosphere 52 (2003) 683–694 691
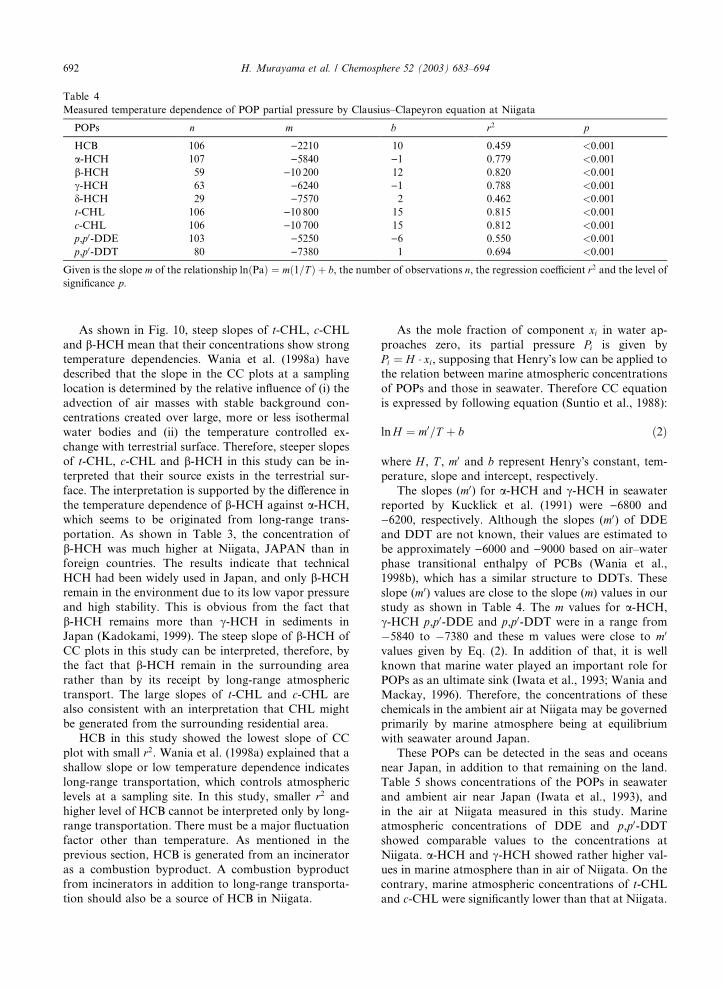
As shown in Fig. 10, steep slopes of t-CHL, c-CHL
and b-HCH mean that their concentrations show strongtemperature dependencies. Wania et al. (1998a) have
described that the slope in the CC plots at a sampling
location is determined by the relative influence of (i) the
advection of air masses with stable background con-
centrations created over large, more or less isothermal
water bodies and (ii) the temperature controlled ex-
change with terrestrial surface. Therefore, steeper slopes
of t-CHL, c-CHL and b-HCH in this study can be in-terpreted that their source exists in the terrestrial sur-
face. The interpretation is supported by the difference in
the temperature dependence of b-HCH against a-HCH,which seems to be originated from long-range trans-
portation. As shown in Table 3, the concentration of
b-HCH was much higher at Niigata, JAPAN than in
foreign countries. The results indicate that technical
HCH had been widely used in Japan, and only b-HCHremain in the environment due to its low vapor pressure
and high stability. This is obvious from the fact that
b-HCH remains more than c-HCH in sediments in
Japan (Kadokami, 1999). The steep slope of b-HCH ofCC plots in this study can be interpreted, therefore, by
the fact that b-HCH remain in the surrounding area
rather than by its receipt by long-range atmospheric
transport. The large slopes of t-CHL and c-CHL are
also consistent with an interpretation that CHL might
be generated from the surrounding residential area.
HCB in this study showed the lowest slope of CC
plot with small r2. Wania et al. (1998a) explained that ashallow slope or low temperature dependence indicates
long-range transportation, which controls atmospheric
levels at a sampling site. In this study, smaller r2 andhigher level of HCB cannot be interpreted only by long-
range transportation. There must be a major fluctuation
factor other than temperature. As mentioned in the
previous section, HCB is generated from an incinerator
as a combustion byproduct. A combustion byproduct
from incinerators in addition to long-range transporta-
tion should also be a source of HCB in Niigata.
As the mole fraction of component xi in water ap-proaches zero, its partial pressure Pi is given by
Pi ¼ H � xi, supposing that Henry�s low can be applied tothe relation between marine atmospheric concentrations
of POPs and those in seawater. Therefore CC equation
is expressed by following equation (Suntio et al., 1988):
lnH ¼ m0=T þ b ð2Þ
where H , T , m0 and b represent Henry�s constant, tem-perature, slope and intercept, respectively.
The slopes (m0) for a-HCH and c-HCH in seawaterreported by Kucklick et al. (1991) were )6800 and)6200, respectively. Although the slopes (m0) of DDE
and DDT are not known, their values are estimated to
be approximately )6000 and )9000 based on air–waterphase transitional enthalpy of PCBs (Wania et al.,
1998b), which has a similar structure to DDTs. These
slope (m0) values are close to the slope (m) values in ourstudy as shown in Table 4. The m values for a-HCH,c-HCH p,p0-DDE and p,p0-DDT were in a range from
5840 to 7380 and these m values were close to m0
values given by Eq. (2). In addition of that, it is well
known that marine water played an important role for
POPs as an ultimate sink (Iwata et al., 1993; Wania and
Mackay, 1996). Therefore, the concentrations of these
chemicals in the ambient air at Niigata may be governed
primarily by marine atmosphere being at equilibrium
with seawater around Japan.
These POPs can be detected in the seas and oceans
near Japan, in addition to that remaining on the land.
Table 5 shows concentrations of the POPs in seawater
and ambient air near Japan (Iwata et al., 1993), and
in the air at Niigata measured in this study. Marine
atmospheric concentrations of DDE and p,p0-DDT
showed comparable values to the concentrations at
Niigata. a-HCH and c-HCH showed rather higher val-ues in marine atmosphere than in air of Niigata. On the
contrary, marine atmospheric concentrations of t-CHL
and c-CHL were significantly lower than that at Niigata.
Table 4
Measured temperature dependence of POP partial pressure by Clausius–Clapeyron equation at Niigata
POPs n m b r2 p
HCB 106 )2210 10 0.459 <0.001
a-HCH 107 )5840 )1 0.779 <0.001
b-HCH 59 )10 200 12 0.820 <0.001
c-HCH 63 )6240 )1 0.788 <0.001
d-HCH 29 )7570 2 0.462 <0.001
t-CHL 106 )10 800 15 0.815 <0.001
c-CHL 106 )10 700 15 0.812 <0.001
p,p0-DDE 103 )5250 )6 0.550 <0.001
p,p0-DDT 80 )7380 1 0.694 <0.001
Given is the slope m of the relationship lnðPaÞ ¼ mð1=T Þ þ b, the number of observations n, the regression coefficient r2 and the level ofsignificance p.
692 H. Murayama et al. / Chemosphere 52 (2003) 683–694
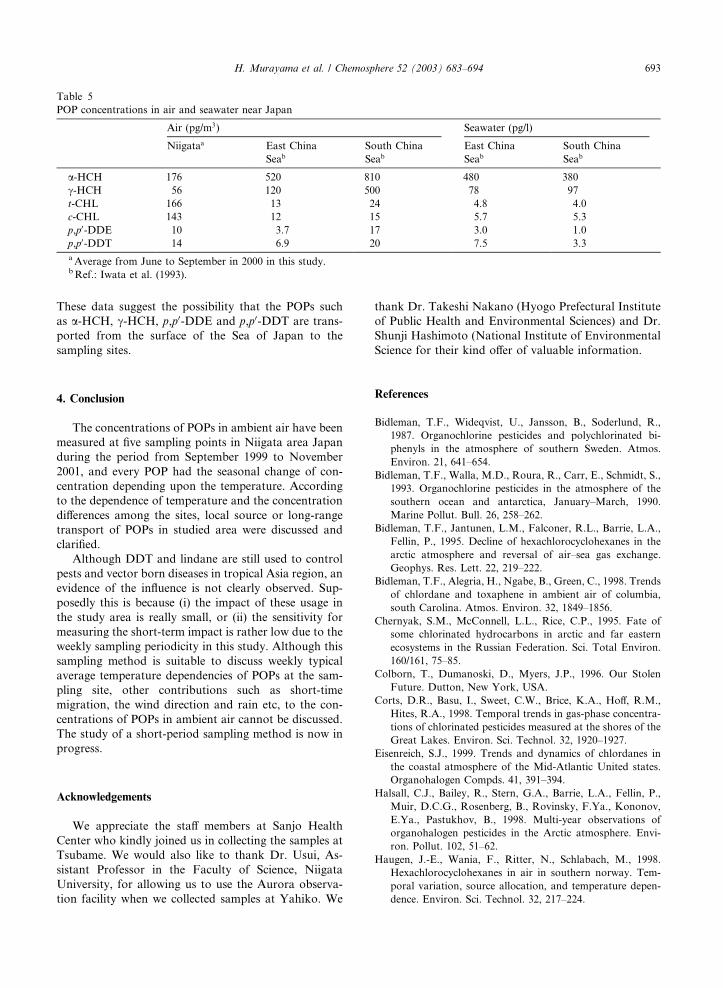
These data suggest the possibility that the POPs such
as a-HCH, c-HCH, p,p0-DDE and p,p0-DDT are trans-
ported from the surface of the Sea of Japan to the
sampling sites.
4. Conclusion
The concentrations of POPs in ambient air have been
measured at five sampling points in Niigata area Japan
during the period from September 1999 to November
2001, and every POP had the seasonal change of con-
centration depending upon the temperature. According
to the dependence of temperature and the concentration
differences among the sites, local source or long-range
transport of POPs in studied area were discussed and
clarified.
Although DDT and lindane are still used to control
pests and vector born diseases in tropical Asia region, an
evidence of the influence is not clearly observed. Sup-
posedly this is because (i) the impact of these usage in
the study area is really small, or (ii) the sensitivity for
measuring the short-term impact is rather low due to the
weekly sampling periodicity in this study. Although this
sampling method is suitable to discuss weekly typical
average temperature dependencies of POPs at the sam-
pling site, other contributions such as short-time
migration, the wind direction and rain etc, to the con-
centrations of POPs in ambient air cannot be discussed.
The study of a short-period sampling method is now in
progress.
Acknowledgements
We appreciate the staff members at Sanjo Health
Center who kindly joined us in collecting the samples at
Tsubame. We would also like to thank Dr. Usui, As-
sistant Professor in the Faculty of Science, Niigata
University, for allowing us to use the Aurora observa-
tion facility when we collected samples at Yahiko. We
thank Dr. Takeshi Nakano (Hyogo Prefectural Institute
of Public Health and Environmental Sciences) and Dr.
Shunji Hashimoto (National Institute of Environmental
Science for their kind offer of valuable information.
References
Bidleman, T.F., Wideqvist, U., Jansson, B., Soderlund, R.,
1987. Organochlorine pesticides and polychlorinated bi-
phenyls in the atmosphere of southern Sweden. Atmos.
Environ. 21, 641–654.
Bidleman, T.F., Walla, M.D., Roura, R., Carr, E., Schmidt, S.,
1993. Organochlorine pesticides in the atmosphere of the
southern ocean and antarctica, January–March, 1990.
Marine Pollut. Bull. 26, 258–262.
Bidleman, T.F., Jantunen, L.M., Falconer, R.L., Barrie, L.A.,
Fellin, P., 1995. Decline of hexachlorocyclohexanes in the
arctic atmosphere and reversal of air–sea gas exchange.
Geophys. Res. Lett. 22, 219–222.
Bidleman, T.F., Alegria, H., Ngabe, B., Green, C., 1998. Trends
of chlordane and toxaphene in ambient air of columbia,
south Carolina. Atmos. Environ. 32, 1849–1856.
Chernyak, S.M., McConnell, L.L., Rice, C.P., 1995. Fate of
some chlorinated hydrocarbons in arctic and far eastern
ecosystems in the Russian Federation. Sci. Total Environ.
160/161, 75–85.
Colborn, T., Dumanoski, D., Myers, J.P., 1996. Our Stolen
Future. Dutton, New York, USA.
Corts, D.R., Basu, I., Sweet, C.W., Brice, K.A., Hoff, R.M.,
Hites, R.A., 1998. Temporal trends in gas-phase concentra-
tions of chlorinated pesticides measured at the shores of the
Great Lakes. Environ. Sci. Technol. 32, 1920–1927.
Eisenreich, S.J., 1999. Trends and dynamics of chlordanes in
the coastal atmosphere of the Mid-Atlantic United states.
Organohalogen Compds. 41, 391–394.
Halsall, C.J., Bailey, R., Stern, G.A., Barrie, L.A., Fellin, P.,
Muir, D.C.G., Rosenberg, B., Rovinsky, F.Ya., Kononov,
E.Ya., Pastukhov, B., 1998. Multi-year observations of
organohalogen pesticides in the Arctic atmosphere. Envi-
ron. Pollut. 102, 51–62.
Haugen, J.-E., Wania, F., Ritter, N., Schlabach, M., 1998.
Hexachlorocyclohexanes in air in southern norway. Tem-
poral variation, source allocation, and temperature depen-
dence. Environ. Sci. Technol. 32, 217–224.
Table 5
POP concentrations in air and seawater near Japan
Air (pg/m3) Seawater (pg/l)
Niigataa East China
SeabSouth China
SeabEast China
SeabSouth China
Seab
a-HCH 176 520 810 480 380
c-HCH 56 120 500 78 97
t-CHL 166 13 24 4.8 4.0
c-CHL 143 12 15 5.7 5.3
p,p0-DDE 10 3.7 17 3.0 1.0
p,p0-DDT 14 6.9 20 7.5 3.3
aAverage from June to September in 2000 in this study.bRef.: Iwata et al. (1993).
H. Murayama et al. / Chemosphere 52 (2003) 683–694 693
Hoff, R.M., Muir, D.C.G., Grift, N.P., 1992a. Annual cycle of
polychlorinated biphenyls and organohalogen pesticides in
air in southern Ontario. 1. Air concentration data. Environ.
Sci. Technol. 26, 266–275.
Hoff, R.M., Muir, D.C.G., Grift, N.P., 1992b. Annual cycle of
polychlorinated biphenyls and organohalogen pesticides in
air in southern Ontario. 2. Atmospheric transport and
sources. Environ. Sci. Technol. 26, 276–283.
Hoff, R.M., Brice, K.A., Halsall, C.J., 1998. Nonlinearity in the
slopes of Clausius–Clapeyron plots for SVOCs. Environ.
Sci. Technol. 32, 1793–1798.
Iwata, H., Tanabe, S., Sakai, N., Tatsukawa, R., 1993.
Distribution of persistent organochlorines in the oceanic
air and surface seawater and the role of ocean on their
global transport and fate. Environ. Sci. Technol. 27, 1080–
1098.
Kadokami, K., 1998. In Endocrine disrupter; Risk Exploratory
Committee of Environment Agency Ed., Kankyoshinbun-
sha, Japan, pp. 67–88 (in Japanese).
Kadokami, K., 1999. In: Morita, M. (Ed.), In Monitoring of
Endocrine Disrupter. CMC Books, Tokyo, Japan, pp. 1–17
(in Japanese).
Kucklick, J.R., Hinckley, D.A., Bidleman, T.F., 1991. Deter-
mination of Henry�s law constants for hexachlorocyclohex-anes in distilled water and artificial seawater as a function of
temperature. Marine Chemistry 34, 197–209.
Lane, D.A., Schroeder, W.H., Johnson, N.D., 1992. Gas- and
particle-phase concentrations of a-hexachlorocyclohexane,
r-hexachlorocyclohexane, and hexachlorobenzene in On-
tario air. Atmos. Environ. 26A, 31–42.
Leone, A.D., Ulrich, E.M., Bodnar, C.E., Falconer, R.L.,
Hites, R.A., 2000. Organochlorine pesticide concentrations
and enantiomer fractions for chlordane in indoor air from
the US cornbelt. Atmos. Environ. 34, 4131–4138.
Li, Yi-F., McMillan, A., Scholtz, M.T., 1996. Global HCH
usage with 1� 1� longitude/latitude resolution. Environ.Sci. Technol. 30, 3525–3533.
Mitobe, H., Murayama, H., Mukai, H., Moriyama, N., 2001.
GC/MS method for determination of pesticides in the
atmosphere collected by activated carbon fiber filter. J.
Environ. Chem. 11, 477–489.
Moriyama, N., Murayama, H., Kitajima, E., Urushiyama, Y.,
Kawata, K., 1990. Sampling of airborne pesticides using a
quartz fiber filter and an activated carbon fiber filter. Eisei
Kagaku 36, 299–303 (in Japanese).
Morris, C.R., Cabral J.P.R. (Eds.), 1986. Hexachlorobenzene;
publication No. 77, International Agency Research Cancer.
Murayama, H., Tanabe, A., Mukai, H., Moriyama, N., 2001.
Sensitive and selective determination of pesticides in air
using a high resolution gas chromatograph/high resolution
mass spectrometer. Bunseki Kagaku 50, 537–545 (in Japa-
nese).
Nakano, T., Tsuji, M., Okuno, T., 1987. Level of chlorinated
organic compounds in the atmosphere. Chemosphere 16,
1781–1786.
Nakano, T., 2002. The Environmental Science Institute of
Hyogo Prefecture, private communication.
Oehme, M., 1991. Further evidence for long-range air transport
of polychlorinated aromates and pesticides: North America
and Eurasia to the Arctic. Ambio 20, 293–297.
Oehme, M., Heugen, J.E., Schlabach, M., 1995. Ambient air
levels of persistent organochlorines in spring 1992 at
Spitsbergen and the Norwegian mainland: comparison with
1984 results and quality control measures. Sci. Total
Environ. 160/161, 139–152.
Oehme, M., Haugen, J.-E., Schlabach, M., 1996. Seasonal
changes and relations between levels of organochlorines in
arctic ambient air: first results of an all-year-round moni-
toring program at Ny-Alesund, Svalbard, Norway. Environ.
Sci. Technol. 30, 2294–2304.
Okumura, T., 1991. In: Proceedings of the 32th Annual
Meeting of the Japanese Society on Air Pollution Kitakyu-
shu, p. 161 (in Japanese).
Park, J.-S., Wade, T.L., Sweet, S., 2001. Atmospheric deposi-
tion of organochlorine contaminants to Galveston Bay,
Texas. Atmos. Environ. 35, 3315–3324.
Pirrone, N., Keeler, G.J., Holsen, T.M., 1995. Dry deposition
of semivolatile organic compounds to lake Michigan.
Environ. Sci. Technol. 29, 2123–2132.
Ramesh, A., Tanabe, S., Tatsukawa, R., 1989. Seasonal
variations of organochlorine insecticide residues in air from
Porto Novo, south India. Environ. Pollut. 62, 213–222.
Sofuoglu, A., Odabasi, M., Tasdemir, Y., Khalili, N.R.,
Holsen, T.M., 2001. Temperature dependence of gas-phase
polycyclic aromatic hydrocarbon and organochlorine pesti-
cide concentrations in Chicago air. Atmos. Environ. 35,
6503–6510.
Suntio, L.R., Shiu, W.Y., Mackay, D., Seiber, J.N., Glotfelty,
D., 1988. Critical review of Henry�s law constants for
pesticides. Rev. Environ. Contam. Toxicol. 103, 1–59.
Tanabe, S., 2002. Contamination and biological impacts of
persistent toxic substances in wildlife and humans from
Asia-Pacific. In: Proceedings of International Workshop on
Effects of Dioxins on Agriculture, Forestry and Fisheries
and their Mechanisms of Action on Animals and Fishes,
Tsukuba, Japan, pp. 21–35.
Wania, F., Mackay, D., 1996. Tracking the distribution of
persistent organic pollutants. Environ. Sci. Technol. 30,
390A–396A.
Wania, F., Haugen, J.-E., Lei, Y.D., Mackay, D., 1998a.
Temperature dependence of atmospheric concentrations of
semivolatile organic compounds. Environ. Sci. Technol. 32,
1013–1021.
Wania, F., Axelman, J., Broman, D., 1998b. A review of
processes involved in the exchange of persistent organic
pollutants across the air–sea interface. Environ. Pollut. 102,
3–23.
Willet, K.L., Ulrich, E.M., Hites, R.A., 1998. Differential
toxicity and environmental fates of hexachlorocyclohexane
isomers. Environ. Sci. Technol. 32, 2197–2207.
694 H. Murayama et al. / Chemosphere 52 (2003) 683–694
Copyright © 2022 FDOKUMEN