Seasonal and spatial trends in the sources of fine particle organic carbon in Israel, Jordan, and...
10
Seasonal and spatial trends in the sources of fine particle organic carbon in Israel, Jordan, and Palestine Erika von Schneidemesser a,1 , Jiabin Zhou a, b , Elizabeth A. Stone a , James J. Schauer a, * , Radwan Qasrawi c , Ziad Abdeen c , Jacob Shpund d , Arye Vanger d , Geula Sharf d , Tamar Moise e , Shmuel Brenner e , Khaled Nassar f , Rami Saleh f , Qusai M. Al-Mahasneh f , Jeremy A. Sarnat g a Environmental Chemistry and Technology Program, University of Wisconsin-Madison, 660 N. Park Street, Madison, WI 53706, United States b School of Resources and Environmental Engineering, Wuhan University of Technology, PR China c Al Quds University (AQU), East Jerusalem, Israel d Israel Union for Environmental Defense (IUED), Tel Aviv, Israel e Arava Institute for Environmental Studies (AIES), Hevel Eilot, Israel f Jordan Society for Sustainable Development (JSSD), Amman, Jordan g Environmental Health, Emory University, United States article info Article history: Received 10 December 2009 Received in revised form 31 May 2010 Accepted 23 June 2010 Keywords: Middle East Source apportionment Aerosol Carbonaceous Organic carbon abstract A study of carbonaceous particulate matter (PM) was conducted in the Middle East at sites in Israel, Jordan, and Palestine. The sources and seasonal variation of organic carbon, as well as the contribution to fine aerosol (PM 2.5 ) mass, were determined. Of the 11 sites studied, Nablus had the highest contribution of organic carbon (OC), 29%, and elemental carbon (EC), 19%, to total PM 2.5 mass. The lowest concen- trations of PM 2.5 mass, OC, and EC were measured at southern desert sites, located in Aqaba, Eilat, and Rachma. The OC contribution to PM 2.5 mass at these sites ranged between 9.4% and 16%, with mean annual PM 2.5 mass concentrations ranging from 21 to 25 ug m 3 . These sites were also observed to have the highest OC to EC ratios (4.1e5.0), indicative of smaller contributions from primary combustion sources and/or a higher contribution of secondary organic aerosol. Biomass burning and vehicular emissions were found to be important sources of carbonaceous PM in this region at the non-southern desert sites, which together accounted for 30%e55% of the fine particle organic carbon at these sites. The fraction of measured OC unapportioned to primary sources (1.4 mgC m 3 to 4.9 mgC m 3 ; 30%e74%), which has been shown to be largely from secondary organic aerosol, is relatively constant at the sites examined in this study. This suggests that secondary organic aerosol is important in the Middle East during all seasons of the year. Ó 2010 Elsevier Ltd. All rights reserved. 1. Introduction Atmospheric particulate matter has been shown to have adverse human health impacts (Pope and Dockery, 2006). A substantial amount of atmospheric particulate matter (PM) is typically comprised of carbonaceous material and has been observed to constitute greater than half of the total PM mass in many urban and remote locations (Carrico et al., 2003; Schauer et al., 1996; Sillanpaa et al., 2005; Stone et al., 2008). Recently, there has been increased attention on the health effects of the different PM components (e.g., OC and EC) beyond PM mass concentrations (e.g., Mauderly and Chow, 2008). Significant research characterizing carbonaceous PM has been conducted in Europe and North America (Schauer et al., 1996, 2003; Sheesley et al., 2004; Sillanpaa et al., 2005; Stone et al., 2008). Far less research has been conducted throughout much of the developing world and in the Middle East, specifically, to assess the chemical composition of the PM and fractional contributions of specific chemical components to total PM mass. Previous aerosol characterization studies in Israel and Jordan have focused on the associations of PM with gaseous and inorganic pollutants, such as SO x , NO x ,O 3 , trace elements, and limited anions and cations (Asaf et al., 2008; Erel et al., 2007; Hamdi et al., 2008; Hirsch et al., 1981; Jaradat et al., 1997; Luria et al., 1985; Perrino et al., 2009; Yuval and Broday, 2006). Moreover, to our knowledge, no studies of PM components or sources have been published that address measurements made in any Palestinian locations. A limited * Corresponding author. Tel.: þ1 (608) 262 4495; fax: þ1 (608) 262 0454. E-mail address: [email protected] (J.J. Schauer). 1 Now at: Atmospheric Chemistry Group, Chemistry Department, University of Leicester. Contents lists available at ScienceDirect Atmospheric Environment journal homepage: www.elsevier.com/locate/atmosenv 1352-2310/$ e see front matter Ó 2010 Elsevier Ltd. All rights reserved. doi:10.1016/j.atmosenv.2010.06.039 Atmospheric Environment 44 (2010) 3669e3678
Transcript of Seasonal and spatial trends in the sources of fine particle organic carbon in Israel, Jordan, and...
lable at ScienceDirect
Atmospheric Environment 44 (2010) 3669e3678
Contents lists avai
Atmospheric Environment
journal homepage: www.elsevier .com/locate/atmosenv
Seasonal and spatial trends in the sources of fine particle organiccarbon in Israel, Jordan, and Palestine
Erika von Schneidemesser a,1, Jiabin Zhou a,b, Elizabeth A. Stone a, James J. Schauer a,*, Radwan Qasrawi c,Ziad Abdeen c, Jacob Shpund d, Arye Vanger d, Geula Sharf d, Tamar Moise e, Shmuel Brenner e,Khaled Nassar f, Rami Saleh f, Qusai M. Al-Mahasneh f, Jeremy A. Sarnat g
a Environmental Chemistry and Technology Program, University of Wisconsin-Madison, 660 N. Park Street, Madison, WI 53706, United Statesb School of Resources and Environmental Engineering, Wuhan University of Technology, PR ChinacAl Quds University (AQU), East Jerusalem, Israeld Israel Union for Environmental Defense (IUED), Tel Aviv, IsraeleArava Institute for Environmental Studies (AIES), Hevel Eilot, Israelf Jordan Society for Sustainable Development (JSSD), Amman, Jordang Environmental Health, Emory University, United States
a r t i c l e i n f o
Article history:Received 10 December 2009Received in revised form31 May 2010Accepted 23 June 2010
Keywords:Middle EastSource apportionmentAerosolCarbonaceousOrganic carbon
* Corresponding author. Tel.: þ1 (608) 262 4495; fE-mail address: [email protected] (J.J. Schauer).
1 Now at: Atmospheric Chemistry Group, ChemistLeicester.
1352-2310/$ e see front matter � 2010 Elsevier Ltd.doi:10.1016/j.atmosenv.2010.06.039
a b s t r a c t
A study of carbonaceous particulate matter (PM) was conducted in the Middle East at sites in Israel,Jordan, and Palestine. The sources and seasonal variation of organic carbon, as well as the contribution tofine aerosol (PM2.5) mass, were determined. Of the 11 sites studied, Nablus had the highest contributionof organic carbon (OC), 29%, and elemental carbon (EC), 19%, to total PM2.5 mass. The lowest concen-trations of PM2.5 mass, OC, and EC were measured at southern desert sites, located in Aqaba, Eilat, andRachma. The OC contribution to PM2.5 mass at these sites ranged between 9.4% and 16%, with meanannual PM2.5 mass concentrations ranging from 21 to 25 ugm�3. These sites were also observed to havethe highest OC to EC ratios (4.1e5.0), indicative of smaller contributions from primary combustionsources and/or a higher contribution of secondary organic aerosol. Biomass burning and vehicularemissions were found to be important sources of carbonaceous PM in this region at the non-southerndesert sites, which together accounted for 30%e55% of the fine particle organic carbon at these sites. Thefraction of measured OC unapportioned to primary sources (1.4 mgCm�3 to 4.9 mgCm�3; 30%e74%),which has been shown to be largely from secondary organic aerosol, is relatively constant at the sitesexamined in this study. This suggests that secondary organic aerosol is important in the Middle Eastduring all seasons of the year.
� 2010 Elsevier Ltd. All rights reserved.
1. Introduction
Atmospheric particulate matter has been shown to have adversehuman health impacts (Pope and Dockery, 2006). A substantialamount of atmospheric particulate matter (PM) is typicallycomprised of carbonaceous material and has been observed toconstitute greater than half of the total PM mass in many urban andremote locations (Carrico et al., 2003; Schauer et al., 1996; Sillanpaaet al., 2005; Stone et al., 2008). Recently, there has been increasedattention on the health effects of the different PM components
ax: þ1 (608) 262 0454.
ry Department, University of
All rights reserved.
(e.g., OC and EC) beyond PMmass concentrations (e.g., Mauderly andChow, 2008). Significant research characterizing carbonaceous PMhas been conducted in Europe and North America (Schauer et al.,1996, 2003; Sheesley et al., 2004; Sillanpaa et al., 2005; Stone et al.,2008). Far less research has been conducted throughout much ofthedevelopingworld and in theMiddle East, specifically, to assess thechemical composition of the PM and fractional contributions ofspecific chemical components to total PM mass.
Previous aerosol characterization studies in Israel and Jordanhave focused on the associations of PM with gaseous and inorganicpollutants, such as SOx, NOx, O3, trace elements, and limited anionsand cations (Asaf et al., 2008; Erel et al., 2007; Hamdi et al., 2008;Hirsch et al., 1981; Jaradat et al., 1997; Luria et al., 1985; Perrinoet al., 2009; Yuval and Broday, 2006). Moreover, to our knowledge,no studies of PM components or sources have been published thataddress measurements made in any Palestinian locations. A limited
E. von Schneidemesser et al. / Atmospheric Environment 44 (2010) 3669e36783670
number of published studies in the region provide information onthe carbonaceous contribution to PMand the characterization of thecarbonaceous aerosol component (Graham et al., 2004; Perrinoet al., 2009). Graham et al. (2004) published results from a studyin Tel Aviv during December 2000 which characterized the organicand elemental carbon portion of the PM, including some speciationof acids, sugars, polycyclic aromatic hydrocarbons (PAHs), andanhydrosugars (e.g. levoglucosan) in the OC portion. More recently,Perrino et al. (2009) determined the bulk composition of PM2.5during an intensive summertime study in the Ashdod area of Israel,which included the fraction apportioned to organic material(primary and secondary).
This study examines the spatial and temporal differences inorganic carbon (OC) and its contribution to PM mass over thecourse of an entire calendar year. Chemically-speciated organicparticulate matter was used to investigate differences in the spatialand seasonal organic PM trends. Using these chemically-resolvedmeasurements, we applied a chemical mass balance sourceapportionment model to assess the spatial and seasonal variationsin source contributions at 11 sites in Israel, Jordan, and Palestine.Numerous chemical mass balance studies of organic PM have beenconducted in North America and Asia (Chowdhury et al., 2007;Schauer et al., 1996; Stone et al., 2008; Zheng et al., 2002, 2005,2006). To our knowledge, however, no comparable analyses oforganic PM sources have been conducted in regions such as theMiddle East, which typically have very different climatic andecological conditions compared to the sites examined previously.
2. Methods
Aerosol particulate matter was collected at eleven sites in Israel,Jordan, and Palestine for one calendar year (January throughDecember 2007). The Israeli sampling sites were located in Eilat,Haifa, Tel Aviv, and West Jerusalem; the Jordanian sites were inAmman, Aqaba, Rachma, and Zarka; and the Palestinian sites werein East Jerusalem, Hebron, and Nablus. PM2.5 samples werecollected on 47 mm filters (2 Teflon, 1 quartz fiber) for 24 h(midnight to midnight) every 6th day using a multi-channel airsampler fabricated specifically for this project (URG Corporation).For sampler details see von Schneidemesser et al. (2009).
2.1. Site descriptions
All sites were located within an area of approximately70,000 sq km bordering on the eastern Mediterranean Sea. Themost southerly sites were on the northern coast of the Red Sea. TheJordan River runs north-south along the border of Jordan and Israel,in the Rift Valley and ends in the Dead Sea. The area of studyincluded arid desert, areas of fertile farmland near the Mediterra-nean coast, as well as somemountainous areas in the northwesternarea of Israel. The area’s climate can be broadly classified as havinga rainy season during the autumn and winter months (October toApril), and a dry, hot summer season from approximately June toSeptember. Atmany sites temperatures reach dailymaxima of 40 �Cin the summer and are moderately cool in the winter, and in certainregions it does occasionally snow in the winter.
2.2. Israeli site details
Eilat is located at the southern tip of Israel on the coastline of theDead Sea at approximately 55 m above sea level (asl). The airsampler was located on the top of a school building at about 11 mabove ground level. The surrounding area is residential, witha population density of 525 persons sq. km�1, and a total populationof approximately 46,000 (CBS, 2009).
Haifa is also located along the Mediterranean coastline, in thenorthern part of Israel, at w220 m asl. The sampler was located onthe rooftop of the Neve Shaanan Tel Hai School at 10 m aboveground level in a residential neighborhood. The population densitywas approximately 5000 persons sq. km�1 and approximately265,000 persons total (CBS, 2009).
Tel Aviv is just under 100 km south of Haifa on thewestern coastof Israel on the Mediterranean Sea at 30 m asl. The sampling sitewas located in a residential area on top of the geography building ofTel Aviv University at 5 m above ground level. The populationdensity of Tel Aviv was about 10,000 persons sq. km�1 with a totalpopulation of w390,000 persons (CBS, 2009).
West Jerusalem is w765 m asl and has a population density ofapproximately 5600 persons sq. km�1. The total population of Eastand West Jerusalem is approximately 750,000 persons (CBS, 2009).The sampling site in West Jerusalem was located at HebrewUniversity on the Givat Ram campus on top of the Earth SciencesBuilding at 14 m above ground level. The surrounding area isuniversity-owned property, green space, and residential. Withina few hundred meters of the site is Begin Expressway, an urbanfour-lane highway, which at this point is located in a sunkencorridor slightly below ground level.
2.3. Jordanian site details
Amman is located in the northwestern quadrant of Jordanapproximately 50 km from the Israeli border. The city of Amman isat an elevation of just over 1000 m asl, with a population density ofapproximately 2000persons sq. km�1 and about 2.3millionpersonstotal (DOS, 2004). The sampling site in Amman was located on theroof of a primary school (12 m above ground level) in a commercialand residential area, 250 m away from the nearest roadway.
Zarka is located approximately 20 km to the northeast ofAmman. The sampling site in Zarka was located on top ofa secondary school at 13 m above ground level, in a commercial andresidential area, and w300 m away from the nearest roadway.Zarka is a heavily industrialized urban center, approximately 650 masl with a population of approximately 890,000 persons anda population density of w1750 persons sq. km�1 (DOS, 2004).
Aqaba is located in the southwest corner of Jordan, across theborder from Eilat, Israel, on the Dead Sea at an elevation of 36 m asl.The population density of Aqaba is w40 persons sq. km�1 witha total population of about 130,000 persons (DOS, 2004). Thesampling site was located on the rooftop of That Al-Sawari School(10 m above ground level) in a residential area.
Rachma, approximately 40e50 km north of Aqaba on the borderwith Israel is considered the rural/background site. It is a desert site,184 m asl, with a population density of 2 persons sq. km�1 and 1500persons total (DOS, 2004). The sampler was located 8 m aboveground level on top of a secondary school, w300 m from thenearest road.
2.4. Palestinian site details
East Jerusalem encompasses the predominantly Palestinianneighborhoods of Jerusalem. The East Jerusalem sampling site waslocated in close proximity (w3.7 km) to the West Jerusalem site, atan elevation of 650 m asl. The population density of East Jerusalemis roughly 5000 persons sq. km�1. The population of East Jerusalemwas estimated at approximately 225,000 persons (PCBS, 2010). Thesampling site was located on the rooftop (20 m above ground level)of the College of Arts building of Al-Quds University, in a residentialand commercial area that includes some undeveloped dirt/gravellots. It was a few hundred meters from a main roadway (Road 60)that transects Jerusalem.
E. von Schneidemesser et al. / Atmospheric Environment 44 (2010) 3669e3678 3671
Hebron is 35 km south of Jerusalem, sits 900 m asl, and hasa total population ofw551,000 persons and a population density ofroughly 9000 persons sq. km�1 (PCBS, 2008). The sampling sitewaslocated 5 m above ground level on the roof of a private residence.
Nablus is located 50 km north of Jerusalem, 575 m asl, witha population density of 7000 persons sq. km�1 and a total pop-ulation of approximately 321,000 persons (PCBS, 2008). Thesampling site was on the rooftop of the Water and WastewaterDepartment at 10 m above ground level in a residential area.
2.5. Filter analysis
Two methods were used to analyze the filter samples,a thermal-optical method for total organic carbon, and GC-MS forspeciated organic compounds. First, each quartz fiber filter (QFF)was analyzed for OC and elemental carbon (EC) using a thermaloptical transmittance method (Sunset Laboratory, Inc., ForestGrove, OR) (Schauer et al., 2003). In this method a filter punch isplaced in the oven and heated up to 870 �C during which the OC isevolved under a He gas stream, cooled and then reheated to evolveEC under a stream of He gas with O2. The evolved carbon gases areconverted to CO2 and quantified with an infrared detector. Lasertransmittance through the filter during the heating and coolingcycles is used to determine the EC/OC split (Schauer et al., 2003).
Second, quartz fiber filter quarters were composited seasonally toensure enough extractable carbonaceous material. Seasonalcomposites were winter (January, February, March), spring (April,May, June), summer (July, August, September), and autumn (October,November, December). QFF composites from the following sitescontained all fourfilter quarters, Aqaba, Eilat, Haifa, Rachma, Tel Aviv,and West and East Jerusalem; the remaining sites had QFF compos-ites consisting of two filter quarters due to higher OC loadings. Theseasonal composites of the sampled QFFs and parallel field blankQFFswere solvent extracted by sonicationwith dichloromethane andmethanol. The extractswere concentrated by rotary evaporation, andunder a stream of nitrogen gas to a final volume of 250 mL. Theextracts were analyzed for individual organic source tracercompounds by GC-MS (Sheesley et al., 2004). Furthermethod detailsare given in Sheesley et al. (2004).
Additionally, individual Teflon filters (Pall Life Sciences) wereanalyzed for mass, inorganic ions, and metals. Mass was analyzedgravimetrically; water soluble ions were analyzed by ion chroma-tography; and metals were analyzed by X-ray fluorescence (XRF)(Kellog and Winberry, 1999).
Table 1Annual average and standard deviation of PM2.5 mass, organic and elemental carbon (Oelemental carbon ratio.
Site PM2.5 Mass(mgm�3)
OC (mgm�3) OC contribto mass (%
Israeli SitesEilat 21� 4 3.3� 0.6 16� 3Haifa 24� 8 3.5� 0.9 15� 4Tel Aviv 32� 7 4.8� 1.3 16� 7West Jerusalem 25� 9 4.5� 1.7 18� 2
Jordanian SitesAmman 40� 9 6.7� 0.5 18� 5Aqabah 25� 6 3.7� 0.7 15� 2Rachma 25� 7 2.2� 0.2 9.4� 2.5Zarka 37� 7 9.1� 1.7 25� 5
Palestinian SitesEast Jerusalem 27� 10 5.6� 1.4 21� 4Hebron 23� 5 5.8� 0.9 27� 9Nablus 31� 6 8.6� 1.3 29� 5
2.6. Source apportionment
Source apportionment calculations were conducted using theEPA chemical mass balance (CMB) model version 8.2. The CMBmodel produces an effective variance weighted least squaressolution of OC source contributions, taking the uncertainties of themeasured ambient data and the source profiles into account(Watson et al., 1984). Source apportionment modeling wasemployed for each site using the seasonal speciated organiccompound data and complementary metals data. The followingcompounds were included in the CMBmodel: elemental carbon, Si,Al, Ni, V, C27, C29, and C31 n-alkanes, levoglucosan, abb-20(Rþ S)-C27-cholestane, abb-20(Rþ S)-C29-sitostane, 17a(H)-22,29,30-tris-norhopane, 17b(H)-21a(H)-norhopane, 17a(H)-21b(H)-hopane,benzo[b]fluoranthene, benzo[k]fluoranthene, benzo[e]pyrene,indeno(1,2,3-cd)pyrene, benzo(ghi)perylene, and picene. Thesource profiles used include vegetative detritus (Rogge et al., 1993),biomass burning (Lee et al., 2005), three vehicle source profiles,including a profile for diesel vehicles, one for gasoline vehicles, andone for non-catalyzed/poorly maintained gasoline vehicles (Loughet al., 2007), ship emissions/residual fuel oil (Yuan et al., 2006),a local soil/dust profile (von Schneidemesser et al., 2009), and coalsoot (Zhang et al., 2008). While the source profiles were not derivedfrom studies in the Middle East (as those do not exist, with theexception of the soil/dust profile developed as a part of this study),source profiles were chosen based on their applicability to the typeof emissions expected from each source category in the region.Previous sensitivity studies investigating the effect of differentbiomass burning profiles on the CMB model results found that themodel output reasonable results within a 30% standard deviationregardless for a wide range of biomass sources and burningconditions (Sheesley et al., 2007). All three vehicle source profilesused are based primarily on emissions from tracers originating inthe lubricating oil used in vehicles and not on the fuel used in thevehicles, which is globally more uniform than fuel usage. The coalcombustion profile is representative of poorly optimized, inefficientburning conditions that would be applicable to small scale indus-trial processes or residential use (Rutter et al., 2009).
All model runs were performed using the same set of sourceprofiles for all sites, with the following one exception. The vege-tative detritus source was omitted for Haifa in the winter seasonbecause the n-alkanes displayed no odd-even preference, whichsuggested that these compounds were not associated with vege-tative detritus and were from an anthropogenic source. At all of the
C and EC), organic and elemental carbon contribution to mass, and the organic to
ution)
EC (mgm�3) EC contributionto mass (%)
OC:EC ratio
0.82� 0.10 4.1� 1.2 4.1� 0.91.0� 0.04 4.7� 1.6 3.3� 0.081.6� 0.5 5.3� 2.7 3.1� 0.41.3� 0.3 5.3� 2.0 3.7� 1.1
2.6� 0.8 6.7� 2.9 2.8� 0.70.92� 0.22 3.9� 1.2 4.1� 1.00.45� 0.10 2.0� 0.9 5.0� 0.84.3� 1.8 12� 5.1 2.3� 0.6
2.2� 0.5 9.1� 3.8 2.6� 0.71.9� 0.4 8.8� 2.7 3.0� 0.45.7� 0.6 19� 4.9 1.5� 0.4
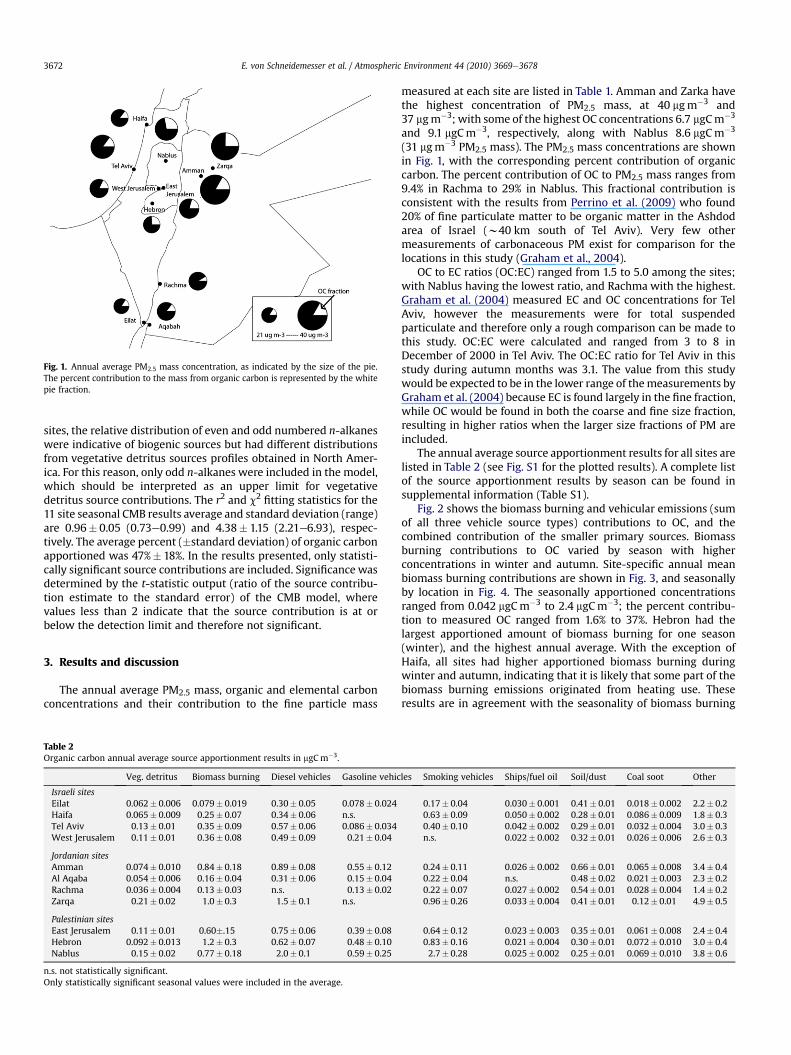
Fig. 1. Annual average PM2.5 mass concentration, as indicated by the size of the pie.The percent contribution to the mass from organic carbon is represented by the whitepie fraction.
E. von Schneidemesser et al. / Atmospheric Environment 44 (2010) 3669e36783672
sites, the relative distribution of even and odd numbered n-alkaneswere indicative of biogenic sources but had different distributionsfrom vegetative detritus sources profiles obtained in North Amer-ica. For this reason, only odd n-alkanes were included in the model,which should be interpreted as an upper limit for vegetativedetritus source contributions. The r2 and c2 fitting statistics for the11 site seasonal CMB results average and standard deviation (range)are 0.96� 0.05 (0.73e0.99) and 4.38� 1.15 (2.21e6.93), respec-tively. The average percent (�standard deviation) of organic carbonapportioned was 47%� 18%. In the results presented, only statisti-cally significant source contributions are included. Significance wasdetermined by the t-statistic output (ratio of the source contribu-tion estimate to the standard error) of the CMB model, wherevalues less than 2 indicate that the source contribution is at orbelow the detection limit and therefore not significant.
3. Results and discussion
The annual average PM2.5 mass, organic and elemental carbonconcentrations and their contribution to the fine particle mass
Table 2Organic carbon annual average source apportionment results in mgCm�3.
Veg. detritus Biomass burning Diesel vehicles Gasoline vehic
Israeli sitesEilat 0.062� 0.006 0.079� 0.019 0.30� 0.05 0.078� 0.024Haifa 0.065� 0.009 0.25� 0.07 0.34� 0.06 n.s.Tel Aviv 0.13� 0.01 0.35� 0.09 0.57� 0.06 0.086� 0.034West Jerusalem 0.11� 0.01 0.36� 0.08 0.49� 0.09 0.21� 0.04
Jordanian sitesAmman 0.074� 0.010 0.84� 0.18 0.89� 0.08 0.55� 0.12Al Aqaba 0.054� 0.006 0.16� 0.04 0.31� 0.06 0.15� 0.04Rachma 0.036� 0.004 0.13� 0.03 n.s. 0.13� 0.02Zarqa 0.21� 0.02 1.0� 0.3 1.5� 0.1 n.s.
Palestinian sitesEast Jerusalem 0.11� 0.01 0.60�.15 0.75� 0.06 0.39� 0.08Hebron 0.092� 0.013 1.2� 0.3 0.62� 0.07 0.48� 0.10Nablus 0.15� 0.02 0.77� 0.18 2.0� 0.1 0.59� 0.25
n.s. not statistically significant.Only statistically significant seasonal values were included in the average.
measured at each site are listed in Table 1. Amman and Zarka havethe highest concentration of PM2.5 mass, at 40 mgm�3 and37 mgm�3; with some of the highest OC concentrations 6.7 mgCm�3
and 9.1 mgCm�3, respectively, along with Nablus 8.6 mgCm�3
(31 mgm�3 PM2.5 mass). The PM2.5 mass concentrations are shownin Fig. 1, with the corresponding percent contribution of organiccarbon. The percent contribution of OC to PM2.5 mass ranges from9.4% in Rachma to 29% in Nablus. This fractional contribution isconsistent with the results from Perrino et al. (2009) who found20% of fine particulate matter to be organic matter in the Ashdodarea of Israel (w40 km south of Tel Aviv). Very few othermeasurements of carbonaceous PM exist for comparison for thelocations in this study (Graham et al., 2004).
OC to EC ratios (OC:EC) ranged from 1.5 to 5.0 among the sites;with Nablus having the lowest ratio, and Rachma with the highest.Graham et al. (2004) measured EC and OC concentrations for TelAviv, however the measurements were for total suspendedparticulate and therefore only a rough comparison can be made tothis study. OC:EC were calculated and ranged from 3 to 8 inDecember of 2000 in Tel Aviv. The OC:EC ratio for Tel Aviv in thisstudy during autumn months was 3.1. The value from this studywould be expected to be in the lower range of themeasurements byGraham et al. (2004) because EC is found largely in the fine fraction,while OC would be found in both the coarse and fine size fraction,resulting in higher ratios when the larger size fractions of PM areincluded.
The annual average source apportionment results for all sites arelisted in Table 2 (see Fig. S1 for the plotted results). A complete listof the source apportionment results by season can be found insupplemental information (Table S1).
Fig. 2 shows the biomass burning and vehicular emissions (sumof all three vehicle source types) contributions to OC, and thecombined contribution of the smaller primary sources. Biomassburning contributions to OC varied by season with higherconcentrations in winter and autumn. Site-specific annual meanbiomass burning contributions are shown in Fig. 3, and seasonallyby location in Fig. 4. The seasonally apportioned concentrationsranged from 0.042 mgCm�3 to 2.4 mgCm�3; the percent contribu-tion to measured OC ranged from 1.6% to 37%. Hebron had thelargest apportioned amount of biomass burning for one season(winter), and the highest annual average. With the exception ofHaifa, all sites had higher apportioned biomass burning duringwinter and autumn, indicating that it is likely that some part of thebiomass burning emissions originated from heating use. Theseresults are in agreement with the seasonality of biomass burning
les Smoking vehicles Ships/fuel oil Soil/dust Coal soot Other
0.17� 0.04 0.030� 0.001 0.41� 0.01 0.018� 0.002 2.2� 0.20.63� 0.09 0.050� 0.002 0.28� 0.01 0.086� 0.009 1.8� 0.30.40� 0.10 0.042� 0.002 0.29� 0.01 0.032� 0.004 3.0� 0.3n.s. 0.022� 0.002 0.32� 0.01 0.026� 0.006 2.6� 0.3
0.24� 0.11 0.026� 0.002 0.66� 0.01 0.065� 0.008 3.4� 0.40.22� 0.04 n.s. 0.48� 0.02 0.021� 0.003 2.3� 0.20.22� 0.07 0.027� 0.002 0.54� 0.01 0.028� 0.004 1.4� 0.20.96� 0.26 0.033� 0.004 0.41� 0.01 0.12� 0.01 4.9� 0.5
0.64� 0.12 0.023� 0.003 0.35� 0.01 0.061� 0.008 2.4� 0.40.83� 0.16 0.021� 0.004 0.30� 0.01 0.072� 0.010 3.0� 0.42.7� 0.28 0.025� 0.002 0.25� 0.01 0.069� 0.010 3.8� 0.6
Spring (April - June)
Ha
ifa
Te
l A
viv
Nab
lu
s
W J
eru
sa
lem
E Jeru
salem
Heb
ro
n
Am
man
Zarq
a
Ra
ch
ma
Eila
t
Aq
ab
ah
0
2
4
6
8
10
12
Winter (January - March)
Ha
ifa
Te
l A
viv
Nab
lu
s
W J
eru
sa
lem
E Jeru
salem
Heb
ro
n
Am
man
Zarq
a
Ra
ch
ma
Eila
t
Aq
ab
ah
gC
m
-3
0
2
4
6
8
10
12
Biomass BurningVehicular EmissionsOther Apportioned SourcesMeasured OC
Autumn (October - December)
Ha
ifa
Tel A
viv
Nab
lu
s
W J
eru
sa
le
m
E Jeru
salem
Heb
ro
n
Am
man
Zarq
a
Ra
ch
ma
Eila
t
Aq
ab
ah
0
2
4
6
8
10
12
Summer (July - September)
Haifa
Te
l A
viv
Nab
lu
s
W J
eru
sa
le
m
E J
eru
sa
le
m
Heb
ro
n
Am
man
Zarq
a
Rach
ma
Eilat
Aq
ab
ah
-3
0
2
4
6
8
10
12
a b
dc
gC
m
-3
gC
m
-3
gC
m
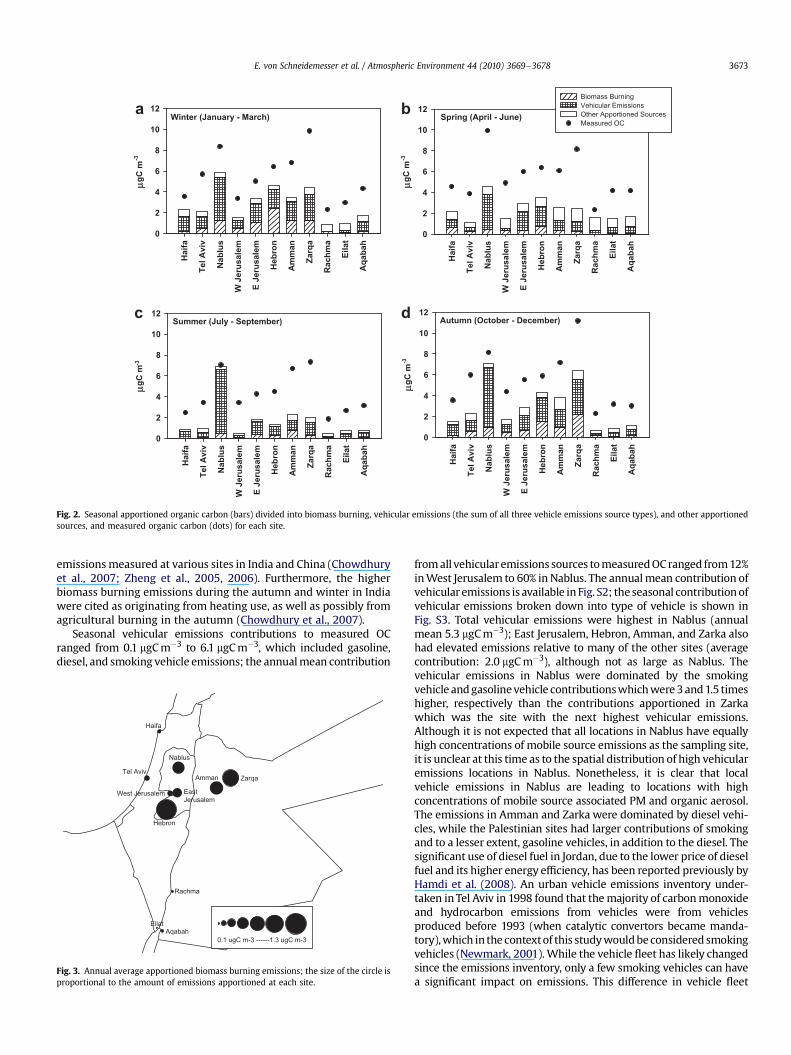
Fig. 2. Seasonal apportioned organic carbon (bars) divided into biomass burning, vehicular emissions (the sum of all three vehicle emissions source types), and other apportionedsources, and measured organic carbon (dots) for each site.
E. von Schneidemesser et al. / Atmospheric Environment 44 (2010) 3669e3678 3673
emissionsmeasured at various sites in India and China (Chowdhuryet al., 2007; Zheng et al., 2005, 2006). Furthermore, the higherbiomass burning emissions during the autumn and winter in Indiawere cited as originating from heating use, as well as possibly fromagricultural burning in the autumn (Chowdhury et al., 2007).
Seasonal vehicular emissions contributions to measured OCranged from 0.1 mgCm�3 to 6.1 mgCm�3, which included gasoline,diesel, and smoking vehicle emissions; the annualmean contribution
Haifa
Tel Aviv
West Jerusalem East Jerusalem
Hebron
Rachma
Eilat Aqabah
Amman Zarqa
Nablus
0.1 ugC m-3 ------1.3 ugC m-3
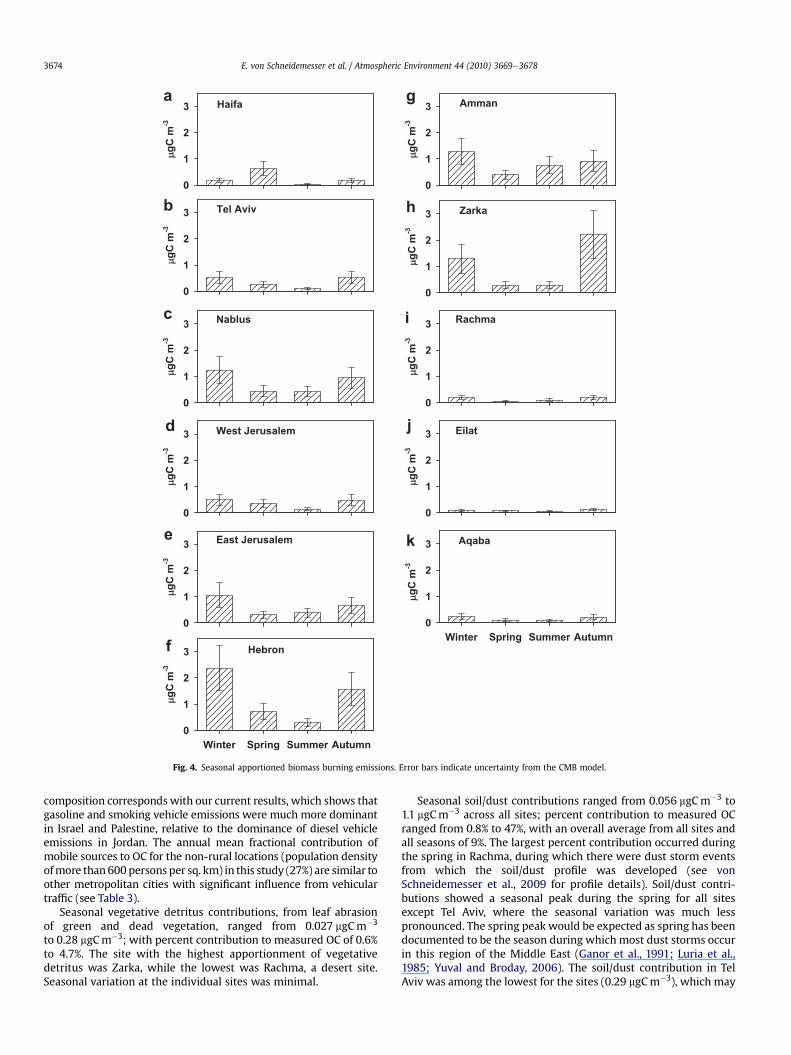
Fig. 3. Annual average apportioned biomass burning emissions; the size of the circle isproportional to the amount of emissions apportioned at each site.
fromall vehicularemissions sources tomeasuredOCranged from12%inWest Jerusalem to 60% in Nablus. The annualmean contribution ofvehicular emissions is available in Fig. S2; the seasonal contributionofvehicular emissions broken down into type of vehicle is shown inFig. S3. Total vehicular emissions were highest in Nablus (annualmean 5.3 mgCm�3); East Jerusalem, Hebron, Amman, and Zarka alsohad elevated emissions relative to many of the other sites (averagecontribution: 2.0 mgCm�3), although not as large as Nablus. Thevehicular emissions in Nablus were dominated by the smokingvehicle andgasolinevehicle contributionswhichwere3and1.5 timeshigher, respectively than the contributions apportioned in Zarkawhich was the site with the next highest vehicular emissions.Although it is not expected that all locations in Nablus have equallyhigh concentrations of mobile source emissions as the sampling site,it is unclear at this time as to the spatial distribution of high vehicularemissions locations in Nablus. Nonetheless, it is clear that localvehicle emissions in Nablus are leading to locations with highconcentrations of mobile source associated PM and organic aerosol.The emissions in Amman and Zarka were dominated by diesel vehi-cles, while the Palestinian sites had larger contributions of smokingand to a lesser extent, gasoline vehicles, in addition to the diesel. Thesignificant use of diesel fuel in Jordan, due to the lower price of dieselfuel and its higher energy efficiency, has been reported previously byHamdi et al. (2008). An urban vehicle emissions inventory under-taken inTel Aviv in 1998 found that themajority of carbonmonoxideand hydrocarbon emissions from vehicles were from vehiclesproduced before 1993 (when catalytic convertors became manda-tory),which in the contextof this studywouldbeconsidered smokingvehicles (Newmark, 2001).While the vehicle fleet has likely changedsince the emissions inventory, only a few smoking vehicles can havea significant impact on emissions. This difference in vehicle fleet
a
b
c
d
e
f
g
h
i
j
k
Fig. 4. Seasonal apportioned biomass burning emissions. Error bars indicate uncertainty from the CMB model.
E. von Schneidemesser et al. / Atmospheric Environment 44 (2010) 3669e36783674
composition corresponds with our current results, which shows thatgasoline and smoking vehicle emissions were much more dominantin Israel and Palestine, relative to the dominance of diesel vehicleemissions in Jordan. The annual mean fractional contribution ofmobile sources to OC for the non-rural locations (population densityofmore than600 persons per sq. km) in this study (27%) are similar toother metropolitan cities with significant influence from vehiculartraffic (see Table 3).
Seasonal vegetative detritus contributions, from leaf abrasionof green and dead vegetation, ranged from 0.027 mgCm�3
to 0.28 mgCm�3; with percent contribution to measured OC of 0.6%to 4.7%. The site with the highest apportionment of vegetativedetritus was Zarka, while the lowest was Rachma, a desert site.Seasonal variation at the individual sites was minimal.
Seasonal soil/dust contributions ranged from 0.056 mgCm�3 to1.1 mgCm�3 across all sites; percent contribution to measured OCranged from 0.8% to 47%, with an overall average from all sites andall seasons of 9%. The largest percent contribution occurred duringthe spring in Rachma, during which there were dust storm eventsfrom which the soil/dust profile was developed (see vonSchneidemesser et al., 2009 for profile details). Soil/dust contri-butions showed a seasonal peak during the spring for all sitesexcept Tel Aviv, where the seasonal variation was much lesspronounced. The spring peak would be expected as spring has beendocumented to be the season during which most dust storms occurin this region of the Middle East (Ganor et al., 1991; Luria et al.,1985; Yuval and Broday, 2006). The soil/dust contribution in TelAviv was among the lowest for the sites (0.29 mgCm�3), which may
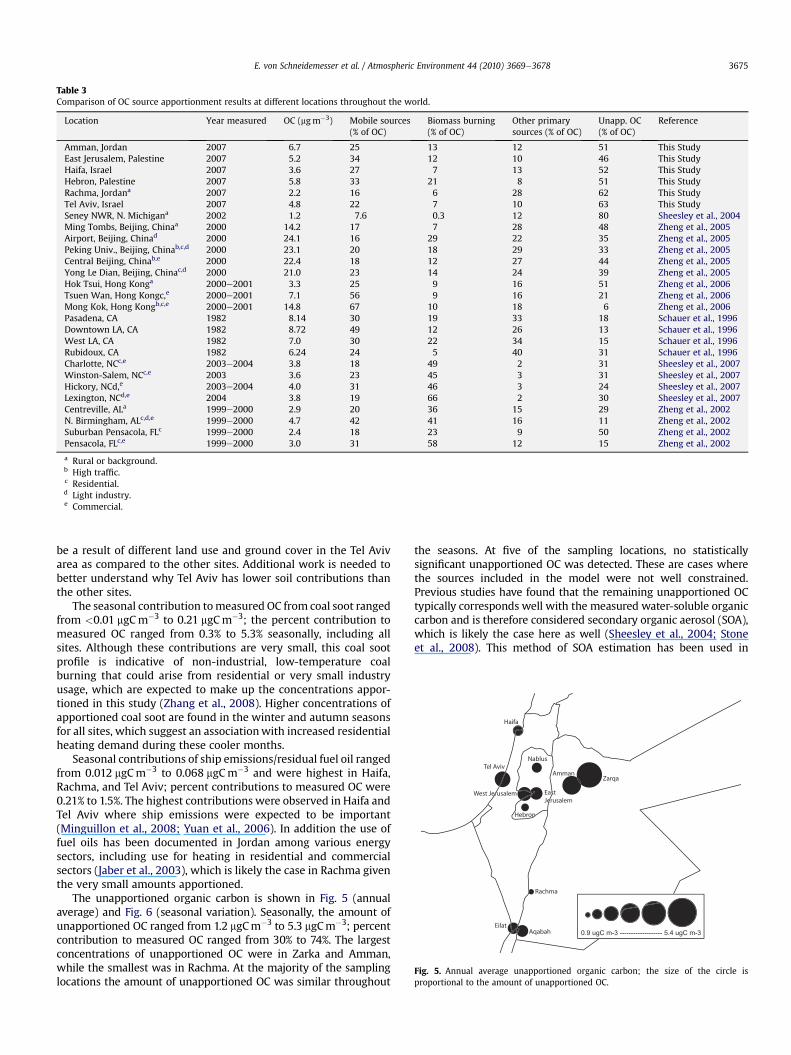
Table 3Comparison of OC source apportionment results at different locations throughout the world.
Location Year measured OC (mgm�3) Mobile sources(% of OC)
Biomass burning(% of OC)
Other primarysources (% of OC)
Unapp. OC(% of OC)
Reference
Amman, Jordan 2007 6.7 25 13 12 51 This StudyEast Jerusalem, Palestine 2007 5.2 34 12 10 46 This StudyHaifa, Israel 2007 3.6 27 7 13 52 This StudyHebron, Palestine 2007 5.8 33 21 8 51 This StudyRachma, Jordana 2007 2.2 16 6 28 62 This StudyTel Aviv, Israel 2007 4.8 22 7 10 63 This StudySeney NWR, N. Michigana 2002 1.2 7.6 0.3 12 80 Sheesley et al., 2004Ming Tombs, Beijing, Chinaa 2000 14.2 17 7 28 48 Zheng et al., 2005Airport, Beijing, Chinad 2000 24.1 16 29 22 35 Zheng et al., 2005Peking Univ., Beijing, Chinab,c,d 2000 23.1 20 18 29 33 Zheng et al., 2005Central Beijing, Chinab,e 2000 22.4 18 12 27 44 Zheng et al., 2005Yong Le Dian, Beijing, Chinac,d 2000 21.0 23 14 24 39 Zheng et al., 2005Hok Tsui, Hong Konga 2000e2001 3.3 25 9 16 51 Zheng et al., 2006Tsuen Wan, Hong Kongc,e 2000e2001 7.1 56 9 16 21 Zheng et al., 2006Mong Kok, Hong Kongb,c,e 2000e2001 14.8 67 10 18 6 Zheng et al., 2006Pasadena, CA 1982 8.14 30 19 33 18 Schauer et al., 1996Downtown LA, CA 1982 8.72 49 12 26 13 Schauer et al., 1996West LA, CA 1982 7.0 30 22 34 15 Schauer et al., 1996Rubidoux, CA 1982 6.24 24 5 40 31 Schauer et al., 1996Charlotte, NCc,e 2003e2004 3.8 18 49 2 31 Sheesley et al., 2007Winston-Salem, NCc,e 2003 3.6 23 45 3 31 Sheesley et al., 2007Hickory, NCd,e 2003e2004 4.0 31 46 3 24 Sheesley et al., 2007Lexington, NCd,e 2004 3.8 19 66 2 30 Sheesley et al., 2007Centreville, ALa 1999e2000 2.9 20 36 15 29 Zheng et al., 2002N. Birmingham, ALc,d,e 1999e2000 4.7 42 41 16 11 Zheng et al., 2002Suburban Pensacola, FLc 1999e2000 2.4 18 23 9 50 Zheng et al., 2002Pensacola, FLc,e 1999e2000 3.0 31 58 12 15 Zheng et al., 2002
a Rural or background.b High traffic.c Residential.d Light industry.e Commercial.
Fig. 5. Annual average unapportioned organic carbon; the size of the circle isproportional to the amount of unapportioned OC.
E. von Schneidemesser et al. / Atmospheric Environment 44 (2010) 3669e3678 3675
be a result of different land use and ground cover in the Tel Avivarea as compared to the other sites. Additional work is needed tobetter understand why Tel Aviv has lower soil contributions thanthe other sites.
The seasonal contribution tomeasured OC from coal soot rangedfrom <0.01 mgCm�3 to 0.21 mgCm�3; the percent contribution tomeasured OC ranged from 0.3% to 5.3% seasonally, including allsites. Although these contributions are very small, this coal sootprofile is indicative of non-industrial, low-temperature coalburning that could arise from residential or very small industryusage, which are expected to make up the concentrations appor-tioned in this study (Zhang et al., 2008). Higher concentrations ofapportioned coal soot are found in the winter and autumn seasonsfor all sites, which suggest an associationwith increased residentialheating demand during these cooler months.
Seasonal contributions of ship emissions/residual fuel oil rangedfrom 0.012 mgCm�3 to 0.068 mgCm�3 and were highest in Haifa,Rachma, and Tel Aviv; percent contributions to measured OC were0.21% to 1.5%. The highest contributions were observed in Haifa andTel Aviv where ship emissions were expected to be important(Minguillon et al., 2008; Yuan et al., 2006). In addition the use offuel oils has been documented in Jordan among various energysectors, including use for heating in residential and commercialsectors (Jaber et al., 2003), which is likely the case in Rachma giventhe very small amounts apportioned.
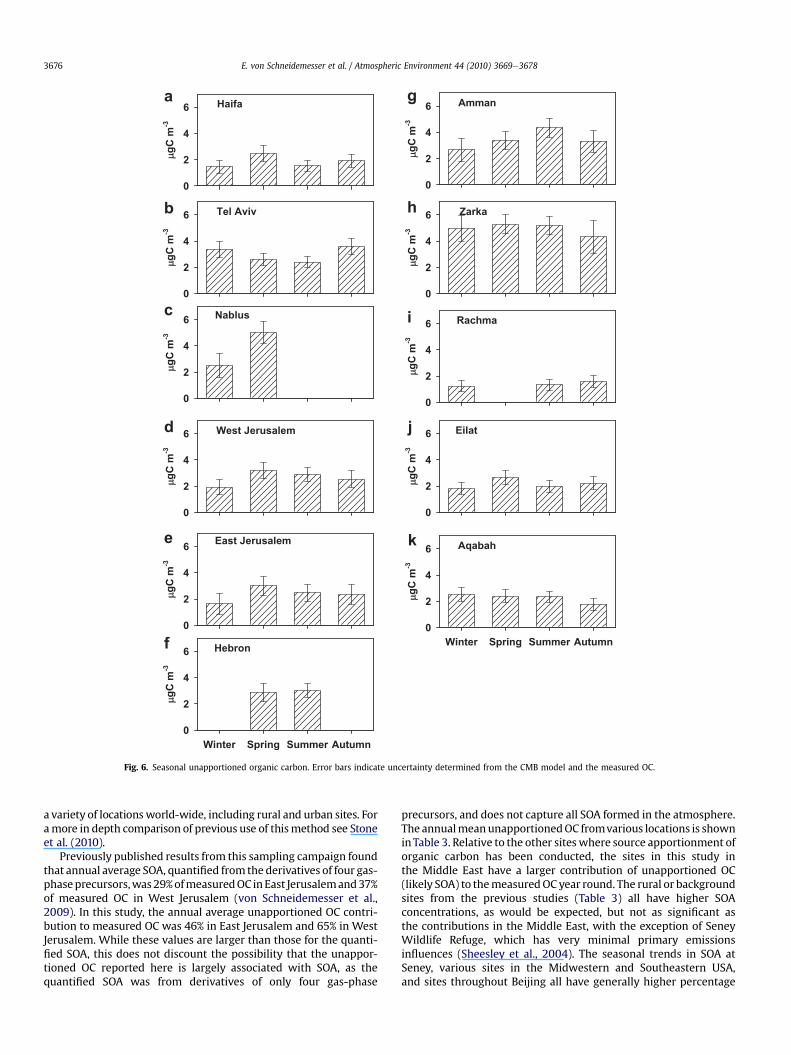
The unapportioned organic carbon is shown in Fig. 5 (annualaverage) and Fig. 6 (seasonal variation). Seasonally, the amount ofunapportioned OC ranged from 1.2 mgCm�3 to 5.3 mgCm�3; percentcontribution to measured OC ranged from 30% to 74%. The largestconcentrations of unapportioned OC were in Zarka and Amman,while the smallest was in Rachma. At the majority of the samplinglocations the amount of unapportioned OC was similar throughout
the seasons. At five of the sampling locations, no statisticallysignificant unapportioned OC was detected. These are cases wherethe sources included in the model were not well constrained.Previous studies have found that the remaining unapportioned OCtypically corresponds well with the measured water-soluble organiccarbon and is therefore considered secondary organic aerosol (SOA),which is likely the case here as well (Sheesley et al., 2004; Stoneet al., 2008). This method of SOA estimation has been used in
a
b
c
d
e
f
g
h
i
j
k
Fig. 6. Seasonal unapportioned organic carbon. Error bars indicate uncertainty determined from the CMB model and the measured OC.
E. von Schneidemesser et al. / Atmospheric Environment 44 (2010) 3669e36783676
a variety of locationsworld-wide, including rural and urban sites. Foramore in depth comparison of previous use of thismethod see Stoneet al. (2010).
Previously published results from this sampling campaign foundthat annual average SOA, quantified from the derivatives of four gas-phaseprecursors,was29%ofmeasuredOC inEast Jerusalemand37%of measured OC in West Jerusalem (von Schneidemesser et al.,2009). In this study, the annual average unapportioned OC contri-bution to measured OC was 46% in East Jerusalem and 65% in WestJerusalem. While these values are larger than those for the quanti-fied SOA, this does not discount the possibility that the unappor-tioned OC reported here is largely associated with SOA, as thequantified SOA was from derivatives of only four gas-phase
precursors, and does not capture all SOA formed in the atmosphere.The annualmeanunapportionedOC fromvarious locations is showninTable 3. Relative to the other siteswhere source apportionment oforganic carbon has been conducted, the sites in this study inthe Middle East have a larger contribution of unapportioned OC(likely SOA) to themeasuredOC year round. The rural or backgroundsites from the previous studies (Table 3) all have higher SOAconcentrations, as would be expected, but not as significant asthe contributions in the Middle East, with the exception of SeneyWildlife Refuge, which has very minimal primary emissionsinfluences (Sheesley et al., 2004). The seasonal trends in SOA atSeney, various sites in the Midwestern and Southeastern USA,and sites throughout Beijing all have generally higher percentage
E. von Schneidemesser et al. / Atmospheric Environment 44 (2010) 3669e3678 3677
contributions of unapportioned OC (SOA) during the warmer,summer months (Lewandowski et al., 2008; Sheesley et al., 2004;Zheng et al., 2002, 2005). The results from this study would indi-cate that SOA formation in the Middle East has a more substantialinfluence in the region year-round, with only minor seasonality(higher concentrations in summer) observed at some of the sites.
The results of the current study must be viewed as preliminaryuntil further work is completed to better demonstrate the differ-ences in source profiles used in the study from North America andAsia from local emissions in the Middle East. However, large biasesare not expected with the use of North American source profiles asshown in similar source apportionment studies in Mexico City andKathamandu, which found that the source apportionment estimateswere consistent with estimates of secondary organic aerosol esti-mated from water soluble organic carbon (WSOC) measurements(Stone et al., 2010, 2008). A critical reason why molecular markersource profiles are not expected to be highly variable, as seen withtrace element source profiles, is due to the fact that the key tracersare components of the rawmaterials used in the combustion source.In the case of mobile sources, the key tracers are hopanes and ster-anes, which are derived from the lubricating oil and not the fuels ofthe engines. Lubricating oil is much less variable across differentregions of the world as compared to fuels. Likewise, levoglucosanis the key tracer for biomass smoke, which is derived from thepyrolysis of cellulose and picene is the key tracer for coal soot, whichis formed from the pyrolysis of dimethlypicene present in coal.Nonetheless, future work is needed to better understand thedifferences of emissions profiles for combustion sources and theimplications to molecular marker CMB models.
4. Conclusions
This study is the first molecular marker source apportionmentstudy to be conducted simultaneously in cities in close proximity butunder different governmental authority and different environmentalmanagement authorities. Likewise, the results are unique in thatthey represent an environment different from most of the carbo-naceous PM studied, which have been conducted in North America,Europe, and Asia. The climate of the study region is much warmerand the area is more arid as compared to locations where suchstudies have been conducted in the past. Concentrations of fineparticle carbon frommobile sources were shown to have substantialspatial variation, while the impact of secondary organic aerosol wasconsistent across sites through the entire year. The northwesternJordanian sites were generally among the highest in measuredcarbonaceous particulate matter concentrations, with correspond-ingly high contributions from biomass burning and vehicular emis-sions. However, vehicular emissions from Nablus were far largerthan those apportioned at any of the other sites in the region. Aswould be expected, the sites with the lowest population densities(Rachma, Aqabah, and Eilat) located on the southern end of the studyregion had the lowest measured OC; however, the most denselypopulated sites (Tel Aviv and Hebron) did not have the highestmeasuredOC. Apportioned biomass burningwas lowest at the Israelisites, while apportioned total vehicular emissions were largest atPalestinian and Jordanian sites. These results would indicate thatfrom a human health perspective regulatory measures should beaimed at reducing vehicular emissions and biomass burning, asthese make up the most substantial portion of the organic carbonfraction of PM. Specifically, in locations such as Nablus, with highvehicular emissions and relatively high population density, peoplewill be disproportionately affected by the air pollution levels in thatarea. Also, given the importance of SOA in the region, furtherresearch to characterize the SOA precursors and their origin isimportant if any policy measures are to be implemented.
Acknowledgements
This work was funded by the Middle East Research Consortia(MERC) program of USAID. The GCMS analysis, performed by JiabinZhou through funding from the China Scholarship Council (CSC).We would like to thank all of the members of the PM2.5 Projectteam. We would also like to thank Judy Chow at DRI for conductingthe XRF analysis; Yinon Rudich and Mia Moonshine at the Weiz-mann Insitute for conducting the ECOC analysis; and BrandonShelton (Wisconsin State Laboratory of Hygiene) for assistancewiththe GC-MS analysis.
Appendix. Supplementary data
Supplementary data associated with this article can be found inthe online version, at doi:10.1016/j.atmosenv.2010.06.039.
References
Asaf, D., Pedersen, D., Peleg, M., Matveev, V., Luria, M., 2008. Evaluation of backgroundlevels of air pollutants over Israel. Atmospheric Environment 42, 8453e8463.
Carrico, C.M., Bergin, M.H., Shrestha, A.B., Dibb, J.E., Gomes, L., Harris, J.M., 2003. Theimportance of carbon and mineral dust to seasonal aerosol properties in theNepal Himalaya. Atmospheric Environment 37, 2811e2824.
Central Bureau of Statistics, 2009. Statistical Abstract of Israel 2009. http://www.cbs.gov.il/shnaton60/st02_15.pdf.
Chowdhury, Z., Zheng, M., Schauer, J.J., Sheesley, R.J., Salmon, L.G., Cass, G.R.,Russell, A.G., 2007. Speciation of ambient fine organic carbon particles andsource apportionment of PM2.5 in Indian cities. Journal of Geophysical Research112, D15303.
Department of Statistics, Hashemite Kingdom of Jordan, 2004. http://www.dos.gov.jo/sdb_pop_e/inde_o.htm.
Erel, Y., Kalderon-Asael, B., Dayan, U., Sandler, A., 2007. European atmosphericpollution imported by cooler air masses to the Eastern Mediterranean duringthe summer. Environmental Science & Technology 41, 5198e5203.
Ganor, E., Foner, H.A., Brenner, S., Neeman, E., Lavi, N., 1991. The chemical compo-sition of aerosol settling in israel following dust storms. Atmospheric Envi-ronment 25A, 2665e2670.
Graham, B., Falkovich, A.H., Rudich, Y., Maenhaut, W., Guyon, P., Andreae, M.O.,2004. Local and regional contributions to the atmospheric aerosol over Tel Aviv,Israel: a case study using elemental, ionic and organic tracers. AtmosphericEnvironment 38, 1593e1604.
Hamdi, M.R., Bdour, A., Tarawneh, Z., 2008. Diesel quality in Jordan: impacts ofvehicular and industrial emissions on Urban air quality. Environmental Engi-neering Science 25, 1333e1343.
Hirsch, Y., Peleg, M., Luria, M., 1981. Characterization of suspended dust particles inthe Jerusalem air. Environmental Science & Technology 15, 1456e1460.
Jaber, J.O., Mohsen, M.S., Al-Sarkhi, A., Akash, B., 2003. Energy analysis of Jordan’scommercial sector. Energy Policy 31, 887e894.
Jaradat, Q.M., Monami, K.A., Jiries, A.G., 1997. Ion chromatographic analysis of water-soluble anions in the atmosphere in Amman, Jordan. Turkish Journal ofChemistry 21, 92e99.
Kellog, R., Winberry, W.J., 1999. EPA Compendium Method 10-3.3: Determination ofMetals in Ambient Particulate Matter Using X-ray Fluorescence (XRF) Spec-troscopy. U.S. Environmental Protection Agency.
Lee, S., Baumann, K., Schauer, J.J., Sheesley, R.J., Naeher, L.P., Meinardi, S., Blake, D.R.,Edgerton, E.S., Russell, A.G., Clements, M., 2005. Gaseous and particulateemissions from prescribed burning in Georgia. Environmental Science &Technology 39, 9049e9056.
Lewandowski, M., Jaoui, M., Offenberg, J.H., Kleindienst, T.E., Edney, E.O., Sheesley, R.J.,Schauer, J.J., 2008. Primary and secondary contributions to ambient PM in theMidwestern United States. Environmental Science & Technology 42, 3303e3309.
Lough, G.C., Christensen, C.G., Schauer, J.J., Tortorelli, J., Mani, E., Lawson, D.R.,Clark, N.N., Gabele, P.A., 2007. Development of molecular marker source profilesfor emissions from on-road gasoline and diesel vehicle fleets. Journal of the Air& Waste Management Association 57, 1190e1199.
Luria, M., David, T., Peleg, M., 1985. 5-Year air-quality trends in Jerusalem, Israel.Atmospheric Environment 19, 715e726.
Mauderly, J.L., Chow, J.C., 2008. Health effects of organic aerosols. Inhalation Toxi-cology 20, 257e288.
Minguillon, M.C., Arhami, M., Schauer, J.J., Sioutas, C., 2008. Seasonal and spatial varia-tionsofsourcesoffineandquasi-ultrafineparticulatematter inneighborhoodsnearthe Los Angeles-Long Beach harbor. Atmospheric Environment 42, 7317e7328.
Newmark, G.L., 2001. Emissions inventory analysis of mobile source air pollution inTel Aviv, Israel. Energy, Air Quality, And Fuels 2001-Energy and Environment1750, 40e48.
Palestinian Central Bureau of Statistics, 2008. Population, Housing and EstablishmentCensus-2007. http://www.pcbs.gov.ps/Portals/_pcbs/PressRelease/census2007_e.pdf.
E. von Schneidemesser et al. / Atmospheric Environment 44 (2010) 3669e36783678
Palestinian Central Bureau of Statistics, 2010. West Bank and Gaza Strippopulation census of 2007. http://www.reliefweb.int/rw/RWFiles2010.nsf/FilesByRWDocUnidFilename/VDUX-822SWX-full_report.pdf/$File/full_report.pdf.
Perrino, C., Catrambone, M., Esposito, G., Lahav, D., Mamane, Y., 2009. Character-isation of gaseous and particulate atmospheric pollutants in the East Mediter-ranean by diffusion denuder sampling lines. Environmental Monitoring andAssessment 152, 231e244.
Pope, C.A., Dockery, D.W., 2006. Health effects of fine particulate air pollution: linesthat connect. Journal of Air and Waste Management Association 56, 709e742.
Rogge, W.F., Hildemann, L.M., Mazurek, M.A., Cass, G.R., Simoneit, B.R.T., 1993.Sources of fine organic aerosol .4. Particulate abrasion products from leafsurfaces of urban plants. Environmental Science & Technology 27, 2700e2711.
Rutter, A.P., Snyder, D.C., Schauer, J.J., DeMinter, J., Shelton, B., 2009. Sensitivity andbias of molecular marker-based aerosol source apportionment models to smallcontributions of coal combustion soot. Environmental Science & Technology 43,7770e7777.
Schauer, J.J., Rogge, W.F., Hildemann, L.M., Mazurek, M.A., Cass, G.R., 1996. Sourceapportionment of airborne particulate matter using organic compounds astracers. Atmospheric Environment 30, 3837e3855.
Schauer, J.J., Mader, B.T., Deminter, J.T., Heidemann, G., Bae, M.S., Seinfeld, J.H.,Flagan, R.C., Cary, R.A., Smith, D., Huebert, B.J., Bertram, T., Howell, S., Kline, J.T.,Quinn, P., Bates, T., Turpin, B., Lim, H.J., Yu, J.Z., Yang, H., Keywood, M.D., 2003.ACE-Asia intercomparison of a thermal-optical method for the determination ofparticle-phase organic and elemental carbon. Environmental Science & Tech-nology 37, 993e1001.
Sheesley, R.J., Schauer, J.J., Zheng, M., Wang, B., 2007. Sensitivity of molecularmarker-based CMB models to biomass burning source profiles. AtmosphericEnvironment 41, 9050e9063.
Sheesley, R.J., Schauer, J.J., Bean, E., Kenski, D., 2004. Trends in secondary organicaerosol at a remote site in Michigan’s upper peninsula. Environmental Science& Technology 38, 6491e6500.
Sillanpaa, M., Frey, A., Hillamo, R., Pennanen, A.S., Salonen, R.O., 2005. Organic,elemental and inorganic carbon in particulate matter of six urban environmentsin Europe. Atmospheric Chemistry And Physics 5, 2869e2879.
Stone, E.A., Snyder, D.C., Sheesley, R.J., Sullivan, A.P., Weber, R.J., Schauer, J.J., 2008.Source apportionment of fine organic aerosol in Mexico City during theMILAGRO experiment 2006. Atmospheric Chemistry and Physics 8,1249e1259.
Stone, E.A., Schauer, J.J., Pradhan, B.B., Dangol, P.M., Habib, G., Venkataraman, C.,Ramanathan, V., 2010. Characterization of emissions from South Asian biofuelsand application to source apportionment of carbonaceous aerosol in theHimalayas. Journal of Geophysical Research 115, D06301.
von Schneidemesser, E., Zhou, J., Stone, E.A., Schauer, J.J., Shpund, J., Brenner, S.,Qasrawi, R., Abdeen, Z., Sarnat, J.A., 2009. Spatial variability of carbonaceousaerosol concentrations in East and West Jerusalem. Environmental Science &Technology. doi:10.1021/es9014025.
Watson, J.G., Cooper, J.A., Huntzicker, J.J., 1984. The effective variance weighting forleast-squares calculations applied to the mass balance receptor model. Atmo-spheric Environment 18, 1347e1355.
Yuan, Z., Lau, A.K.H., Zhang, H., Yu, J.Z., Louie, P.K.K., Fung, J.C.H., 2006. Identificationand spatiotemporal variations of dominant PM10 sources over Hong Kong.Atmospheric Environment 40, 1803e1815.
YuvalBroday, D.M., 2006. High-resolution spatial patterns of long-term meanconcentrations of air pollutants in Haifa Bay area. Atmospheric Environment 40,3653e3664.
Zhang, Y., Schauer, J.J., Zhang, Y., Zeng, L., Wei, Y., Liu, Y., Shao, M., 2008. Charac-teristics of particulate carbon emissions from real-world Chinese coalcombustion. Environmental Science & Technology 42, 5068e5073.
Zheng, M., Cass, G.R., Schauer, J.J., Edgerton, E.S., 2002. Source apportionment ofPM2.5 in the Southeastern United States using solvent-extractable organiccompounds as tracers. Environmental Science & Technology 36, 2361e2371.
Zheng, M., Salmon, L.G., Schauer, J.J., Zeng, L., Kiang, C.S., Zhang, Y., Cass, G.R., 2005.Seasonal trends in PM2.5 source contributions in Beijing, China. AtmosphericEnvironment 39, 3967e3976.
Zheng, M., Hagler, G.S.W., Ke, L., Bergin, M.H., Wang, F., Louie, P.K.K., Salmon, L.,Sin, D.W.M., Yu, J.Z., Schauer, J.J., 2006. Composition and sources of carbona-ceous aerosols at three contrasting sites in Hong Kong. Journal of GeophysicalResearch 111, D20313.