How environmental stress affects density dependence and carrying capacity in a marine copepod
Upload
laurentponsonCategory
view
0download
0
Antarctic Science 23(1), 3–17 (2011) & Antarctic Science Ltd 2010 doi:10.1017/S0954102010000519
Seasonal and growth stage changes in lipid and fatty acidcomposition in the multigeneration copepod Drepanopus
pectinatus from Iles KerguelenP. MAYZAUD, S. LACOMBRE and M. BOUTOUTE
UPMC Universite Pierre et Marie Curie-Paris 6, UMR 7093 CNRS, Laboratoire d’oceanographie de Villefranche,
06230 Villefranche-sur-Mer, France
Abstract: Changes in adult weight, lipid and fatty acid composition per lipid class were studied over a complete
seasonal cycle in Drepanopus pectinatus Brady. This copepod displayed a strong seasonality in adult individual
weight and total lipid content. Stages C3 to adult from a summer cohort were compared in terms of lipid and
fatty acid structure. Changes in lipid content were related to wax esters and polar lipids (PL) while
triacylglycerols (TAG) and cholesterol remained minor constituents except at the end of winter. Changes in fatty
acid composition of different lipid classes showed that food limitation in winter was high enough to affect
22:6n-3 (DHA) content in PL, and provoke accumulation of maximal percentages of bacterial marker as
branched acids. Composition of TAG followed closely the changes in trophic interactions as diatom and
flagellate markers dominated in spring and summer while bacterial and detritus particle markers dominated in
late winter. The composition of wax esters followed the same seasonal succession but with a lower level of turn
over time and shifted characteristics (bacterial markers) from winter to spring individuals when compared to
TAG. Ontogenetic changes showed high triacylglycerols content in younger C3 stages and increasing wax esters
with increasing developmental stages. Fatty acid composition of PL showed low percentages of EPA and DHA
in stage C3, and recovery of high levels of DHA for stage C4 or 20:5n-3 (EPA) at stage C5. The same trend was
observed for 18:4n-3. The reverse pattern was noted for the n-6 polyunsaturated acids (PUFA) suggesting a
greater requirement in younger stages. Fatty acid partitioning between neutral and PL suggested essential fatty
acids selective incorporation from neutral classes into membrane lipids.
Received 20 January 2010, accepted 10 May 2010, first published online 30 July 2010
Key words: energy store, life cycle, lipid dynamics, sub-Antarctic copepod, survival
Introduction
Our knowledge of lipid biochemistry of marine Antarctic
copepods is relatively recent compared to Arctic species and
remains limited to oceanic areas. The earlier studies by
Reinhard & Van Vleet (1986) and Hagen (1988) surveyed the
lipid class composition of the six major species (Calanus
propinquus Brady, Calanoides acutus Giesbrecht, Rhincalanus
gigas Brady, Metridia gerlachei Giesbrecht, Euchaeta
antarctica Giesbrecht and Euchirella rostamagna Wolfenden)
and the fatty acid structure of some of them. More recent work
(see review by Lee et al. 2006) has brought further information
on the triacylglycerol (TAG) and wax ester (WE) structure in
relation to seasons and life cycle variability.
However, to our knowledge, the small neritic species of
both Antarctic and sub-Antarctic areas have received little
attention despite their ecological significance (Tucker &
Burton 1990, Ward & Shreeve 1999). In the Iles Kerguelen,
the zooplankton community is largely dominated by the small
clausocalanid copepod species, Drepanopus pectinatus Brady,
which displays very high spring and summer biomass and
plays a key role in energy transfer towards higher trophic
levels (Razouls & Razouls 1988, 1990, Razouls et al. 1996).
Throughout the year, a succession of four generations with
different duration has been proposed by Razouls & Razouls
(1990), but information on the energetic content and lipid
composition of each generation is totally unknown. As
indicated by Kattner et al. (2007) in their perspectives paper
‘‘there is a general need for comprehensive field studies on
lipid of zooplankton and the seasonal variability of these
changes’’.
During a general survey of the zooplankton community
in Kerguelen, populations of Drepanopus pectinatus were
sampled seasonally in order to examine lipid content,
composition and structure in relation of both food
interactions and life cycle stage.
Material and methods
Zooplankton samples were collected in the Bay of
Morbihan by vertical hauls from bottom to the surface at
central stations (see Fig. 1). Sampling was carried out from
January 1996–February 1997, at monthly or bimonthly
3

intervals depending on seasons for lipid characteristics.
According to Razouls & Razouls (1990) the biological
cycle of Drepanopus pectinatus comprised four generations:
G1 October–December, G2 December–mid February, G3 end
February–mid April, and G4 April–September.
Consecutive temperature and water samples were taken
using reversing temperature probes (Orca RTM T709) at
two depths (0 and 30 m). Samples of 1 litre of surface
water were filtered on GF/F filters for measurements of
particulate chlorophyll a at three depths (0, 30, 80 m) using
a Turner Design 10 fluorometer (Lorenzen & Downs 1966).
Mesozooplankton were sampled with a 200 mm WP2 net by
vertical hauls from bottom to surface. The zooplankton
were immediately diluted in a plastic cooler with surface
seawater and brought back to a laboratory cold room set to
in situ temperature. For seasonal lipid studies, groups of
200–300 C6 females (with few C5 in autumn and winter)
were sorted, immediately deep frozen and kept at -808C
under nitrogen and transported by air shipment to France
on dry ice every 3–4 months. A subsample of female
Drepanopus pectinatus was used for dry weight and total lipid
determination. For dry weight, individuals (10–15) were
placed on aluminium pans and dried at 608C to constant
weight. Weights were measured on a Cahn electrobalance.
On one date in January, D. pectinatus was sorted to
stages to check the influence of ontogeny on the lipid
composition. However, the high number of individuals
needed for complete analyses (800–900 for younger stages,
200 for adults), made it difficult to obtain totally pure
samples. Hence, a subsample of 50 individuals for each
stage was fixed and counted under microscope: group C3
contains 10% of C4 (in number), group C4 contains 5% of
C5, and group C5 contains 3% of females.
Lipid extraction and determination
Lipids were extracted upon arrival in France according to the
method of Bligh & Dyer (1959). After solvent evaporation at
high vacuum, the extracted lipids were weighed in tared vials
on a precision balance ( ± 100 mg) to evaluate the content
of total lipids. The extracts were then placed under nitrogen
at -808C until further analyses, usually within four months.
The very low levels of free fatty acids were taken as evidence
for proper lipid preservation.
Lipid classes were quantified after chromatographic
separation coupled with FID detection on an Iatroscan
Mark V TH 10 (Ackman 1981). Total lipid extracts were
applied to Chromarods SIII using microcapillaries (1 ml)
and analysed in duplicate. Neutral lipids were separated
using a double development procedure with the following
solvent systems: n-hexane: benzene: formic acid 80:20:1
(by volume) followed by n-hexane: diethylether: formic
acid 97:3:1.5 (v/v). Calibration was achieved using either
commercial standards (Sigma) or lipid extract (WE) from
D. pectinatus separated by column chromatography (Mayzaud
et al. 1998).
Fatty acid methyl esters of each lipid class were prepared
with 7% boron trifluoride in methanol (Morrison & Smith
1964). Wax esters fatty alcohols were acetylated using acetic
anhydride (Ackman et al. 1972). Gas liquid chromatography
(GLC) of all esters was carried out on a 30 m length x 0.32 mm
internal diameter quartz capillary column coated with
Fig. 1. Map of sampling sites in
the Bay of Morbihan of the Iles
Kerguelen.
4 P. MAYZAUD et al.
Famewax (Restek) in a Perkin-Elmer XL Autolab gas
chromatograph equipped with a flame ionization detector.
The column was operated isothermally at 1908C for methyl
esters and 2008C for alcohol acetates. Helium was used as
carrier gas at 7 psig. Injector and detector were maintained
at 2508C. Individual components were identified by comparing
retention time data with those obtained from authentic and
laboratory standards. In addition to the examination of esters
as recovered, a part of all ester samples was completely
hydrogenated and the products examined qualitatively and
quantitatively by GLC. The level of accuracy is ± 5% for
major components, 1–9% for intermediate components and
up to ± 30% for minor components.
Data treatment
Non parametric Kolmogorov-Smirnov tests were used to
evaluate significance between mean values using Statgraphics
XV software.
To clarify the seasonal evolution of successive generations
in relation to trophic interactions, the fatty acid profiles of the
wax esters and triacylglycerols were subjected to a factorial
correspondence analysis (Gower 1987). The analysis was
performed on a reduced data matrix transformed to relative
frequencies and scaled so that each row (or column) can be
viewed as a row (or column) of conditional probability
distribution. The fatty acids were used to fill the matrix of
variables and the different sampling dates were used as
observations. Distances between fatty acid profiles were
computed with a x2 metrics. This distance gives symmetry to
the two sets of data (active variables and observations) so that
each factorial axis associated to the cluster of variables
corresponds to a factorial axis of the cluster of observations.
Thus, it was possible to represent simultaneously descriptors
and observations on the plane defined by the factorial axes.
Graphs of projections retained those variables which
displayed more than 1% total contribution to axes 1 and 2.
Hierarchical clustering on the fatty acids descriptors was
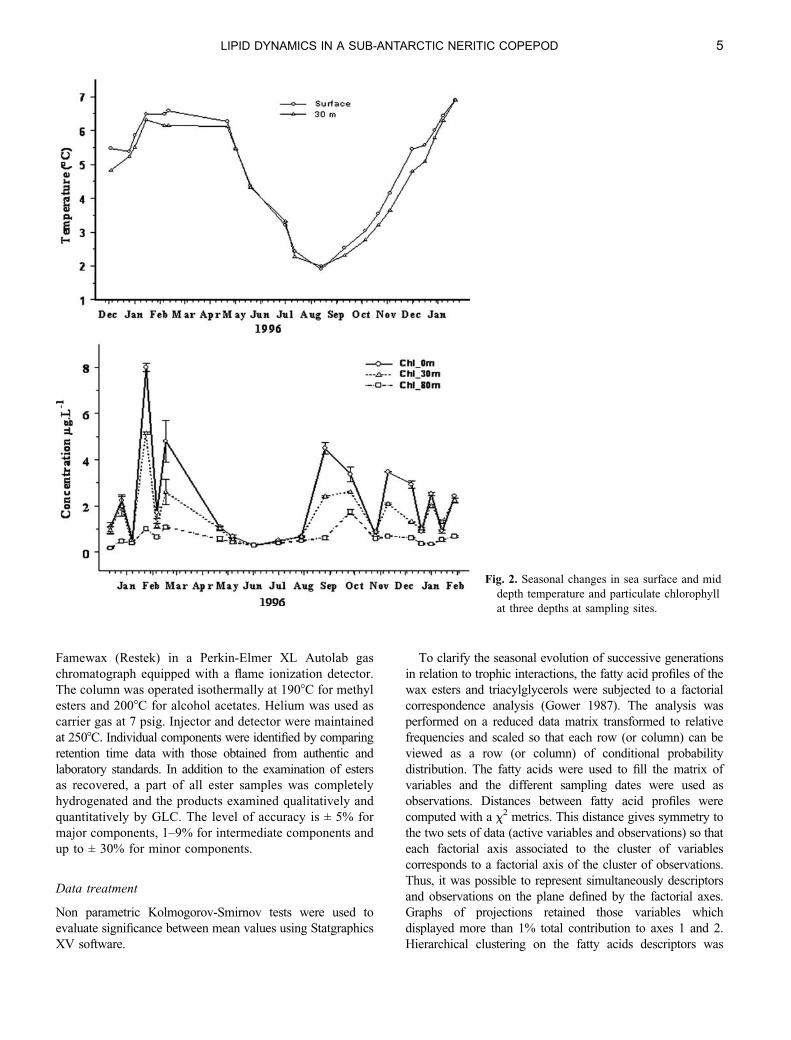
Fig. 2. Seasonal changes in sea surface and mid
depth temperature and particulate chlorophyll
at three depths at sampling sites.
LIPID DYNAMICS IN A SUB-ANTARCTIC NERITIC COPEPOD 5
carried out using reciprocal neighbour classification (Lebart
et al. 1995). Computation was made using the SPAD 5.5
software (DECISIA).
Results
Annual changes in environmental conditions
Temperature in the Kerguelen waters followed a very
seasonal pattern with winter lows (July–August) between
2 and 38C and maxima between 6 and 88C from January–
April (summer). Over the period considered the maximum
recorded at both depths were higher in 1997 than in 1996
(Fig. 2 top). Chlorophyll also showed a strong seasonal signal
but with a large interannual variability (Fig. 2 bottom) with a
September spring bloom and succession of summer blooms
in February and March 1996, and blooms of lower intensity in
December, January and February 1997.
Seasonal changes in size, dry weight and lipid content
No attempt was made to redefine the population dynamics and
the scheme with four generations per year was used as
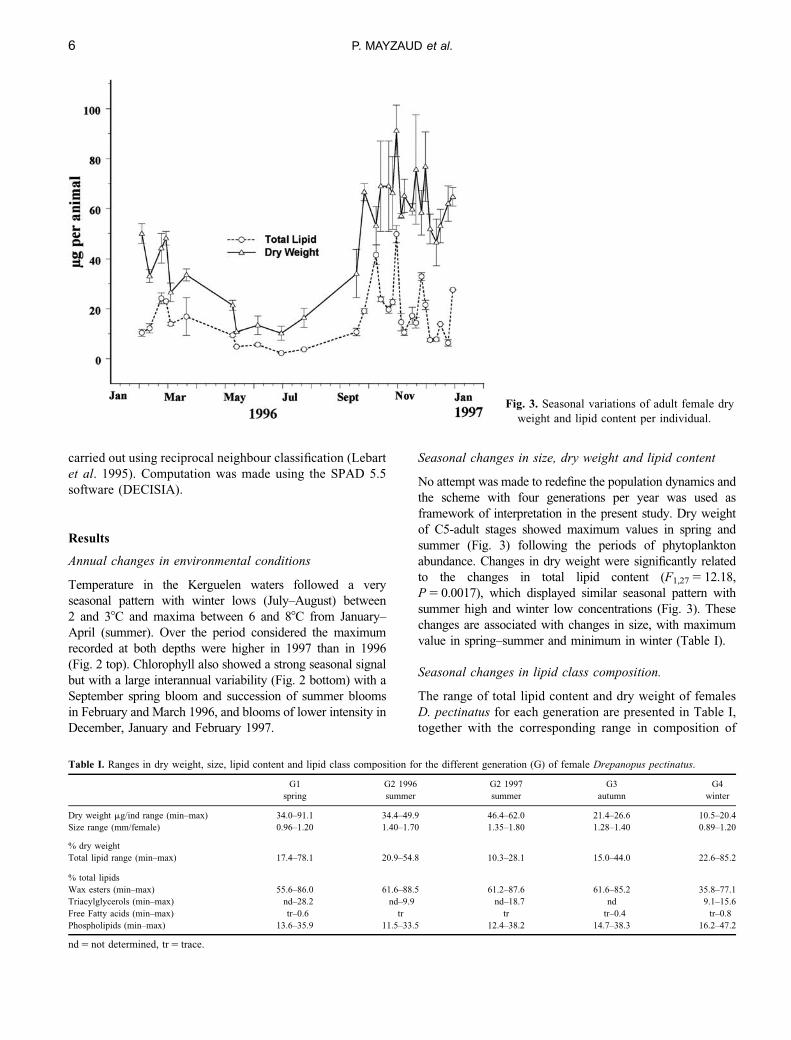
framework of interpretation in the present study. Dry weight
of C5-adult stages showed maximum values in spring and
summer (Fig. 3) following the periods of phytoplankton
abundance. Changes in dry weight were significantly related
to the changes in total lipid content (F1,27 5 12.18,
P 5 0.0017), which displayed similar seasonal pattern with
summer high and winter low concentrations (Fig. 3). These
changes are associated with changes in size, with maximum
value in spring–summer and minimum in winter (Table I).
Seasonal changes in lipid class composition.
The range of total lipid content and dry weight of females
D. pectinatus for each generation are presented in Table I,
together with the corresponding range in composition of
Fig. 3. Seasonal variations of adult female dry
weight and lipid content per individual.
Table I. Ranges in dry weight, size, lipid content and lipid class composition for the different generation (G) of female Drepanopus pectinatus.
G1 G2 1996 G2 1997 G3 G4
spring summer summer autumn winter
Dry weight mg/ind range (min–max) 34.0–91.1 34.4–49.9 46.4–62.0 21.4–26.6 10.5–20.4
Size range (mm/female) 0.96–1.20 1.40–1.70 1.35–1.80 1.28–1.40 0.89–1.20
% dry weight
Total lipid range (min–max) 17.4–78.1 20.9–54.8 10.3–28.1 15.0–44.0 22.6–85.2
% total lipids
Wax esters (min–max) 55.6–86.0 61.6–88.5 61.2–87.6 61.6–85.2 35.8–77.1
Triacylglycerols (min–max) nd–28.2 nd–9.9 nd–18.7 nd 9.1–15.6
Free Fatty acids (min–max) tr–0.6 tr tr tr–0.4 tr–0.8
Phospholipids (min–max) 13.6–35.9 11.5–33.5 12.4–38.2 14.7–38.3 16.2–47.2
nd 5 not determined, tr 5 trace.
6 P. MAYZAUD et al.

lipid classes. WE dominated lipids at all times with mean
percentages ranging from 65 to 73% in winter (G4) and
summer and autumn (G2 and G3) respectively. TAG
showed low contributions to the lipid pool with percentages
ranging from 9–16% in winter (G4) and minimum values
(0–10%) in summer (G2). Polar lipids (PL) remained the
second constituent and ranged throughout the seasons from
14% (spring low G1) to 47% (winter high G4) of total
lipids. Cholesterol and free fatty acids were always low
at the limit of detection. The large range in the content of
lipid within generation is indicative of the high degree of
variability. The differences between means within generation
were usually not significant (P . 0.05) suggesting that, in the
present case, generation may not be the proper time scale to
address the seasonal variation of lipid reserves.
Changes in total lipids were linearly correlated to both polar
and reserve lipids (Fig. 4). WE dominated the lipid dynamics
with a highly significant regression (WE 5 -1.96 1 0.75 Liptot;
P 5 0.0001, F1,28 5 199.1). TAG were also significantly related
to total lipids but with a lower slope (TG 5 -2.19 1 0.21 Liptot;
P 5 0.0004, F1,14 5 22.99). Contrary to the expected trend, PL
lipids were significantly related to total lipids with a slope
similar to that of triacylglycerols (PL 5 3.89 1 0.10 Liptot;
P 5 0.0001, F1,28 5 20.63).
Fig. 4. Relation between total lipids and
concentration of the main lipid classes for
adult females.
Fig. 5. Seasonal variability in lipid classes as
percentage of total lipids for adult females.
LIPID DYNAMICS IN A SUB-ANTARCTIC NERITIC COPEPOD 7

Seasonal changes in the main three lipid classes as
percent total lipids (Fig. 5) illustrated the inverse pattern
between PL and WE with high WE percentages in spring
and summer and decreasing levels through winter. TAG
remained low without any clear seasonal pattern. Interestingly,
there was no relation between the catabolism of neutral
lipids and the peak of reproduction between November and
March.
Table II. Drepanopus pectinatus. Dry weight (mg/ind) and lipid class composition (% total lipids per growth stage). WE 5 wax esters,
TAG 5 triacylglycerols, FFA 5 free fatty acids, Chol 5 cholesterol, PL 5 phospholipids.
Stages from G2 generation Dry wt WE TAG FFA Chol PL
C3 1 10% C4 4.1 ± 0.6 25.6 28.9 2.2 nd 43.3
C4 1 5% C5 9.4 ± 2.4 74.9 8.1 1.3 2.8 12.9
C5 1 3% females 25.7 ± 1.9 83.3 3.3 0.8 0.5 13.2
Females 51.8 ± 5.9 70.5 3.3 1.4 1.2 19.7
Table III. Drepanopus pectinatus. Fatty acid composition of the wax esters (% of total methyl esters).
1996 1997
07/02 01/05 02/06 13/07 26/08 26/09 19/11 26/11 07/12 29/01
14:0 2.71 2.69 5.74 6.40 1.16 0.77 4.05 3.37 2.54 0.15
15:0 0.03 0.05 0.09 0.18 0.06 0.02 0.06 0.06 0.04 0.02
ISO15:0 0.03 0.04 0.07 0.06 0.02 0.01 0.09 0.04 0.03 0.04
ANT15:0 0.13 0.03 0.08 0.11 0.02 0.09 0.04 0.09 0.02 0.02
ISO16:0 0.01 0.14 0.12 0.14 0.20 0.06 0.02 0.01 0.01 0.01
ISO17:0 0.18 0.21 0.38 0.34 0.15 0.08 0.29 0.00 0.27 0.00
ANT17:0 0.05 0.06 0.09 0.04 0.03 0.04 0.10 0.15 0.01 0.05
16:0 0.26 0.80 0.24 0.12 0.38 0.21 0.42 0.26 0.18 0.34
17:0 0.57 0.41 0.02 0.49 0.14 0.18 0.80 0.50 0.36 0.39
18:0 0.28 0.37 0.14 0.07 0.13 0.09 0.14 0.12 0.13 0.25
24:0 0.48 0.89 0.42 0.18 0.58 0.50 0.48 0.13 0.81 0.42
S saturates 4.78 5.73 7.43 8.25 2.88 2.05 6.52 4.77 4.43 2.11
14:1 0.59 0.28 0.58 0.46 0.22 0.44 2.41 1.47 0.64 2.59
16:1n-7 12.37 9.85 13.68 21.21 21.80 27.05 14.74 13.48 10.01 12.71
16:1n-5 0.19 0.10 0.08 0.10 0.09 0.08 1.43 0.19 0.05 0.08
18:1n-9 38.57 33.65 40.74 44.09 47.17 45.45 36.95 42.40 29.67 37.42
18:1n-7 0.57 0.86 1.64 2.14 0.65 0.74 0.72 0.78 0.81 0.52
18:1n-5 0.19 0.27 0.19 0.23 0.42 0.30 0.47 0.81 0.13 0.04
20:1n-11 0.92 0.84 1.12 1.79 0.79 0.56 0.43 0.83 0.65 0.90
20:1n-9 0.19 0.57 0.36 0.46 0.27 0.22 0.34 0.22 0.20 0.14
22:1n-13111 0.11 0.34 0.19 0.30 0.17 0.13 0.07 0.07 0.11 0.08
22:1n-9 0.09 0.11 0.13 0.17 0.06 0.02 0.08 0.04 0.07 0.07
24:1n-9 0.33 0.36 0.41 0.31 0.16 0.05 0.13 0.25 0.42 0.21
S monoenes 54.25 47.57 59.42 71.71 72.02 75.16 57.99 60.67 42.86 54.88
16:2n-6 0.21 0.21 0.27 0.26 0.08 0.13 0.14 0.15 0.12 0.24
16:2n-4 1.33 0.93 1.07 1.22 1.03 1.57 0.65 0.18 0.52 1.50
18:2n-6 1.78 2.66 2.25 3.67 3.31 2.45 2.91 1.69 2.61 1.10
20:2n-6 0.19 0.27 0.38 0.38 0.27 0.14 0.31 2.11 1.51 0.24
S dienes 3.60 4.19 4.12 5.67 4.88 4.40 4.10 4.17 4.81 3.19
16:3n-6 0.21 0.29 0.66 0.60 0.25 0.10 0.24 0.33 0.47 0.17
16:3n-4 2.15 0.98 1.10 0.48 0.41 0.83 0.86 0.19 0.44 1.63
16:3n-3 0.16 0.37 0.44 0.47 0.50 0.36 0.56 0.46 0.15 0.11
18:3n-6 0.21 0.24 0.22 0.22 0.11 0.08 0.15 0.14 0.22 0.26
18:3n-3 1.97 2.46 2.40 1.77 2.50 1.96 3.71 4.69 5.12 1.26
20:3n-3 0.06 0.15 0.16 0.13 0.12 0.05 0.09 0.42 0.41 0.06
S trienes 4.76 4.48 4.97 3.66 3.89 3.39 5.62 6.22 6.81 3.50
16:4n-3 0.14 0.35 0.18 0.07 0.33 0.06 0.33 3.04 2.41 0.33
16:4n-1 3.45 1.58 0.73 0.19 0.40 1.33 1.40 0.42 1.13 5.73
18:4n-3 12.84 12.11 11.39 2.74 3.44 2.25 15.30 8.54 17.08 8.96
20:4n-6 0.18 0.35 0.50 0.39 0.28 0.11 0.10 0.57 0.84 0.27
20:4n-3 0.49 0.44 0.46 0.52 0.78 0.35 0.36 0.18 0.49 0.36
22:4n-6 0.21 0.35 0.20 0.39 0.13 0.05 0.00 0.52 0.66 0.08
S poly with 4 18.13 15.62 14.08 4.48 5.60 4.36 17.60 13.35 22.86 16.20
20:5n-3 10.00 11.95 5.48 3.60 4.94 3.45 3.38 4.62 11.07 15.85
21:5n-3 0.85 0.94 0.43 0.22 0.36 0.39 0.42 0.21 0.96 0.91
22:5n-3 0.31 1.18 0.28 0.25 0.50 0.26 0.21 0.10 0.42 0.27
S poly with 5 11.16 14.06 6.19 4.07 5.81 4.09 4.01 4.93 12.45 17.02
22:6n-3 3.23 5.89 2.81 1.20 3.89 3.33 3.65 0.75 4.83 2.76
S PUFA 6 2.97 4.37 4.48 5.90 4.41 3.05 3.85 5.51 6.43 2.35
S PUFA 3 30.53 35.98 24.48 11.00 17.40 12.45 28.01 23.02 42.94 30.88
Sn-6/Sn-3 0.10 0.12 0.18 0.54 0.25 0.25 0.14 0.24 0.15 0.08
8 P. MAYZAUD et al.

The influence of ontogeny was monitored on one occasion
in January using groups of dominant growth stages (Table II).
Because of the limited amount of material, no attempt was
made to weigh total lipid to avoid sample degradation. Early
C3 and C4 stages showed little accumulation of wax esters
and relatively high percentages of TAG and PL. Subadult C5
was the stage of WE accumulation with values exceeding
70% of the total lipids. Triacylglycerols fell below 10% and
PL below 15%. Females retained high percentages of wax
esters. Changes in dry weight showed maximum increase
between stage C4 and C5.
Fatty acid and fatty alcohol constituents of wax esters
The fatty acid composition of WE was dominated at all
times by the monoenes (sum ranging from 47–75% of the
total fatty acids) with oleic acid (18:1n-9) as the main
constituent and to a lesser extent palmitoleic acid (16:n-7)
(Table III). Saturated acids were dominated by myristic
acid (14:0) with maximum percentages in early winter.
Palmitic (16:0) and stearic (18:0) acids were generally low
with values , 1% of total fatty acids. PUFA with 5 and 6
double bonds showed a strong seasonal signal with
minimum values for the winter generation and maximum
values for the summer period (Table III). Polyenes with
four double bonds were the dominant polyunsaturated
(PUFA) fraction with 18:4n-3 ranging from less than 3% in
winter and interesting high levels of 10% during spring and
summer. Substantial amount of 20:5n-3 (10–15%) was
recorded during summer while smaller, but significant,
amounts of 16:4n-1 was abundant in summer. Dienoic acids
were essentially 16:2n-4 and 18:2n-6 while trienoic acids
were dominated by 16:3n-4 and 18:3n-3. The changes in
n-3 PUFA showed marked seasonal changes with a
decreasing trend in autumn, minimal values in winter and
increasing percentages throughout spring and summer.
Changes in n-6 PUFA were less pronounced with lower
percentages in January and February. The resulting ratio
ranged from less than 0.1 to 0.5 with maximal values
during the winter months.
The fatty alcohol fraction of the WE were dominated at
all time by C14 and C16 alcohols (Table IV) which
accounted for over 90% of the total alcohols. Minor
constituents included 18:1n-5 alcohol which displayed
maximal values in winter (August–September) and iso-,
anteiso-branched alcohols, which showed a clear seasonal
pattern with minimum values in summer and maxima in
winter. Unsaturated alcohols with two and three double
bonds were occasionally detected but always in percentages
lower than 0.2% (not shown).
Fatty acid composition of TAG
The fatty acid composition of the TAG fraction was
dominated by saturated and monoenoic acids in similar
proportion ranging from 25–42% and from 23–48% for
saturates and monoenes respectively (Table V). Palmitic
(16:0), myristic (14:0) and to a minor extent stearic (18:0)
acids made the bulk of the saturated acids while oleic
(18:1n-9) and palmitoleic (16:1n-7) acids dominated the
monoenoic acids. Among PUFA 18:4n-3, EPA (20:5n-3) and
to a minor extent DHA (22:6n-3) were the main constituents.
Minor PUFA included 16:3n-4, 16:4n-3, 16:4n-1, 18:3n-3
which are considered as diet markers. Over time, 14:0 and
18:0 dominated in winter and early spring (August–early
November) while 16:0 showed an opposite trend. PUFA (n-3)
showed maximum percentage in December (late spring) and
minimum values in winter (August–September). PUFA (n-6)
displayed a similar pattern of changes but with lower intensity
yielding a S PUFA n-6/S PUFA n-3 ratio which varied from
0.05 in summer to 0.25 in winter (Table V). C20 and C22
monoenes failed to show a clear seasonal pattern with higher
percentages between May and July (autumn–early winter) and
very low values for the rest of the survey period.
Table IV. Drepanopus pectinatus. Fatty alcohol composition of wax esters (% of total alcohols).
1996 1997
07/02 01/05 02/06 13/07 26/08 26/09 19/11 26/11 07/12 29/01
14:0 45.05 39.03 39.72 46.05 39.98 42.99 53.90 47.35 47.47 42.57
ISO15:0 0.60 1.24 1.60 2.03 0.98 0.67 0.61 0.90 0.48 0.40
ANT15:0 0.41 0.63 0.65 0.90 0.45 0.30 0.27 0.32 0.24 0.18
15:0 0.51 1.16 1.28 1.15 0.95 0.71 0.44 0.91 1.22 0.51
ISO16:0 0.17 0.42 0.60 0.57 0.44 0.26 0.11 0.11 0.16 0.11
ISO17:0 0.19 0.82 0.30 0.67 0.61 0.24 0.35 0.33 0.11 0.18
ANT17:0 0.22 0.42 0.40 0.41 0.29 0.10 0.12 0.14 0.10 0.01
16:0 47.92 46.73 47.57 40.15 46.54 44.76 39.43 42.73 46.52 51.38
ISO18:0 0.17 0.46 1.17 0.55 0.50 0.24 0.14 0.07 0.17 0.15
18:0 1.13 2.37 2.26 2.64 1.09 0.45 0.45 0.66 0.75 1.24
S saturates 96.57 93.64 96.47 95.86 92.36 90.94 95.99 93.73 97.36 97.24
16:1n-7 0.26 0.51 0.31 0.37 1.28 2.03 1.57 5.05 0.34 0.31
16:1n-5 0.80 0.50 0.34 0.35 0.45 0.51 0.41 0.41 0.24 0.28
18:1n-5 1.11 1.00 0.64 0.78 1.67 1.67 1.01 0.31 0.70 0.70
S monoenes 2.76 4.56 2.51 2.91 7.04 8.08 3.32 6.04 1.78 1.68
LIPID DYNAMICS IN A SUB-ANTARCTIC NERITIC COPEPOD 9

Fatty acids of phospholipids (PL)
Phospholipids showed relatively weak seasonal changes with
DHA and to a lesser extent EPA as the major fatty acids
(Table VI). Saturated acids were the second largest contributor
with palmitic acid as the major constituent (. 22% total fatty
acids) associated with lower levels of myristic and stearic
acids. Monoenoic acids were always intermediate with
percentages , 11% and oleic acid (18:1n-9) as the main
component. Other PUFA included 18:4n-3 and minor
percentages of other n-3 acids (Table VI). The only
seasonal pattern concerned DHA concentration which was
minimal in winter and maximum in spring and EPA and
palmitic acid which showed a reverse pattern of changes.
Table V. Drepanopus pectinatus. Fatty acid composition of triacylglycerols (% total fatty acids).
1996 1997
07/02 01/05 02/06 13/07 26/08 26/09 19/11 26/11 07/12 29/01
14:0 9.13 4.11 1.83 1.49 19.25 15.65 3.13 3.42 5.04 5.65
ISO15:0 0.29 0.21 0.39 0.38 0.46 0.42 0.20 0.13 0.19 0.14
ANT15:0 0.23 0.12 0.25 0.21 0.18 0.24 0.08 0.12 0.12 0.09
15:0 0.22 0.66 0.45 0.51 0.47 0.37 0.24 0.33 0.32 0.16
ISO16:0 1.01 0.20 1.19 0.96 0.17 0.19 0.30 0.76 0.44 0.22
ISO17:0 0.40 0.66 0.80 0.75 0.31 0.33 0.20 0.22 0.49 0.28
16:0 19.11 18.50 20.09 14.51 20.17 19.12 26.36 21.91 13.53 20.58
17:0 1.06 1.48 0.55 1.11 0.21 0.86 0.74 1.49 0.17 0.14
18:0 6.36 5.33 4.12 3.03 0.93 0.82 5.42 6.49 3.30 4.91
20:0 0.34 0.67 0.26 0.48 0.07 0.07 0.48 0.45 0.17 0.18
S saturates 38.43 33.39 31.66 25.43 42.72 39.15 38.74 35.76 24.74 33.49
14:1 0.68 0.43 0.17 0.06 0.23 0.22 0.43 0.24 0.38 1.43
16:1n-7 10.71 5.37 7.60 8.55 16.13 16.08 7.40 5.50 6.42 9.65
16:1n-5 0.53 0.40 0.30 0.26 0.27 0.36 0.51 0.33 0.19 0.28
18:1n-9 18.65 7.94 21.11 9.73 25.42 26.21 20.21 17.81 12.02 19.72
18:1n-7 0.64 1.76 3.82 4.56 1.11 1.80 2.19 1.85 0.77 0.57
18:1n-5 0.83 0.99 1.05 1.25 1.18 1.23 2.14 0.91 0.47 0.62
20:1n-11 0.57 0.25 0.61 1.13 0.33 0.32 0.61 0.19 0.27 0.52
20:1n-9 0.14 1.09 2.03 0.76 0.44 0.30 0.15 0.28 0.13 0.19
20:1n-7 0.09 0.72 0.65 1.76 0.19 0.13 0.11 0.05 0.04 0.03
20:1n-5 0.16 0.25 0.17 0.33 0.15 0.11 0.36 0.11 0.13 0.08
22:1n-13111 0.04 6.90 0.45 5.04 0.09 0.13 0.08 0.05 0.07 0.03
22:1n-9 0.11 3.77 0.50 2.96 0.12 0.21 0.20 0.00 0.10 0.08
S monoenes 34.87 32.90 41.43 41.97 46.41 47.99 35.36 28.59 23.17 34.33
16:2n-4 1.10 0.50 0.49 0.61 0.74 0.92 0.22 0.21 0.46 1.16
18:2n-9 0.13 0.25 0.14 0.33 0.05 0.07 0.73 0.23 0.09 0.04
18:2n-6 0.99 2.13 1.66 2.28 1.61 1.26 2.30 1.36 1.71 0.69
18:2n-4 0.16 0.21 0.43 0.36 0.10 0.12 0.05 0.39 0.08 0.43
20:2n-6 0.10 0.25 0.43 0.45 0.18 0.12 0.24 0.99 0.71 0.10
S dienes 2.58 3.56 3.30 4.17 2.70 2.68 3.91 3.32 3.24 2.54
16:3n-4 1.45 0.42 0.29 0.41 0.08 0.23 0.22 0.14 0.38 0.95
16:3n-3 0.19 0.47 0.40 0.42 0.23 0.29 0.47 1.00 0.64 0.06
18:3n-6 0.12 0.15 0.09 0.18 0.02 0.04 0.52 0.60 0.13 0.28
18:3n-3 1.24 1.80 1.51 1.85 1.22 1.14 2.67 5.15 4.45 0.96
20:3n-3 0.09 0.41 0.27 0.17 0.06 0.05 0.09 0.27 0.30 0.06
S trienes 3.42 3.59 3.05 3.40 1.61 1.75 4.11 7.73 6.55 2.44
16:4n-3 1.08 0.61 1.09 0.63 0.06 0.07 0.29 2.14 1.62 0.26
16:4n-1 2.56 0.55 0.43 0.39 0.14 0.37 0.25 0.28 0.07 3.64
18:4n-3 7.81 7.23 4.48 5.26 0.69 1.19 8.04 10.65 17.79 7.42
18:4n-1 0.26 0.31 0.15 0.34 0.13 0.17 0.26 0.38 0.39 0.36
20:4n-6 0.06 0.20 0.27 0.42 0.06 0.10 0.07 0.30 0.39 0.12
20:4n-3 0.24 1.08 0.59 0.48 0.15 0.17 0.25 0.22 0.41 0.27
S poly with 4 12.12 10.06 7.42 7.86 1.45 2.30 9.46 14.30 21.05 12.10
20:5n-3 5.02 7.64 6.65 9.31 2.42 3.65 2.71 5.93 9.88 10.64
21:5n-3 0.56 0.74 0.46 0.68 0.57 0.19 0.48 0.53 1.28 0.79
22:5n-3 0.20 0.93 0.82 1.10 0.22 0.25 0.26 0.28 0.65 0.03
S poly with 5 5.80 9.42 8.00 11.25 3.20 3.86 3.45 6.78 12.21 11.84
22:6n-3 2.47 7.17 5.14 5.93 1.92 2.28 4.98 3.53 9.09 3.26
S n-6 PUFA 1.58 3.01 2.84 3.61 1.88 1.52 3.28 3.51 3.52 1.31
S n-3 PUFA 18.90 28.09 21.42 25.82 7.54 9.27 20.24 29.71 46.11 23.76
Sn-6/Sn-3 0.08 0.11 0.13 0.14 0.25 0.16 0.16 0.12 0.08 0.06
10 P. MAYZAUD et al.

Among the branched acids, iso15:0, iso17:0 and anteiso17:0
displayed a clear winter maximum.
Fatty acid composition of ontogenetic stages
Changes in fatty acid composition from copepodite C3 to
adult stages are presented in Table VII for both total polar
and neutral lipids. Polar lipids exhibited a major decrease
in total saturates and monoenes with growth stage and
conversely increasing percentages in PUFA. Copepodite
C3 displayed the smaller level of DHA and EPA and
maximum values for C5 and adult female. The same
applied at a smaller scale for 18:4n-3. Conversely, palmitic
and stearic acids, and to a minor extent palmitoleic and
oleic acids, were maximum for C3 and decrease sharply as
early as C4 stage. The TAG pattern displayed was different
with increasing percentages of total saturates and dienoic
acids, decreasing levels of total monoenoic acids while
PUFA did not show a clear pattern of variation. Palmitic
acid, palmitoleic and DHA displayed the largest increase in
percentages, while oleic acid, stearic acid, linoleic acid
decrease mainly between C3 and C4 stages. The same
pattern was observed for 18:4n-3 but with a decrease
between C4 and C5. EPA and DHA showed little changes
with no clear pattern. WE showed increasing percentages
of total monoenoic acids and dienoic acids but no clear
pattern for the sum of saturated acids. Conversely, total
PUFA showed decreasing percentages with increasing
copepodite stages. The decrease was essentially associated
with 18:4n-3, DHA and linoleic acid, which dropped either
between C3 and C4 or between C4 and C5 and to a minor
extent with oleic, palmitic and stearic acid. Increasing
percentage concerned essentially 16:4n-1, 16:3n-4, 16:2n-4
and myristic acid.
To illustrate the probable changes in trophic interactions
with growth stage, a factorial correspondence analysis
(FCA) was performed on the fatty acid composition of the
TAG from stage C3 to adults. Due to the limited number
of cases the first two factorial axes accounted for 96% of
the total variance and the link between growth stage and
characteristic fatty acid grouping can be derived from
a hierarchical clustering on factorial score from all three
Table VI. Drepanopus pectinatus. Fatty acid composition of phospholipids (% total fatty acids).
1996 1997
07/02 01/05 02/06 13/07 26/08 26/09 19/11 26/11 07/12 29/01
14:0 1.94 1.22 1.54 1.38 3.06 2.03 1.83 0.94 1.22 0.39
ISO15:0 0.16 0.25 0.30 0.28 0.40 0.13 0.12 0.07 0.09 0.04
ANT15:0 0.07 0.12 0.11 0.10 0.20 0.05 0.04 0.03 0.03 0.02
15:0 0.18 0.36 0.39 0.33 0.71 0.29 0.21 0.14 0.20 0.12
ISO16:0 0.16 0.50 0.22 0.26 0.30 0.16 0.09 0.04 0.12 0.17
ISO17:0 0.28 0.36 0.39 0.39 0.67 0.42 0.28 0.06 0.15 0.23
ANT17:0 0.12 0.13 0.24 0.23 0.31 0.13 0.06 0.06 0.06 0.05
16:0 19.99 14.61 25.38 21.17 19.73 18.27 22.62 21.14 18.81 17.71
17:0 0.23 0.56 0.58 0.51 0.79 0.30 0.26 0.29 0.31 0.22
ISO18:0 0.15 0.12 0.58 0.41 0.24 0.22 0.18 0.10 0.19 0.08
18:0 2.04 2.44 1.77 1.10 2.06 1.22 1.59 1.32 1.27 2.99
S saturates 25.34 20.67 31.50 26.16 28.47 23.22 27.28 24.19 22.45 22.02
16:1n-7 1.09 1.12 1.04 1.21 2.07 2.15 0.35 1.08 0.65 0.78
18:1n-9 2.07 2.78 2.77 2.53 3.75 4.37 1.82 1.79 1.75 2.72
18:1n-7 0.47 0.80 0.98 1.10 2.05 2.34 0.98 1.01 0.51 0.39
18:1n-5 2.86 1.17 2.32 2.49 1.07 1.58 3.91 2.31 2.47 2.27
24:1 0.58 4.43 2.42 1.88 0.74 1.06 1.41 1.81 1.80 2.51
S monoenes 7.08 10.30 9.65 9.35 9.69 11.50 8.48 7.99 7.18 8.67
18:2n-9 0.10 0.09 0.16 0.27 0.23 0.14 0.79 0.42 0.08 0.02
18:2n-6 0.63 1.23 0.58 0.80 0.96 0.79 1.03 0.71 0.55 0.54
18:2n-4 0.12 0.08 0.11 0.12 0.13 0.15 0.05 0.04 0.07 0.13
S dienes 0.85 1.40 0.84 1.19 1.33 1.08 1.87 1.18 0.70 0.69
16:3n-3 0.06 0.16 0.11 0.12 0.14 0.09 0.06 0.04 0.04 0.06
18:3n-3 0.45 0.59 0.39 0.47 0.71 0.47 0.53 0.71 0.55 0.21
S trienes 0.51 0.75 0.50 0.59 0.85 0.56 0.59 0.75 0.59 0.27
16:4n-3 0.06 0.48 0.04 0.03 0.29 0.10 0.06 0.11 0.15 0.28
18:4n-3 3.40 2.13 1.71 1.55 1.56 1.46 2.05 1.94 1.96 2.42
20:4n-3 0.38 0.78 0.27 0.22 1.02 0.64 0.38 0.24 0.27 0.33
S poly with 4 3.84 3.39 2.02 1.80 2.87 2.21 2.49 2.29 2.38 3.03
20:5n-3 19.97 14.52 13.79 18.68 16.70 24.00 16.62 20.35 20.40 22.14
21:5n-3 0.35 0.52 0.24 0.26 0.66 0.70 0.16 0.30 0.30 0.34
22:5n-6 0.15 0.41 0.20 0.26 0.33 0.15 0.08 0.25 0.65 0.17
S poly with 5 20.47 15.45 14.23 19.20 17.69 24.85 16.86 20.90 21.35 22.65
22:6n-3 38.63 43.27 37.85 38.43 32.01 31.77 41.01 40.03 43.29 39.77
LIPID DYNAMICS IN A SUB-ANTARCTIC NERITIC COPEPOD 11

axes. The results presented in Fig. 6 showed a strong
opposition on axis 1 (85% total inertia) between stage C3
and older stages with C3 associated with saturated and
branched acids as well as (n-3) 16 PUFA and 18:4n-3. This
suggests feeding on small-size particles (live and detritic).
Later stages showed a clear association with diatom bloom
type material with C16 PUFA of the (n-4) and (n-1)
families, 16:1n-7 and EPA. Interestingly, the second axis
Table VII. Changes in fatty acid composition (% total fatty acids) of the different classes of lipids for copepodite stages and adult females of
Drepanopus pectinatus. PL 5 phospholipids, TG 5 triglycerides, WE 5 wax esters.
PL C3 PL C4 PL C5 PL fem TG C3 TG C4 TG C5 TG Fem WE C3 WE C4 WE C5 WE fem
S Saturates 53.16 29.79 24.66 24.73 31.16 33.06 39.05 35.75 3.65 3.83 4.50 4.90
S Monoenes 22.83 10.20 11.15 9.62 42.35 30.75 34.11 37.05 53.52 54.24 61.63 63.47
S dienes 1.59 0.53 0.56 0.59 2.54 2.86 2.65 3.44 3.89 4.18 4.94 4.89
S poly 3 1.59 0.73 0.66 0.68 4.08 4.09 2.65 3.44 5.06 4.90 4.71 4.63
S poly 4 1.63 2.29 2.08 2.61 8.03 13.23 7.34 7.14 18.03 18.92 11.64 10.42
S poly 5 6.32 18.91 23.61 25.15 7.05 8.05 8.26 7.45 11.49 11.28 9.47 8.36
14:0 - - - - 0.34 5.18 5.80 7.11 0.79 2.57 4.25 4.58
16:0 38.02 24.61 20.89 20.01 15.58 21.18 27.59 23.29 1.15 0.18 0.12 0.15
18:0 10.10 2.45 1.65 1.45 10.57 4.18 2.85 2.17 0.98 0.16 0.11 0.10
16:1n-7 3.12 0.92 1.04 0.92 7.99 7.57 8.24 9.24 8.46 11.20 19.08 19.75
16:1n-5 0.63 0.11 0.08 0.05 - - - - - - - -
18:1n-9 9.78 3.36 4.44 4.03 30.89 16.82 20.28 22.21 43.30 38.07 38.66 39.05
18:1n-7 3.92 0.49 0.45 0.39 - - - - - - - -
18:1n-5 4.20 2.91 2.78 2.44 - - - - - - - -
16:2n-4 0.70 0.07 0.07 0.07 0.29 0.62 0.70 0.83 0.61 1.20 1.90 1.94
18:2n-6 0.94 0.69 0.63 0.64 2.01 1.64 1.31 1.73 2.58 2.41 1.87 1.89
18:2n-4 0.84 0.20 0.10 0.09 0.07 0.14 0.17 0.42 - - - -
16:3n-4 - - - - 0.62 0.43 0.31 0.26 0.48 1.04 1.37 1.35
16:3n-3 - - - - 0.43 0.14 0.19 0.22 - - - -
16:4n-3 - - - - 0.11 0.53 0.53 0.82 - - - -
16:4n-1 - - - - 0.21 1.41 0.87 0.80 1.34 2.49 1.94 1.86
18:4n-3 0.80 1.59 1.42 1.76 7.48 10.62 5.32 4.74 15.54 15.07 7.98 7.20
20:4n-6 0.49 0.19 0.24 0.24 0.04 0.10 0.16 0.23 - - - -
18:5n-3 - - - - 0.79 0.24 0.08 0.07 1.16 0.08 0.03 0.02
20:5n-3 6.03 18.12 22.57 24.14 5.62 6.39 7.44 6.61 9.31 10.15 8.82 7.76
22:6n-3 11.84 34.96 36.17 35.58 4.78 5.77 5.17 5.23 4.57 4.31 1.51 1.18
Fig. 6. Hierarchical cluster analysis on the
score from the factorial correspondence
analysis on triglyceride fatty acids from the
different copepodite stages (C3 to adults).
The clustering illustrates the results of the
FCA considering the projections on the first
three axes and summarizes the associations
between growth stages and fatty acids in all
three directions of the factorial space.
12 P. MAYZAUD et al.

(11% total inertia) discriminate C4 from C5 and adults
suggesting a differential use of the diatom bloom material,
but similar trophic relationships for C5 and adults.
Seasonal changes in fatty acid composition and trophic
interactions of adult females
To clarify the importance of season, FCA was performed
on the fatty acid constituents of the wax esters and
triacylglycerols fractions. For WE, three factorial axes are
needed to explain 75.3% of the total variance (axis 1 5 32.5%,
axis 2 5 26.3%, axis 3 5 16.5%). Projection on the factorial
plan defined by the first two axes opposes the summer period
(January–February) to the spring one (November–December)
on the first axis (Fig. 7 top). Spring and summer individuals
are opposed to the winter ones (July–September) on the
second axis. The third axis (not shown), singles out the 19/11
sampling date. The seasonal path derived from the wax esters
showed a transition from summer to autumn and to winter
along the second axis. An internal shift within wax esters
fatty acids of the winter individuals can be seen along the
first axis from July–September. In terms of fatty acid
descriptors the opposition on the first component between
summer and spring is characterized respectively by 16
PUFA, EPA versus a group of n-3 and n-6 PUFA (16:4n-3,
18:3n-3, 20:3n-3, 20:2n-6). The winter generation on
the second axis is associated with saturates, monoenoic
acids and 16:3n-3. The winter changes suggested that
August–September wax esters showed increasing proportion
of some PUFA (16:2n-4, 20:4n-3).
The projection of the TAG fatty acid confirmed a globally
similar seasonal pattern except that the factorial analysis
suggested a different relationship between variance and
processes involved. Indeed, axis 1 accounted for 41.6% of
Fig. 7. Factorial correspondence analysis on the
seasonal changes in fatty acid composition
for wax esters (top) and triglycerides
(bottom). Top: combine projections of wax
ester fatty acids and sampling dates. Bottom:
single projection of triglycerides sampling
dates. The figure shows the ordination of the
variables and observations in the plane of
axis 1 and axis 2. The major trend of
seasonal variation is illustrated by the dashed
line arrows joining the sampling dates. Fatty
acids illustrate for each season the key
descriptors associated with the time periods.
LIPID DYNAMICS IN A SUB-ANTARCTIC NERITIC COPEPOD 13

the total variance and singles out the shift in triglyceride
composition between early and late winter (Fig. 7 bottom).
The second axis opposes the spring–summer individuals to
the winter one but with only 26.8% of the total inertia. The
fatty acid descriptors are relatively similar to the one
recorded for the wax esters with spring associated with (n-3)
16, 18 PUFA and EPA, and summer characterized by (n-1)
(n-4) C16 PUFA and 14:1 (not shown). The triacylglycerols
from winter individuals are divided into two groups: June–July
associated with 22:1 and 20:1 acids and August–September
associated with 14:0, 16:0, C16 and C18 monoenes, and
branched fatty acids.
Discussion
The copepod Drepanopus pectinatus is considered endemic
to Kerguelen and constitutes 70–98% of the total copepod
population (Razouls & Razouls 1988). Based on cohort
analysis, its biological cycle has been shown to comprise
four generations of different durations (44–49 days in summer
to 151 days in winter) which vary in relation to temperature
and food availability, with populations growing from G1 to
G3 and slower development or possibly arrest of moulting for
the winter generation G4 (Razouls & Razouls 1990).
In copepods, lipid accumulation has been classically related
to seasonality in food supply and reproductive metabolism
(see review by Lee et al. 2006). Large accumulations of wax
esters in copepods or euphausiids are usually related to their
overwintering strategy (with or without diapause), while the
link with reproduction is more complex with either species
fuelling their egg production with accumulated lipids or
species using food - derived lipid to cover their reproductive
needs. As observed by Lee et al. (2006) most data at present
concerns species from polar or subpolar regions, i.e. large
Calanus type copepods and little is known concerning the
lipid dynamics of lipid-poor or lipid-rich small neritic
copepods. An earlier report on different small species from
the North Sea, such as Pseudocalanus elongatus, Acartia
clausi and Centropages hamatus, demonstrated that lipid
content was directly related to spring and summer blooms of
phytoplankton (Kattner et al. 1981). Most of these species
have two or more generations per year and the relationship
between lipid dynamic, generation succession, trophic
environment and reproductive strategy is largely unknown,
though it has generally been assumed that egg production was
directly or indirectly related to intake or synthesis from
available food source (Corkett & McLaren 1969, Bautista
et al. 1994).
Our data on Drepanopus pectinatus illustrated that,
although this is a multigenerational species, intra-generation
variability of lipid class composition dominated. Indeed,
spring and summer generations showed large fluctuations
while the winter generation showed a strong seasonal trend
throughout the period. As a result the seasonal lipid dynamics
did not seem to be linked to any single generation but rather to
the general pattern with a strong winter decline. A possible
general explanation could be that the lipid dynamics of a
given generation is driven by the accumulation of the previous
generation of females. Hence, spring and summer variability
in female lipid class composition could be linked to
successive phases of neutral lipid accumulation and
catabolism related to the high reproductive rate taking
place during this period of time (Alonzo et al. 2001). Late
autumn–winter decrease in lipid reserves is probably a
response to both low food conditions and lower level of
reproduction entirely based on the internal pool of lipid
reserves (Alonzo et al. 2001). Although total lipid content
is moderate (30–40% dry weight) when compared to large
Calanus species (Lee et al. 2006), the seasonal dynamics of
lipids was related to the accumulation of wax esters in
spring and summer (reproductive period). The coincidence
between high phytoplankton biomass and high wax esters
content does not mean that lipid accumulation controlled
egg production since Alonzo et al. (2001) established
that D. pectinatus used ingested phytoplankton to reduce
the consumption of their internal lipid reserves. The
seasonal changes in total lipid and WE suggested that for
multigeneration species, the overwintering pattern with high
lipid accumulation does not apply since winter individuals
showed the smallest size and lowest lipid levels. However,
the relatively high proportion of WE in late autumn and the
decreasing trends as winter developed is indicative that
survival remains associated with this type of reserve but
determined by the previous generation of females. The decrease
in WE between June and October could well illustrate the
importance of the long generation time of G4. Early winter
subadults and adults probably originate from the autumn G3
generation with relatively high wax esters percentage, while
individuals found in late winter in August were probably new
recruits from the winter G4 population with low WE but
relatively high TAG percentages.
Fatty acid composition of D. pectinatus cannot be
compared to any similar species from the Southern Ocean,
since data is non-existent. Polar lipid structure showed a
dominance of DHA, EPA and 16:0, a feature common to all
marine planktonic crustaceans (Albers et al. 1996, Mayzaud
1997, Lee et al. 2006). However, the changes in PUFA
proportion with season and generation illustrate the food
limitation on the winter generation to ensure proper
membrane structure. The lower content in DHA and
18:4n-3 together with the relatively stable level of EPA
suggests limitation of DHA synthesis in relation to the very
low level of food supply and the detritic nature of the
particulate matter associated with the maximum of
heterotrophic bacterial abundance (Razouls et al. 1997).
Such a dietary constraint is expected to be even more
influential on the control of the composition of neutral
lipid. Indeed, triacylglycerols changes are indicative of the
origin of food ingested over a relatively short time scale
14 P. MAYZAUD et al.

and follow quite well the changes in particulate characteristics
(Razouls et al. 1997). The spring and summer individuals
were associated with markers of phytoplankton blooms: i.e.
spring females with both diatoms and flagellates markers
(PUFAs of the n-3 family) and summer ones with diatom
(C16 PUFAs). Autumn and early winter individuals appeared
to shift feeding towards a more omnivorous/carnivorous mode
with C20 and C22 monoenes as characteristic descriptors (see
Lee et al. 2006). Late winter individuals are clearly associated
with detritus/bacteria food chain associated with saturated and
branched chain fatty acids. Wax esters illustrated a slightly
different perspective related to the longer time integration of
the fatty acid composition (Lee et al. 2006). Hence, WE from
the spring individuals are related to flagellate and some
bacterial descriptors (18 PUFA, 16:4n-3, 20:3n-3 but also
anteiso17:0, iso 17:0, 16:1n-5), while summer WE are clearly
associated with diatom bloom markers (C16 PUFA and 20:5).
Autumn and winter WE, associated with monoenes (C16, C20
and C22 as well as 16:3n-3, 20:4n-3 and 18:2n-6), would
indicate a more omnivorous/carnivorous trophic mode.
The alcohol fraction is extremely stable in all generations
with mainly saturated constituents accounting for more than
90%. The dominance of 16:0 and 14:0 alcohols is shared with
other neritic copepods such as Pseudocalanus sp. (Fraser et al.
1989), Pseudocalanus acuspes (Norrbin et al. 1990) and
Pseudocalanus minutus (Mayzaud 1980, Lischka & Hagen
2006). Kattner et al. (1996) suggested that such biosynthetic
pathway is associated with omnivorous/carnivorous trophic
behaviour. Given our results and the phytoplankton regime of
late stages D. pectinatus in spring and summer, one could
question this interpretation. Sargent et al. (1976) suggested
that wax esters formation in copepods was a mechanism
which ensures a high rate of lipid synthesis by converting
inhibitory end products fatty acyl coenzyme-A into alcohols,
which are removed from the system by being coupled with
fatty acids of dietary origin. Fatty alcohols may originate
either from phytoplankton fatty acids or synthesized de novo
from carbohydrates or amino acids (Sargent & Henderson
1986). In both cases D. pectinatus limits conversion to short
chain alcohols, in contrast to large Calanus species, which
convert monoenoic acids into 20:1n-9 and 22:1n-11 alcohols.
All large calanoid species, which undergo diapause during
winter to cope with low food conditions, accumulate wax
esters over the short phytoplankton abundance with a
dominance of high energy long chain C20 and C22
monoenoic acids (Falk-Petersen et al. 2009). Small, neritic
calanoid copepods, such as D. pectinatus, also feed mostly
on phytoplankton during spring and summer and display a
high rate of lipid synthesis. The outcome of these reserves
seems unlikely to be oriented towards winter survival since
few individuals from summer generation are likely to survive
as long as winter. None of the small species mentioned are
known to diapause and probably do not require such long
chain high energy molecules for their metabolic processes.
Other species with short chain saturated alcohols include
herbivorous/omnivorous Calanus propinquus (Hagen et al.
1993), Metridia longa (Sargent & Henderson 1986), Euchaeta
japonica (Lee et al. 1974) and carnivorous species such as
Paraeuchaeta antarctica (Mayzaud unpublished data). Hence,
long chain alcohols are more likely to be related to life
cycle requirements associated with diapause than trophic
type.
The changes in lipid classes over growth revealed some
interesting features. Young D. pectinatus copepodites showed
a dominance of TAG at stage C3, which is gradually replaced
by wax esters from stage C4 to a maximum percentage during
stage C5. Comparison is again difficult since most relevant
data concerns large calanoid species but the increased content
of wax esters with copepodite stage is consistent with the
findings of Lee et al. (1974) on Euchaeta japonica, and of
Kattner et al. (1994) on Calanus propinquus, Calanoides
acutus and Rhyncalanus gigas. The decrease in TAG seems
more specific to such small species and may simply indicate a
slow change from triacylglycerols dominating eggs and
nauplii to low triglyceride/high wax esters composition in
late copepodite and adult stages.
Fatty acid changes in relation to ontogenetic changes have
been studied in different copepod species but generally with
regard to total lipid rather than lipid classes or only for late
copepodite stages (Lee et al. 1974, Kattner & Krause 1987,
Kattner et al. 1994, Ward et al. 1996). Hence, comparisons
with the present findings are difficult due to the confounding
effect of neutral lipid changes on the polar lipid composition.
One of the interesting features recorded in the present work is
the low percentages of EPA and DHA in the phospholipids of
copepodite stage C3, and the recovery of high levels of DHA
as early as stage C4 or EPA at stage C5. The same trend was
observed for 18:4n-3 but over a smaller range of percentages.
The reverse pattern could be seen for the n-6 PUFA suggesting
a greater requirement in younger stages. Confirmation of
this possibility requires further study on a more complete
set of developmental stages. Saturated and monoenoic acids
decreased with increasing growth stage.
Considering the limited ability to elongate and/or desaturate
18-carbon PUFA (Moreno et al. 1979), copepods require pre-
formed essential fatty acids such as arachidonis acid (ARA,
20:4n-6), EPA and DHA in their diet to sustain growth.
Although our study was not organized to study essential fatty
acid (EFA) requirements, the data on the fatty acid partitioning
between neutral and PL suggests useful information
concerning EFA incorporation into membrane lipids. The
proportions of DHA, EPA and to a lower extent ARA recorded
in all stages (respectively 12–36%, 6–25% and 0.2–0.5%) were
markedly higher than in the natural spring–summer particulate
matter used as diet by the small copepods (DHA: 0–6%, EPA:
1–10%, ARA: 0.1–2%; Kerguelen shelf water, Mayzaud
unpublished data), indicating selective incorporation into
membrane lipids. This suggests that diet lipids are very
probably limiting in terms of DHA and EPA incorporation
mainly for the early C3 stage which feeds on the smaller
LIPID DYNAMICS IN A SUB-ANTARCTIC NERITIC COPEPOD 15

fraction of the size particles with low PUFA content
(Mayzaud et al. 1989).
In conclusion, while yearly and multiyear generation
copepods have developed lipid accumulation to respond
to winter survival and reproduction, multigenerational
species such as Drepanopus appear to accumulate lipid for
immediate specific needs, with spring and summer generation
accumulation to ensure reproduction and autumn generation
accumulation followed by winter catabolism to overcome
late winter poor food conditions. The dominant control of
neutral lipid composition by food intake, illustrated well
the succession of trophic interaction imposed on each
generation and the differential food sources for the different
developmental stages. Assimilated and stored (n-3) as well
as (n-6) PUFA are required to maintain structural synthesis,
but further work on a larger set of developmental stages
would be required to confirm our preliminary results.
Acknowledgements
The study was part of the IOZ programme financially
supported by a grant from the Groupement de Recherche en
Environnement 1069 ‘‘Ecosystemes Polaires et Anthropisation’’
from the CNRS, from IPEV Interactions Oiseaux-
Zooplancton 166 (IOZ), from Europe Noe MARBEF and
by CNRS UMR 7093. Fieldwork was supported financially
and logistically by the Institut Francais pour la Recherche
et la Technologie Polaires. The authors would like to thank
Dr J. Dolan for his editorial comments and Dr F. Alonzo for
his help during the fieldwork. The work would have been
difficult without the help at sea of the captain and the crew
from the RV La Curieuse. The technical help from P. Le
Jeune, G. Roudaut and N. Coffineau was greatly appreciated.
References
ACKMAN, R.G. 1981. Application of flame ionisation detector to thin layer
chromatography on coated quartz road. Methods in Enzymology, 72,
205–252.
ACKMAN, R.G., HOOPER, S.N., EPSTEIN, S. & KELLCHNER, M. 1972. Wax
esters of Barracuda lipid: a potential replacement for sperm whale oil.
Journal of American Oil Chemist’s Society, 49, 378–382.
ALBERS, C.S., KATTNER, G. & HAGEN, W. 1996. The composition of wax
esters, triacylglycerols and phospholipids in Arctic and Antarctic copepods:
evidence of energetic adaptation. Marine Chemistry, 55, 347–358.
ALONZO, F., MAYZAUD, P. & RAZOULS, S. 2001. Egg production and energy
storage in relation to feeding conditions in the subantarctic copepod
Drepanopus pectinatus: an experimental study of reproductive strategy.
Marine Ecology Progress Series, 209, 231–242.
BAUTISTA, B., HARRIS, R.P., RODRIGUEZ, V. & GUERRERO, F. 1994. Temporal
variability in copepod fecundity during two different spring bloom
periods in coastal waters off Plymouth (SW England). Journal of
Plankton Research, 16, 1367–1377.
BLIGH, E.G. & DYER, W.J. 1959. A rapid method of total lipid extraction
and purification. Canadian Journal of Biochemistry and Physiology, 37,
911–917.
CORKETT, C.J. & MCLAREN, I.A. 1969. Egg production and oil storage by
the copepod Pseudocalanus in the laboratory. Journal of Experimental
Marine Biology and Ecology, 3, 90–105.
FALK-PETERSEN, S., MAYZAUD, P., KATTNER, G. & SARGENT, J.R. 2009.
Lipids and life strategy in Arctic Calanus, a review. Marine Biology
Research, 5, 18–39.
FRASER, A.J., SARGENT, J.R. & GAMBLE, J.C. 1989. Lipid class and fatty acid
composition of Calanus finmarchicus (Gunnerus), Pseudocalanus sp., and
Temora longicornis Muller from nutrient enriched sea water enclosure.
Journal of Experimental Marine Biology and Ecology, 130, 81–92.
GOWER, J.C. 1987. Introduction to ordination techniques. In LEGENDRE, P.
& LEGENDRE, L., eds. Development in numerical ecology. NATO ASI
series G14. Berlin: Springer, 3–64.
HAGEN, W. 1988. On the significance of lipids in Antarctic zooplankton.
Berichte fur Polarforschung, 41, 1–129.
HAGEN, W., KATTNER, G. & GRAEVE, M. 1993. Calanoides acutus and
Calanus propinquus, Antarctic copepods with different lipid storage
modes via wax esters and triacylglycerols. Marine Ecology Progress
Series, 97, 135–142.
KATTNER, G. & KRAUSE, M. 1987. Changes in lipid during the development
of Calanus finmarchicus from copepodite I to adult. Marine Biology, 96,
511–518.
KATTNER, G., GRAEVE, M. & HAGEN, W. 1994. Ontogenetic and seasonal
changes in lipid and fatty acid/alcohol compositions of the dominant
Antarctic copepods Calanus propinquus, Calanoides acutus and
Rhyncalanus gigas. Marine Biology, 118, 637–644.
KATTNER, G., KRAUSE, M. & TRAHMS, J. 1981. Lipid composition of some
typical North Sea copepods. Marine Ecology Progress Series, 4, 69–74.
KATTNER, G., HAGEN, W., FALK-PETERSEN, S., SARGENT, J.R. & HENDERSON, R.J.
1996. Antarctic krill Thysanoessa macrura fills a major gap in marine
lipogenic pathways. Marine Ecology Progress Series, 134, 295–298.
KATTNER, G., HAGEN, W., LEE, R.F., CAMPBELL, R., DEIBEL, D., FALK-
PETERSEN, S., GRAEVE, M., HANSEN, B.W., HIRCHE, H.J., JONASDOTTIR,
S.H., MADSEN, M.L., MAYZAUD, P., MULLER-NAVARRA, D., NICHOLS, P.D.,
PAFFENHOFFER, G.A., POND, D., SAITO, H., STUBING, D. & VIRTUE, P. 2007.
Perspectives on marine zooplankton lipids. Canadian Journal of
Fisheries and Aquatic Sciences, 64, 1628–1639.
LEBART, L., MORINEAU, A. & PIRON, M. 1995. Statistique exploratoire
multidimensionnelle. Paris: Dunod Editeur, 450 pp.
LEE, R.F., HAGEN, W. & KATTNER, G. 2006. Lipid storage in marine
zooplankton. Marine Ecology Progress Series, 307, 273–306.
LEE, R.F., NEVENZEL, J. & LEWIS, A.G. 1974. Lipid changes during life cycle
of marine copepod Euchaeta japonica Marukawa. Lipids, 9, 891–898.
LISCHKA, S. & HAGEN, W. 2006. Seasonal lipid dynamics of the copepod
Pseudocalanus minutus (Calanoida) and Oithona similis (Cyclopoida) in
the Arctic Kongsforden (Svalbard). Marine Biology, 150, 443–454.
LORENZEN, C.J. & DOWNS, J.N. 1966. The specific absorption coefficients of
chlorophyllide a and pheophorbide a in 90 percent acetone and
comments on the fluorometric determination of chlorophyll and
pheopigments. Limnology and Oceanography, 31, 449–452.
MAYZAUD, P. 1980. Etude du metabolisme nutritionnel du zooplancton.
PhD thesis, Pierre and Marie Curie University, Villefranche, 250 pp.
[Unpublished].
MAYZAUD, P. 1997. Spatial and life cycle changes in lipid and fatty acid
structure of the Antarctic euphausiid Euphausia superba. In BATTAGLIA, B.,
VALENCIA, J. & WALTON, D.W.H., eds. Antarctic communities: species,
structure and survival. Cambridge: Cambridge University Press, 284–294.
MAYZAUD, P., ALBESSARD, E. & CUZIN-ROUDY, J. 1998. Changes in lipid
composition of the Antarctic krill Euphausia superba in the Indian
sector of the Antarctic Ocean: distribution among organs and sexual
maturity stage. Marine Ecology Progress Series, 173, 149–162.
MAYZAUD, P., CHANUT, J.P. & ACKMAN, R.G. 1989. Seasonal changes of the
biochemical composition of the marine particulate matter with special
reference to fatty acid and sterols. Marine Ecology Progress Series, 56,
189–204.
MORENO, V.J., MORENO, J.E.A. & BRENNER, R.R. 1979. Fatty acid
metabolism in the calanoid copepod Paracalanus parvus: 1.
Polyunsaturated fatty acids. Lipids, 14, 313–322.
16 P. MAYZAUD et al.

MORRISON, W.R. & SMITH, L.M. 1964. Preparation of fatty acid methyl-
esters and dimethyl acetals from lipids with boron fluoride-methanol.
Journal of Lipid Research, 5, 600–608.
NORRBIN, M.F., OLSEN, R.E. & TANDE, K.S. 1990. Seasonal variation in
lipid class and fatty acid composition of two small copepods in
Balsfjorden, northern Norway. Marine Biology, 105, 205–211.
RAZOULS, C. & RAZOULS, S. 1990. Biological cycle of a population of
subantarctic copepod, Drepanopus pectinatus (Clausocalanidae),
Kerguelen Archipelago. Polar Biology, 10, 541–543.
RAZOULS, S. & RAZOULS, C. 1988. Seasonal size distribution of developmental
stages of subantarctic copepod. Hydrobiologia, 167/168, 239–246.
RAZOULS, S., KOUBBI, P. & MAYZAUD, P. 1996. Spatio-temporal distribution
of mesozooplankton in a subantarctic coastal basin of the Kerguelen
Archipelago (southern Indian Ocean). Polar Biology, 16, 581–587.
RAZOULS, S., DE BOVEE, F., DELLILE, D., FIALA, M. & MAYZAUD, P. 1997.
Temporal variability of subantarctic bacteria, phyto- and zoo-plankton
assemblages. In BATTAGLIA, B., VALENCIA, J. & WALTON, D.W.H., eds.
Antarctic communities: species, structure and survival. Cambridge:
Cambridge University Press, 86–92.
REINHARD, S.B. & VAN VLEET, E.S. 1986. Lipid composition of twenty two
species of Antarctic midwater zooplankton and fish. Marine Biology, 91,
149–159.
SARGENT, J.R. & HENDERSON, R.J. 1986. Lipids. In CORNER, E.D.S. &
O’HARA, S.C.M., eds. The biological chemistry of copepods. Oxford:
Clarendon Press, 59–108.
SARGENT, J.R., LEE, R.F. & NEVENZEL, J.C. 1976. Marine waxes. In
KOLATTUKUDY, P., ed. Chemistry and biochemistry of natural waxes.
Amsterdam: Elsevier, 50–91.
TUCKER, M.J. & BURTON, H.R. 1990. Seasonal and spatial variations in the
zooplankton community of an eastern Antarctic coastal location. Polar
Biology, 10, 571–580.
WARD, P. & SHREEVE, R.S. 1999. The spring mesozooplankton community
at South Georgia: a comparison of shelf and oceanic sites. Polar
Biology, 22, 289–301.
WARD, P., SHREEVE, R.S. & CRIPPS, G.C. 1996. Rhincalanus gigas and
Calanus simillimus: lipid storage patterns of two species of copepod in
the seasonally ice free zone of the Southern Ocean. Journal of Plankton
Research, 18, 1439–1454.
LIPID DYNAMICS IN A SUB-ANTARCTIC NERITIC COPEPOD 17
Copyright © 2022 FDOKUMEN