Search, spectral classification and benchmarking of brown ...
81
UNIVERSIDADE FEDERAL DO RIO GRANDE DO SUL INSTITUTO DE F ´ ISICA DEPARTAMENTO DE ASTRONOMIA Search, spectral classification and benchmarking of brown dwarfs Marina Dal Ponte Msc. dissertation taken under the super- vision of Dr. Bas´ ılio Xavier Santiago sub- mitted to the Graduate Program of Insti- tuto de F´ ısica - Universidade Federal do Rio Grande do Sul (UFRGS) as part of the fulfilment to obtain the master’s degree in physics with emphasis in astrophysics. Porto Alegre, RS, Brasil 2019 ? This work has received financial support from Coordena¸ c˜ ao de Aperfei¸ coamento de Pessoal de N´ ıvel Superior (CAPES)
-
Upload
khangminh22 -
Category
Documents
-
view
2 -
download
0
Transcript of Search, spectral classification and benchmarking of brown ...

UNIVERSIDADE FEDERAL DO RIO GRANDE DO SULINSTITUTO DE FISICA
DEPARTAMENTO DE ASTRONOMIA
Search, spectral classification
and benchmarking of brown dwarfs
Marina Dal Ponte
Msc. dissertation taken under the super-
vision of Dr. Basılio Xavier Santiago sub-
mitted to the Graduate Program of Insti-
tuto de Fısica - Universidade Federal do
Rio Grande do Sul (UFRGS) as part of the
fulfilment to obtain the master’s degree in
physics with emphasis in astrophysics.
Porto Alegre, RS, Brasil
2019
? This work has received financial support from Coordenacao de Aperfeicoamento de
Pessoal de Nıvel Superior (CAPES)
UNIVERSIDADE FEDERAL DO RIO GRANDE DO SULINSTITUTO DE FISICA
DEPARTAMENTO DE ASTRONOMIA
Procura, classificacao espectral
e benchmarking de anas marrons
Marina Dal Ponte
Porto Alegre, RS, Brasil
2019
? Trabalho financiado pela Coordenacao de Aperfeicoamento de Pessoal de Nıvel Superior
(CAPES)

”There’s comfort in melancholy
When there’s no need to explain
It’s just as natural as the weather
In this moody sky today”
Joni Mitchell
(Hejira,1976.)

Acknowledgements
To my family, especially my mother Zenaide and father Santo, for all the sup-
port. Even though my life choice was the oddest for them, it was fundamental never
being questioned for my decisions. I also appreciate all their curiosity related to my
work and the pride in their voices when referring to me as the scientist of the family.
To my advisor, Basılio Xavier Santiago for all the patience, the sharing of knowl-
edge, the teaching of how to question, for all the trust and support in difficult times
and all the efforts that made me grow as a researcher.
To my astro friends Anna, Lari, Nicolas, Ale, Ingrid, Fernanda for all the sup-
port, for encouraging me in life and work and for all the beer nights. An extra
special thanks for the astro girls, who always share their amazing power with me.
To the people of M207, especially Amanda and Vinicius, for providing lots of
coffee every single day. Also thanks for the chocolate, cake, bread and caipirinha.
Also an extra thanks to Vini, my bike partner, who taught me how to be nicer and
gentle with car drivers even when they don’t deserve.
To my friend Gabrielly, a true sister, and Nick for sharing so much so fast. We
learn a lot together and I feel really privileged having you in my life.
To my boyfriend Fabio for being there in the most stressful and anxious moments
of my life. Thanks a lot for helping me and for constantly trying to convince me
that everything is going to be ok.
To Aurelio for the amazing brown dwarfs journey, for the patience, all the shared
tasks and knowledge and for encouraging me to move forward.
All of my life I studied in public institutions and without them, I wouldn’t be
able to be where I am today. We must support quality public education to provide
all kinds of opportunities to people who wouldn’t have them otherwise.

AbstractBrown dwarfs are a very common type of object in our Galaxy, but due to
their very low luminosity they rank among the hardest sources to detect. The
known samples are still largely restricted to a distance of few tens of parsecs. Our
motivation is to make a first large scale census of L and T dwarfs in order to study
structural Milky Way parameters and to constrain the properties and formation
history of this population. In order to do so, we developed a color selection method
for brown dwarfs and applied it to large survey data. Our color selection was based
on DES+VHS+WISE photometry. We also used these data for spectral classification
of MLT dwarfs, by developing and applying a code that compares their observed
colours to expected template values, with the minimization of the χ2. With the L
and T dwarfs candidate sample in hand, we measured the scale height of disk L-
type dwarfs. The L dwarf scale height was estimated with the aid of a brown dwarf
simulation code, which we call GalmodBD, by comparing the observed and simulated
number counts of such objects for a grid of models of varying spatial distributions.
The initial estimate of scale height was hz,thin ∼ 450 parsec.
We also studied benchmark systems, specifically the wide binary systems made
up of L or T dwarfs orbiting main sequence stars. These systems are useful to
improve brown dwarf evolutionary models, since their chemical composition and
age constraints may be taken from the primary star assuming that the pair formed
from the same gas cloud and at the same time. Our approach was to use our
sample of brown dwarfs candidates selected from DES+VHS+WISE data and then
search for possible companions in the Gaia DR2 and DES DR1 stellar data. We
also searched for L and T dwarfs binary systems among themselves. We found 197
new binary systems made up by an L or T dwarf orbiting a main sequence star or
in a double LT system and we also found 2 multiple system candidates, triple and
quadruple. All the systems with < 10,000 AU projected separation.
Key-words: Brown Dwarfs, Benchmarks, Dark Energy Survey

ResumoAnas marrons sao um tipo comum de objeto na nossa Galaxia, mas devido a
sua baixa luminosidade elas sao fontes difıcies de detectar. As amostras conhecidas
ainda sao em geral restritas a uma distancia de poucas dezenas de parsecs. Nossa
motivacao e fazer um primeiro censo em grande escala de anas L e T para entao
estudar parametros da Via Lactea e tambem restringir as propriedades e historico da
formacao desta populacao. Para tal, nos desenvolvemos um metodo de selecao em
cor para anas marrons e o aplicamos a dados de grandes levantamentos. A selecao
de cores foi feita usando a fotometria do DES+VHS+WISE. Usamos tambem os
mesmos dados em um codigo de classificacao espectral para anas MLT, baseada na
comparacao das cores observadas e esperadas e minimizacao do χ2. Com a amostra
de candidatas a anas L e T em maos, nos medimos a escala de altura do disco para
as anas L. A escala de altura foi estimada com o auxılio de um codigo chamado
GalmodBD, que simula anas marrons, pela comparacao entre a contagem observada
e as simuladas para uma grade de modelos com diferentes distribuicoes espaciais.
Nossa primeira estimativa da escala de altura do disco foi da ordem de hz,fino ∼ 450
pc.
Tambem estudamos sistemas benchmark, especificamente em sistemas binarios
formados por uma ana L ou T orbitando uma estrela de sequencia principal. Esses
sistemas sao uteis para melhorar modelos evolutivos de anas marrons, dado que a
composicao quımica e idade podem ser obtidas atraves da estrela primaria, assu-
mindo que o par se formou de uma mesma nuvem de gas e ao mesmo tempo. Nossa
abordagem foi usar nossa amostra de candidatas a anas marrons selecionadas nos
dados do DES+VHS+WISE e entao procurar por possıveis companheiros nos dados
do Gaia DR2 e da amostra estelar do DES DR1. Tambem procuramos por sistemas
binarios entre as proprias anas L e T. Encontramos 197 novos sistemas binarios
constituıdos por uma ana L ou T orbitando uma estrela de sequencia principal ou
em um sistema contituıdo por duas anas marrons e encontramos 2 candidatos a sis-
temas multiplos, um triplo e quadruplo. Todos os sistemas possuem uma separacao
projetada < 10,000 UA.
Palavras-chaves: Anas marrons, Benchmarks, Dark Energy Survey

Contents
Contents 1
1 Introduction 2
1.1 Brief history of brown dwarfs . . . . . . . . . . . . . . . . . . . . . . 2
1.2 Brown dwarfs properties and characteristics . . . . . . . . . . . . . . 3
1.3 Evolutionary models . . . . . . . . . . . . . . . . . . . . . . . . . . . 4
1.4 Luminosity and Mass Function . . . . . . . . . . . . . . . . . . . . . 8
1.5 Spectroscopic and photometric samples of L, T and Y dwarfs . . . . . 9
1.6 Benchmark brown dwarfs . . . . . . . . . . . . . . . . . . . . . . . . . 11
1.7 L and T dwarfs and the Dark Energy Survey . . . . . . . . . . . . . . 12
2 DES L and T dwarfs sample 14
3 Benchmark L and T dwarfs 43
4 Conclusions and Future Perspectives 61
References 63
1

Chapter 1
Introduction
1.1 Brief history of brown dwarfs
The existence of objects with a mass less that a certain limit that cannot burn
hydrogen because of their temperature and density was demonstrated by Kumar
(1963), based on theoretical calculations. Instead, the object contracts, becomes
completely degenerate and the electron degeneracy pressure provides the hydrostatic
equilibrium. The hydrogen burning minimum mass of mHBMM ∼ 0.085M was
proposed by Grossman et al. (1974) based on detailed evolutionary calculations,
however the term brown dwarf was given by Tarter (1975) to designate such objects.
The firsts discoveries of bona fide brown dwarfs were made only in the 1990s.
Gliese 229B, shown in Figure 1.1, discovered by Oppenheimer et al. (1995), exhibited
a strong methane (CH4) absorption line which implied an object too cool to be a star.
Also, in the Pleiades cluster, PP1 15 and Teide 1 (Stauffer et al., 1994, Rebolo et al.,
1995) were identified as promising brown dwarfs candidates and were confirmed later
by the detection of lithium (Li) (see Section 1.2), therefore becoming the first known
free-floating brown dwarfs.
The early models for low mass stars and brown dwarfs suggested by Vandenberg
et al. (1983), Dantona & Mazzitelli (1985), Nelson et al. (1986), Lunine et al. (1986),
Burrows et al. (1989), Dorman et al. (1989) failed to reproduce the observations at
the bottom of the Main Sequence (MS) and to provide a reliable determination of
properties such as mass, age, effective temperature (Teff ) and luminosity. Only the
subsequent models presented by Brett & Smith (1993), Saumon et al. (1994), Al-
lard & Hauschildt (1995) allowed the computation of non-grey evolutionary models
(Baraffe et al., 1995) and enabled a direct confrontation between theory and obser-
vation. We will return to the structure and evolutionary models of brown dwarfs in
2

Introduction 3
Figure 1.1: The left panel shows the image of Gliese 229B obtained in the PalomarObservatory and the right panel the Hubble Space Telescope image, both from 1995.Image taken from http://hubblesite.org/image/372/news_release/1995-48.
Section 1.3.
1.2 Brown dwarfs properties and characteristics
Brown dwarfs are considered substellar objects linking the lowest mass stars and
giant planets, with masses ranging 0.085 down to 0.013 M. For solar composition
and age, evolutionary models predict a central density (ρc) range from ∼ 103 to 10
g/cm3 and the Teff range from ∼ 2,000 to ∼ 100 K, if we consider objects with
mass from the mHBMM to Saturn.
For brown dwarfs, the interior is essentially made by fully ionized plasma and
degenerate electrons. The central density decreases with decreasing mass (ρc ∝ m2).
The energy transport is essentially made by convection, but may also take place
by conduction. As brown dwarfs undergo cooling throughout most of their lives,
the interior of a brown dwarf eventually becomes degenerate enough so that the
conductive flux becomes larger than the convective flux (Chabrier & Baraffe, 2000).
The evolutionary timescale is many orders of magnitude larger than the convec-
tive timescale (Bildsten et al., 1997). This means that the abundances in the interior
and the atmosphere are the same. Rebolo et al. (1992) was the first to proposed the
Li test to identify bona-fide brown dwarfs. The Li remaining in a fully mixed object
older than 108 years means lack of H burning in its interior. The minimum mass for
the occurrence of lithium burning is ' 0.06 M (Chabrier et al., 1996). However,
it is important to mention that the Li test could lead to false positive cases. An
example is young low mass stars (t < 108 years, and with specific masses), which
will exhibit lithium in their photosphere because they did not yet have the time to
burn it. Also, more massive brown dwarfs (' 0.06 M) older than 108 years will

Introduction 4
have burned all the Li, thus escaping detection based on this element. Similar tests
can be applied to deuterium (D). For D, the minimum mass for the burning to
occur is ' 0.013 M (Shu et al., 1987).
The low temperature and high pressures in the photosphere of brown dwarfs
are appropriate for formation of many molecular species, whose chemical features
and opacities result in a complex spectral energy distribution (SEDs). For example,
at a m ∼ 0.085 M and Teff ∼ 2,000 K broad molecular absorption bands as V O,
FeH, CaH disappear from the spectral distribution, only with some TiO remaining.
The decreasing of TiO led to the proposition of the new L spectral type, since the
TiO band is often an indicator of M dwarfs. Also, as the temperature decreases
the carbon will be mainly found in the form of CH4, whose spectral features again
claimed for another spectral type, known as T dwarfs. The Figure 1.2 shows the
spectra for the M, L and T dwarfs, in special for the L type sequence, with an
emphasis in the most prominent lines and bands. The L and T transition effective
temperature is not precisely determined but it is in a narrow range of 1,400 to 1,200
K. Also, objects with Teff < 600 K are the Y types.
For late M dwarfs and L types, there is a cloud formation very near to the
photosphere. Figure 1.3 shows many interesting features about the characteristics
of L and T dwarfs. It shows a natural extension from the M to the L dwarfs,
suggesting that clouds play a continuous role from late M through the L. From L
to T dwarfs, there is a change in color which its characterized by the lack of cloud
opacity and also for the appearance of CH4. This change in color is due to CH4
absorption in the H and K bands, yielding relatively blue near infrared colors. In
terms of model implications, the L/T transition requires a change in properties in
a small range of Teff , something that is challenging to achieve.
1.3 Evolutionary models
The evolutionary models for brown dwarfs are very sensitive to the chemical compo-
sition of the photosphere. Moreover, the spectra of brown dwarfs are composed by
several types of molecules, as discussed in the previous section, and the line opacities
for several of them still need improvement.
The evolutionary models connects the surface properties as Teff and surface
gravity (g) to the interior properties as mass, luminosity, radius and age. For the
structure and evolution, the model needs the mass equation, the equation of hy-
drostatic equilibrium, the equation of conservation of energy and the equation of

Introduction 5
Figure 1.2: Spectra for the L-dwarf sequence, a T dwarf (Gliese 229B) and threelate-M dwarfs. The late-M dwarfs and T dwarf spectra are shown for comparisonto the L dwarfs. The prominent lines and bands are marked. Image taken fromKirkpatrick et al. (1999).
state (Saumon et al., 1995). The non-gray, realistic atmosphere models provide the
surface boundary condition for the interior structure calculations and also the colors
and magnitudes for a given star at a given age. The last evolutionary models was
proposed by Saumon & Marley (2008), including two different atmospheres for the
models: cloudy and cloudless. The cloudy atmospheres have larger opacity than
clear models.
Figure 1.4 shows that the difference between the cloudy and cloudless models

Introduction 6
Figure 1.3: Near infrared color-magnitude diagram for brown dwarfs, where theobjects have been color-coded according to the spectral subtype. Image taken fromFaherty et al. (2016).
vanishes at low and high effective temperature. At intermediate temperature, the
models are more discrepant. This figure also shows that a object with a known
luminosity has a upper limit to its Teff . For the cloudless evolutionary model the
surface gravity has a limit of logg = 5.465 for 0.068 M at Teff = 1160 K. In the
cloudy model, the logg = 5.366 at the same mass, with Teff = 1380 K.
The cloudy model was compared with DUSTY00 (Chabrier et al., 2000, Baraffe
et al., 2002) and the cloudless with the COND03 (Baraffe et al., 2003). Both models
have the same interior, no significant difference in the nuclear reaction rates, but
COND03 and DUSTY00 include the energy transportation by conduction. Com-
paring the models, the luminosities are slightly higher in COND03 and DUSTY00
models. However, for all masses and ages above a few Myr the models agreed very
well. At young ages, there are more discrepancies, but it is a reflection of different
choices for the initial conditions. Also, for objects with more than 10 Gyr, the effect
of a non inclusion of electron conduction reflects in a larger luminosity difference
between the models. Also, Saumon & Marley (2008) presented a single model, called
hybrid, which is an approach to describe the L/T transition where the clouds vanish
with decreasing Teff . This hybrid model was proposed because neither cloud nor
cloudless models alone can describe the observed or simulated populations.
Also, the binaries play an important role in evolutionary models (Chabrier, 2002,

Introduction 7
Figure 1.4: Surface gravity versus effective temperature for evolutionary modelsbased on cloudless and cloudy atmospheres proposed by Saumon & Marley (2008).The black lines represents the cloudy atmospheres with masses ranging from 0.08to 0.005 M as indicated on the left of each line. The cloudless tracks are the graylines. The isochrones are the blue dotted lines ranging from 0.01, 0.02, 0.04, 0.1,0.2, 0.4, 1, 2, 4 to 10 Gyr (right to left). The red vertical lines are curves fromconstant luminosity from log L/L = -3 to -6.5 (from right to left). The greencurves represent constant radius from 0.08 to 0.13 R (from top to bottom). Thekink in the isochrones represents the deuterium burning phase. Image taken fromSaumon & Marley (2008).
Burgasser, 2007). Almost 10-20 % of brown dwarfs are predicted to be in binaries
systems, as we will discuss in more details in Section 1.6. Unresolved binaries also
affect photometric measurements, with an upward shift by 0.75 magnitude for a
secondary to primary mass ratio of q = 1, when the total flux is doubled with
respect to a single object. Notice that the mass ratio distribution is in general
peaked at or close to q = 1.

Introduction 8
1.4 Luminosity and Mass Function
The problem in the determination of the luminosity and mass function is based on
the limited number of objects, since the available samples are limited to the solar
neighbourhood. Brown dwarf observations will be biased toward young and massive
objects, since most of the sources formed at the early stages of the Galaxy will have
dimmed to very low luminosities (L ∼ 1/t).
In the stellar regime, the initial mass function (IMF) is often characterized by
a power law dN/dM ∝ M−α, with α = 2.35 for Salpeter IMF (Salpeter, 1955).
For brown dwarfs there is no unique mass-luminosity relationship that one can use
to convert the luminosity function into the IMF. The luminosity function (LF) is
influenced by the formation history, which is still lacking details and relies on many
possible formation scenarios. Considering young clusters and associations, it is pos-
sible to break the age-mass-luminosity relations because their age and metallicities
are known and, therefore, remove the dependency of the LF with the formation his-
tory. In the case of field brown dwarfs, the benchmarks systems play an important
role in the determination of age and metallicity, since the primary star could con-
strain these parameters for the brown dwarf. However, the field populations require
assumptions of the formation history. Also, an IMF measure requires a well known
space density for LTY types and a precise determination of the binary fraction.
For brown dwarfs, the value of α changes with the sample, binary fraction and
space density. For field surveys, the slope is α < 0 (Burningham et al., 2010) and
for young clusters and associations, as for Upper Sco is α = 0.6± 0.1 (Lodieu et al.,
2007), for Pleaides is α = 0.6 ± 0.1 (Moraux et al., 2003) and for σ Orionis is
α = 0.5 ± 0.2 (Lodieu et al., 2009). The variations on the slope arise from the
different methods and quantities considered to derive it.
The shape of the IMF, binary fraction and multiplicity function of brown dwarfs
are important discriminants to scenarios of brown dwarf formation. According to
Luhman (2012), there are five basic such scenarios: i) formation in a proto stellar
cluster, where tidal shears and high internal velocities negatively affect the mass
accretion by small mass cores (Bonnell et al., 2008); ii) brown dwarfs are the least
massive cores inside a proto cluster and are therefore ejected due to dynamical inter-
action with more massive ones, hence halting their mass growth (Boss, 2001, Bate
& Bonnell, 2005); iii) massive OB stars form first and their ionizing flux removes
the gas around least massive cores, again with a negative feedback to brown dwarf
progenitors (Whitworth & Zinnecker, 2004); iv) brown dwarfs form in circumstellar
disks around more massive proto stars and then are ejected into the field by inter-

Introduction 9
action with other (proto)stars (Bate et al., 2002, Bate & Bonnell, 2005, Stamatellos
et al., 2011); v) a proto cluster fragments into smaller cores spanning a wide range
of masses, the smallest of which turn into brown dwarfs (Padoan & Nordlund, 2002,
Elmegreen, 2011). Ruling out or even constraining these models, however, requires
larger samples and more accurate estimates of the IMF, space densities, binary
fractions and multiplicity functions than currently available.
1.5 Spectroscopic and photometric samples of L,
T and Y dwarfs
With the advent of deep and wide field surveys, such as Deep Near Infrared Survey
of the Southern Sky (DENIS; Epchtein et al., 1997), Sloan Digital Sky Survey
(SDSS; York et al., 2000), Two-Micron All-Sky Survey (2MASS; Skrutskie et al.,
2006), UKIRT Infrared Deep Sky Survey (UKIDSS; Lawrence et al., 2007), VISTA
Hemisphere Survey (VHS; McMahon et al., 2013) and Wide-field Infrared Survey
Explorer (WISE; Wright et al., 2010), ever larger samples of L,T and Y dwarfs
were provided. This increase in the census of brown dwarfs brought an increase
in statistical significance to constraints to current models for the structure and
evolution of brown dwarfs. Up to now there are several samples selected in different
ways, depending on the main photometric bands from each survey. Some of them
are listed bellow.
Using the SDSS data, Chiu et al. (2006) presented the discovery and properties of
71 LT dwarfs using a (i− z)SDSS > 2.2 color selection. 65 of these dwarfs have been
classified spectroscopically and the spectral types range from L3 to T7. A similar
method is presented in Schmidt et al. (2010), who identified a sample of 484 L dwarfs
candidates applying (i− z)SDSS > 1.4 color selection. In this candidate sample, 210
L dwarfs were new discoveries and the authors have not made the spectroscopic
confirmation.
The Canada–France Brown Dwarfs Survey presented in Albert et al. (2011) was
carried out with MegaCam at the Canada–France–Hawaii Telescope, and covers a
surface area of 780 deg2. This survey identified about 70 T dwarf candidates where
43 were spectroscopically confirmed and 6 were previously published and 37 were
new discoveries, with spectral types ranging from T0 to T8.5.
Using WISE data, Kirkpatrick et al. (2011) were able to identify and classify 6 Y
dwarfs, 89 T dwarfs and 8 L dwarfs. The selection was made by color cuts and the
sample has spectrocopic confirmation. With this sample, it was able to extend the
Introduction 10
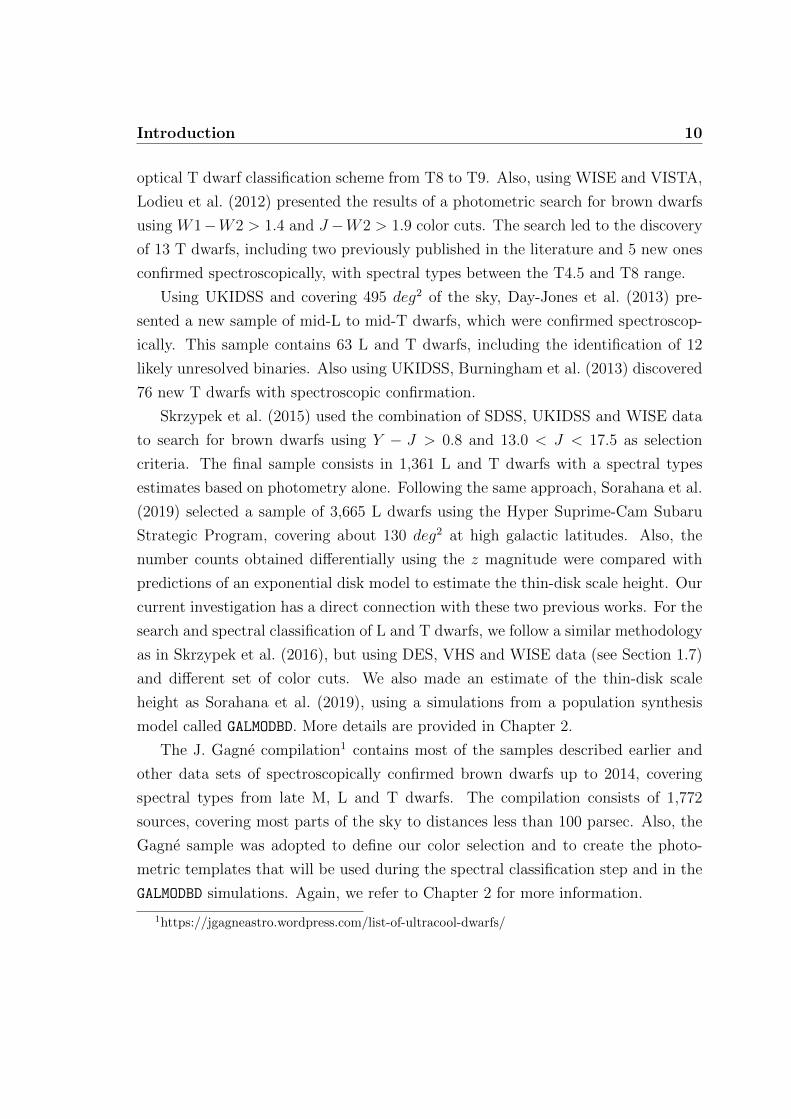
optical T dwarf classification scheme from T8 to T9. Also, using WISE and VISTA,
Lodieu et al. (2012) presented the results of a photometric search for brown dwarfs
using W1−W2 > 1.4 and J −W2 > 1.9 color cuts. The search led to the discovery
of 13 T dwarfs, including two previously published in the literature and 5 new ones
confirmed spectroscopically, with spectral types between the T4.5 and T8 range.
Using UKIDSS and covering 495 deg2 of the sky, Day-Jones et al. (2013) pre-
sented a new sample of mid-L to mid-T dwarfs, which were confirmed spectroscop-
ically. This sample contains 63 L and T dwarfs, including the identification of 12
likely unresolved binaries. Also using UKIDSS, Burningham et al. (2013) discovered
76 new T dwarfs with spectroscopic confirmation.
Skrzypek et al. (2015) used the combination of SDSS, UKIDSS and WISE data
to search for brown dwarfs using Y − J > 0.8 and 13.0 < J < 17.5 as selection
criteria. The final sample consists in 1,361 L and T dwarfs with a spectral types
estimates based on photometry alone. Following the same approach, Sorahana et al.
(2019) selected a sample of 3,665 L dwarfs using the Hyper Suprime-Cam Subaru
Strategic Program, covering about 130 deg2 at high galactic latitudes. Also, the
number counts obtained differentially using the z magnitude were compared with
predictions of an exponential disk model to estimate the thin-disk scale height. Our
current investigation has a direct connection with these two previous works. For the
search and spectral classification of L and T dwarfs, we follow a similar methodology
as in Skrzypek et al. (2016), but using DES, VHS and WISE data (see Section 1.7)
and different set of color cuts. We also made an estimate of the thin-disk scale
height as Sorahana et al. (2019), using a simulations from a population synthesis
model called GALMODBD. More details are provided in Chapter 2.
The J. Gagne compilation1 contains most of the samples described earlier and
other data sets of spectroscopically confirmed brown dwarfs up to 2014, covering
spectral types from late M, L and T dwarfs. The compilation consists of 1,772
sources, covering most parts of the sky to distances less than 100 parsec. Also, the
Gagne sample was adopted to define our color selection and to create the photo-
metric templates that will be used during the spectral classification step and in the
GALMODBD simulations. Again, we refer to Chapter 2 for more information.
1https://jgagneastro.wordpress.com/list-of-ultracool-dwarfs/

Introduction 11
1.6 Benchmark brown dwarfs
Benchmark brown dwarfs are very useful because we can use them to break degen-
eracies in age, mass and metallicity, thus being very helpful for the characterisation
of cool substellar objects. A common type of benchmark system are wide binaries,
composed of resolved companions, where the primary is commonly a main sequence
star and the secondary is a L or T dwarf. The metallicity and age constraints may be
taken from the primary star since it is very difficult to measure these properties for
the L and T dwarfs. For that purpose, one naturally has to rely on the assumption
that the pair formed at the same time, from the same material, and evolved in the
same environment.
One issue in finding benchmark systems involving L or T dwarfs is that the
binary fraction seems to decrease from early to late primary’s spectral types (Kraus
& Hillenbrand, 2012). For solar type stars, the binary fraction ranges within 50-60%
(Raghavan et al., 2010) and for M stars it is in the 30-40% range (Janson et al.,
2012). For brown dwarfs in the field, the resolved binary frequency ranges around
10-20% (Burgasser et al., 2006, Gelino et al., 2011, Huelamo et al., 2015). Also, for
binary systems with a solar type as a primary and a brown dwarfs as a secondary, we
find a called brown dwarf desert, which corresponds to a very small binary fraction
(1 − 3%) for small separations (few AU) (Grether & Lineweaver, 2006, Metchev &
Hillenbrand, 2009). For brown dwarfs, the binary fraction, mass-ratio distribution
or separation could provide constrains on star formation and dynamical evolution
(Goodwin & Whitworth, 2007).
In the case of wide binary systems, for solar type stars Tokovinin & Lepine
(2012) estimates 4.4 % are wider than 2,000 AU. More recently Dhital et al. (2011)
and Dhital et al. (2015) presented the Sloan Low-mass Wide Pairs of Kinematically
Equivalent Stars (SLoWPoKES), which is a catalog containing common proper mo-
tion and common distance of wide (∼ 500-60,000 AU) candidate pairs. For the mid
K and mid M type dwarfs presented in both catalogs, the wide binary frequency was
∼ 1.1%. For L and T dwarfs in wide systems this frequency still remains uncertain.
Also, brown dwarfs in wide binary systems could impact the formation theories,
especially the ejection model, since this type of system is not expected to survive
ejection from their birth environments.
Since it is harder in practice to sample and measure resolved pairs with large
primary to secondary mass ratios, for which the magnitude difference is large. Often
either the primary may be saturated or the secondary be undetected. Our expecta-
tion is to find mostly pairs involving late type main-sequence dwarfs as primaries.

Introduction 12
Figure 1.5: The DES footprint is shown in red. The eight shallow SN fields areshown as blue circles, and the two deep SN fields are shown as red circles. TheMilky Way plane is shown as a solid line, with dashed lines at b = ±10 deg. TheGalactic center are marked as a cross and south Galactic pole as a plus sign. TheLarge and Small Magellanic Clouds are indicated as gray ellipses. Image taken fromAbbott et al. (2018).
Based on the discussion earlier in this section, binaries involving two brown dwarfs
should be rare. Also L dwarfs should appear in fewer wide binary companions when
compared to M dwarfs, and most of these systems should have an M as a primary.
1.7 L and T dwarfs and the Dark Energy Survey
The Dark Energy Survey (DES) is a wide field optical survey in the grizY bands,
covering 5,000 deg2 in the south Galactic cap, using the Dark Energy Camera (DE-
Cam; Flaugher et al., 2015), which is installed at the prime focus of the 4 m Blanco
telescope at Cerro Tololo Inter-American Observatory (CTIO) in northern Chile.
The DES wide-area footprint shape, shown in Figure 1.5, was selected to obtain
an overlap with the South Pole Telescope survey (Carlstrom et al., 2011) and Stripe
82 from SDSS (Abazajian et al., 2009). The Galactic plane was avoided in order to
maintain the main DES goals, which are cosmological and extragalactic in nature,
by minimizing stellar foregrounds and extinction from interstellar dust.
DES Data Release 1 (DR1; Abbott et al., 2018) is composed by 345 distinct
nights spread over the first 3 years of DES operations from 2013 August 15 to 2016
February 12. The DR1 uses exposure times are of 90s for griz bands and 45s for Y
band, yielding a typical single-epoch point-spread function (PSF) depth at signal-
to-noise ratio (S/N) = 10 of g = 23.57, r = 23.34, i = 22.78, z = 22.10, and Y

Introduction 13
= 20.69 (AB system). The DES DR1 co-add source extraction process detected
and cataloged 399,263,026 distinct objects. The Figure 1.5 shows the DES DR1
footprint.
The DES filters izY were the most important to our project, since due to their
very red nature, brown dwarfs could be detected using red optical bands. Also, we
decided to match DES data with two other surveys: VISTA Hemisphere Survey
(VHS) and Wide-field Infrared Survey Explorer (WISE). The main reason was to
increase the number of bands, especially the infrared ones. This combination of
optical bands with infrared is very helpful to identify red and late-type objects, as
has been demonstrated in the literature and mentioned in the earlier sections.

Chapter 2
DES L and T dwarfs sample
In this section we describe our L and T candidates sample selected using DES, VHS
and WISE data. The candidate L and T dwarfs were initially selected based on
color criteria in optical and near-infrared bands. For that purpose we used available
catalogs containing MLT dwarfs with spectroscopic confirmation and located inside
the common footprint between DES and VHS. The colours of these objects, and
also of a high redshift quasar sample, were used to find cuts in colour-space that
best isolate L and T dwarfs from M stars and quasars.
We also performed spectral classification using only the available photometry,
based on the approach presented in Skrzypek et al. (2015) and Skrzypek et al.
(2016), which relies a minimization of the χ2 relative to empirical templates. The
templates were created using the samples of confirmed MLT dwarfs inside the foot-
print. Spectral types were obtained for all sources that passed the colour cuts, and
led to an additional cleaning of the L and T candidates. The final catalog contains
11,745 L and T dwarfs candidates and is the biggest to date.
We also used a simulation code called GalmodBD to estimate the completeness and
purity of our photometric brown dwarfs catalogue as well as to constrain the thin
disk scale height for the early L population. GalmodBD creates synthetic samples of
brown dwarfs based on the expected number counts for a given footprint and down
to a given magnitude limit, using empirically determined space densities of objects,
absolute magnitudes and colors as a function of spectral type. Using the synthetic
samples, we compared the number counts between simulation and data and find a
scale height of the order of hz,thin ∼ 450 pc. However, T dwarfs are less than 2% of
the sample and are limited to 100 pc. This implies that we are estimating the scale
height for the early L dwarfs.
The rest of this chapter is presented as submitted paper (Carnero Rosell et al.,
14

DES L and T dwarfs sample 15
2019) to the Monthly Notices of the Royal Astronomical Society. It is important to
mention that this paper has passed through an extensive internal review by DES
members.
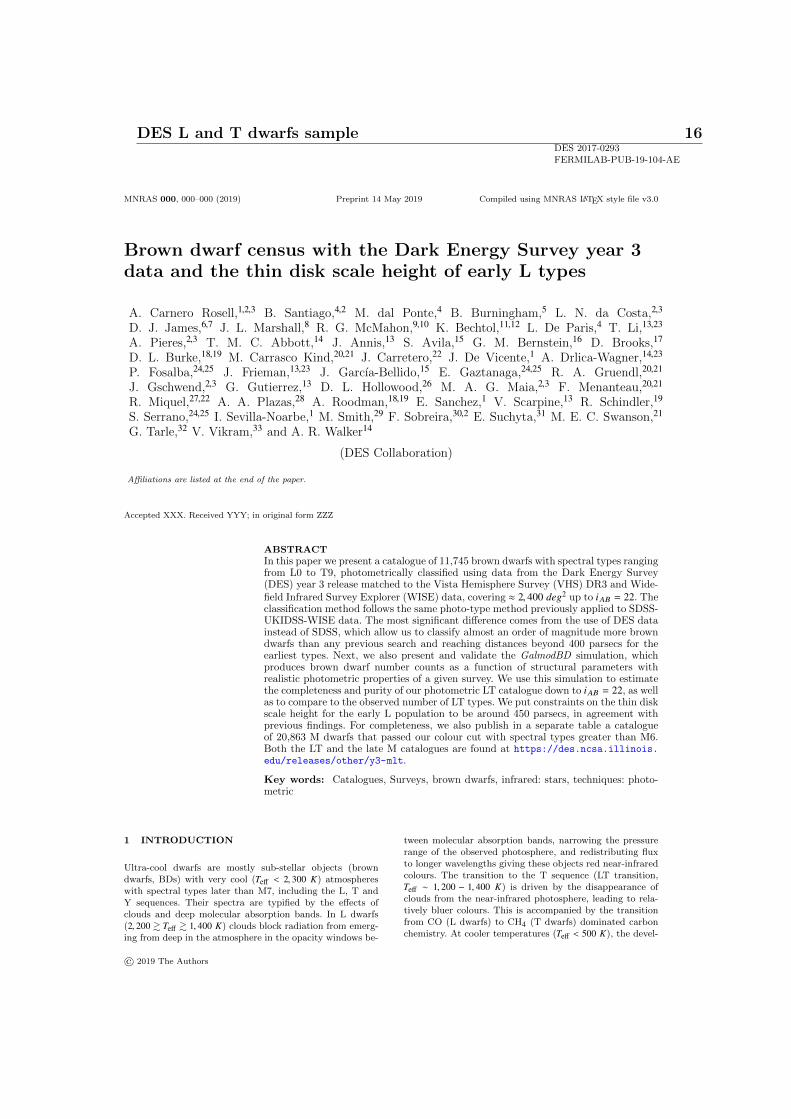
DES 2017-0293FERMILAB-PUB-19-104-AE
MNRAS 000, 000–000 (2019) Preprint 14 May 2019 Compiled using MNRAS LATEX style file v3.0
Brown dwarf census with the Dark Energy Survey year 3data and the thin disk scale height of early L types
A. Carnero Rosell,1,2,3 B. Santiago,4,2 M. dal Ponte,4 B. Burningham,5 L. N. da Costa,2,3
D. J. James,6,7 J. L. Marshall,8 R. G. McMahon,9,10 K. Bechtol,11,12 L. De Paris,4 T. Li,13,23
A. Pieres,2,3 T. M. C. Abbott,14 J. Annis,13 S. Avila,15 G. M. Bernstein,16 D. Brooks,17
D. L. Burke,18,19 M. Carrasco Kind,20,21 J. Carretero,22 J. De Vicente,1 A. Drlica-Wagner,14,23
P. Fosalba,24,25 J. Frieman,13,23 J. Garcıa-Bellido,15 E. Gaztanaga,24,25 R. A. Gruendl,20,21
J. Gschwend,2,3 G. Gutierrez,13 D. L. Hollowood,26 M. A. G. Maia,2,3 F. Menanteau,20,21
R. Miquel,27,22 A. A. Plazas,28 A. Roodman,18,19 E. Sanchez,1 V. Scarpine,13 R. Schindler,19
S. Serrano,24,25 I. Sevilla-Noarbe,1 M. Smith,29 F. Sobreira,30,2 E. Suchyta,31 M. E. C. Swanson,21
G. Tarle,32 V. Vikram,33 and A. R. Walker14
(DES Collaboration)
Affiliations are listed at the end of the paper.
Accepted XXX. Received YYY; in original form ZZZ
ABSTRACTIn this paper we present a catalogue of 11,745 brown dwarfs with spectral types rangingfrom L0 to T9, photometrically classified using data from the Dark Energy Survey(DES) year 3 release matched to the Vista Hemisphere Survey (VHS) DR3 and Wide-field Infrared Survey Explorer (WISE) data, covering ≈ 2, 400 deg2 up to iAB = 22. Theclassification method follows the same photo-type method previously applied to SDSS-UKIDSS-WISE data. The most significant difference comes from the use of DES datainstead of SDSS, which allow us to classify almost an order of magnitude more browndwarfs than any previous search and reaching distances beyond 400 parsecs for theearliest types. Next, we also present and validate the GalmodBD simulation, whichproduces brown dwarf number counts as a function of structural parameters withrealistic photometric properties of a given survey. We use this simulation to estimatethe completeness and purity of our photometric LT catalogue down to iAB = 22, as wellas to compare to the observed number of LT types. We put constraints on the thin diskscale height for the early L population to be around 450 parsecs, in agreement withprevious findings. For completeness, we also publish in a separate table a catalogueof 20,863 M dwarfs that passed our colour cut with spectral types greater than M6.Both the LT and the late M catalogues are found at https://des.ncsa.illinois.edu/releases/other/y3-mlt.
Key words: Catalogues, Surveys, brown dwarfs, infrared: stars, techniques: photo-metric
1 INTRODUCTION
Ultra-cool dwarfs are mostly sub-stellar objects (browndwarfs, BDs) with very cool (Teff < 2, 300 K) atmosphereswith spectral types later than M7, including the L, T andY sequences. Their spectra are typified by the effects ofclouds and deep molecular absorption bands. In L dwarfs(2, 200 & Teff & 1, 400 K) clouds block radiation from emerg-ing from deep in the atmosphere in the opacity windows be-
tween molecular absorption bands, narrowing the pressurerange of the observed photosphere, and redistributing fluxto longer wavelengths giving these objects red near-infraredcolours. The transition to the T sequence (LT transition,Teff ∼ 1, 200 − 1, 400 K) is driven by the disappearance ofclouds from the near-infrared photosphere, leading to rela-tively bluer colours. This is accompanied by the transitionfrom CO (L dwarfs) to CH4 (T dwarfs) dominated carbonchemistry. At cooler temperatures (Teff < 500 K), the devel-
© 2019 The Authors
DES L and T dwarfs sample 16

2 DES Collaboration
opment of the Y dwarf sequence is thought to be driven bythe emergence of clouds due to sulphide and chloride con-densates, as well as water ice (e.g. Leggett et al. 2013, 2015;Skemer et al. 2016).
BDs never achieve sufficient core temperatures to main-tain main-sequence hydrogen fusion. Instead, they evolvefrom relatively warm temperatures at young ages to evercooler temperatures with increasing age as they radiate theheat generated by their formation. As a result, the late-Mand early-L dwarf regime includes both young, high-mass,brown dwarfs and the lowest mass stars. The latter can takeseveral hundred million years to reach the main sequence.Objects with late-L, T and Y spectral types are exclusivelysubstellar. In this work, we focus on L and T dwarfs, andfor brevity refer to this group as BDs.
BDs have very low luminosity, especially the older orlower mass ones. Their mass function, star formation his-tory (SFH) and spatial distribution are still poorly con-strained, and the evolutionary models still lack details, es-pecially the lowest-masses and old ages. They are supportedat their cores by degenerate electron pressure and, becausethe degeneracy determines the core density (instead of theCoulomb repulsion), more massive BDs have smaller radii.BDs are actually partially-degenerate, in the sense thatwhile in their atmospheres reign thermal pressure, some-where in their interior there must be a transition from de-generate electron to thermal pressure.
The current census covers an age range from a few mil-lion years (Liu et al. 2013; Gagne et al. 2017) to > 10 Gyrhalo members (Burgasser et al. 2003; Zhang et al. 2017),and spans the entire mass interval between planetary andstellar masses. The diverse range of properties that theseobjects display reflects the continual luminosity and tem-perature evolution of these partially-degenerate objects. Asa numerous and very long-lived component of our Galaxy,these continually evolving objects could be used to inferstructural components of the Milky Way, and tracing thelow-mass extreme of star formation over cosmic timescales.However, studies of L dwarfs have typically been restrictedto the nearest 100 pc, while T dwarfs are only known todistances of a few tens of parsecs.
The era of digital wide-field imaging surveys has allowedthe study of brown dwarfs to blossom, with thousands nowknown in the solar neighbourhood. But this collection is het-erogeneous and very shallow and therefore, not suitable forlarge-scale statistical analysis of their properties. The newgeneration of deep and wide surveys (DES (Dark EnergySurvey Collaboration et al. 2016), VHS (McMahon et al.2013), UKIDDS (Lawrence et al. 2007), LSST (Abell et al.2009), HSC (Miyazaki et al. 2018)) offer the opportunity toplace the brown dwarf population in their Galactic context,echoing the transition that occurred for M dwarfs with theadvent of the Sloan Digital Sky Survey (SDSS; Bochanskiet al. 2007; West et al. 2011). These surveys should be ableto create homogeneous samples of BDs to sufficient distanceto be suitable for various applications, such as kinematicsstudies (Faherty et al. 2009, 2012; Schmidt et al. 2010; Smithet al. 2014), the frequency of binary systems in the LT pop-ulation (Burgasser et al. 2006a; Burgasser 2007; Luhman2012), benchmark systems (Pinfield et al. 2006; Burning-ham et al. 2013; Marocco et al. 2017), the search for rareor unusual objects (Burgasser et al. 2003; Folkes et al. 2007;
Looper et al. 2008; Skrzypek et al. 2016), and the studyof Galactic parameters (Ryan et al. 2005; Juric et al. 2008;Sorahana et al. 2018). In this latter case, we will also needsimulations to confront observed samples. Realistic simu-lations will benefit from improved spectral type-luminosityand spectral type-local density relations in the solar neigh-bourhood.
The UKIRT Infrared Deep Sky Survey (UKIDSS;Lawrence et al. 2007) imaged 4000 deg2 in the Y, J,H,K fil-ter passbands, and provided discovery images for over 200T dwarfs, making it one of the principal contributors to thecurrent sample of LT dwarfs, particularly at fainter mag-nitudes (e.g. Burningham et al. 2010; Burningham et al.2013; Burningham 2018). Experience gained through theexploitation of UKIDSS has demonstrated that significantamounts of 8m-class telescope time are required to spec-troscopically classify samples of 10s to 100s of LT dwarfswithin 100 pc. For example, total observation times of 40 -60 minutes were needed to obtain low-resolution spectra ofJ ∼ 18.5 targets at a signal-to-noise ratio (SNR) = 20, nec-essary for spectral classification (Burningham et al. 2013).Obtaining homogeneous samples to the full depth availablein the new generation of surveys is thus only feasible to-day through photometric classification. Such an approachwas demonstrated in Skrzypek et al. (2015) and Skrzypeket al. (2016), where they obtained a sample of more than1000 LT dwarfs, independent of spectroscopic follow-up, us-ing i, z,Y, J,H,Ks,W1,W2 from SDSS ∩UKIDDS ∩W ISE.
A summary of surveys that attempted to select BDscandidates photometrically can be found in Table 1. Weidentify two approaches: one based on a colour selection inoptical bands and another with colour selection in the near-infrared. In the first case, a common practice is to applya cut on (i − z). For example, Schmidt et al. (2010) applya cut at (i − z)SDSS > 1.4, while Chiu et al. (2006) cut at(i − z)SDSS > 2.2 to select T types. This latter cut would beinteresting to study the transition between L and T types,but not for a complete sample of L types. In any case, sincethe i, z bands in DES are not precisely the same as in SDSS,we expect changes in our nominal colour cuts.
When infrared bands are available, it is common tomake the selection on J band. For example, Skrzypeket al. (2016) apply a cut on Vega magnitudes (Y −J)UKIDSS,vega > 0.8, which, in our case, would translateinto (YAB − Jvega)UKIDSS > 1.4. Burningham et al. (2013)search for T types, applying a cut at zAB − JVega > 2.5.Again, the UKIDSS filters are not exactly the same as DESor VHS, so we expect these cuts to change when applied toour data.
In this paper, we follow the photo-type methodology ofSkrzypek et al. (2015) to find and classify L and T dwarfs inthe DES ∩ VHS ∩ AllW ISE system (The AllWISE programwas built by combining data from the WISE cryogenic andNEOWISE post cryogenic phases). We can go to greater dis-tances due to the increased depth in the DES optical bandsi, z in comparison with SDSS while maintaining high com-pleteness in the infrared bands, needed for a precise photo-metric classification. In fact, the optical bands can drive theselection of L dwarfs, as demonstrated here, improving uponprevious photometric BDs searches. In the case of T dwarfs,the infrared bands are the limiting ones, and therefore, our
MNRAS 000, 000–000 (2019)
DES L and T dwarfs sample 17

Brown dwarf census with DES Y3 3
Table 1. Summary of the major photometric brown dwarf census so far. In the third column we show the colour selection in its originalsystems, according to the surveys used (indicated in the first column). For comparison, we also show the selection used in this paper,
where we classify more than 10, 000 BDs up to zAB = 22.
Reference Area Selection Spectral Types Number
(Surveys) (deg2)
Chiu et al. (2006) 3,526 (i − z)AB > 2.2, LT 73
(SDSS) zAB < 20.4
Schmidt et al. (2010) 11,000 (i − z)AB > 1.4 L 484
(SDSS, 2MASS)
Albert et al. (2011) 780 (i − z)AB > 2.5 T 37
(CFHT)
Kirkpatrick et al. (2011) All sky T5: (W1 −W2)Vega > 1.5, (W2 −W3)Vega < 3. LT 103
(WISE) L: (W1 −W2)Vega > 0.
Lodieu et al. (2012) 675 (W1 −W2)Vega > 1.4, (J −W2)Vega > 1.9 T 13
(VHS, WISE)
Day-Jones et al. (2013) 500 JVega < 18.1 LT 63
(UKIDSS)
Burningham et al. (2013) 2,000 (zAB − JVega ) > 2.5, T 76
(UKIDSS) JVega < 18.8
Skrzypek et al. (2016) 3,070 (Y − J)Vega > 0.8, LT 1,361
(SDSS, UKIDSS, WISE) JVega < 17.5
Sorahana et al. (2018) 130 1 < (i − z)AB < 2.0, 0.75 < (z −Y)AB < 1.0, L 3,665
(HSC) zAB < 24
This paper (2019) 2,400 (i − z)AB > 1.2, (z −Y)AB > 0.15, (YAB − JVega ) > 1.6, LT 11,745
(DES, VHS, WISE) zAB < 22
sample will have a similar efficiency in that spectral regimein comparison with previous surveys.
The methodology is based on three steps: first a photo-metric selection in colour space (i− z), (z−Y ), (Y − J) is done;second, a spectral classification is performed by comparingobserved colours in i, z,Y, J,H,Ks,W1,W2 to a set of colourtemplates for various spectral types, ranging from M1 toT9. These templates are calibrated using a sample of spec-troscopically confirmed ultra-cool dwarfs (MLT). Finally, weremove possible extragalactic contamination with the use ofa galaxy template fitting code, in particular, we use Lephare
photo-z code1 (Arnouts et al. 1999; Ilbert et al. 2006).After completion of a homogeneous sample of LT
dwarfs, we proceed to measure the thin disk scale height(hz,thin). Unfortunately, current simulations present manyinconsistencies with observations and are not trustworthy.Therefore, we also introduce a new simulation which com-putes expected number counts of LT dwarfs and creates syn-thetic samples following the properties of a given survey. Wehave called it GalmodBD. Finally, we can compare the out-put of the simulation for different formation scenarios, tothe number of BDs found in the sample footprint, placingconstraints on hz,thin and other fundamental parameters.
In Section 2 we describe the data used in this paper(DES∩VHS∩AllW ISE) and how these samples were matchedand used through the analysis. In Section 3 we detail the
1 http://www.cfht.hawaii.edu/~arnouts/LEPHARE/lephare.
html
samples we have used to define our colour selection as well asto create the colour templates that will feed the classificationand the GalmodBD simulation.
In Section 4 we show the colour based target selectionscheme we have defined and how it compares with the pre-vious analysis, in particular to Skrzypek et al. (2015). InSection 5 we explain our classification methodology and howwe apply it to the DES data in Section 6. In Section 7 wedetail the public catalogue. In Sections 8 and 9 we introducethe GalmodBD simulation and how we tune it to our data inSection 10. In Section 11 we present results of running thesimulation. In Section 12 we use the GalmodBD to studythe completeness of our photometric selection and other sys-tematics applying to the number of BDs detected. Finally,in Section 13 we compare results from the GalmodBD simu-lation to our data, placing constraints on the thin disk scaleheight of L types.
Through the paper, we will use the photometric bandsi, z,Y from DES in AB magnitudes, J,H,Ks from VHS inVega and W1,W2 from AllWISE in Vega. The use of Vega orAB normalisation is not important since it is only a constantfactor when calculating colours.
2 THE DATA
In this section we present the three photometric data setsused in this analysis: the Dark Energy Survey (DES), with 5filters covering from 0.38 to 1 µm (from which we use i, z,Y),VHS, with 3 filters covering from 1.2 to 2.2 µm and AllWISE
MNRAS 000, 000–000 (2019)
DES L and T dwarfs sample 18

4 DES Collaboration
W1 and W2, at 3.4 and 4.6 µm. Finally, in Subsection 2.4 wedetail the catalogue matching process and quality cuts.
2.1 The Dark Energy Survey (DES)
DES is a wide-field optical survey in the g, r, i, z,Y bands,covering from 3800 A to ∼ 1 µm. The footprint was designedto avoid extinction contamination from the Milky Way asmuch as possible, therefore pointing mostly towards inter-mediate and high Galactic latitudes. The observational cam-paign ended on the 9th of January 2019. The final DES datacompromises 758 nights of observations over six years (from2013 to 2019).
In this paper we use DES year 3 (Y3) data, an aug-mented version of the Data Release 1 (The DR1; Dark En-ergy Survey Collaboration et al. 2018)2 which contains allthe observations from 2013 to 2016. DES DR1 covers thenominal 5,000 deg2 survey region. The median coadded cat-alogue depth for a 1.95′′ diameter aperture at S/N = 10is i ∼ 23.44, z ∼ 22.69, and Y ∼ 21.44. DR1 catalogue isbased on coaddition of multiple single epochs (Morgansonet al. 2018) using SExtractor (Bertin & Arnouts 1996).The DES Data Management (DESDM) system also com-putes morphological and photometric quantities using the“Single Object Fitting” pipeline (SOF), based on the ngmix3
code, which is a simplified version of the MOF pipeline asdescribed in (Drlica-Wagner et al. 2018). The SOF cataloguewas only calculated in g, r, i, z, but not in Y , therefore we useSExtractor Y measurement from DR1 data. All magnitudeshave been corrected by new zeropoint values produced bythe collaboration, improving over those currently publishedin the DR1 release.
Information about the mean wavelength of each pass-band and magnitude limit at 5σ (defined as the mode of themagnitude distribution, as cited above, for a catalogue withS/N > 5σ) is given in Table 2. In Fig. 1 we show the DESfootprint with coverage in i, z,Y . It has an area = 5019 deg2
and all coloured areas represent the DES footprint.To ensure high completeness in the i band and infrared
bands with sufficient quality, we impose a magnitude limitcut of z < 22 with a detection of 5σ at least in the z andY magnitudes. To avoid corrupted values due to image arte-facts or reduction problems, we also apply the following cuts:SEXTRACTOR_FLAGS_z,Y = 0: ensures no reduction problemsin the z and Y bands. IMAFLAGS_ISO_i,z,Y = 0: ensures theobject has not been affected by spurious events in the imagesin i, z,Y bands.
2.2 VISTA Hemisphere survey (VHS)
The VISTA Hemisphere Survey (VHS, McMahon et al.2013) is an infrared photometric survey aiming to observe18,000 deg2 in the southern hemisphere, with full over-lap with DES in two wavebands, J and Ks, to a depthJAB ∼ 21.2, Ks,AB ∼ 20.4 at 5σ for point sources (JVega ∼20.3, Ks,Vega ∼ 18.6, respectively) and partial coverage in Hband, with depth HAB ∼ 19.85 at 5σ (HVega ∼ 18.5). TheVHS uses the 4m VISTA telescope at ESO Cerro Paranal
2 https://des.ncsa.illinois.edu/releases/dr13 https://github.com/esheldon/ngmix
Observatory in Chile with the VIRCAM camera (Daltonet al. 2006). The data were downloaded by the DESDM sys-tem from the ESO Science Archive Facility (Cross et al.2012) and the VISTA Science Archive4.
The VHS DR3 covers 8,000 deg2 in J,Ks of observationsfrom the year 2009 to 2013, from which a smaller region over-laps with DES, as shown in brown in Fig. 1. The coveragearea in common with DES is 2374 deg2 for the J,Ks filters,whereas addition of the H band reduces this to 1331 deg2
(shown as light brown in Fig. 1).In this paper, we use only sources defined as primary in
the VHS data. We also impose 5σ detection in J; wheneverH,Ks are available, we use them for the spectral classification(see Section 5).
We use apermag3 as the standard VHS magnitude, inthe Vega system, defined as the magnitude for a fixed aper-ture of 2′′. In Table 2 we show the summary of the filters andmagnitude limits for VHS. VHS magnitude limits are in AB,even though we work in Vega throughout the paper. We usethe transformation given by the VHS collaboration 5: JAB =JVega+0.916, HAB = HVega+1.366, Ks,AB = Ks,Vega+1.827.
2.3 AllWISE
We also use AllWISE6 data, a full sky infrared survey in3.4, 4.6, 12, and 22 µm, corresponding to W1,W2,W3,W4,respectively. AllWISE data products are generated using theimaging data collected and processed as part of the originalWISE (Wright et al. 2010) and NEOWISE (Mainzer et al.2011) programs.
Because LT colours tend to saturate for longer wave-lengths, we will make use only of W1 and W2. The AllWISEcatalogue is >95% complete for sources with W1 < 17.1 andW2 < 15.7 (Vega).
In Table 2 we also show the properties of the All-WISE filters and magnitude limits. Magnitudes are givenin AB using the transformations given by the collaboration7: W1AB = W1Vega + 2.699, W2AB = W2Vega + 3.339.
Since our primary LT selection criteria do not use W1and W2 magnitudes, we do not demand the availability ofmagnitudes in these bands when selecting our candidatesample. In other words, if a source has no data from All-WISE, we still keep it and flag their W1 and W2 magnitudesas unavailable in the classification.
2.4 Combining DES, VHS and AllWISE data
We first match DES to VHS with a matching radius of 2′′,and with the resulting catalogue, we repeat the same processto match to the AllWISE catalogue, using DES coordinates.The astrometric offset between DES and VHS sources wasestimated in Banerji et al. (2015), giving a standard devia-tion of 0.18′′. For sources with significant proper motions,this matching radius may be too small. For instance, an
4 http://horus.roe.ac.uk/vsa/coverage-maps.html5 http://casu.ast.cam.ac.uk/surveys-projects/vista/
technical/filter-set6 http://wise2.ipac.caltech.edu/docs/release/allwise/7 http://wise2.ipac.caltech.edu/docs/release/allsky/
expsup/sec4_4h.html
MNRAS 000, 000–000 (2019)
DES L and T dwarfs sample 19

Brown dwarf census with DES Y3 5
010203040506070 330340350RA J2000
50
40
30
20100
+10
DE
C J2
000
Figure 1. The footprint of DES Y3 data considering the intersec-tion of i, z,Y bands. The effective area for this region is 5019 deg2.
In brown shaded regions, we show the overlap between DES and
VHS, covering 2, 374 deg2 with J, Ks and 1331 deg2 if the H bandis included (in light brown).
object at 10 pc distance, moving at 30 km/s in tangentialvelocity, has a proper motion of 0.6′′/yr. So, a matching ra-dius of 2′′ will work except for the very nearby (<= 6pc) orhigh-velocity (> 50km/s) cases, given a 2-year baseline dif-ference in the astrometry. In fact, high velocity nearby BDsare interesting, since they may be halo BDs going throughthe solar neighbourhood. A small percentage of BDs will bemissing from our catalogue due to this effect. In Section 12we quantify this effect.
We use the DES ∩ VHS ∩ AllW ISE sample (called tar-get sample) to find BDs. Matching the three catalogues andremoving sources that do not pass the DES quality cuts, wefind 42,046,583 sources. Applying the cut in signal-to-noise(SNR) greater than 5σ in z,Y, J and selecting sources withz < 22, we find 27,249,118 sources in our 2, 374 deg2 foot-print.
We do not account for interstellar reddening. Our tar-get sample is concentrated in the solar neighbourhood andtherefore, applying any known extinction maps, like Schlegelet al. (1998) or Schlafly & Finkbeiner (2011) maps, we wouldoverestimate the reddening.
3 CALIBRATION SAMPLES
In this section, we present and characterise the calibrationsamples used to define our colour selection (Section 4) and tocreate the photometric templates (see Section 3.4) that willbe used during the spectral classification step (Section 5)and to feed the GalmodBD simulation (Section 8). Quasarsare only used as a reference in the first stage, while the Mdwarfs and BDs are used both to select the colour space andto create the colour templates that will be used during theanalysis.
The calibration samples are: J. Gagne’s compilation ofbrown dwarfs, M dwarf sample from SDSS and spectroscop-ically confirmed quasars from DES. It is important to notethat all of them have spectroscopic confirmation.
Each calibration sample has been matched to the targetsample. In all cases, we again use a matching radius of 2′′to DES coordinates.
Table 2. Information about the photometric passbands fromDES Y3, VHS DR3 and AllWISE. Columns are the survey
acronym, the filter name, the effective wavelength and the mag-
nitude limit at 5σ in AB.
Survey Filter λc m5σ(µm) (AB)
DES i 0.775 23.75
DES z 0.925 23.05
DES Y 1.0 20.75
VHS J 1.25 21.2
VHS H 1.65 19.85
VHS Ks 2.15 20.4
AllWISE W1 3.4 19.80
AllWISE W2 4.6 19.04
3.1 Gagne’s sample of brown dwarfs
The Gagne compilation 8 contains a list of most of the spec-troscopically confirmed BDs up to 2014, covering spectraltypes from late M to LT dwarfs. It consists of 1772 sources,covering most parts of the sky to distances less than 100 pc.The spectral classification in this sample is given by its op-tical classification anchored to the standard L dwarf schemeof Kirkpatrick et al. (1999) or by its near-infrared classifi-cation anchored to the scheme for T dwarfs from Burgasseret al. (2006b). Some of the brown dwarfs present in thissample have both classifications. In most cases, both esti-mations agree, but for a few of them (≈ 10%), there is adiscrepancy of more than one spectral types, which can beconsidered as due to peculiarities. In these cases, we adoptedthe optical classification. We tested the effect of using oneor another value in the creation of the templates and founddiscrepancies of . 3%.
From the initial list of 1772 BDs, we removed objectsthat are considered peculiar (in colour space) or that arepart of a double system, categories given in the Gagne com-pilation and also sources with spectral type M, yielding aremaining list of 1629 BDs. From this list, 233 are presentin the DES footprint, but when we match at 2′′ betweenthe DES and Gagne sample, we only recover 150 of these.For the remaining 83 that are not matched within 2′′, we vi-sually inspected the DES images to find their counterpartsbeyond the 2′′ radius, recovering in this process 58 addi-tional LT types to the DES sample. Therefore, our sampletotals 208 known LT dwarfs, while 25 are not found dueto partial coverage of the footprint or due to high propermotions.
Repeating the same procedure but for VHS: in the en-tire VHS footprint (not only in the DES ∩VHS region), butwe find 163 LT dwarfs at 2′′ radius. Here we did not repeatthe process of manually recovering missing objects. In theDES ∩ VHS region, we end with 104 confirmed LT dwarfs,
8 https://jgagneastro.wordpress.com/
list-of-ultracool-dwarfs/
MNRAS 000, 000–000 (2019)
DES L and T dwarfs sample 20

6 DES Collaboration
L0 L5 T0 T5 T9Spectral type
100
101
102
Cou
nts
All DES VHS DES VHS
Figure 2. The distribution of known BDs in the Gagne sample
for different overlaps. The original sample contains 1,629 BDs,208 of which are found in the DES Y3 data, 163 in the VHS DR3
data and 104 in the DES ∩VHS data, after removal of M types
and young L types.
from 139 in the DES ∩VHS common footprint. The missingsources are due to the same effects of partial coverage orhigh proper motions.
During our analysis, we found that BDs tagged as“young” in the Gagne sample were biasing the empiricalcolour templates used for classification (see details in Sec-tion 5.1). BDs are tagged as “young” in the Gagne samplewhenever they are found as members of a Young MovingGroup (YMG) or are otherwise suspected of having agesless than a few 100 Myrs. Young BDs are typically found toexhibit redder photometric colours in the near-infrared dueto the effects of low-gravity and/or different cloud proper-ties (e.g. Faherty et al. 2016). We, therefore, removed thosefrom the calibration sample.
As a result, our final LT calibration sample contains 208sources in the Y3 DES sample, 104 in the DES∩VHS region,163 in VHS DR3 alone and 128 with VHS∩ AllW ISE. Theseare the final samples we use to calibrate the empirical colourtemplates for BDs, depending on the colour to parameter-ize (For example, for (J − H) we use the VHS sample with163 sources, whereas for (i − z) and (z − Y ), we use the DESsample with 208 sources). These templates will also feed theGalmodBD simulation for the LT population (Section 8).
In Fig. 2 we show the number of BDs as a function ofthe spectral type in the Gagne sample, matched to differentphotometric data. At this point, we assume that the colourtemplates we will obtain from these samples are representa-tive of the whole brown dwarf population. Later, in section 4,we will compare the target sample to the calibration sampleand confirm that this approximation is valid.
3.2 M dwarfs
The sample of M dwarfs comes from a spectroscopic cata-logue of 70,841 visually inspected M dwarfs from the seventhdata release of the SDSS (West et al. 2011), confined to theStripe82 region. After matching with the target sample at a2′′ radius, we end up with 3,849 spectroscopically confirmedM dwarfs with spectroscopic classification, from M0 to M9.
We use this sample to create templates for our classificationschema, with particular care for the transition from M9 toL0. These templates will also feed the GalmodBD simulationfor the M population (Section 8).
3.3 Quasars
Quasars have been traditionally a source of contaminantsin brown dwarf searches since they are point-like, and athigh redshift, they can be very red, especially in infraredsearches using WISE or 2MASS data, for instance. On theother hand, this degeneracy can be broken with the use ofoptical information, as shown in Reed et al. (2015) andReed et al. (2017). We use two samples of confirmed quasarsin DES, one from Tie et al. (2017) up to z=4 and the onefrom Reed et al. (2017) with z > 6. In principle, quasarsfollow a different colour locus (as seen in Reed et al. (2017))but some contamination might remain after the colour cuts,and we will treat them as a source of extragalactic contam-ination in Section 6.1.
3.4 Colour templates
To define our colour selection, to classify BDs and to producerealistic colours in the simulation, we create colour templatesas a function of the spectral type in (i − z)AB, (z − Y )AB,(YAB − JVega), (J −H)Vega, (H −Ks)Vega, (Ks −W1)Vega and(W1 −W2)Vega.
Since M dwarfs are much more abundant than BDsin our samples, we adopt different approaches to build thecolour templates, depending on the available number of cali-brating sources. For M and L0 dwarfs, where we have enoughstatistics, we take the mean value for each spectral type asthe template value, selecting sources with SNR > 5σ only.Beyond L0, since we do not have enough statistics for allspectral types, we follow a different approach: we fit thecolour versus spectral type distribution locally in each spec-tral type using both first order and second order polyno-mials. For instance, for L7 we fit the colour distributionbetween L3 and T3, and with the given first and secondorder polynomials, we interpolate the result for L7. Finally,the colour value for the given spectral type is taken as theaverage of the two polynomial fits.
The empirical templates can be seen in Fig. 3. The tem-plate values are listed in Table 3. We found several degenera-cies in colour space. For example, in (H−Ks), one cannot dis-tinguish spectral types between early-L and late-L/early-Tbecause their colours are the same, or in (W1−W2), where wecannot discriminate between mid-M stars and early-mid/L-dwarfs for the same reason. Since several colours exhibitdegeneracies in their colour-spectral type relationships, itis important to have multiple colours to establish a goodspectral type calibration and therefore the need for a com-bination of optical and infrared data.
In terms of the dispersion about the templates, it in-creases with spectral type, with some exceptions. For ex-ample, in (W1 − W2) the dispersion for M types is largerthan for some LT types. In the T regime, in general, thedispersion due to variations in metallicity, surface gravityor cloud cover, among other effects, can be of the same or-der or bigger than the dispersion introduced by differences
MNRAS 000, 000–000 (2019)
DES L and T dwarfs sample 21

Brown dwarf census with DES Y3 7
M5 L0 L5 T0 T5Spectral Type
0
1
2
3
4
5
(iz)
AB
TemplateGagne LTsM dwarfs
M5 L0 L5 T0 T5Spectral Type
0.0
0.5
1.0
1.5
2.0
2.5
(zY)
AB
TemplateGagne LTsM dwarfs
M5 L0 L5 T0 T5Spectral Type
1.0
1.5
2.0
2.5
3.0
(YAB
J Veg
a)
TemplateGagne LTsM dwarfs
M5 L0 L5 T0 T5Spectral Type
0.75
0.50
0.25
0.00
0.25
0.50
0.75
1.00(J
H) V
ega
TemplateGagne LTsM dwarfs
M5 L0 L5 T0 T5Spectral Type
0.6
0.4
0.2
0.0
0.2
0.4
0.6
0.8
1.0
(HK s
) Veg
a
TemplateGagne LTsM dwarfs
M5 L0 L5 T0 T5Spectral Type
0.5
0.0
0.5
1.0
1.5
2.0
(Ks
W1)
Vega
TemplateGagne LTsM dwarfs
M5 L0 L5 T0 T5Spectral Type
1
0
1
2
3
4
(W1
W2)
Vega
TemplateGagne LTsM dwarfs
M5 L0 L5 T0 T5Spectral Type
1
0
1
2
3
4
5
Tem
plat
e co
lour
i-zz-YY-JJ-HH-KsKs-W1W1-W2
Figure 3. Colours as a function of the spectral type in the MLT spectral regime. M dwarfs are shown in olive, in blue, green and yellow
are BDs with their colour given by their spectral type, as seen in Fig 4. These templates are used during the classification and to feed
the GalmodBD simulations. In the last panel, we compare all the templates together. Since several colours exhibit degeneracies in their
colour-spectral type relationships, it is essential to have multiple colours to establish a good spectral type calibration.
MNRAS 000, 000–000 (2019)
DES L and T dwarfs sample 22

8 DES Collaboration
in signal-to-noise. Possible peculiar objects will be identifiedwith high χ2 when compared to the empirical templates.
In the last panel of Fig. 3, we compare all the templatestogether. From here, we find that (i−z) colour has the largestvariation through the ML range, demonstrating the impor-tance of the optical filters to separate M dwarfs from LTdwarfs. (W1 −W2) is very sensitive to T types (as expectedby design), and (Y − J) is also important for the ML transi-tion. The other bands will add little to the M/L transition,but they will help on L/T transition. Similar findings werealready presented in Skrzypek et al. (2015).
4 MLT COLOUR SELECTION
In this section we explain the steps to select our initial listof LT candidates from the target sample. In Fig. 4, we showthe colour-colour diagrams of known BDs, M dwarfs andquasars. Clearly, some of these colour-colour diagrams aremore efficient to disentangle LT dwarfs from other pointsources than others. Furthermore, at z ∼ 22, we are stillmostly complete in the i band, although not necessarily forlate T types. Therefore we do not demand detection in iband, but we still impose a minimum (i − z) colour as aselection criterion, very efficient to remove quasars from oursample, as attested by Fig. 4.
The nominal cut at zAB = 22 is set to ensure that thecombination DES∩VHS takes full advantage of both surveys,something that was not possible earlier due to the brightermagnitude limits imposed by SDSS. At zAB = 22, we are lim-ited at JVega ∼ 19.7. This corresponds to zAB− JVega ∼ 2.30,which is the colour of an L0 according to the templates pre-sented in Table 3. This is brighter by at least 0.7 magnitudesthan the 5σ limit on VHS. In other words, we will be ableto reach zAB = 22.7 in upcoming DES updates and still re-main complete in optical and VHS bands for the LT types.The magnitude limits on VHS bands are also deeper thanits predecessors. For example, UKIDSS has a global depthlimit of JVega ∼ 19.6 (Warren et al. 2007), while VHS hasJVega ∼ 20.3.
We define the colour space where BDs are found to re-side. We initially aim at high completeness in color space,at the expense of allowing for some contamination by Mdwarfs and extragalactic sources. Purity is later improvedat the classification stage (Section 5).
The entire selection process can be summarized in 7stages as detailed below and listed in Table 4:
(i) Quality cuts on DES and matching to VHS (explainedin Section 2). We end up with 42,046,583 sources after ap-plying a matching within 2′′ between the DES and the VHS,and selecting sources with SEXTRACTOR_FLAGS_z,Y = 0 andIMAFLAGS_ISO_i,z,Y = 0.
(ii) Magnitude limit cut in z < 22 and signal-to-noisegreater than 5σ in z,Y, J. We end up with 28,259,901 sources.
(iii) We first apply a cut in the optical bands (i − z), re-moving most quasar contamination while maintaining thosesources for which i band has no detection. We decided toapply a cut of (i − z) > 1.2. In comparison with previoussurveys, as seen in Table 1, this is a more relaxed cut, ini-tially focusing on high completeness in our sample at theexpense of purity. This cut eliminates more than 99.8% ofthe catalogue, leaving us with a sample of 65,041 candidates.
(iv) We apply a second selection to the target sample inthe space (z−Y ) vs. (Y−J). From Fig. 4, we decided the cut tobe: (z−Y ) > 0.15 , (Y−J) > 1.6 avoiding the z > 6 QSO colourlocus. The surviving number of sources is 35,548. This cut isactually very similar to the cut proposed in Skrzypek et al.(2016). They imposed Y − J > 0.8 (Vega). Transforming ourY band to Vega, our equivalent cut would be Y − J > 0.7.
(v) Finally, we apply the footprint mask. In this pro-cess, we end up with 35,426 candidates. This is the samplethat goes into classification. Extragalactic contamination istreated after running the classification.
(vi) Apply the photo-type method (Skrzypek et al. 2015)to estimate the spectral type in the MLT range for all thetargets. We call this method classif (see Section 5). Afterremoval of the M types, we ended with 12,797 LT types.
(vii) Removal of extragalactic contamination (see Sec-tion 6.1). We end up with the final sample of 11,745 LTtypes from which 11,545 are L types, and 200 are T types.There is also extragalactic contamination in the M regime,as explained in the next section.
5 SPECTRAL CLASSIFICATION
In this section we explain the method to assign spectral typesto our candidate list and evaluate its uncertainties basedon the calibration samples. We implement the same clas-sification method presented in Skrzypek et al. (2015) andSkrzypek et al. (2016), based on a minimization of the χ2
relative to the MLT empirical templates. Our method usesthe templates created in Section 3.4. We refer to our classi-fication code as classif.
As mentioned earlier, we impose a 5σ detection in z,Y, J.For the rest of the bands, we require a 3σ detection. If themagnitude error exceeds this limit, we consider the source asnot observed in the given band. However, there is one excep-tion, the W1 magnitude, which is cut at 5σ in the AllWISEcatalogue.
Let a set of Nbands observed for the j-th candidate tobe mji , i=1,Nbands and their photometric uncertaintiesbe σm j i , i=1,Nbands. Let also a set of colour templatesbe ci,k , i=1,Nbands, k=1,Nmod, which give the magnitudedifference between band b and the reference band z. Hencecz,k = 0 by construction. Let’s consider the template intrinsicdispersion to be σci,k , i=1,Nbands, k=1,Nmod, which wefix for all bands and templates to σc = 0.07, as also done bySkrzypek et al. (2016). The total error for band b, for the
j-th candidate will be σbj =√σ2m jb+ σ2
c .
The first step in the classification process for the j-thcandidate is, for each of the k-th spectral type (Nmod), calcu-late the inverse variance weighted estimate of the referencemagnitude (in our case z) as:
mj,z,k =
∑Nbands
b=1m jb−cbk
σ2b j∑Nbands
b=11σ2
b j
(1)
MNRAS 000, 000–000 (2019)
DES L and T dwarfs sample 23

Brown dwarf census with DES Y3 9
Table 3. Template values as a function of the spectral type in the MLT regime. These are the best-fit values shown in Fig. 3 and thatare later used in the classification and to feed the GalmodBD simulation.
Spectral Type Colour
(i − z)AB (z −Y)AB (YAB − JVega ) (J − H)Vega (H − Ks )Vega (Ks −W1)Vega (W1 −W2)Vega
M1 0.35 0.04 1.23 0.58 0.20 0.12 0.05
M2 0.43 0.06 1.25 0.56 0.22 0.12 0.09M3 0.50 0.07 1.28 0.54 0.24 0.14 0.13
M4 0.58 0.11 1.31 0.53 0.26 0.18 0.15M5 0.67 0.12 1.36 0.52 0.27 0.17 0.17
M6 0.83 0.16 1.43 0.51 0.31 0.20 0.18
M7 1.02 0.22 1.52 0.53 0.34 0.21 0.21M8 1.27 0.30 1.65 0.54 0.39 0.24 0.21
M9 1.36 0.34 1.72 0.58 0.42 0.26 0.22
L0 1.48 0.43 1.83 0.60 0.48 0.35 0.25
L1 1.47 0.45 1.98 0.64 0.51 0.40 0.24
L2 1.53 0.49 2.09 0.69 0.54 0.47 0.25L3 1.63 0.53 2.19 0.73 0.56 0.54 0.26
L4 1.73 0.57 2.27 0.78 0.59 0.62 0.30
L5 1.87 0.60 2.30 0.82 0.60 0.66 0.34
L6 1.96 0.62 2.31 0.84 0.62 0.69 0.36
L7 2.07 0.63 2.32 0.87 0.64 0.72 0.40
L8 2.18 0.65 2.30 0.85 0.62 0.73 0.46
L9 2.35 0.66 2.30 0.78 0.55 0.69 0.52
T0 2.51 0.67 2.30 0.74 0.50 0.68 0.59
T1 2.71 0.72 2.32 0.60 0.36 0.64 0.75
T2 2.88 0.76 2.34 0.45 0.26 0.61 0.92
T3 3.02 0.84 2.40 0.27 0.18 0.59 1.13
T4 3.16 0.92 2.43 0.11 0.10 0.56 1.35
T5 3.25 1.02 2.48 -0.07 0.07 0.54 1.62
T6 3.35 1.13 2.53 -0.24 0.05 0.53 1.90
T7 3.40 1.25 2.57 -0.40 0.10 0.52 2.21
T8 3.41 1.37 2.61 -0.55 0.20 0.52 2.51
T9 3.39 1.50 2.64 -0.68 0.32 0.53 2.83
Table 4. Steps used in this paper to classify LT sources in DES ∩VHS ∩WISE. First, quality cuts are applied to the data to remove
spurious targets. Next, a magnitude limit is imposed in the z band and finally, colour cuts are applied to select only the reddest objects.
These are the sources that enter the classification. Finally, extragalactic contamination is removed.
Step Description Percentage Number
Removed Remaining
0 DES Y3 sample (DR1) 399,263,026
1 Matching 2 arcseconds to VHS
FLAGS_z,Y=0
IMAFLAGS_ISO_i,z,Y=0 89.5% 42,046,583
2 z < 22SNR z,Y, J > 5σ 33% 28,259,901
3 (i − z)AB > 1.2 99.8% 65,041
4 (z −Y)AB > 0.15YAB − JVega > 1.6 45% 35,548
5 Footprint masking 0.3% 35,426
6 LT Classification 64% 12,797
7 Remove extragalactic contamination 8% 11,745
MNRAS 000, 000–000 (2019)
DES L and T dwarfs sample 24

10 DES Collaboration
1 2 3 4 5(i z)AB
0.5
0.0
0.5
1.0
1.5
2.0
(zY)
AB
TemplateGagne LTsM dwarfs
QSOs z<4QSOs z>6.
0.5 0.0 0.5 1.0 1.5 2.0(z Y)AB
1.2
1.4
1.6
1.8
2.0
2.2
2.4
2.6
2.8
3.0
(YAB
J Veg
a)
TemplateGagne LTsM dwarfs
QSOs z<4QSOs z>6.
1.2 1.4 1.6 1.8 2.0 2.2 2.4 2.6 2.8 3.0(YAB JVega)
1.0
0.5
0.0
0.5
1.0
1.5
2.0
(JH
) Veg
a
TemplateGagne LTsM dwarfs
QSOs z<4QSOs z>6.
1.0 0.5 0.0 0.5 1.0 1.5 2.0(J H)Vega
0.5
0.0
0.5
1.0
1.5
2.0
(HK s
) Veg
a
TemplateGagne LTsM dwarfs
QSOs z<4QSOs z>6.
0.5 0.0 0.5 1.0 1.5 2.0(H Ks)Vega
0.5
1.0
1.5
2.0
2.5
3.0
(Ks
W1)
Vega
TemplateGagne LTsM dwarfs
QSOs z<4QSOs z>6.
0.5 1.0 1.5 2.0 2.5 3.0(Ks W1)Vega
1
0
1
2
3
(W1
W2)
Vega
TemplateGagne LTsM dwarfs
QSOs z<4QSOs z>6.
L0
L5
T0
T5
L0
L5
T0
T5
L0
L5
T0
T5
L0
L5
T0
T5
L0
L5
T0
T5
L0
L5
T0
T5
Figure 4. Colour-colour diagrams for spectroscopically confirmed BDs, M dwarfs and quasars that are found in the target sample. Each
panel corresponds to a specific colour-colour space. In all panels, M dwarfs are shown as olive circles. Quasars as black circles for z < 4and as empty red circles for z > 6, whereas LT dwarfs are shown as filled circles with their colour a function of the spectral type, as
depicted in the colour bar on the right. The colour templates that were empirically derived (see Section 3.4) are shown by the brown
line. The colour cuts applied to the sample before classification are depicted by the blue lines in the first two panels.
Next, the above value is used to calculate the χ2 valuefor the k-th spectral type, for each j-th candidate:
χ2(mj , σbj , mz,k, k) =Nbands∑b=1
(mjb − mz,k − cb,kσbj
)2
(2)
Finally, we assign the spectral type that gives the min-imum χ2 value.
5.1 Classification performance on known samples
In this section we apply classif to our list of known BDs andM dwarfs to assess how well the method works. We run thecode on the Gagne list of 104 known BDs (including youngBDs) and in the West list of known M dwarfs. Results aresummarized in Fig. 5, where we show the photometric spec-tral type versus the spectroscopic classification, separatelyfor M (left) and LT types (right). In these figures, the dia-
MNRAS 000, 000–000 (2019)
DES L and T dwarfs sample 25

Brown dwarf census with DES Y3 11
mond points are those where the difference between the truespectral type and the photometric estimation is greater orequal to 4 (∆t >= 4). There are 8 sources with ∆t >= 4, fromwhich 6 of them are young L types.
We estimate the accuracy of the method using:
σclassi f =
∑Ncandidates
j=1 |∆t |Ncandidates
√2Ncandidates
2(3)
Dividing in M types (from West sample), L and T types(Gagne sample), we get σM = 0.69 (for M with spectral typeM7 or higher), σL = 1.47 and σT = 1.12 and a global σLT =1.37. If we now estimate the errors but without the youngL types, the metrics improve to σL = 1.03 and σT = 1.12and a global σLT = 1.06, a precision compatible to what wasfound in Skrzypek et al. (2016). Nonetheless, it is obviousfrom Fig. 5 that it is much more appropriate to use a 3σvalue for how well one establish a photometric spectral typefor these low-mass objects, thereby implying that the bestone can do in estimating photometric spectral types is ±2for M types and ±3 for LT-dwarfs.
Another test we perform is to estimate the spectraltypes for those LT candidates in the overlapping samplewith Skrzypek et al. (2016), consisting of 74 sources. We runclassif on these 74 sources and compare both photometricestimators. In general, we find an excellent agreement withσclassi f ,skrzypek = 0.38. In Fig. 6 we show the comparisonbetween the two methods.
6 CLASSIFICATION OF THE TARGETSAMPLE
After confirming that our method reliably classifies MLTspectral types, we run classif on the target sample presentedin Section 4, a sample of 35,426 candidates. A visual inspec-tion of the candidates demonstrates that all are real sources.The main caveat in our methodology might be residual con-tamination by extragalactic sources. We next explain ourstar-galaxy separation method.
6.1 Extragalactic contamination
To remove possible extragalactic contamination, we runLephare photo-z code on the whole candidate list us-ing galaxy and quasar templates spanning various red-shifts, spectral types and internal extinction coefficients (theLephare configuration used is presented in Appendix A). Forthose candidates where the best-fit is χ2
lephare< χ2
classi f,
we assign them a galaxy or quasar class and are no longerconsidered MLT types. This method also has the potentialto identify interesting extragalactic targets.
It is worth noting that running Lephare onto the Gagnesample, we can recover most known LT types. Only onebrown dwarf in the Gagne sample is assigned a galaxyclass, which is already known to be a very peculiar L7 typecalled ULAS J222711-004547 (Marocco et al. 2014). It hasa χ2
classi f> 630, while the rest of the 103 BDs have a
χ2classi f
< 130. Also, the classification is robust concerning
changes in the galaxy libraries used in the Lephare config-uration: we tested various choices of galaxy templates, and
the number of extragalactic contaminants remained constantwithin errors.
6.2 Results
After running classif and Lephare on the target sample,we obtain 32,608 sources classified as MLT types. Fromthese, 20,863 are M types, 11,545 are L types and are 200T types. Our catalogue also includes 2,818 candidates clas-sified as galaxies or quasars. A preliminary discussion aboutthe properties of the extragalactic sources is given in Ap-pendix B. In Section 7 we show an example of the data pub-lished in electronic format and its explanation. It consists ofa table with all the 11,745 candidates in the target samplewith LT spectral type including the photometry used andthe classif results.
Sources with a number of bands available for classifica-tion (NBANDS) less than 5 (3 or 4) are generally assigned toextragalactic spectral types; likewise those have the best-fitMLT template as M types. By visually inspecting the spec-tral energy distribution of sources with NBANDS < 5, com-pared to the best-fit templates of MLT types, galaxies andquasars, we conclude that the classification is ambiguous andshould be taken with caution when NBANDS < 5. From thecatalogue of 35,426 targets, 6% have NBANDS < 5. If we con-sider only those with spectral type L, the percentage goesdown to 3.7% (469 targets), i.e., 3.7% of the L types haveNBANDS < 5, from which 96% (449 targets) are assigned toa galaxy template instead of to an L type. This effect con-tributes to the uncertainty associated with the removal ofextragalactic contamination.
At this point, we compare the colour distribution as afunction of the spectral type for the target sample with re-spect to the empirical templates of Section 3.4. We assumedthat the templates were representative of the LT population.In Fig. 7 we can see the comparison. Our modelling repro-duces the target sample colour distribution. Only in the lateT regime, we find some discrepancies. This effect is due toboth the lack of statistics when we calculated the empiricaltemplates in this regime, and to the intrinsic dispersion incolours in the T regime.
6.3 Photometric properties of the LT population
We analyse the properties of the 11,745 LT types found inthe target sample. The distribution of spectral types can befound in Fig. 8 in logarithmic scale. In Fig. 9 we show thedistribution of bands available for classification.
The χ2classi f
of the fits are generally very good, in agree-
ment with the theoretical curve for the same degrees of free-dom. In our model we have two free parameters, the bright-ness of the source and the spectral type, therefore the de-grees of freedom are Nbands−2. The χ2
classi fdistribution can
be found in Fig. 10. The theoretical curve is a summationover the χ2 curves for degrees of freedom 1, 2, 3, 4, 5 (corre-sponding to Nbands = 3, 4, 5, 6, 7, 8 respectively, where eachcurve was multiplied by the percentage of total sources with
each number of bands. The reduced χ2 defined asχ2
(d.o. f ) is
close to one, with a mean value ofχ2
(d.o. f ) = 1.3 and a median
value med( χ2
(d.o. f ) ) = 0.95.
MNRAS 000, 000–000 (2019)
DES L and T dwarfs sample 26

12 DES Collaboration
M1 M3 M5 M7 M9Spectral type
M1
M3
M5
M7
M9
Cla
ssif
type
color cut
West sample of known M dwarfs
t > = 4
L0 L3 L6 L9 T2 T5 T8Spectral type
L0
L3
L6
L9
T2
T5
T8
Cla
ssif
type
Gagne sample of known Brown Dwarfs
Young L
Figure 5. Classification performance for M dwarfs (left) and LT types (right). In both panels, sources with a misclassification higher
or equal 4 are shown as diamond symbols. Red dashed lines indicate the limits where the difference between the spectroscopic and
photometric classification is equal to 4. On the right panel, we also tag young L types, which were not used to build the templates
but are shown here to illustrate their peculiar nature, with a classification that is always higher than 2. The classification have a mean
uncertainty of σM = 0.69 (for M dwarfs passing the colour cuts) and σL = 1.03 and σT = 1.12 for the LT sample without the young L
types. For visualization purposes we have applied small random shifts smaller than ∆t emplate ± 0.1 to the true spectral types (only in
the x-axis).
L0 L3 L6 L9 T2 T5Skrzypek 2016 photo type
L0
L3
L6
L9
T2
T5
Cla
ssif
type
Skrzypek overlapping sample
Figure 6. Comparison between the photometric classification of
Skrzypek et al. (2016) and classif for 74 common LT candidatesfound in the footprint. We find an excellent agreement between
both estimates with a mean dispersion of σclassi f = 0.38. For vi-
sualization purposes we have applied small random shifts smaller
than ∆t emplate ± 0.1 to the Skrzypek et al. (2016) types (only in
the x-axis).
In our analysis, we tag BDs as peculiar (in terms ofcolours) if their χ2
classi fis beyond 99.7% of the probability,
which in a z-score analysis means having a χ2classi f
> 3σ off
the median. In our case, we set the cut-off at 3.5σ instead toaccommodate the natural dispersion of LT types. Since theχ2classi f
distribution is not normal we define σ based on the
median absolute deviation (MAD) instead of the standarddeviation, and since the distribution is non-symmetrical, weapply a double MAD strategy. Since T types have intrinsi-cally more colour dispersion than L types, we treat them sep-
arately. Applying the double MAD algorithm to the χ2classi f
distribution of L and T types, for a cut-off = 3.5σ, we endup with 461 L types labeled as peculiar (≈ 4%) and 6 T typestagged as peculiar (≈ 3.5%). These limits are equivalent tosay that L types are peculiar whenever their χ2
classi f> 20.
and that T types are peculiar whenever their χ2classi f
> 46.5.
Peculiar sources can be identified in the catalogue readingthe PECULIAR column as explained in Section 7.
6.3.1 Photometric distances
We estimate photometric distances using the distance mod-ulus:
d(T ype)[i] = 10 ∗ 10(mz [i]−Mz (Type))/5 (4)
Absolute magnitudes have been anchored to M W1 andM W2 from Dupuy & Liu (2012) as explained in Section 8.1.We compare two estimates for the distance: one where we useall available bands from the i, z,Y, J,H,Ks,W1,W2 set, andthen we average over the bands to give a mean value, and theother where we use band z only. The distance distributioncan be found in Fig. 11 for the averaged value. In Fig. 12we show the difference between the averaged value and thez band estimate. In general, both definitions agree. In thepublished catalogue both estimates are given with namesDISTANCE_AVG and DISTANCE_Z.
7 ELECTRONIC CATALOGUE
This is the largest photometric LT catalogue publishedto date, containing 11,745 sources. We also publish theM dwarf catalog in a separate table containing 20,863sources. Table 5 shows a sample of the LT catalogue,
MNRAS 000, 000–000 (2019)
DES L and T dwarfs sample 27

Brown dwarf census with DES Y3 13
L0 L3 L6 L9 T2 T5 T8Spectral Type
1.5
2.0
2.5
3.0
3.5
4.0
4.5
(iz)
AB
TemplatesY3 locus
L0 L3 L6 L9 T2 T5 T8Spectral Type
0.2
0.4
0.6
0.8
1.0
1.2
1.4
1.6
1.8
(zY)
AB
TemplatesY3 locus
L0 L3 L6 L9 T2 T5 T8Spectral Type
1.6
1.8
2.0
2.2
2.4
2.6
2.8
3.0
(YAB
J Veg
a)
TemplatesY3 locus
L0 L3 L6 L9 T2 T5 T8Spectral Type
0.75
0.50
0.25
0.00
0.25
0.50
0.75
1.00
(JH
) Veg
aTemplatesY3 locus
L0 L3 L6 L9 T2 T5 T8Spectral Type
0.4
0.2
0.0
0.2
0.4
0.6
0.8
(HK s
) Veg
a
TemplatesY3 locus
L0 L3 L6 L9 T2 T5 T8Spectral Type
0.2
0.0
0.2
0.4
0.6
0.8
1.0
1.2
1.4
1.6
(Ks
W1)
Vega
TemplatesY3 locus
L0 L3 L6 L9 T2 T5 T8Spectral Type
0.0
0.5
1.0
1.5
2.0
2.5
3.0
(W1
W2)
Vega
TemplatesY3 locus
Figure 7. Comparison between the colour templates and the locus of the LT candidates. Blue points show the mean and standard
deviation colour for candidates with the given spectral type. In brown, the empirical templates used. The agreement is good throughall the spectral space, with deviations appearing in the late T type regime, where the calibration sample is very sparse, confirming the
initial assumption that the calibration sample is representative of the whole LT population.
MNRAS 000, 000–000 (2019)
DES L and T dwarfs sample 28

14 DES Collaboration
L0 L3 L6 L9 T2 T5 T8Classif type
101
102
103
104
Cou
nts
LT Candidates
Figure 8. The distribution of spectral types for the LT candi-
dates. We classify 20,863 sources as M dwarfs (from M7 to M9,not shown here), 11,545 as L types (from L0 to L9) and 200 as T
types (from T0 to T9).
3 4 5 6 7 8Number of bands used in classif
0
500
1000
1500
2000
2500
3000
3500
Cou
nts
LT Candidates
Figure 9. The number of bands (Nbands) used during the clas-
sification. This information is used to assign weights when we
calculate the theoretical χ2 distribution in Fig. 10.
which can be accessed at https://des.ncsa.illinois.
edu/releases/other/y3-mlt. The number of LT typesfound in the target sample is subject to completeness andpurity effects (see Section 12).
Spectral type is given by SPT_PHOT with the followingconvention: L types are assigned SPT_PHOT from 10 to 19,corresponding to L0 to L9, and from 20 to 29 for the T types,corresponding with T0 to T9. In the M dwarf catalogue, Mtypes are assigned SPT_PHOT from 6 to 9. We also give theχ2 of the classification and the number of bands used withcolumns XI2_CLASSIF and NBANDS. Distances are providedwith 2 estimates, one based on band z only (DISTANCE_Z)and another based on the average of the distances calculatedin all the available bands (DISTANCE_AVG). We also tag if thesource is peculiar based on a z-score analysis of its χ2, wherePECULIAR=1 is peculiar and PECULIAR=0 is not. Distancesand the peculiar tag are only present in the LT catalogue.The LT and the M Catalogues also include i, z,Y magnitudesfrom DES, J,H,Ks from VHS and W1,W2 from AllWISEas used in the classification. DES magnitudes are corrected
0 5 10 15 20 25 302 classif
0.000
0.025
0.050
0.075
0.100
0.125
0.150
Den
sity
LT Candidates
Expected 2
Figure 10. χ2 distribution for the LT candidates, together withthe theoretical expectation. In order to calculate this curve, we
add, proportional to the numbers in Fig. 9, the degrees of freedom.
Our distribution follows the expected curve, therefore our errorsreflect the dispersion of the model. The reduced χ2 defined as
χ2
(d .o . f ) is close to one, with a mean value ofχ2
(d .o . f ) = 1.3 and a
median value med( χ2
(d .o . f ) ) = 0.95.
L0 L5 T0 T5 T9Spectral type
0
100
200
300
400
500
Aver
age
dist
ance
[pc
]
LT Candidates
Figure 11. Distances as a function of spectral type. Distances
have been calculated using the average value from the distance
modulus obtained using all available bands. The colour scale rep-
resents the density. Most LT candidates are early L types at dis-
tances smaller than 500 parsecs.
with updated zeropoints different from those present in thepublic DR1 release (Dark Energy Survey Collaboration et al.2018) and they will be published in the future.
We matched the M and LT catalogues with Gaia DR2release (Gaia Collaboration et al. 2018), but the amountof matches was very low in the LT catalogue. Only 282matches were found (2.4%). In the M catalogue, we found1,141 matches (5.4%), but these spectral types are not thescope of this paper.
MNRAS 000, 000–000 (2019)
DES L and T dwarfs sample 29

Brown dwarf census with DES Y3 15
L0 L5 T0 T5 T9Spectral type
40
20
0
20
40
60
Aver
age
- ban
d z
dist
ance
[pc]
LT Candidates
Figure 12. Difference between the two distance estimators. Inone where we only use z band and another where the average
value over all available bands is used. The colour scale representsthe density.
MNRAS 000, 000–000 (2019)
DES L and T dwarfs sample 30

Table 5. Example of the LT catalogue published, distances and peculiar flag are only present in the LT catalogue. SPT PHOT is the spectral type, NBANDS the number of bandsused in classification and XI2 CLASSIF the χ2 for the best-fit in classif. DISTANCE AVG is the average distance calculated from apparent magnitudes in all the available bands (in
parsecs) and DISTANCE Z the distance calculated from the apparent magnitude in DES z band (in parsecs). HPIX 512 is the Healpix pixel ID for order = Nest and nside = 512 andPECULIAR is a category given if it has a χ2 > 3.5σ median absolute deviations (1 = peculiar, 0 = no peculiar).
COADD OBJECT ID RA DEC SPT PHOT NBANDS XI2 CLASSIF DISTANCE AVG DISTANCE Z HPIX 512 PECULIAR
293254901 16.568 -52.537 8 5 4.326 419.848 406.993 2240708 0302513036 18.383 -51.732 10 5 5.944 277.501 270.822 2240815 0
232352550 23.216 -63.690 8 5 3.974 380.790 370.102 2142795 0237139089 313.501 -60.505 8 5 1.837 582.501 555.256 2935140 0204133552 322.767 -53.430 9 5 4.503 491.583 495.687 2939932 0
71547410 330.937 -57.231 10 7 3.993 308.368 306.911 2915933 0185491825 315.506 -53.252 9 5 1.530 393.643 398.255 2945055 093231446 33.147 -51.827 8 7 0.971 262.541 259.220 2244895 0
Table 5 – continued DES magnitudes are in AB. i, z are PSF magnitudes from “SOF” while Y band is from “Sextractor”. VHS magnitudes are in Vega and are aperture magnitudes at2 arcseconds.
PSF MAG I PSF MAGERR I PSF MAG Z PSF MAGERR Z AUTO MAG Y AUTO MAGERR Y JAPERMAG3 JAPERMAG3ERR
21.971 0.029 20.735 0.016 20.580 0.088 18.937 0.039
22.571 0.041 20.937 0.022 20.394 0.068 18.722 0.03721.738 0.028 20.529 0.014 20.292 0.088 18.588 0.050
22.800 0.055 21.410 0.040 21.156 0.159 19.466 0.086
22.893 0.051 21.603 0.031 21.389 0.172 19.693 0.10822.736 0.043 21.209 0.027 20.882 0.088 18.803 0.055
22.488 0.033 21.128 0.018 20.768 0.089 18.949 0.05521.069 0.013 19.756 0.007 19.467 0.029 17.857 0.031
Table 5 – continued VHS magnitudes are in Vega and are aperture magnitudes at 2 arcseconds. WISE magnitudes are in Vega and are magnitudes measured with profile-fittingphotometry. For more details visit https://des.ncsa.illinois.edu/releases/other/y3-mlt.
HAPERMAG3 HAPERMAG3ERR KSAPERMAG3 KSAPERMAG3ERR W1MPRO W1SIGMPRO W2MPRO W2SIGMPRO
-9999. -9999. 17.921 0.105 -9999. -9999. -9999. -9999.-9999. -9999. 17.773 0.108 -9999. -9999. -9999. -9999.
-9999. -9999. 17.937 0.156 -9999. -9999. -9999. -9999.-9999. -9999. 18.868 0.329 -9999. -9999. -9999. -9999.-9999. -9999. 18.266 0.178 -9999. -9999. -9999. -9999.18.309 0.078 17.860 0.106 17.604 0.175 17.292 -9999.-9999. -9999. 18.098 0.157 -9999. -9999. -9999. -9999.-9999. -9999. 16.835 0.060 16.702 0.071 16.476 0.189
DES L and T dwarfs sample 31

Brown dwarf census with DES Y3 17
8 MODELING THE NUMBER COUNTS OF LTDWARFS
This section describes the effort to create robust expectednumber counts of LT dwarfs. The algorithm is calledGalmodBD. It is a Python code that computes expectedgalactic counts of LT dwarfs, both as a function of magni-tude, colour and direction on the sky, using the fundamen-tal equation of stellar statistics. It was adapted from thecode used by Santiago et al. (1996) and Kerber et al. (2001)to model HST star number counts, and by Santiago et al.(2010) for a preliminary forecast of DES star counts. In thecurrent analysis, we kept the density laws for the differentGalactic components, and simply replaced the specific lumi-nosity functions of normal stars by the BD number densitiesas a function of the spectral type presented in Subsection 8.1.
GalmodBD also creates synthetic samples of LT dwarfsbased on the expected number counts for a given foot-print. Besides a model for the spatial distribution of BDs,GalmodBD uses empirically determined space densities ofobjects, plus absolute magnitudes and colours as a functionof spectral type. The model is described in Subsection 8.1.The point generating process is described in Subsection 9.The validation tests are provided in Appendix C.
8.1 GalmodBD
For convenience, we will refer to the space density versusspectral type relation as the luminosity function (LF), whichis somewhat of a misnomer, since luminosity does not scaleuniquely with spectral type in the LT regime. We refer to thecolours versus spectral type relations as C-T relation. Thecode requires several choices of structural parameters forthe Galaxy, such as the density law and local normalisationof each Galactic component. Equally crucial are parametersthat govern the region of the sky and magnitude and colourranges where the expected counts will be computed.
These parameters are listed in different configurationfiles. Currently, only one choice of LF is available, takenfrom Table 8 of Marocco et al. (2015). More specifically, fortypes earlier than L4, we use Cruz et al. (2007) space densityvalues; from L4 to T5 we use those of Marocco et al. (2015)themselves, and for later types than T5 we use Burninghamet al. (2013).
For the C-T relations, we first build absolute magni-tude vs. spectral type relations for AllWISE data. M W1,and M W2 versus type relations are taken from Figures 25,26 and Table 14 of Dupuy & Liu (2012). Once we anchorabsolute magnitudes in these bands, we use the C-T re-lations found in Section 3 in Table 3, Fig. 3 to populateM i,M z,M Y,M J,M H,M Ks.
The expected number counts are computed by directapplication of the fundamental equation of stellar statistics.In summary, given a choice of apparent magnitude rangein some filter, and some direction in the sky (pointer), wego through distance steps and for each of them, find therange of LT spectral types whose absolute magnitudes fitinto the chosen apparent magnitude range. We then computethe volume element in the selected direction and distanceand multiply it by the appropriate LF value.
The final number count as a function of apparent mag-nitude is the sum of these contributions for all appropri-
ate combinations of spectral types (through their associatedabsolute magnitudes) and distances. Because we also havecolour versus type relations, we can also perform the sameintegral over distance and type range to compute numbercounts as a function of colour.
GalmodBD incorporates extinction and dereddened us-ing the Schlegel et al. (1998, SFD98) dust maps, althoughit can also use (Burstein & Heiles 1982) maps. Conversionfrom A V and E(B-V) to SDSS A i, A z and E(i-z) are basedon An et al. (2008). Nonetheless, in this first application ofthe code, we have not included any reddening effect sinceour sample is concentrated in the solar neighborhood.
The code currently permits many choices of magnitudesand colours for number counts modeling, including coloursin SDSS and DES in the optical, VHS and 2MASS in thenear-infrared and AllWISE in the infrared.
In Appendix C we validate the GalmodBD simulationcomparing its predictions with a prediction based on a singledisk component analytical count.
9 SYNTHETIC CATALOGUES
Besides determining expected N(m) and N(col) for BDswithin some magnitude range and over some chosen areaon the sky, the code also generates synthetic samples basedon these number counts. This is done for every chosen direc-tion, distance and type (absolute magnitude) by randomlyassigning an absolute magnitude within the range allowedby the spectral type bin, and then converting it to appar-ent magnitude. We use the same random variable to assignabsolute magnitudes within each bin for all filters, in or-der to keep the synthetic objects along the stellar locus incolour-colour space.
For a complete description, we also need to assign ran-dom magnitude errors to mimic an observed sample, whichwill depend on the particular case. Therefore, error curvesas a function of magnitude for each filter are required. Insubsection 10.2 we detail this step for our sample. By de-fault, GalmodBD accepts an exponential error distribution.In case of more sophisticated models, the error must be in-troduced afterward.
For synthetic dwarfs, the code outputs its Galactic com-ponent, spectral type, Galactic coordinates (l,b) of the cen-tre of the pointer, distance and magnitudes in the set of fil-ters, for example: iDES , iSDSS , zDES , zSDSS , YDES , JVHS ,J2MASS , HVHS , H2MASS , Ks,VHS , Ks,2MASS , W1 and W2.Both the true and observed magnitudes, as well as their er-rors, are output, regardless of the chosen pair (mag, colour)used in the output expected model counts. This latter choice,coupled with the apparent magnitude range and the direc-tion chosen, however, affects the total number of points gen-erated.
In order to have a synthetic sample with coordinates,we randomly assign positions to the sources within the givenpointer area (see Section 10.1).
These simple synthetic catalogues can be compared to areal catalogue of BD candidates by correcting the expectednumbers for the visibility mask, that accounts for cataloguedepth and detection variations, and for estimates of purityand completeness levels of the observed catalogue.
MNRAS 000, 000–000 (2019)
DES L and T dwarfs sample 32

18 DES Collaboration
10 GALMODBD IN THE TARGET SAMPLE
In this section we detail the input information used to feedthe GalmodBD simulation that reproduces the DES∩VHS∩AllW ISE data. Besides the empirical colour template rela-tions, we need to define the footprint of the simulation andthe photometric error model to produce realistic MLT cat-alogues.
10.1 Footprint and pointers definition
To create a sample that resembles the target sample, wecreate a grid of pointers following the DES tile distribution.
DES coadd data are divided into square (in sphericalcoordinates) regions of equal area, covering 0.534 deg2 each,called tiles. We use this information to define our pointerscovering the area occupied in Fig. 1. The pointers defined torun GalmodBD have the same coordinates as the centre ofthe DES tiles and the same area of 0.534 deg2. Later, tilesare intersected with the VHS footprint in the DES area,covering the brown areas in the same figure. Eventually, weend with 5187 pointers of 0.534 deg2, covering 2, 374 deg2.
After running the simulation in each pointer, we assignrandom positions within the area of the pointer to each ob-ject in the simulated catalogue. At this point we would needto consider the effect of incompleteness in the footprint, i.e.,apply the footprint mask.
To study the effect the mask might have in the numberof BDs recovered by our method, for each GalmodBD run,we create multiple synthetic position catalogues and passthe data through the footprint mask. Eventually, obtaininga statistic of the mean and standard deviation (std) of thenumber of MLT sources that we will lose. In our case we run500 realizations for each GalmodBD model to calculate theeffect on footprint completeness in Section 12.
10.2 Mimic DES photometric properties
Another ingredient in the GalmodBD simulation is the pho-tometric errors that apply to the simulated data to createan observed synthetic sample.
To model the signal-to-noise distribution we start byselecting a random sample of the DES∩VHS∩AllW ISE data,limited to z < 23 and selecting point sources only using theextended classification from DES Y3 data. We next applythe following algorithm for each band:
First, we divide the sample in magnitude bins ofwidth=0.1. For each bin, we estimate the probability den-sity function of the magnitude error using a kernel densityestimation (KDE).
With the KDE information for each thin magnitude bin,we can assign a magnitude error for a given magnitude witha dispersion that follows the KDE. Once an error is assignedto a source, we estimate apparent magnitudes assuming aGaussian distribution centred in the true apparent magni-tude and with a standard deviation equals to their magni-tude error.
We extract the KDE for magnitude bins where we havemore than 60 objects. In the extreme cases of very brightor very faint objects in the magnitude distribution, this re-quirement is not met. Therefore we expand the distributionalong the bright end by repeating the KDE from the brightest
bin with enough statistics. In the faint end, we fit the meanand sigma of the faintest 4 bins with enough statistics bya second-order polynomial and extrapolate this fit towardsfainter magnitudes.
In Fig. 13 we summarize the error modeling for thebands of interest: i, z,Y and J. In the Figures, we comparethe error distribution as a function of magnitude for the realdata, individually for each band, with the simulated data.The median and dispersion agree very well for all bands.
11 GALMODBD RESULTS
In Table 6 we show the result of running GalmodBD for dif-ferent galactic models varying the thin disk scale height athz,thin = 250, 300, 350, 400, 450, 500, 550 pc and the local thick-to-thin disk density normalisation nsun,thick = 5, 10, 15, 20%defined as nsun,thick = ρthick (R)/ρthin(R). After sometesting, it was clear the LT number counts were most sen-sitive to these two parameters. We ran the simulation forM dwarfs ranging M0 to M9 and BDs from L0 to T9 (eventhough the scale height of LT types does not need to be thesame as for M types).
We run GalmodBD up to a true apparent magnitudelimit of ztrue < 25. Next, we assign errors and observedmagnitudes as explained in Section 10.2. Later, we selectMLT with zobs <= 22 and (SNR) > 5σ in z,Y, J to build oursimulated MLT parent catalogues. Using these catalogues,we can study the completeness and purity of our sample(see Section 12).
In Table 6, the third column is the number of M typesfor a given model that pass the colour cuts defined in Sec-tion 4 and zobs < 22 and (SNR) > 5σ in z,Y, J. The fourthcolumn is the number of LT types when zobs < 22 and(SNR) > 5σ in z,Y, J. We have not applied here the colourcut, since it is a source of incompleteness and we treat ittogether with other effects in Section 12.
12 PURITY AND COMPLETENESS
In this section we detail the various sources of error in themeasurement of the number counts of LT dwarfs from thetarget sample. We will use a combination of both the cali-bration samples and the GalmodBD simulation. There aretwo issues to consider: one is to identify and quantify con-tamination and incompleteness effects on our sample, so wecan correct the simulated numbers in order to compare themto the data. The other is assessing the uncertainty associ-ated with these corrections and the expected fluctuations inthe corrected number counts. The effects we consider are:
– Colour-colour incompleteness: how many LT we lose byapplying the colour cut to select candidates.
– Loss of targets from the catalogue due to proper mo-tions.
– Footprint effects: how many LT we lose due to maskingeffect.
– Loss of LTs due to misclassification.– Contamination of targets due to unresolved binary sys-
tems in our magnitude-limited catalogue.– Contamination by M dwarfs and extragalactic sources.
MNRAS 000, 000–000 (2019)
DES L and T dwarfs sample 33

Brown dwarf census with DES Y3 19
17.83 19.00 20.17 21.33 22.50 23.67SOF PSF MAG i
0.00
0.03
0.05
0.08
0.10
0.13
0.15
0.18
0.20
SOF
PSF
MAG
ER
RO
R i
DES-VHS dataSimulation data
17.75 18.75 19.75 20.75 21.75 22.75SOF PSF MAG z
0.00
0.03
0.05
0.08
0.10
0.13
0.15
0.18
0.20
SOF
PSF
MAG
ER
RO
R z
DES-VHS dataSimulation data
17.83 19.00 20.17 21.33 22.50 23.67AUTO MAG Y
0.00
0.20
0.40
0.60
0.80
1.00
AUTO
MAG
ER
RO
R Y
DES-VHS dataSimulation data
15.83 17.00 18.17 19.33 20.50 21.67APER3 MAG J
0.00
0.10
0.20
0.30
0.40
0.50
APE
R3
MAG
ER
RO
R J
DES-VHS dataSimulation data
Figure 13. Box-plot comparing the magnitude uncertainties as a function of magnitude for DES i, z,Y and VHS J data, versus the
modeled distribution in GalmodBD simulation. In red, the DES ∩VHS distribution, in blue, the simulated distribution. The horizontal
line within the box indicates the median, boundaries of the box indicate the 25th- and 75th-percentile, and the whiskers indicate the
highest and lowest values of the distribution. The median and dispersion agree very well for all bands.
12.1 Incompleteness
To assess how many BDs we miss due to the colour-colourselection, we look at the number of LT types that do notenter our colour selection both in the Gagne sample as wellas in the GalmodBD simulation. The colour range selectedwas chosen to minimize incompleteness. But peculiar early Ldwarfs may eventually be found outside our colour range. Inthe Gagne sample, from the list of 104 known BDs (includ-ing young types), 2 are left outside the colour range (2%).In GalmodBD, we haven’t modeled peculiar BDs and there-fore, the incompleteness level should be low. Applying thecolour cut to the GalmodBD outputs, as expected, led toa mean completeness of 98.8%. We define the colour-colourcompleteness correction to be the average of the two. Theuncertainty associated with this correction should be low.Conservatively, we define the uncertainty to be of 1%, lead-ing to Ccolour = 98.4 ± 1.%.
In order to estimate the number of missing sources dueto proper motions, we will assume that the mean propermotion of LT types decreases with distance. Considering aconservative 3-year difference in astrometry between DESand VHS, a 2′′ matching radius should be complete for dis-tances > 50 pc. In fact, looking at the BDs that we recovervisually beyond the 2′′ radius in Section 3.1 and that have
distances in the Gagne sample, more than 95% of the miss-ing BDs have a distance < 50 pc. So we can set this as anupper limit for this effect. Above 50 pc, we match at 2′′almost all of the BDs presented in the calibration sample.Likewise, we do match some of the BDs below 50 pc, at least20% of them.
In summary, matching the Gagne sample to DES within2′′ we recover 20% of the BDs below 50 pc and 100% abovethat distance. This is a conservative limit, but it gives us asense of the percentage loose by proper motions. Note thatwe have not considered here that we might miss some ofthe targets due to the incompleteness of the footprint so the20% should be higher.
If we now look at the GalmodBD simulation, we predictthe number of LT types with distances < 50 pc to be 2% ofthe whole sample. Considering an 80% completeness and anerror in the determination comparable to the effect itself, itresults in a proper motion completeness correction of Cpm =
98.4 ± 2%.
In terms of footprint incompleteness, we apply the al-gorithm presented in Section 10.1 to estimate the effect ofthe footprint mask: we produce 500 realizations of eachGalmodBD model and estimate the mean and std of LTtype number counts that survive the masking process. We
MNRAS 000, 000–000 (2019)
DES L and T dwarfs sample 34

20 DES Collaboration
Table 6. Number of BDs as a function of MW structural parameters in GalmodBD. hz, thin is the thin disk scale height in parsecs,nsun, thick is the local thick-to-thin disk density normalisation in percentage. The third column is the number of M types after the
magnitude limit cut, the signal-to-noise cut and the colour cut. The fourth column is the number of LT types applying only the
magnitude limit cut and the signal-to-noise cut and the fifth column is the number of early L types defined as those with spectral typesless than L4. This last column will be compared with the number of BDs detected in our sample to give a first estimate of the thin disk
scale height for early L types.
hz, thin nsun, thick M types LT types Early L types
pc % [snr > 5σ + z < 22 + colour cut] [snr > 5σ + z < 22] (L0, L1, L2, L3)
250 5 11,609 8,403 7,427250 10 12,869 9,094 8,055
250 15 14,121 9,742 8,663
250 20 15,428 10,475 9,333
300 5 13,782 9,426 8,381
300 10 15,113 10,086 8,992300 15 16,366 10,821 9,663
300 20 17,652 11,427 10,211
350 5 15,768 10,197 9,118
350 10 17,018 10,887 9,758
350 15 18,173 11,507 10,336
350 20 19,599 12,151 10,929
400 5 17,329 10,891 9,798
400 10 18,611 11,590 10,454
400 15 19,968 12,313 11,079
400 20 21,345 12,958 11,684
450 5 18,831 11,463 10,343
450 10 20,015 12,022 10,873
450 15 21,486 12,774 11,575
450 20 22,653 13,384 12,115
500 5 20,231 11,891 10,764
500 10 21,425 12,589 11,409
500 15 22,732 13,255 12,028
500 20 24,086 14,100 12,785
550 5 21,217 12,297 11,152
550 10 22,551 13,038 11,811
550 15 23,859 13,763 12,501
550 20 25,121 14,359 13,033
then average over all models to obtain a model-independentcompleteness correction of Cf oot = 93.6 ± 3.5%.
Finally, there is the effect of misclassification of LTtypes as M types. We estimated the incompleteness of LTtypes due to misclassification as Cclassi f = 85 ± 1%. In thenext subsection, we describe this correction along with thecorresponding contamination effect, namely the misclassifi-cation of M dwarfs as LT types.
12.2 Contamination
Our LT dwarfs catalogue is limited to z ≤ 22. Unresolvedbinary systems containing two LT dwarfs will have a higherflux than a single object and hence will make into the cat-alogue even though each member of the system individu-ally would not. This boosts the total number of LTs in oursample. We estimate the effect of unresolved binarism sys-tems as follows. According to Luhman (2012) (and referencestherein), the fraction of binaries decreases with the mass ofthe primary, while the mass ratio (q = m1/m2) tends to unity(equal-mass binaries). In our case, we are only interestedin those binaries where the primary is an LT. Binary sys-
tems with the LT as secundary, will have a small mass ratio(q << 1), and therefore, they will be uncommon. Also, wecannot census this type of population since the light fromthe primary will dominate the light from secondary. Luh-man (2012) quotes different estimates the fraction of bina-ries where the primary is an LT, fbin. Observational datasuggest fbin ' 7%, but may be prone to incompleteness, es-pecially for close pairs. Theoretical models of brown dwarfformation predict fbin in the 20% − 30% range (Maxted &Jeffries 2005; Basri & Reiners 2006). Nonetheless, a recentestimate by Fontanive et al. (2018) would confirm the em-pirical trend of Luhman (2012) and therefore we here adoptfbin = 0.07. If we assume that q ∼ 1 in all cases, we will ob-tain binary systems that have the same spectral type as theprimary, but with a magnitude that is 0.75 times brighter(since the system flux is twice that of the primary). To es-timate the contamination by binaries in the target sample,we follow the description of Burningham et al. (2010). Ac-
MNRAS 000, 000–000 (2019)
DES L and T dwarfs sample 35

Brown dwarf census with DES Y3 21
cording to equation 3 in that paper, the correction factoris:
Pbinary =γ − 1
γ + 1/ fbin − 1(5)
where γ = 2√
2 for equal mass/luminosity binaries, andfbin = 0.07. Finally, we get Pbinary = 111 ± 1%.
There are two additional sources of contaminants ap-plied here: one is the migration of M dwarfs that have beenwrongly assigned as LT type after running classif, and theother is the contamination by extragalactic sources.
Ideally, in order to estimate the contamination by Mdwarfs and the incompleteness of LT types due to the pho-tometric classification, we should run classif on the outputof GalmodBD. Unfortunately, our classification code is fedwith the same templates used in the simulation and, there-fore, the classification uncertainty we get by running classifin GalmodBD is unrealistically low. In order to estimatethe number of M dwarfs that are classified as LT types andvice versa, we perturb the true spectral types for GalmodBDsources following a normal distribution with dispersion givenin Section 5.1: σM = 0.69, σL = 1.03 and σT = 1.12 and meanvalue centred in the true spectral type.
Once we perturb the true spectral types to get a pseudo-photometric calibration in GalmodBD, we can estimate howmany LTs will be classified as M, and vice versa. We es-timate this number for all the GalmodBD realizations andfind that ∼ 11% of M dwarfs (after the colour cut) are givenLT type. This corresponds to contamination by about 14-19% of the corresponding LT simulated sample. This meansa mean LT purity level of Pclass = 83 ± 2%. We also usethe same procedure applied on the GalmodBD data to as-sess the number of LT types migrating to M type. This is anadditional incompleteness of Cclass = 85 ± 1%, to be addedto those from the previous subsection.
The removal of extragalactic contaminants is anothersource of uncertainty. We saw in Section 6 that . 10% ofthe MLT sample have galaxy or quasar class. These are notmodeled in GalmodBD, and therefore we do not need toapply a correction due to extragalactic contamination, al-though there will always be uncertainty associated with it.Based on tests with different Lephare SED libraries and theambiguity in classification for sources with NBANDS < 5, weestimate a standard deviation associated with the removalof extragalactic sources of σSG ∼ 5.%.
12.3 Completeness and purity summary
Summarizing all these effects, we estimate the completenessand contamination up to z < 22 at 5σ as:
– Completeness due to the colour-colour cut of Ccolour =
98.4 ± 1.%.– Completeness due to proper motions of Cpm = 98.4±2%.– Completeness due to masking of Cf oot = 93.6 ± 3.5%.– Completeness due to LT misclassified as M types of
Cclass = 85 ± 1%.– Contamination due to unresolved binary systems mea-
sured as the fraction fbin = 7% of sources: Kbin = 11 ± 1%.– Contamination of the LT sample due to M types clas-
sified as LTs: Kclass = 17 ± 2%.
– Uncertainty in the extragalactic contamination removalalgorithm introduces an additional systematic error ofσextra = 5.%.
Combining all these effects, we define a correction fac-tor:
CPLT =Ccolour ∗ Cpm ∗ Cf oot ∗ Cclass
(1 − Kbin) ∗ (1 − Kclass)(6)
that multiplies the LT sample. This correction factoraccounts for the effect of incompleteness and purity, and ap-plies to our definition with z < 22 and 5σ in z,Y, J. Differentmagnitude limits would lead to different corrections. In thiscase, the final correction factor is CLT = 1.05. This factoris applied to the number of detected LT N(LT)obs = 11, 745to get an estimate of the total number of LT in the foot-print up to z < 22 with at least a 5σ detection in z,Y, J asN(LT)true = N(LT)obs ∗CLT . At first approximation, the un-certainty in the number of LT types is the square root of thesum of the squares of the individual errors listed above:
σLT =√σ2col+ σ2
pm + σ2bin+ σ2
f oot+ σ2
cl,C+ σ2
cl,P+ σ2
ex (7)
with σLT ∼ 7%. Finally, the number of LT’s to com-pare against the different SFH scenarios is in round num-bers N(LT) ∼ 12, 300 ± 900. If we only select the early Ltypes (L0, L1, L2 and L3) for which we want to estimatethe thin disk scale height, the number to compare with be-comes N(L0,1,2,3) ∼ 11, 500 ± 800.
13 THE THIN DISK SCALE HEIGHT
Juric et al. (2008) estimate the thin disk scale height andthe local thick-to-thin disk density normalisation of SDSS Mdwarfs up to a distance of 2 kpc. They found hz,thin = 300 pcand nsun,thick = 12%.
As a first application of the brown dwarf catalogue andGalmodBD, we compare the number of observed LT typeswith different realizations of GalmodBD to shed light on thethin disk scale height of the LT population. Since T types areless than 2% of the sample and go only up to 100 pc, in prac-tice, we are estimating the scale height of the early L types.A previous attempt to measure the thin disk scale heightof L types can be found in Ryan et al. (2005), where theyestimate a value of hz,thin = 350± 50 using only 28 LT typesand on a very simplistic Galactic model. Since our model ismore detailed and we have a much higher statistic, we be-lieve that our results will be more reliable. More recently,Sorahana et al. (2018) have used data from the first datarelease from the Hyper Suprime Camera (HSC, Miyazakiet al. 2018; Aihara et al. 2018) to estimate the vertical thindisk scale height of early L types with an estimate between320 pc and 520 pc at 90% confidence.
Comparing the value of N(LT) ∼ 12000 ± 900 with thegrid of GalmodBD (Table 6), we do find a higher scale heightthan that of M dwarfs, as Ryan et al. (2005) found, of theorder of hz,thin ∼ 450pc. Nonetheless, there is a degeneracybetween the thin disk scale height and nsun,thick and there-fore we cannot yet rule out a models with hz,thin = 300 pc:
MNRAS 000, 000–000 (2019)
DES L and T dwarfs sample 36

22 DES Collaboration
0 100 200 300 400 500Distance (pc)
0
2000
4000
6000
8000
10000
12000
Cum
ulat
ive
num
ber
of L
T
hz=400 pchz=300 pchz=500 pcEarly L types
Figure 14. Comparison of the number counts of early L types
(L0, L1, L2 and L3) with three models of the thin disk scaleheight. In Grey we show models with a scale height similar to that
for M dwarfs (Juric et al. 2008) with hz = 300 pc, in dashed blue,
models with hz = 400 pc and in red, models with hz = 500 pc. For
each model we show two estimates, one where nsun, thick = 5%(lower limit) and another where nsun, thick = 20% (upper limit).
considering the error in the number counts σLT ∼ 900, thereare models of hz,thin = 300 pc which predicts a numberof LT types within 1σ of our measurement. In Fig. 14 wecompare the number counts to various models taken fromGalmodBD. In Grey we show two models for hz,thin = 300 pc,one with nsun,thick = 5% (lower limit) and another withnsun,thick = 20% (upper limit). In dashed blue we show mod-els for hz,thin = 400 pc, for same values of nsun,thick and inred points we show models for hz,thin = 500 pc.
In order to constraint the thin disk scale height, we willperform a Markov chain Monte Carlo analysis which willmarginalize over nsun,thick . This will be the scope of a futureanalysis. We will wait until the full coverage of DES andVHS have been achieved, covering ∼ 5000deg2. Here we willapply the same methodology presented here, for magnitudesz < 22.7, increasing both the area and the distance of thesurveyed sample.
14 CONCLUSION
In this paper, we apply a photometric brown dwarf classi-fication scheme based on Skrzypek et al. (2015) to DES ∩VHS ∩ AllW ISE data using 8 bands covering a wavelengthrange between 0.7 µm and 4.6 µm. Since several degeneraciesare found in colour space between spectral types M,L andT, the use of multiple bands are required for a good spectraltype calibration.
In comparison with Skrzypek et al. (2015), we can goto greater distances in the L regime due to the deeper DESand VHS samples, in contrast with the SDSS ∩UKIDSS de-sign. This way, we classify 11,745 BDs in the spectral regimefrom L0 to T9 in ≈ 2, 400 deg2, with a similar spectral res-olution of 1 spectral type. We make this catalogue publicin electronic format. It can be downloaded from https://
des.ncsa.illinois.edu/releases/other/y3-mlt. This isthe largest LT sample ever published. We further estimatethe purity and completeness of the sample. We estimate the
sample to be ∼ 77% complete and ∼ 74% pure at zAB < 22.Finally, we can calculate the total number of LTs in theDES ∩ VHS footprint to be ∼ 12, 300 ± 900.
During the classification, we identify 2,818 possible ex-tragalactic sources that we removed from the catalogue, con-taining 57 quasars at high redshift. The removal of extra-galactic sources increases the uncertainty in the determina-tion of the number of LT types.
In parallel, we have presented the GalmodBD simula-tion, a simulation that computes LT number counts as afunction of SFH parameters. In our analysis, we found thatthe thin disk scale height and the thin-to-thick disk nor-malisation were the parameters that most affect the num-ber counts. Nonetheless, more free parameters are availablein the simulation. When comparing the simulation outputwith the number of LT expected in the footprint, we putconstraints on the thin disk scale height for early L-types,finding a value that is in agreement with recent measure-ments, like the one found in Sorahana et al. (2018) withhz ∼ 400 pc.
Having these two ingredients, a robust simulation ofnumber counts, and a methodology to select BDs in DES ∩VHS∩ AllW ISE will allow us to do a precise measurement ofthe thin disk scale height of the L population, putting browndwarf science in its Galactic context. This will be the scopeof future analyses.
ACKNOWLEDGMENTS
Funding for the DES Projects has been provided by the U.S.Department of Energy, the U.S. National Science Founda-tion, the Ministry of Science and Education of Spain, the Sci-ence and Technology Facilities Council of the United King-dom, the Higher Education Funding Council for England,the National Center for Supercomputing Applications at theUniversity of Illinois at Urbana-Champaign, the Kavli Insti-tute of Cosmological Physics at the University of Chicago,the Center for Cosmology and Astro-Particle Physics atthe Ohio State University, the Mitchell Institute for Fun-damental Physics and Astronomy at Texas A&M Univer-sity, Financiadora de Estudos e Projetos, Fundacao CarlosChagas Filho de Amparo a Pesquisa do Estado do Rio deJaneiro, Conselho Nacional de Desenvolvimento Cientıfico eTecnologico and the Ministerio da Ciencia, Tecnologia e In-ovacao, the Deutsche Forschungsgemeinschaft and the Col-laborating Institutions in the Dark Energy Survey.
The Collaborating Institutions are Argonne NationalLaboratory, the University of California at Santa Cruz,the University of Cambridge, Centro de InvestigacionesEnergeticas, Medioambientales y Tecnologicas-Madrid, theUniversity of Chicago, University College London, the DES-Brazil Consortium, the University of Edinburgh, the Ei-dgenossische Technische Hochschule (ETH) Zurich, FermiNational Accelerator Laboratory, the University of Illi-nois at Urbana-Champaign, the Institut de Ciencies del’Espai (IEEC/CSIC), the Institut de Fısica d’Altes Ener-gies, Lawrence Berkeley National Laboratory, the Ludwig-Maximilians Universitat Munchen and the associated Ex-cellence Cluster Universe, the University of Michigan, theNational Optical Astronomy Observatory, the University ofNottingham, The Ohio State University, the University of
MNRAS 000, 000–000 (2019)
DES L and T dwarfs sample 37

Brown dwarf census with DES Y3 23
Pennsylvania, the University of Portsmouth, SLAC NationalAccelerator Laboratory, Stanford University, the Universityof Sussex, Texas A&M University, and the OzDES Member-ship Consortium.
Based in part on observations at Cerro Tololo Inter-American Observatory, National Optical Astronomy Obser-vatory, which is operated by the Association of Universi-ties for Research in Astronomy (AURA) under a cooperativeagreement with the National Science Foundation.
The DES data management system is supported bythe National Science Foundation under Grant NumbersAST-1138766 and AST-1536171. The DES participants fromSpanish institutions are partially supported by MINECOunder grants AYA2015-71825, ESP2015-66861, FPA2015-68048, SEV-2016-0588, SEV-2016-0597, and MDM-2015-0509, some of which include ERDF funds from the Euro-pean Union. IFAE is partially funded by the CERCA pro-gram of the Generalitat de Catalunya. Research leading tothese results has received funding from the European Re-search Council under the European Union’s Seventh Frame-work Program (FP7/2007-2013) including ERC grant agree-ments 240672, 291329, and 306478. We acknowledge sup-port from the Australian Research Council Centre of Excel-lence for All-sky Astrophysics (CAASTRO), through projectnumber CE110001020, and the Brazilian Instituto Nacionalde Ciencia e Tecnologia (INCT) e-Universe (CNPq grant465376/2014-2).
This manuscript has been authored by Fermi ResearchAlliance, LLC under Contract No. DE-AC02-07CH11359with the U.S. Department of Energy, Office of Science, Of-fice of High Energy Physics. The United States Governmentretains and the publisher, by accepting the article for pub-lication, acknowledges that the United States Governmentretains a non-exclusive, paid-up, irrevocable, world-wide li-cense to publish or reproduce the published form of thismanuscript, or allow others to do so, for United States Gov-ernment purposes.
This publication makes use of data products from theWide-field Infrared Survey Explorer, which is a joint projectof the University of California, Los Angeles, and the JetPropulsion Laboratory/California Institute of Technology,and NEOWISE, which is a project of the Jet Propulsion Lab-oratory/California Institute of Technology. WISE and NE-OWISE are funded by the National Aeronautics and SpaceAdministration.
The analysis presented here is based on observationsobtained as part of the VISTA Hemisphere Survey, ESOProgramme, 179.A-2010 (PI: McMahon).
This paper has gone through internal review by the DEScollaboration.
ACR acknowledges financial support provided by thePAPDRJ CAPES/FAPERJ Fellowship and by “Unidad deExcelencia Marıa de Maeztu de CIEMAT - Fısica de Partıcu-las (Proyecto MDM)”.
The authors would like to thank Jacqueline Fahertyand Joe Filippazzo for their help on the early stages of thisproject.
REFERENCES
Abell P. A., et al., 2009
Aihara H., et al., 2018, Publication of the Astronomical Society
of Japan, 70
Albert L., Artigau E., Delorme P., Reyle C., Forveille T., Delfosse
X., Willott C. J., 2011, Aj, 141, 203
An D., et al., 2008, The Astrophysical Journal Supplement Series,
179, 326
Arnouts S., Cristiani S., Moscardini L., Matarrese S., Lucchin F.,Fontana A., Giallongo E., 1999, MNRAS, 310, 540
Arnouts S., et al., 2007, A&A, 476, 137
Banerji M., et al., 2015, MNRAS, 446, 2523
Basri G., Reiners A., 2006, AJ, 132, 663
Bertin E., Arnouts S., 1996, A&AS, 117, 393
Bochanski J. J., Munn J. A., Hawley S. L., West A. A., Covey
K. R., Schneider D. P., 2007, AJ, 134, 2418
Bruzual G., Charlot S., 2003, MNRAS, 344, 1000
Burgasser A. J., 2007, ApJ, 659, 655
Burgasser A. J., et al., 2003, ApJ, 592, 1186
Burgasser A. J., Kirkpatrick J. D., Cruz K. L., Reid I. N., Leggett
S. K., Liebert J., Burrows A., Brown M. E., 2006a, ApJSup-
plement, 166, 585
Burgasser A. J., Geballe T. R., Leggett S. K., Kirkpatrick J. D.,Golimowski D. A., 2006b, ApJ, 637, 1067
Burke D. L., et al., 2018, AJ, 155, 41
Burningham B., 2018, preprint, (arXiv:1805.05661)
Burningham B., et al., 2010, MNRAS, 406, 1885
Burningham B., et al., 2013, Monthly Notices of the Royal As-
tronomical Society, 433, 457
Burstein D., Heiles C., 1982, Aj, 87, 1165
Chiu K., Fan X., Leggett S. K., Golimowski D. A., Zheng W.,
Geballe T. R., Schneider D. P., Brinkmann J., 2006, Aj, 131,
2722
Coleman G. D., Wu C.-C., Weedman D. W., 1980, ApJS, 43, 393
Cross N. J. G., et al., 2012, A&A, 548, A119
Cruz K. L., et al., 2007, Aj, 133, 439
Dalton G. B., et al., 2006, in Society of Photo-Optical Instru-
mentation Engineers (SPIE) Conference Series. p. 62690X,
doi:10.1117/12.670018
Dark Energy Survey Collaboration et al., 2016, MNRAS, 460,
1270
Dark Energy Survey Collaboration et al., 2018, ApJS, 239, 18
Day-Jones A. C., Marocco F., Pinfield D. J., Zhang Z. H., Burn-
ingham B., Deacon N., Ruiz M. T., et al. 2013, MNRAS, 430,
1171
Drlica-Wagner A., et al., 2018, The Astrophysical Journal Sup-plement Series, 235, 33
Dupuy T. J., Liu M. C., 2012, Apjs, 201, 19
Faherty J. K., Burgasser A. J., Cruz K. L., Shara M. M., WalterF. M., Gelino C. R., 2009, Aj, 137, 1
Faherty J. K., et al., 2012, ApJ, 752, 56
Faherty J. K., et al., 2016, ApJS, 225, 10
Folkes S. L., Pinfield D. J., Kendall T. R., Jones H. R. A., 2007,
MNRAS, 378, 901
Fontanive C., Biller B., Bonavita M., Allers K., 2018, MNRAS,
479, 2702
Gagne J., et al., 2017, ApJS, 228, 18
Gaia Collaboration et al., 2018, A&A, 616, A1
Ilbert O., et al., 2006, A&A, 457, 841
Juric M., Ivezic Z., Brooks A., Lupton R. H., Schlegel D.,Finkbeiner D., et al. 2008, ApJ, 673, 864
Kerber L. O., Javiel S. C., Santiago B. X., 2001, A&A, 365, 424
Kinney A. L., Calzetti D., Bohlin R. C., McQuade K., Storchi-Bergmann T., Schmitt H. R., 1996, ApJ, 467, 38
Kirkpatrick J. D., et al., 1999, ApJ, 519, 802
Kirkpatrick J. D., et al., 2011, ApJs, 197, 19
Lawrence A., et al., 2007, Monthly Notices of the Royal Astro-
nomical Society, 379, 1599
Leggett S. K., Morley C. V., Marley M. S., Saumon D., Fortney
J. J., Visscher C., 2013, ApJ, 763, 130
MNRAS 000, 000–000 (2019)
DES L and T dwarfs sample 38

24 DES Collaboration
Leggett S. K., Morley C. V., Marley M. S., Saumon D., 2015,
ApJ, 799, 37
Liu M. C., et al., 2013, ApJ, 777, L20Lodieu N., et al., 2012, AaP, 548, A53
Looper D. L., et al., 2008, ApJ, 686, 528
Luhman K. L., 2012, Araa, 50, 65
Mainzer A., et al., 2011, ApJ, 731, 53
Marocco F., et al., 2014, MNRAS, 439, 372Marocco F., et al., 2015, Monthly Notices of the Royal Astronom-
ical Society, 449, 3651
Marocco F., et al., 2017, MNRAS, 470, 4885Maxted P. F. L., Jeffries R. D., 2005, MNRAS, 362, L45
McMahon R. G., Banerji M., Gonzalez E., Koposov S. E., Bejar
V. J., Lodieu N., Rebolo R., VHS Collaboration 2013, TheMessenger, 154, 35
Miyazaki S., et al., 2018, PASJ, 70, S1
Morganson E., et al., 2018, PASP, 130, 074501Pinfield D. J., Jones H. R. A., Lucas P. W., Kendall T. R., Folkes
S. L., Day-Jones A. C., Chappelle R. J., Steele I. A., 2006,
MNRAS, 368, 1281Prevot M. L., Lequeux J., Maurice E., Prevot L., Rocca-
Volmerange B., 1984, A&A, 132, 389Reed S. L., et al., 2015, MNRAS, 454, 3952
Reed S. L., et al., 2017, MNRAS, 468, 4702
Ryan Jr. R. E., Hathi N. P., Cohen S. H., Windhorst R. A., 2005,
ApJLetters, 631, L159
Santiago B. X., Gilmore G., Elson R. A. W., 1996, MNRAS, 281,
871
Santiago B., Yanny B., Yanny 2010, in Bruzual G. R.,
Charlot S., eds, IAU Symposium Vol. 262, Stellar Pop-
ulations - Planning for the Next Decade. pp 265–269,
doi:10.1017/S1743921310002899
Schlafly E. F., Finkbeiner D. P., 2011, ApJ, 737, 103
Schlegel D. J., Finkbeiner D. P., Davis M., 1998, Apj, 500, 525
Schmidt S. J., West A. A., Hawley S. L., Pineda J. S., 2010, Aj,
139, 1808
Skemer A. J., et al., 2016, ApJ, 826, L17
Skrzypek N., Warren S. J., Faherty J. K., Mortlock D. J., Bur-
gasser A. J., Hewett P. C., 2015, A&A, 574, A78
Skrzypek N., Warren S. J., Faherty J. K., 2016, A&A, 589, A49
Smith L., Lucas P. W., Burningham B., Jones H. R. A., Smart
R. L., Andrei A. H., Catalan S., Pinfield D. J., 2014, MNRAS,
437, 3603
Sorahana S., Nakajima T., Matsuoka Y., 2018, preprint,
(arXiv:1811.07496)
Tie S. S., et al., 2017, Aj, 153, 107
Warren S. J., et al., 2007, ArXiv Astrophysics e-prints,
West A. A., Morgan D. P., Bochanski J. J., Andersen J. M., et
al. 2011, aj, 141, 97
Wright E. L., et al., 2010, AJ, 140, 1868
Zhang Z. H., Homeier D., Pinfield D. J., Lodieu N., Jones
H. R. A., Allard F., Pavlenko Y. V., 2017, MNRAS, 468, 261
15 AFFILIATIONS
1 Centro de Investigaciones Energeticas, Medioambientalesy Tecnologicas (CIEMAT), Madrid, Spain2 Laboratorio Interinstitucional de e-Astronomia - LIneA,Rua Gal. Jose Cristino 77, Rio de Janeiro, RJ - 20921-400,Brazil3 Observatorio Nacional, Rua Gal. Jose Cristino 77, Rio deJaneiro, RJ - 20921-400, Brazil4 Instituto de Fısica, UFRGS, Caixa Postal 15051, PortoAlegre, RS - 91501-970, Brazil5 Center for Astrophysics Research, University of Hertford-shire, Hatfield AL10 9AB, UK
6 Harvard-Smithsonian Center for Astrophysics, Cambridge,MA 02138, USA7 Black Hole Initiative at Harvard University, 20 GardenStreet, Cambridge, MA 02138, USA8 George P. and Cynthia Woods Mitchell Institute forFundamental Physics and Astronomy, and Department ofPhysics and Astronomy, Texas A&M University, CollegeStation, TX 77843, USA9 Institute of Astronomy, University of Cambridge, Madin-gley Road, Cambridge CB3 0HA, UK10 Kavli Institute for Cosmology, University of Cambridge,Madingley Road, Cambridge CB3 0HA, UK11 Physics Department, 2320 Chamberlin Hall, University ofWisconsin-Madison, 1150 University Avenue Madison, WI53706-139012 LSST, 933 North Cherry Avenue, Tucson, AZ 85721, USA13 Fermi National Accelerator Laboratory, P. O. Box 500,Batavia, IL 60510, USA14 Cerro Tololo Inter-American Observatory, National Op-tical Astronomy Observatory, Casilla 603, La Serena, Chile15 Instituto de Fisica Teorica UAM/CSIC, Universidad Au-tonoma de Madrid, 28049 Madrid, Spain16 Department of Physics and Astronomy, University ofPennsylvania, Philadelphia, PA 19104, USA17 Department of Physics & Astronomy, University CollegeLondon, Gower Street, London, WC1E 6BT, UK18 Kavli Institute for Particle Astrophysics & Cosmology, P.O. Box 2450, Stanford University, Stanford, CA 94305, USA19 SLAC National Accelerator Laboratory, Menlo Park, CA94025, USA20 Department of Astronomy, University of Illinois atUrbana-Champaign, 1002 W. Green Street, Urbana, IL61801, USA21 National Center for Supercomputing Applications, 1205West Clark St., Urbana, IL 61801, USA22 Institut de Fısica d’Altes Energies (IFAE), The BarcelonaInstitute of Science and Technology, Campus UAB, 08193Bellaterra (Barcelona) Spain23 Kavli Institute for Cosmological Physics, University ofChicago, Chicago, IL 60637, USA24 Institut d’Estudis Espacials de Catalunya (IEEC), 08034Barcelona, Spain25 Institute of Space Sciences (ICE, CSIC), Campus UAB,Carrer de Can Magrans, s/n, 08193 Barcelona, Spain26 Santa Cruz Institute for Particle Physics, Santa Cruz, CA95064, USA27 Institucio Catalana de Recerca i Estudis Avancats, E-08010 Barcelona, Spain28 Department of Astrophysical Sciences, Princeton Univer-sity, Peyton Hall, Princeton, NJ 08544, USA29 School of Physics and Astronomy, University ofSouthampton, Southampton, SO17 1BJ, UK30 Instituto de Fısica Gleb Wataghin, Universidade Estad-ual de Campinas, 13083-859, Campinas, SP, Brazil31 Computer Science and Mathematics Division, Oak RidgeNational Laboratory, Oak Ridge, TN 3783132 Department of Physics, University of Michigan, Ann Ar-bor, MI 48109, USA33 Argonne National Laboratory, 9700 South Cass Avenue,Lemont, IL 60439, USA
MNRAS 000, 000–000 (2019)
DES L and T dwarfs sample 39

Brown dwarf census with DES Y3 25
APPENDIX A: LEPHARE CONFIGURATION
In this section we detail the Lephare configuration we usedto separate extragalactic sources from the main MLT cat-alogue. We run separately Lephare for galaxy and quasartemplates.
We used AVEROIN galaxy template library, containing 62different templates including starburst, spiral, elliptical andirregular galaxies from Coleman et al. (1980), Kinney et al.(1996), and Bruzual & Charlot (2003) and tuned in the mid-infrared (from 3.6 to 4.5 microns) based on VVDS-CFHTLS-SWIRE photometry and VVDS spectra. They were used forthe first in Arnouts et al. (2007). We allow for internal ex-tinction following the extinction law by Prevot et al. (1984)up to a E(B-V) = 0.3. In Table A1 we summarize the con-figuration parameters we used in Lephare.
For quasars, we use the default quasar template listfrom Lephare and we refer to their documentation for de-tails about the templates used. In Table A2 we summarizethe configuration used for the quasar run.
We further need the filter passbands for i, z,Y (DES),J,H,Ks (VHS) and W1,W2 (WISE). The DES passbandsare the most updated versions of the calibrated transmissioncurves as shown in Burke et al. (2018), for the VHS pass-bands, we use the curves given at ESO instrument descriptionpage9 while for the WISE filters we used the curves given atthe WISE documentation page10.
Finally, we add an error of 0.07 in quadrature to eachmagnitude error as we did for the main classif run and trans-form magnitudes to AB previous to run Lephare.
APPENDIX B: GALAXY CONTAMINATION INTHE MLT CATALOGUE
In this section we describe the extragalactic populationfound in the colour space defined in Section 4 after runningLephare. From the list of 2818 targets, 2,761 are galaxies,and 57 are quasars. Next, we show the properties of thegalaxy population.
To avoid biases in our conclusions due to a wrong classi-fication as explained in Section 6.1, we analyse only sourceswith NBANDS> 5. From the list of 2,761 extragalactic sources,514 targets meet this requirement. In this sample, we iden-tify two phenotypes of galaxies that mimic the LT colours:elliptical galaxies at redshifts 1. < z < 2. and another phe-notype of spirals and irregulars with 5. < z < 6.. In Fig. B1we show the best-fit galaxy template versus the redshift. Incolour scale, the best-fit MLT type is presented. In Fig. B2we show the number of extragalactic sources as a functionof galaxy spectral type. The contamination happens only inthe ML regime.
APPENDIX C: VALIDATION
As a simple validation test, the expected number counts out-put from GalmodBD for a field with unit solid angle, in the
9 http://www.eso.org/sci/facilities/paranal/instruments/
vircam/inst.html10 http://www.astro.ucla.edu/~wright/WISE/passbands.html
Elliptical Sbc Scd IrregularSBAVEROIN Galaxy Template
0
1
2
3
4
5
6
7
Phot
o-z
NBANDS > 5
L0
L5
T0
T5
MLT
Typ
e
Figure B1. Best galaxy templates versus redshift for extragalac-
tic targets with NBANDS > 5. The colour scale is given by thecolour bar and represent the best-fit MLT type.
Elliptical Sbc Scd Irregular SBAVEROIN Galaxy Template
0
100
200
300
400
500
600
700
800
900
Cou
nts
NBANDS > 5
Figure B2. Best galaxy template distribution for extragalactic
targets with NBANDS > 5.
case of a uniform BD LF of n0 pc−3, and towards the Galac-tic poles may be compared to the trivial analytical solutionfor this particular case, which comes from direct integrationof the fundamental equation of stellar statistics for a singledisk exponential model:
N(m) =n0[hz f1(d1, d2) + 2 h2
z f2(d1, d2) + 2 h3z f3(d1, d2)] (C1)
In the expression above, if m,m + dm is some chosenbin in apparent magnitude, N(m)dm will be the number ofobjects in the given bin. hz is the model exponential scaleheight for the disk, and
f1(d1, d2) = d21 exp(−d1/hz ) − d2
2 exp(−d2/hz ) (C2)
f2(d1, d2) = d1 exp(−d1/hz ) − d2 exp(−d2/hz ) (C3)
f3(d1, d2) = exp(−d1/hz ) − exp(−d2/hz ) (C4)
MNRAS 000, 000–000 (2019)
DES L and T dwarfs sample 40

26 DES Collaboration
Table A1. Lephare configuration used when fitting the data to galaxy templates.
NAME VALUE EXPLANATION
GAL_SED AVEROIN MOD.list List of 62 galaxy templatesGAL_FSCALE 1. Arbitrary Flux Scale
FILTER_LIST i, z,Y, J, H, Ks,W1,W2 List of paths to ascii files with passbands
TRANS_TYPE 0 Transmission type (0 = Energy, 1 = Nb of photons)FILTER_CALIB 0 Filter calibration (0 = fnu=ctt)
MAGTYPE AB Magnitude type (AB or VEGA)
Z_STEP 0.04, 6., 0.1 dz, zmax, dzsupCOSMOLOGY 70, 0.3, 0.7 H0, ΩM , ΩΛEXTINC_LAW SMC prevot.dat Extinction law
EB_V 0., 0.05, 0.1, 0.15, 0.2, 0.3 Allowed E(B-V) values
MOD_EXTINC 38, 62 Templates for which to apply extinction law
EM_LINES NO Allow emission linesCAT_MAG AB Input Magnitude (AB or VEGA)
ERR_SCALE 0.07 Errors per band added in quadrature
Z_INTERP YES Redshift interpolation
Table A2. Lephare configuration used to fit the data to quasar templates.
NAME VALUE EXPLANATION
GAL_SED QSO MOD.list List of 28 quasar templates
GAL_FSCALE 1. Arbitrary Flux Scale
FILTER_LIST i, z,Y, J, H, Ks,W1,W2 List of paths to ascii files with passbands
TRANS_TYPE 0 Transmission type (0 = Energy, 1 = Nb of photons)
FILTER_CALIB 0 Filter calibration (0 = fnu=ctt)
MAGTYPE AB Magnitude type (AB or VEGA)
Z_STEP 0.04, 9., 0.1 dz, zmax, dzsup
COSMOLOGY 70, 0.3, 0.7 H0, ΩM , ΩΛEB_V None Allowed E(B-V) values
CAT_MAG AB Input Magnitude (AB or VEGA)
ERR_SCALE 0.07 Errors per band added in quadrature
Z_INTERP YES Redshift interpolation
where
d1 = 10(0.2(m−M f t+5)) pc (C5)
d2 = 10(0.2(m−Mbr+5)) pc (C6)
are, respectively, the minimum and maximum distancesout to which any BD can be observed with the appar-ent magnitude m. This minimum (maximum) distance in-evitably corresponds to the least (most) luminous BD spec-tral type in some filter, whose absolute magnitude is Mf t
(Mbr ).Another simple validation test, again for the same spe-
cial case as before, but this time involving all spectral types,is provided by the cumulative counts within some magnituderange [mbr,m f t ], N(≤ m):
N(≤ m) =Nmod∑
k
n0[hz f1(k, d1, d2) + 2 h2z f2(k, d1, d2)+
2 h3z f3(k, d1, d2)] (C7)
where in the expression above, the sum is over all NmodBD spectral types, and the functions f1, f2, and f3 are as
given before. The minimum and maximum distances are nowgiven by
d1 = 10(0.2(mbr−Mk+5)) pc (C8)
d2 = 10(0.2(m f t−Mk+5)) pc (C9)
therefore corresponding to the minimum and maximumdistances over which the k-th model contributes to thecounts.
Completely analogous analytic expressions apply to thesituation in which we model the number counts for (l, b) =(180, 0) deg. In this case, all one needs to do is to replace themodel disk scale height hz,thin by the scale length hR.
In Fig. C1, we show the comparison of GalmodBDpredictions with the analytical counts, based on a sin-gle disk component over a 1 sq. deg. field, and usingn0=4 10−4 pc−3mag−1, for the following cases: 1 - Galacticpole (left panel, using hz = 150 pc); 2-(l, b) = (180, 0, ) deg(right panel, with hR = 2500 pc). The points are fromGalmodBD and the lines are from the analytic expressionsprovided above. Open (filled) symbols are differential (cumu-lative) counts as a function of z band magnitude. GalmodBDclearly reproduces the expected counts.
This paper has been typeset from a TEX/LATEX file prepared bythe author.
MNRAS 000, 000–000 (2019)
DES L and T dwarfs sample 41

Brown dwarf census with DES Y3 27
20 22 24z
5
4
3
2
1
0
log
N(z
) (sq
.deg
mag
)1
Galactic pole
hz = 150 pc
20 22 24z
4
3
2
1
0
1
2(l, b) = (180 , 0 )hR = 2500 pc
Figure C1. Left panel: Star counts as a function of zAB to-
wards the Galactic Pole using a single disk model with scale height
hz, thin = 150 pc. Points come from GalmodBD : the open sym-
bols are differential counts and the filled symbols are cumulative
counts. The associated curves are the analytic formulae given by
equations C1 and C7, respectively. Right panel: Same as in the
previous panel, but now star counts towards the Galactic anti-
centre, for a model with a single disk with horizontal scale length
hR = 2.5 kpc.
MNRAS 000, 000–000 (2019)
DES L and T dwarfs sample 42

Chapter 3
Benchmark L and T dwarfs
In this section we describe candidate benchmark systems, specifically the wide binary
systems made up of L or T dwarf candidates orbiting main sequence stars. Also,
we present systems made up by two brown dwarfs. We also find in our search 2
multiple system candidates: a triple and a quadruple. The vast majority of the
systems have . 10000 AU projected separation. The benchmark systems are useful
to improve brown dwarf evolutionary models since their chemical composition and
age constraints may be taken from the primary star if we assumed that the pair
formed together, at the same time and in the same molecular cloud.
Our approach was to use our sample of L and T candidates selected from DES
data (Carnero Rosell et al., 2019) and then search for possible companions. We used
a common distance criterion, without any proper motion information. For Gaia DR2
and DES stars, we estimated distances using the StarHorse code and for the brown
dwarfs, the distances were based on empirical templates ranging from L0 to T9. In
order to assess the false positives, we compute chance alignment probabilities. We
discarded pairs with probability > 5%. From Gaia DR2 we found 65 pairs, from
DES we found 123. And we identified 9 systems involving two brown dwarfs. This
is the largest catalog containing candidate benchmark brown dwarfs to date. The
vast majority of our brown dwarfs pair members are of early L type, in tune with
the total sample of L and T candidates. Also, we determine that the typical binary
fraction over all spectral types is 2− 4%.
The rest of this chapter is presented as paper that is currently at internal review
by DES members.
43

MNRAS 000, 000–000 (2018) Preprint 1 July 2019 Compiled using MNRAS LATEX style file v3.0
L and T dwarfs wide binaries from the Dark Energy Survey DR1and Gaia DR2 data
M. Dal Ponte1,2?, B. Santiago1,2, A. Carnero Rosell2,3, B. Burningham4,DES MWWorking group, Builders, +others1Universidade Federal do Rio Grande do Sul (UFGRS)2Laboratório Interinstitucional de e-Astronomia (LIneA)3Centro de Investigaciones Energéticas, Medioambientales y Tecnológicas (Ciemat)4University of Hertfordshire
Accepted XXX. Received YYY; in original form ZZZ
ABSTRACTWe present 188 candidate wide binary systems composed by L or T dwarfs orbiting mainsequence stars, 9 double brown dwarf systems and 2 multiple systems candidate (triple andquadruple) with . 10000 AU projected separation. Using a sample of 11,745 brown dwarfscandidates selected from DES data, we search for possible main sequence companions in GaiaDR2 and Dark Energy Survey data. We also search for systems made up by two brown dwarfs.The benchmark binary systems are very useful to improve brown dwarf evolutionary modelssince their chemical composition and ages may be taken from the primary star. We use acommon distance criterion with no proper motion information. For the Gaia DR2 stars weestimate distances based on their parallaxes and photometry, using the StarHorse code, whilefor DES stars, the StarHorse distances were purely photometric for the majority of cases,with a small fraction having parallax measurement from Gaia DR2. L and T dwarfs distancesare based on empirical templates ranging from L0 to T9. We also compute chance alignmentprobabilities in order to assess the physical nature of each pair. We found 70 possible pairswith Gaia DR2 primaries, 65 of them with chance alignment probabilities < 5%. For DESprimaries, these numbers are 132 and 123, respectively. Only 9 candidate systems composedby two brown dwarfs were identified. We cross-correlate our wide binary candidates withprevious objects from the literature, either with common distances and proper motions orconfirmed spectroscopically, having found 1 object in common. The vast majority of our Lor T pair members are of early L type, as expected in comparison to our sample of L and Tcandidates. Also, we determine that the typical wide binary fraction over the L and T spectraltypes is 2 − 4%.
Key words: Brown Dwarfs, Benchmarks, Dark Energy Survey
1 INTRODUCTION
L,T and Y dwarfs, also called brown dwarfs (BDs), are presumedto be common objects in the Milky Way. Due their very low masses(< 0.075M) and temperatures (Teff < 2300K), and hence lumi-nosities, rank them among the most difficult sources to detect.
Their census has greatly improved since the appearance ofinfrared surveys, such the Two-Micron All-Sky Survey (2MASS;Skrutskie et al. 2006), the Deep Near Infrared Survey of the South-ern Sky (DENIS; Epchtein et al. 1997), the UKIRT Infrared DeepSky Survey (UKIDSS; Lawrence et al. 2007), the Wide-field In-frared Survey Explorer (WISE; Wright et al. 2010) and the VISTAHemisphere Survey (VHS; McMahon et al. 2013). Among the
? E-mail: [email protected]
optical surveys that unveiled substantial numbers of such as coolsources are the Sloan Digital Sky Survey (SDSS; York et al. 2000),and, more recently, the Dark Energy Survey (DES; Abbott et al.2018). However, samples of known brown dwarfs are still restrictedto distances of a few hundred parsecs from the Solar position.
On the theoretical side, many uncertainties about the interior,atmosphere and evolution of L and T dwarfs still remains. Modelsof brown dwarf structure often lack consistent boundary conditionsbetween the interior and the atmosphere. Uncertainties also remainsin terms of opacities, the equation of state and the importance ofcloud condensation in the atmospheres. As in the case of stars,brown dwarf formation and evolution models should benefit fromknowledge of chemical composition, masses and ages of a sizeablesample of such objects. Binary systems are ideal to study star for-mation, to benchmark stellar evolutionary models and to calibrateempirical relations that determine fundamental parameters. In this
© 2018 The Authors
Benchmark L and T dwarfs 44

2 M. Dal Ponte et al.
scenario, large statistical samples could constrain the behavior andintrinsic variations of star formation and stellar properties of L andT dwarf population.
In terms of binary statistics, there is evidence that the binaryfrequency decreases as a function of spectral type. For solar-typesstars, Raghavan et al. (2010) found that ∼ 25% have a companionwith separation wider than 100 AU, ∼ 11 % wider than 1000 AUand Tokovinin & Lépine (2012) estimate 4.4 % wider than 2000AU. However, searches for M,L or T dwarfs in wide binary sys-tems remains incomplete. Recently Dhital et al. (2011) and Dhitalet al. (2015) presented the Sloan Low-mass Wide Pairs of Kinemat-ically Equivalent Stars (SLoWPoKES), a catalog containing com-mon proper motion and common distance wide candidate pairs. Forthe mid-K and mid-M type dwarfs presented in both catalogs, thewide binary frequency was ∼ 1.1%. However, the binary fractionfor L and T dwarfs in wide systems is still uncertain.
Using DES+VHS+WISE data we were recently able to se-lect and perform spectral classification using only photometry on asample of ∼ 11,000 brown dwarfs candidates (Carnero Rosell et al.2019). Using this sample of L and T dwarfs we estimated the thindisk scale height of L dwarfs, which agreed with a recent measure-ments found by Sorahana et al. (2018). A more detailed descriptionof the data, color cuts, spectral classification and modeling of thespatial distribution of L and T dwarfs is presented in Carnero Rosellet al. (2019).
In this paper we present the study of benchmark systems,specifically wide binary systems which contain L or a T dwarforbiting main sequence (MS) stars. These systems are useful toimprove brown dwarfs evolutionary models since their chemicalcomposition and age constraints may be taken from the primarystar, assuming that the pair formed at the same time, of the samematerial and evolved in the same environment. In Section 3 wedescribe our sample of brown dwarfs candidates selected fromDES+VHS+WISE data. In Section 4 we discuss the photometricdistance measurement for the L and T candidates and the spectro-photometric distance for the primary stars selected in the Gaia DR2and DES data. In Section 5 we present the details about the candi-date binaries and alsowe address the estimation of change alignmentprobability.
2 THE DATA
In this section we describe the data used to select L and T dwarfcandidates and primaries stars used in our search for wide binarycompanions.
2.1 DES, VHS and WISE data
DES is a (∼5,000deg2) optical survey in the grizY bands that usesthe Dark Energy Camera (DECam; Flaugher et al. 2015). DECamis a wide-field (3 deg2) imager at the prime focus of the Blanco 4mtelescope in Cerro Tololo Inter-American Observatory (CTIO).
The DES footprint was selected to obtain a overlap with theSouth Pole Telescope survey (Carlstrom et al. 2011) and Stripe 82from SDSS (Abazajian et al. 2009). The Galactic plane was avoidedto minimize stellar foregrounds and extinction from interstellar dustin order to maintain the DES cosmological goals. Even thoughthe main drive for DES is cosmological, the stellar data have beenextensively used by the collaboration to identify new star clusters,streams and satellite galaxies in the MW Halo and beyond (Bechtolet al. 2015; Drlica-Wagner et al. 2015; Luque et al. 2017).
The first public data release of the Dark Energy Survey, DESDR1 (DR1; Abbott et al. 2018) is composed of 345 distinct nightsspread over the first 3 years of DES operations, from 2013 August15 to 2016 February 12. DR1 uses exposure times of 90s for grizbands and 45s for Y band, yielding a typical single-epoch point-spread function (PSF) depth at signal-to-noise ratio (S/N) = 10 of g= 23.57, r = 23.34, i = 22.78, z = 22.10, and Y = 20.69 (AB system)(Morganson et al. 2018). The median air mass of DR1 survey-quality exposures was 1.22, with >99% of exposures taken at airmass <1.4. Meanwhile, the median delivered seeing (FWHM) wasg = 1.12, r = 0.96, i = 0.88, z = 0.84, and Y = 0.90 arcseconds. TheDES DR1 co-add source extraction process detected and cataloged399,263,026 distinct objects. The star/galaxy separation schemefollows the SEXtractor SPREAD_MODEL, which compares the fitof a local PSF model to a slightly extended exponencial disk model(Desai et al. 2012).
DES DR1 has many flags in order to avoid corrupted valuesdue to image artifacts or reduction problems. the case of searchesfor L and T dwarfs and MS stars in the DES data, we demandedthat FLAGS_z,Y = 0 (ensures no reduction problems in the z andY bands) and ISO_MAGFLAGS_i,z,Y = 0 (ensures the object hasnot been affected by spurious events in the images in i,z,Y bands).In the case of LT dwarfs search, we also imposed a magnitudelimit cut of z < 22 with a detection of 5σ at least in the z and Ymagnitudes to ensure a high completeness in the i band. For theMS stars case, we imposed a magnitude limit cut of i < 24. TheDES DR1 is a already a public release, but in our investigation weused SOF_PSF_MAG_i,z photometry, which is not been publishedyet. The SOF photometry is based on a different reduction usingthe ngmix code 1, with has better PSF and shape modeling. Eventhough we used nonpublic photometry, the COADD_ID are the sameas those in the public release.
The VHS is a infrared survey imaging 18,000 deg2 in thesouthern hemisphere which uses the 4m VISTA telescope at ESOCerro Paranal Observatory, in Chile, with the VIRCAM camera(Dalton et al. 2006). The VHS has a full overlap with DES in twowavebands, J and Ks , with depth J = 20.3, Ks = 18.6 and partialcoverage in H band, with depth H = 18.5 (Vega system) at 5σ forpoint sources. The VHS Data Release 3 has 42,046,641 sources inthe region that overlaps the DES.
We also used the AllWISE data, which is a full sky infraredsurvey observing in the wavelength range 3.4, 4.6, 12, and 22 µm inW1, W2, W3 and W4 bands. The AllWISE is a combination of theWISE mission and NEOWISE (Mainzer et al. 2011). The AllWISECatalog is >95% complete for sources with W1 < 17.1 and W2 <
15.7 mag (Vega system). The AllWISE catalog has 58,764,954sources in the region overlaping DES.
In order to match the three catalogs, we first matched DES toVHS using a positional matching radius of 2 arcseconds, and thenwe repeated the same procedure with the AllWISE catalog usingthe DES+VHS catalog. After matching the DES+VHS+WISE data,we removed every source that did not pass the DES quality cutsas explained before. The resulting catalog has 27,249,118 sourcesin 2374 deg2 footprint and was used for the L and T dwarf search(Section 3) and also to search for primary star candidates (Section5.2).
1 https://github.com/esheldon/ngmix
MNRAS 000, 000–000 (2018)
Benchmark L and T dwarfs 45

L and T dwarfs wide binaries from the Dark Energy Survey DR1 and Gaia DR2 data 3
2.2 Gaia
The Gaia astrometric mission was launched in December 2013 andplaced 1.5 million km from the Earth. It is measuring positions,parallaxes, proper motions and photometry for over one billionsources to G ' 20.7, and obtaining physical parameters and radialvelocities for millions of brighter stars. Its recent Data Release 2(Gaia DR2; Gaia Collaboration et al. 2018), has covered the initial22 months of data taking (from a predicted total of 5 years), withpositions and photometry for 1.7 × 10⁹ sources, full astrometricsolution for 1.3× 10⁹, Teff , extinction, stellar radii and luminositiesfor' 108 stars, and radial velocities for 7×10⁷ of them. In this paper,GaiaDR2was used to select primary star candidates to our sample ofLT dwarfs. Particularly important for this purpose are the parallaxes,whose precision varies from < 0.1 mas for G ≤ 17 to ' 0.7 mas forG = 20. They allow us to better discern dwarfs (whose distanceswill overlap those of the LT dwarfs from DES+VHS+WISE) frommuch more distant giants of similar colours, Teff and chemistry. Thedistance estimated for primaries and secondaries are described inSection 4.2 and Section 4.1, respectively. The Gaia DR2 sample wascross-matched to the APASS (Henden&Munari 2014) and 2MASScatalogues, so as to increase the amount of photometric informationavailable for each star. This is very important in the derivation ofthe distances, as explained in Section 4.2.
3 SAMPLE OF L AND T CANDIDATES
In Carnero Rosell et al. (2019) our initial goal was to search for Land T candidates in the DES+VHS+WISE data using a color-colorcut criteria. We adopt iAB − zAB > 1.2, zAB − YAB > 0.15 andYAB − JVega > 1.6 to perform the selection of the candidates. Weused this initial sample of M,L and T dwarfs to run our spectralclassification code, which uses only photometry, to estimate thespectral type. The spectral classification code was implementedusing the same method as presented in Skrzypek et al. (2015) andSkrzypek et al. (2016), based on a minimization of the χ2 relativeto MLT empirical templates. We ended up with 11,745 L and Tdwarfs candidates. More details about the selection method and thespectral classification can be found in Carnero Rosell et al. (2019).
4 DISTANCE MEASUREMENT
In this section we describe our method to measure distances forthe L and T candidates, selected from DES+VHS+WISE sam-ple, and for the possible primaries stars which were selected usingDES+VHS+WISE and Gaia DR2 data.
4.1 L and T dwarfs candidates
Using our L and T sample described in Section 3, we use the spectraltype from each candidate and our empirical model grid describedin Carnero Rosell et al. (2019) to find the absolute magnitude andthen obtain the distance modulus for each L and T dwarf. Theempirical model grid lists absolute magnitudes in izY JHKW1W2for dwarfs ranging from M1 to T9. We computed one distancemodulus for each filter with available apparent magnitude. Theresulting distance to each L and T was then taken to be the meanvalue among the available filters and we used the dispersion aroundthemean as the distance uncertainty.Wedid not apply any correctionfor extinction, since this is expected to be small out to the distancesto ours candidates, which is smaller than 500 pc.
4.2 Primary stars
We use the Gaia DR2 (Gaia Collaboration et al. 2018) and the DESDR1+VHS+WISE to search for stars located close to our L or Tdwarfs. The Gaia data was cut in G < 18 and the DES+VHS+WISEin z < 22. Every star in the Gaia DR2 sample has a distancemeasured by the StarHorse code (Queiroz et al. 2018).
StarHorse uses a Bayesian approach to determine masses,ages, distances and extinctions for field stars through the compar-ison of their observed spectroscopic, photometric and astrometricparameters with those from stellar evolution models. The modelsused were materialized by the PARSEC set of isochrones (Bressanet al. 2012). The code assumes spatial priors for each structuralcomponent of the Galaxy (thin and thick disks, bulge and halo).The priors also assume Gaussian metallicity and age distributionfunctions for each of them. The same prior on the Initial MassFunction (IMF) was assumed as the Chabrier IMF (Chabrier 2003)for all components. Gaussian likelihood functions were generatedusing the available observed parameter set and their associated un-certainties. In the case of Gaia DR2, this set included optical andnear infrared (NIR) magnitudes and parallaxes. The code then com-putes the posterior distribution function over distance, marginalizedfor all other parameters. We take the median of this marginalizedposterior as the best distance estimate, while the percentile positionsare taken as the uncertainty.
For DES+VHS+WISE stars, StarHorse was applied only forthose objects close enough to the L or T candidates to be consideredas a potential primary star in a wide binary system, as will bediscussed in the next section. In this case, we use optical and NIRphotometry and parallaxes from Gaia when available.
5 THE SEARCH AND THE BENCHMARK CANDIDATES
We paired L and T candidates to potential primary stars using asearch radius that corresponds to 10000 AU as the distance of theprimary to the secondary. We choose this physical separation forwide binary systems, following Marocco et al. (2017). We performthis search for three sets of primaries: i) from the Gaia DR2 catalog,with distances based on StarHorse ; ii) from DES+VHS+WISEcatalog, with photometric distances based on StarHorse ; iii) fromthe L and T candidates themselves. We describe in detail the waythis pairing was done for each set, and also discuss the way chancealignment probabilities were computed in each case.
5.1 Primary stars from Gaia DR2
For the Gaia DR2 stars, we considered the individual StarHorsedistances to each star and the photometric distances for the L and Tcandidates. We define a search radius equal to a distance of 10000AU for the Gaia stars. Using this individual search radius for eachGaia star, we search for possible L or T companions within thisradius. In order to refine our analysis, we also demand that thedistance of the primary and the secondary is within 2σ of eachother. Using this common distance criteria, we ended up with 70candidate pairs as shown in Figure 1. The main characteristics ofthe candidates binary pairs are presented in Table 1, shown entirelyin the Appendix.
For each possible pairs, we first estimate the chance alignmentprobability following an similar procedure used by Smart et al.(2017). The chance alignment probability is the probability that wefind a physically unrelated object with the same common distance
MNRAS 000, 000–000 (2018)
Benchmark L and T dwarfs 46

4 M. Dal Ponte et al.
100 150 200 250 300 350 400 450 500Gaia primary distance [pc]
100
150
200
250
300
350
400
450
500
Bro
wn d
warf
dis
tance
[pc]
Figure 1. The common-distance pair candidates identified using the browndwarf sample and Gaia DR2 stars. The horizontal axis represents the pri-mary distance given by StarHorse and the vertical axis shows the secondaryphotometric distance. The error bars correspond to an uncertainty of 2σ.The uncertainties in the photometric distances of the brown dwarf sampleare usually much larger than those of the Gaia stars, which are based onmeasured parallaxes.
within our uncertainties. For Gaia, we also considered a secondapproach using simulated data instead of Gaia catalog itself. Weaim to compare this to different approaches, since for the samplethat we will present in Section 5.2 and Section 5.3 we will rely onlyon simulations.
For each L or T with a matched Gaia primary candidate, weselected stars within a area of 2 deg2, using the Gaia catalog itself.We then randomly selected half of the stars within this area and de-manded that the distances of brown dwarf and the random star wereagain within 2σ of each other. We did not include the primary can-didate in this random sampling. We calculate the fraction N/M ofsuch common distance stars, where N is the number of stars whichhave the common distance with the L or T candidate andM is the to-tal number of randomly selected stars. This is the chance alignmentprobability for a single pair event. We thus multiply the result bythe total number of stars within the search radius to obtain the totalchance alignment probability for the given L or T candidate. We didnot include the Gaia primary candidate in this multiplying factor.In most cases, it was the only object within the search radius, whichexplains why most of the probabilities are zero. We considered aschance alignments contamination every pair that has a probabilitylarger than 5%. Chance alignment are computed for each candidatesystem and can be found in Table 1.
We also considered a second approach to obtain the chancealignment contamination. We simulate stars within a 2 deg2 fromthe L or T candidate using Trilegal (Girardi et al. 2005). TheTrilegal simulated stars have a distance modulus without anyuncertainty. In order to mimic an uncertainty in their distances, weuse the uncertainty computed by StarHorse for the Gaia DR2 starwhose distance is closest to that of the simulated Trilegal star. Wethus assume that the uncertainty in distance for the simulated starsfollows the same distribution as computed by StarHorse for realstars. The procedure to compute the chance alignment probabilityis then similar to that based on the actual distribution of Gaia DR2stars around the brown dwarf candidates. We compute the fractionof simulated stars that lie within the common distance range at 2σ
100 200 300 400 500 600DES primary distance [pc]
100
200
300
400
500
600
Bro
wn d
warf
dis
tance
[pc]
Figure 2. The common-distance pair candidates identified using the browndwarf sample and DES stars. The horizontal axis represents the primaryphotometric distance given by StarHorse and the vertical axis shows thebrown dwarf photometric distance. In this case, we suppress the error barsfor each pair due to the number of sources showing only an average error.
and then obtain the probability over all stars within the search radiusby making an area normalization.
5.2 Primary stars from DES DR1
We search for primary stars using DES+VHS+WISE data. In thiscase, the search radius corresponds to 10000 AU at the lower dis-tance limit for the L or T dwarf. We adopt this threshold because wedo not have the distances for the entire DES catalog. In this case,a possible large uncertainty in the brown dwarfs distances, due totheir photometric nature, will result in a larger search radius andcould lead to the inclusion of false positives companions.
As mentioned in the previous section, in this case StarHorsedistances were based on photometric measurements, with additionalconstraint from parallaxes for a small number of DES stars. We thuslook for pairswithin the search radius of eachL or T candidatewhichalso have a distance match within 2σ. This is the same procedureas in the case of the brighter Gaia DR2 primaries. But as we do nothave distances for all stars within 2 deg2 of the L or T candidate,we cannot use the DES+VHS+WISE catalog itself to estimate thechance alignment probability as we did previously. We are thusforced to rely exclusively on Trilegal simulations.
The procedure is the same as described in Section 5.1. Weassign distance uncertainties to the simulated stars using the closestDES+VHS+WISE star and then require that the distances of the Lor T candidate and the simulated star lie within 2σ of each other.Thenwe obtain the probability over all stars within the search radius.Also, for DES stars, we randomly selected 10000 stars to obtain theprobability since all the simulated areas have more than ∼ 20000stars.
We found a total of 132 possible pairs involving aDES+VHS+WISE primary and an L or T as a secondary, as shownthe Figure 2. The characteristics are presented in Table 2, shownentirely in the Appendix.
MNRAS 000, 000–000 (2018)
Benchmark L and T dwarfs 47

L and T dwarfs wide binaries from the Dark Energy Survey DR1 and Gaia DR2 data 5
50 100 150 200 250 300 350 400 450Brown dwarf distance [pc]
50
100
150
200
250
300
350
400
450
Bro
wn d
warf
dis
tance
[pc]
Figure 3. The common-distance for the brown dwarfs binary candidatesidentified. The horizontal and vertical axis show the brown dwarf photomet-ric distance and the error bars correspond to an uncertainty of 2σ.
5.3 Wide binaries involving two brown dwarfs
We also used the L and T candidates sample to search for binariesamong themselves. Again, we compute a search radius for each Lor T dwarf and check if another brown dwarf appears inside thisindividual radius.Wewere able to identify 9 possible pairs as shownin Figure 3. The information about these possible binary pairs arepresented in Table 1.
To obtain the chance alignment probability we used theGalmodBD simulation code presented inCarneroRosell et al. (2019),which computes expected Galactic counts of L and T dwarfs as afunction of magnitude, colour and direction on the sky. GalmodBDalso creates synthetic samples of brown dwarfs based on the ex-pected number counts for a given footprint, using empirically deter-mined space densities of objects, absolute magnitudes and coloursas a function of spectral type. For the current purpose, we com-puted the expected number of L and T dwarfs in a given directionand within the volume bracketed by the common range of distancesand by the area within the angular separation of each possible pair.In all cases, the probability of chance alignment is < 0.2 %, asshown in Table 1.
6 DISCUSSION
In our search for binary pairs, we end up finding a possible triplesystem, as shown in Figure 5. This candidate triple system wereidentified among the brown dwarf sample along with a DES star.The characteristics of this system are also described in Table 2.
For our pair candidates, we inspected the images to verifyhow they look like. Figure 4 shows a sample of images of selectedbenchmark candidates. All of the images were taken from the DESScience Portal related to the DR1 public release images 2.
Figure 6 shows the projected separation versus the distance ofour candidate sample. Our brown dwarf sample is limited to ∼ 480pc and despite our previous projected separation limit of 10000 AU,we end up having some pairs with a value larger than that limit. Thereason is due to the way we obtain our search radius. We compute a
2 https://des.ncsa.illinois.edu/releases/dr1/dr1-access
search value that corresponds to 10000 AU projected separation atthe lower limit of each star’s distance. We decided to use the lowerdistance to increase the radius search and this option in many casestranslates into a larger projected separation compared to our initiallimit. However, the vast majority of our pair candidates concentratesat a distance range of 200-400 pc and projected separation < 10000AU.
The figure also shows a lower limit in projected separationwhich is related to angular resolution of the DES and Gaia images,especially the former, fromwhich the brown dwarf sample is drawn.Pairs whose angular separation is of the order or lower than the DESseeing limit will be harder to resolve. At a distance of 480 pc a 1.3arcsec resolution limit will translate into a minimum separation of' 620 AU, which is roughly what Figure 6 shows as a lower limit.
The left panel of Figure 7 shows the frequency distributionof L and T spectral types both in our total sample and for ourcandidates of wide binary systems. In both samples, the L0 dwarfsdominate. Even in a deep survey such DES, we are still bound todetect mainly L types at ∼ 500 pc and this selection bias againstlater types clearly appears in the distributions. The right panel showsthe fraction of wide binaries (within the projected separation limitsdiscussed earlier) as a function of spectral type. We observe that thetypical binary fraction is 2-4% over most of the spectral types.
In Table 3 we present the known pairs already published in theliterature that were spectroscopically confirmed and has a browndwarfs as a secondary. In Table 4 we present the common distanceand/or common proper motion pairs identified so far. Using thisinformation, we performed a search between our pair candidates andthe known companions, but neither of the 197 pairs were identifiedamong them. The main reason is because the majority of the knowbinarieswith spectroscopic confirmation are unresolved binary pairswith a small projected separation andwe are not able to resolve them.
We also perform a search using the catalog presented in Dhitalet al. (2011) and Dhital et al. (2015), which contains low mass starswide binaries identified using common distance and/or commonproper motion. In this case, we were able to identify 1 commonobject. In Dhital et al. (2015) this particular system is presentedas an M1+M1 binary pair, but we identified an L0 as a pair of thecomponents, and also a DES star who has the same distance asthis system. This leads us to the possibility of a quadruple systemas illustrate the Figure 8. The objects that constitute this multiplesystem are described in Table 2.
7 SUMMARY AND CONCLUSIONS
Using the Gaia DR2 and DES+VHS+WISE data along with oursample of L and T candidates from Carnero Rosell et al. (2019), weidentified 197 newwide binary candidates. The projected separationspreads from 600 . dp . 10000 AU projected separations. Ourcandidates were selected based on common distance criteria andwith a chance alignment probability criteria of < 5%. These binaryand multiple system candidates involving substellar sources arecrucial as benchmarks to evolutionary models below the hydrogenburning limit since properties such as metallicity and age, as wellas masses, may be obtained for the primaries. The upper limit inprojected distance results from our search strategy, in which weavoided larger separations that are more likely to be affected bycontaminants. The lower limit in separation stems from the typicalresolution of the DES images on which the brown dwarfs sample isbased.
We found 65 pairs with a primary from Gaia DR2 catalogue
MNRAS 000, 000–000 (2018)
Benchmark L and T dwarfs 48

6 M. Dal Ponte et al.
Table 1. The common-distance pair candidates identified among the brown dwarfs sample. In this case, A and B represents a different brown dwarf.
Spectral Type Distance Separation ProbabilityA B A B ["] [AU] [%]
L7 L2 69.5 74.3 131.5 9141.8 0.000T5 T6 56.6 43.5 112.0 6345.8 0.007L0 L0 303.6 286.2 25.6 7777.4 0.115L2 L0 233.1 273.6 29.4 6859.0 0.170L0 L0 371.3 348.5 29.5 10961.6 0.025L4 L5 86.3 113.6 4.0 352.2 0.066L0 L5 46.4 53.7 226.4 10514.6 0.224L0 L0 176.1 180.6 59.1 10411.8 0.020L1 L1 183.5 224.1 37.2 6832.9 0.045
Figure 4. Images of selected benchmark candidates systems. The first row, we present the primary star from Gaia catalog and the L dwarfs as the secondary.The second row, the primary is from DES data and again, the L dwarfs as the secondary. In the last row we present some of the binary pairs composed by twobrown dwarfs. The primary star is identified by an arrow and the brown dwarf by the spectral type.
limited to G < 18, for which distances are estimated from theStarHorse code using constraints from their measured parallaxes.Moreover, 123 of the primaries are in the DES+VHS+WISE sam-ple. These latter tend to be fainter and their StarHorse distancesare based mostly on photometry, although some have Gaia DR2parallax information as well. In addition, we found 9 systems com-
posed by two brown dwarfs. One of the L0+L0 pairs seems to be atriple system for which we separately matched each L0 secondaryto a DES star. Another multiple candidate was found to contain aL0 dwarf associated to a DES star and to an Gaia DR2 M1+M1double found by Dhital et al. (2015), therefore making up a poten-
MNRAS 000, 000–000 (2018)
Benchmark L and T dwarfs 49

L and T dwarfs wide binaries from the Dark Energy Survey DR1 and Gaia DR2 data 7
Table 2. The common-distance multiple systems found in our search. In the first row we present the information of the quadruple system, where A refers to theGaia DR2 star, B to DES star and C to the L0 dwarf. In the second row we present the information of the triple system, where A refers to DES star and B andC to the L0 dwarfs.
Distance Spectral Type ProbabilityA B C [%]
345.5 345.2 285.7 L0 0.000266.7 285.9 278.7 L0 L0 1.069
Figure 5. Image of the possible triple candidate system. The arrow indicatesthe DES star and two brown dwarfs are identified by the spectral type.
0 100 200 300 400 500Distance [pc]
5000
10000
15000
20000
Pro
ject
ed S
epara
tion [
AU
]
Gaia+BDDES+BDBD+BD
Figure 6. Projected pair separation in AU plotted against distance for allcandidates. The colors and different symbols represent the three differentsamples presented previously, as indicated in the upper right corner. The zoneof avoidance at small projected separations is caused by spatial resolutionlimits, while the paucity of pairs with separations larger than 10000 AU isdue to the search method.
8 10 12 14 16 18 20 22 24 26Spectral Type
0.0
0.1
0.2
0.3
0.4
0.5
0.6
0.7
Frequency
BD sampleBD in binaries
10 12 14 16 18 20 22 24 26Spectral Type
0.00
0.02
0.04
0.06
0.08
0.10
Fract
ion o
f bin
ari
es
Figure 7. The left panel shows the total frequency distribution of L and Tdwarfs (black line) and of brown dwarfs in candidate wide binary systems(red line), both as a function of spectral type. The right panel shows theobserved fraction of wide binaries (in the separation range as shown inFigure 6) as a function of spectral type. Spectral type L0-T9 are representedby 10-29.
Figure 8. Image of the binary pair identify by Dhital et al. (2015) along witha common distance L0 and a DES star.
MNRAS 000, 000–000 (2018)
Benchmark L and T dwarfs 50

8 M. Dal Ponte et al.
tial quadruple system. We found in total 199 independent multiplesystem candidates.
About 67% of our brown dwarfs found in binary or multiplesystems are of the L0 type. Still they make up only ' 2% of the totalsample of L0 by Carnero Rosell et al. (2019). The typical binaryfraction over all spectral types ranges from 2 − 4% in the projectedseparation range covered by this work.
ACKNOWLEDGMENTS
Funding for the DES Projects has been provided by the U.S. Depart-ment of Energy, the U.S. National Science Foundation, the Ministryof Science and Education of Spain, the Science and TechnologyFacilities Council of the United Kingdom, the Higher EducationFunding Council for England, theNational Center for Supercomput-ing Applications at the University of Illinois at Urbana-Champaign,the Kavli Institute of Cosmological Physics at the University ofChicago, the Center for Cosmology and Astro-Particle Physics atthe Ohio State University, the Mitchell Institute for FundamentalPhysics and Astronomy at Texas A&M University, Financiadorade Estudos e Projetos, Fundação Carlos Chagas Filho de Amparo àPesquisa do Estado do Rio de Janeiro, Conselho Nacional de Desen-volvimento Científico e Tecnológico and the Ministério da Ciência,Tecnologia e Inovação, the Deutsche Forschungsgemeinschaft andthe Collaborating Institutions in the Dark Energy Survey.
The Collaborating Institutions are Argonne National Labora-tory, the University of California at Santa Cruz, the University ofCambridge, Centro de Investigaciones Energéticas, Medioambien-tales y Tecnológicas-Madrid, the University of Chicago, Univer-sity College London, the DES-Brazil Consortium, the Universityof Edinburgh, the Eidgenössische Technische Hochschule (ETH)Zürich, Fermi National Accelerator Laboratory, the University ofIllinois at Urbana-Champaign, the Institut de Ciències de l’Espai(IEEC/CSIC), the Institut de Física d’Altes Energies, LawrenceBerkeley National Laboratory, the Ludwig-Maximilians UniversitätMünchen and the associated Excellence Cluster Universe, the Uni-versity of Michigan, the National Optical Astronomy Observatory,the University of Nottingham, The Ohio State University, the Uni-versity of Pennsylvania, the University of Portsmouth, SLAC Na-tional Accelerator Laboratory, Stanford University, the Universityof Sussex, Texas A&M University, and the OzDES MembershipConsortium.
Based in part on observations at Cerro Tololo Inter-AmericanObservatory, NationalOptical AstronomyObservatory, which is op-erated by the Association of Universities for Research in Astronomy(AURA) under a cooperative agreement with the National ScienceFoundation.
The DES data management system is supported by the Na-tional Science Foundation under Grant Numbers AST-1138766and AST-1536171. The DES participants from Spanish institu-tions are partially supported by MINECO under grants AYA2015-71825, ESP2015-66861, FPA2015-68048, SEV-2016-0588, SEV-2016-0597, and MDM-2015-0509, some of which include ERDFfunds from the European Union. IFAE is partially funded by theCERCA program of the Generalitat de Catalunya. Research leadingto these results has received funding from the European ResearchCouncil under the European Union’s Seventh Framework Program(FP7/2007-2013) includingERCgrant agreements 240672, 291329,and 306478.We acknowledge support from the Australian ResearchCouncil Centre of Excellence for All-sky Astrophysics (CAAS-TRO), through project number CE110001020, and the Brazilian In-
stituto Nacional de Ciência e Tecnologia (INCT) e-Universe (CNPqgrant 465376/2014-2).
This manuscript has been authored by Fermi Research Al-liance, LLC under Contract No. DE-AC02-07CH11359 with theU.S. Department of Energy, Office of Science, Office of High En-ergy Physics. The United States Government retains and the pub-lisher, by accepting the article for publication, acknowledges thatthe United States Government retains a non-exclusive, paid-up, ir-revocable, world-wide license to publish or reproduce the publishedform of this manuscript, or allow others to do so, for United StatesGovernment purposes.
This publication makes use of data products from the Wide-field Infrared Survey Explorer, which is a joint project of the Uni-versity of California, Los Angeles, and the Jet Propulsion Labo-ratory/California Institute of Technology, and NEOWISE, whichis a project of the Jet Propulsion Laboratory/California Instituteof Technology. WISE and NEOWISE are funded by the NationalAeronautics and Space Administration.
The analysis presented here is based on observations obtainedas part of the VISTA Hemisphere Survey, ESO Programme, 179.A-2010 (PI: McMahon).
This paper has gone through internal review by the DES col-laboration.
ACR acknowledges financial support provided by the PAPDRJCAPES/FAPERJ Fellowship and by “Unidad de Excelencia Maríade Maeztu de CIEMAT - Física de Partículas (Proyecto MDM)".
REFERENCESAbazajian K. N., et al., 2009, ApJS, 182, 543Abbott T. M. C., et al., 2018, ApJS, 239, 18Anderson E., Francis C., 2012, Astronomy Letters, 38, 331Bailey V., et al., 2014, ApJ, 780, L4Bechtol K., et al., 2015, ApJ, 807, 50Billères M., Delfosse X., Beuzit J.-L., Forveille T., Marchal L., Martín E. L.,
2005, A&A, 440, L55Bouy H., Brandner W., Martín E. L., Delfosse X., Allard F., Basri G., 2003,
AJ, 126, 1526Bowler B. P., Liu M. C., Cushing M. C., 2009, ApJ, 706, 1114Bowler B. P., Liu M. C., Shkolnik E. L., Tamura M., 2012, ApJ, 756, 69Bressan A., Marigo P., Girardi L., Salasnich B., Dal Cero C., Rubele S.,
Nanni A., 2012, MNRAS, 427, 127Burgasser A. J., et al., 2000, ApJ, 531, L57Burgasser A. J., Reid I. N., Leggett S. K., Kirkpatrick J. D., Liebert J.,
Burrows A., 2005, ApJ, 634, L177Burningham B., et al., 2009, MNRAS, 395, 1237Burningham B., et al., 2010, MNRAS, 404, 1952Burningham B., et al., 2013, Monthly Notices of the Royal Astronomical
Society, 433, 457Caballero J. A., 2007, ApJ, 667, 520Carlstrom J. E., et al., 2011, PASP, 123, 568Carnero Rosell A., et al., 2019, arXiv e-prints, p. arXiv:1903.10806Casagrande L., Schönrich R., Asplund M., Cassisi S., Ramírez I., Meléndez
J., Bensby T., Feltzing S., 2011, A&A, 530, A138Chabrier G., 2003, Publications of the Astronomical Society of the Pacific,
115, 763Chauvin G., et al., 2005, A&A, 438, L29Close L. M., Siegler N., Freed M., Biller B., 2003, ApJ, 587, 407Crepp J. R., Gonzales E. J., Bechter E. B., Montet B. T., Johnson J. A.,
Piskorz D., Howard A. W., Isaacson H., 2016, ApJ, 831, 136Currie T., Burrows A., Daemgen S., 2014, ApJ, 787, 104Dalton G. B., et al., 2006, in Society of Photo-Optical Instrumentation En-
gineers (SPIE) Conference Series. p. 62690X, doi:10.1117/12.670018Day-Jones A. C., et al., 2011, MNRAS, 410, 705
MNRAS 000, 000–000 (2018)
Benchmark L and T dwarfs 51

L and T dwarfs wide binaries from the Dark Energy Survey DR1 and Gaia DR2 data 9
De Rosa R. J., et al., 2015, ApJ, 814, L3Deacon N. R., et al., 2012a, ApJ, 755, 94Deacon N. R., et al., 2012b, ApJ, 757, 100Deacon N. R., et al., 2014, ApJ, 792, 119Desai S., et al., 2012, ApJ, 757, 83Dhital S., Burgasser A. J., Looper D. L., Stassun K. G., 2011, AJ, 141, 7Dhital S., West A. A., Stassun K. G., Schluns K. J., Massey A. P., 2015, AJ,
150, 57Drlica-Wagner A., et al., 2015, ApJ, 813, 109Dupuy T. J., Liu M. C., 2012, Apjs, 201, 19Epchtein N., et al., 1997, The Messenger, 87, 27Faherty J. K., Burgasser A. J., West A. A., Bochanski J. J., Cruz K. L., Shara
M. M., Walter F. M., 2010, AJ, 139, 176Flaugher B., et al., 2015, AJ, 150, 150Forveille T., et al., 2004, A&A, 427, L1Gaia Collaboration Brown A. G. A., Vallenari A., Prusti T., de Brui-
jne J. H. J., Babusiaux C., Bailer-Jones C. A. L., 2018, preprint,(arXiv:1804.09365)
Gálvez-Ortiz M. C., Solano E., Lodieu N., Aberasturi M., 2017, MNRAS,466, 2983
Gauza B., Béjar V. J. S., Pérez-Garrido A., Rosa Zapatero OsorioM., LodieuN., Rebolo R., Pallé E., Nowak G., 2015, ApJ, 804, 96
Girardi L., Groenewegen M. A. T., Hatziminaoglou E., da Costa L., 2005,A&A, 436, 895
Gizis J. E., Monet D. G., Reid I. N., Kirkpatrick J. D., Burgasser A. J., 2000,MNRAS, 311, 385
Gizis J. E., Kirkpatrick J. D., Wilson J. C., 2001, AJ, 121, 2185Goldman B., Marsat S., Henning T., Clemens C., Greiner J., 2010, MNRAS,
405, 1140Golimowski D. A., et al., 2004, AJ, 128, 1733Gomes J. I., et al., 2013, MNRAS, 431, 2745Henden A., Munari U., 2014, Contributions of the Astronomical Observa-
tory Skalnate Pleso, 43, 518Kirkpatrick J. D., Allard F., Bida T., Zuckerman B., Becklin E. E., Chabrier
G., Baraffe I., 1999, ApJ, 519, 834Kirkpatrick J. D., et al., 2000, AJ, 120, 447Kirkpatrick J. D., et al., 2011, The Astrophysical Journal Supplement Series,
197, 19Kraus A. L., Ireland M. J., Cieza L. A., Hinkley S., Dupuy T. J., Bowler
B. P., Liu M. C., 2014, ApJ, 781, 20Lafrenière D., et al., 2007, ApJ, 670, 1367Lafrenière D., Jayawardhana R., van Kerkwijk M. H., 2008, ApJ, 689, L153Lagrange A. M., et al., 2010, Science, 329, 57Lawrence A., et al., 2007, Monthly Notices of the Royal Astronomical
Society, 379, 1599Loutrel N. P., Luhman K. L., Lowrance P. J., Bochanski J. J., 2011, ApJ,
739, 81Lowrance P. J., Becklin E. E., Schneider G., NICMOS IDT/EONS Team
STIS/8176 Team 2000, in American Astronomical Society MeetingAbstracts. p. 52.03
Luhman K. L., et al., 2007, ApJ, 654, 570Luhman K. L., Burgasser A. J., Bochanski J. J., 2011, ApJ, 730, L9Luhman K. L., et al., 2012, ApJ, 760, 152Luque E., et al., 2017, MNRAS, 468, 97Mace G. N., et al., 2013, ApJ, 777, 36Mainzer A., et al., 2011, ApJ, 731, 53Marocco F., et al., 2017, MNRAS, 470, 4885Marois C., Macintosh B., Barman T., Zuckerman B., Song I., Patience J.,
Lafrenière D., Doyon R., 2008, Science, 322, 1348Martin E. L., Brandner W., Basri G., 1999, Science, 283, 1718McCaughrean M. J., Close L. M., Scholz R. D., Lenzen R., Biller B.,
Brandner W., Hartung M., Lodieu N., 2004, A&A, 413, 1029McMahonR. G., BanerjiM., Gonzalez E., Koposov S. E., Bejar V. J., Lodieu
N., Rebolo R., VHS Collaboration 2013, The Messenger, 154, 35Metchev S. A., Hillenbrand L. A., 2004, ApJ, 617, 1330Metchev S. A., Hillenbrand L. A., 2006, ApJ, 651, 1166Morganson E., et al., 2018, PASP, 130, 074501
Mugrauer M., Seifahrt A., Neuhäuser R., Mazeh T., 2006, MNRAS, 373,L31
Mugrauer M., Neuhäuser R., Mazeh T., 2007, A&A, 469, 755Murray D. N., et al., 2011, MNRAS, 414, 575Mužić K., et al., 2012, AJ, 144, 180Naud M.-E., et al., 2014, ApJ, 787, 5Neuhäuser R., Guenther E. W., Wuchterl G., Mugrauer M., Bedalov A.,
Hauschildt P. H., 2005, A&A, 435, L13Peretti S., et al., 2018, arXiv e-prints, p. arXiv:1805.05645Phan-Bao N., et al., 2008, MNRAS, 383, 831Pinfield D. J., et al., 2012, MNRAS, 422, 1922Queiroz A. B. A., et al., 2018, MNRAS, 476, 2556Radigan J., Lafrenière D., Jayawardhana R., Doyon R., 2008, ApJ, 689, 471Raghavan D., et al., 2010, ApJS, 190, 1Rebolo R., Zapatero Osorio M. R., Madruga S., Bejar V. J. S., Arribas S.,
Licandro J., 1998, Science, 282, 1309Reid I. N.,Walkowicz L.M., 2006, Publications of the Astronomical Society
of the Pacific, 118, 671Reylé C., et al., 2013, Memorie della Societa Astronomica Italiana, 84, 1050Scholz R. D., 2010a, A&A, 510, L8Scholz R. D., 2010b, A&A, 515, A92Scholz R.-D., 2016, A&A, 587, A51Scholz R. D., McCaughrean M. J., Lodieu N., Kuhlbrodt B., 2003, A&A,
398, L29Seifahrt A., Guenther E., Neuhäuser R., 2005, A&A, 440, 967Skrutskie M. F., et al., 2006, AJ, 131, 1163Skrzypek N., Warren S. J., Faherty J. K., Mortlock D. J., Burgasser A. J.,
Hewett P. C., 2015, A&A, 574, A78Skrzypek N., Warren S. J., Faherty J. K., 2016, A&A, 589, A49Smart R. L.,Marocco F., Caballero J. A., JonesH. R. A., BarradoD., Beamín
J. C., Pinfield D. J., Sarro L. M., 2017, MNRAS, 469, 401Smith L. C., et al., 2015, MNRAS, 454, 4476Sorahana S., Nakajima T., Matsuoka Y., 2018, preprint,
(arXiv:1811.07496)Steele P. R., BurleighM. R., Farihi J., Gänsicke B. T., Jameson R. F., Dobbie
P. D., Barstow M. A., 2009, A&A, 500, 1207Tokovinin A., Lépine S., 2012, AJ, 144, 102Wilson J. C., Kirkpatrick J. D., Gizis J. E., Skrutskie M. F., Monet D. G.,
Houck J. R., 2001, AJ, 122, 1989Wright E. L., et al., 2010, AJ, 140, 1868York D. G., et al., 2000, AJ, 120, 1579Zhang Z. H., et al., 2010, MNRAS, 404, 1817ZuckermanB., Becklin E., 1988, International Astronomical UnionCircular,
4652, 3Zuckerman B., Song I., 2009, A&A, 493, 1149
MNRAS 000, 000–000 (2018)
Benchmark L and T dwarfs 52
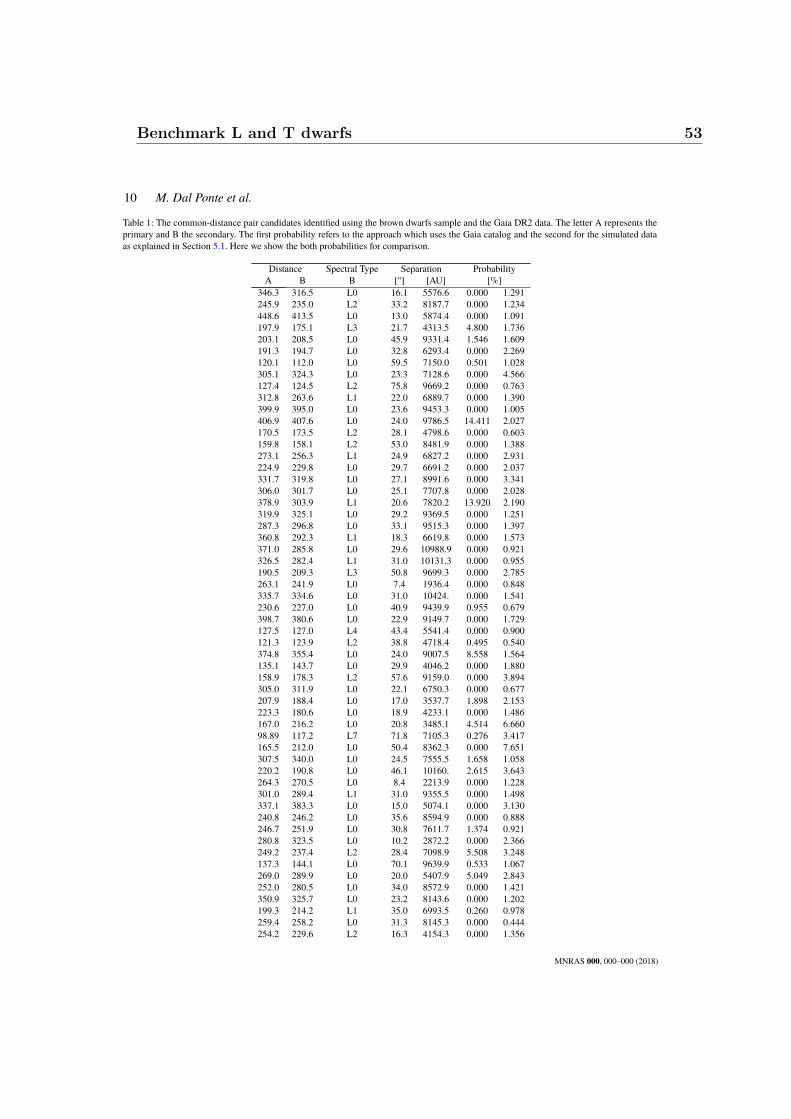
10 M. Dal Ponte et al.
Table 1: The common-distance pair candidates identified using the brown dwarfs sample and the Gaia DR2 data. The letter A represents theprimary and B the secondary. The first probability refers to the approach which uses the Gaia catalog and the second for the simulated dataas explained in Section 5.1. Here we show the both probabilities for comparison.
Distance Spectral Type Separation ProbabilityA B B ["] [AU] [%]
346.3 316.5 L0 16.1 5576.6 0.000 1.291245.9 235.0 L2 33.2 8187.7 0.000 1.234448.6 413.5 L0 13.0 5874.4 0.000 1.091197.9 175.1 L3 21.7 4313.5 4.800 1.736203.1 208.5 L0 45.9 9331.4 1.546 1.609191.3 194.7 L0 32.8 6293.4 0.000 2.269120.1 112.0 L0 59.5 7150.0 0.501 1.028305.1 324.3 L0 23.3 7128.6 0.000 4.566127.4 124.5 L2 75.8 9669.2 0.000 0.763312.8 263.6 L1 22.0 6889.7 0.000 1.390399.9 395.0 L0 23.6 9453.3 0.000 1.005406.9 407.6 L0 24.0 9786.5 14.411 2.027170.5 173.5 L2 28.1 4798.6 0.000 0.603159.8 158.1 L2 53.0 8481.9 0.000 1.388273.1 256.3 L1 24.9 6827.2 0.000 2.931224.9 229.8 L0 29.7 6691.2 0.000 2.037331.7 319.8 L0 27.1 8991.6 0.000 3.341306.0 301.7 L0 25.1 7707.8 0.000 2.028378.9 303.9 L1 20.6 7820.2 13.920 2.190319.9 325.1 L0 29.2 9369.5 0.000 1.251287.3 296.8 L0 33.1 9515.3 0.000 1.397360.8 292.3 L1 18.3 6619.8 0.000 1.573371.0 285.8 L0 29.6 10988.9 0.000 0.921326.5 282.4 L1 31.0 10131.3 0.000 0.955190.5 209.3 L3 50.8 9699.3 0.000 2.785263.1 241.9 L0 7.4 1936.4 0.000 0.848335.7 334.6 L0 31.0 10424. 0.000 1.541230.6 227.0 L0 40.9 9439.9 0.955 0.679398.7 380.6 L0 22.9 9149.7 0.000 1.729127.5 127.0 L4 43.4 5541.4 0.000 0.900121.3 123.9 L2 38.8 4718.4 0.495 0.540374.8 355.4 L0 24.0 9007.5 8.558 1.564135.1 143.7 L0 29.9 4046.2 0.000 1.880158.9 178.3 L2 57.6 9159.0 0.000 3.894305.0 311.9 L0 22.1 6750.3 0.000 0.677207.9 188.4 L0 17.0 3537.7 1.898 2.153223.3 180.6 L0 18.9 4233.1 0.000 1.486167.0 216.2 L0 20.8 3485.1 4.514 6.66098.89 117.2 L7 71.8 7105.3 0.276 3.417165.5 212.0 L0 50.4 8362.3 0.000 7.651307.5 340.0 L0 24.5 7555.5 1.658 1.058220.2 190.8 L0 46.1 10160. 2.615 3.643264.3 270.5 L0 8.4 2213.9 0.000 1.228301.0 289.4 L1 31.0 9355.5 0.000 1.498337.1 383.3 L0 15.0 5074.1 0.000 3.130240.8 246.2 L0 35.6 8594.9 0.000 0.888246.7 251.9 L0 30.8 7611.7 1.374 0.921280.8 323.5 L0 10.2 2872.2 0.000 2.366249.2 237.4 L2 28.4 7098.9 5.508 3.248137.3 144.1 L0 70.1 9639.9 0.533 1.067269.0 289.9 L0 20.0 5407.9 5.049 2.843252.0 280.5 L0 34.0 8572.9 0.000 1.421350.9 325.7 L0 23.2 8143.6 0.000 1.202199.3 214.2 L1 35.0 6993.5 0.260 0.978259.4 258.2 L0 31.3 8145.3 0.000 0.444254.2 229.6 L2 16.3 4154.3 0.000 1.356
MNRAS 000, 000–000 (2018)
Benchmark L and T dwarfs 53

L and T dwarfs wide binaries from the Dark Energy Survey DR1 and Gaia DR2 data 11
Table 1 – continued from previous pageDistance Spectral Type Separation ProbabilityA B B ["] [AU] [%]
242.2 245.4 L1 15.1 3660.1 0.000 1.598353.5 329.6 L0 23.7 8396.3 0.000 0.963347.7 314.8 L0 28.0 9738.7 0.000 0.727352.7 269.3 L0 14.7 5207.9 0.000 2.121124.1 130.4 L0 58.7 7299.0 0.375 1.903253.1 248.7 L0 30.9 7839.6 0.000 0.662372.7 304.2 L1 26.5 9915.6 0.000 2.989340.2 331.4 L0 13.3 4527.9 0.000 1.152316.5 327.0 L0 35.4 11209. 0.000 1.407178.7 203.4 L0 49.3 8826.3 0.000 1.689357.8 393.0 L0 25.3 9078.7 0.000 2.072473.2 425.8 L0 10.9 5159.9 0.000 1.138174.0 167.0 L3 21.4 3727.1 4.680 3.186196.3 223.8 L1 43.0 8441.9 0.000 0.967
MNRAS 000, 000–000 (2018)
Benchmark L and T dwarfs 54

12 M. Dal Ponte et al.
Table 2: The common-distance pair candidates identified using the brown dwarfs sample and the DES data. The letter A represents the primaryand B the secondary. The primary with a measure parallax from Gaia are marked with an asterisk. In this case, we only have the probabilitymeasured with simulated data.
Distance Spectral Type Separation ProbabilityA B B ["] [AU] [%]393.1* 369.2 L0 14.1 5580.9 1.029354.0 329.7 L1 20.8 7388.5 2.111375.2* 264.9 L0 26.6 10017.5 1.234404.0* 342.2 L1 19.4 7876.3 1.664507.9 337.6 L0 26.7 13582.5 2.832310.0* 312.8 L0 28.3 8782.0 1.400194.6 189.6 L0 38.4 7480.2 1.767349.1 288.6 L2 27.6 9637.1 2.004256.3 330.8 L0 29.4 7540.8 0.927271.9* 293.6 L0 15.5 4236.3 0.932265.0* 257.6 L0 37.6 9985.5 1.665304.2* 302.6 L0 7.50 2281.8 1.291199.0 258.7 L1 25.3 5052.2 1.804209.3 212.1 L0 41.1 8623.1 0.933519.3* 416.0 L0 22.4 11653.1 1.150258.2 200.5 L2 24.8 6406.9 3.549261.8* 221.9 L0 19.8 5208.4 1.464358.1* 306.2 L0 22.7 8145.1 2.063332.1* 340.1 L0 35.9 11947.5 3.407456.1* 293.6 L0 34.5 15750.8 1.440428.2* 382.6 L0 22.1 9478.8 1.025353.6* 311.6 L1 37.3 13204.7 3.019338.6* 304.6 L1 6.75 2286.5 1.876405.2* 348.7 L0 25.2 10242.9 1.921274.5* 244.7 L0 25.2 6937.6 1.785418.2 222.5 L0 40.7 17055.5 1.219352.1* 342.0 L0 10.0 3551.6 1.248320.8* 287.3 L0 24.0 7711.3 2.822371.1* 299.9 L1 30.4 11292.9 3.688411.3* 341.1 L0 16.4 6768.4 2.386173.1 246.3 L2 36.4 6315.2 3.267363.2* 360.1 L0 15.6 5675.3 0.838522.3 230.8 L3 34.9 18240.6 3.097452.4* 386.5 L0 14.0 6336.2 2.011296.0 184.6 L1 48.2 14276.5 0.852256.5* 259.2 L1 55.1 14150.9 7.084301.3 282.5 L0 38.0 11479.2 1.914252.4 333.2 L0 28.4 7174.5 4.984233.9* 267.5 L0 39.9 9344.5 2.457473.5 339.0 L0 30.0 14214.9 0.985372.5* 411.6 L0 10.5 3937.0 1.031401.4 423.6 L0 31.2 12544.7 4.612265.1 325.1 L0 35.7 9489.9 2.541338.3* 297.8 L1 23.6 8017.0 2.418356.0* 349.0 L0 11.6 4144.8 1.252213.4* 219.4 L2 40.8 8720.8 1.461131.9* 124.2 L3 33.4 4407.6 1.866458.8* 429.1 L0 17.7 8132.4 2.529419.8 426.0 L0 11.1 4668.6 0.893278.7 246.7 L0 40.1 11183.3 2.197319.7* 281.6 L1 32.0 10242.5 2.074334.5* 289.6 L1 18.2 6096.0 2.298430.1* 405.3 L0 19.7 8493.2 0.937213.0 205.1 L0 51.0 10872.1 1.184221.1 210.8 L0 27.8 6164.3 1.334302.2 319.9 L1 20.3 6143.3 2.335
MNRAS 000, 000–000 (2018)
Benchmark L and T dwarfs 55

L and T dwarfs wide binaries from the Dark Energy Survey DR1 and Gaia DR2 data 13
Table 2 – continued from previous pageDistance Spectral Type Separation Probability
B B ["] [AU] [%]476.9* 451.5 L0 25.9 12388.4 2.703302.0* 322.7 L1 29.2 8820.5 1.203312.0 229.3 L1 51.3 16040.6 3.230367.1* 415.9 L0 7.60 2793.2 1.168557.6 281.0 L0 44.1 24611.5 5.234365.8* 349.9 L0 31.9 11699.5 2.772179.7* 233.0 L1 53.1 9548.4 4.232332.1* 298.3 L0 20.9 6971.5 1.357391.7* 360.8 L0 32.8 12852.8 2.439443.4* 406.9 L0 19.8 8796.2 1.044215.6 238.0 L0 33.8 7297.7 1.345328.8 384.3 L0 9.02 2967.3 0.770340.1* 330.3 L0 17.3 5901.3 2.159510.7* 400.3 L0 16.0 8173.0 4.913341.5* 348.6 L0 34.2 11681.9 3.957306.2* 334.4 L0 18.9 5794.3 1.279383.0 347.8 L0 31.0 11904.5 2.951294.6* 277.0 L0 27.4 8098.0 2.290340.2* 323.0 L0 26.1 8913.1 1.537396.9* 419.6 L0 8.59 3411.7 2.576151.0* 143.9 L2 47.2 7135.8 3.944551.3* 439.2 L0 5.76 3176.2 6.117425.6* 334.4 L0 37.2 15857.2 8.824396.0* 311.8 L1 40.2 15942.1 4.144449.2* 343.5 L0 26.2 11774.7 5.375281.8* 279.5 L1 27.1 7641.8 1.100244.8* 218.1 L0 29.1 7146.3 2.801236.7 260.3 L0 43.2 10236.6 2.585318.2* 310.8 L0 30.4 9681.7 1.645381.2* 270.4 L0 29.9 11415.3 4.613331.3* 277.8 L0 25.4 8423.1 2.816271.5* 314.9 L0 36.8 9997.1 4.793478.0* 403.4 L0 11.3 5402.5 2.208407.2* 311.9 L0 13.8 5632.0 1.101541.9* 373.7 L0 27.5 14937.1 1.653424.3* 364.4 L0 29.7 12638.8 1.481251.1* 260.0 L0 29.8 7492.0 1.211123.5 124.8 L2 13.2 1631.7 3.248240.4 228.0 L2 19.3 4640.8 1.939263.3 238.1 L1 44.6 11761.3 1.776408.1* 395.9 L0 10.6 4352.8 1.214365.6* 266.8 L2 29.3 10743.4 2.042311.7* 284.5 L1 31.2 9735.7 0.664116.8 120.6 L2 65.1 7608.7 2.009351.5* 325.3 L0 16.9 5969.2 3.720466.6* 322.1 L1 35.8 16713.7 5.284314.7* 331.9 L0 15.7 4962.0 3.528335.9* 276.7 L0 26.6 8955.2 4.007178.3 214.7 L2 27.3 4886.8 2.614217.8* 233.9 L0 41.9 9137.4 2.084246.7 253.5 L0 32.3 7972.7 1.918265.9* 289.7 L0 26.8 7128.9 2.236237.4* 224.0 L0 30.4 7237.4 2.113485.0 338.1 L0 7.23 3511.5 1.838234.9 259.7 L2 47.0 11050.3 6.546340.1* 291.2 L0 22.4 7651.4 3.092478.4* 395.6 L0 26.0 12462.2 2.073254.2* 222.7 L1 19.8 5037.6 2.979149.8* 155.8 L0 12.6 1901.5 1.434
MNRAS 000, 000–000 (2018)
Benchmark L and T dwarfs 56

14 M. Dal Ponte et al.
Table 2 – continued from previous pageDistance Spectral Type Separation Probability
B B ["] [AU] [%]563.0* 383.5 L0 28.7 16190.5 4.821545.5* 390.0 L0 30.3 16569.9 8.411494.6* 315.8 L0 24.9 12341.2 3.360296.7* 315.6 L0 26.4 7836.7 1.669325.5 243.2 L2 44.0 14342.8 2.715341.9* 311.3 L1 19.1 6565.0 1.659384.4 323.8 L0 23.5 9051.1 3.003263.4* 277.6 L1 27.5 7259.7 2.475423.9* 412.6 L0 13.3 5661.6 0.973275.7* 241.9 L0 38.5 10637.9 2.006504.5* 345.4 L1 19.4 9791.4 3.295293.5* 289.3 L0 5.38 1581.1 0.914250.6* 226.5 L1 13.0 3266.1 1.573451.5* 387.2 L0 20.1 9091.2 1.472268.9 307.7 L1 22.3 6007.1 7.398369.8 287.7 L1 33.6 12432.4 1.169136.2 130.9 L5 52.3 7126.7 1.753
MNRAS 000, 000–000 (2018)
Benchmark L and T dwarfs 57

L and T dwarfs wide binaries from the Dark Energy Survey DR1 and Gaia DR2 data 15
Table 3: Known objects that are spectroscopically confirmed companions. Based on Table 12 from Deacon et al. (2014).
Object Separation Spectral Type Spectral Type Companion Mass Age References[AU] ["] Companion Primary M [Gyr]
HD65216B 7.00 253 M7+L2 G5 0.09 3-6 1G 239-25 2.80 30 L0 M3 - 2.1-7.2 2,3,4DENIS 0551-4434B 2.20 220 L0 M8.5 0.06 0.1-10 5Denis-PJ1347-7610B 16.80 418 L0 M0 - 0.2-1.4 6HD89744B 63.00 2460 L0 F7 0.077-0.080 1.5-3 7NLTT2274B 23.00 483 L0 M4 0.081-0.083 4.5-10.0 8LP312-49B 15.40 801 L0 M4 - - 9SDSSJ130432.93+090713.7B 7.60 374 L0 M4.5 - - 9SDSSJ163814.32+321133.5B 46.00 2420 L0 M4 - - 91RXSJ235133.3+312720B 2.40 120 L0 M2 0.026-0.038 0.05-0.15 102MASS 12593933+0651255 23.86 1110 L0 M8 0.21 0.5 112MASS 09411195+3315060 7.44 244 L0 M5 0.23 < 10 11HIP 2397 B 117.1 3970 L0.5 K5 - 0.3-2.5 12HD 253662 B 20.1 > 1 L0.5 G8IV - 0.3 12HIP 59933 B 38.10 2170 L1 F8 - 0.5 12HIP 63506 B 132.8 5640 L1 M0 - 0.0017-0.025 12HIP 6407 B 44.90 2570 L1+T3 G5 - - 12η TelB 4.20 190 L1 A0V 0.04 0.6-2 13LP213-68Bb 14.00 230 L1 M6.5 0.068-0.090 ∼0.03 14,15GJ1048B 11.90 250 L1 K2 0.055-0.075 0.5-0.8 16ABPicB 5.50 275 L1 K2 0.01 - 17G124-62Ba 44.00 1496 L1+L1 dM4.5e 0.054-0.082 <0.002 18HD 16270 11.90 254 L1 K3.5 - 0.0015-0.003 2,16,4GQLupB 0.70 103 L1 K7 0.010-0.020 < 10 19ROX42Bb 1.80 140 L1 M1 0.006-0.014 0.1 20,21LSPM J0241+2553 B 31.20 2153 L1 WD - 0.2 12HIP 112422 B 16.0 1040 L1.5 K2 - 0.3 12LSPM J0632+5053 B 47.4 4499 L1.5 G2 - 0.3 12PMI 13518+4157 B 21.6 613 L1.5 M2.5 - 0.3 12NLTT 44368 B 90.2 7760 L1.5 M3 - 0.37-0.5 12PM 122118-1005 B 204.5 8892 L1.5 M2 - 0.3 12β Cir 217.3 6656 L1 A3V 0.056 0.2-10.0 22NLTT 1011 B 58.5 3990 L2 K7 - 1.0-10.0 12G255-24B 38.30 9710 L2 K8 - 0.06-0.3 232MASSJ05254550-7425263B 44.00 2000 L2 M3 0.06-0.075 0.5-12 24G196-3B 16.20 300 L2 M2.5 0.015-0.04 0.013-0.015 25Gl618.1B 35.00 1090 L2.5 M0 0.06-0.079 5.5-8 7HD106906b 7.10 650 L2.5 F5 0.003-0.007 - 26HD221356 452.00 11900 L3 F8 0.072 3.3-5.1 27GD 165 4.00 140 L3 DA ∼0.075 3.0-4.0 28,29G63-33B 66.00 2010 L3 K0 0.079-0.081 2.2-6.1 8G73-26B 73.00 2774 L3 M2 0.079-0.081 0.5-4.7 8,9ηCancriB 164.00 15020 L3.5 K3III 0.063-0.082 0.3 9HD 49197 0.950 44 L4 F5 - 0.3 2,30,31NLTT 26746 B 18.0 661 L4 M4 - 0.05-12.4 12PMI 13410+0542 B 9.4 484 L4 M1 - 1.6-5.3 12GJ 564 2.64 48 L4+L4 F9 - 1.8-3.5 2,32HD 2057 218 9465 L4+L4 F8 0.045-0.083 7.0-12.0 2,8,30G171-58B 218.00 9200 L4 F8 0.077-0.078 2.6-8 8G200-28B 570.00 25700 L4 G5 0.055-0.075 0.010-0.013 8LHS5166B 8.43 160 L4 M4.5 0.009-0.016 1-10 181RXSJ1609-2105b 2.20 330 L4 M0 0.060.075 0.08-0.3 33GJ1001B 18.60 180 L4.5 M4 0.02-0.05 1-5 29,34,35Gl417Bab 90.00 2000 L4.5+L6 G0+G0 0.051-0.074 3.5-10.0 29,36G203-50B 6.40 135 L5.0 M4.5 - - 37GJ499B 516.00 1360 L5 K5+M4 - - 23G259-20B 30.00 650 L5 M2.5 - 0.5 382M1207-39 0.90 46 L5 M8 - 0.3 39
MNRAS 000, 000–000 (2018)
Benchmark L and T dwarfs 58

16 M. Dal Ponte et al.
Table 3 – continued from previous pageObject Separation Spectral Type Spectral Type Companion Mass Age References
[AU] ["] Companion Primary M [Gyr]HD 196180 13.51 907 L5 A3V - 0.3 40NLTT 55219 B 9.7 432 L5.5 M2 - 0.1-0.2 12NLTT 31450 B 12.30 487 L6 M4 0.019-0.025 0.25-0.8 12LP261-75B 13.00 450 L6 M4.5 0.032-0.076 0.15-0.3 412MASSJ01303563-4445411B 3.28 130 L6 M9 0.0112 0.13-0.4 42VHS 1256-1257 8.06 102 L7 M7.5 0.012-0.031 0.6-3.4 43HD203030B 11.00 487 L7.5 G8 0.04-0.074 1-2.5 44Gl337CD 43.00 880 L8+>=L8 G8+K1 0.045-0.075 - 7,45Gl584C 194.00 3600 L8 G1 0.06 1.3-4.3 46PHL 5038 0.94 55 L8 DA 0.045-0.072 2.3 47HD46588B 79.20 1420 L9 F7 0.07 - 48HD 4747 - - L9 - 0.005 - 49,50HR 8799 1.70 68 L A5 ∼0.009 ∼5 51β Pic 0.30 8-15 L A5 0.060-0.073 - 52ε Indi Ba 402.00 1460 T1 K5 0.06-0.07-6. 0.1-0.5 53,542MASSJ111806.99-064007.8B 7.70 650 T2 M4.5 0.012-0.030 0.009-0.013 55HNPegB 43.00 795 T2.5 G0 0.07-0.13 0.3-2.8 56GUPscB 41.97 2000 T3.5 M3 0.018-0.058 4-10 57HIP38939B 88.00 1630 T4.5 K4 0.064-0.075 3.5-10 58LSPMJ1459+0851B 365.00 21500 T4.5 DA 0.068-0.081 1.5-4.9 59LHS2803B 67.60 1400 T5 M4.5 - >1.6 24,60HD118865B 148.00 9200 T5 F5 - - 61HIP73786B 63.80 1230 T6 K5 - 0.5-3.0 62,63LHS302B 265.00 4500 T6 M5 0.02-0.035 2-5 64G204-39B 198.00 2685 T6.5 M3 0.03-0.07 0.7-4.7 8Gl570D 258.00 1500 T7 K4+M1.5+M3 0.018-0.058 ∼10 65HD3651B 43.00 480 T7.5 K0 0.03-0.04 2.3-14.4 56,66SDSSJ1416+30B 9.00 45 T7.5 L6p 0.019-0.047 > 3.5 67,68,69LHS2907B 156.00 2680 T8 G1 - > 2 38,70LHS6176B 52.00 1400 T8 M4 0.020-0.050 < 1.0 38,61Wolf1130B 188.50 3000 T8 sd M1.5+DA 0.005-0.0014 4.0-8.0 71Ross458C 102.00 1162 T8.5 M0.5+M7 0.014-0.038 3.5-6 72ξ UMa E 510.00 4100 T8.5 F9+G0 0.02-0.032 1.2-2 61Wolf940B 32.00 400 T8.5 M4 0.03-0.10 73WD0806-661 130.00 2500 Y0 DQ 74
References: (1) Mugrauer et al. (2007); (2) Anderson & Francis (2012); (3) Forveille et al. (2004); (4) Dupuy & Liu (2012); (5) Billèreset al. (2005); (6) Phan-Bao et al. (2008); (7) Wilson et al. (2001); (8) Faherty et al. (2010); (9) Zhang et al. (2010); (10) Bowler et al. (2012);(11) Gálvez-Ortiz et al. (2017); (12) Deacon et al. (2014); (13) Lowrance et al. (2000); (14) Gizis et al. (2000); (15) Close et al. (2003);(16) Gizis et al. (2001); (17) Chauvin et al. (2005); (18) Seifahrt et al. (2005); (19) Neuhäuser et al. (2005); (20) Kraus et al. (2014); (21)Currie et al. (2014); (22) Smith et al. (2015); (23) Gomes et al. (2013); (24) Mužić et al. (2012); (25) Rebolo et al. (1998); (26) Bailey et al.(2014); (27) Caballero (2007); (28) Zuckerman & Becklin (1988); (29) Kirkpatrick et al. (1999); (30) Casagrande et al. (2011); (31) Metchev& Hillenbrand (2004); (32) Lafrenière et al. (2007); (33) Lafrenière et al. (2008); (34) Golimowski et al. (2004); (35) Martin et al. (1999);(36) Bouy et al. (2003); (37) Radigan et al. (2008); (38) Luhman et al. (2012); (39) Zuckerman & Song (2009); (40) De Rosa et al. (2015);(41) Reid & Walkowicz (2006); (42) Dhital et al. (2011); (43) Gauza et al. (2015); (44) Metchev & Hillenbrand (2006); (45) Burgasser et al.(2005); (46) Kirkpatrick et al. (2000); (47) Steele et al. (2009); (48) Loutrel et al. (2011); (49) Crepp et al. (2016); (50) Peretti et al. (2018);(51) Marois et al. (2008); (52) Lagrange et al. (2010); (53) Scholz et al. (2003); (54) McCaughrean et al. (2004); (55) Reylé et al. (2013);(56) Luhman et al. (2007); (57) Naud et al. (2014); (58) Deacon et al. (2012a); (59) Day-Jones et al. (2011); (60) Deacon et al. (2012b); (61)Burningham et al. (2013); (62) Scholz (2010b); (63) Murray et al. (2011); (64) Kirkpatrick et al. (2011); (65) Burgasser et al. (2000); (66)Mugrauer et al. (2006); (67) Scholz (2010a) ; (68) Burningham et al. (2010); (69) Bowler et al. (2009); (70) Pinfield et al. (2012); (71) Maceet al. (2013); (72) Goldman et al. (2010); (73) Burningham et al. (2009); (74) Luhman et al. (2011).
MNRAS 000, 000–000 (2018)
Benchmark L and T dwarfs 59

L and T dwarfs wide binaries from the Dark Energy Survey DR1 and Gaia DR2 data 17
Table 4. The common-distance and common-proper-motion pair candidates identified in the literature.
Object Separation Distance Sp. Type Sp. Type µα cos δ µδ References[kAU[ [pc[ Companion Primary [mas yr−1] [mas yr−1]
J0223-5815 400 49 ±10 L0 M5 134.0±10 5.0±19 1J1214+3721 153 82 ±17 L0 - -122.6 ±10.6 82.0 ±17 1J0939+3412 156 62 ±10 L0 - -107.1 ±10.4 -64.3 ±12.6 1ULAS J0255+0532 29 140 ±26 L0 F5 28 ±30 40 ±30 2ULAS J0900+2930 16 197 ±37 L0 M3.5 -13 ±10 -27.8 ±8.8 2ULAS J1222+1407 6.7 70 ±13 L0 M4 -74 ±20 -34 ±20 2J0626+0029 252 67 ±14 L0.5 - 84 ±15 -92 ±15 1J1632+3505 2 37 ±8 L0.5 K0 91.6 ±9.7 -65.3 ±11.9 1J2037-4216 270 51 ±10 L1 - 229 ±10 -391 ±10 1ULAS J1217+1427 2.7 216 ±41 L1 F8V -49 ±8.2 -19.7 ±8.5 2ULAS J1330+0914 61 149 ±30 L2 G5 -83 ±37 10 ±37 2HD 3861 B L3.5 F8V -121 ±14 -79 ±13 3J0230-0225 145 33 ±8 L8 K1 -105 ±8 -62.8 ±8.2 1J1244+1232 286 46 ±8 T4 - -104.8 ±8.6 4.5 ±7.3 1J0758+2225 157 27 ±6 T6.5 - 329 ±16.8 51.3 ±14.9 1J1150+0949 211 60 ±27 T6.5 - -107.6 ±17.1 -31.9 ±4.5 1J0915+0531 178 33 ±6 T7 - -95 ±5.5 -57.7 ±4.4 1
References (1) Smart et al. (2017); (2) Marocco et al. (2017); (3) Scholz (2016).
MNRAS 000, 000–000 (2018)
Benchmark L and T dwarfs 60

Chapter 4
Conclusions and Future
Perspectives
In this work we have presented the basic properties of L and T dwarfs and the current
models that try to describe their internal structure and their evolution. We have also
argued about the importance of larger samples of brown dwarfs and of benchmark
systems than those currently available as an important step towards improving their
evolutionary model. Large sample of L and T dwarfs will also provide a more detailed
description of the spatial distribution of these sources and reliable values of the main
parameters of Galactic structure as traced by this population.
In Chapter 2 we presented the selection and spectral classification of a sample
containing 11,745 L and T dwarfs candidates, most of them L dwarfs, located in the
common footprint of DES, VHS and WISE surveys. We also made the first estimate
of the scale height for the L dwarfs, and found hz,thin ∼ 450 pc.
In Chapter 3 we presented the search for benchmarks systems, made up of a L
or T dwarfs orbiting a main sequence star in a wide binary pair. We also searched
for systems constituted by two brown dwarfs. We found 197 new pair candidates
and 2 multiple systems: one seems to be a quadruple and another is a triple. The
vast majority of the binary candidates are made up of L dwarfs. We found a binary
fraction of ' 2 − 4% over all spectral types (L0-T9). This is small compared to
other observational estimates, but one has to keep in mind that in our case, we
only select systems with wide separation (projected separations in the 600− 10, 000
AU), whereas most estimates in the literature involve spectroscopic binaries of much
smaller separations. Dhital et al. (2011) study common distance and proper motion
wide binaries spanning the mid-K to mid-M spectral range and find a similar binary
fraction to ours (1.1%).
61

Conclusions and Future Perspectives 62
Under the assumption that the two (or more) stars were formed from the same
gas cloud, these wide separation binaries and multiples provide means of estimating
the system metallicity and age based on the brighter, and easier to study, primary
star. The small orbital velocities also imply that their physically bound systems
may be more easily identified using common proper motions and radial velocities.
It is worth mention that proper motion measurements are expected to be provided
by the DES collaboration, based on the six year observation baseline of the survey.
For our benchmark systems, we proposed a spectroscopic follow up using both
SOAR and Gemini. From SOAR we are interested in the Gaia DR2 primary star
members of the most probable benchmark candidates. Our goals are to determine
atmospheric parameters (effective temperature and surface gravity) and metallicity.
Combining the spectroscopic parameters with Gaia DR2 parallaxes and available
photometry, we will then improve on the estimated distance of the system and infer
the primary mass and age using the StarHorse code. From Gemini we are interested
on the most probable brown dwarfs candidates of our benchmark candidates, to con-
firm their nature (spectral type), to better constrain their distances and, therefore,
their association to the primary.
We certainly plan to extend the same analyses to the Y5/Y6 DES data, which
will be photometrically deeper, allowing fainter candidates to be probed, and also
leading to more reliable photometry for the current ones. This in turn will lead
to an increase in the number of L and T dwarfs and a better estimate of the scale
height. Their spatial distribution and associated luminosity function may then be
analyzed in separately for each spectral type, at least for the L dwarfs.

References
[1] ABAZAJIAN, K. N., ADELMAN-MCCARTHY, J. K., AGUEROS, M. A., AL-
LAM, S. S., ALLENDE PRIETO, C., AN, D., ANDERSON, K. S. J., AN-
DERSON, S. F., ANNIS, J., BAHCALL, N. A., AL., ET . The Seventh Data
Release of the Sloan Digital Sky Survey. ApJS, v. 182, p. 543–558, June 2009.
[2] ABBOTT, T. M. C., ABDALLA, F. B., ALLAM, S., AMARA, A., ANNIS, J.,
ASOREY, J., AVILA, S., BALLESTER, O., BANERJI, M., BARKHOUSE,
W., BARUAH, L., BAUMER, M., BECHTOL, K., BECKER, M. R., BENOIT-
LEVY, A., BERNSTEIN, G. M., BERTIN, E., BLAZEK, J., BOCQUET, S.,
BROOKS, D., BROUT, D., BUCKLEY-GEER, E., BURKE, D. L., BUSTI,
V., CAMPISANO, R., CARDIEL-SAS, L., CARNERO ROSELL, A., CAR-
RASCO KIND, M., CARRETERO, J., CASTANDER, F. J., CAWTHON,
R., CHANG, C., CHEN, X., CONSELICE, C., COSTA, G., CROCCE, M.,
CUNHA, C. E., DANDREA, C. B., DA COSTA, L. N., DAS, R., DAUES,
G., DAVIS, T. M., DAVIS, C., DE VICENTE, J., DEPOY, D. L., DEROSE,
J., DESAI, S., DIEHL, H. T., DIETRICH, J. P., DODELSON, S., DOEL,
P., DRLICA-WAGNER, A., EIFLER, T. F., ELLIOTT, A. E., EVRARD,
A. E., FARAHI, A., FAUSTI NETO, A., FERNANDEZ, E., FINLEY, D. A.,
FLAUGHER, B., FOLEY, R. J., FOSALBA, P., FRIEDEL, D. N., FRIE-
MAN, J., GARCıA-BELLIDO, J., GAZTANAGA, E., GERDES, D. W., GI-
ANNANTONIO, T., GILL, M. S. S., GLAZEBROOK, K., GOLDSTEIN,
D. A., GOWER, M., GRUEN, D., GRUENDL, R. A., GSCHWEND, J.,
GUPTA, R. R., GUTIERREZ, G., HAMILTON, S., HARTLEY, W. G., HIN-
TON, S. R., HISLOP, J. M., HOLLOWOOD, D., HONSCHEID, K., HOYLE,
B., HUTERER, D., JAIN, B., JAMES, D. J., JELTEMA, T., JOHNSON,
M. W. G., JOHNSON, M. D., KACPRZAK, T., KENT, S., KHULLAR, G.,
KLEIN, M., KOVACS, A., KOZIOL, A. M. G., KRAUSE, E., KREMIN, A.,
KRON, R., KUEHN, K., KUHLMANN, S., KUROPATKIN, N., LAHAV, O.,
LASKER, J., LI, T. S., LI, R. T., LIDDLE, A. R., LIMA, M., LIN, H.,
63

LOPEZ-REYES, P., MACCRANN, N., MAIA, M. A. G., MALONEY, J. D.,
MANERA, M., MARCH, M., MARRINER, J., MARSHALL, J. L., MARTINI,
P., MCCLINTOCK, T., MCKAY, T., MCMAHON, R. G., MELCHIOR, P.,
MENANTEAU, F., MILLER, C. J., MIQUEL, R., MOHR, J. J., MORGAN-
SON, E., MOULD, J., NEILSEN, E., NICHOL, R. C., NOGUEIRA, F., NORD,
B., NUGENT, P., NUNES, L., OGANDO, R. L. C., OLD, L., PACE, A. B.,
PALMESE, A., PAZ-CHINCHON, F., PEIRIS, H. V., PERCIVAL, W. J., PE-
TRAVICK, D., PLAZAS, A. A., POH, J., POND, C., PORREDON, A., PU-
JOL, A., REFREGIER, A., REIL, K., RICKER, P. M., ROLLINS, R. P.,
ROMER, A. K., ROODMAN, A., ROONEY, P., ROSS, A. J., RYKOFF,
E. S., SAKO, M., SANCHEZ, M. L., SANCHEZ, E., SANTIAGO, B., SARO,
A., SCARPINE, V., SCOLNIC, D., SERRANO, S., SEVILLA-NOARBE, I.,
SHELDON, E., SHIPP, N., SILVEIRA, M. L., SMITH, M., SMITH, R. C.,
SMITH, J. A., SOARES-SANTOS, M., SOBREIRA, F., SONG, J., STEB-
BINS, A., SUCHYTA, E., SULLIVAN, M., SWANSON, M. E. C., TARLE, G.,
THALER, J., THOMAS, D., THOMAS, R. C., TROXEL, M. A., TUCKER,
D. L., VIKRAM, V., VIVAS, A. K., WALKER, A. R., WECHSLER, R. H.,
WELLER, J., WESTER, W., WOLF, R. C., WU, H., YANNY, B., ZENTENO,
A., ZHANG, Y., ZUNTZ, J., DES COLLABORATION, , JUNEAU, S., FITZ-
PATRICK, M., NIKUTTA, R., NIDEVER, D., OLSEN, K., SCOTT, A., DATA
LAB, N. The Dark Energy Survey: Data Release 1. ApJS, v. 239, p. 18, De-
cember 2018.
[3] ALBERT, L., ARTIGAU, E., DELORME, P., REYLE, C., FORVEILLE, T.,
DELFOSSE, X., WILLOTT, C. J. 37 New T-type Brown Dwarfs in the Canada-
France Brown Dwarfs Survey. AJ, v. 141, p. 203, June 2011.
[4] ALLARD, F., HAUSCHILDT, P. H. Model atmospheres for M (sub)dwarf stars.
1: The base model grid. ApJ, v. 445, p. 433–450, May 1995.
[5] BARAFFE, I., CHABRIER, G., ALLARD, F., HAUSCHILDT, P. H. New Evolu-
tionary Tracks for Very Low Mass Stars. ApJ, v. 446, p. L35, June 1995.
[6] BARAFFE, I., CHABRIER, G., ALLARD, F., HAUSCHILDT, P. H. Evolutionary
models for low-mass stars and brown dwarfs: Uncertainties and limits at very
young ages. A&A, v. 382, p. 563–572, February 2002.

[7] BARAFFE, I., CHABRIER, G., BARMAN, T. S., ALLARD, F., HAUSCHILDT,
P. H. Evolutionary models for cool brown dwarfs and extrasolar giant planets.
The case of HD 209458. A&A, v. 402, p. 701–712, May 2003.
[8] BATE, M. R., BONNELL, I. A. The origin of the initial mass function and its
dependence on the mean Jeans mass in molecular clouds. MNRAS, v. 356, p.
1201–1221, February 2005.
[9] BATE, M. R., OGILVIE, G. I., LUBOW, S. H., PRINGLE, J. E. The excita-
tion, propagation and dissipation of waves in accretion discs: the non-linear
axisymmetric case. MNRAS, v. 332, p. 575–600, May 2002.
[10] BILDSTEN, L., BROWN, E. F., MATZNER, C. D., USHOMIRSKY, G. Lithium
Depletion in Fully Convective Pre-Main-Sequence Stars. ApJ, v. 482, p. 442–
447, June 1997.
[11] BONNELL, I. A., CLARK, P., BATE, M. R. Gravitational fragmentation and the
formation of brown dwarfs in stellar clusters. MNRAS, v. 389, p. 1556–1562,
October 2008.
[12] BOSS, A. P. Formation of Planetary-Mass Objects by Protostellar Collapse and
Fragmentation. ApJ, v. 551, p. L167–L170, April 2001.
[13] BRETT, J. M., SMITH, R. C. A model atmosphere investigation of the effects of
irradiation on the secondary star in a dwarf nova. MNRAS, v. 264, p. 641,
October 1993.
[14] BURGASSER, A. J. Binaries and the L Dwarf/T Dwarf Transition. ApJ, v. 659,
p. 655–674, April 2007.
[15] BURGASSER, A. J., KIRKPATRICK, J. D., CRUZ, K. L., REID, I. N.,
LEGGETT, S. K., LIEBERT, J., BURROWS, A., BROWN, M. E. Hubble
Space Telescope NICMOS Observations of T Dwarfs: Brown Dwarf Multiplic-
ity and New Probes of the L/T Transition. ApJS, v. 166, p. 585–612, October
2006.
[16] BURNINGHAM, B., CARDOSO, C. V., SMITH, L., LEGGETT, S. K., SMART,
R. L., MANN, A. W., DHITAL, S., LUCAS, P. W., TINNEY, C. G., PIN-
FIELD, D. J., ZHANG, Z., MORLEY, C., SAUMON, D., ALLER, K., LIT-
TLEFAIR, S. P., HOMEIER, D., LODIEU, N., DEACON, N., MARLEY,

M. S., VAN SPAANDONK, L., BAKER, D., ALLARD, F., ANDREI, A. H.,
CANTY, J., CLARKE, J., DAY-JONES, A. C., DUPUY, T., FORTNEY,
J. J., GOMES, J., ISHII, M., JONES, H. R. A., LIU, M., MAGAZZU, A.,
MAROCCO, F., MURRAY, D. N., ROJAS-AYALA, B., TAMURA, M. 76 T
dwarfs from the UKIDSS LAS: benchmarks, kinematics and an updated space
density. MNRAS, v. 433, p. 457–497, July 2013.
[17] BURNINGHAM, B., PINFIELD, D. J., LUCAS, P. W., LEGGETT, S. K., DEA-
CON, N. R., TAMURA, M., TINNEY, C. G., LODIEU, N., ZHANG, Z. H.,
HUELAMO, N., JONES, H. R. A., MURRAY, D. N., MORTLOCK, D. J.,
PATEL, M., BARRADO Y NAVASCUES, D., ZAPATERO OSORIO, M. R.,
ISHII, M., KUZUHARA, M., SMART, R. L. 47 new T dwarfs from the UKIDSS
Large Area Survey. MNRAS, v. 406, p. 1885–1906, August 2010.
[18] BURROWS, A., HUBBARD, W. B., LUNINE, J. I. Theoretical models of very
low mass stars and brown dwarfs. ApJ, v. 345, p. 939–958, October 1989.
[19] CARLSTROM, J. E., ADE, P. A. R., AIRD, K. A., BENSON, B. A., BLEEM,
L. E., BUSETTI, S., CHANG, C. L., CHAUVIN, E., CHO, H.-M., CRAW-
FORD, T. M., CRITES, A. T., DOBBS, M. A., HALVERSON, N. W., HEIM-
SATH, S., HOLZAPFEL, W. L., HRUBES, J. D., JOY, M., KEISLER, R.,
LANTING, T. M., LEE, A. T., LEITCH, E. M., LEONG, J., LU, W.,
LUEKER, M., LUONG-VAN, D., MCMAHON, J. J., MEHL, J., MEYER,
S. S., MOHR, J. J., MONTROY, T. E., PADIN, S., PLAGGE, T., PRYKE, C.,
RUHL, J. E., SCHAFFER, K. K., SCHWAN, D., SHIROKOFF, E., SPIELER,
H. G., STANISZEWSKI, Z., STARK, A. A., TUCKER, C., VANDERLINDE,
K., VIEIRA, J. D., WILLIAMSON, R. The 10 Meter South Pole Telescope.
PASP, v. 123, p. 568, May 2011.
[20] CARNERO ROSELL, A., SANTIAGO, B., DAL PONTE, M., BURNINGHAM,
B., DA COSTA, L. N., JAMES, D. J., MARSHALL, J. L., MCMAHON,
R. G., BECHTOL, K., DE PARIS, L., LI, T., PIERES, A., ABBOTT,
T. M. C., ANNIS, J., AVILA, S., BERNSTEIN, G. M., BROOKS, D.,
BURKE, D. L., CARRASCO-KIND, M., CARRETERO, J., DE VICENTE, J.,
DRLICA-WAGNER, A., FOSALBA, P., FRIEMAN, J., GARCIA-BELLIDO,
J., GAZTANAGA, E., GRUENDL, R. A., GSCHWEND, J., GUTIERREZ,
G., HOLLOWOOD, D. L., MAIA, M. A. G., MENANTEAU, F., MIQUEL,
R., PLAZAS, A. A., ROODMAN, A., SANCHEZ, E., SCARPINE, V.,

SCHINDLER, R., SERRANO, S., SEVILLA-NOARBE, I., SMITH, M., SO-
BREIRA, F., SUCHYTA, E., SWANSON, M. E. C., TARLE, G., VIKRAM,
V., WALKER, A. R. Brown dwarf census with the Dark Energy Survey year
3 data and the thin disk scale height of early L types. arXiv e-prints, p.
arXiv:1903.10806, Mar 2019.
[21] CHABRIER, G. The Galactic Disk Mass Budget. II. Brown Dwarf Mass Function
and Density. ApJ, v. 567, p. 304–313, March 2002.
[22] CHABRIER, G., BARAFFE, I. Theory of Low-Mass Stars and Substellar Objects.
ARA&A, v. 38, p. 337–377, 2000.
[23] CHABRIER, G., BARAFFE, I., ALLARD, F., HAUSCHILDT, P. Evolutionary
Models for Very Low-Mass Stars and Brown Dwarfs with Dusty Atmospheres.
ApJ, v. 542, p. 464–472, October 2000.
[24] CHABRIER, G., BARAFFE, I., PLEZ, B. Mass-Luminosity Relationship and
Lithium Depletion for Very Low Mass Stars. ApJ, v. 459, p. L91, March 1996.
[25] CHIU, K., FAN, X., LEGGETT, S. K., GOLIMOWSKI, D. A., ZHENG, W.,
GEBALLE, T. R., SCHNEIDER, D. P., BRINKMANN, J. Seventy-One New
L and T Dwarfs from the Sloan Digital Sky Survey. AJ, v. 131, p. 2722–2736,
June 2006.
[26] DANTONA, F., MAZZITELLI, I. Evolution of very low mass stars and brown
dwarfs. I - The minimum main-sequence mass and luminosity. ApJ, v. 296, p.
502–513, September 1985.
[27] DAY-JONES, A. C., MAROCCO, F., PINFIELD, D. J., ZHANG, Z. H., BURN-
INGHAM, B., DEACON, N., RUIZ, M. T., GALLARDO, J., JONES, H. R. A.,
LUCAS, P. W. L., JENKINS, J. S., GOMES, J., FOLKES, S. L., CLARKE,
J. R. A. The sub-stellar birth rate from UKIDSS. MNRAS, v. 430, p. 1171–
1187, April 2013.
[28] DHITAL, S., WEST, A. A., STASSUN, K. G., SCHLUNS, K. J., MASSEY, A. P.
SLoWPoKES-II: 100,000 Wide Binaries Identified in SDSS without Proper Mo-
tions. AJ, v. 150, p. 57, August 2015.
[29] DHITAL, SAURAV, BURGASSER, ADAM J., LOOPER, DAGNY L., STASSUN,
KEIVAN G. Resolved Spectroscopy of M Dwarf/L Dwarf Binaries. IV. Discov-

ery of AN M9 + L6 Binary Separated by Over 100 AU. AJ, v. 141, p. 7,
January 2011.
[30] DORMAN, B., NELSON, L. A., CHAU, W. Y. Theoretical models of low-mass
stars and brown dwarfs. I - The lower main sequence. ApJ, v. 342, p. 1003–
1018, July 1989.
[31] ELMEGREEN, B. G. On the Initial Conditions for Star Formation and the Initial
Mass Function. ApJ, v. 731, p. 61, April 2011.
[32] EPCHTEIN, N., DE BATZ, B., CAPOANI, L., CHEVALLIER, L., COPET, E.,
FOUQUE, P., LACOMBE, P., LE BERTRE, T., PAU, S., ROUAN, D., RU-
PHY, S., SIMON, G., TIPHENE, D., BURTON, W. B., BERTIN, E., DEUL,
E., HABING, H., BORSENBERGER, J., DENNEFELD, M., GUGLIELMO,
F., LOUP, C., MAMON, G., NG, Y., OMONT, A., PROVOST, L., RENAULT,
J. C., TANGUY, F., KIMESWENGER, S., KIENEL, C., GARZON, F., PERSI,
P., FERRARI-TONIOLO, M., ROBIN, A., PATUREL, G., VAUGLIN, I.,
FORVEILLE, T., DELFOSSE, X., HRON, J., SCHULTHEIS, M., APPEN-
ZELLER, I., WAGNER, S., BALAZS, L., HOLL, A., LEPINE, J., BOSCOLO,
P., PICAZZIO, E., DUC, P. A., MENNESSIER, M. O. The deep near-infrared
southern sky survey (DENIS). The Messenger, v. 87, p. 27–34, Mar 1997.
[33] FAHERTY, J. K., RIEDEL, A. R., CRUZ, K. L., GAGNE, J., FILIPPAZZO,
J. C., LAMBRIDES, E., FICA, H., WEINBERGER, A., THORSTENSEN,
J. R., TINNEY, C. G., BALDASSARE, V., LEMONIER, E., RICE, E. L.
Population Properties of Brown Dwarf Analogs to Exoplanets. ApJS, v. 225,
p. 10, July 2016.
[34] FLAUGHER, B., DIEHL, H. T., HONSCHEID, K., ABBOTT, T. M. C., AL-
VAREZ, O., ANGSTADT, R., ANNIS, J. T., ANTONIK, M., BALLESTER,
O., BEAUFORE, L., BERNSTEIN, G. M., BERNSTEIN, R. A., BIGELOW,
B., BONATI, M., BOPRIE, D., BROOKS, D., BUCKLEY-GEER, E. J.,
CAMPA, J., CARDIEL-SAS, L., CASTANDER, F. J., CASTILLA, J., CEASE,
H., CELA-RUIZ, J. M., CHAPPA, S., CHI, E., COOPER, C., DA COSTA,
L. N., DEDE, E., DERYLO, G., DEPOY, D. L., DE VICENTE, J., DOEL, P.,
DRLICA-WAGNER, A., EITING, J., ELLIOTT, A. E., EMES, J., ESTRADA,
J., FAUSTI NETO, A., FINLEY, D. A., FLORES, R., FRIEMAN, J.,
GERDES, D., GLADDERS, M. D., GREGORY, B., GUTIERREZ, G. R.,
HAO, J., HOLLAND, S. E., HOLM, S., HUFFMAN, D., JACKSON, C.,

JAMES, D. J., JONAS, M., KARCHER, A., KARLINER, I., KENT, S.,
KESSLER, R., KOZLOVSKY, M., KRON, R. G., KUBIK, D., KUEHN, K.,
KUHLMANN, S., KUK, K., LAHAV, O., LATHROP, A., LEE, J., LEVI,
M. E., LEWIS, P., LI, T. S., MANDRICHENKO, I., MARSHALL, J. L., MAR-
TINEZ, G., MERRITT, K. W., MIQUEL, R., MUNOZ, F., NEILSEN, E. H.,
NICHOL, R. C., NORD, B., OGANDO, R., OLSEN, J., PALAIO, N., PAT-
TON, K., PEOPLES, J., PLAZAS, A. A., RAUCH, J., REIL, K., RHEAULT,
J.-P., ROE, N. A., ROGERS, H., ROODMAN, A., SANCHEZ, E., SCARPINE,
V., SCHINDLER, R. H., SCHMIDT, R., SCHMITT, R., SCHUBNELL, M.,
SCHULTZ, K., SCHURTER, P., SCOTT, L., SERRANO, S., SHAW, T. M.,
SMITH, R. C., SOARES-SANTOS, M., STEFANIK, A., STUERMER, W.,
SUCHYTA, E., SYPNIEWSKI, A., TARLE, G., THALER, J., TIGHE, R.,
TRAN, C., TUCKER, D., WALKER, A. R., WANG, G., WATSON, M.,
WEAVERDYCK, C., WESTER, W., WOODS, R., YANNY, B., DES COL-
LABORATION, . The Dark Energy Camera. AJ, v. 150, p. 150, November
2015.
[35] GELINO, C. R., KIRKPATRICK, J. D., CUSHING, M. C., EISENHARDT, P. R.,
GRIFFITH, R. L., MAINZER, A. K., MARSH, K. A., SKRUTSKIE, M. F.,
WRIGHT, E. L. WISE Brown Dwarf Binaries: The Discovery of a T5+T5 and
a T8.5+T9 System. AJ, v. 142, p. 57, August 2011.
[36] GOODWIN, S. P., WHITWORTH, A. Brown dwarf formation by binary disrup-
tion. A&A, v. 466, p. 943–948, May 2007.
[37] GRETHER, D., LINEWEAVER, C. H. How Dry is the Brown Dwarf Desert?
Quantifying the Relative Number of Planets, Brown Dwarfs, and Stellar Com-
panions around Nearby Sun-like Stars. ApJ, v. 640, p. 1051–1062, April 2006.
[38] GROSSMAN, A. S., HAYS, D., GRABOSKE, H. C., JR. The theoretical low mass
main sequence. A&A, v. 30, p. 95–103, January 1974.
[39] HUELAMO, N., IVANOV, V. D., KURTEV, R., GIRARD, J. H., BORISSOVA, J.,
MAWET, D., MUZIC, K., CACERES, C., MELO, C. H. F., STERZIK, M. F.,
MINNITI, D. WISE J061213.85-303612.5: a new T-dwarf binary candidate.
A&A, v. 578, p. A1, June 2015.
[40] JANSON, M., HORMUTH, F., BERGFORS, C., BRANDNER, W., HIPPLER,
S., DAEMGEN, S., KUDRYAVTSEVA, N., SCHMALZL, E., SCHNUPP, C.,

HENNING, T. The AstraLux Large M-dwarf Multiplicity Survey. ApJ, v. 754,
p. 44, July 2012.
[41] KIRKPATRICK, J. D., CUSHING, M. C., GELINO, C. R., GRIFFITH, R. L.,
SKRUTSKIE, M. F., MARSH, K. A., WRIGHT, E. L., MAINZER, A.,
EISENHARDT, P. R., MCLEAN, I. S., THOMPSON, M. A., BAUER, J. M.,
BENFORD, D. J., BRIDGE, C. R., LAKE, S. E., PETTY, S. M., STAN-
FORD, S. A., TSAI, C.-W., BAILEY, V., BEICHMAN, C. A., BLOOM, J. S.,
BOCHANSKI, J. J., BURGASSER, A. J., CAPAK, P. L., CRUZ, K. L., HINZ,
P. M., KARTALTEPE, J. S., KNOX, R. P., MANOHAR, S., MASTERS, D.,
MORALES-CALDERON, M., PRATO, L. A., RODIGAS, T. J., SALVATO,
M., SCHURR, S. D., SCOVILLE, N. Z., SIMCOE, R. A., STAPELFELDT,
K. R., STERN, D., STOCK, N. D., VACCA, W. D. The First Hundred Brown
Dwarfs Discovered by the Wide-field Infrared Survey Explorer (WISE). ApJS,
v. 197, p. 19, December 2011.
[42] KIRKPATRICK, J. D., REID, I. N., LIEBERT, J., CUTRI, R. M., NELSON, B.,
BEICHMAN, C. A., DAHN, C. C., MONET, D. G., GIZIS, J. E., SKRUTSKIE,
M. F. Dwarfs Cooler than “M”: The Definition of Spectral Type “L” Using
Discoveries from the 2 Micron All-Sky Survey (2MASS). ApJ, v. 519, p. 802–
833, July 1999.
[43] KRAUS, A. L., HILLENBRAND, L. A. Multiple Star Formation to the Bottom
of the Initial Mass Function. ApJ, v. 757, p. 141, October 2012.
[44] KUMAR, S. S. The Structure of Stars of Very Low Mass. ApJ, v. 137, p. 1121,
May 1963.
[45] LAWRENCE, A., WARREN, S.J., ALMAINI, O., EDGE, A.C., HAMBLY, N.C.,
JAMESON, R.F., LUCAS, P., CASALI, M., ADAMSON, A., DYE, S., EMER-
SON, J.P., FOUCAUD, S., HEWETT, P., HIRST, P., HODGKIN, S.T., IR-
WIN, M.J., LODIEU, N., MCMAHON, R.G., SIMPSON, C., SMAIL, I.,
MORTLOCK, D., FOLGER, M. The ukirt infrared deep sky survey (ukidss).
Monthly Notices of the Royal Astronomical Society, v. 379, n. 4, p.
1599–1617, 2007.
[46] LODIEU, N., BURNINGHAM, B., DAY-JONES, A., SCHOLZ, R.-D.,
MAROCCO, F., KOPOSOV, S., BARRADO Y NAVASCUES, D., LUCAS,
P. W., CRUZ, P., LILLO, J., JONES, H., PEREZ-GARRIDO, A., RUIZ, M. T.,

PINFIELD, D., REBOLO, R., BEJAR, V. J. S., BOUDREAULT, S., EMER-
SON, J. P., BANERJI, M., GONZALEZ-SOLARES, E., HODGKIN, S. T.,
MCMAHON, R., CANTY, J., CONTRERAS, C. First T dwarfs in the VISTA
Hemisphere Survey. A&A, v. 548, p. A53, December 2012.
[47] LODIEU, N., HAMBLY, N. C., JAMESON, R. F., HODGKIN, S. T., CARRARO,
G., KENDALL, T. R. New brown dwarfs in Upper Sco using UKIDSS Galactic
Cluster Survey science verification data. MNRAS, v. 374, p. 372–384, January
2007.
[48] LODIEU, N., ZAPATERO OSORIO, M. R., REBOLO, R., MARTıN, E. L., HAM-
BLY, N. C. A census of very-low-mass stars and brown dwarfs in the σ Orionis
cluster. A&A, v. 505, p. 1115–1127, October 2009.
[49] LUHMAN, K. L. The Formation and Early Evolution of Low-Mass Stars and
Brown Dwarfs. ARA&A, v. 50, p. 65–106, September 2012.
[50] LUNINE, J. I., HUBBARD, W. B., MARLEY, M. S. Evolution and infrared
spectra of brown dwarfs. ApJ, v. 310, p. 238–260, November 1986.
[51] MCMAHON, R. G., BANERJI, M., GONZALEZ, E., KOPOSOV, S. E., BEJAR,
V. J., LODIEU, N., REBOLO, R., VHS COLLABORATION, . First Scientific
Results from the VISTA Hemisphere Survey (VHS). The Messenger, v. 154,
p. 35–37, December 2013.
[52] METCHEV, S. A., HILLENBRAND, L. A. The Palomar/Keck Adaptive Optics
Survey of Young Solar Analogs: Evidence for a Universal Companion Mass
Function. ApJS, v. 181, p. 62–109, March 2009.
[53] MORAUX, E., BOUVIER, J., STAUFFER, J. R., CUILLANDRE, J.-C. Brown
dwarfs in the Pleiades cluster: Clues to the substellar mass function. A&A, v.
400, p. 891–902, March 2003.
[54] NELSON, L. A., RAPPAPORT, S. A., JOSS, P. C. The evolution of very low mass
stars. ApJ, v. 311, p. 226–240, December 1986.
[55] OPPENHEIMER, B. R., KULKARNI, S. R., MATTHEWS, K., NAKAJIMA, T.
Infrared Spectrum of the Cool Brown Dwarf Gl 229B. Science, v. 270, p.
1478–1479, December 1995.

[56] PADOAN, P., NORDLUND, A. The Stellar Initial Mass Function from Turbulent
Fragmentation. ApJ, v. 576, p. 870–879, September 2002.
[57] RAGHAVAN, D., MCALISTER, H. A., HENRY, T. J., LATHAM, D. W.,
MARCY, G. W., MASON, B. D., GIES, D. R., WHITE, R. J., TEN BRUM-
MELAAR, T. A. A Survey of Stellar Families: Multiplicity of Solar-type Stars.
ApJS, v. 190, p. 1–42, September 2010.
[58] REBOLO, R., MARTIN, E. L., MAGAZZU, A. Spectroscopy of a brown dwarf
candidate in the Alpha Persei open cluster. ApJ, v. 389, p. L83–L86, April
1992.
[59] REBOLO, R., ZAPATERO OSORIO, M. R., MARTıN, E. L. Discovery of a brown
dwarf in the Pleiades star cluster. Nature, v. 377, p. 129–131, September 1995.
[60] SALPETER, E. E. The Luminosity Function and Stellar Evolution. ApJ, v. 121,
p. 161, January 1955.
[61] SAUMON, D., BERGERON, P., LUNINE, J. I., HUBBARD, W. B., BURROWS,
A. Cool zero-metallicity stellar atmospheres. ApJ, v. 424, p. 333–344, March
1994.
[62] SAUMON, D., CHABRIER, G., VAN HORN, H. M. An Equation of State for
Low-Mass Stars and Giant Planets. ApJS, v. 99, p. 713, August 1995.
[63] SAUMON, D., MARLEY, M. S. The Evolution of L and T Dwarfs in Color-
Magnitude Diagrams. ApJ, v. 689, p. 1327–1344, December 2008.
[64] SCHMIDT, S. J., WEST, A. A., HAWLEY, S. L., PINEDA, J. S. Colors and
Kinematics of L Dwarfs from the Sloan Digital Sky Survey. AJ, v. 139, p.
1808–1821, May 2010.
[65] SHU, F. H., ADAMS, F. C., LIZANO, S. Star formation in molecular clouds -
Observation and theory. ARA&A, v. 25, p. 23–81, 1987.
[66] SKRUTSKIE, M. F., CUTRI, R. M., STIENING, R., WEINBERG, M. D.,
SCHNEIDER, S., CARPENTER, J. M., BEICHMAN, C., CAPPS, R.,
CHESTER, T., ELIAS, J., HUCHRA, J., LIEBERT, J., LONSDALE, C.,
MONET, D. G., PRICE, S., SEITZER, P., JARRETT, T., KIRKPATRICK,
J. D., GIZIS, J. E., HOWARD, E., EVANS, T., FOWLER, J., FULLMER, L.,
HURT, R., LIGHT, R., KOPAN, E. L., MARSH, K. A., MCCALLON, H. L.,

TAM, R., VAN DYK, S., WHEELOCK, S. The Two Micron All Sky Survey
(2MASS). AJ, v. 131, p. 1163–1183, Feb 2006.
[67] SKRZYPEK, N., WARREN, S. J., FAHERTY, J. K. A&A, v. 589, p. A49, May
2016.
[68] SKRZYPEK, N., WARREN, S. J., FAHERTY, J. K., MORTLOCK, D. J., BUR-
GASSER, A. J., HEWETT, P. C. A&A, v. 574, p. A78, February 2015.
[69] SORAHANA, S., NAKAJIMA, T., MATSUOKA, Y. Evaluation of the Vertical
Scale Height of L Dwarfs in the Galactic Thin Disk. ApJ, v. 870, p. 118,
January 2019.
[70] STAMATELLOS, D., MAURY, A., WHITWORTH, A., ANDRE, P. The lower
limits of disc fragmentation and the prospects for observing fragmenting discs.
MNRAS, v. 413, p. 1787–1796, May 2011.
[71] STAUFFER, J. R., HAMILTON, D., PROBST, R. G. A CCD-based search for
very low mass members of the Pleiades cluster. AJ, v. 108, p. 155–159, July
1994.
[72] TARTER, J. C. The interaction of gas and galaxies within galaxy clusters.
1975. Tese de Doutoramento – California Univ., Berkeley.
[73] TOKOVININ, A., LEPINE, S. Wide Companions to Hipparcos Stars within 67 pc
of the Sun. AJ, v. 144, p. 102, October 2012.
[74] VANDENBERG, D. A., HARTWICK, F. D. A., DAWSON, P., ALEXANDER,
D. R. Studies of late-type dwarfs. V - Theoretical models for lower main-
sequence stars. ApJ, v. 266, p. 747–754, March 1983.
[75] WHITWORTH, A. P., ZINNECKER, H. The formation of free-floating brown
dwarves and planetary-mass objects by photo-erosion of prestellar cores. A&A,
v. 427, p. 299–306, November 2004.
[76] WRIGHT, E. L., EISENHARDT, P. R. M., MAINZER, A. K., RESSLER,
M. E., CUTRI, R. M., JARRETT, T., KIRKPATRICK, J. D., PADGETT,
D., MCMILLAN, R. S., SKRUTSKIE, M., STANFORD, S. A., COHEN, M.,
WALKER, R. G., MATHER, J. C., LEISAWITZ, D., GAUTIER, T. N., III,
MCLEAN, I., BENFORD, D., LONSDALE, C. J., BLAIN, A., MENDEZ,
B., IRACE, W. R., DUVAL, V., LIU, F., ROYER, D., HEINRICHSEN, I.,

HOWARD, J., SHANNON, M., KENDALL, M., WALSH, A. L., LARSEN,
M., CARDON, J. G., SCHICK, S., SCHWALM, M., ABID, M., FABINSKY,
B., NAES, L., TSAI, C.-W. The Wide-field Infrared Survey Explorer (WISE):
Mission Description and Initial On-orbit Performance. AJ, v. 140, p. 1868–
1881, December 2010.
[77] YORK, DONALD G., ADELMAN, J., ANDERSON, JR., JOHN E., AN-
DERSON, SCOTT F., ANNIS, JAMES, BAHCALL, NETA A., BAKKEN,
J. A., BARKHOUSER, ROBERT, BASTIAN, STEVEN, BERMAN, EILEEN,
BOROSKI, WILLIAM N., BRACKER, STEVE, BRIEGEL, CHARLIE,
BRIGGS, JOHN W., BRINKMANN, J., BRUNNER, ROBERT, BURLES,
SCOTT, CAREY, LARRY, CARR, MICHAEL A., CASTANDER, FRAN-
CISCO J., CHEN, BING, COLESTOCK, PATRICK L., CONNOLLY, A. J.,
CROCKER, J. H., CSABAI, ISTVAN, CZARAPATA, PAUL C., DAVIS,
JOHN ERIC, DOI, MAMORU, DOMBECK, TOM, EISENSTEIN, DANIEL,
ELLMAN, NANCY, ELMS, BRIAN R., EVANS, MICHAEL L., FAN, XIAO-
HUI, FEDERWITZ, GLENN R., FISCELLI, LARRY, FRIEDMAN, SCOTT,
FRIEMAN, JOSHUA A., FUKUGITA, MASATAKA, GILLESPIE, BRUCE,
GUNN, JAMES E., GURBANI, VIJAY K., DE HAAS, ERNST, HALDE-
MAN, MERLE, HARRIS, FREDERICK H., HAYES, J., HECKMAN, TIM-
OTHY M., HENNESSY, G. S., HINDSLEY, ROBERT B., HOLM, SCOTT,
HOLMGREN, DONALD J., HUANG, CHI-HAO, HULL, CHARLES, HUSBY,
DON, ICHIKAWA, SHIN-ICHI, ICHIKAWA, TAKASHI, IVEZIC, ZELJKO,
KENT, STEPHEN, KIM, RITA S. J., KINNEY, E., KLAENE, MARK,
KLEINMAN, A. N., KLEINMAN, S., KNAPP, G. R., KORIENEK, JOHN,
KRON, RICHARD G., KUNSZT, PETER Z., LAMB, D. Q., LEE, B., LEGER,
R. FRENCH, LIMMONGKOL, SIRILUK, LINDENMEYER, CARL, LONG,
DANIEL C., LOOMIS, CRAIG, LOVEDAY, JON, LUCINIO, RICH, LUP-
TON, ROBERT H., MACKINNON, BRYAN, MANNERY, EDWARD J.,
MANTSCH, P. M., MARGON, BRUCE, MCGEHEE, PEREGRINE,
MCKAY, TIMOTHY A., MEIKSIN, AVERY, MERELLI, ARONNE, MONET,
DAVID G., MUNN, JEFFREY A., NARAYANAN, VIJAY K., NASH,
THOMAS, NEILSEN, ERIC, NESWOLD, RICH, NEWBERG, HEIDI JO,
NICHOL, R. C., NICINSKI, TOM, NONINO, MARIO, OKADA, NORIO,
OKAMURA, SADANORI, OSTRIKER, JEREMIAH P., OWEN, RUSSELL,
PAULS, A. GEORGE, PEOPLES, JOHN, PETERSON, R. L., PETRAV-
ICK, DONALD, PIER, JEFFREY R., POPE, ADRIAN, PORDES, RUTH,

PROSAPIO, ANGELA, RECHENMACHER, RON, QUINN, THOMAS R.,
RICHARDS, GORDON T., RICHMOND, MICHAEL W., RIVETTA, CLAU-
DIO H., ROCKOSI, CONSTANCE M., RUTHMANSDORFER, KURT,
SAND FORD, DALE, SCHLEGEL, DAVID J., SCHNEIDER, DONALD P.,
SEKIGUCHI, MAKI, SERGEY, GARY, SHIMASAKU, KAZUHIRO, SIEG-
MUND, WALTER A., SMEE, STEPHEN, SMITH, J. ALLYN, SNEDDEN,
S., STONE, R., STOUGHTON, CHRIS, STRAUSS, MICHAEL A., STUBBS,
CHRISTOPHER, SUBBARAO, MARK, SZALAY, ALEXANDER S., SZA-
PUDI, ISTVAN, SZOKOLY, GYULA P., THAKAR, ANIRUDDA R.,
TREMONTI, CHRISTY, TUCKER, DOUGLAS L., UOMOTO, ALAN, VAN-
DEN BERK, DAN, VOGELEY, MICHAEL S., WADDELL, PATRICK,
WANG, SHU-I., WATANABE, MASARU, WEINBERG, DAVID H., YANNY,
BRIAN, YASUDA, NAOKI, SDSS COLLABORATION, . The Sloan Digital
Sky Survey: Technical Summary. AJ, v. 120, p. 1579–1587, Sep 2000.