Sea-surface dynamics and palaeoenvironmental changes in the North Atlantic Ocean (IODP Site U1313)...
14
Sea-surface dynamics and palaeoenvironmental changes in the North Atlantic Ocean (IODP Site U1313) during Marine Isotope Stage 19 inferred from coccolithophore assemblages D. Emanuele a , P. Ferretti b , E. Palumbo a , F.O. Amore a, ⁎ a DST - Università del Sannio, Via dei Mulini 59a, Benevento 82100, Italy b CNR-IDPA - Consiglio Nazionale delle Ricerche, Istituto per la Dinamica dei Processi Ambientali, Calle Larga Santa Marta 2137, Venezia I-30123, Italy abstract article info Article history: Received 28 July 2014 Received in revised form 1 April 2015 Accepted 9 April 2015 Available online 18 April 2015 Keywords: North Atlantic Ocean IODP Site U1313 Early-Middle Pleistocene MIS 19 interglacial Calcareous nannoplankton Foraminifera stable isotopes Coccolithophore assemblages recovered from Integrated Ocean Drilling Program (IODP) Site U1313 are investi- gated to reconstruct the palaeoceanographic evolution of a sector of the North Atlantic during Marine Isotope Stage (MIS) 19 (~790–760 ka) at orbital, suborbital and millennial time-scales. The end of the glacial MIS 20 is marked by the arrival of cold waters, deriving from ice melting at higher latitudes, as recorded by Coccolithus pelagicus pelagicus. The MIS 19c is characterised by an extension of warmer North At- lantic Transitional Waters (NATW) reflecting the intensification of subtropical gyre influence on Site U1313, identified by an increase in warm species Umbilicosphaera sibogae. The influence on the site of cooler NATW is inferred from higher percentages of Gephyrocapsa margereli, which starts increasing from ~779 ka. Finally, the transition from MIS 19a to MIS 18 is characterised by a southward shift of the palaeoceanographic system due to a southward extension of the subpolar front, as indicated by an increase of cold subspecies C. pelagicus pelagicus. The evolution of the palaeoproductivity proxy records (number of coccoliths/g of sediment and Nannofossil Ac- cumulation Rate — NAR) and the abundances of small Gephyrocapsa, G. margereli, U. sibogae and C. pelagicus pelagicus show that fluctuations in sea-surface productivity and alternations between cooling and warming phases occurred on the precessional timescale. Spectral analyses of U. sibogae, number of coccoliths/g of sediment and NAR indicate a significant concentration of variance close to half precession (~10 kyr); this reflects a nonlinear response of the mid-latitude North Atlantic surface ocean to low-latitude insolation forcing. Furthermore, millennial to multi-centennial instability in sea-surface dynamics is highlighted by spectral and wavelet analyses of U. sibogae, G. margereli and C. pelagicus pelagicus percentages, number of coccoliths/g of sed- iment and NAR, which reveal the occurrence of rapid events, related to stadial and interstadial-type conditions. © 2015 Elsevier B.V. All rights reserved. 1. Introduction Coccolithophores are unicellular marine algae belonging to Haptophyta, an important taxonomic group of phytoplankton. Coccolithophore blooms, often quite extensive, are very important because vast amount of calcite–carbon and dimethyl sulfide, which may have a significant impact on the Earth's climate, are produced during these events. In addition, coccolithophore depend on ecolog- ical factors such as sunlight, salinity, temperature of the water masses, availability of nutrients and quickly respond to oceano- graphic and climatic changes. As coccolithophores are involved in oceanic biogeochemical cycles (Rost and Riebesell, 2004) and are sensi- tive to environmental and ecological conditions, they are of great im- portance in ocean dynamics on regional and global scales. For all these reasons the variations in the structure of their assemblages and the changes in abundance of some species of coccolithophores can be used to investigate changes in oceanographic conditions (e.g. Baumann and Freitag, 2004; Giraudeau, 1992a,b; Giraudeau et al., 1993; McIntyre, 1967; McIntyre and Bè, 1967; McIntyre et al., 1972; Samtleben and Schröder, 1992; Winter and Siesser, 1994). Therefore, coccoliths are con- sidered a valid proxy to reconstruct palaeoceanographic changes on the sea-surface and to study the development of the Earth climate in several basins at glacial–interglacial (Baumann and Freitag, 2004; Baumann et al., 2005; Flores et al., 2003; Giraudeau et al., 2004; Rogalla and Andruleit, 2005), as well as millennial scales (Alvarez et al., 2005; Amore et al., 2012; Colmenero-Hidalgo et al., 2004; Flores et al., 1997; Giraudeau et al., 2010; Marino et al., 2008; Palumbo et al., 2013a,b). Palaeogeography, Palaeoclimatology, Palaeoecology 430 (2015) 104–117 ⁎ Corresponding author. Tel.:+39 0824 305181; fax: +39 0824 305199. E-mail addresses: [email protected] (D. Emanuele), [email protected] (P. Ferretti), [email protected] (E. Palumbo), [email protected] (F.O. Amore). http://dx.doi.org/10.1016/j.palaeo.2015.04.014 0031-0182/© 2015 Elsevier B.V. All rights reserved. Contents lists available at ScienceDirect Palaeogeography, Palaeoclimatology, Palaeoecology journal homepage: www.elsevier.com/locate/palaeo
-
Upload
independent -
Category
Documents
-
view
4 -
download
0
Transcript of Sea-surface dynamics and palaeoenvironmental changes in the North Atlantic Ocean (IODP Site U1313)...
Palaeogeography, Palaeoclimatology, Palaeoecology 430 (2015) 104–117
Contents lists available at ScienceDirect
Palaeogeography, Palaeoclimatology, Palaeoecology
j ourna l homepage: www.e lsev ie r .com/ locate /pa laeo
Sea-surface dynamics and palaeoenvironmental changes in the NorthAtlantic Ocean (IODP Site U1313) during Marine Isotope Stage 19inferred from coccolithophore assemblages
D. Emanuele a, P. Ferretti b, E. Palumbo a, F.O. Amore a,⁎a DST - Università del Sannio, Via dei Mulini 59a, Benevento 82100, Italyb CNR-IDPA - Consiglio Nazionale delle Ricerche, Istituto per la Dinamica dei Processi Ambientali, Calle Larga Santa Marta 2137, Venezia I-30123, Italy
⁎ Corresponding author. Tel.:+39 0824 305181; fax: +E-mail addresses: [email protected] (D. Emanuele)
(P. Ferretti), [email protected] (E. Palumbo), f.amo
http://dx.doi.org/10.1016/j.palaeo.2015.04.0140031-0182/© 2015 Elsevier B.V. All rights reserved.
a b s t r a c t
a r t i c l e i n f oArticle history:Received 28 July 2014Received in revised form 1 April 2015Accepted 9 April 2015Available online 18 April 2015
Keywords:North Atlantic OceanIODP Site U1313Early-Middle PleistoceneMIS 19 interglacialCalcareous nannoplanktonForaminifera stable isotopes
Coccolithophore assemblages recovered from Integrated Ocean Drilling Program (IODP) Site U1313 are investi-gated to reconstruct the palaeoceanographic evolution of a sector of the North Atlantic during Marine IsotopeStage (MIS) 19 (~790–760 ka) at orbital, suborbital and millennial time-scales.The end of the glacial MIS 20 ismarked by the arrival of coldwaters, deriving from icemelting at higher latitudes,as recorded by Coccolithus pelagicus pelagicus. The MIS 19c is characterised by an extension of warmer North At-lantic Transitional Waters (NATW) reflecting the intensification of subtropical gyre influence on Site U1313,identified by an increase in warm species Umbilicosphaera sibogae. The influence on the site of cooler NATW isinferred from higher percentages of Gephyrocapsa margereli, which starts increasing from ~779 ka. Finally, thetransition from MIS 19a to MIS 18 is characterised by a southward shift of the palaeoceanographic system dueto a southward extension of the subpolar front, as indicated by an increase of cold subspecies C. pelagicuspelagicus.The evolution of the palaeoproductivity proxy records (number of coccoliths/g of sediment and Nannofossil Ac-cumulation Rate — NAR) and the abundances of small Gephyrocapsa, G. margereli, U. sibogae and C. pelagicuspelagicus show that fluctuations in sea-surface productivity and alternations between cooling and warmingphases occurred on the precessional timescale.Spectral analyses ofU. sibogae, number of coccoliths/g of sediment andNAR indicate a significant concentration ofvariance close to half precession (~10 kyr); this reflects a nonlinear response of the mid-latitude North Atlanticsurface ocean to low-latitude insolation forcing.Furthermore, millennial to multi-centennial instability in sea-surface dynamics is highlighted by spectral andwavelet analyses of U. sibogae, G. margereli and C. pelagicus pelagicus percentages, number of coccoliths/g of sed-iment and NAR, which reveal the occurrence of rapid events, related to stadial and interstadial-type conditions.
© 2015 Elsevier B.V. All rights reserved.
1. Introduction
Coccolithophores are unicellular marine algae belonging toHaptophyta, an important taxonomic group of phytoplankton.Coccolithophore blooms, often quite extensive, are very importantbecause vast amount of calcite–carbon and dimethyl sulfide, whichmay have a significant impact on the Earth's climate, are producedduring these events. In addition, coccolithophore depend on ecolog-ical factors such as sunlight, salinity, temperature of the watermasses, availability of nutrients and quickly respond to oceano-graphic and climatic changes. As coccolithophores are involved in
39 0824 305199., [email protected]@unisannio.it (F.O. Amore).
oceanic biogeochemical cycles (Rost and Riebesell, 2004) and are sensi-tive to environmental and ecological conditions, they are of great im-portance in ocean dynamics on regional and global scales. For all thesereasons the variations in the structure of their assemblages and thechanges in abundance of some species of coccolithophores can be usedto investigate changes in oceanographic conditions (e.g. Baumann andFreitag, 2004; Giraudeau, 1992a,b; Giraudeau et al., 1993; McIntyre,1967; McIntyre and Bè, 1967; McIntyre et al., 1972; Samtleben andSchröder, 1992; Winter and Siesser, 1994). Therefore, coccoliths are con-sidered a valid proxy to reconstruct palaeoceanographic changes on thesea-surface and to study the development of the Earth climate in severalbasins at glacial–interglacial (Baumann and Freitag, 2004; Baumann et al.,2005; Flores et al., 2003; Giraudeau et al., 2004; Rogalla and Andruleit,2005), as well as millennial scales (Alvarez et al., 2005; Amore et al.,2012; Colmenero-Hidalgo et al., 2004; Flores et al., 1997; Giraudeauet al., 2010; Marino et al., 2008; Palumbo et al., 2013a,b).
105D. Emanuele et al. / Palaeogeography, Palaeoclimatology, Palaeoecology 430 (2015) 104–117
In viewof future climate changes,millennial-scale climate variabilityduring Pleistocene interglacial intervals has received a great deal of at-tention in the past years because of its potential to provide analoguesto the climate stability of the Holocene. In this respect, the Marine Iso-tope Stage (MIS) 19, an interglacial stage that occurred between ~790and ~760 ka during the last part of the Mid-Pleistocene Transition,represents a very interesting case study. The orbital configurations ofboth MIS 19 and MIS 1 are very similar and characterised by a weakeccentricity-precession forcing, which determines subdued amplitudeof insolation changes (Berger et al., 1993). Unlike MIS 11, which haslong been considered a close analogue to the present interglacial(Droxler et al., 2003; Loutre and Berger, 2003), the phasing betweenprecession and obliquity during MIS 1 and 19 is comparable, makingMIS 19c a potential astronomical analogue to the Holocene and its fu-ture evolution (Ferretti et al., 2015; Pol et al., 2010; Tzedakis et al.,2012).
There is a dearth of high-resolution calcareous nannofossil recordsspanning MIS 19. In this work, for the first time, a high-resolutionstudy of MIS 19 by means of calcareous nannofossil assemblages en-ables the reconstruction of sea-surface dynamics and palaeoclimatichistory of a sector of the mid-latitude North Atlantic Ocean, located at
IODP U1313
AF
GS
AH
(a) (b)
(c)
NATW area
Cooler NATW
Warmer NATW
IL
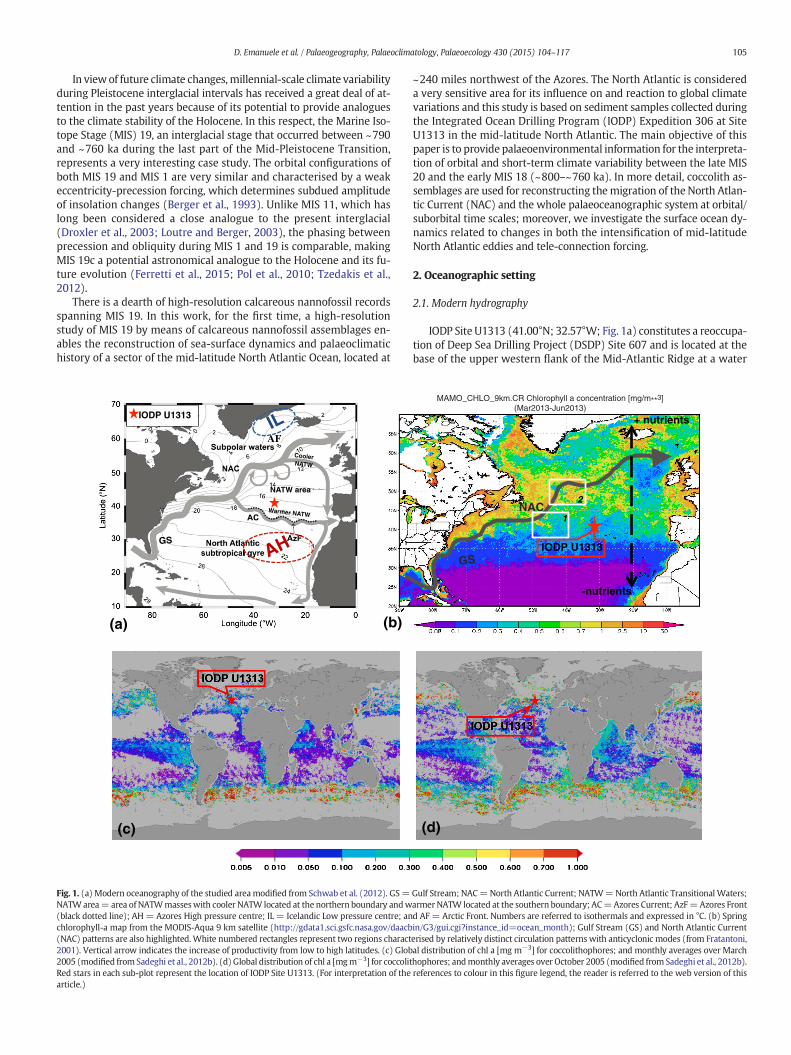
Fig. 1. (a) Modern oceanography of the studied areamodified from Schwab et al. (2012). GS=NATWarea= area of NATWmasseswith cooler NATW located at the northern boundary andw(black dotted line); AH= Azores High pressure centre; IL = Icelandic Low pressure centre; anchlorophyll-a map from the MODIS-Aqua 9 km satellite (http://gdata1.sci.gsfc.nasa.gov/daacb(NAC) patterns are also highlighted.White numbered rectangles represent two regions charact2001). Vertical arrow indicates the increase of productivity from low to high latitudes. (c) Glob2005 (modified from Sadeghi et al., 2012b). (d) Global distribution of chl a [mgm−3] for coccolitRed stars in each sub-plot represent the location of IODP Site U1313. (For interpretation of thearticle.)
~240 miles northwest of the Azores. The North Atlantic is considereda very sensitive area for its influence on and reaction to global climatevariations and this study is based on sediment samples collected duringthe Integrated Ocean Drilling Program (IODP) Expedition 306 at SiteU1313 in the mid-latitude North Atlantic. The main objective of thispaper is to provide palaeoenvironmental information for the interpreta-tion of orbital and short-term climate variability between the late MIS20 and the early MIS 18 (~800–~760 ka). In more detail, coccolith as-semblages are used for reconstructing themigration of the North Atlan-tic Current (NAC) and the whole palaeoceanographic system at orbital/suborbital time scales; moreover, we investigate the surface ocean dy-namics related to changes in both the intensification of mid-latitudeNorth Atlantic eddies and tele-connection forcing.
2. Oceanographic setting
2.1. Modern hydrography
IODP Site U1313 (41.00°N; 32.57°W; Fig. 1a) constitutes a reoccupa-tion of Deep Sea Drilling Project (DSDP) Site 607 and is located at thebase of the upper western flank of the Mid-Atlantic Ridge at a water
IODP U1313
+ nutrients
-nutrients
NAC
GS
(d)
1
2
MAMO_CHLO_9km.CR Chlorophyll a concentration [mg/m**3](Mar2013-Jun2013)
Gulf Stream; NAC=North Atlantic Current; NATW=North Atlantic Transitional Waters;armer NATW located at the southern boundary; AC=Azores Current; AzF=Azores Frontd AF = Arctic Front. Numbers are referred to isothermals and expressed in °C. (b) Springin/G3/gui.cgi?instance_id=ocean_month); Gulf Stream (GS) and North Atlantic Currenterised by relatively distinct circulation patterns with anticyclonic modes (from Fratantoni,al distribution of chl a [mg m−3] for coccolithophores; and monthly averages over Marchhophores; andmonthly averages over October 2005 (modified from Sadeghi et al., 2012b).references to colour in this figure legend, the reader is referred to the web version of this
106 D. Emanuele et al. / Palaeogeography, Palaeoclimatology, Palaeoecology 430 (2015) 104–117
depth of 3426 m, ~240 miles northwest of the Azores (Expedition 306Scientists, 2006; Stein et al., 2006).
The North Atlantic area is characterised by a complex current sys-tem, which constitutes the northern part of the Atlantic MeridionalOverturning Circulation. Currently, a continuous northern flow of sur-face water influences Site U1313. This flow originates from the GulfStream, which continues as North Atlantic Current (NAC) as it movesfromwest to east into the northeastern North Atlantic. The Gulf Streambranches into the NAC and the Azores Current that separates near theGrand Banks, close to 40°N 45°W (New et al., 2001; Fig. 1a). The NACis bordered at the north by the subpolar Front (Krauss, 1986), and atthe south by the North Atlantic Transitional Waters (NATW), whichare in turn bordered on the south by the Azores Current (Ottens,1991; Schwab et al., 2012; Fig. 1a). Thus, the NAC forms a transitionalzone, influenced by the strength and position of the subpolar gyre, be-tween twodifferent regimes: the cold, less saline and productive regimeconnected to the subpolar gyre at higher latitudes and the warm andoligotrophic waters connected to the subtropical gyre at mid- to low-latitudes. NATW show a wide latitudinal distribution, including waterscharacterised by Sea Surface Temperatures (SST) ranging between18 °C at the southern boundary, and 10 °C at the northern boundary(Schwab et al., 2012).
The subpolar gyre is associated with the NAC, which ultimately af-fects the position of subpolar and subtropical waters (Versteegh et al.,1996; Calvo et al., 2001; Villanueva et al., 2001; Lawrence et al., 2009;Robinson, 2009; Stein et al., 2009). The subpolar gyre is a region ofstrong interaction between ocean and atmosphere and, at multi-decadal time scales, its variability has been documented to be mainlytriggered by the North Atlantic Oscillation (NAO; Eden and Jung, 2001;Núñez-Riboni et al., 2012), a climatic phenomenon in the North Atlanticaffecting the atmospheric masses between the pressure centres of theAzores High (AH) and Icelandic Low (IL) (Fig. 1a). Several studiesshow that, during glacial periods, arctic waters extended into the mid-latitudes, producing a southward shift of the palaeoceanographic sys-tem (McIntyre et al., 1972; Naafs et al., 2010; Stein et al., 2009;Villanueva et al., 2001).
The region located just north of the NAC, associated with the posi-tion of the subpolar front, is characterised by high eddy activity that pro-motes surface water productivity. Eddy kinetic energy shows a verycomplex pattern. Two regions characterised by relatively distinct circu-lation patterns are present in the studied area, as indicated by whiterectangles in Fig. 1b: one is located in the Newfoundland Basin near45°W and 41°N, the other further north and closer to the NAC, atabout 40°W and 50°N; the latter is an anticyclonic recirculation celland is representative of the time-averaged Northwest Corner of theNAC (Fratantoni, 2001). The kinetic energy in these areas is not ashigh as in other regions close to the Gulf Stream and NAC (Fratantoni,2001). This is confirmed by observational data from the MODIS-Aqua9 km satellite that show that the concentration of chlorophyll-a ishigher close to the northern boundary region of the Gulf Stream andthe NAC than in the area neighbouring the studied site (Fig. 1b).Chlorophyll-a is a typical photosynthetic pigment present in all speciesof phytoplankton, including eukaryotic algae and is commonly used as avalid proxy for total phytoplankton biomass (Falkowski et al., 1998).Recent advances in hyper-spectral satellite studies have enabled thediscrimination of the global distribution of chlorophyll-a belonging todifferent groups of phytoplankton, and therefore the remote identifica-tion of coccolithophore distribution (Sadeghi et al., 2012a,b) (Fig. 1c–d).Average amounts of chlorophyll-a of coccolithophores in October(Fig. 1d) are elevated in the North Atlantic, while they are highest inthe higher latitudes of the North Atlantic, close to the polar front, whichmight be explained by the pronounced seasonal cycle of this group inthe north; the current distribution of coccolitophore chlorophyll-a(Fig. 1d) shows good agreement with the distribution of the totalchlorophyll-a (Fig. 1b), therefore these two chlorophyll-a maps may berepresentative of the total abundance of coccolithophore production
(i.e. nannoplankton accumulation rate and number of coccoliths/g ofsediment).
2.2. Biogeographic distribution of coccolithophore species
Modern biogeographic coccolithophore distribution in the AtlanticOcean mainly based on the zonation by McIntyre and Bè (1967),summarized and reviewed by Winter et al. (1994), is representative ofthe distribution of the different surface ocean water masses describedabove. Among all the taxa of calcareous nannofossils recognised in thesamples from IODP Site U1313, the most important ones from apalaeoceanographic point of viewareUmbilicosphaera sibogae, Coccolithuspelagicus subspecies pelagicus and Gephyrocapsa margereli (Fig. 2). Today,the biogeography of U. sibogae is restricted to tropical and subtropical lat-itudes and tomean annual SST N15 °C (Ziveri et al., 2004). The C. pelagicusspecies is widely found in the subarctic zone, especially during summermonths (Winter et al., 1994); its subspecies C. pelagicus pelagicus showshigher abundance in the northern Atlantic, in areas with SST b10 °C(Ziveri et al., 2004). In the Atlantic, G. margereli belongs to the same phy-logenetic lineage as Gephyrocapsa muellerae, which evolved from the for-mer at around200ka (Nowaczyk andBaumann, 1992). These two speciesshow strong ecological affinity and a clear preference for cold surfacewa-ters both in recent and Pleistocene glacial and stadial periods (Amoreet al., 2004; Amore et al., 2012; Bollmann, 1997; Bréhéret, 1978; Findlayand Flores, 2000; Flores et al., 1999; Jordan andWinter, 1998; Nowaczykand Baumann, 1992; Palumbo et al., 2013a,b; Wells and Okada, 1997;Winter and Siesser, 1994; Ziveri et al., 2004, among others). The abun-dance of G. muellerae currently exhibits an inverse relationshipwith tem-perature (Ziveri et al., 2004) and this species tolerates a temperaturerange between 5 and 18 °C, with an optimum of 14 °C (Samtleben et al.,1995). Because of their affinity from both an evolutionary and ecologicalpoint of view,weassume thatG.margerelihas a similar biogeographic dis-tribution as G. muellerae.
3. Material and methods
3.1. Age model
During IODP Expedition 306, four holes were drilled at Site U1313,providing ample material to construct two spliced stratigraphic se-quences. Hole B and Hole C were used to build the primary spliced sec-tion, whereas Hole A and Hole D were used for the secondary splice(Expedition 306 Scientists, 2006). The originalmetres composite depths(mcd) for Holes U1313A, U1313C and U1313D were updated after thecruise by tying them to the mcd scale for U1313B, which representsthe deepest continuously cored hole at this site. The adjustments in-volved simultaneously correlating the shipboard magnetostratigraphy,lightness and magnetic susceptibility measurements between the fourholes and led to a revised metres composite depth (rmcd) scale (Naafset al., 2012). The sampled sequence corresponds to 39.00–37.00 mcd(39.04–36.93 rmcd).
The age model for Site U1313 is based on stable isotope data of ben-thic and planktonic foraminifera from the secondary splice (Ferrettiet al., 2015). The δ18O measurements were carried out on Cibicidoideswuellerstorfi, an epifaunal benthic foraminiferal species, and Globigerinabulloides (selected from the 315 to 355 μm size fraction), a mixed-layerdwelling planktonic foraminifera that in the North Atlantic lives in theupper 60 m of the water column (Schiebel et al., 1997). Between 5and 10 specimens of C. wuellerstorfi and 20 specimens of G. bulloideswere selected for each analysis. The selected specimens were lightlycrushed and soaked in methanol, sonically cleaned to remove fine-grain particles, after which the excess liquid was siphoned off and sam-ples were dried under a vacuum hood. The isotopic composition of car-bon dioxide released from the foraminiferal carbonate was measuredusing a ThermoFinnigan MAT 252 mass spectrometer linked online toa single acid bath CarboKiel-II carbonate preparation device at the
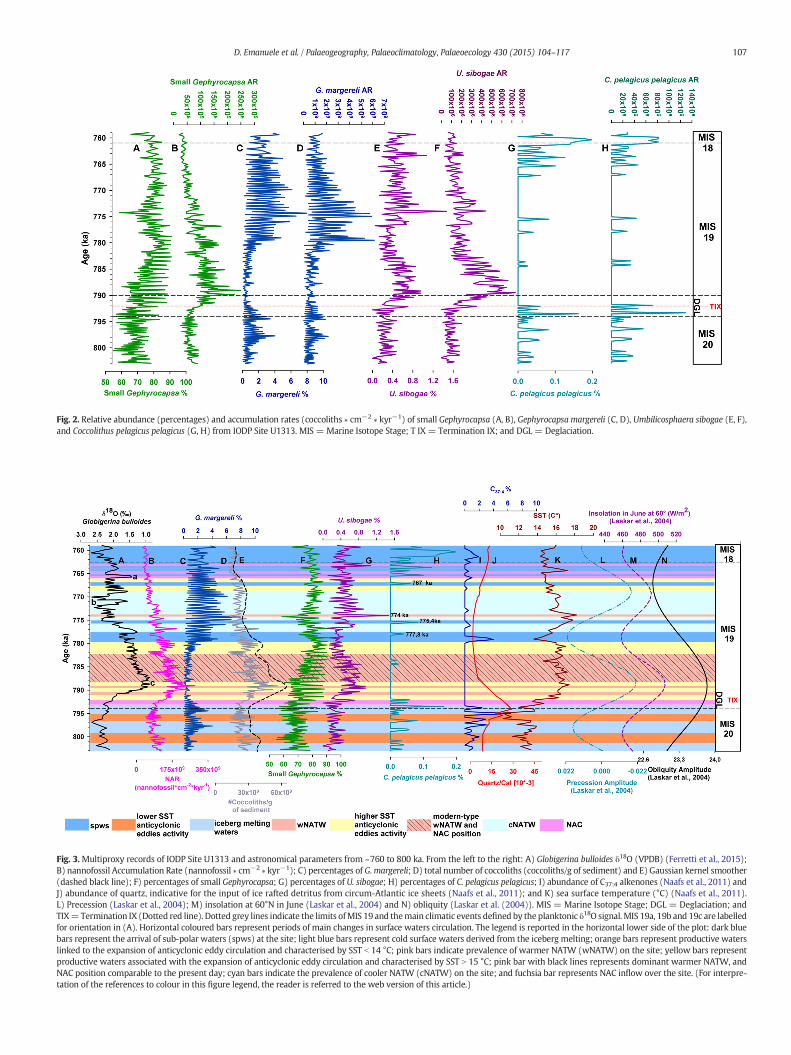
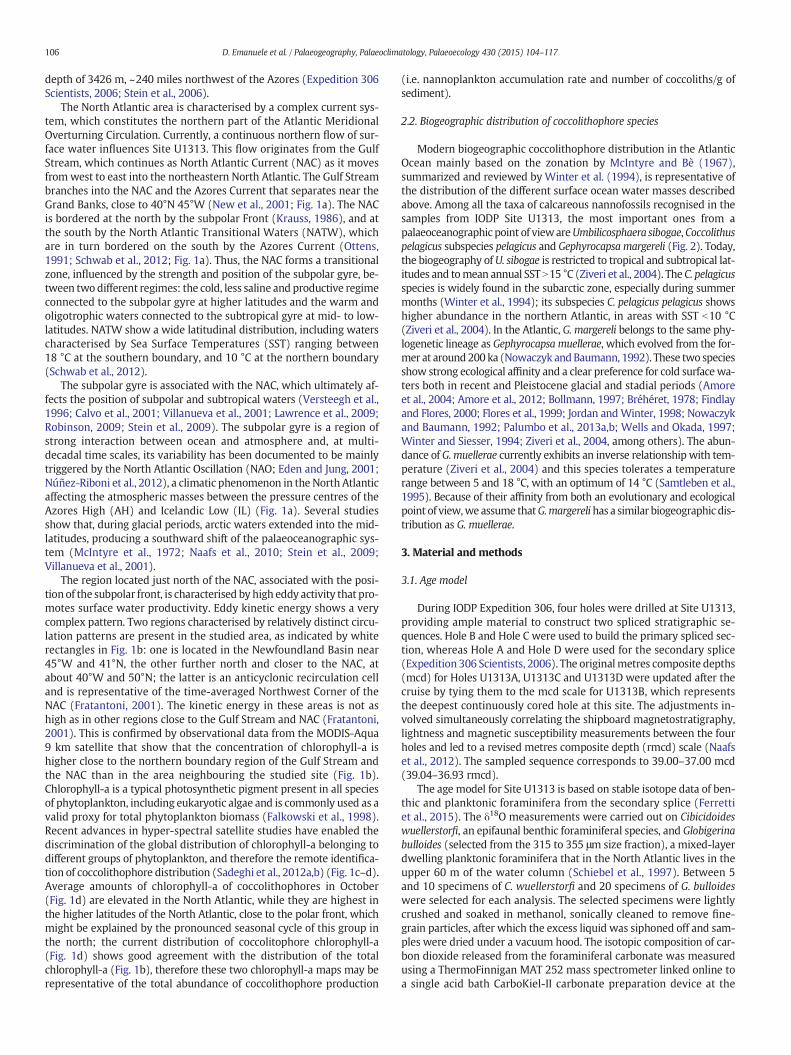
Fig. 2. Relative abundance (percentages) and accumulation rates (coccoliths ∗ cm−2 ∗ kyr−1) of small Gephyrocapsa (A, B), Gephyrocapsa margereli (C, D), Umbilicosphaera sibogae (E, F),and Coccolithus pelagicus pelagicus (G, H) from IODP Site U1313. MIS = Marine Isotope Stage; T IX = Termination IX; and DGL = Deglaciation.
Fig. 3.Multiproxy records of IODP Site U1313 and astronomical parameters from ~760 to 800 ka. From the left to the right: A) Globigerina bulloides δ18O (VPDB) (Ferretti et al., 2015);B) nannofossil Accumulation Rate (nannofossil ∗ cm−2 ∗ kyr−1); C) percentages of G. margereli; D) total number of coccoliths (coccoliths/g of sediment) and E) Gaussian kernel smoother(dashed black line); F) percentages of small Gephyrocapsa; G) percentages of U. sibogae; H) percentages of C. pelagicus pelagicus; I) abundance of C37:4 alkenones (Naafs et al., 2011) andJ) abundance of quartz, indicative for the input of ice rafted detritus from circum-Atlantic ice sheets (Naafs et al., 2011); and K) sea surface temperature (°C) (Naafs et al., 2011).L) Precession (Laskar et al., 2004); M) insolation at 60°N in June (Laskar et al., 2004) and N) obliquity (Laskar et al. (2004)). MIS = Marine Isotope Stage; DGL = Deglaciation; andTIX=Termination IX (Dotted red line). Dotted grey lines indicate the limits ofMIS 19 and themain climatic events defined by the planktonic δ18O signal. MIS 19a, 19b and 19c are labelledfor orientation in (A). Horizontal coloured bars represent periods of main changes in surface waters circulation. The legend is reported in the horizontal lower side of the plot: dark bluebars represent the arrival of sub-polar waters (spws) at the site; light blue bars represent cold surface waters derived from the iceberg melting; orange bars represent productive waterslinked to the expansion of anticyclonic eddy circulation and characterised by SST b 14 °C; pink bars indicate prevalence of warmer NATW (wNATW) on the site; yellow bars representproductive waters associated with the expansion of anticyclonic eddy circulation and characterised by SST N 15 °C; pink bar with black lines represents dominant warmer NATW, andNAC position comparable to the present day; cyan bars indicate the prevalence of cooler NATW (cNATW) on the site; and fuchsia bar represents NAC inflow over the site. (For interpre-tation of the references to colour in this figure legend, the reader is referred to the web version of this article.)
107D. Emanuele et al. / Palaeogeography, Palaeoclimatology, Palaeoecology 430 (2015) 104–117
108 D. Emanuele et al. / Palaeogeography, Palaeoclimatology, Palaeoecology 430 (2015) 104–117
Serveis Científico-Tècnics of the University of Barcelona. Analytical pre-cision was estimated to be 0.08‰ for δ18O and 0.04‰ for δ13C, and iso-tope values were calibrated to the Vienna Pee Dee Belemnite scale(VPDB) with the NBS-19 carbonate standard.
A preliminary depth-to-age conversion was obtained by tuning thebenthic oxygen signal to the stacked δ18O record of Lisiecki andRaymo (2005), hereafter referred to as LR04. This timescale was subse-quently refined through a fine-tuning of the extracted precession com-ponent of the planktonic δ18O record to the precession index, whilemaintaining the LR04 stack as the main tuning basis (Ferretti et al.,2015). According to the age model, the investigated record spans thetime interval from ~803 to ~759 ka (Fig. 3a). The sedimentation rate ob-tained is in the order of 5 cm/kyr allowing an average resolution of~200 years for a 1 cm sampling interval.
3.2. Sampling and analyses
A total of 201 samples, spaced every 1 cm, were collected from SiteU1313 Hole C, following the primary splice, at the IODP Bremen CoreRepository. The sampled section is from 306-U1313C-5H-1-126 to306-U1313C-5H-3-28 and the dominant lithology is nannofossil ooze,with minor lithologies represented by nannofossil ooze with clay andnannofossil silty clay with diatoms. Bioturbation is rare to moderate(Expedition 306 Scientists, 2006). The studied interval (MIS 20–18)falls within the CN 14a subzone of Okada and Bukry (1980) (CNPL10Zone of Backman et al., 2012). The interval is also equivalent to QAZ 5the small Gephyrocapsa Quaternary Acme Zone of Hine (1990), whichcoincides with an acme interval dominated by small Gephyrocapsa,mainly Gephyrocapsa aperta, and small specimens of Gephyrocapsacaribbeanica (Heine and Weaver, 1998), which are abundant in thestudied assemblages.
The slides for coccolith analysis were prepared through the set-tling technique proposed by Flores and Sierro (1997). This procedureallows one to obtain both percentages and absolute values, i.e. theabsolute number of coccoliths/g of sediment (N) and the NannofossilAccumulation Rate (NAR nannofossil ∗ cm−2 ∗ kyr−1). Coccolithspecimens, identified according to the taxonomic concept of Younget al. (2003, 2014), were counted in random visual fields using aNikon polarised light microscope at 1000× magnification, countingat least 300 specimens larger than 3 μmper slide in a varying numberof fields of view. In the same fields, a separated count of specimenssmaller than 3 μm was also performed in order to quantify the abso-lute and percentage values of all taxa (Fig. 2). This ensured a 95%level of confidence for all species present with an abundance of atleast 1% (Patterson and Fishbein, 1989). In addition, followingBuzas (1990), we referred to species with abundance below 1% iftheir presence is significant from a palaeoceanographic point ofview. C. pelagicus was differentiated on the basis of the length of itscoccoliths: C. pelagicus (Schiller, 1930; Wallich, 1877) ssp. pelagicus(6–10 μm) is the cold form, and C. pelagicus ssp. braarudii (Gaarder,1962; Geisen et al., 2002) (9–15 μm) the form found in temperateand upwelling waters.
The software NIS-elements BR 3.10, adapted to calcareous nanno-plankton research, was used for observing some specific details of thespecimens (i.e. length, shape etc.) and to keep track of the counting,which was carried out in any case by a human operator.
3.3. Time series analyses
Different time series analyseswere applied to our records in order toexamine the recorded climatic variance, summarise the evolution of or-bital and millennial scale periodicities, and finally recognise possibleforcings and their influence on coccolithophore assemblages.
Red-noise spectra were estimated directly from unevenly spacedtime series, using the package REDFIT provided by Schulz andMudelsee (2002) and implemented in the Paleontological Statistical
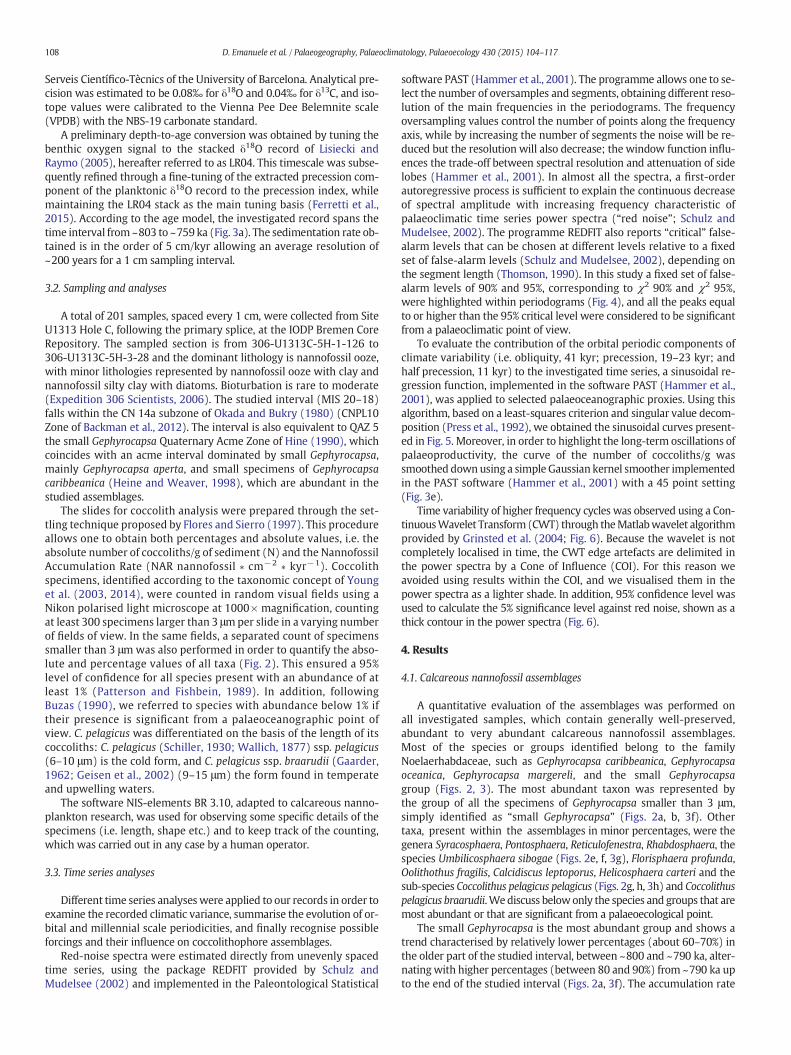
software PAST (Hammer et al., 2001). The programme allows one to se-lect the number of oversamples and segments, obtaining different reso-lution of the main frequencies in the periodograms. The frequencyoversampling values control the number of points along the frequencyaxis, while by increasing the number of segments the noise will be re-duced but the resolution will also decrease; the window function influ-ences the trade-off between spectral resolution and attenuation of sidelobes (Hammer et al., 2001). In almost all the spectra, a first-orderautoregressive process is sufficient to explain the continuous decreaseof spectral amplitude with increasing frequency characteristic ofpalaeoclimatic time series power spectra (“red noise”; Schulz andMudelsee, 2002). The programme REDFIT also reports “critical” false-alarm levels that can be chosen at different levels relative to a fixedset of false-alarm levels (Schulz and Mudelsee, 2002), depending onthe segment length (Thomson, 1990). In this study a fixed set of false-alarm levels of 90% and 95%, corresponding to χ2 90% and χ2 95%,were highlighted within periodograms (Fig. 4), and all the peaks equalto or higher than the 95% critical level were considered to be significantfrom a palaeoclimatic point of view.
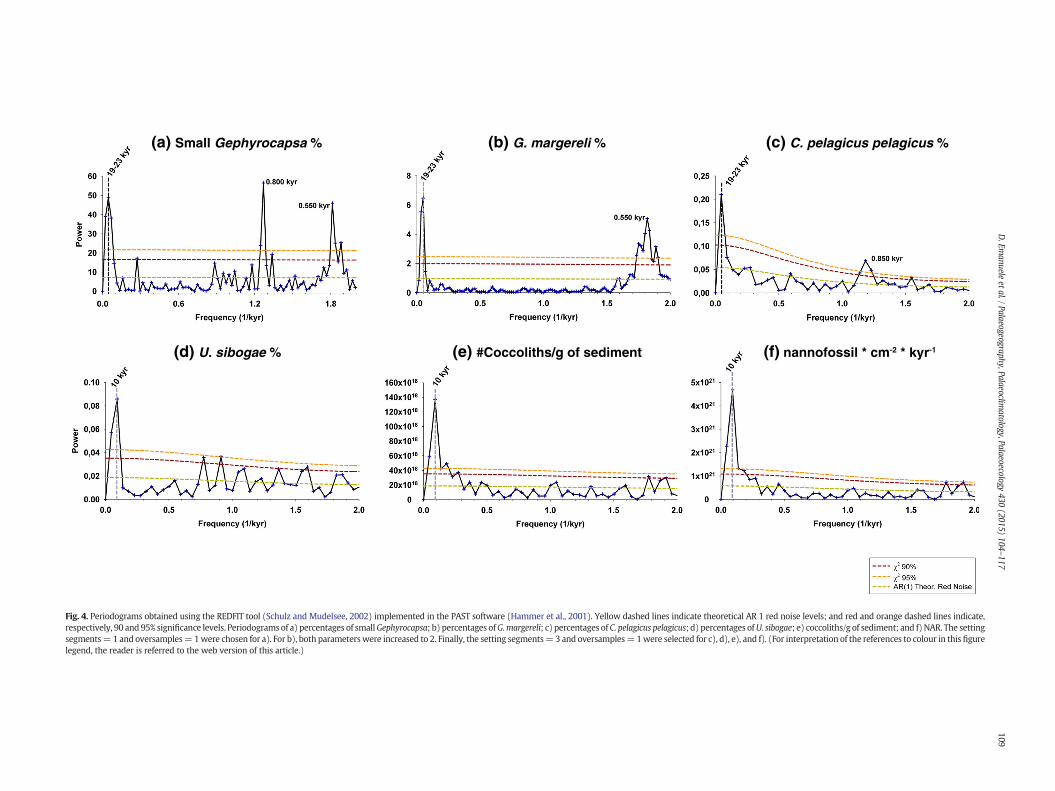
To evaluate the contribution of the orbital periodic components ofclimate variability (i.e. obliquity, 41 kyr; precession, 19–23 kyr; andhalf precession, 11 kyr) to the investigated time series, a sinusoidal re-gression function, implemented in the software PAST (Hammer et al.,2001), was applied to selected palaeoceanographic proxies. Using thisalgorithm, based on a least-squares criterion and singular value decom-position (Press et al., 1992), we obtained the sinusoidal curves present-ed in Fig. 5. Moreover, in order to highlight the long-term oscillations ofpalaeoproductivity, the curve of the number of coccoliths/g wassmoothed downusing a simple Gaussian kernel smoother implementedin the PAST software (Hammer et al., 2001) with a 45 point setting(Fig. 3e).
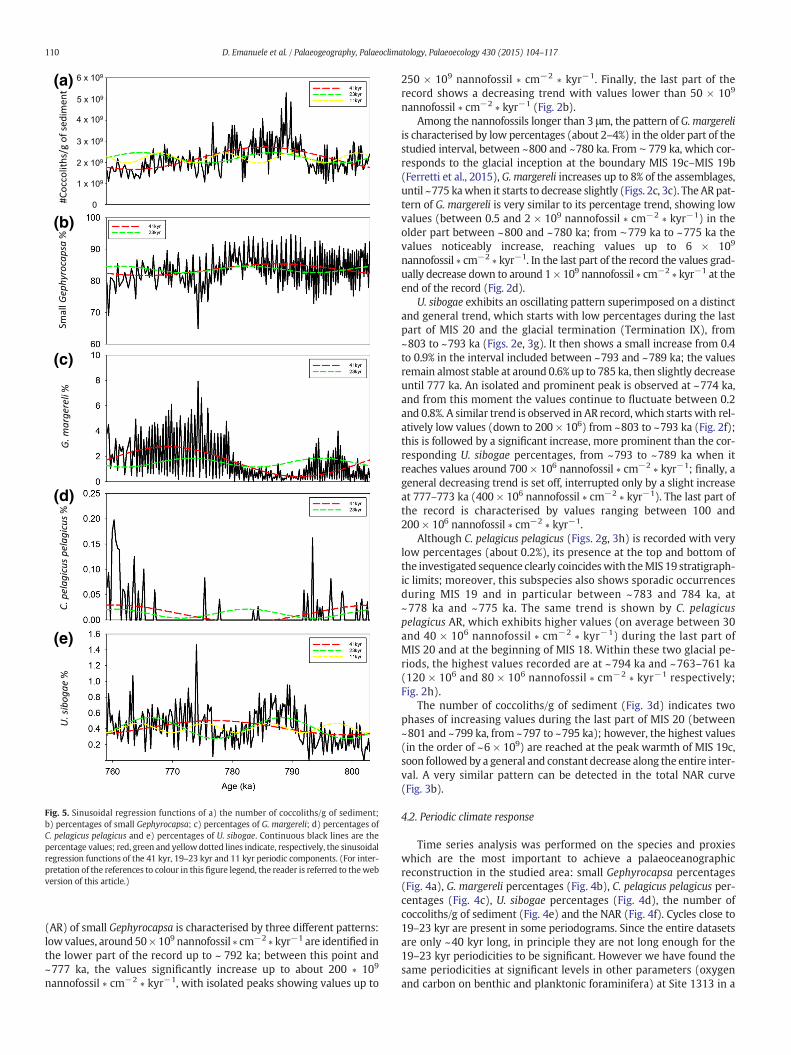
Time variability of higher frequency cycles was observed using a Con-tinuousWavelet Transform (CWT) through theMatlabwavelet algorithmprovided by Grinsted et al. (2004; Fig. 6). Because the wavelet is notcompletely localised in time, the CWT edge artefacts are delimited inthe power spectra by a Cone of Influence (COI). For this reason weavoided using results within the COI, and we visualised them in thepower spectra as a lighter shade. In addition, 95% confidence level wasused to calculate the 5% significance level against red noise, shown as athick contour in the power spectra (Fig. 6).
4. Results
4.1. Calcareous nannofossil assemblages
A quantitative evaluation of the assemblages was performed onall investigated samples, which contain generally well-preserved,abundant to very abundant calcareous nannofossil assemblages.Most of the species or groups identified belong to the familyNoelaerhabdaceae, such as Gephyrocapsa caribbeanica, Gephyrocapsaoceanica, Gephyrocapsa margereli, and the small Gephyrocapsagroup (Figs. 2, 3). The most abundant taxon was represented bythe group of all the specimens of Gephyrocapsa smaller than 3 μm,simply identified as “small Gephyrocapsa” (Figs. 2a, b, 3f). Othertaxa, present within the assemblages in minor percentages, were thegenera Syracosphaera, Pontosphaera, Reticulofenestra, Rhabdosphaera, thespecies Umbilicosphaera sibogae (Figs. 2e, f, 3g), Florisphaera profunda,Oolithothus fragilis, Calcidiscus leptoporus, Helicosphaera carteri and thesub-species Coccolithus pelagicus pelagicus (Figs. 2g, h, 3h) and Coccolithuspelagicus braarudii.We discuss belowonly the species and groups that aremost abundant or that are significant from a palaeoecological point.
The small Gephyrocapsa is the most abundant group and shows atrend characterised by relatively lower percentages (about 60–70%) inthe older part of the studied interval, between ~800 and ~790 ka, alter-natingwith higher percentages (between 80 and 90%) from ~790 ka upto the end of the studied interval (Figs. 2a, 3f). The accumulation rate
(d) U. sibogae % (e) #Coccoliths/g of sediment (f) nannofossil * cm-2 * kyr-1
(c) C. pelagicus pelagicus %(b) G. margereli %(a) Small Gephyrocapsa %
Fig. 4. Periodograms obtained using the REDFIT tool (Schulz and Mudelsee, 2002) implemented in the PAST software (Hammer et al., 2001). Yellow dashed lines indicate theoretical AR 1 red noise levels; and red and orange dashed lines indicate,respectively, 90 and 95% significance levels. Periodograms of a) percentages of smallGephyrocapsa; b) percentages ofG.margereli; c) percentages of C. pelagicus pelagicus; d) percentages ofU. sibogae; e) coccoliths/g of sediment; and f) NAR. The settingsegments=1 and oversamples=1were chosen for a). For b), both parameterswere increased to 2. Finally, the setting segments=3 and oversamples=1were selected for c), d), e), and f). (For interpretation of the references to colour in this figurelegend, the reader is referred to the web version of this article.)
109D.Em
anueleetal./Palaeogeography,Palaeoclim
atology,Palaeoecology430
(2015)104
–117
(a)
(b)
(c)
(d)
(e)
Fig. 5. Sinusoidal regression functions of a) the number of coccoliths/g of sediment;b) percentages of small Gephyrocapsa; c) percentages of G. margereli; d) percentages ofC. pelagicus pelagicus and e) percentages of U. sibogae. Continuous black lines are thepercentage values; red, green and yellowdotted lines indicate, respectively, the sinusoidalregression functions of the 41 kyr, 19–23 kyr and 11 kyr periodic components. (For inter-pretation of the references to colour in this figure legend, the reader is referred to thewebversion of this article.)
110 D. Emanuele et al. / Palaeogeography, Palaeoclimatology, Palaeoecology 430 (2015) 104–117
(AR) of small Gephyrocapsa is characterised by three different patterns:low values, around 50× 109 nannofossil ∗ cm−2 ∗ kyr−1 are identified inthe lower part of the record up to ~ 792 ka; between this point and~777 ka, the values significantly increase up to about 200 ∗ 109
nannofossil ∗ cm−2 ∗ kyr−1, with isolated peaks showing values up to
250 × 109 nannofossil ∗ cm−2 ∗ kyr−1. Finally, the last part of therecord shows a decreasing trend with values lower than 50 × 109
nannofossil ∗ cm−2 ∗ kyr−1 (Fig. 2b).Among the nannofossils longer than 3 μm, the pattern of G. margereli
is characterised by low percentages (about 2–4%) in the older part of thestudied interval, between ~800 and ~780 ka. From ∼ 779 ka, which cor-responds to the glacial inception at the boundary MIS 19c–MIS 19b(Ferretti et al., 2015), G. margereli increases up to 8% of the assemblages,until ~775 kawhen it starts to decrease slightly (Figs. 2c, 3c). The AR pat-tern of G. margereli is very similar to its percentage trend, showing lowvalues (between 0.5 and 2 × 10⁹ nannofossil ∗ cm−2 ∗ kyr−1) in theolder part between ~800 and ~780 ka; from ∼779 ka to ~775 ka thevalues noticeably increase, reaching values up to 6 × 10⁹
nannofossil ∗ cm−2 ∗ kyr−1. In the last part of the record the values grad-ually decrease down to around 1 × 10⁹ nannofossil ∗ cm−2 ∗ kyr−1 at theend of the record (Fig. 2d).
U. sibogae exhibits an oscillating pattern superimposed on a distinctand general trend, which starts with low percentages during the lastpart of MIS 20 and the glacial termination (Termination IX), from~803 to ~793 ka (Figs. 2e, 3g). It then shows a small increase from 0.4to 0.9% in the interval included between ~793 and ~789 ka; the valuesremain almost stable at around 0.6% up to 785 ka, then slightly decreaseuntil 777 ka. An isolated and prominent peak is observed at ~774 ka,and from this moment the values continue to fluctuate between 0.2and 0.8%. A similar trend is observed in AR record, which starts with rel-atively low values (down to 200 × 106) from ~803 to ~793 ka (Fig. 2f);this is followed by a significant increase, more prominent than the cor-responding U. sibogae percentages, from ~793 to ~789 ka when itreaches values around 700 × 106 nannofossil ∗ cm−2 ∗ kyr−1; finally, ageneral decreasing trend is set off, interrupted only by a slight increaseat 777–773 ka (400 × 106 nannofossil ∗ cm−2 ∗ kyr−1). The last part ofthe record is characterised by values ranging between 100 and200 × 106 nannofossil ∗ cm−2 ∗ kyr−1.
Although C. pelagicus pelagicus (Figs. 2g, 3h) is recorded with verylow percentages (about 0.2%), its presence at the top and bottom ofthe investigated sequence clearly coincideswith theMIS 19 stratigraph-ic limits; moreover, this subspecies also shows sporadic occurrencesduring MIS 19 and in particular between ~783 and 784 ka, at~778 ka and ~775 ka. The same trend is shown by C. pelagicuspelagicus AR, which exhibits higher values (on average between 30and 40 × 106 nannofossil ∗ cm−2 ∗ kyr−1) during the last part ofMIS 20 and at the beginning of MIS 18. Within these two glacial pe-riods, the highest values recorded are at ~794 ka and ~763–761 ka(120 × 106 and 80 × 106 nannofossil ∗ cm−2 ∗ kyr−1 respectively;Fig. 2h).
The number of coccoliths/g of sediment (Fig. 3d) indicates twophases of increasing values during the last part of MIS 20 (between~801 and ~799 ka, from ~797 to ~795 ka); however, the highest values(in the order of ~6 × 10⁹) are reached at the peak warmth of MIS 19c,soon followed by a general and constant decrease along the entire inter-val. A very similar pattern can be detected in the total NAR curve(Fig. 3b).
4.2. Periodic climate response
Time series analysis was performed on the species and proxieswhich are the most important to achieve a palaeoceanographicreconstruction in the studied area: small Gephyrocapsa percentages(Fig. 4a), G. margereli percentages (Fig. 4b), C. pelagicus pelagicus per-centages (Fig. 4c), U. sibogae percentages (Fig. 4d), the number ofcoccoliths/g of sediment (Fig. 4e) and the NAR (Fig. 4f). Cycles close to19–23 kyr are present in some periodograms. Since the entire datasetsare only ~40 kyr long, in principle they are not long enough for the19–23 kyr periodicities to be significant. However we have found thesame periodicities at significant levels in other parameters (oxygenand carbon on benthic and planktonic foraminifera) at Site 1313 in a
(a) G. margereli %
(b) C. pelagicus pelagicus %
(d) #Coccoliths/g of sediment
(e) NAR-Nannofossil * cm-2-2 * kyr-1-1
(c) U. sibogae %
Fig. 6. (a) Continuouswavelet power spectra of a) percentages of G.margereli, b) percentages of C. pelagicus pelagicus, c) percentages ofU. sibogae, d) coccoliths/g of sediment, and e) NAR.Black lines, delineating the lighter shade of the spectra, represent the Cone of influence (COI), the regions of the spectra where signals could be unreal because of the zero-padding(Torrence and Compo, 1998). Thick contour in the spectra indicate 95% confidence level of signals time variability. Right sides colour bars indicate the amplitude of thewavelet coefficientswith low values identified by blue levels, shading to red colourwhen they reach high values. (For interpretation of the references to colour in this figure legend, the reader is referred to theweb version of this article.)
111D. Emanuele et al. / Palaeogeography, Palaeoclimatology, Palaeoecology 430 (2015) 104–117
much longer time window, between ~910 and 740 kyr (Ferretti et al.,2015). The presence of precession cycles in other proxy records fromthe same site, together with the clear contribution of precession onthe sinusoidal curves of U. sibogae, G. margereli and the number ofcoccoliths/g (Fig. 5), suggests that the precession cycles recorded in thecoccoliths assemblages should be considered as a real response to climateforcing. Spectral power is also concentrated in the 10-kyr band in the re-cords of U. sibogae (Fig. 4d), the number of coccoliths/g (Fig. 4e) and NAR(Fig. 4f). Concentration of variance is also detected at higher frequencies,and cycles of 0.5–0.850 kyr can be identified in the periodograms of smallGephyrocapsa (Fig. 4a), G. margereli (Fig. 4b), C. pelagicus pelagicus per-centages (Fig. 4c), the number of coccoliths/g of sediment (Fig. 4e) andNAR (Fig. 4f). The same cycles can be identified in the wavelet powerspectra of G. margereli (Fig. 6a), C. pelagicus pelagicus percentages(Fig. 6b), the number of coccoliths/g of sediment (Fig. 6d) and, even ifwith less power, the NAR (Fig. 6e). The wavelet power spectrum ofC. pelagicus pelagicus exhibits relatively strong power in the 0.850 kyr pe-riod distributed between 794–792 ka and 767–760 ka (Fig. 6b). The 0.5and 0.850-kyr components of the number of coccoliths/g of sediment dis-play the highest power between 800–801, 798–796 and 792–775 ka(Fig. 6d). G. margereli percentages exhibit strong power in the 0.5 kyrband between 777 and 763 ka (Fig. 6a). Spectral power centred at ~1-kyr period in the U. sibogae is apparent between 776 and 770 ka (Fig. 6c).
5. Discussion
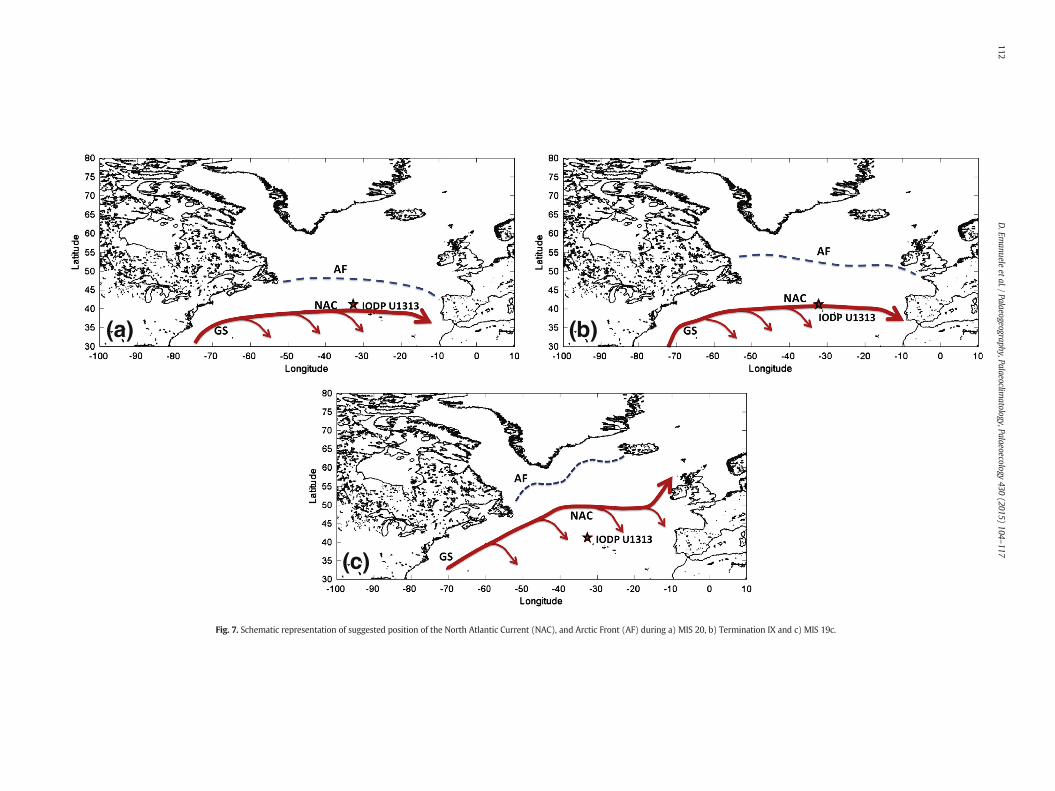
The palaeoceanographic dynamics on orbital and suborbital time scalehave been reconstructed during the interval ~800–760 ka, on the basis ofthe results obtained from the analysis of different proxies. Our calcareousnannofossil data analyses and available alkenone records (Naafs et al.,2011) indicate that during the glacial periods under study the surfacewater circulation in the North Atlantic was significantly different fromtoday: colder conditions prevailed in this area because the subpolarfront was located at a more southerly position (Pflaumann et al., 2003),as suggested by the higher abundances of C. pelagicus pelagicus, a subspe-cies living today in the subarctic zone, and G. margereli, an organism typ-ical of cold surfacewaters (Fig. 3); consequently, the NAC flowed south ofitsmodern latitude (Fig. 7a).MIS 19was characterised by interglacial con-ditions duringmarine isotope substage 19c, followed by a gradual coolingtowards the end of the stage. This pattern is clearly seen in the U. sibogae,C. pelagicus pelagicus andG. margereli records, reflecting a northward shiftof the NAC andNATW, in relationwith their position duringMIS 20, up to~782 ka (Fig. 7b, 7c), followed by a southward movement from ~782 kaonwards.
The rapid succession of palaeoceanographic events, marked by spe-cific increases in C. pelagicus pelagicus (∼ 777.8, 775.4 and 767 ka) and ofU. sibogae percentages (∼ 774 and 789 ka), is indicative of
(a) (b)
(c)
Fig. 7. Schematic representation of suggested position of the North Atlantic Current (NAC), and Arctic Front (AF) during a) MIS 20, b) Termination IX and c) MIS 19c.
112D.Em
anueleetal./Palaeogeography,Palaeoclim
atology,Palaeoecology430
(2015)104
–117
113D. Emanuele et al. / Palaeogeography, Palaeoclimatology, Palaeoecology 430 (2015) 104–117
palaeoceanographic instability during much of the studied interval atmillennial scale.
5.1. Late MIS 20 and Termination IX
This period predates the onset of the interglacial conditionscharacterising the first part of MIS 19, and represents the late MIS 20and the deglaciation phase at the MIS 20/19 boundary, from ~800 to~790 ka. Our study indicates that, although the NAC flowed south of thesite location (Fig. 7a), the period is characterised by the highestpalaeoceanographic instability of the entire investigated time interval.This period is also marked by an increase in the abundance of coldspecies G. margereli (Fig. 3c), which occurred in two steps (light blue ver-tical bars in Fig. 3); this general pattern, together with the low percent-ages of U. sibogae (Fig. 3g) and higher percentages of C. pelagicuspelagicus (Fig. 3h), suggests the prevalence of cold waters over the site.Further support for this cold scenario comes from the low values of thealkenone-derived SST at Site U1313 (Fig. 3k), heavy planktonic δ18Ovalues (Fig. 3a) togetherwith an increased proportion of tetraunsaturatedC37 alkenone to total C37 alkenones (C37:4; Fig. 3i), which is indicative ofless saline polar/artic waters at this site location (Naafs et al., 2011). In-creases in C37:4 alkenone are in line with the higher percentages ofC. pelagicus pelagicus and enhanced abundance of quartz, which is indica-tive of the input of Ice Rafted Detritus (IRD, Fig. 3j) from circum-Atlanticice sheets (Naafs et al., 2011), suggesting that the arrival of cold waterat Site U1313 was related to iceberg melting. Similar associations ofhigher percentages of C. pelagicus pelagicus and increases in C37:4alkenone were already observed in previous studies of the North AtlanticOcean during the Middle Pleistocene, although with a different composi-tion of lithic fragments (Amore et al., 2012; Palumbo et al., 2013b).
Superimposed on this cold trend, two phases of increasedpalaeoproductivity are recorded by the NAR (Fig. 3b) and total numberof coccoliths/g of sediment (Fig. 3d) (orange vertical bars in Fig. 3).These two episodes of increased palaeoproductivity, together with thelowSST values (Fig. 3k;Naafs et al., 2011), suggest an expansionof the an-ticyclonic eddy circulation, currently located in the North Newfoundlandbasin close to the NAC path and situated in correspondence with coolerand nutrient-rich waters (Fig. 1b). An expansion of warm-temperate wa-ters and lower coccolith palaeoproductivity (Fig. 3b, d) occurred in corre-spondence with Termination IX, from ~793 to ~792 ka, when the NACpath reached the site (Fig. 7b), as evidenced also by an increase inU. sibogae abundances (Fig. 3) (fuchsia vertical bar in Fig. 3). The influenceof warmer NATW begins to prevail and alternates with episodes of in-creased productivity, related to the eddies located south of the NAC(Fig. 1a).
5.2. Sea-surface dynamics during MIS 19
The MIS 19c is characterised by a lower palaeoceanographic var-iability compared to the previous interval encompassing the late glacial/deglaciation, and clear interglacial conditions can be inferred from thecoccolith assemblages (Fig. 3). In particular, during this substage ofMIS 19, coccolith assemblages are characterised by an increase inwarm taxa, mainly represented by the warm and oligotrophic spe-cies U. sibogae (Fig. 3g). The general trend of the total number ofcoccoliths/g of sediment (Fig. 3d) and NAR records (Fig. 3b) also pre-sents a similar increase. However, by looking in more detail at thehigher frequency variability of these proxy records, it is evidentthat the rapid fluctuations of U. sibogae abundances are opposite inphase to the total number of coccoliths from c. 793 to 789 ka (yellowand pink vertical bars in Fig. 3), so that high percentages of warm andoligotrophic species U. sibogae are connected, as expected, with thearrival at the site of warmer NATW; these water masses arecharacterised by low productivity, as also confirmed by the lowvalues of the total number of coccoliths.
At the same time, the cold C. pelagicus pelagicus morphotype(Fig. 3h) and the temperate species G. margereli (Fig. 3c) either areabsent or record their lowest percentages. The high percentages ofU. sibogae suggest the influence of warmer NATW, while the total num-ber of coccoliths indicates an extension of the anticyclonic eddy circula-tion occurring in two rather rapid phases (between ~790 and 788 ka,and from ~782 to 780 ka). The mutually opposite trends of the recordsof U. sibogae (Fig. 3g) and G. margereli (Fig. 3c) demonstrate that thesepalaeoceanographic signals are related to a stronger influence of warm-er NATW. This observation is in line with the alkenone-derived SSTs(Naafs et al., 2011), which indicate relatively warm (~16 °C) and stableconditions during MIS 19c (and interrupted by a small decrease of SSTup to 13.6 °C at 779 ka (Fig. 3k), in correspondencewith high precessionvalues (Fig. 3l)). The arrival of warmer waters (as recorded by theU. sibogae), located in the southern NATW area, takes place from ~789and lasted up to 782 ka, indicating a period of warm conditions at thesite (dashed pink vertical bar in Fig. 3). Low percentages ofG. margereli suggest that during this interval the site was never reachedby a prevalence of cool water located in the northern NATW area. Com-paring the present-day U. sibogae percentages at the study area (Ziveriet al., 2004) to those from the MIS 19c shows that the site was neveraffected by significantly warmer conditions than the present ones, andsuggests a NAC position similar to the present one in this specific inter-val of time. Moreover the absence of the morphotype C. pelagicusazorinus might suggest that during MIS 19c the Arctic Front was neverlocated to the north of its present latitudinal position (Parente et al.,2004). From 782 to 780 ka, a small decrease of U. sibogae is observed,with respect to the previous time-slice (789–782 ka), together withSST values of ~16 °C and a slight increase of both the NAR and numberof coccoliths/g of sediment (yellow vertical bar in Fig. 3); all this evi-dence suggests a southward expansion of the productivity zone.Today, mixing processes related to anticyclonic eddy activity (Fig. 1bregion 1, marked by thewhite rectangle) supply nutrients to the surfacewater (Garside and Garside, 1993); moreover there is a specific succes-sion of responses in the plankton communities because after the firstspring bloom phase, dominated by diatoms, nannophytoplanktongains more importance as primary producers when silicate is depleted,as observed in surface water samples (Lochte et al., 1993; Sieracki et al.,1993) and sediment traps from the North Atlantic (Broerse et al., 2000).
The MIS 19b, from ~779 to ~769 ka, is characterised by lowerabundances of warm species U. sibogae (Fig. 3g) than those detectedbetween ~789 and 782 ka (cyan and dashed pink vertical bars, respec-tively, in Fig. 3) and by a pronounced increase of the cold/temperatespecies G. margereli (Fig. 3c). G. margereli, which represents thepalaeoceanographic signal with the most pronounced relative changein amplitude variations, is considered a transitional/subpolar species(Bréhéret, 1978) and high abundances of this species have beenobserved during glacial periods and stadials (Amore et al., 2012;Palumbo et al., 2013a,b). This change in the structure of thecoccolithopore assemblages is considered a signal of a gradual and con-stant cooling, whichmarks the transition to more temperate conditionsand the inflow of cooler waters at the site. Although this pattern doesnot find confirmation in the alkenone-based SST reconstruction, whichshows relatively warm and stable conditions at the surface waters atSite U1313 (Fig. 3k), the general deterioration of the climate system in-ferred from the coccolith assemblages between 779 and 769 ka is cor-roborated by the planktonic foraminifera δ18O record which reflectsthe combined effects of decreased surface temperature and increasedwater δ18O (reflecting in turn the local hydrographic effect and the glob-al ice volume; Fig. 3a). In addition, during this interval of time, episodesof increased percentages of tetraunsaturated alkenones (Fig. 3i) providefurther support to this cooling scenario, indicating rapid inflows of coldand less saline polar/arctic waters (Naafs et al., 2011).
These conditions indicate a change in the palaeoceanographic dy-namics and imply a southward migration of the NAC with consequentincreased influence of cooler NATW at Site U1313 (Fig. 1a).
114 D. Emanuele et al. / Palaeogeography, Palaeoclimatology, Palaeoecology 430 (2015) 104–117
5.3. MIS 19/18 transition and the beginning of MIS 18
The return to palaeoceanographic instability at the site characterisesthe last part of the investigated interval, which includes the MIS 19/18transition and the early MIS 18. The influence of cooler NATW at SiteU1313, as inferred from the abundance of G. margereli (Fig. 3c), startsto decrease from ~771 ka onwards. This is followed by an intensificationof the eddy circulation from ~769 to ~766 ka, as evidenced by the NARand number of coccoliths/g (Fig. 3b, d), and Site U1313 sporadically ex-periences the influence of anticyclonic eddies, located at the north-northwest boundary of the NATW area (yellow vertical bars in Fig. 3).Starting from 767 ka, an increased abundance of the subpolar speciesC. pelagicus pelagicus (Fig. 3h), together with higher percentages of theC37:4 alkenone (Fig. 3i; Naafs et al., 2011), indicates that the regionwas affected by cold waters of subpolar origin (dark blue vertical barsin Fig. 3). The planktonic oxygen isotope signal is consistentwith this re-construction, with heavier δ18O values accounting for both colder SSTand continental ice growth; this is also supported by an increase inthe global ice volume, reconstructed by deconvolving the δ18Oseawater
and deep water temperature from benthic δ18O (Elderfield et al.,2012), and by an expansion of the North American ice sheet inferredfrom modelling studies (Bintanja and van de Wal, 2008), which culmi-nated in the onset of the MIS 18 glacial conditions. During this perioda southern migration of the palaeoceanographic system transported acooler signal to Site U1313. This is the consequence of the southwardmigration of the subpolar front, a shift also observed by Naafs et al.(2010) for the late Pliocene and early Pleistocene, and by Voelker et al.(2010) for the early MIS 12 in the North Atlantic area. The subpolarfront is known to have migrated southward during the onset of the gla-cial periods of the Pliocene and Pleistocene, bringing much cooler wa-ters and potentially also sea ice south of 60°N (Ruddiman, 1977;Wright and Flower, 2002).
5.4. Sea surface variability at orbital and millennial time-scales
The results of the spectral analysis (Fig. 4) and the calculation ofthe sinusoids (Fig. 5) performed on selected proxies allow us torecognise the control of orbital parameters and insolation on thepalaeoceanographic changes inferred from the coccolith assemblages.Previous studies documented how, during the glacial/interglacial cyclesof the Middle Pleistocene, surface ocean dynamics in the NorthernHemisphere (NH) underwent significant variability probably due to asouthern/northern position of the Inter Tropical Convergence Zone(ITCZ) during glacial/interglacial periods strictly related to ocean–atmosphere settings. The ITCZ migration causes changes in the meanfixed positions of the pressure centres of the Azores High (AH) andIcelandic Low (IL) (Fig. 1a), also confirmed by model simulations,highlighting a southward shifting of the AH/IL in the Last Glacial Maxi-mum relative to the pre-industrial simulation (Pausata et al., 2009).Thus, similar mechanisms could be responsible for the NAC migrationand consequent movement of the NATW area, as suggested by changesin our coccolith assemblages. Support for this hypothesis comes alsofrom Alonso-Garcia et al. (2011), who infer changes in the distributionofwarmer and coolerNATWdue to thenorthward/southwardmovementof the Arctic Front during the terminations and interglacial–glacial transi-tions of the Middle Pleistocene at 56°N. In our study, the presence of theNAC, warmer NATW or cooler NATW at the site during Termination IXandMIS 19, and the general persistence of subpolarwaters during the gla-cial onset of MIS 18 can be explained with the progressive migration ofthe ITCZ and subpolar front, as these are direct consequences of differentsurface-ocean settings during the glacial and interglacial periods. In addi-tion, intra-stage variability of AH and IL was claimed to be related tochanges in insolationdrivenbyprecession (Amore et al., 2012). Therefore,we identified the specific imprint of precession variations on the coccolithassemblages from IODP Site U1313 in order to verify whether duringMIS
19, a period of low eccentricity, changes at ~19–23 kyr periodicity bandsmay have had large impacts on our climate records.
Coccolith assemblages suggest that NATW are controlled by preces-sion and obliquity (Figs. 3, 4, 5) following the changes in insolation at60°N in June (Fig. 3m). Before Termination IX, the NH received lesssolar radiation (Fig. 3m), and as a consequence the subpolar front waslocated further south and the NAC flowed south of Site U1313(Fig. 7a). During Termination IX and MIS 19c, as the NH received moresolar radiation, the subpolar front and the ITCZ moved northward.This caused the gradual northwardmigration of theNAC,which reachedthe site at Termination IX (Fig. 7b); subsequently, the northward NACmovement continued, and the site experienced initially the expansionof the eddy activity zone and successively the prevalence of warmerNATW during MIS 19c (Fig. 7c). Warmer NATW, as inferred from theabundance record of U. sibogae (Fig. 3g) and its sinusoidal curve(Fig. 5e), were prevalent at the site about 3 kyr after the summer inso-lation maxima (Fig. 3m), reflecting a delay between forcing and climateresponse.
The prevalence of cooler NATW occurred between c. 780 and 769 ka,as shown by G. margereli percentages, and lags the transition from a peri-od duringwhich theNH receivedmore solar radiation in summer to a pe-riod of decreased incoming summer solar radiation, with the insolationminimumcentred at ~778 ka; the sinusoidal curves ofG.margereliobtain-ed at precession and obliquity periodicities (Fig. 5c) highlight the controlof both orbital parameters on the temporal distribution of this species.Today, the northern boundary of the cooler NATW coincides with thesouthern edge of the NAC (Fig. 1a). Thus, the prevalence of these watermasses at the site results from changes in the position or intensificationof the NAC, driven by variations in high-latitude summer insolation.
Superimposed on this long-term variability in sea-surface dynamics,high-frequency changes are present in the entire interval analysed inthis study. The spectra of U. sibogae (Fig. 4d), total number ofcoccoliths/g (Fig. 4e) and NAR (Fig. 4f) feature a pronouncedsuborbital-scale peak centred at the ~10 kyr period, which stands outwell above the background and is significant above the 95% confidencelevel; this periodicity is very close to the second harmonic of the19–23 kyr precession signal, and suggests the existence of a nonlinearclimate response to Milankovitch forcing. Harmonic responses to pre-cessional forcing were predicted in the early 1990s by Short et al.(1991) and related to a complex response of surface temperatures to in-solation forcing in the equatorial regionswhen perihelion interactswiththe overhead passage of the sun at either Equinox; this combination oc-curs twice during a precessional cycle and consequently generates a sig-nal at near half the precession period (10 to 12 kyr). More recently,oscillations at frequencies equal to precession harmonics were identi-fied in a calculation of the amplitude of the seasonal cycle of the energythat the equatorial (and to a lesser extent the intertropical) regionsreceived from the Sun over the last 1 Ma (Berger et al., 2006). In bothstudies, the origin of the half-precession signal lies in the equatorial re-gion; however, the presence of a half-precession signal was also detect-ed in palaeoclimate records from higher latitudes and attributed toadvection via atmosphere and oceanic currents from low to high lati-tudes (Hagelberg et al., 1994; McIntyre and Molfino, 1996; Short et al.,1991; Weirauch et al., 2008). An investigation of lower-middle Pleisto-cene sediments from Site U1313 already resolved significant concentra-tion of variance centred at 10–11 kyr in the benthic and planktonicstable isotope records; an excellent correlation between the foraminif-era isotope records and insolation variations at the equator during theequinoxes was taken as evidence of a climate response related to low-latitude precession variations, whichwas advected to the high latitudesby tropical convective processes (Ferretti et al., 2010, 2015). The pres-ence of the 10 kyr signal in the three proxy records – the warm andoligotrophic species U. sibogae, and the two palaeoproductivity proxies,number of coccoliths per gram andNAR – is consistent with this climatereconstruction from Site U1313, where poleward heat transport in sur-face currents originated in the equatorial region is a plausible
115D. Emanuele et al. / Palaeogeography, Palaeoclimatology, Palaeoecology 430 (2015) 104–117
mechanism that could introduce suborbital scale fluctuations into proxyrecords of sea-surface conditions.
In addition, the wavelet analysis documented the evolution of cli-mate variability in the proxy records at millennial to multi-centennialtime scales (Fig. 6). Spectral power at 0.8 and 0.5 kyr periods in thenumber of coccoliths/g (and in the NAR record, although with lesspower) is manifest between ~801–800, 798–796 and 792–775 ka, andwe interpret this variability as mainly related to changes in coccolithpalaeoproductivity, linked to the intensification of the eddies (Fig. 6d,e); thus the wavelet analysis suggests that in these specific millennial/centennial bands the surface dynamic variability was characterised bychanges in the intensification of the eddies, which occurred duringintervals mainly influenced by the long-term prevalence of bothiceberg-melt waters and warmer NATW. The wavelet power spectrumof U. sibogae exhibits strong power in the ~1 kyr band between ~777and 770 ka (Fig. 6c) suggesting that during this interval the warmerNATW oscillated at millennial-time scale. The wavelet power spectrumof G. margereli shows relatively high power distributed in the 0.5 kyrband between 778 and 763 ka (Fig. 6a), indicating that at this time thesite experienced high-frequency fluctuations of cooler NATW. More-over, during the transitionsMIS20/19 andMIS19/MIS18, climate var-iability at millennial and centennial scale seems rather to becontrolled by the arrival, at the site, of cold water linked to icebergmelting and subpolar waters respectively, as shown by C. pelagicuspelagicus abundances (Fig. 3h) and its wavelet power spectrum(Fig. 6b). On the one hand, the abundances of C37:4 alkenone(Fig. 3i) and quartz/calcite (Fig. 3j) during the deglaciation fromMIS 20/19, higher than during the transition MIS 19/18, suggest theprevalence at the site of cold waters linked to iceberg melting, as ex-pected from a climate system evolving from a period of significantlygreater ice volume to low continental ice volume (Elderfield et al.,2012). On the other hand, the abundances of C. pelagicus pelagicus(Fig. 3h) during the MIS 19/18 glacial inception, higher than in theprevious MIS 20/19 glacial–interglacial transition, document the in-fluence of subpolar waters on the site.
Furthermore, during MIS 19, rapid events related to sea-surface dy-namics affected the signal of C. pelagicus pelagicus (c. 777.8, 775.4,767 ka) and U. sibogae percentages (c. 774 ka). C. pelagicus pelagicus(Fig. 3h) is recognised only during sporadic episodes, suggesting theoccurrence of rapid and isolated surface cooling events, and is associat-ed with generally decreased percentages of warm species U. sibogae(Fig. 3g), and with a decrease in the palaeoproductivity of coccoliths(NAR and number of coccoliths/g Fig. 3b, d). Some of these cooling epi-sodes are also associated with drops in SST (Fig. 3k), increased abun-dances of tetraunsaturated alkenones (Fig. 3i), and are superimposedto a general trend characterised by increased IRD at the site (i.e.quartz/calcite abundances, Fig. 3j); considered as a whole, this body ofevidence suggests that, at least during some of these surface coolingevents, the abrupt arrival of very cold and low salinity surface meltwaters at the site caused water stratification and limited coccolithpalaeoproductivity. Similarly, an episode of increased percentages ofU. sibogae at c. 774 ka documents the occurrence of a rapid and isolatedsurface warming event (Fig. 3g), confirming that high-frequency sea-surface instabilities during MIS 19 were associated with both cold andwarm fluctuations. A correlationwith our planktonic oxygen isotope re-cord (Fig. 3a) indicates that these events are related to both stadial andinterstadial episodes. Persistent significant millennial to sub-millennialscale oscillations have emerged from MIS 19 climate reconstructions inthe North Atlantic (Ferretti et al., 2005, 2015; Hodell et al., 2008; Kleivenet al., 2011) and the SouthernHemisphere (Pol et al., 2010); theMIS 19 ev-idence presented in this studynarrows even further the debate over the oc-currence or absence of abrupt events in this interglacial periods, andsuggests that sea-surface variability in the studied interval was linked tochanges in the position and/or strength of the NAC and NATW. Futurework should focus on comparing signals between proxies and betweensite locations in the North Atlantic, overcoming the uncertainties of their
respective chronologies, in order to provide a global framework for intra-interglacial variability during MIS 19.
6. Conclusions
We have presented palaeoceanographic reconstruction of sea-surfacedynamics for the period between ~800 and 760 ka (MIS 20–18) based onnannoplankton assemblages. Changes in surface water characteristics inthe mid-latitude North Atlantic (IODP Site U1313) provide new insightsinto the variations of the NAC and NATW during this interglacial period.These results allowed us to recognise a control of the orbital parametersand insolation on the inferred palaeoceanographic changes, likely relatedto the different position of the ITCZ, causing the southern location of thesubpolar front/NAC system during late in MIS 20 and its northward mi-gration during the interglacial period MIS 19c. At the end of MIS 20,coccolithophore assemblages, together with an increased abundance ofthe tetra-unsaturated alkenone, indicate a southern location of the subpo-lar front and the NAC flowing south of the current latitude. During thetransition from MIS 20 to 19, the site was marked by the arrival of coldwater linked to iceberg melting; changes in coccolith assemblage struc-ture during this period indicate a northwards migration of the NAC untilTermination IX, when the NAC path reached the site, and the influenceof warmer NATW, alternated with events of increased productivity,began to prevail. The MIS 19c is characterised by an increase in warmtaxa, which indicates a palaeoceanographic configuration characterisedby an expansion of warm water, located in the southern NATW area.Thiswarmphasewas followed by a gradually increased influence of cool-er NATW duringMIS 19b and 19a, as a result of their southern extension.During theMIS 19/18 transition, the sitewasmarked by the arrival of coldwater of subpolar provenance; this glacial inception is characterised by areturn to palaeoceanographic instability and by the southward shift of thepalaeoceanographic system culminating, during the early MIS 18, in a re-turn to glacial conditions.
We propose that insolation is the driver of also some of the short-termchanges identified in our proxy records, which were superimposed onthis long-term variability in sea-surface dynamics during the intervalanalysed in this study. In particular, time series analysis indicates that sig-nificant concentration of variance exists at periods of 10 kyr in the warmand oligotrophic U. sibogae and in the palaeoproductivity proxies — NARand the number of coccoliths/g of sediment. This periodicity is equal toharmonic of precession band oscillations, arisen as a nonlinear responseto Milankovitch forcing. We suggest that these results are consistentwith amechanism of equatorial origin and related to low-latitude preces-sion variations, ultimately exported to higher latitudes by oceanic and at-mospheric circulation.
Higher frequency climate variability, at millennial to sub-millennial scale, has emerged from our MIS 19 climate reconstruc-tions. Some of these oscillations were brief and isolated events, asfor example those identified in the signals of C. pelagicus pelagicusand U. sibogae during MIS 19b and 19a, which suggest the rapidoccurrence of cooling and warming episodes associated with de-creases in palaeoproductivity. These events were related to the oc-currence of both stadial and interstadial-type conditions. On theother hand, some of these oscillation were periodic, and high fre-quency cycles (i.e. 0.5, 0.85 and 1 kyr) were identified in the spectraland wavelet analyses of some our proxy records, indicating thathigh-frequency variability in surface dynamics was characterisedby changes in the intensification of the eddies (at ~801–800,798–796 and 792–775 ka), oscillation of warmer NATW (between777 and 770 ka) and cooler NATW (between 778 and 763 ka).Although identifying the controls on intra-interglacial variability re-mains a challenge, these results identify a general instability of seasurface hydrography in the mid-latitude North Atlantic and, on abroader perspective, contribute to evidence for relative climate in-stability during interglacial intervals.

116 D. Emanuele et al. / Palaeogeography, Palaeoclimatology, Palaeoecology 430 (2015) 104–117
Acknowledgments
This research used samples provided by the Integrated Ocean DrillingProgram (IODP). Walter Hale and Alex AlexWülbers at the IODP deposi-tory in Bremen are acknowledged for their help during sampling.We alsothank two anonymous reviewers for very specific and details suggestionsthat have helped us to improve the manuscript. We thank DanielaAlmansi for her contribution to revise the English text. Thisworkwas sup-ported by a PhD grant provided to D. Emanuele by MIUR (Cycle 25th ofPhD) (Ministero dell'Istruzione, dell'Università e della Ricerca) and alsopartially funded through FRA grants (2009–2010 and 2011–2012) pro-vided to F.O. Amore. P. Ferretti acknowledges support from the EUthrough a Marie-Curie Reintegration grant (PERG-GA-2010-272134 —
MILLEVARIABILI) and “Past4Future. Climate change — Learning from thepast climate” (FP7/2007-2013, grant agreement no. 243908). This isPast4Future contribution no. 82.
References
Alonso-Garcia, M., Sierro, F.J., Flores, J.A., 2011. Arctic front shifts in the subpolar North At-lantic during the Mid-Pleistocene (800–400 ka) and their implications for ocean cir-culation. Palaeogeogr. Palaeoclimatol. Palaeoecol. 311, 268–280. http://dx.doi.org/10.1016/j.palaeo.2011.09.004.
Alvarez, M.C., Flores, J.A., Sierro, F.J., Diz, P., Francés, G., Pelejero, C., Grimalt, J., 2005. Mil-lennial surface water dynamics in the Ría de Vigo during the last 3000 years as re-vealed by coccoliths and molecular biomarkers. Palaeogeogr. Palaeoclimatol.Palaeoecol. 218, 1–13. http://dx.doi.org/10.1016/j.palaeo.2004.12.002.
Amore, F.O., Caffau, M., Massa, B., Morabito, S., 2004. Late Pleistocene–Holocenepaleoclimate and related environmental changes as recorded by calcareousnannofossils and planktonic foraminifera assemblages in the southern TyrrhenianSea (Cape Palinuro, Italy). Mar. Micropaleontol. 52, 255–276. http://dx.doi.org/10.1016/j.marmicro.2004.05.004.
Amore, F.O., Flores, J.A., Voelker, A.H.L., Lebreiro, S.M., Palumbo, E., Sierro, F.J., 2012. AMid-dle Pleistocene Northeast Atlantic coccolithophore record: palaeoclimatology andpaleoproductivity aspects. Mar. Micropaleontol. 90–91, 44–59. http://dx.doi.org/10.1016/j.marmicro.2012.03.006.
Backman, J., Raffi, I., Rio, D., Fornaciari, E., Paelike, H., 2012. Biozonation and biochronology ofMiocene through Pleistocene calcareous nannofossils from low and middle latitudes.Newsl. Stratigr. 45 (3), 221–244. http://dx.doi.org/10.1127/0078-0421/2012/0022.
Baumann, K.H., Freitag, T., 2004. Pleistocene fluctuations in the northern Benguela Cur-rent system as revealed by coccolith assemblages. Mar. Micropaleontol. 52,195–215. http://dx.doi.org/10.1016/j.marmicro.2004.04.011.
Baumann, K.H., Andruleit, H., Boeckel, B., Geisen, M., Kinkel, H., 2005. The significance ofextant coccolithophores as indicators of ocean water masses, surface water tempera-ture, and paleoproductivity: a review. Paläontol. Z. 79, 93–112.
Berger, A., Loutre, M.F., Tricot, C., 1993. Insolation and Earth's orbital periods. J. Geophys.Res. 98 (D6), 10341–10362. http://dx.doi.org/10.1029/93JD00222.
Berger, A., Loutre, M.F., Melice, J.L., 2006. Equatorial insolation: from precession har-monics to eccentricity frequencies. Clim. Past 2, 131–136.
Bintanja, R., van de Wal, R.S.W., 2008. North American ice-sheet dynamics and the onsetof 100,000-year glacial cycles. Nature 454, 869–872. http://dx.doi.org/10.1038/nature07158.
Bollmann, J., 1997.Morphology and biogeography of the genus Gephyrocapsa coccoliths inHolocene sediments. Mar. Micropaleontol. 29, 319–350.
Bréhéret, J., 1978. Formes nouvelles quaternaires et actuelles de la famille desGephyrocapsaceae (Coccolithophorides). C. R. Hebd. Seances Acad. Sci. Paris 287, 447–449.
Broerse, A.T.C., Ziveri, P., van Hinte, J.E., Honjo, S., 2000. Coccolithophore export produc-tion, species composition, and CaCO3 fluxes in the NE Atlantic (34°N, 21°W and48°N, 21°W). Deep-Sea Res. II 47, 1877–1905.
Buzas, M.A., 1990. Another look at confidence limits for species proportions. J. Paleontol.64, 842–843.
Calvo, E., Villanueva, J., Grimalt, J.O., Boelaert, A., Labeyrie, L., 2001. New insights into theglacial latitudinal temperature gradients in the North Atlantic. Results from Uk'37 seasurface temperatures and terrigenous inputs. Earth Planet. Sci. Lett. 188 (3–4),509–519. http://dx.doi.org/10.1016/S0012-821X(01)00316-8.
Colmenero-Hidalgo, E., Flores, J.A., Sierro, J., Barcena, M.A., Lowemark, L., Schonfeld, J.,Grimalt, J.O., 2004. Ocean-surface water response to short-term climate changes re-vealed by coccolithophores from the Gulf of Cadiz (NE Atlantic) and Alboran Sea(W Mediterranean). Palaeogeogr. Palaeoclimatol. Palaeoecol. 205, 317–336.
Droxler, A.W., Alley, R.B., Howard, W.R., Poore, R.Z., Burckle, L.H., 2003. Unique and excep-tionally long interglacial Marine Isotope Stage 11: window into Earth warm futureclimate. In: Droxler, A.W., Poore, R.Z., Burckle, L.H. (Eds.), Earth's Climate and OrbitalEccentricity: the Marine Isotope Stage 11 Question, Geophysical Monograph 137.AGU, Washington, pp. 1–14.
Eden, C., Jung, T., 2001. North Atlantic interdecadal variability: oceanic response to theNorth Atlantic Oscillation (1865–1997). J. Clim. 14 (5), 676–691. http://dx.doi.org/10.1175/1520-0442(2001)014b0676:NAIVORN2.0.CO;2.
Elderfield, H., Ferretti, P., Greaves, M., Crowhurst, S., McCave, I.N., Hodell, D., Piotrowski,A.M., 2012. Evolution of ocean temperature and ice volume through the mid-Pleistocene climate transition. Science 337, 704–709. http://dx.doi.org/10.1126/science.1221294.
Expedition 306 Scientists, 2006. Site U1313. In: Channell, J.E.T., et al. (Eds.), Proceedings ofIntegrated Ocean Drilling Program. Integrated Ocean Drilling Program ManagementInternational, Inc., College Station TX (Integrated Ocean Drilling Program Manage-ment International, Inc.) http://dx.doi.org/10.2204/iodp.proc.303306.112.2006.
Falkowski, P.G., Barber, R.T., Smetacek, V., 1998. Biogeochemical controls and feedbackson ocean primary production. Science 281, 200–206. http://dx.doi.org/10.1126/science.281.5374.200.
Ferretti, P., Shackleton, N.J., Rio, D., Hall,M.A., 2005. Early-Middle Pleistocene deep circulationin the western subtropical Atlantic: Southern Hemisphere modulation of the North At-lantic Ocean. In: Head, M.J., Gibbard, P.L. (Eds.), Early-Middle Pleistocene transitions:the land ocean evidence. vol. 247. The Geological Society, London, pp. 131–145.
Ferretti, P., Crowhurst, S.J., Hall, M.A., Cacho, I., 2010. North Atlantic millennial-scale cli-mate variability 910 to 790 ka and the role of the equatorial insolation forcing.Earth Planet. Sci. Lett. 293, 28–41. http://dx.doi.org/10.1016/j.epsl.2010.02.016.
Ferretti, P., Crowhurst, S.J., Naafs, B.D.A., Barbante, C., 2015. TheMarine Isotope Stage 19 in themid-latitude North Atlantic Ocean: astronomical signature and intra-interglacial vari-ability. Quat. Sci. Rev. 108, 95–110. http://dx.doi.org/10.1016/j.quascirev.2014.10.024.
Findlay, C.S., Flores, J.A., 2000. Subtropical front fluctuations south of Australia (45°09′S,146°17′E) for the last 130 ka years based in calcareous nannoplankton. Mar.Micropaleontol. 40, 403–416. http://dx.doi.org/10.1016/S0377-8398(00)00045-1.
Flores, J.A., Sierro, F.J., 1997. Revised technique for calculation of calcareous nannofossilaccumulation rates. Micropaleontology 43, 321–324.
Flores, J.A., Sierro, F.J., Francéz, G., Vásquez, A., Zamarreno, I., 1997. The last 100,000 yearsin the western Mediterranean: sea surface water and frontal dynamics as revealed bycoccolithophores. Mar. Micropaleontol. 29, 351–366.
Flores, J.A., Gersonde, R., Sierro, F.J., 1999. Pleistocene fluctuations in the Agulhas CurrentRetroflection based on the calcareous plankton record. Mar. Micropaleontol. 37, 1–22.http://dx.doi.org/10.1016/S0377-8398(99)00012-2.
Flores, J.A., Marino, M., Sierro, F.J., Hodell, D.A., Charles, C.D., 2003. Calcareous planktondissolution pattern and coccolithophore assemblages during the last 600 kyr atODP Site 1089 (Cape Basin, South Atlantic): paleoceanographic implications.Palaeogeogr. Palaeoclimatol. Palaeoecol. 196, 409–426. http://dx.doi.org/10.1016/S0031-0182(03)00467-X.
Fratantoni, D.M., 2001. North Atlantic surface circulation during the 1990's observed withsatellite-tracked drifters. J. Geophys. Res. 106, 22067–22093. http://dx.doi.org/10.1029/2000JC000730.
Gaarder, K.R., 1962. Electron microscope studies on holococcolithophorids. Nytt Mag. Bot.10, 35–51.
Garside, C., Garside, J.C., 1993. The ‘f-ratio’ on 20°W during the North Atlantic BloomExperiment. Deep-Sea Res. II 40 (1/2), 75–90. http://dx.doi.org/10.1016/0967-0645(93)90007-A.
Geisen, M., Billard, C., Broerse, A., Cros, L., Probert, I., Young, J., 2002. Life-cycle asso-ciations involving pairs of holococcolithophorid species: intraspecific variationor cryptic speciation? Eur. J. Phycol. 37, 531–550. http://dx.doi.org/10.1017/S0967026202003852.
Giraudeau, J., 1992a. Coccolith paleotemperature and paleosalinity estimates in the Carib-bean Sea for the Middle-Late Pleistocene (DSDP Leg 68 Hole 502B). Sci. Geol. Mem.43, 375–387 (Allegato).
Giraudeau, J., 1992b. Distribution of recent nannofossils beneath the Benguela System:southwest African Continental Margin. Mar. Geol. 108, 219–237. http://dx.doi.org/10.1016/0025-3227(92)90174-G.
Giraudeau, J., Monteiro, P.M.S., Nikodemus, K., 1993. Distribution and malformation of livingcoccolithophores in the northern Benguela upwelling system off Namibia. Mar.Micropaleontol. 22, 93–110. http://dx.doi.org/10.1016/0377-8398(93)90005-I.
Giraudeau, J., Jennings, A.E., Andrews, J.T., 2004. Timing and mechanisms of surfaceand intermediate water circulation changes in the Nordic Seas over the last10,000 cal years: a view from the North Iceland shelf. Quat. Sci. Rev. 23, 2127–2139.
Giraudeau, J., Grelaud, M., Solignac, S., Andrews, J.T., Moros, M., Jansen, E., 2010.Millennial-scale variability in Atlantic water advection to the Nordic Seas derivedfrom Holocene coccolith concentration records. Quat. Sci. Rev. 29, 1276–1287.http://dx.doi.org/10.1016/j.quascirev.2010.02.014.
Grinsted, A., Moore, J.C., Jevrejeva, S., 2004. Application of the cross wavelet transform andwavelet coherence to geophysical time series. Nonlinear Process. Geophys. 11,561–566. http://dx.doi.org/10.5194/npg-11-561-2004.
Hagelberg, T., Bond, G., DeMenocal, P., 1994. Milankovitch band forcing of sub-Milankovitchclimate variability during the Pleistocene. Paleoceanography 9, 545–558.
Hammer, Ø., Harper, D.A.T., Ryan, P.D., 2001. PAST: Paleontological Statistics softwarepackage for education and data analysis. Palaeontol. Electron. 4 (1), 1–9.
Heine, N., Weaver, P.P.E., 1998. Quaternary. In: Bown, P.R. (Ed.), Calcareous NannofossilBiostratigraphy. Chapman and Hall, London, pp. 266–283.
Hine, N., 1990. Late Cenozoic Calcareous Nannoplankton from the Northeast Atlantic.(PhD Thesis). University of East Anglia.
Hodell, D.A., Channell, J.E.T., Curtis, J.H., Romero, O.E., Röhl, U., 2008. Onset of “HudsonStrait” Heinrich events in the eastern North Atlantic at the end of the middle Pleisto-cene transition (∼640 ka)? Paleoceanography 23, PA4218. http://dx.doi.org/10.1029/2008PA001591.
Jordan, R.W., Winter, A., 1998. An unusual coccolithophorid (Haptophyta) specimen fromPuerto Rico. J. Nannoplankton Res. 20, 81–83.
Kleiven, H.F., Hall, I.R., McCave, I.N., Knorr, G., Jansen, E., 2011. Coupled deep-water flowand climate variability in the Middle Pleistocene North Atlantic. Geology 39,343–346. http://dx.doi.org/10.1130/G31651.1.
Krauss, W., 1986. The North Atlantic Current. J. Geophys. Res. Oceans 91 (C4), 5061–5074.http://dx.doi.org/10.1029/JC091iC04p05061.
Laskar, J., Robutel, P., Joutel, F., Gastineau, M., Correia, A.C.M., Levrard, B., 2004. A long-term numerical solution for the insolation quantities of the Earth. Astron. Astrophys.428, 261–285. http://dx.doi.org/10.1051/0004-6361:20041335.
117D. Emanuele et al. / Palaeogeography, Palaeoclimatology, Palaeoecology 430 (2015) 104–117
Lawrence, K.T., Herbert, T.D., Brown, C.M., Raymo,M.E., Haywood, A.M., 2009. High amplitudevariations in North Atlantic Sea surface temperature during the early Pliocenewarm pe-riod. Paleoceanography 24, PA2218. http://dx.doi.org/10.1029/2008PA001669.
Lisiecki, L.E., Raymo, M.E., 2005. A Pliocene–Pleistocene stack of 57 globally distributedbenthic δ18O records. Paleoceanography 20, PA1003. http://dx.doi.org/10.1029/2004PA001071.
Lochte, K., Ducklow, H.W., Fasham, M.J.R., Stienen, C., 1993. Plankton succession and car-bon cycling at 47°N 20°W during JGOFS North Atlantic Bloom Experiment. Deep-SeaRes. II 40, 91–114. http://dx.doi.org/10.1016/0967-0645(93)90008-B.
Loutre, M.F., Berger, A., 2003. Marine Isotope Stage 11 as an analogue for the present in-terglacial. Glob. Planet. Chang. 36, 209–217. http://dx.doi.org/10.1016/S0921-8181(02)00186-8.
Marino, M., Maiorano, P., Lirer, F., 2008. Changes in calcareous nannofossil assemblagesduring the Mid-Pleistocene revolution. Mar. Micropaleontol. 69, 70–90. http://dx.doi.org/10.1016/j.marmicro.2007.11.010.
McIntyre, A., 1967. Coccoliths as paleoclimatic indicators of Pleistocene glaciation. Science158, 1314–1317. http://dx.doi.org/10.1126/science.158.3806.1314.
McIntyre, A., Bè, A.H.W., 1967. Modern coccolithophores of the Atlantic Ocean: I. Placolithand cystoliths. Deep-Sea Res. 14, 561–597.
McIntyre, A., Molfino, B., 1996. Forcing of Atlantic equatorial and subpolar millennial cy-cles by precession. Science 274, 1867–1870.
McIntyre, A., Ruddiman, W.F., Jantzen, R., 1972. Southward penetrations of the North At-lantic Polar Front: faunal and floral evidence of large-scale surface water mass move-ments over the last 225,000 years. Deep-Sea Res. 19, 61–77. http://dx.doi.org/10.1016/0011-7471(72)90073-3.
Naafs, B.D.A., Stein, R., Hefter, J., Khélifi, N., De Schepper, S., Haug, G.H., 2010. Late Pliocenechanges in the North Atlantic Current. Earth Planet. Sci. Lett. 298, 434–442. http://dx.doi.org/10.1016/j.epsl.2010.08.023.
Naafs, B.D.A., Hefter, J., Ferretti, P., Stein, R., Haug, H., 2011. Sea surface temperatures didnot control the first occurrence of Hudson Strait Heinrich Events during MIS 16.Paleoceanography 26, PA4201. http://dx.doi.org/10.1029/2011PA002135.
Naafs, B.D.A., Hefter, J., Acton, G., Haug, G.H., Martínez-Garcia, A., Pancost, R., Stein, R., 2012.Strengthening of North American dust sources during the late Pliocene (2.7 Ma). EarthPlanet. Sci. Lett. 317–318, 8–19. http://dx.doi.org/10.1016/j.epsl.2011.11.026.
New, A.L., Jia, Y., Coulibaly, M., Dengg, J., 2001. On the role of the Azores Current in theventilation of the North Atlantic Ocean. Prog. Oceanogr. 48, 163–194. http://dx.doi.org/10.1016/S0079-6611(01)00004-0.
Nowaczyk, N.R., Baumann, M., 1992. Combined high-resolution magnetostratigraphy andnannofossil biostratigraphy for late Quaternary Arctic Ocean sediments. Deep-SeaRes. A Oceanogr. Res. Pap. 39 (2), 567–601. http://dx.doi.org/10.1016/S0198-0149(06)80021-X.
Núñez-Riboni, I., Bersch, M., Haak, H., Jungclaus, J.H., Lohmann, K., 2012. A multi-decadalmeridional displacement of the Subpolar Front in the Newfoundland Basin. Ocean Sci.8, 91–102. http://dx.doi.org/10.5194/os-8-91-2012.
Okada, H., Bukry, D., 1980. Supplementary modification and introduction of code num-bers to the low-latitude coccolith biostratigraphic zonation (Bukry, 1973; 1975).Mar. Micropaleontol. 5, 321–325. http://dx.doi.org/10.1016/0377-8398(80)90016-X.
Ottens, J.J., 1991. Planktonic foraminifera as North Atlantic water mass indicator. Oceanol.Acta 14 (2), 123–140.
Palumbo, E., Flores, J.A., Perugia, C., Emanuele, D., Petrillo, Z., Rodrigues, T., Voelker, A.H.L.,Amore, F.O., 2013a. Abrupt variability of the last 24 ka recorded by coccolithophoreassemblages off the Iberian Margin (core MD03-2699). J. Quat. Sci. 28 (3), 320–328.
Palumbo, E., Flores, J.A., Perugia, C., Petrillo, Z., Voelker, A.H.L., Amore, F.O., 2013b. Millen-nial scale Coccolithophore palaeoproductivity and surface water changes between445 and 360 ka (Marine Isotope Stages 12/11) in the Northeast Atlantic. Palaeogeogr.Palaeoclimatol. Palaeoecol. 383–384, 27–41. http://dx.doi.org/10.1016/j.palaeo.2013.04.024.
Parente, A., Cachão, M., Baumann, K.H., de Abreu, L., Ferreira, J., 2004. Morphometry ofCoccolithus pelagicus s.l. (Coccolithophore, Haptophyta) from offshore Portugal, dur-ing the last 200 kyr. Micropaleontology 50 (1), 107–120. http://dx.doi.org/10.2113/50.Suppl_1.107.
Patterson, R.T., Fishbein, E., 1989. Re-examination of the statistical methods used to deter-mine the number of point counts needed for micropaleontological quantitative re-search. J. Paleontol. 63, 245–248.
Pausata, F.S.R., Li, C., Wettstein, J.J., Nisancioglu, K.H., Battisti, D.S., 2009. Changes in atmo-spheric variability in a glacial climate and the impacts on proxy data: a model inter-comparison. Clim. Past 5, 489–502. http://dx.doi.org/10.5194/cp-5-489-2009.
Pflaumann, U., Sarnthein, M., Chapman, M., de Abreu, L., Funnell, B., Huels, M., Kiefer, T.,Maslin, M., Schulz, H., Swallow, J., van Kreveld, S., Vautravers, M., Vogelsang, E.,Weinelt, M., 2003. Glacial North Atlantic: sea-surface conditions reconstructed byGLAMAP 2000. Paleoceanography 18, 1065. http://dx.doi.org/10.1029/2002PA000774.
Pol, K., Masson-Delmotte, V., Johnsen, S., Bigler, M., Cattani, O., Durand, G., Falourd, S.,Jouzel, J., Minster, B., Parrenin, F., Ritz, C., Steen-Larsen, H.C., Stenni, B., 2010. NewMIS 19 EPICA Dome C high resolution deuterium data: hints for a problematic pres-ervation of climate variability at sub-millennial scale in the “oldest ice”. Earth Planet.Sci. Lett. 298, 95–103. http://dx.doi.org/10.1016/j.epsl.2010.07.030.
Press, W.H., Teukolsky, S.A., Vetterling, W.T., Flannery, B.P., 1992. Numerical Recipes in C.Cambridge University Press.
Robinson, M.M., 2009. New quantitative evidence of extremewarmth in the Pliocene Arc-tic. Stratigraphy 6 (4), 265–275.
Rogalla, U., Andruleit, H., 2005. Precessional forcing of coccolithophore assemblages in thenorthern Arabian Sea: implications for monsoonal dynamics during the last200,000 years. Mar. Geol. 217 (12), 31–48.
Rost, B., Riebesell, U., 2004. Coccolithophores and the biological pump: responses to envi-ronmental changes. In: Thierstein, H., Young, J. (Eds.), Coccolithophores — From Mo-lecular Processes to Global Impact. Springer Verlag, Berlin, pp. 99–125.
Ruddiman, W.F., 1977. Late Quaternary deposition of ice-rafted sand in the subpolarNorth Atlantic (lat 40° to 65°N). Geol. Soc. Am. Bull. 88, 1813–1827. http://dx.doi.org/10.1130/0016-7606(1977)88b1813:LQDOISN2.0.CO;2.
Sadeghi, A., Dinter, T., Vountas, M., Taylor, B., Altenburg-Soppa, M., Bracher, A., 2012a. Re-mote sensing of coccolithophore blooms in selected oceanic regions using thePhytoDOAS method applied to hyper-spectral satellite data. Biogeosciences 9,2127–2143. http://dx.doi.org/10.5194/bg-9-2127-2012.
Sadeghi, A., Dinter, T., Vountas, M., Taylor, B.B., Altenburg-Soppa, M., Peeken, I., Bracher, A.,2012b. Improvement to the PhytoDOAS method for identification of coccolithophoresusing hyper-spectral satellite data. Ocean Sci. 8, 1055–1070. http://dx.doi.org/10.5194/os-8-1055-2012.
Samtleben, C., Schröder, A., 1992. Living coccolithophore communities in the Norwegian–Greenland Sea and their record in sediments. Mar. Micropaleontol. 19, 333–354.http://dx.doi.org/10.1016/0377-8398(92)90037-K.
Samtleben, C., Schäfer, P., Andruleit, H., Baumann, A., Baumann, K.H., Kohly, A.,Matthiessen, J., Schröder-Ritzrau, A., 1995. Plankton in the Norwegian–GreenlandSea: from living communities to sediment assemblages — an actualistic approach.Geol. Rundsch. 84, 108–136.
Schiebel, R., Bijma, J., Hemleben, C., 1997. Population dynamics of the planktic foraminiferGlobigerina bulloides from the eastern North Atlantic. Deep-Sea Res. I 44 (9–10),1701–1713. http://dx.doi.org/10.1016/S0967-0637(97)00036-8.
Schiller, J., 1930. Coccolithineae. In: Rabenhorst, L. (Ed.), Kryptogamen-Flora von Deutschland,Osterreich und der Schweiz. 10. Leipzig, Akademische Verlagsgesellschaft, pp. 89–267.
Schulz, M., Mudelsee, M., 2002. REDFIT: estimating red-noise spectra directly from un-evenly spaced paleoclimatic time series. Comput. Geosci. 28, 421–426. http://dx.doi.org/10.1016/S0098-3004(01)00044-9.
Schwab, C., Kinkel, H., Weinelt, M., Repschläger, J., 2012. Coccolithophore paleoproductivityand ecology response to deglacial and Holocene changes in the Azores Current System.Paleoceanography 27, PA3210. http://dx.doi.org/10.1029/2012PA002281.
Short, D.A., Mengel, J.D., Crowley, T.J., Hyde, W.T., North, G.R., 1991. Filtering ofMilankovitch cycles by Earth's geography. Quat. Res. 35, 157–173.
Sieracki, M.E., Verity, P.G., Stoecker, D.K., 1993. Plankton community response to sequen-tial silicate and nitrate depletion during the 1989 North Atlantic spring bloom. Deep-Sea Res. II 40 (1/2), 213–226. http://dx.doi.org/10.1016/0967-0645(93)90014-E.
Stein, R., Kanamatsu, T., Alvarez-Zarikian, C., Higgins, S.M., Channell, J.E.T., Aboudeshish,E., Ohno, M., Acton, G.D., Akimoto, K., Bailey, I., Bjørklund, K.R., Evans, H., Nielsen,S.H.H., Fang, N., Ferretti, P., Gruetzner, J., Guyodo, Y.J.B., Hagino, K., Harris, R.,Hatakeda, K., Hefter, J., Judge, S.A., Kulhanek, D.K., Nanayama, F., Rashid, H., SierroSanchez, F.J., Voelker, A., Zhai, Q., 2006. North Atlantic paleoceanography: the lastfive millions years. EOS Trans. Am. Geophys. Union 87 (13), 129–133.
Stein, R., Hefter, J., Grützner, J., Voelker, A., Naafs, B.D.A., 2009. Variability of surface watercharacteristics and Heinrich-like events in the Pleistocene mid-latitude North Atlan-tic Ocean: biomarker and XRD records from IODP Site U1313 (MIS 16–9).Paleoceanography 24, PA2203. http://dx.doi.org/10.1029/2008PA001639.
Thomson, D.J., 1990. Time series analysis of Holocene climate data. Philos. Trans. R. Soc.Lond. Ser. A 330, 601–616.
Torrence, C., Compo, G.P., 1998. A practical guide to wavelet analysis. Bull. Am. Meteorol.Soc. 79, 61–78.
Tzedakis, P.C., Channell, J.E.T., Hodell, D.A., Kleiven, H.F., Skinner, L.C., 2012. Determiningthe natural length of the current interglacial. Nat. Geosci. 5, 1–4. http://dx.doi.org/10.1038/ngeo1358.
Versteegh, G.J.M., Brinkhuis, H., Visscher, H., Zonneveld, K.A.F., 1996. The relation betweenproductivity and temperature in the Pliocene North Atlantic at the onset of northernhemisphere glaciation: a palynological study. Glob. Planet. Chang. 11 (4), 155–165.http://dx.doi.org/10.1016/0921-8181(95)00054-2.
Villanueva, J., Calvo, E., Pelejero, C., Grimalt, J.O., Boelaert, A., Labeyrie, L., 2001. A latitudinalproductivity band in the Central North Atlantic over the last 270 kyr: an alkenone per-spective. Paleoceanography 16, 617–626. http://dx.doi.org/10.1029/2000PA000543.
Voelker, A.H.L., Rodrigues, T., Billups, K., Oppo, D., McManus, J.K., Stein, R., Hefter, J.,Grimalt, J.O., 2010. Variations in mid-latitude North Atlantic surface water propertiesduring the mid-Brunhes (MIS 9–14) and their implications for the thermohaline cir-culation. Clim. Past 6, 531–552. http://dx.doi.org/10.5194/cp-6-531-2010.
Wallich, G.C., 1877. Observations on the coccosphere. Ann. Mag. Nat. Hist. 19, 342–350.Weirauch, D., Billups, K., Martin, P., 2008. Evolution of millennial-scale climate
variability during the mid-Pleistocene. Paleoceanography 23, PA3216 (doi:3210.1029/2007PA001584).
Wells, P., Okada, H., 1997. Response of nannoplankton to major changes in sea-surfacetemperature and movements of hydrological fronts over Site DSDP 594 (south Chat-ham Rise, southeastern New Zealand), during the last 130 kyr. Mar. Micropaleontol.32, 341–363. http://dx.doi.org/10.1016/S0377-8398(97)00025-X.
Winter, A., Siesser, W.G., 1994. Coccolithophores. Cambridge University Press, Cambridge(321 pp.).
Winter, A., Jordan, R.W., Roth, P.H., 1994. Biogeography of living coccolithophores inoceanwaters. In: Winter, A., Siesser, W.G. (Eds.), Coccolitophores. Cambridge Univer-sity Press, Cambridge, pp. 161–177.
Wright, A.K., Flower, B.P., 2002. Surface and deep ocean circulation in the subpolar NorthAtlantic during the Mid-Pleistocene revolution. Paleoceanography 17 (4), 1068.http://dx.doi.org/10.1029/2002PA000782.
Young, J.R., Geisen, M., Cros, L., Kleijne, A., Probert, I., Ostergaard, J.B., 2003. A guide to ex-tant coccolithophore taxonomy. J. Nannoplankton Res. Spec. Issue 1, 1–132.
Young, J.R., Bown, P.R., Lees, J.A. (Eds.), 2014. Nannotax3 website. International Nanno-plankton Association (21 Apr., URL: http://http://ina.tmsoc.org/Nannotax3).
Ziveri, P., Baumann, K.-H., Boeckel, B., Bollmann, J., Young, J., 2004. Biogeography of select-ed Holocene coccoliths in the Atlantic Ocean. In: Thierstein, H.R., Young, J.R. (Eds.),Coccolithophores: From Molecular Processes to Global Impact. Springer, Berlin,pp. 403–429.