Elaborazione FLC CGIL riepilogo situazione organico scuola ...
Upload
independentCategory
view
0download
0
Università degli Studi di Pisa Scuola Superiore Sant'Anna
Scuola Superiore Sant'Anna
Classe Accademica di Scienze Sperimentali, Settore di Ingegneria
Corso di Laurea in
Ingegneria Informatica
A distributed approach to topology
discovery in grid environment
Tesi di Diploma
Luca Foschini
Tutore:Prof. Paolo Ancilotti
Relatore:Dott. Luca Valcarenghi
Contents
1 The Grid 3
1.1 GGF, the Global Grid Forum and GTx, the Globus Toolkit . . . . . . . . . 4
2 Network awareness and Topology discovery in grid environments 5
2.1 The goal of this work . . . . . . . . . . . . . . . . . . . . . . . . . . . . . . 5
2.2 Performance measures over grid networks . . . . . . . . . . . . . . . . . . . 6
2.2.1 Sample Grid use of network measurements . . . . . . . . . . . . . . 6
2.2.2 Terminology . . . . . . . . . . . . . . . . . . . . . . . . . . . . . . . 7
2.2.3 Representing Topology . . . . . . . . . . . . . . . . . . . . . . . . . 8
2.2.4 Physical and Functional Topologies . . . . . . . . . . . . . . . . . . 9
2.2.5 An alternative model for topology description . . . . . . . . . . . . 10
2.3 Common performance metrics . . . . . . . . . . . . . . . . . . . . . . . . . 11
2.4 Measurement methodologies . . . . . . . . . . . . . . . . . . . . . . . . . . 12
2.4.1 Packet pair . . . . . . . . . . . . . . . . . . . . . . . . . . . . . . . 12
2.4.2 Packet train . . . . . . . . . . . . . . . . . . . . . . . . . . . . . . . 12
2.4.3 Tailgating . . . . . . . . . . . . . . . . . . . . . . . . . . . . . . . . 13
2.4.4 Variable Packet Size (VPS) . . . . . . . . . . . . . . . . . . . . . . 13
2.4.5 Even/Odd . . . . . . . . . . . . . . . . . . . . . . . . . . . . . . . . 13
2.4.6 Self Loading Periodic Streams (SLOPS) . . . . . . . . . . . . . . . 14
2.4.7 TCP simulation . . . . . . . . . . . . . . . . . . . . . . . . . . . . . 14
2.4.8 Path �ooding . . . . . . . . . . . . . . . . . . . . . . . . . . . . . . 14
2.5 Network sensors . . . . . . . . . . . . . . . . . . . . . . . . . . . . . . . . . 15
2.6 pathchar . . . . . . . . . . . . . . . . . . . . . . . . . . . . . . . . . . . . . 16
2.7 Grid Network Services . . . . . . . . . . . . . . . . . . . . . . . . . . . . . 17
2.7.1 Overview of Grid Network Services . . . . . . . . . . . . . . . . . . 17
2.7.2 Network Monitoring Service (a proxy to NM-WG) . . . . . . . . . . 19
2.8 Requirements of a Grid Network service . . . . . . . . . . . . . . . . . . . 20
2.9 Web service/Grid Service De�nition . . . . . . . . . . . . . . . . . . . . . . 21
2.10 Related work . . . . . . . . . . . . . . . . . . . . . . . . . . . . . . . . . . 23
2.10.1 Network weather service . . . . . . . . . . . . . . . . . . . . . . . . 23
2.10.2 NWS: drawbacks . . . . . . . . . . . . . . . . . . . . . . . . . . . . 23
2.10.3 Topomon . . . . . . . . . . . . . . . . . . . . . . . . . . . . . . . . 24
2.10.4 Other kinds of approach . . . . . . . . . . . . . . . . . . . . . . . . 24
1
3 The proposed approach 25
3.1 Architecture . . . . . . . . . . . . . . . . . . . . . . . . . . . . . . . . . . . 25
3.2 Implementation . . . . . . . . . . . . . . . . . . . . . . . . . . . . . . . . . 26
3.3 GT3 . . . . . . . . . . . . . . . . . . . . . . . . . . . . . . . . . . . . . . . 27
3.4 About the Globus Toolkit . . . . . . . . . . . . . . . . . . . . . . . . . . . 27
3.5 Globus installation, testbed setup . . . . . . . . . . . . . . . . . . . . . . . 28
3.6 Further consideration about the discovered topology . . . . . . . . . . . . . 28
4 Results 29
4.1 Considerations about running time . . . . . . . . . . . . . . . . . . . . . . 31
4.2 Future work . . . . . . . . . . . . . . . . . . . . . . . . . . . . . . . . . . . 33
4.2.1 Security . . . . . . . . . . . . . . . . . . . . . . . . . . . . . . . . . 33
4.2.2 Network sensor improvements . . . . . . . . . . . . . . . . . . . . . 33
4.2.3 Grid topology service . . . . . . . . . . . . . . . . . . . . . . . . . . 34
A Globus installation tricks 35
B Programming GT3 35
B.0.4 OGSA,OGSI,GT3 and WSRF . . . . . . . . . . . . . . . . . . . . . . 36
B.0.5 The �ve steps . . . . . . . . . . . . . . . . . . . . . . . . . . . . . . 37
B.1 Deeper inside implementation . . . . . . . . . . . . . . . . . . . . . . . . . 38
B.1.1 Server-side . . . . . . . . . . . . . . . . . . . . . . . . . . . . . . . . 38
B.1.2 Client-side: the broker and the grid end user . . . . . . . . . . . . . 39
C Grid Topology service installation and user guide 41
C.1 Anatomy of the directory . . . . . . . . . . . . . . . . . . . . . . . . . . . . 41
C.2 Compiling, deploying and running the service . . . . . . . . . . . . . . . . 42
C.3 Compiling and running the client . . . . . . . . . . . . . . . . . . . . . . . 43
2

1 The Grid
Today Grid Computing is ubiquitous. As of June 2005 searching those 2 words on Google
would return more than 13 millions results and just the �rst ten results show how some of
the largest technology companies in the world, like IBM, Intel, Sun Microsystems and HP
have decided to invest in their own Grid Computing project.
Grid is a type of parallel and distributed system that enables the sharing, selection, and
aggregation of geographically distributed autonomous resources dynamically at runtime
depending on their availability, capability, performance, cost, and users' quality-of-service
requirements.
The key distinction between clusters and grids is mainly lie in the way resources are man-
aged. In case of clusters, the resource allocation is performed by a centralised resource
manager and all nodes cooperatively work together as a single uni�ed resource. In case
of Grids, each node has its own resource manager and doesn't aim for providing a single
system view. Another important distinction is that in cluster environments all the applica-
tions running are cluster-oriented while every host of a Grid is independent from others and
runs many applications non grid-aware. More information on Grid Computing concepts
can be retrieved here [2],[3],[4]
According to Wikipedia [1] Grid Computing o�ers a model for solving massive computa-
tional problems by making use of the unused resources (CPU cycles and/or disk storage)
of large numbers of disparate, often desktop, computers treated as a virtual cluster embed-
ded in a distributed telecommunications infrastructure. Grid Computing 's focus on the
ability to support computation across administrative domains sets it apart from traditional
computer clusters or traditional distributed computing.
Grids o�er a way to solve Grand Challenge problems like protein folding, �nancial mod-
elling, earthquake simulation, climate/weather modelling etc. Grids o�er a way of using the
information technology resources optimally in an organization. Some of the large companies
involved in Grid development, such as IBM [34], provide a means for o�ering information
technology as a utility bureau for commercial and non-commercial clients, with those clients
paying only for what they use, as with electricity or water.
Grid Computing has the design goal of solving problems too big for any single super-
computer, whilst retaining the �exibility to work on multiple smaller problems. Thus grid
computing provides a multi-user environment. Its secondary aims are: better exploitation
of the available computing power, and catering for the intermittent demands of large com-
putational exercises.
Just to sketch the idea of what Grid Computing really turns to be in the real world here
3

are reported three interesting de�nition of Grid Computing from Wikipedia:
• CERN, who were key in the creation of the World Wide Web, talk of The Grid: a
service for sharing computer power and data storage capacity over the Internet.
• Pragmatically, Grid Computing is attractive to geographically-distributed non-
pro�t collaborative research e�orts like the NCSA Bioinformatics Grids such as BIRN:
external grids.
• Grid Computing is also attractive to large commercial enterprises with complex
computation problems who aim to fully exploit their internal computing power: in-
ternal grids.
1.1 GGF, the Global Grid Forum and GTx, the Globus Toolkit
The Global Grid Forum (GGF) has the purpose of de�ning speci�cations for Grid Com-
puting . The Globus Alliance implements these standards through the Globus Toolkit
, which has become the de facto standard for grid middleware1. As a middleware compo-
nent, it provides a standard platform for services to build upon, but Grid Computing
needs other components as well, and many other tools operate to support a successful
Grid environment. This situation resembles that of TCP/IP: the usefulness of the Internet
emerged both from the success of TCP/IP and the establishment of applications such as
newsgroups and webpages.
Globus has implementations of the GGF-de�ned protocols to provide:
• Resource management: Grid Resource Allocation & Management Protocol (GRAM)
• Information Services: Monitoring and Discovery Service (MDS)
• Security Services: Grid Security Infrastructure (GSI)
• Data Movement and Management: Global Access to Secondary Storage (GASS) and
GridFTP
A number of tools function along with Globus to make Grid Computing a more robust
platform, useful to high-performance computing communities. They include:
• Grid Portal Software such as GridPort and OGCE
1 Software that connects two otherwise separate applications in case belonging to di�erent computing
framework such as lying on di�erent operative systems or belonging to di�erent network domains.
4

• Grid Packaging Toolkit (GPT)
• MPICH-G2 (Grid Enabled MPI)
• Network Weather Service (NWS) (Quality-of-Service monitoring and statistics)
• Condor (CPU Cycle Scavenging) and Condor-G (Job Submission)
Most of the grids which span research and academic communities in North America and
Europe use the Globus Toolkit as their core middleware.
XML-based web services o�er a way to access the diverse services/applications in a dis-
tributed environment. In the last few years the worlds of grid computing and of web
services have started to converge to o�er Grid as a web service (Grid Service). The Open
Grid Services Architecture (OGSA) has de�ned this environment, which will o�er several
functionalities adhering to the semantics of the Grid Service.
OGSA, OGSI and their implementation provided by Globus Toolkit will be explored into
the details later B.0.4
2 Network awareness and Topology discovery in grid
environments
A di�cult problem in designing e�cient applications for computational Grids is that the
wide-area interconnection network is highly complex, dynamic, and heterogeneous. A more
traditional computing platform such as a cluster or supercomputer typically has a highly
regular network with constant, guaranteed performance. With a Grid, however, the network
has an irregular and asymmetric topology, where di�erent links have di�erent speeds, which
even change over time.
On the other hand, the dynamic joint optimization of both computational and network
resources has the potential of guaranteeing optimal performance to Metropolitan Area Net-
work (MAN) grid applications. For this purpose the introduction of grid network services
has been proposed. Grid network services provide either the users or the programming envi-
ronment, with information on network resource status and means for reallocating network
resources.
2.1 The goal of this work
In this study a speci�c grid network service, i.e. the topology discovery service, is presented.
The topology discovery service provides grid users with up to date information on the
5

grid network status considering di�erent network layers. The proposed implementation is
based on a producer/consumer architecture where grid users are contemporarily producers
and consumers of the required information. This implementation can be utilized in any
MAN based on commercial routers without the need of modifying router management
and control protocols. The information provided by the proposed system could be useful
to allow applications to handle with the network taking into consideration the link level
thus improving the e�ectiveness at which operations are performed. For instance, a grid
user application, empowered by network awareness, could decide to route a connection to
another application via an alternative path instead of the default provided by the IP level
route because of congestion. Other examples on the importance of exploiting topology-
related information in Grid environments will be given in the next sections.
2.2 Performance measures over grid networks
The GGF Network Measurements Working Group has provided a draft [8] in which is
described a set of network characteristics and a classi�cation hierarchy for these charac-
teristics useful for Grid applications and services.
The goal of their work is to identify the various types of network measurements according
to the network characteristic they measure and the network entity on which they are taken
in the hope that the application of this naming system will facilitate the creation of com-
mon schemata for describing network monitoring data in Grid Monitoring and Discovery
Services.
The NMWG is closely related to the IETF Internet Protocol Performance Metrics (IPPM)
WG.
Whereas their work focuses on best-practices for network engineers and de�ning the correct
way to take measurements, the GGF NMWG's goal is creating a comprehensive system
that can be used to categorize all measurements that are in use, taking into account the
requirements of grid applications and grid-related tools.
2.2.1 Sample Grid use of network measurements
As an example of how network measurements could be used in a Grid environment, the case
of a Grid �le transfer service is presented. Assume that a Grid Scheduler [10] determines
that a copy of a given �le needs to be copied to site A before a job can be run. Several
copies of this �le are registered in a Data Grid Replica Catalogue [11], so there is a choice
of where to copy the �le from. The Grid Scheduler needs to determine the optimal method
to create this new �le copy, and to estimate how long this �le creation will take. To make
6
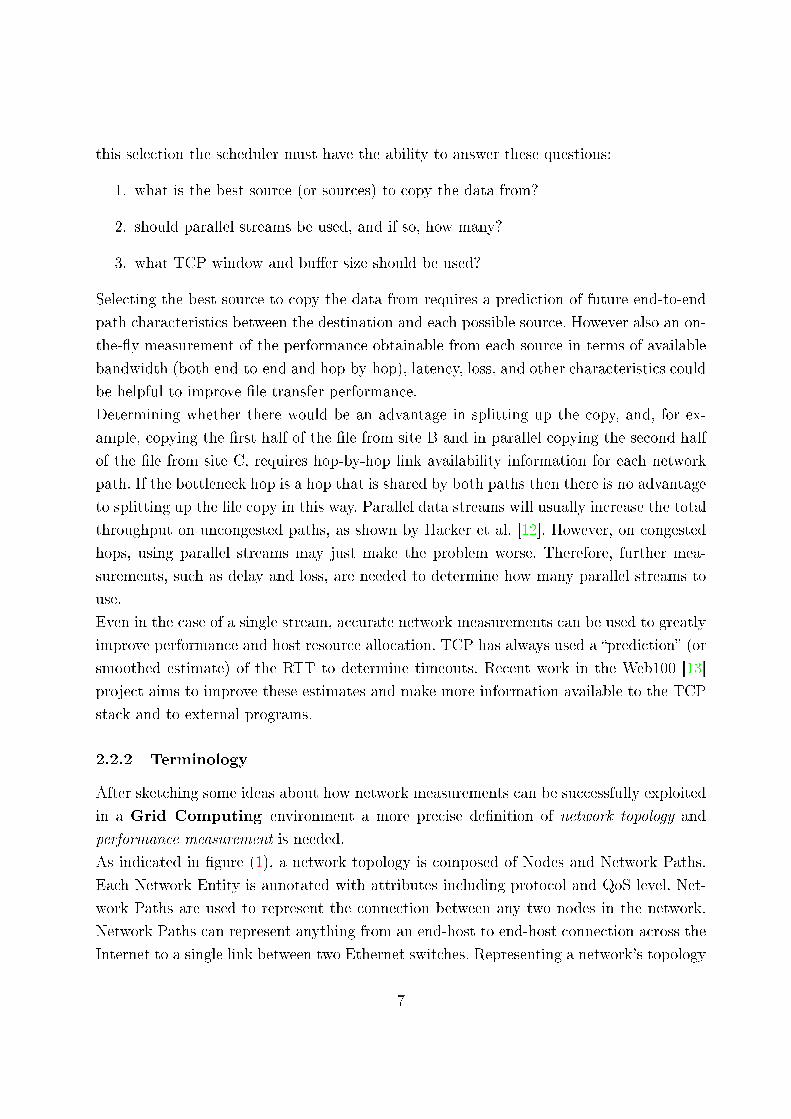
this selection the scheduler must have the ability to answer these questions:
1. what is the best source (or sources) to copy the data from?
2. should parallel streams be used, and if so, how many?
3. what TCP window and bu�er size should be used?
Selecting the best source to copy the data from requires a prediction of future end-to-end
path characteristics between the destination and each possible source. However also an on-
the-�y measurement of the performance obtainable from each source in terms of available
bandwidth (both end-to-end and hop-by-hop), latency, loss, and other characteristics could
be helpful to improve �le transfer performance.
Determining whether there would be an advantage in splitting up the copy, and, for ex-
ample, copying the �rst half of the �le from site B and in parallel copying the second half
of the �le from site C, requires hop-by-hop link availability information for each network
path. If the bottleneck hop is a hop that is shared by both paths then there is no advantage
to splitting up the �le copy in this way. Parallel data streams will usually increase the total
throughput on uncongested paths, as shown by Hacker et al. [12]. However, on congested
hops, using parallel streams may just make the problem worse. Therefore, further mea-
surements, such as delay and loss, are needed to determine how many parallel streams to
use.
Even in the case of a single stream, accurate network measurements can be used to greatly
improve performance and host resource allocation. TCP has always used a �prediction� (or
smoothed estimate) of the RTT to determine timeouts. Recent work in the Web100 [13]
project aims to improve these estimates and make more information available to the TCP
stack and to external programs.
2.2.2 Terminology
After sketching some ideas about how network measurements can be successfully exploited
in a Grid Computing environment a more precise de�nition of network topology and
performance measurement is needed.
As indicated in �gure (1), a network topology is composed of Nodes and Network Paths.
Each Network Entity is annotated with attributes including protocol and QoS level. Net-
work Paths are used to represent the connection between any two nodes in the network.
Network Paths can represent anything from an end-host to end-host connection across the
Internet to a single link between two Ethernet switches. Representing a network's topology
7
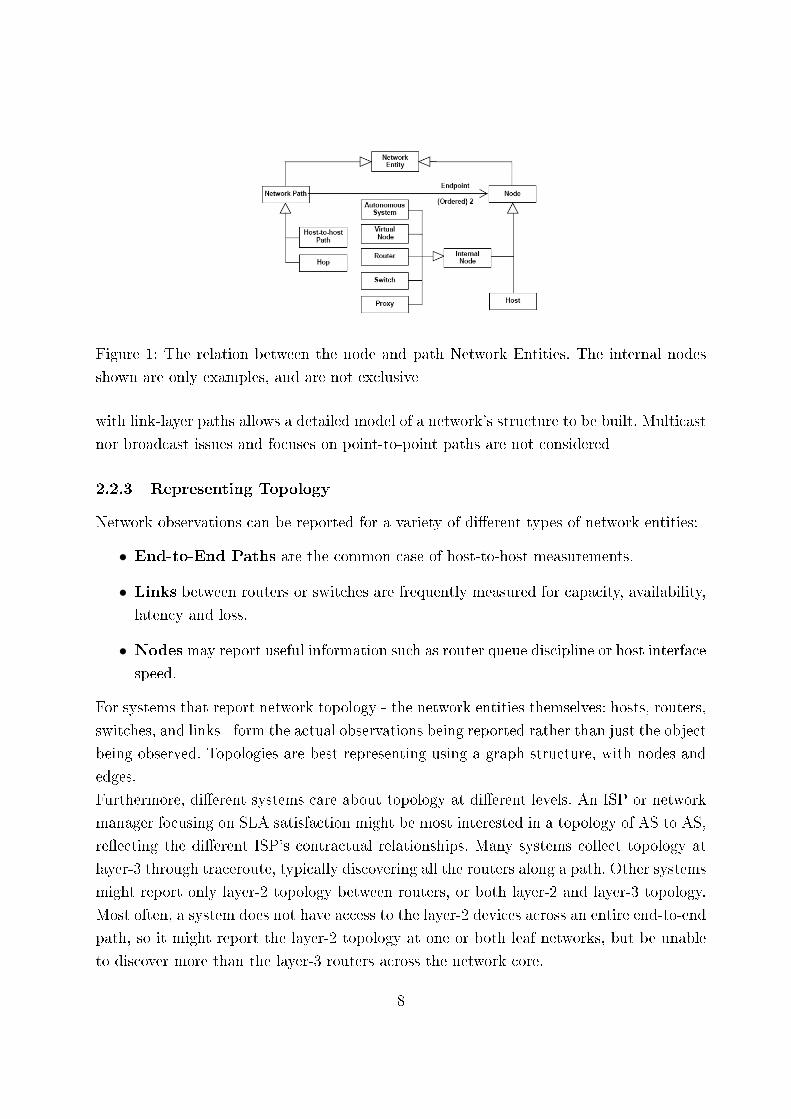
Figure 1: The relation between the node and path Network Entities. The internal nodes
shown are only examples, and are not exclusive
with link-layer paths allows a detailed model of a network's structure to be built. Multicast
nor broadcast issues and focuses on point-to-point paths are not considered
2.2.3 Representing Topology
Network observations can be reported for a variety of di�erent types of network entities:
• End-to-End Paths are the common case of host-to-host measurements.
• Links between routers or switches are frequently measured for capacity, availability,
latency and loss.
• Nodesmay report useful information such as router queue discipline or host interfacespeed.
For systems that report network topology - the network entities themselves: hosts, routers,
switches, and links - form the actual observations being reported rather than just the object
being observed. Topologies are best representing using a graph structure, with nodes and
edges.
Furthermore, di�erent systems care about topology at di�erent levels. An ISP or network
manager focusing on SLA satisfaction might be most interested in a topology of AS to AS,
re�ecting the di�erent ISP's contractual relationships. Many systems collect topology at
layer-3 through traceroute, typically discovering all the routers along a path. Other systems
might report only layer-2 topology between routers, or both layer-2 and layer-3 topology.
Most often, a system does not have access to the layer-2 devices across an entire end-to-end
path, so it might report the layer-2 topology at one or both leaf networks, but be unable
to discover more than the layer-3 routers across the network core.
8

2.2.4 Physical and Functional Topologies
There are two approaches to characterizing network topology: physical and functional.
The physical approach determines the physical hops that connect the network together. By
determining the connections between nodes, along with their capacities, queuing disciplines,
and tra�c load, the network can be modelled and its behaviour analysed or predicted.
Physical topology can be determined for both LANs and WANs.
The functional approach di�ers in that it makes use of end-to-end information, under the
assumption that such observations are more readily available and usable than modelling low
level network behaviour. Functional topology representations attempt to group and arrange
network sites according to their perceived closeness determined by tra�c performance,
rather than according to the actual connections of physical hops. This approach may be
taken across a variety of sites distributed around the Internet, or using a single source tree.
Functional topologies provide useful information that an application could use to make
many of the same decisions that are made with physical information. The only noticeable
di�erence in the representation of physical and functional topologies is, as it was mentioned
before, that functional topology cannot handle with shared hops simply because it doesn't
perceive it.
Nodes are generally classi�ed into hosts and internal nodes:
• Hosts are considered to be only endpoints of communication. Internal nodes are
capable of forwarding tra�c, and can be routers, switches, or proxies, as well as more
general concepts such as autonomous systems or virtual nodes in a topology.
• Virtual nodes are used to describe additional functionality that might be found in a
physical node. Note that physical and virtual nodes do not occupy disjoint graphs in
a network topology. In particular, functional networks always contain physical nodes
at their edges. There may be several virtual nodes, describing di�erent functionality,
overlaid on a single physical node. Furthermore, virtual nodes may play a role in
describing physical networks.
Two examples of the use of a virtual node are given:
• Because some hosts also perform routing, a virtual node might be used to represent
the routing done by the host, with the host being a separate node linked to the virtual
node.
• As an example of using a virtual node to describe a physical network, consider a
halfduplex link such as a wireless network. Because paths are de�ned to be unidirec-
9
tional, the half-duplex nature of such a network cannot be adequately described in
a path. However, by imposing a virtual node in the network with appropriate char-
acteristics of the half-duplex link, the virtual node can represent the transmission
characteristics of the half-duplex link.
Like paths, nodes also should be annotated with a set of attributes. The attributes indicate
a speci�c set of characteristics of the node when handling a particular type of tra�c. In
particular, queuing disciplines, queue lengths, etc. may vary quite signi�cantly according
to type of tra�c and QoS level.
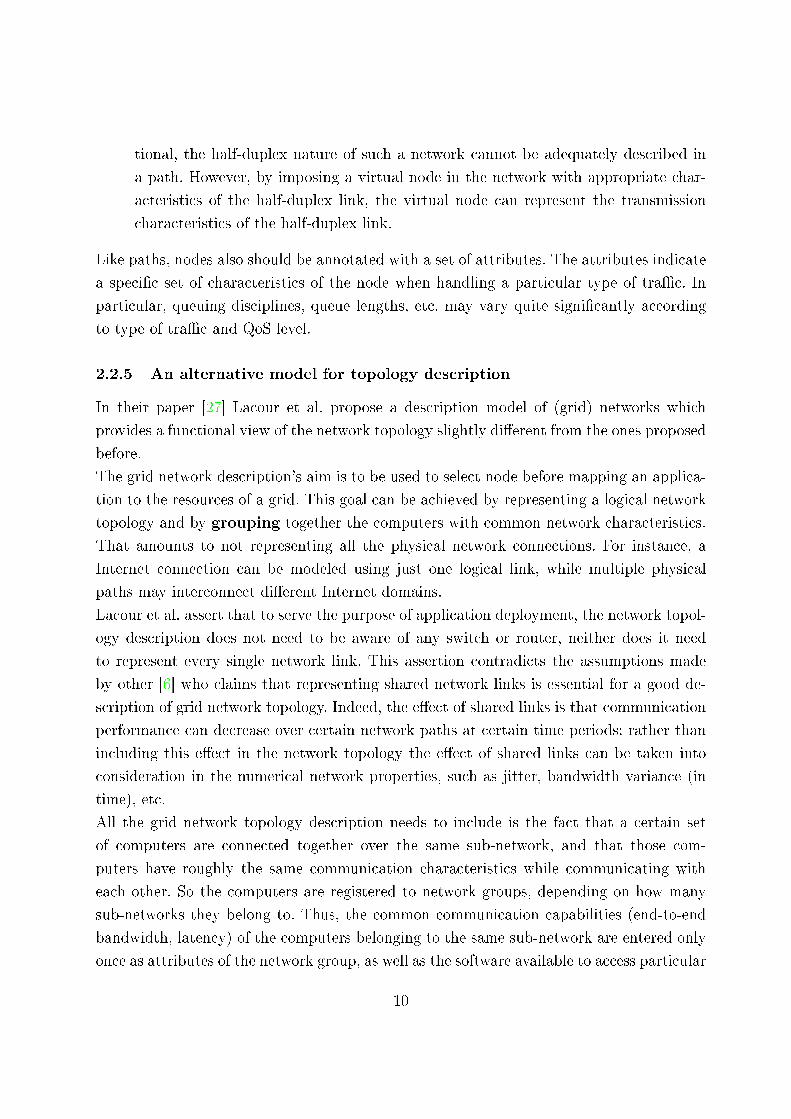
2.2.5 An alternative model for topology description
In their paper [27] Lacour et al. propose a description model of (grid) networks which
provides a functional view of the network topology slightly di�erent from the ones proposed
before.
The grid network description's aim is to be used to select node before mapping an applica-
tion to the resources of a grid. This goal can be achieved by representing a logical network
topology and by grouping together the computers with common network characteristics.
That amounts to not representing all the physical network connections. For instance, a
Internet connection can be modeled using just one logical link, while multiple physical
paths may interconnect di�erent Internet domains.
Lacour et al. assert that to serve the purpose of application deployment, the network topol-
ogy description does not need to be aware of any switch or router, neither does it need
to represent every single network link. This assertion contradicts the assumptions made
by other [6] who claims that representing shared network links is essential for a good de-
scription of grid network topology. Indeed, the e�ect of shared links is that communication
performance can decrease over certain network paths at certain time periods: rather than
including this e�ect in the network topology the e�ect of shared links can be taken into
consideration in the numerical network properties, such as jitter, bandwidth variance (in
time), etc.
All the grid network topology description needs to include is the fact that a certain set
of computers are connected together over the same sub-network, and that those com-
puters have roughly the same communication characteristics while communicating with
each other. So the computers are registered to network groups, depending on how many
sub-networks they belong to. Thus, the common communication capabilities (end-to-end
bandwidth, latency) of the computers belonging to the same sub-network are entered only
once as attributes of the network group, as well as the software available to access particular
10

network technologies (BIP, GM or MX for a Myrinet network, for instance).
Network grouping makes the node selection phase easier because it supplies a functional
view of network topology highly hierarchical. Intuitively, grouping replaces a �join� (in the
database language) for free, since the information about the network is already �precom-
piled� . As each individual link could not taken into consideration the description become
more compact. Lacour et Al. also assert that network grouping makes sense because end-to-
end network per performance properties are roughly the same between any two computers
of a sub-network like a dedicated cluster or a LAN: network performance characteristics
can be described as attributes of network groups using the results of the NMWG from the
GGF.
The topology described using the network grouping approach use a directed acyclic graph
(DAG). The nodes of the grid network description graph correspond to the network groups
or the computers (which can be considered as network groups made of just one host).
The oriented edges of this description graph correspond to network group inclusions: net-
work groups can have parent or child network groups and the edges are oriented from a
parent network group to a child network group. In other words, a child network group
represents a sub-network of its parent network group.
2.3 Common performance metrics
The common network performance index of more interest are:
• bandwidth capacity: the theoretical maximum link-layer bandwidth of a network
element or end-to-end path.
• bandwidth utilization: the aggregate of all tra�c currently being consumed on a
hop or path.
• available bandwidth: the capacity minus utilization over a given time interval.
• achievable bandwidth: the throughput between two end points given a speci�c setof conditions, such as transmission protocol (e.g.: TCP or UDP), host hardware (e.g.:
processor speed, bus speed, NIC speed), operating system, system settings (e.g.: TCP
bu�er size, txqueuelen setting), and so on.
• delay: one way delay (OWD) is the time it takes for a packet to travel from source
to destination. Round Trip Time (RTT) is the time to travel from the source to the
destination and back.
11
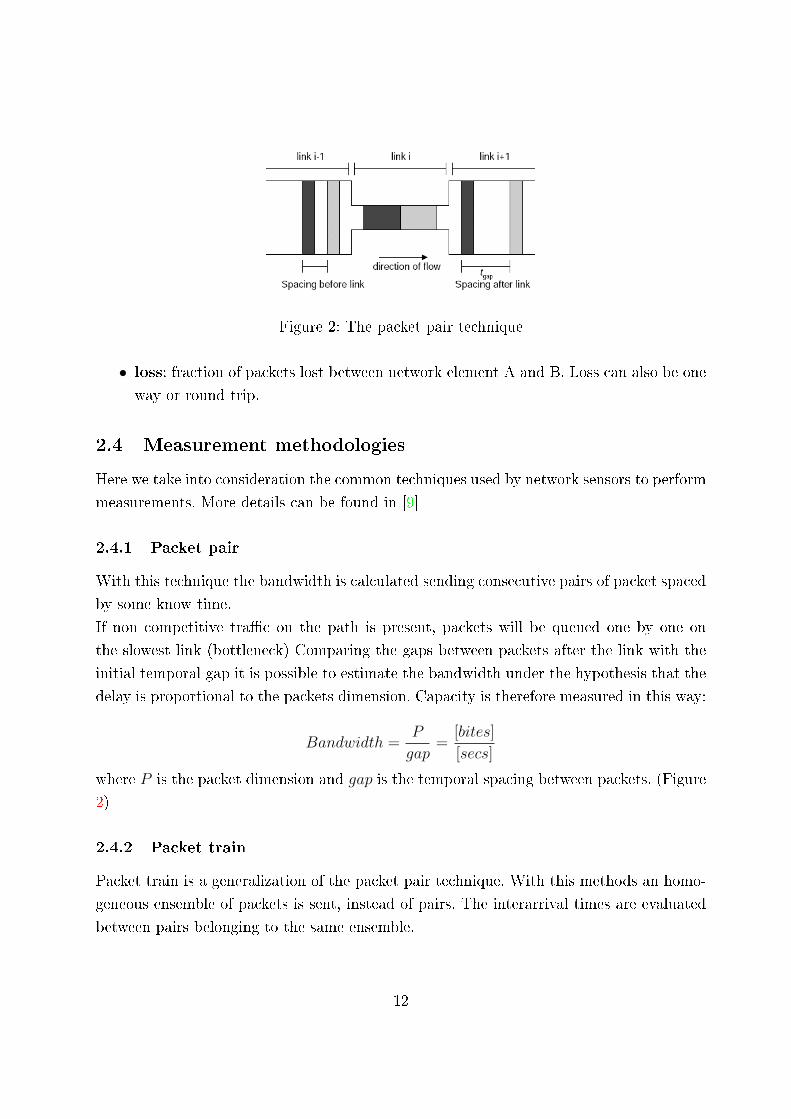
Figure 2: The packet pair technique
• loss: fraction of packets lost between network element A and B. Loss can also be one
way or round trip.
2.4 Measurement methodologies
Here we take into consideration the common techniques used by network sensors to perform
measurements. More details can be found in [9]
2.4.1 Packet pair
With this technique the bandwidth is calculated sending consecutive pairs of packet spaced
by some know time.
If non competitive tra�c on the path is present, packets will be queued one by one on
the slowest link (bottleneck) Comparing the gaps between packets after the link with the
initial temporal gap it is possible to estimate the bandwidth under the hypothesis that the
delay is proportional to the packets dimension. Capacity is therefore measured in this way:
Bandwidth =P
gap=
[bites]
[secs]
where P is the packet dimension and gap is the temporal spacing between packets. (Figure
2)
2.4.2 Packet train
Packet train is a generalization of the packet pair technique. With this methods an homo-
geneous ensemble of packets is sent, instead of pairs. The interarrival times are evaluated
between pairs belonging to the same ensemble.
12
2.4.3 Tailgating
This technique aims to improve the packet pair method. It is divided in two phases: during
the �rst phase (σ phase) the performance along an end-to-end path is measured while
during the second one tailgating phase link-based measures are taken. During the σ phase
latency and bandwidth are calculated for the link prior to the destination. The calculation
is performed sending a train of packets of di�erent dimensions until the estimate of the
bandwidth is su�ciently precise.
In the second phase two packets are sent. The �rst is as long as the link MTU and has TTL
equal to the distance of the link is under measurement. The second packet has the minimum
dimension allowed by the protocol. As long as the TTL of the �rst packet isn't expired
the second (smaller) packet follows the �rst.When the TTL of the �rst packet expires the
second one proceeds without being queued to the �rst one anymore. This mechanism is
iterated for each link to the destination.
In this way it is possible to estimate the bandwidth of intermediate link considering the
delay accumulated by the smaller packet compared to the (�xed) delay of bigger packets.
2.4.4 Variable Packet Size (VPS)
With this methodology it is possible to estimate the bandwidth of the link. Packets of
di�erent dimension are sent through the network using the TTL �eld of IP. In this way,
after passing a know number of links the packet is discarded and an ICMP message is sent
back to the sender so that the sender will be able to calculate the round trip time.
Repeating this mechanism many time and varying the packets dimension it is possible to
build a XY graph of the delay vs packet size.
For each dimension is then considered the minimum delay obtained supposing the packet
never been queued that is, the delay is only dependant from the transit time through the
net.
Then this points are linearly interpolated, so that the di�erence between the slope of two
consecutive nodes is the inverse of the bandwidth of the link which connects those two
nodes.
2.4.5 Even/Odd
Even/odd is a mathematic tool to increase the accuracy in the measurements of VPS-like
techniques. For each packet dimension the ensemble of obtained samples is divided in two
subset: the subset of odd dimension samples and the subset of even dimension samples.
13

The bandwidth is therefore estimated independently:
1. evaluating only the even-indexed samples
2. evaluating only the odd-indexed samples
3. evaluating only the even-indexed samples through a known index i and the odd-
indexed through the end
4. evaluating only the odd-indexed samples through a known index i and the even-
indexed through the end
Considering the minimum and the maximum estimate obtained a con�dence interval is
drawn. The real value will be contained in that interval.
2.4.6 Self Loading Periodic Streams (SLOPS)
With this technique many packet streams are sent at a frequency greater than the supposed
bandwidth of the link. The packets will be queued on the node that processes them at
a lower frequency. Each packet is given a timestamp when it is sent. Upon the arrival
the timestamp of consecutive packets are compared with the interarrival time taking into
account the network latency. In order to modulate the frequency to which packet are sent
an adaptive algorithm is then used.
2.4.7 TCP simulation
A TCP connection is simulated by means of UDP or ICMP packets. The TCP slow-start
phase is simulated as well in order to determine the link MTU
2.4.8 Path �ooding
A measurement is performed trying to �ll up the link with a �ood of packets. In this way the
real bandwidth at the applicative level is measured, taking into account all the overheads
caused by lower level protocol, operative system and the tra�c in transit on the link. This
measurement technique is highly intrusive and a�ects heavily the communications through
the measured link.
14

2.5 Network sensors
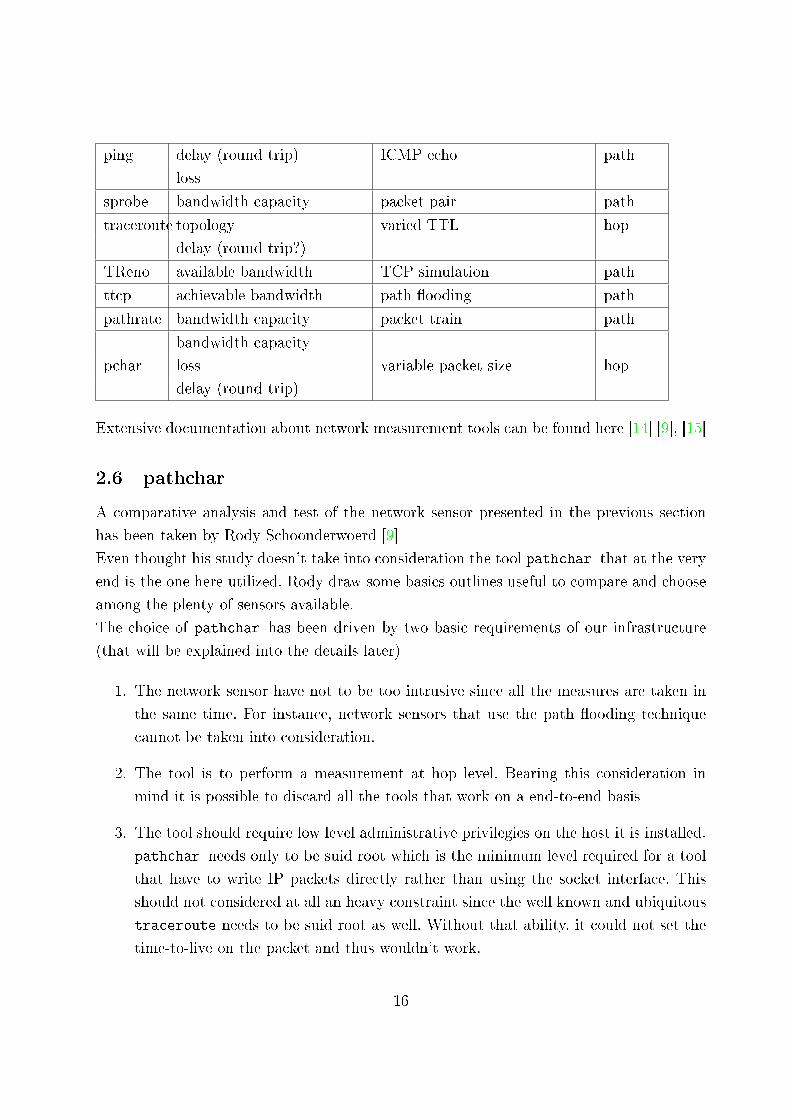
Table 2.5 contains mapping of some common network measurement tools to the network
characteristics as described in [8]. Table 2.5 table is focused on active monitoring tools,
however there are a number of passive tools that can also be used to measure some of the
NMWG de�ned characteristics.
Tool
name
Characteristics Measured Measurement Methodology Path or
hop
bandwidth capacity
bing loss variable packet size path
delay (round trip)
bprobe bandwidth capacity packet pair path
cprobe bandwidth utilization packet pair path
clink bandwidth capacity variable packet size hop
delay (round trip)
Iperf achievable bandwidth path �ooding path
available bandwidth
netest achievable bandwidth packet train and path path
loss �ooding
delay (round trip)
Netperf achievable bandwidth path �ooding path
Nettimer bandwidth capacity packet pair with tailgating path
one-way delay
owping loss active, GPS-based path
reordering
bandwidth capacity
pathchar loss variable packet size hop
delay (round trip)
pathload available bandwidth SLOPS path
available bandwidth
pipechar loss packet train hop
delay (round trip)
15
ping delay (round trip) ICMP echo path
loss
sprobe bandwidth capacity packet pair path
traceroute topology varied TTL hop
delay (round trip?)
TReno available bandwidth TCP simulation path
ttcp achievable bandwidth path �ooding path
pathrate bandwidth capacity packet train path
bandwidth capacity
pchar loss variable packet size hop
delay (round trip)
Extensive documentation about network measurement tools can be found here [14] [9], [15]
2.6 pathchar
A comparative analysis and test of the network sensor presented in the previous section
has been taken by Rody Schoonderwoerd [9]
Even thought his study doesn't take into consideration the tool pathchar that at the very
end is the one here utilized, Rody draw some basics outlines useful to compare and choose
among the plenty of sensors available.
The choice of pathchar has been driven by two basic requirements of our infrastructure
(that will be explained into the details later)
1. The network sensor have not to be too intrusive since all the measures are taken in
the same time. For instance, network sensors that use the path �ooding technique
cannot be taken into consideration.
2. The tool is to perform a measurement at hop level. Bearing this consideration in
mind it is possible to discard all the tools that work on a end-to-end basis
3. The tool should require low level administrative privilegies on the host it is installed.
pathchar needs only to be suid root which is the minimum level required for a tool
that have to write IP packets directly rather than using the socket interface. This
should not considered at all an heavy constraint since the well known and ubiquitous
traceroute needs to be suid root as well. Without that ability, it could not set the
time-to-live on the packet and thus wouldn't work.
16
pathchar �ts all previously listed requirements. As a drawback, as it will be pointed out,
it does not deal very well with high throughput network. Moreover it seems that it also
lacks software maintenance and this could mean that no further development will a�ect it.
A. Downey in his work on pathchar [35] provides an extensive analysis and testing of the
pathchar tool pointing out advantages and shortcomings in di�erent network layouts.
It is necessary to stress that the netowrk sensor used, even thought it can a�ect greatly
the results of the work of the proposed system, is really not the core point. The proposed
infrastructure has been thought to be modular thus uncoupled from the low level sensors
it uses. With some minor software rewriting the topology discovery service here presented
can adapt to using some other low level network sensor.
2.7 Grid Network Services
So far it has been discussed about lower level sensor in charge of performing measurements
on the grid network. In the following section the higher level software monitor architecture
deemed to elaborate the information provided by sensors and dispatch it to the grid user
as a service is taken into consideration.
An informational draft that explains Grid Network Services getting into the details and by
means of a plenty of examples and useful implementation directives can be found here [7]
Grid network services combine several existing network services yielding a rich mediation
function between grid applications and legacy networks. Through these services, the net-
work resource is seen joining CPU and storage as a �rst-class, grid managed resource (and
handled, as such, by a community scheduler, or other OGSA services).
A network service is further labeled as a Grid Network Service whenever the service has
roles and/or interfaces that are deemed to be speci�c infrastructure.
2.7.1 Overview of Grid Network Services
Network services assist a grid infrastructure in di�erent ways. In the simplest setup, a
grid application (or a grid infrastructure on its behalf) consults a Network Service as if it
was an omniscient oracle (e.g., a directory service) using a plain question/answer style of
interaction. In more complex setups, Network Services interact with one another to realize
one or more end-to-end feedback loop cycles (as in: observe + request + provision + act).
Application requirements, policy considerations, and brokers directives are continuously
injected into these feedback loops via expressive languages and machine interfaces (as
opposed to, say, point-and-click sessions driven by operators).
Figure (3) shows an example of notional network services engaged in a fairly complex set
17

Figure 3: An example of Network Service in action (e.g. for an hypothetical bulk transfer
mover)
of feedback loops. Applications demands, policy, and networks observed metrics (capacity,
latency, jitter, loss, etc.) are continuously mediated, resulting in data marshalling and
provisioning actions upon the network and/o the end-systems.
The various �ows de�ned by boxes and edges must operate in a secure fashion across 1..N
administrative boundaries. For some of the edges, there may be WS-Agreement Initiators
and Providers at the opposite ends of the edge.
In Figure (3), the edge labeled 1 is meant to capture the following concept: there mecha-
nisms for the application (or the Grid infrastructure in its behalf, e.g. a broker) to invoke
services, and pass on to these services parameters like data rate pro�le (time vs. rate),
total data amount remaining (estimation or actual), and other characteristics associated
with the data stream and/or the service request. In turn, these parameters aid network ser-
vices in predicting and optimizing the utilization of network resources, resulting in greater
satisfaction and/or cost e�ciencies to the end user.
With regard to the edge labeled 2, a designated service must notify an application (or the
Grid infrastructure) of those events that the application has negotiated and registered for.
It must tell an application if it is admission-controlled out (be it a capacity or a policy
issue). It must provide timely noti�cations of SLA violations to an application .
With regard to the edge labeled 3, when appropriate, credited services can dynamically
(re)provision network aspects (e.g., to tap on either tra�c engineering �xtures TDM/WDM
circuits upon a very large bulk )
The Grid Network Services are the boxes and their derivatives which are directly exposed
18

Figure 4: Grid Network Services vs. Network Services
to elements of the Grid infrastructure (such as a universal Grid broker for all resource
types). For these elements to interoperate, a GGF-sanctioned Grid interface is necessary.
On the contrary, the network services are represented by those boxes and their derivatives
which are not directly exposed to elements of the Grid infrastructure (e.g., they only
interact with other network services, network control planes management planes). For
these, a GGF-sanctioned interface is a su�cient albeit not necessary choice. Examples of
network services include: a domain-speci�c bandwidth broker, a network directory service.
It is appropriate to think of the network services forming a practical underlay to the actual
Grid Network Services, as pictured in Figure (4).
2.7.2 Network Monitoring Service (a proxy to NM-WG)
Traditionally, network monitoring has been driven by the need for fault detection and
performance prediction. While this remains true in Grid environments, a signi�cant new
concept is introduced, that of publishing performance data to Grid applications, middle-
ware and the network fabric. This radical change will allow systems to both adapt to
changing network conditions, thus optimising performance, and also provide support for
the Grids much touted self-healing capability. As �gure (5) shows, the services potential
clients are numerous varied: middleware and end-user software (Grid applications), other
services (e. network cost function), network administration software, such as tools used by
human administrators in network operation centre environments, automated systems, and
�nally, corresponding monitoring services other network domains.
19
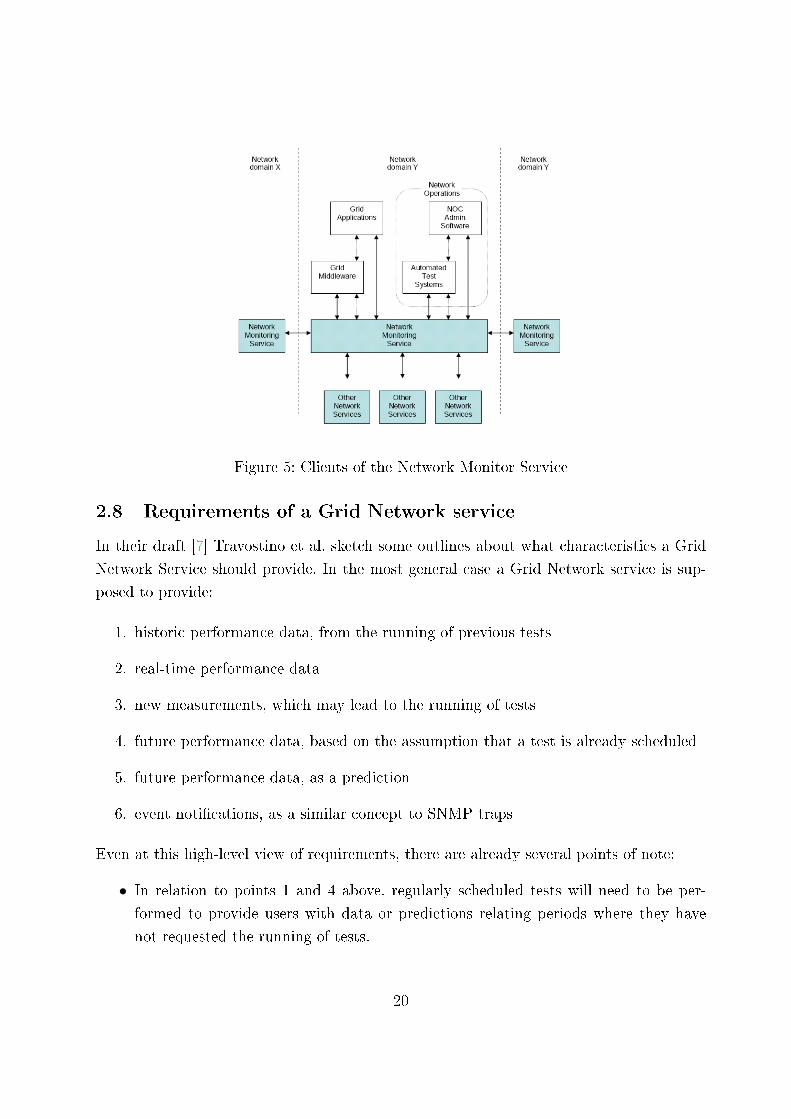
Figure 5: Clients of the Network Monitor Service
2.8 Requirements of a Grid Network service
In their draft [7] Travostino et al. sketch some outlines about what characteristics a Grid
Network Service should provide. In the most general case a Grid Network service is sup-
posed to provide:
1. historic performance data, from the running of previous tests
2. real-time performance data
3. new measurements, which may lead to the running of tests
4. future performance data, based on the assumption that a test is already scheduled
5. future performance data, as a prediction
6. event noti�cations, as a similar concept to SNMP traps
Even at this high-level view of requirements, there are already several points of note:
• In relation to points 1 and 4 above, regularly scheduled tests will need to be per-
formed to provide users with data or predictions relating periods where they have
not requested the running of tests.
20
• Points 3-5 above imply that it should be possible for a user to select whether a data
request will ever result in the running of a test.
• As �gure (5) suggests, it is expected that requests will work across multiple adminis-
trative domains. In addition to this direct requirement, it is clear monitoring services
will also need the ability to discover further monitoring services.
• Monitor services could be decompose into several sub-services.
• Further, many of the detailed requirements will make reference to services and mon-
itoring points. These services could be the network monitoring service as a whole,
or one of its possible sub-services. Services control monitoring points, the entities
which make actual performance measurements. Services and monitoring points have
one-to-one or one-to-many relationships.
And in terms of making requests and receiving results:
• Requests for data and tests, and the publication of performance data should in the
main make use of the work of the GGF NM-WG group [8] who have de�ned XML
schemas for such tasks.
• Internally, a monitoring service can use any communication method deemed appro-
priate, but the NM-WG approach should be supported externally. An example of in-
ternal communication is that between a monitoring service and its monitoring points
(the nodes that actually make measurements).
• Interim communication, that taking place between a request being made and a result
being returned, is yet to be addressed.
• A means for requesting event noti�cations is yet to be de�ned. In the strictest sense,
event noti�cation is a monitoring not measurement task, and may be deemed by
NMWG to be outside their scope.
2.9 Web service/Grid Service De�nition
From the implementation point of view web services are self-contained, self-describing,
modular applications that can be published, located, and typically (but not necessarily)
invoked using standard HTTP over port 80. Web services can perform functions that are
anything from simple requests to complicated business or scienti�c procedures.
21

The W3C Web services Architecture working group provides the following de�nition: A
Web service is a software system designed to support interoperable machine-to-machine
interaction over a network. It has an interface described in a machine-processable format
(speci�cally WSDL). Other systems interact with the Web service in a manner prescribed
by its description using SOAP messages, typically conveyed using HTTP with an XML seri-
alization in conjunction with other Web-related standards. The main di�erence between a
normal remotely-invoked application and a Web service is that the latter has an XML-based
interface description that enables it to be self-describing. Once a Web service component is
deployed, other applications can discover and invoke the published service via its interface.
Web service are a hence a loosely coupled distributed computing technology but seems to
be the choice for the future because:
• Web Services are platform-independent and language-independent, since they use
standard XML languages. This means that the client program can be programmed in
C++ and running under Windows, while the Web Service is programmed in Java
and running under Linux.
• Most Web Services use HTTP for transmitting messages (such as the service request
and response). This is a major advantage if you want to build an Internet-scale
application, since most of the Internet's proxies and �rewalls won't mess with HTTP
tra�c (unlike CORBA, which usually has trouble with �rewalls)
A Grid service is a WSDL-de�ned service that conforms to a set of conventions relating to
its interface de�nitions and behaviors. OGSA speci�es three conditions for a Web service to
be quali�ed as a Grid service. First it must be an instance of a service implementation of
some service type as described above. Second, it must have a Grid Services Handle (GSH),
which is a type of Grid URI for the service instance. The GSH is not a direct link to the
service instance, but rather it is bound to a Grid Service Reference (GSR). The idea is
that the handle provides a constant way to locate the current GSR for the service instance,
because the GSR may change if the service instance changes or is upgraded. Third, each
Grid Service instance must implement a port called GridService portType. This portType
is analogous to the base Object class within object-oriented programming languages such
as Smalltalk or Java in that it encapsulates the root behavior of the component model.
The behavior encapsulated by the GridService portType is that of querying and updating
against the serviceData set of the Grid service instance, and managing the termination of
the instance.
22

2.10 Related work
Many researchers have found that high-performance Grid applications need to be aware of
the interconnection network in use [17],[18],[19],[20] Performance monitoring systems thus
are becoming integral parts of Grid computing platforms.
2.10.1 Network weather service
The Network Weather Service [16] is a distributed system that periodically monitors and
dynamically forecasts the performance that various network and computational resources
can deliver over a given time interval. The service operates a distributed set of performance
sensors (network monitors, CPU monitors, etc.) from which it gathers readings of the
instantaneous conditions. It then uses numerical models to generate forecasts of what the
conditions will be for a given time frame.
The NWS has been developed for use by dynamic schedulers and to provide statistical
Quality-of-Service readings in a networked computational environment. Prototype imple-
mentations for Globus and the Global Grid Forum (GGF) Grid Information System (GIS)
architecture have been developed.
Currently, the system includes sensors for end-to-end TCP/IP performance (bandwidth
and latency), available CPU percentage, and available non-paged memory. The sensor
interface, however, allows new internal sensors to be con�gured into the system.
NWS support various types of forecasting methods: mean based, median based, autoregres-
sive method
The system tracks the accuracy (using prediction error as an accuracy measure) of all
predictors, and uses the one exhibiting the lowest cumulative error measure at any given
moment to generate a forecast. In this way, the NWS automatically identi�es the best
forecasting technique for any given resource. Moreover, as new methods are added, they
will automatically be used to forecast the resource performance for which they are the most
accurate.
2.10.2 NWS: drawbacks
Unfortunately, the information provided by NWS is insu�cient for applications with com-
munication patterns where multiple sites compete for the same links. For example, if two
pairs of communicating sites are used, NWS will predict performance for each pair sep-
arately. If the two communication streams have some links in common, however, these
predictions will clearly be too optimistic, as the bandwidth for these links has to be shared
23

by the two streams. The current NWS system cannot solve this problem, because it lacks
topology information and thus cannot know which links are shared. This problem is es-
pecially important for applications that use collective communication, where many sites
communicate with each other simultaneously. This problem has been already faced in sec-
tion 2.2.5 where the approach of Lancur et Al. has been explained. Even though their
approach could make sense and make feasibly the description of large networks otherwise
infeasible, for small networks it could lead to less accuracy in description w.r.t the approach
taken by Topomon and by the present work. The shared links problem will be investigated
in details in next sections.
2.10.3 Topomon
TopoMon [6] is a tool which heavily inspired the present work. It was made to augments
NWS with topology information about the wide-area network. It is based on the idea
that the added value of integrating both performance and topology information is that
applications or communication libraries can not only predict their communication perfor-
mance, but can also avoid congestion on those Internet links that are shared by multiple,
simultaneous data streams.
2.10.4 Other kinds of approach
There exist several monitoring systems for the Internet that either measure network per-
formance [21],[23], [24] or explore network topology [25], [26]. However, their usefulness
for Grid applications is limited as they only provide data for the nodes involved in their
own monitoring e�orts. In order to have a useful information for Grid applications some
information (topology and performance) about exactly those parts of the global Internet
that connect the sites of a Grid environment is needed. While Internet-related tools pro-
vide useful monitoring techniques, Grid environments have to apply them to their own
sites. Some systems explore the topology of LAN installations in great detail. Most promi-
nently, Remos [17] uses SNMP to collect the necessary information. However, SNMP is not
available for general Internet connections. The BGP [22] routing protocol provides global
topology information, however only with the granularity of Autonomous Systems, which
is insu�cient for our purposes.
24

Figure 6: Testbed for D-TDS
3 The proposed approach
This section describes the architecture and the implementation issues of the system for
topology discovery presented. The topology discovery service, following the recommenda-
tion proposed in 2.8, provides grid users with up to date information on the grid network
status considering di�erent network layers. The proposed implementation is based on a
producer/consumer architecture developed under the GT3 framework Here onwards the
system taken into consideration will be referred as D-TDS (Distributed topology discovery
service).
3.1 Architecture
The Distributed TDS (D-TDS) architecture, as depicted in Figure (6), consists of a set of
grid hosts (i.e., users) and a broker. The grid hosts are both producers and consumers of
the information provided by the topology discovery service. The hosts run a service capable
of discovering the link-by-link paths to other hosts belonging to the Virtual Organization
(VO). The D-TDS provides the grid users with the logical topology, i.e. with the router
adjacencies at the IP layer. IP layer adjacencies consist of both physical layer adjacencies
(i.e., the adjacencies between physically connected routers) and MPLS layer adjacencies
(i.e.., two routers non physically adjacent can be adjacent at the IP layer because connected
by a Label Switched Path (LSP)).Logical topology is considered as something between the
physical and functional topology treated in 2.2.4.
In the D-TDS architecture the D-TDS broker tasks are just to trigger a sub-set of network
hosts to produce the requested information and to gather and elaborate the information
25

once it is produced. Thus, the D-TDS broker does not implement any communication with
the routers but it communicates just with the hosts. In addition the D-TDS broker does
not require to have any administrative privileges on the routers. The topology discovery
service procedure is as follows.
1. A user (i.e., hosts) submits a query to the broker regarding the VO logical network
topology. More precisely it ask the broker to drive measurement between a pool of
hosts whose IP is given as input to the broker
2. The broker contacts each hosts asked by the client triggering the topology discovery
procedure.
3. Each contacted host runs the sensor command to �nd the path, on the logical topol-
ogy, to any other host in the set.
4. Upon termination of the sensor-based discovery process, each host sends to the broker
the tree rooted on itself to every other host in the selected host set.
In particular, if a shortest path protocol, such as OSPF, is utilized to route IP packets
between the VO routers, the tree provided by each host to the D-TDS broker is the shortest
path tree (in terms of router hops) from itself to all the other hosts in the set. Upon
reception of all the host-rooted trees the broker merges them to compute the logical network
topology. Eventually the broker sends to the host that triggered the topology discovery
service the reply containing the computed VO logical network topology.
3.2 Implementation
In the implementation of the proposed D-DTS, the D-DTS broker runs on one of the
VO host. This does not imply any loss of generality since the broker and the topology
discovery service can run independently. The services developed for implementing the D-
DTS topology discovery service are grid services implemented in GT3.2 and deployed in
the globus container web server. All the communication between D-DTS broker and hosts
and between hosts is implemented via web service SOAP through the Globus Toolkit
libraries. Both the D-DTS broker and the topology discovery service at the hosts are
implemented in java(tm). The topology discovery service has only one remote method
getTree which is called by the broker and takes a host list as input (i.e., the set of selected
hosts involved in the distributed topology discovery process) which turns to be a simple list
of host IPs. The method getTree returns the list of the links discovered through pathchar
attributed with bandwidth, loss percentage, round trip time and queue delay per link.
26

As it was mentioned before pathchar o�ers a way of estimating the available bandwidth in
a non invasive fashion di�erently from other tools, such as iperf and netperf, that introduce
a huge amount of tra�c to give an estimate of the link bandwidth. Moreover as it was
mentioned before, pathchar is able to measure the network link characteristics on a per-
link basis. Instead a lot of tools (such as bing or cprobe, bprobe) give an aggregate end-
to-end information. Pathchar is run by the grid service on each host once the method
getTree is called and the list of the nodes in the pool is provided by the D-DTS broker.
It is important to notice that the method is called by the D-DTS broker asynchronously
with respect to each topology discovery service on the hosts of the pool so that each host
can start the measurements almost contemporarily, thus speeding up the overall process.
This asynchronous procedure call has been implemented in java via the Thread package.
Once the remote method is called, each host starts collecting measurements. Each host
involved in the measurements process then parses the result returned by pathchar and ex-
tracts a formatted information to be returned to the broker. The parser is written utilizing
the java StreamTokenizer package. The hosts return the information to the broker via grid
noti�cation. In fact each hosts �lls up a predetermined SDE (service data element) and
sends it to the broker which subscribed to it before calling the getTree method. Once the
broker has gathered all the information from all the selected hosts, it can process it and
sends it to the host that requested the service by means of a XML �le.
A more detalied description of the implementation issues will be provided in the appendix
B
3.3 GT3
The D-TDS has been implemented as a pair producer/consumer where the topology dis-
covery service has been developed under GT3 (Globus Toolkit) This section aims to explain
to some extent the taxonomy and the feature provided by Globus in relation to the service
here presented
3.4 About the Globus Toolkit
The open source Globus Toolkit [28] includes software services and libraries for resource
monitoring, discovery, and management, plus security and �le management.
The toolkit includes software for security, information infrastructure, resource management,
data management, communication, fault detection, and portability. It is packaged as a set
of components that can be used either independently or together to develop applications.
27

Every organization has unique modes of operation, and collaboration between multiple
organizations is hindered by incompatibility of resources such as data archives, computers,
and networks. The Globus Toolkit was conceived to remove obstacles that prevent seamless
collaboration. As it was mentioned before, its core services, interfaces and protocols, allow
users to access remote resources as if they were located within their own machine room
while simultaneously preserving local control over who can use resources and when.
More information on the Globus Toolkit can be found here [2] [3]
3.5 Globus installation, testbed setup
In order to test the D-TSD system a grid-enabled testbed has been set up.
The testbed consist of 3 hosts connected through di�erent routers as depicted in (6)
The hosts run a standard Linux distribution (Debian and RH9) and Globus Toolkit 3.2
has been installed on them. The installation process has not been too much plain as it will
be explained later. The new release of Globus (GT4) improves to a great extent this issue.
In appendix A are reported some tricks to speed up thee installation process. This howto
doesn't mean to be an installation tutorial, it is just a memo made of (hopefully) useful
information for grid newbies.
3.6 Further consideration about the discovered topology
In the topology information collected by the broker it possible (highly probably, indeed)
that a link is reported more than once to the D-TDS broker by di�erent hosts involved
in the topology discovery procedure because the same link can be shared by many paths
between di�erent host pairs. This information, regarding the �collision� of di�erent path
is indeed very important as it was mentioned since provides more knowledge about the
dynamic setting of the grid network, that is, it considers that competitive tra�c could be
present. An intuitive way of elaborating the redundant link parameter information from
the quantitative point of view is to consider the duplicated links as a single link which
connects the same pair of nodes. Thus the quantitative performance measurements, such
as bandwidth and delay, can be obtained, for example, by averaging the set of values
reported for the duplicated links between the same node pair.
It is important to underline that the topology discovery service based on the D-TDS ar-
chitecture presents the drawback of not always guaranteeing the discovery of the complete
VO network. Indeed the set of users among which the trees are discovered might not coin-
cide with the minimum set of hosts necessary for the complete network topology discovery
28

or, even though their number could be su�cient, their placement cannot guarantee the
complete network topology discovery. For example in (6), if the hosts producing the infor-
mation are connected to the routers R1, R2, and R3, all the links in the networks are not
discovered by the D-TDS. (Speci�cally the link R4-R2 is not discovered.) Instead if the
hosts are connected to the routers R1, R3, and R4 all the network links are discovered. On
the other and the distributed approach adopted in the D-TDS represents also an advantage.
Indeed the possibility of selecting the number of hosts involved in the topology discovery
process allows to trade-o� the level of details of the discovered topology with the amount
of the resources (i.e., messages) utilized for the discovery. This makes the D-TDS scalable
to MAN with an elevated number of network elements. Fourth, it can be claimed that for
discovering the complete logical network topology it would be su�cient that at least one
host of the VO is connected to each VO network element and that each host just noti�es
to the broker its neighbors. However this scenario is unlikely because, in general, VOs span
various autonomous systems and in a speci�c VO some routers can be just transit routers
without any connected host.
On the other hand the Distributed-TDS (D-TDS) allows to obtain information on the
topology traversed by IP packets, i.e. the logical topology, that depends on the number of
users (i.e., grid hosts) involved in the discovery procedure. However the D-TDS is scalable
and it utilizes tools available to regular grid users, such as pathchar .
4 Results
For what it concerns the D-TDS implementation, below is shown the output of the pathchar
command run from host 10.10.21.1 (CLIENT1) to host 10.10.31.2 (CLIENT3). It can be
noticed that pathchar announces just the input interface of the crossed network element.
pathchar to 10.10.31.2 (10.10.31.2)
doing 3 probes at each of 45 sizes (64 to 1500 by 32)
0 localhost
| 54 Mb/s, 143 us (508 us)
1 10.10.21.1 (10.10.21.1)
| 95 Mb/s, 16 us (668 us)
2 10.10.4.1 (10.10.4.1)
| ?? b/s, 233 us (1.13 ms)
3 10.10.50.1 (10.10.50.1)
| 87 Mb/s, -34 us (1.20 ms), 15% dropped
29

4 10.10.31.2 (10.10.31.2)
4 hops, rtt 716 us (1.20 ms), bottleneck 54 Mb/s, pipe 9848 bytes
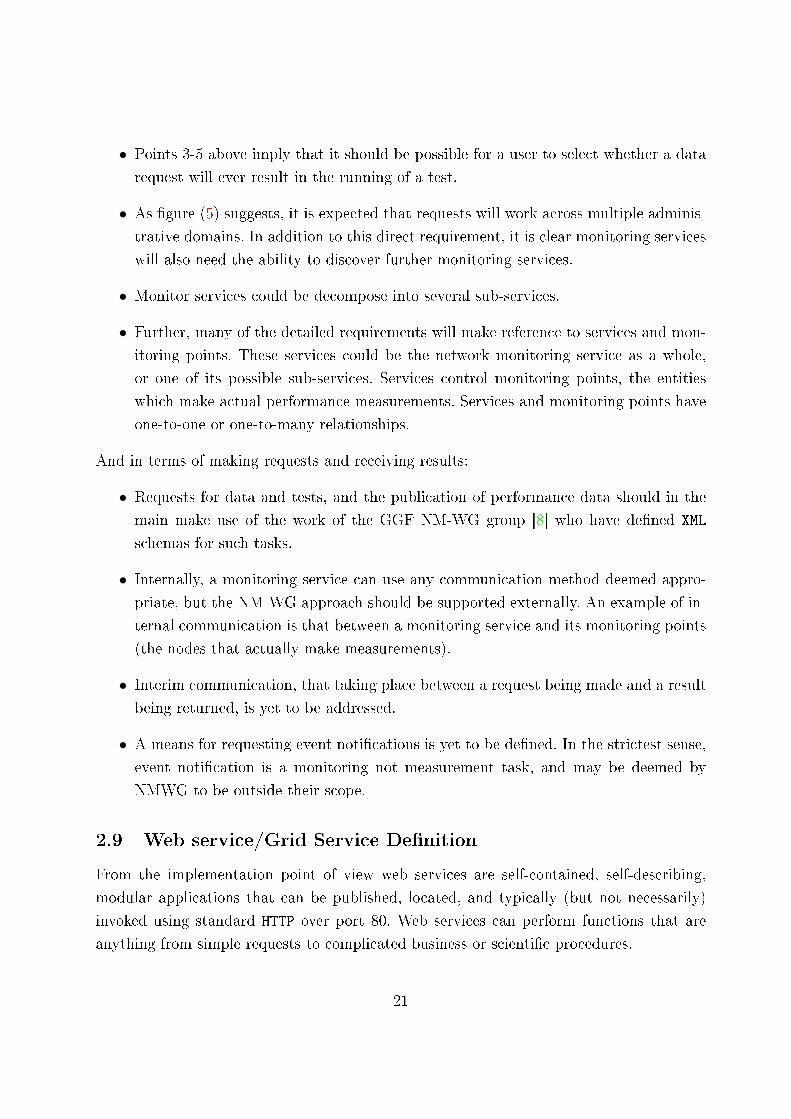
An excerpt of the D-TDS logical network topology is depicted below. The formatted XML
�le is obtained by providing the broker with the information regarding which interfaces
(i.e., IP addresses) belong to which routers and by assuming that all the interfaces of the
router are fully connected within the router. In the XML �le are present some tag <nodes>
which represent the IP of the selected hosts. After the node stanza a list of links is provided:
these are all the links, comprehensive of the measured bandwidth, round trip time, queue
delay and dropped packets computed by the services through pathchar. The D-TDS based
topology discovery service is able to obtain an estimate of the link bandwidth and of
the round trip time (on which the latency depends). However the D-TDS is not able to
obtain information on each router interface as it was mentioned before. In addition, the
link bandwidth appears underestimated, especially for high capacity links. This can be due
to the pathchar speci�c implementation.
<D-TDS-topology>
<node>
<name>10.10.21.2</name>
<dns-name>ringo</dns-name>
<node-type>host</node-type>
<link>
<source>10.10.21.2</source>
<destination>10.10.21.1</destination>
<dns-destination>R1</dns-destination>
<timestamp>12:34</timestamp>
<available-bandwidth>50 Mb/s</available-bandwidth>
<rtt>7.1</rtt>
<dropped>5</dropped>
<queue-delay>1.3E-4</queue-delay>
</link>
</node>
<node>
<name>217.9.70.112</name>
<dns-name>R1</dns-name>
<node-type>router</node-type>
<link>
30
<source>10.10.21.1</source>
<destination>10.10.21.2</destination>
<dns-destination>ringo</dns-destination>
<timestamp>12:34</timestamp>
<available-bandwidth>50 Mb/s </available-bandwidth>
<rtt>7.1</rtt>
<dropped>5</dropped>
<queue-delay>1.3E-4</queue-delay>
</link>
<link>
<source>10.10.4.2</source>
6
<destination>10.10.4.1</destination>
<dns-destination>R2</dns-destination>
<timestamp>12:33</timestamp>
<available-bandwidth>87 Mb/s</available-bandwidth>
<rtt>7.43</rtt>
<dropped>0</dropped>
<queue-delay>1.6E-4</queue-delay>
</link>
</node>
4.1 Considerations about running time
An important characteristic that has been neglected so far is about the time required by
the system to perform a complete round of measurements given a pool of hosts.
This is a very important issue for two main reasons:
1. since the measurements have to be performed periodically in order to keep the grid
network description up to date, the time it takes the system to perform them limits
the maximum frequency at which measurements could be taken.
2. in the proposed infrastructure an host submits a request for measurements among a
pool of hosts. Each host in the pool have to perform measures towards every other
host in the pool and measures are performed on a per-hop basis and in parallel. The
total time needed by the i− th host for a measurement is then (neglecting the time
31

unit of measurement):
T (i) =
j=H∑j=1,i 6=j
li−j (1)
where li−j is the length of the path (numbers of hop) from i to j (assuming that the
time needed to test a hop to be a constant) and H is the number of host towards
which the measure be performed.
Since each host computes the measurement in parallel then the total time T can be
approximated as max(T (i))
The 1 can be rewritten as:
T ≤ (H − 1) ∗max(E[li−j,∀j])∀i (2)
where E[li−j∀j] is the average path length for each pair of host i− j taken w.r.t j in
the pool and the operator max is computed on the index i
It would be interesting to give some asymptotic bounds valid on very large networks.
It has been noticed [30] that network topology, taken both at router level and at
autonomous system level usually exhibit the so called �small-word� property. It is also
known [31] that if a graph exhibits small world property then its diameter D (de�ned
as the longest among the shortest paths between all node pairs) is proportional to
the logarithm of the number of nodes in the graph. Provided that, 2 becomes (the
Big-O notation is used):
T ≤ (H − 1) ∗D = O(H log(N)) (3)
Where N is the number of hosts in the network considered and H is still the number
of hosts for which the measurements are performed.
It comes out that the time needed for a complete round of measurement is then
proportional to the number of host involved in the measurement in a particular
network and increases linearly w.r.t logarithm of the total number of hosts in the
network.
Testing the tool on the network depicted in (6) it emerges that it takes 4 minutes for a
complete round of measures.
32
The time needed depend indeed also on the precision at which pathchar probes the paths
to and fro host. A greater accuracy in measurement would require more time.
In order to speed up the process other network sensors instead of pathchar could be
taken into consideration, in any case, since the asymptotic bound given before, the system
doesn't scale to large network (where N as well as H are high). In this case, in order not
to take too much time to perform the measurements, H should be reduced w.r.t. to N
thus reducing the completeness of the topology discovered since it increases as the ratioHN
increases, ideally tending to 1. Anyway, as it was mentioned before, a witty choice of
the hosts to include in the pool submitted for measurements could help a lot, for instance,
including the host on the border of the network could be a good choice.
4.2 Future work
The proposed system could be improved to a great extent both from inside (adding some
features) and outside (adding new intermediate piece of software to elaborate its results)
point of view.
4.2.1 Security
At �rst the system should be made secure. The communication between hosts is now in
plain text with no authentication.
Security tools are concerned with establishing the identity of users or services (authentica-
tion), protecting communications, and determining who is allowed to perform what actions
(authorization), as well as with supporting functions such as managing user credentials and
maintaining group membership information.
The forthcoming version of the Globus Toolkit (GT4) provides distinct WS and pre-
WS authentication and authorization capabilities. Both build on the same base, namely
standard X.509 end entity certi�cates and proxy certi�cates, which are used to identify
persistent entities such as users and servers and to support the temporary delegation of
privileges to other entities, respectively.
More information about security in grid environment can be found here: [32]
4.2.2 Network sensor improvements
A considerable e�ort should be spend in �nding a better network sensor w.r.t. pathchar
. As it was mentioned before, pathchar features many advantages but as a drawback it
cannot handle high capacity links with accuracy and, since links throughput is constantly
33

increasing in the time, pathchar cannot be the solution for the future.
New network sensor have thus to be extensively tested in order to �nd a better solution.
4.2.3 Grid topology service
Even though the server-side of the proposed infrastructure, except for the modi�cation
proposed before, can be considered somehow self-contained and complete, the broker can
be improved to a great extent.
In this work the broker has been considered as joint with the client itself but its �nal purpose
should be that to provide a persistent middleware able to answer to queries submitted by
grid users about topology.
In order to do this the broker should become a standalone grid-service able to query a pool
of hosts that communicate to each other in a peer-to-peer fashion to compute the relative
topology.
The broker could then be empowered by a historic data server, able to store past measures
and topology and forecast those quantities for the future like the Network Weather Service
but empowered with topology awareness.
34

A Globus installation tricks
Installing and con�guring GT3.2 could seem a tricky task to be accomplished. A GT3.2
installation and administration guide can be found here [33]. At the �rst chapter of this
guide a plenty of support software is required to be installed before GT3.2 can be installed
as well.
The aim of this section is to sketch a list of best practices for GT3.2 installer newbies.
• If it is possible installation from source should always be chosen . Binary package
is provided as well but it is highly likely that it won't work perfectly. GT3.2 is a
huge piece of software, in part written in java, perl and bash and thus decoupled
from OS but in part (i.e. the GridFTP bundle) very architecture dependent. Building
from source requires some additional software (i.e. C compiler) but it is guaranteed
to work properly.
• The instructions provided have to be followed carefully (this is a rule of thumb for do-
ing whatever, indeed), because sometimes globus works di�erently as expected. For in-
stance, in order to start the globus container the command globus-start-container
have to be issued from the globus root directory, otherwise it won't work properly.
This is really counter-intuitive.
• If something goes wrong, always googling the error reported will point to some globus-
discuss forum where hopefully a solution for the problem will be given. The fora about
globus are very active on the Internet and sometimes could help more than manuals
and tutorial.
B Programming GT3
Writing a Grid Service for GT3 is an exercise that requires some background notions. A
great tutorial by Borja Sotomajor can be retrieved here [29]
In this section a coarse grain introduction to programming GT3.2 and grid services is
provided.
According to [29] writing and deploying a Grid Service could be done following �ve simple
steps.
1. De�ne the service's interface. This is done with GWSDL
2. Implement the service. This is done with java
35
3. De�ne the deployment parameters. This is done with WSDD
4. Compile everything and generate GAR �le. This is done with ant.
5. Deploy service. This is also done with ant.
B.0.4 OGSA,OGSI,GT3 and WSRF
Before going on explaining how to program a grid service some basic concepts have to be
drawn.
The Open Grid Services Architecture (OGSA), developed by The Global Grid Forum, aims
to de�ne a common, standard, and open architecture for grid-based applications. The goal
of OGSA is to standardize practically all the services one �nds in a grid application (job
management services, resource management services, security services, etc.) by specifying
a set of standard interfaces for these services.
OGSA alone doesn't go into much detail when describing Grid Services. It basically outlines
what a Grid Service should have (that Web Services don't) but little else. That is why
OGSA spawned another standard called the Open Grid Services Infrastructure (OGSI, also
developed by The Global Grid Forum) which gives a formal and technical speci�cation of
what a Grid Service is.
The Globus Toolkit as it was mentioned in section 3.4 is a software toolkit, developed by
The Globus Alliance, which can be used to program grid-based applications. The third
version of the toolkit (GT3) includes a complete implementation of OGSI. However, it's
very important to understand that GT3 isn't only an OGSI implementation. It includes a
whole lot of other services, programs, utilities, etc. Some of them are built on top of OGSI
and are called the WS (Web Services) components, while other are not built on top of OGSI
and are called the pre-WS components.
OGSI speci�cation has shown to have di�erent drawbacks so to solve OGSI's problems and
to improve Grid Services' chances of �nally converging with Web Services, a new standard
was presented in January 2004 to substitute OGSI: The Web Services Resource Framework,
or WSRF.
WSRF aims to integrate itself into the family of Web Services standards, instead of simply
being a 'patch over Web Services' like OGSI was. In this new scenario, OGSA will be based
directly on Web Services instead of being based on OGSI Grid Services.
36

B.0.5 The �ve steps
• The �rst step in writing a Grid Service (or a Web Service) is to de�ne the service
interface. It is necessary to specify what the service is going to provide to the outer
world. This description is not concerned with the inner workings of that service (what
algorithms it uses, what databases it will access, etc.) In Web/Grid Services lingo,
the service interface is usually called the port type (usually written portType).
• After de�ning the service interface ("what the service does"), the next step is im-
plementing that interface. The implementation is "how the service does what it says
it does". The implementation of a Grid Service is simply a java class which, be-
sides implementing the operations described in the GWSDL �le, has to meet certain
requirements. This class can furthermore include additional private methods which
won't be available through the Grid Service interface, but which the service can use
internally.
• Up to this point, the two most important parts of a Grid Service have been written:
the service interface (GWSDL) and the service implementation (java). Now this
pieces have to be put together and made available through a Grid Services-enabled
web server. This step is called the deployment of the Grid Service.
• One of the key components of the deployment phase is a �le called the deployment
descriptor. It's the �le that tells the web server how it should publish the Grid
Service (for example, telling it what the the service's GSH will be). The deployment
descriptor is written in WSDD format (Web Service Deployment Descriptor).
• in this step everything comes together in perfect harmony. The three �les created
before have to be put together in a Grid Archive, or GAR �le. This GAR �le is a
single �le which contains all the �les and information the grid services container need
to deploy the service and make it available to the whole world.
The GAR �le contains all the �les and information the web server needs to deploy the
Grid Service. Deployment is done with the Ant tool, which unpacks the GAR �le and
copies the �les within (WSDL, compiled stubs, compiled implementation, WSDD)
into key locations in the GT3 directory tree. also reads our deployment descriptor
and con�gures the web server to take our new Grid Service into account.
37

B.1 Deeper inside implementation
As mentioned before, each host runs a topology discovery service and has the pathchar
tool installed with proper privilegies set.
B.1.1 Server-side
The service has only a public method: getTree
public void getTree(NetDiscoveryServerIPArrayType serversIP)
This method takes as input the list of the hosts's IP addresses that have to be tested to
each other. The method doesn't return anything since the results are given back to the
broker via noti�cation.
The datatype serversIP is de�ned in an XML schema like this:
<complexType name="NetDiscoveryServerIPArrayType">
<sequence>
<element name="serverIP" type="string" minOccurs="1" //
max Occurs="unbounded"/>
</sequence>
</complexType>
The topology discovery service runs the pathchar tool for each IP in the IPlist provided
by the broker then grabs and parses its output. With the values parsed the service �lls a
service data and gives it back to the client via noti�cation.
The SDE �lled and returned to the broker has the following structure:
<complexType name="LinkStatusDataType">
<sequence>
<element name="IP_a" type="string"/>
<element name="IP_b" type="string"/>
<element name="timestamp" type="string"/>
<element name="maxthroughput" type="float"/>
<element name="linkbw" type="float"/>
<element name="capacity" type="float"/>
<element name="rtt" type="float"/>
<element name="dropped" type="float"/>
38
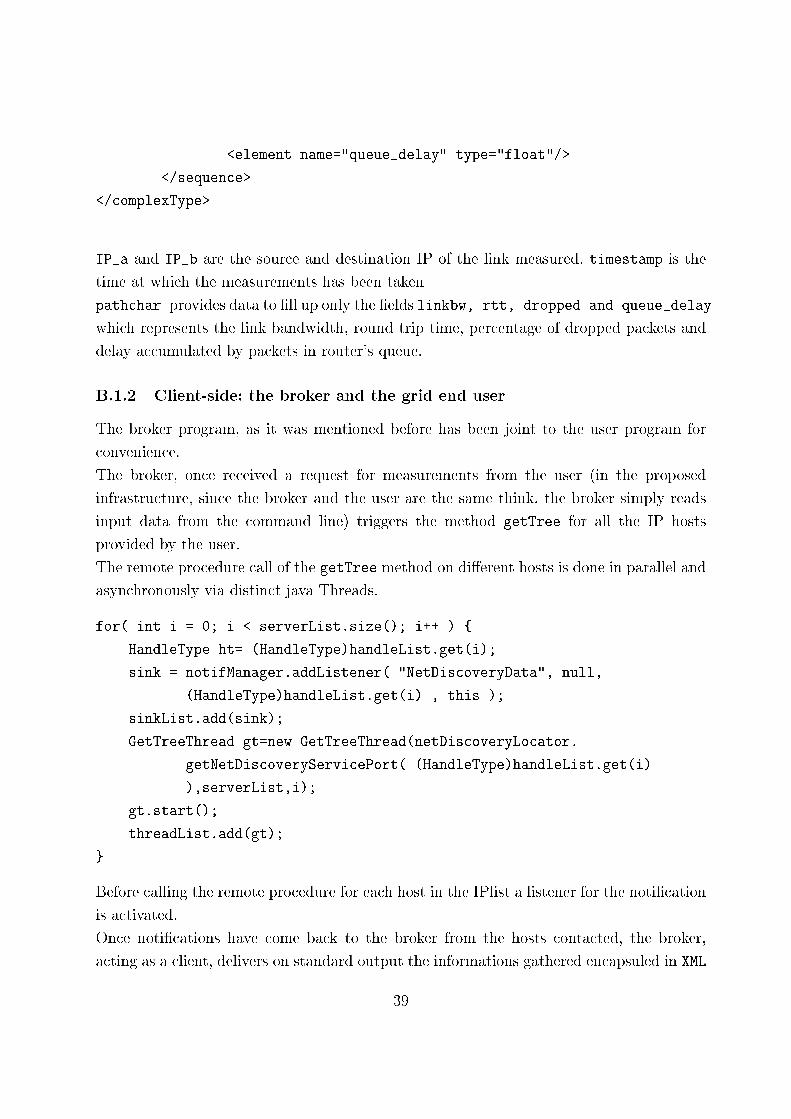
<element name="queue_delay" type="float"/>
</sequence>
</complexType>
IP_a and IP_b are the source and destination IP of the link measured. timestamp is the
time at which the measurements has been taken
pathchar provides data to �ll up only the �elds linkbw, rtt, dropped and queue_delay
which represents the link bandwidth, round trip time, percentage of dropped packets and
delay accumulated by packets in router's queue.
B.1.2 Client-side: the broker and the grid end user
The broker program, as it was mentioned before has been joint to the user program for
convenience.
The broker, once received a request for measurements from the user (in the proposed
infrastructure, since the broker and the user are the same think, the broker simply reads
input data from the command line) triggers the method getTree for all the IP hosts
provided by the user.
The remote procedure call of the getTree method on di�erent hosts is done in parallel and
asynchronously via distinct java Threads.
for( int i = 0; i < serverList.size(); i++ ) {
HandleType ht= (HandleType)handleList.get(i);
sink = notifManager.addListener( "NetDiscoveryData", null,
(HandleType)handleList.get(i) , this );
sinkList.add(sink);
GetTreeThread gt=new GetTreeThread(netDiscoveryLocator.
getNetDiscoveryServicePort( (HandleType)handleList.get(i)
),serverList,i);
gt.start();
threadList.add(gt);
}
Before calling the remote procedure for each host in the IPlist a listener for the noti�cation
is activated.
Once noti�cations have come back to the broker from the hosts contacted, the broker,
acting as a client, delivers on standard output the informations gathered encapsuled in XML
39

public synchronized void deliverNotification( ExtensibilityType any )
throws RemoteException {
try {
ServiceDataValuesType serviceData = AnyHelper.getAsServiceDataValues( any );
LinkStatusDataTypeArrayType monResults = (LinkStatusDataTypeArrayType) //
AnyHelper.getAsSingleObject(serviceData, LinkStatusDataTypeArrayType.class);
...
for( int i = 0; i < monResults.getResultsData().length; i++ ) {
bw=monResults.getResultsData( i ).getLinkbw();
...
qd=monResults.getResultsData( i ).getQueue_delay();
...
System.out.println("\t<link source=\""+monResults.getResultsData( i ). //
getIP_a()+"\" destination=\""+monResults.getResultsData( i ). //
getIP_b()+ "\" timestamp=\"" + monResults.getResultsData( i ). //
getTimestamp() + "\" available_bw=\"" + bws + "\" rtt= \"" + //
monResults.getResultsData( i ).getRtt() + "\" dropped=\"" + //
monResults.getResultsData( i ).getDropped() + "\" //
queuedelay=\"" + qds+"\"/>");
...
}
} catch( Exception e ) {
System.err.println("Errore: " + e.getMessage());
e.printStackTrace();
}
}
}
In the previous excerpt some parts are omitted for the sake of simplicity but it is still pos-
sible to reckon the structure. The function deliverNotification is automatically called
40

once a service data �lled by some topology service has been returned to the client.
The function has been declared synchronized since the topology discovery services could
return data concurrently thus calling the function in the same time and thus leaving internal
data inconsistent.
At �rst the function casts the variable passed to the function as an object of time
LinkStatusDataTypeArrayType an then in the body of the cycle for the service data
returned is parsed and printed in XML
C Grid Topology service installation and user guide
This section aims to provide a comprehensive list of the operation to be performed to
compile, deploy, run and access the topology discovery service.
The instruction here provided are meant to work under UNIX-like environment, how-
ever, since both the client and the service are implemented in java which is a platform-
independent language, it should not be hard to have them up and running on other OS as
well.
C.1 Anatomy of the directory
Source code and gar package of the system are provided in a tar.gz
archive: NetDiscovery.tar.gz
Once decompressed, the archive has appears as follow:
./NetDiscovery
./NetDiscovery/NDservice
./NetDiscovery/NDservice/core
./NetDiscovery/NDservice/core/first
./NetDiscovery/NDservice/core/first/NetDiscoveryService
./NetDiscovery/NDservice/core/first/NetDiscoveryService/client
./NetDiscovery/NDservice/core/first/NetDiscoveryService/impl
./NetDiscovery/NDservice/core/first/NetDiscoveryService/schema
./NetDiscovery/example_topology
./NetDiscovery/lib
The directory /NetDiscovery/NDservice/core/first/NetDiscoveryService/ contains
3 subdirectory:
41

1. client contains the client implementation NetDiscoveryClient.java and the im-
plementation of the class GetTreeThread that handles with threads
2. impl contains the service implementation in java NetDiscoveryImpl.java
3. schema contains the service description NetDiscovery.gwsdl and the de�nition of
the datatype needed by the service NetDiscoveryDataType.xsd
The deployment descriptor is contained in:
./NetDiscovery/NDservice/core/first/NetDiscoveryService/NetDiscovery.wsdd
The directory ./NetDiscovery/build is built and �lled by Ant in the compilation pro-
cess. Once the compilation is terminated, the gar �le to be deployed can be found in the
directory: ./NetDiscovery/build/lib/
C.2 Compiling, deploying and running the service
In order to compile the package, a script NetDiscovery_build.sh is provided. Some envi-
ronment variable have to be set but if no changes are made to the directory tree provided
the script should work properly as is.
The steps to compile are:
1. source the set_classpath.sh script in order to set the right classpath variables
2. run the NetDiscovery_build.sh script, eventually preceded by the command ant
clean to purge the previously built processes.
Once compiled the service, if no errors are reported it is possible to deploy it.
Steps to deploy the gar �le are:
1. log as the globus use on the machine you want to deploy the service.
2. cd into the globus root direcotry (e.g. /usr/globus/)
3. issue the command:
ant deploy -Dgar.name=$NDservice_root/build/lib/
NDservice.core.first.NetDiscoveryService.NetDiscovery.gar where the vari-
able $NDservice_root has to be replaced with the full path where the .tar.gz
package was extracted. This example take into consideration the scenario where the
gar �le and globus are on the same machine.
42

4. The service could be undeployed just issuing the command:
ant undeploy -Dgar.id=NDservice
In order to start the globus containter with the new service built-in it is su�cient to:
1. log as the globus use on the machine you want to deploy the service.
2. cd into the globus root direcotry (e.g. /usr/globus/)
3. issue the command: bin/globus-start-container
It is important to notice that the command have to be issued from the root directory
otherwise it won't work properly.
In order to have the service running properly pathchar should be installed in the /usr/local/bin
directory on each machine which runs the service. pathchar must be suid root (chmod u+s
/usr/local/bin/pathchar)
C.3 Compiling and running the client
The broker-client can be compiled just using the java compiler javac:
1. source the set_classpath.sh script in order to set the right classpath variables
2. issue the command:
javac -classpath .:build/classes/:$LOCALCLASSPATH
NDservice/core/first/NetDiscoveryService/client/NetDiscoveryClient.java
The broker-client can be run from the command line providing the list of the hosts' IP to
test on standard input. An example of a possible command can be:
cat IPlist.txt | java -classpath .:build/classes/:$LOCALCLASSPATH
-Dorg.globus.ogsa.schema.root=http://localhost:8080/
NDservice/core/first/NetDiscoveryService/client/NetDiscoveryClient
where the �le IPlist.txt is supposed to contain the list of the hosts's IP to be tested one
per line.
The broker-client returns the measures performed to standard output in XML format and
some debug information to standard error.
43

References
[1] http://en.wikipedia.org/wiki/Grid_computing
[2] The Anatomy of the Grid: Enabling Scalable Virtual Organizations, I. Foster, C. Kessel-
man, S. Tuecke. International J. Supercomputer Applications, 15(3), 2001.
[3] The Physiology of the Grid: An Open Grid Services Architecture for Distributed Systems
Integration, I. Foster, C. Kesselman, J. Nick, S. Tuecke, 2002.
[4] The Grid: Blueprint for a New Computing Infrastructure, I. Foster and C. Kesselman
(Eds), Morgan Kaufmann, 2005.
[5] Implementing Topology Discovery Service for Metropolitan Grid Computing, Luca Val-
carenghi, Luca Foschini, Francesco Paolucci, Filippo Cugini, Piero Castoldi. Submitted
to LANMAN 2005, in reviewing.
[6] TopoMon: A Monitoring Tool for Grid Network Topology, Mathijs den Burger, Thilo
Kielmann, and Henri E. Bal, ICCS 2002
[7] Global Grid Forum - Netowrk services on high Performances grid networks, Working
Draft, G. Clapp, T. Ferrari, D.B. Hoang, M.j.Leese, P. Mealor, F. Travostino
http://www.google.it/url?sa=U&start=5&q=http://www.gridforum.org/Meetings/
GGF12/Documents/draft-ggf-ghpn-netservices-1.pdf&e=10313
[8] A Hierarchy of Network Performance Characteristics for Grid Applications and Ser-
vices, Bruce Lowekamp,Brian Tierney,Les Cottrell,Richard Hughes-Jones,Thilo Kiel-
mann,Martin Swany, GGF-NMWG
http://nmwg.internet2.edu/docs/nmwg-measurements-v14.pdf
[9] Network performance measurement tools, a comprehensive comparison Rody
Schoonderwoerd, Master thesis - November 2002
http://www.cs.vu.nl/ kielmann/papers/rody-thesis.pdf
[10] GGF. Grid scheduling area. http://www.mcs.anl.gov/schopf/ggf-sched .
[11] Data Replication Research Group. An architecture for replica man-
agement in grid computing environments, Ann Chervenak and GGF
http://www.sdsc.edu/GridForum/RemoteData/Papers/ggf1replica.pdf.
44

[12] The end-to-end performance e�ects of parallel tcp sockets on a lossy wide-area network,
T. J. Hacker and B. D. Athey. Proceedings of the 16th IEEE-CS/ACM International
Parallel and Distributed Processing Symposium (IPDPS) 2002.
[13] Web100 Project team. Web100 project. http://www.web100.org.
[14] http://nmwg.internet2.edu/nmwg-tools.html
[15] Progetto Monitoring delle risorse di reteMatteo Bisi, Thomas Florio, Andrea Messetti:
http://dsg.ce.unipr.it/research/net_monitor/index.html
[16] http://nws.cs.ucsb.edu/
[17] The Architecture of the Remos System, P. Dinda, T. Gross, R. Karrer, B. Lowekamp,
N. Miller, P. Steenkiste, and D. Sutherland. In IEEE Symposium on High Performance
Distributed Computing (HPDC10), San Francisco, CA, 2001.
[18] Network Performance-aware Collective Communication for Clustered Wide Area Sys-
tems. T. Kielmann, H. E. Bal, S. Gorlatch, K. Verstoep, and R. F. H. Hofman. Parallel
Computing, 27(11):1431-1456, 2001.
[19] Sensitivity of Parallel Applications to Large Dierences in Bandwidth and Latency in
Two-Layer Interconnects. A. Plaat, H. E. Bal, R. F. Hofman, and T. Kielmann. Future
Generation Computer Systems, 17(6):769-782, 2001.
[20] Using E�ective Network Views to Promote Distributed Application Performance. G.
Shao, F. Berman, and R. Wolski. In Parallel and Distributed Processing Techniques
and Applications (PDPTA), 1999.
[21] Active Measurement Project (AMP). http://mp.nlanr.net.
[22] A Border Gateway Protocol 4 (BGP-4). IETF Network Working Group, RFC 1771,
1995, Y. Rekhter and T. Li.
http://www.faqs.org/rfcs/rfc1771.html.
[23] An Architecture for Large-scale Internet Measurement. V. Paxson, J. Mahdavi, A.
Adams, and M. Mathis. IEEE Communications, 1988.
[24] PingER. http://www-iepm.slac.stanford.edu/pinger/.
45

[25] A Global Internet Host Distance Estimation Service. P. Francis, S. Jamin, C. Jin, Y.
Jin, D. Raz, Y. Shavitt, and L. Zhang. IDMaps IEEE/CM Transactions on Networking,
2001.
[26] Skitter. http://www.caida.org/tools/measurement/skitter
[27] A Network Topology Description Model for Grid Application Deployment, S bastien
Lacour, Christian P rez, Thierry Priol IRISA /INRIA, Campus de Beaulieu, 35042
Rennes Cedex, France
[28] The Globus Toolkit, http://www.globus.org
[29] The Globus Toolkit 3 Programming tutorial, Borja Sotomajor
http://gdp.globus.org/gt3-tutorial/index.html
[30] Small-World Internet topology, possible cause and implications on scalability of end-
system multicast Shudong Jin, Azer Bestavros, computer Science Department, Boston
University. Technical Report BUCS-TR-2002-004, January 2002
[31] Small Worlds Bruno Codenotti, Luca Foschini. LEM Working paper series.
http://ideas.repec.org/p/ssa/lemwps/2002-11.html
[32] Security in GT4 http://www.globus.org/toolkit/docs/4.0/security/
Grid Security Infrastructure http://www.globus.org/security/overview.html
[33] GT3.2 administration and installation guide. http://www.globus.org/toolkit/docs/3.2/
installation/index.html
[34] IBM Grid computing http://www-1.ibm.com/grid
[35] Using pathchar to estimate the Internet link characteristics Allen B. Downey Colby
College, Waterville. To appear in the ACM SIGCOMM '99
46
Copyright © 2022 FDOKUMEN