
Science & Technology 2008 - India Environment Portal
391
INDIA Science & Technology 2008 (Full report available at www.nistads.res.in) National Institute of Science, Technology And Development Studies (NISTADS), CSIR n i s t a d s n i s t a d s
-
Upload
khangminh22 -
Category
Documents
-
view
2 -
download
0
Transcript of Science & Technology 2008 - India Environment Portal

INDIAScience & Technology 2008(Full report available at
www.nistads.res.in)
National Institute of Science, Technology And
Development Studies (NISTADS), CSIR
n i s t a d sn i s t a d s

About the Cover:The cover for INDIA Scientific & Technology 2008 depicts one of the most exciting and ambitious projects ever undertaken by India: an artistic perception
of the Chandrayaan with a photographic image of the Earth as viewed by Chandrayaan on 29 October 2008 at a distance of 9,000 km from the Earth.
The Chandrayaan mission has not only left its imprint on the Moon, it has also positioned ISRO as one of the world’s top space agencies. It was launched
using the mighty Polar Satellite Launch Vehicle (PSLV) launch pad with a 44.4 metre tall rocket. India’s most talked about space project thundered off into
space at 6.22 a.m. on 22 October 2008. Costing Rs 386 crores, which included Rs 100 crores for establishing the Indian Deep Space Network at Byalalu,
40 km from Bangalore, the Chandrayaan project is the cheapest mission to the Moon ever. Eighteen minutes into the flight the “Chandrayaan" was
successfully placed in its initial orbit. The launch was successful and 22 October 2008 becomes a day to remember in India’s space and national history.
Dr A.P.J. Abdul Kalam, Former President of India said "The Moon cannot be left to a few countries. In another four decades, the Earth, Moon and Mars will
attain strategic and economic importance."
Cover Design: Neeru Sharma

INDIAScience & Technology 2008(Full report available at www.nistads.res.in)
n i s t a d sn i s t a d s
National Institute of Science, Technology And
Development Studies (NISTADS), CSIR

Copy right: Introduction © P. Banerjee
Individual Sections © Contributing Author: Dinesh Abrol; Saurabh Atri; Mala Bahl; P. Banerjee; Rama Bansal; A.K. Bharadwaj; Sujit Bhattacharya; Indranil Biswas; Pradip Biswas; Uree N. Choudhary; Panchanan Das; K.K. Datta; S.M. Dhawan; Bharvi Dutt; Rangan Dutta; Debnirmalya Gangopadhyay; K.C. Garg; B.M. Gupta; Nitin Gupta; R.P. Gupta; V.K. Gupta; N.S.K. Harsh; Parvathi K. Iyer; Kirti Joshi; Rammi Kapoor; M.U. Khan; Subhan Khan; Akshay Khatreja; Avinash Kshitij; B. Ganesh Kumar; Naresh Kumar; Neelam Kumar; Suresh Kumar; Vipan Kumar; Kashmiri Lal; Y. Madhavi; Kasturi Mandal; Sunil Mani; Kavita Mehra; Anand Mohan Mishra; Rashi Mittal; A. K.Mukhopadhyay ; Saswati Nayak; Suresh Pal; Anit Kumar Panda; Mamata Parhi; Sanjib Pohit; Gangan Prathap; Lalsiemlien Pulamte; Varun Satia; Deepak Saxena; Praveen Sharma; Pawan Sikka; Pushpa Singh; Bikramjit Sinha; S.S. Solanki; Yogesh Suman; V. Upadhyay; S.Visalakshi.
Year : May 2009
ISBN: 81-85121-35-4
Editor: P. Banerjee
Technical/Language Editor: Hardip Grewal
Editorial Team: Deepak Saxena; Avinash Kshitij; Debnirmalya Gangopadhyay; Bikramjit Sinha; Indranil Biswas; Kasturi Mandal; Kirti Joshi; Anil Kr. Sharma; Naresh Kumar; Yogesh Suman
Graphics: Mostly by Avinash Kshitij; Bikramjit Sinha
Publication Committee: Naresh Kumar; Yogesh Suman; Avinash Kshitij; Deepak Saxena
Project Management:
Nodal Officer: A.K. Mukhopadhyay
Co-ordinating Officer: P.R. Bose
Editorial coordination: Anil Kr. Sharma
Support coordination: S.A. Nabi, Rameshwar Dass, Sukhram, Ramesh Chandra
Reviewers/Readers: Prof. S.K. Joshi; Prof. Anil K. Gupta; Prof. Ashok Chandra; Shri R. Rajamani; Prof. Sushil Khanna; Dr. Prasanna Hota; Dr. Anuj Sinha; Dr. H.R. Bhojwani; Dr. S.K. Rastogi; Dr. Gangan Prathap; Dr. Chandra Gupt; Dr. Ashok Jain; Dr. Subodh Mahanti; Prof. Pranav Desai; Prof. Biswatosh Saha; Dr. P.K. Biswas; Prof. Deepak Kumar; Dr. Rangan Dutta
Reviewers for part project: Dr. S.K. Sikka; Dr. Rangan Dutta; Dr. Sudha Mahalingam; Dr. D.S. Gangwar; Dr. Ashok Jain; Prof. Deepak Kumar; Mrs. Smita Chug; Dr. Anil Bawa; Ms. Jyoti Bhat.
JEL Classification: I100, I110, I120, I180, I200, I210, I230, I320, I380; O100, O110, O120, O130, O140, O150, O160, O170, O180, O190, O210, O220, O300, O310, O320, O330, O340, O380, O470, O500, O530; Q000, Q010, Q110, Q130, Q160, Q170, Q180, Q210, Q220, Q230, Q40, Q49, Q50, Q59; R200, R210, R220, R230, R280, R290
Publisher: A.K. Mukhopadhyay & P.R. Bose, for National Institute of Science, Technology and Development Studies (NISTADS), CSIR
Production: Pradip Banerjee; Kaushal Kishore; Neeru Sharma; Supriya Gupta; Ashwani K. Brahmi
Designed and Printed at : National Institute of Science Communication And Information Resources (NISCAIR) Dr K S Krishnan Marg, New Delhi 110 012
Disclaimer: This Report does not reflect the views of NISTADS/CSIR. Individual contributors are responsible for the views expressed in their respective contribution(s). This report does not have any commercial purpose. If any copyright violation is brought to our notice, the same shall be immediately acknowledged / withdrawn. Citations have been acknowledged in the main report available on www.nistads.res.in. Since this a summary of the main report, for purposes of style, repetition of citations have been avoided here.

Foreword
A scientist often does not worry about how scientific research would assist the economic and social development of the country. An administrative executive and a policy maker might focus only on immediate concerns and may not be aware of how science and technology (S&T) impact those concerns. A lay citizen might simply be not aware of how S&T can be used to find solutions to his problems. There is therefore a need to bring awareness about the progress of science and technology and how it is being harnessed to serve the society. This present ‘India S&T Report 2008’is the first in series of reports on the progress of science and technology and its applications seen by science policy researchers.
‘India S&T 2008’ is a first report of this kind from NISTADS and may be from our country itself. This report resulted from an analysis of the developmental agenda of the S&T in our country. Similar reports but often with different focus have been brought out by the National Science Foundation (NSF) of the USA, and by several other countries such as Japan, Korea, China, and Taiwan. The NSF reports stand upon accumulated experience and data on S&T. Needless to mention that each country while looking at comparators emphasizes issues and parameters relevant to their environments.
I am very happy that colleagues at NISTADS under the leadership of Dr. P. Banerjee, Director has undertaken the challenge of preparing this report. They have been helped in this by experts from many other institutions. A periodic and regular stock taking helps us knowing where do we stand and what revisions in the policy framework needs to be adopted and which paths and goals to be revisited.
It has been a pleasure for me to interact with my colleagues at NISTADS who have worked very hard in preparing this report. I found my interaction with them very educative for me. I hope this report would prove needful to many who are concerned with use of science and technology for the development of our society. In today’s context science and technology is of council importance for our country’s development.
This is an extended summary of the full report, which is voluminous and available as open document at http:www.nistads.res.in; and we at NISTADS would like to make such a report to appear every alternate year and would look forward to get feedback from readers to improve the report.
(Professor S.K. Joshi)
Chairman, Research Council, NISTADS, CSIR
April 15, 2009

Acknowledgements
On behalf of all my colleagues may I acknowledge the great support in the form of a research grant of a Supra-institutional project provided by Prof. S.K.Brahmachari, Director General, CSIR, and Dr. Naresh Kumar, Head, RDPD, CSIR and Dr. Chandra Gupt, RDPD, CSIR, that made possible research undertaken to writing this Report. We must mention that without the support from this Supra project grant this research would have been impossible.
Since its inception the Research Council of NISTADS, with its Chairman Prof. S.K.Joshi, and members Sh. R.Rajamani, Prof. S. Khanna, Prof. Anil Gupta, Dr. H.R.Bhojwani, Dr. Anuj Sinha, Dr. S.K.Rastogi, Dr. Gangan Prathap, Dr. Prasanna Hota, Dr. Chandra Gupt and Prof. Ashok Chandra et al took special care to interact very regularly with all contributing colleagues and by reviewing as well guiding the research from time to time. The suggestions the Council chairman and members provided were most vital. We acknowledge gratefully their contribution.
At several stages we benefitted greatly from reviewing comments and suggestions from senior colleagues in other organizations. Dr. S.K.Sikka, Dr. Ashok Jain, Prof. Deepak Kumar, Ms. Smita Chugh, Dr. D.S. Gangwar, et al provided important insights and clues to making better the report.
Several scholars read through the voluminous full report of nearly 1500 pages. We are obligated to them for the interest they shown on this work and for the comments they provided and for the time they spent on reading the full report. Special mention must be made of Dr. Rangan Dutta, Prof. Biswatosh Saha, Dr. P.K.Biswas, Sh. R.Rajamani and Dr. H.R.Bhojwani and several others who very kindly took care in making better the full report.
Several other research and academic colleagues participated at various stages of development of this report; their number is large and we acknowledge our debts to all of them. The inability to publish all such names be condoned.
Several academic and researcher colleagues from institutes and universities outside the CSIR system have contributed to this report; especially Prof. P.K.Biswas and Dr. S.Pohit have contributed in more than many ways. Support provided by Dr. A.K. Verma (Advisor S&T, Planning Commission) and his colleagues is duly acknowledged. My young colleagues from NISTADS spent months of hard working days and nights; they are the contributors and it must be mentioned that without their dedication this would not have been possible. Our colleagues from administration, finance and purchase sections and other technical officers have contributed in many ways and finally, Mr. Pradip Banerjee and his team at NISCAIR and Dr. Gangan Prathap, Director, NISCAIR must be acknowledged for printing this extended summary.
(P. Banerjee)
Director, NISTADS
April 15, 2009

iii
Table of Contents Title Contributors Page Introduction India S&T 2008 P. Banerjee
S & T Human Resources Overview 1 Pattern of Enrolment at Different Educational Levels Vipan Kumar, Naresh Kumar,
Neelam Kumar 3
Vocational Education in India Indranil Biswas 7 Educational Infrastructure in India Naresh Kumar, Vipan Kumar,
Neelam Kumar 13
Performance in Sciences at Secondary/Higher Secondary Level
Vipan Kumar, Naresh Kumar, Nitin Gupta
15
Stock of Indian S&T Manpower Deepak Saxena, P. Banerjee 21 Inter-State Migration at Secondary level Vipan Kumar, Avinash Kshitij 24 International Migration of Students Naresh Kumar, Vipan Kumar 25 Migration of Indians Abroad Deepak Saxena, P. Banerjee 28 Measures to promote Basic Science Naresh Kumar , Vipan Kumar 30 Higher Education and Research Training P. Banerjee 32 Medical Manpower in India: An Overview Kasturi Mandal 34 Gender and Science in India Neelam Kumar 38
S & T Financing Overview 41 Financing of S&T in India Dinesh Abrol, Vinod
Upadhyay, Pawan Sikka 42
Financing of Health S&T Parvathi K. Iyer, Dinesh Abrol 65 Financing of Environmental S&T Kasturi Mandal 70
iv
Investment in S&T and Innovation in India Kasturi Mandal, Vipan Kumar,
P. Banerjee 73
S & T Structure, Infrastructure and Public Space Overview 81 Coordination and Governance: S&T Structure and Infrastructure
Kasturi Mandal, Avinash Kshitij, P. Banerjee
82
The Regional Innovation System: Tracing the Evolution in Main Regional Governance Characteristics
M.U. Khan 89
Science in Kerala – a Snapshot Gangan Prathap 95 Science and Technology Mapping in States of India Kasturi Mandal, Anand Mohan
Mishra 97
Technology Transfer Structure: Glimpses Kavita Mehra 101 Technology Park: Snapshots Kavita Mehra 105 Biotechnology Parks and Incubators: Glimpses Kavita Mehra 106 New Public Initiatives in Biotechnology Kavita Mehra 107 Public R&D – Private Industry Partnerships Rama Bansal 108 The CSIR Kirti Joshi 115 Editors from India in Global Journals P. Banerjee 116 Disease Coverage in Web Editions of three Indian English Language Dailies
K.C. Garg, Bharvi Dutt, Suresh Kumar
117
S&T Coverage in English Language Indian Dailies Bharvi Dutt, K.C. Garg, Suresh
Kumar 119
S & T and Industry Overview 121 Salient Features of Growth, Efficiency and Technical Change in the Indian Economy over Sixty Years
Panchanan Das 123
Technical Changes in the Indian Economy as Evident from Input-Output Tables 1993-94 and 2003-04
Pradip Biswas, Panchanan Das, P. Banerjee
125
Trends in High Technology Trade Sanjib Pohit 131

v
Industrial R&D in India: Broad Indications Sunil Mani 135 Industrial R&D in India: Contemporary Scenario Sujit Bhattacharya, Kashmiri Lal
138
FDI in R&D in India A.K. Bhardwaj, Rammi Kapoor 142 R&D in Private Industry in Post liberalization Period (1990-91 to 2006-07)
Yogesh Suman, Kavita Mehra 145
Pattern of Innovation and R&D in Select Sectors by Listed and Other Companies of India
Avinash Kshitij, Bikramjit Sinha, P. Banerjee
148
Micro, Small and Medium Enterprises of India: Innovation Status and State of Affairs
Indranil Biswas, Avinash Kshitij, Saurabh Atri, P.
Banerjee
157
Importance of MSME in Indian Industry and Changes of Industrial Policy
Indranil Biswas 161
Entrepreneurship in MSME Indranil Biswas, Avinash Kshitij, Saurabh Atri
162
Exchange of Knowledge and Other Factors between MSME and Factories in Different Geographies
Avinash Kshitij, Indranil Biswas, P. Banerjee
165
Non-R&D Innovation in Indian Organized Factory Enterprises
Bikramjit Sinha,, Avinash Kshitij, Yogesh Suman, P.
Banerjee
166
Inter Sector Comparative Innovation in Some Select Sectors of Factories
Yogesh Suman 175
Recent Trends in Technology Up-gradation in the Indian Textile Industry: Need for S&T Intervention
Pradip Biswas 178
Indian Automotive Industry: Innovation and Growth Mamata Parhi 181 Automobile Sector: Innovative Changes in Factory Sector over 2000-04
Panchanan Das 187
Tyre Industry in India Parvathi K. Iyer 190 India’s Telecommunications Industry Sunil Mani 193 Growth Performance of Technology Oriented Industries in India: Case – Biotechnology
S. Visalakshi 198
Pharmaceutical Industry S. Visalakshi, Varun Satia,
Parvathi K. Iyer 206
Structure and Performance of Small and Medium Scale Pharmaceutical Firms
Parvathi K. Iyer 210
Regulatory Issues in the Indian Pharmaceutical Industry Parvathi K. Iyer 212 Indian Herbal Sector Kirti Joshi 217

vi
Human Vaccine Science and Technology Status in India Y. Madhavi 219 Knowledge Capability and Capacity in Biomedical Field P. Banerjee 221
Research from Hospitals: Evidence Avinash Kshitij, P. Banerjee 223Institutional Distribution of Biomedical Knowledge P. Banerjee 226Role of Hospital in Research P. Banerjee 228Biomedical Knowledge Assets in Indian Cities P. Banerjee 230
India’s Capability and Competence in Energy Sector R&D Kirti Joshi, Avinash Kshitij,
Bikramjit Sinha, Vipan Kumar, Kasturi Mandal
234
Materials R&D and Innovation Avinash Kshitij, Bikramjit
Sinha 241
S & T Output and Patents Overview 249 Status of India in Science and Technology as Reflected in its Publication Output in Scopus International Database, 1997-2007
B.M. Gupta, S.M. Dhawan 251
Indian Scientific Output as seen through Indian Science Abstracts
K.C. Garg, Suresh Kumar, Bharvi Dutt
260
Mathematics Output Avinash Kshitij , P. Banerjee 261 Global Malaria Vaccine Research: Reflections from Publication
K.C. Garg, Suresh Kumar, Y. Madhavi, Mala Bahl
264
Profile of Indian Science Journals K.C. Garg, Suresh Kumar,
Bharvi Dutt 265
Membership of Editorial Boards of US and UK Journals in Clinical Medicine Field
Praveen Sharma 265
Appropriation and Value of Publications, the Knowledge Assets
P. Banerjee 266
Access to International Journals using Citations: A Case Study of Medical Science Research in India
K.C. Garg, Suresh Kumar, Bharvi Dutt
268
Indian Patent Output 1990-2007 V.K. Gupta 268 Indian Publications and Patents Output in Information and Communication Technology
Akshay Khatreja, V.K. Gupta 271
Indian Publications and Patents Output in Nanotechnology Anit Kumar Panda, V.K. Gupta 271

vii
Indian Patents in Biotechnology S. Visalakshi 273 Strategic Worth of Patenting P. Banerjee 278
S & T for Rural India and Inclusive Growth
Overview 279 Science and Technology for Rural Development: A Synergy Approach
Rangan Dutta 281
Non-Farm Occupation in Rural India A.K. Mukhopadhyay, D.
Gangopadhyay, Saswati Nayak 283
Rural Development: A strategy for Poverty Alleviation in India
D. Gangopadhyay, A.K. Mukhopadhyay, Pushpa Singh
287
Status of Use of Modern Implements, Farm Machinery and Hand Tools
Indranil Biswas, Bikramjit Sinha
291
One Segment of Unorganized Sector Workers: Rural Artisans
S.S. Solanki 296
Shelter: A Big Challenge for Rural India Bikramjit Sinha, Indranil
Biswas 298
Drinking Water Supply vis-a-vis Technological Interventions for Social Empowerment of Rural India
Kasturi Mandal 302
Rural Sanitation: A Step Towards Achieving the Millennium Development Goal No 7, Target 10
Kasturi Mandal 307
Rural Energy Security in India: Reality Checks Bikramjit Sinha, Indranil
Biswas 311
Applications of Geospatial Information Technologies for Rural Development & Inclusive Growth in India
Subhan Khan 315
Government Intervention in Focal Areas of Traditional System of Medicine
Kirti Joshi 317
Impact of Science & Technology on Indian Fisheries Sector B. Ganesh Kumar, K.K. Datta 319 Mushrooms: The Vegetable of Future N.S.K. Harsh, Kirti Joshi 322 Horticulture: Post Harvest Management Saswati Nayak, A.K.
Mukhopadhyay 323
Key Issues in Post-Harvest Management of Fruits and Vegetables in India
L. Pulamte 328

viii
Livestock in Mixed Farming: A Leveraging Asset for Inclusive Rural Development in India
Indranil Biswas, Bikramjit Sinha
329
Sericulture Industry in India – A Review D. Gangopadhyay 334 Potential of Bio-pesticides in Indian Agriculture vis-a-vis Rural Development
Bikramjit Sinha, Indranil Biswas
340
Indigenous Agricultural Systems of Northeast India L. Pulamte 343 Foodgrains: Seed Development & Production Kirti Joshi 344 GM Crops: Potential for Second Green Revolution? Kirti Joshi 346 ICT in Agriculture Marketing Mala Bahl 348 Mechanism of Developing and Fixing Food Standards Kirti Joshi 351 Towards Agricultural Innovation Policy Suresh Pal, Uree N Choudhary,
Rashi Mittal 353

ix
List of Tables
S & T Human Resources Table 1-06.01. Inter-state flow of students Table 1-07.01: Asian recipients of US doctorates in various fields (1985-2005) Table 1-07.02: Flow of students from China and India to USA and vice-versa Table-1-07.03: Major source countries to China and India Table 1-10.01: Profiles of cities from where researchers/ academicians of most Indian major and few minor organizations, received their trainings Table 1-10.02: Profiles of organizations from where researchers/ academicians of most Indian major and few minor organizations, received or definitely did not receive their trainings Table 1-11.01: Universities of Health Sciences established in various states of India Table 1-12.01: Enrolment of Girls as percent of Total Enrolment in University Education by Faculty Table 1-12.02: Enrolment of Women in Engineering S & T Financing Table 2-01.01: Sectoral Composition of Expenditure against Gross Budgetary Support of Central Plan (1998-2008) Table 2-01.02: Changing Patterns of Objectives of National R&D Expenditure Table 2-01.03: National Expenditure on R&D: A Comparative Assessment Table 2-01.04: Pattern of change in R&D as a % of GDP over time: A relative assessment Table 2-01.05: Decline in National R&D Intensity1985/86-2003/04 (Post-Reform Period) Table 2-01.06: Changes in the Sectoral Contribution of National Expenditure on R&D (In Percent) Table 2-01.07: Department/Agency – wise support to Extramural Projects during 1990-2006 Table 2-01.08: Subject Area-Wise Distribution of Extramural R&D Projects and their Approved Cost during the Year 1990-91 to 2005-2006 Table 2-01.09: Distribution of Extramural R&D Projects by types of Institutes and their Approved Cost during the Year 1990-91 to 2005-2006 Table 2-01.10: Distribution in subject & Institute - wise Investment in Extramural R&D projects during the year 2001-02 to 2005-06. Table 2-01.11: Distribution in subject & Source - wise Investment in Extramural R&D projects during the year 2001-02 to 2005-06. Table 2-01.12: Scope & objective wise Support to Extramural R & D Projects Approved during 2001-02 to 2005-06. Table 2-01.13: Top 10 Institutions by Number of Projects during 1990-91 to 94-95, 1995-96 to1999-00 & 2001-02 to 2005-06

x
Table 2-01.14: Subject-wise projects funded by TDB, 1997-2008 Table 2-01.15: Sector-wise Sanctions by IREDA, 2003-08 Table 2-02.01: Some measured levels of expenditure on health in India (1997-2003) Table 2-02.02: Health Financing in India: Key Agencies (Sources & Users/Performers) Table 2-02.03: Scheme-Wise Plan Outlay and Actual Expenditure for Health during Tenth Plan Period Table 2-04.01: Plan Investment (in Crores) in S&T undertaken by Central socio-economic sector ministries Table 2-04.02: Trend of Plan and non-Plan Expenditure on Education and Training by Centre, for Social sector Ministries.
S & T Structure, Infrastructure and Public Space Table 3-01.01: Schematic presentation of the modes of governances of S&T structures in India Table 3-01.02: Schematic of governance structure and the status of R&D institutions in India Table 3-01.03: Differences in governance under social sector Table 3-01.04: Performances of R&D institutes in the textile sector Table 3-05.01: Know-how transfer earnings and patents granted by BCIL Table 3-09.01: Major Government Initiatives promoting R&D Agency – Industry Partnership, 1953-2005 Table 3-09.02: Various Programmes undertaken by CSIR, IIT, IISC, CII Table 3-09.03: Technology Development Funding Mechanisms till 2005
S & T and Industry Table 4-01.01: Share of states in gross output (at constant 1993-94 prices) by factory sector in India Table 4-01.02: Technical change across major states in India Table 4-02.01: Food and non food Crops Table 4-02.02: Allied agricultural activities Table 4-02.03: Sugar, Oil, beverage and tobacco products Table 4-02.04 (a): Textile industries Table 4-02.04 (b): Textile industries Table 4-04.01: Sector –wise GERD in India, 1970-71 to 2004-05 (% shares) Table 4-04.02: Growing privatization of industrial R&D in India, 1985-86 to 2002-03 (Rs in Millions at current prices) Table 4-04.03: Trends in US Patenting of Indian Inventors, 1994-2007 (number of utility patents) Table 4-05.01: Share of Total Global R&D Spending, 2006-2008 Table 4-05.02: Number of Firms Involved in R&D in Different Years Table 4-07.01: Trends in R & D expenditure for Indian Private Industry vis a vis other parameters of industrial growth

xi
Table 4-07.02: Expenditure done by bottom 10 sectors (in terms of sales) on different parameters and sales, export achieved for the period 1990-91 to 2006-07 Table 4-08.01: No. of companies reporting R&D expenditure Table 4-08.02: Best (top 10) industrial sectors in terms of % share of total sales turn over Table 4-08.03: Least performing (bottom 10) sectors in terms of % share of total sales turn over Table 4-09.01: Distribution of closed MSME units by the year of closure Table 4-09.02: Classification of Enterprises into Different Categories (New Definitions) Table 4-09.03: Classification of Enterprises into Different Categories (Old Definitions) Table 4-10.01: Performances of industry between 1990-91 and 2004-05 Table 4-10.02: Changes in the percentage share of value added for select industry sector with respect to the value added in the total industries Table 4-11.01: Trends in innovation parameters for transport sector Table 4-11.02: Trends in innovation parameters for transport sector Table 4-12.01: Investment in Textile Machinery Table 4-12.02: Imports of Various Textile Machinery and Accessories Table 4-13.01: Production Trend of Automotive Segments (Mln No.) Table 4-13.02: Share of Segments in Total Vehicle Production (In Mln) Table 4-13.03: Growth of Auto Components production in India Table 4-13.04: Growth Rate of Exports and Imports Table 4-13.05: Foreign Collaborations of Indian Auto Component Companies Table 4-15.01: Evolutionary Phases of Tyre industry in India. Table 4-16.01: Trends in the number of telecom subscribers and in Tele-density, 1991-2008 Table 4-16.02: Degree of competition in the market for fixed telephone services (as on December 31, 2008) Table 4-16.03: Patents issued to Indian inventors in the US, 2001-2005 (Number of patents) Table 4-17.01: Area of activities of Biotechnology Companies in India Table 4-17.02: Contribution of BT Industry to GDP (2002-03 to 2005-06) Table 4-17.03: Import and export of pharmaceutical products and seeds for Fiscal year 2001-02 Table 4-17.04: Biotech Industry Revenues from Exports and Domestic Sales Table 4-17.05: Past Sales of Biotech Products in India and Future Sales Estimates (Rs. In Millions) Table 4-17.06: Modern biotech products currently (2006-07) being produced in India Table 4-18.01: Royalty Paid by the companies (2003-2007) Table 4-18.02: Average Number of Patents Published by the Companies (2005-2007) Table 4-19.01: Total strength of SSIs and SSSBEs in Indian Pharmaceutical Sector along with strength of work force. Table 4-20.01: Clinical trial cost differences in India and United States Table 4-23.01: Global growth across types of publications in MEDLINE Table 4-23.02: Distribution of publication types across countries in 2008 (February) in MEDLINE Table 4-23.03: Distribution of total (1991-2001) publication over types of institutions
xii
Table 4-23.04: Medical and non-medical authors in country publications of India, China and Israel Table 4-24.01: Foreign collaborators in Indian energy research (1995-2007) Table 4-24.02: Indian Universities undertaking Energy R&D (1995-2007) Table 4-24.03: Collaboration pattern in India in energy research (1995-2007) Table 4-25.01: Relative share of materials trade (%) to total trade of India Table 4-25.02: Top Institutions/Universities in material science publication Table 4-25.03: Foreign Collaborator in materials science in India Table 4-25.04: Different aspects of the publications in the 12 dominant areas of material science India
S & T Output and Patents Table 5-01.01: World Publication Share of Top 20 Countries in Science & Technology, 1997-2007 Table 5-01.02: India’s Share of International Collaborative Papers 1997-2007 Table 5-01.03: Impact of National Funding Agencies in India on R&D Research, 1997-07 Table 5-01.04: Top 36 Productive Organizations in S&T in India, 1997-2007 Table 5-06.01: Number of editorial board members in clinical medicine from different countries Table 5-08.01: Distribution of output and the number of journals cited by each State Table 5-12.01: Patents Filed, Published and Granted during 2001-07 Table 5-12.02: Patents Published during 2002-03 to 2006-07, in Various Fields Table 5-12.03: Proportion of Indian/Foreign BT Patents 2001-07 Table 5-12.04: Nature of Institutions from India and abroad contributing to BT Patents in India S & T for Rural India and Inclusive Growth Table 6-02.01: Non-agricultural establishments and employment in rural India Table 6-02.02: Increase in labour force and working age population Table 6-02.03: Labour force, employment and unemployment Table 6-02.04: Education profile of the unemployed in Rural India Table 6-09.01: Incentive pattern under Nirmal Gram Puraskar Table 6-16.01: Commodity-wise distribution of Cold Storages in the country Table 6-18.01: Silk Statistics of India Table 6-18.02: World Raw Silk Production Table 6-18.03: Involvement of Women Table 6-18.04: Employability in mulberry sericulture/ha Table 6-21.01: Number of Notified seeds of cereals produced Table 6-21.02: Average annual growth rates Table 6-25.01: Centre and states in agricultural funding, 2000

xiii
List of Figures S & T Human Resources Fig 1-01.01: Stages of education w.r.t the population between 5-14 years Fig 1-01.02: Break-up of Enrolment at Primary Level Fig 1-01.03: Break-up of Enrolment at Secondary level in India Fig 1-01.04: Break-up of Enrolment in Higher Education Fig 1-01.05: Percentage of enrolment at BSc & MSc Level Fig 1-01.06: Enrolment at graduate level in Engineering Degree and Polytechnics Fig 1-01.07: Break-up of enrolment in Medical Sciences Fig 1-01.08: Break-up of PhD in Sciences and Engineering Fig 1-02.01: Number of ITIs and ITCs available per million persons in different states in India Fig 1-02.01: Intake capacity of ITIs and ITCs per million persons in different states in India Fig 1-01.03: ITIs/ITCs under Government and Private Bodies, in main states of India Fig 1-02.04: Percentage of different social group trained by KVIC in the year 2001-02 and 2004-05 Fig 1-02.05: Percentage share of the schools imparting vocational training for some major states Fig 1-02.06: Trained paramedical practitioners available in rural India Fig 1-03.01: Break-up of total expenditure Fig1-03.02: Growth of recognized educational institution from 1950 to 2004 Fig 1-04.01: Performance of Science in 12th Standard Fig 1-04.02: Performance of Science vs. Non-Science 12th Std Fig 1-04.03: Performance in PCMB at 12th Standard Fig 1-04.04: Performance in mathematics at 12th Standard Fig 1-04.05: Performance in physics at 12th Standard Fig 1-04.06: Performance in chemistry at 12th Standard Fig 1-05.01: Indian S&T Manpower Stock and Ratio Fig 1-05.02: Migration of Indian & Chinese Students to US Fig 1-05.03: Out turn of Indian Students in Engineering and Science – Domestic and US Fig 1-05.04: Immigration of Asian Students to US in Science Area Fig 1-05.05: Recipients of U.S. Science doctorates normalized by per million active population in home country Fig 1-06.01: Qualitative depiction of Inter-State migration of students from 10 to 12th standard Fig 1-06.02: Matrix of Pearson Correlation Coefficients for state to state migration of students from 10th to 12th Standard, 2005 to 2007 Fig 1-07.01: Global Destinations for International Students at the Post-Secondary (Tertiary) Level, 2008 Fig 1-08.01: Immigrants Legally Admitted in US by Selected Class of Admission from India Fig 1-08.02: Indian immigrated as temporary workers in US Fig 1-08.03: Various categories of Indian admitted into the US

xiv
Fig 1-08.04: Temporary Residents and Students Immigration from India in Australia Fig 1-08.05: Temporary Workers and Students in Canada from India Fig 1-08.06: Comparison of Migration of Indian Temporary Workers and Students in USA, Australia and Canada Fig 1-08.07: Out-turn and Migration for Indian Students Fig 1-10.01: Organizations where case respondents studied Fig 1-10.02: City-wise profiles of organizations from where case respondents received their training Fig 1-11.01: State-wise Enrolment (in numbers) of Students in Medical Education (Medicine, Dentistry, Nursing, Pharmacy, Ayurvedic, Unani and Homeopathy) in India over the years Fig 1-11.02: State-wise distribution of Medical colleges and their annual intake in 2008 Fig 1-11.03: Percentage share of public and private medical colleges offering M.B.B.S. course in India in 2008 Fig 1-11.04: Trend of introduction of new medical colleges since 1998 Fig 1-12.01: Proportion of women and men at different hierarchical positions Fig 1-12.02: Gender status of Fellows S & T Financing Fig 2-01.01: Sectoral Composition of Expenditure against Gross Budgetary Support of Central Plan for Science & Technology (Seventh to Tenth Plan) Fig 2-01.02: S&T Plan Outlays under Socio-economic Ministries/Departments Fig 2-01.03: State Plan Outlays under S&T Sector Fig 2-01.04: National R&D expenditure and its percentage to GNP Fig 2-01.05: R&D Expenditure as percent of GDP for selected countries 2004-07 Fig 2-01.06: Sector-wise growth of R&D expenditure Fig 2-01.07: State wise Total Research Investment in Tenth Plan Outlay (2002-07) Fig 2-01.08: R&D Expenditure by leading industry groups, 2005-06 Fig 2-01.09: Total approved cost Rs.4964.99 Crores Fig 2-01.10: Changing relative cost of projects in different scientific disciplines Fig 2-01.11: Distribution of Extramural R&D Number of Projects & Approved Cost by types of Institutes during the Year 1990-91 to 2005-2006 Fig 2-02.01: Projected deaths in India 2010 Fig 2-02.02: Share in health care spending among the different sectors Fig 2-02.03: Medical Research, Training and Education expenditure as proportion of Total Health Expenditure Fig 2-02.04: Extra-mural R&D projects Fig 2-02.05: Plan Outlay & Expenditure of ICMR for Seventh, Eighth and Ninth Plan period Fig 2-02.06: Health Expenditure at State level (2006-07) Fig 2-03.01: Trend of financing of Environmental S&T Fig 2-03.02: Funding pattern to various Education and Training Institutes Fig 2-03.03: Revised budget allocation for Environmental Education, Training/Extension

xv
Fig 2-03.04: Trend of Funding received by experts for research in the field of environment from respective organizations Fig 2-03.05: Trend of Investment in “Ecology and Environment” under Science and Technology head of Development (2002-05 Actual expenditure; 2005-2007 Approved Outlays) Fig 2-04.01: Plan Investment on S&T incurred by respective socio-economic sector ministries in the 8th Plan Fig 2-04.02: Trend of budgetary transactions on “Scientific services and research” head incurred over the years Fig 2-04.03: Trends in expenditure on Central Plan of revenue account under “Science, Technology and Environment” Fig 2-04.04: Trend of investment in select schemes having S&T component under Scholarship head Fig 2-04.05: Trend of investment in “Institutions of research” under University and Higher Education head Fig 2-04.06: Trend of investment in select schemes having S&T component under Technical Education head Fig 2-04.07: Research & Development Expenditure under technical education Fig 2-04.08: Expenditure on R&D by listed companies S & T Structure, Infrastructure and Public Space Fig 3-01.01: Percentage of S&T organizations under the Central Ministry of Science and Technology Fig 3-01.02: Number of public sector undertakings under respective independent departments and Ministry of Science and Technology of the Central Government Ministry undertaking R&D Fig 3-01.03: Number of S&T institutions across several Central Socio-Economic Ministries Fig 3-01.04: State wise distribution of Private sector companies doing R&D in India in 2008 Fig 3-01.05: Presence of Private Sector Companies doing R&D over the years Fig 3-01.06: City wise distribution of FDI companies doing R&D in India Fig 3-03.01: Region-wise distribution of papers published vis-à-vis Papers/Million of population in various educational institutes in Kerala over the last 15 years Fig 3-03.02: State-wise distribution of Publications vis-à-vis Papers published/ Million Persons/Year during 1996-2006 Fig 3-04.01: Distribution of centre/bodies of higher education in India over the years in select states Fig 3-04.02: Distribution of institutes imparting engineering & medical education in India over the years across select states Fig 3-04.03: State-wise distribution of ITIs and vocational schools in India Fig 3-04.04: Research and Development Institutes across the states Fig 3-04.05: State-wise enrolment status of Sec/Sr. Secondary- General & Vocational (boys& Girls) vis-à-vis literacy rate Fig 3-04.06: State-wise enrolment status of various degrees of higher education over the years
xvi
Fig 3-04.07: Expenditure on Education as percentage of GSDP in select states Fig 3-04.08: Expenditure incurred on S&T by respective states Fig 3-05.01: License Fee & Royalty earned by NRDC Fig 3-05.02: Patents filed by NRDC and number of technologies transferred to NRDC Fig 3-05.03: Number of technologies transferred to NRDC by various organisations Fig 3-06.01: STP Units Growth in Karnataka (Cumulative) Fig 3-06.01: Karnataka’s share in National Export Fig 3-06.03: Continent wise Export 2006-07 from Karnataka Fig 3-06.04: Segment wise Export 2006-07 from Karnataka Fig 3-09.01: Level of Market Certainty and Technology Certainty Supported Under GOI Programmes Supporting Partnerships Fig 3-10.01: CSIR’s Global Science Presence Fig. 3-11.01: Country-wise distribution of editors of global journal (2003-04) Fig. 3-12.01: Articles of different diseases in different newspapers in 2007 Fig. 3-12.02: Word count of different diseases in different newspapers in 1997 Fig. 3-13.01: Distribution of S&T related space in different newspapers Fig. 3-13.02: Broad subject distribution of S&T related items in different newspapers S & T and Industry Fig 4-01.01: Sectoral Changes in NDP Fig 4-01.02: Contribution of technical change in industrial output Fig 4-02.01: Change in share of total energy input cost in total input cost in several industries over the time period (1993-04 & 2003-04) Fig 4-03.01: High Technology Import Fig 4-03.02: High Technology Export Fig 4-03.03: Royalties for Various Countries in HT Trade Fig 4-03.04: Major exporters of computer and information services, 2005 Fig 4-03.05: Major importers of computer and information services, 2005 Fig 4-05.01: Source of R&D funds (%) for select country Fig 4-05.02: US patents granted to inventions of various countries, 2005 Fig 4-07.01: Sales per unit of compensation, money spent on power and raw material Fig 4-07.02: Expenditure done by top 10 sectors on different parameters for the period 1990-91 to 2006-07 Fig 4-08.01: Trends in % change over previous year in numbers of companies doing R&D Fig 4-08.02: Trends in percentage changes in expenditure in non-R&D innovative parameters Fig 4-08.03: R&D expenditure by listed companies in selected sectors of manufacturing industries Fig 4-08.04: Indicators of innovation in the manufacturing industries in India Fig 4-08.05: Indicators of innovation in the drug & pharma industries in India Fig 4-08.06: Status of the listed companies of Maharashtra in terms of R&D Fig 4-08.07: Trend of the R&D doing listed companies in Maharashtra

xvii
Fig 4-09.01: Comparison between MSME and ASI listed large industry Fig 4-09.02: Generation of new entrepreneurs (Registered units) Fig 4-09.03: Non ancillary units (trend in rural India w.r.t initial year of production in terms of number of units) Fig 4-09.04: Pre liberalization: Non ancillary manufacturing units Fig 4-09.05: Skill Pull in India w.r.t operation duration of the unit throughout the year Fig 4-09.06: No. of different industries in selected cities Fig 4-09.07: No. of different industries in selected cities in pre-liberalization period (1990-1990) Fig 4-09.08: No of different industries in selected cities in post liberalization period (1991-2001) Fig 4-10.01: Selected indicators of industrial innovation Fig 4-10.02: Indicators of innovation in urban vs rural industries Fig 4-10.03: Indicators of innovation of representative states Fig 4-10.04: Indicators of innovation in Automobile industries Fig 4-11.01: Ratio of different parameters per unit of net value added Fig 4-11.02: Total emoluments/net value added Fig 4-11.03: Number of workers/net value added Fig 4-11.04: Material consumed/Net value added Fig 4-11.05: Fuel consumed/net value added Fig 4-13.02: Automobile Production in India Fig 4-13.03: Vehicle Production: Industry Gross Fig 4-13.04: Vehicle Production: The 4-wheeler Segment Fig 4-13.05: Domestic Vehicle Sales After 1991 (In Numbers) Fig 4-13.06: Market Share of Various Segments of Automobiles Fig 4-13.07: Automotive Export Trends Fig 4-13.09: Investment in Auto Components Industry Fig 4-13.10: Component-wise Production Trend Fig 4-13.11: Export- Import Trends Fig 4-13.12: Direction of Exports Fig 4-13.13: Imports of Automotive Parts: OECD vs. Non-OECD Fig 4-14.01: Trends in values of output Fig 4-14.02: Fuel and Material Consumed per unit of output Fig 4-14.03: Wages per worker state wise Fig 4-14.04: Net Value Added per worker Fig 4-14.05: Fixed capital per output Fig 4-15.01: Comparison of R&D Expenditure, Exports, Sales & Raw Material Expenditure among all Companies (2000-07) Fig 4-16.01: Distribution of total ICT spending in India, 2001-2006 Fig 4-16.02: The rising privatisation of the Tele-communications services sector, 1995-2006 Fig 4-17.01: Manpower employed in BT Industry in India Fig 4-17.02: Growth of Revenue of Indian Biotech Industry 2002-2007 Fig 4-17.03: Forecast for 2015

xviii
Fig 4-17.04: Revenue Share of Biotech Sectors 2007-08 Fig 4-17.05: R&D and Infrastructure Investments Fig 4-17.06: Compounded Annual Growth since 2003 Fig 4-17.07: No. of Patents published by Indian BT companies (1998-2008); Fig 4-18.01: Total Exports by Pharma Companies during 2000-2007 Fig 4-18.02: Trend in Total Imports by Indian Pharma Industry during 2000-2007 Fig 4-18.03: Market Share comparison between Indian and Foreign Companies Fig 4-18.04: Average Annual Sales and Average RDE comparison (2003-2007) Fig 4-18.05: Average Annual R&D Intensity for 64 Companies (2003-2007) Fig 4-18.06: Comparison of Annual Sales from 2003-2007 between Foreign MNC's and Indian Companies Fig 4-18.07: Comparison of R&D Expenditure from 2003-2007 between Foreign MNC's and Indian Companies Fig 4-18.08: Comparison of RDI from 2003-2007 between Foreign MNC's and Indian Companies Fig 4-19.01: Total value of Assets, Exports & Output of Pharmaceutical SMEs (in current prices) Fig 4-19.02: Sources of Technical Know-How for Pharma SMEs. Fig 4-19.03: GMP compliance status of SSI units in pre-patent regime Fig 4-20.01: Regulation in Indian Pharmaceutical sector Fig 4-20.02: Phase-wise break-up of clinical trials carried out in India Fig 4-21.01: Proportion of manufacturing units of different systems Fig 4-21.02: Herbal manufacturing units Fig 4-22.01: Vaccine R&D map of India Fig 4-23.01: Cross-country comparison of biomedical publications, 1995-2007 Fig 4-23.02: University system in biomedical publications of India Fig 4-23.03: Organized research in biomedical publications of India Fig 4-23.04: Hospitals in biomedical publications of India Fig 4-23.05: Publications percent in Medical & Hospitals of different countries Fig 4-23.06: Publications percent in Universities of different countries Fig 4-23.07: Distribution of Publication over various Universities/Medical of India (1991-2001) Fig 4-23.08: Publications percent of different sectors in India Fig 4-23.09: Publications percent in Cities of India Fig 4-23.10: Publications percent in Institutes of Kolkata (1991-2001) Fig 4-23.11: Publications percent in Institutes of Bangalore (1991-2001) Fig 4-23.12: Publications percent in Institutes of Mumbai (1991-2001) Fig 4-23.13: Publications percent in Institutes of Lucknow (1991-2001) Fig 4-23.14: Publications percent in Institutes of Chennai (1991-2001) Fig 4-23.15: Publications percent in Institutes of New Delhi (1991-2001) Fig 4-23.16: Publications percent in Institutes of Hyderabad (1991-2001) Fig 4-24.01: Production of Coal and Lignite in India

xix
Fig 4-24.02: Consumption of Coal in different industries Fig 4-24.03: Consumption of domestic-petroleum products in India Fig 4-24.04: Consumption of domestic-petroleum products in India Fig 4-24.05: Production and consumption of natural gas in India Fig 4-24.06: Industry-wise Off-take of Natural Gas for non-energy purposes in India Fig 4-24.07: Grid-connected Renewable Power (State wise details of schemes/ programmes being implemented and cumulative achievements); Fig 4-24.08: Consumption of electricity Fig 4-24.09: Installed Generating Capacity of Electricity in Utilities and Non-utilities in India; Fig 4-24.10: Foreign Trade in Coal, Crude Oil and Petroleum Products in India; Fig 4-24.11: No. of companies involved in R&D in Energy Sector in India, based on listed companies Fig 4-24.12: Innovation indicators of the companies doing R&D in Energy Fig 4-24.13: Indian publication in different fields of energy research Fig 4-24.14: Indian authors involved in different fields of energy research Fig 4-25.01: Materials production in India Fig 4-25.02: Foreign Trade of materials by India in quantitative terms Fig 4-25.03: Trend of innovation in the materials related companies Fig 4-25.04: Trend of India’s publication in Materials science Fig 4-25.05: Trend of publication in selected areas of materials science Fig 4-25.06: Involvement of authors in selected areas of materials science S & T Output and Patents Fig 5-03.01: Output in Mathematics from India Fig 5-03.02: Average Impact Factor of journals publishing Indian output Fig 5-03.03: Journal Publication category and the Impact Factor values in 1990’s Fig 5-03.04: Distribution of Indian mathematics papers over IF & non-IF category journals for 1991, 1994, 1997 & 2001 Fig 5-03.05: Organization-wise distribution of authorship of mathematics papers Fig 5-03.06: Reviewed-paper distribution across organizations Fig 5-05.01: Growth of Indian science journals Fig 5-07.01: Number of citations received by papers from different countries Fig 5-07.02: Lorenz Curve for Journals having ten or more papers across different cities of country (Gini Coefficient = 0.605) Fig 5-09.01: India’s growth in patenting Fig 5-09.02: Region-wise spread of India’s patenting activity Fig 5-11.01: Indian publications in nanotechnology for the period 1990-2007 Fig 5-12.01: Number of Patents and Indian Contribution in Biotechnology Fig 5-12.02: Number of Countries involved in Patenting in BT in India, every year Fig 5-12.03: Country wise applications for patents in India in Biotechnology Fig 5-12.04: Patent Publication Performance of Top 16 Indian Applicants

xx
Fig 5-12.05: IPC Codes wise distribution of patent applications in India in Biotechnology Fig 5-12.06: India BT Patents by IPC in 90’s & 2000’s Fig 5-13.01: Strategic value of patents from India granted in USA Fig 5-13.02: Strategic importance of Indian drug patents granted by USPTO S & T for Rural India and Inclusive Growth Fig 6-02.01: Distribution of major Non-agricultural establishments in rural India during 2005 Fig 6-02.02: Trends in employment status in rural labor force (male + female) by sector Fig 6-05.01: Different sources of information about agricultural tools in percentage Fig 6-05.02: Number of different kind of plough owner in rural India Fig 6-05.03: Number of different kind of pump user in rural India Fig 6-05.04: Users of mechanized agricultural implements in rural India Fig 6-05.05: Import export value of soil machinery Fig 6-05.06: Import export value of dairy and milking machinery Fig 6-05.07: Import export value of Agricultural tractors (all values in USD) Fig 6-06.01: Change in awareness level of artisans in 2004 & 2007 Fig 6-07.01: State wise shortage of housing in rural areas Fig 6-08.01: Percentage of affected habitations chemical contamination wise (as per ARWSP Norms) Fig 6-08.02: State wise Cases due to Cholera in India 2007 and Acute Diarrhoeal Disease in 2006 Fig 6-08.03: Percent distribution of rural households by treatment of drinking water in 1998-99 and 2005-06 respectively Fig 6-08.04: Percent distribution of rural households across states not treating the drinking water in 1998-99 Fig 6-09.01: State-wise allocation released on TSC from Centre share Fig 6-09.02: Trend of increase in % of rural individual household latrine Fig 6-09.03: State wise Percentage of sanitation coverage achieved till march 2009 Fig 6-10.01: Sources of energy for Indian Rural MSMEs Fig 6-15.01: Trends of Domestic production in horticulture sector (2000-07) Fig 6-15.02: Export of Fruits & Vegetable products during the Year 2000 to 2008 Fig 6-17.01: Change in number of different types of livestock during 1997-2003 Fig 6-17.02: Milk and Egg production between 1985-86 and 2006-07 in India Fig 6-17.03: Total meat consumption and projected consumption in the year 2020 Fig 6-17.04: Percentage of area operated for farming of animal in rural India according to land Fig 6-17.05: Percentage of area of animal farming for different livestock in rural India Fig 6-17.06: Types and numbers of livestock treatment facilities in India under the Department of Animal Husbandry and others Fig 6-18.01: Variety-wise raw silk production (2007-08) Fig 6-18.02: Year-wise silk export earnings Fig 6-18.02: Sericulture with higher remuneration

xxi
Fig 6-19.01: Trend of bio-pesticide research outputs Fig 6-21.01: All India area, production & yield of food grains from 1950-51 to 2006-07 along with percentage coverage under irrigation Fig 6-21.02: Total quality seed production by National Agricultural Research System Fig 6-21.03: Total breeder seed production by ICAR Fig 6-22.01: Global position of countries according to Biotech crop area (year 2007) Fig 6-22.02: Number of commercially released varieties of Bt cotton hybrids (for year 2008, data upto July 30) Fig 6-22.03: Region wise breakup of number of crop varieties released Fig 6-22.04: Area under Bt cotton in Indian states Fig 6-24.01: State-wise distribution of food testing laboratories (127 labs) Fig 6-25.01: Organization and linkages of Indian agricultural research system Fig 6-25.01: Share (%) of the central and state government in funding for agricultural research & education

xxii
Acronyms and Abbreviations
ABLE Association of Biotechnology Led Enterprises AICCIP All India Coordinated Crop Improvement Project AICRP All India Coordinated Research Projects AIIMS All India Institute of Medical Sciences AMPRI Advanced Materials and Processes Research Institute ARAI Automotive Research Association of India ASI Annual Survey of Industries ATIRA Ahmedabad Textile Industry Research Association ATS Apprenticeship Training Scheme AYUSH Ayurveda, Yoga & Naturopathy, Unani, Siddha and Homoeopathy BARC Bhabha Atomic Research Centre BCIL Biotech Consortium India Limited BHU Banaras Hindu University BIPP Biotechnology Industry Partnership Programme BIRAC Biotechnology Industry Research & Development Assistance Council BIS Bureau of Indian Standards BMTPC Building Materials and Technology Promotion Council BPL Below Poverty Line BT Biotechnology CAPART Council for Advancement of People’s Action and Rural Technology CBRI Central Building Research Institute CBSE Central Board of Secondary Education CCFS Central Committee for Food Standards CCH Central Council of Homeopathy CCIM Central Council for Indian Medicine CCT Controlled Clinical Trial CC Clinical Conference C-DAC Centre for Development in Advanced Computing CDMA Code Division Multiple Access CDRI Central Drug Research Institute CFTRI Central Food Technological Research Institute CGCRI Central Glass and Ceramic Research Institute CII Confederation of Indian Industries CIPHET Central Institute of Post Harvest Engineering & Technology CLRI Central Leather Research Institute CMIE Centre for Monitoring Indian Economy CMRI Central Mining Research Institute CMTI Central Manufacturing Technology Institute COE Centre of Excellence

xxiii
CRAM Contract Research and Manufacturing CRO Contract Research Organization CSA Centre for Sustainable Agriculture CSIR Council of Scientific and Industrial Research CSO Central Statistical Organisation CT Clinical Trial CTS Craftsmen Training Scheme DAE Department of Atomic Energy DARE Department of Agricultural Research and Education DBT Department of Biotechnology DCI Dental council of India DDWS Department of Drinking Water Supply DGE&T Directorate General of Employment & Training DGSD Directorate General of Supplies & Disposals DOD Department of Defence DOS Department of Space DOT Department of Telecommunications DRDA District Rural Development Agencies DRDO Defence Research & Development Organisation DSIR Department of Scientific & Industrial Research DST Department of Science & Technology DWCRA Development of Women and Children in Rural Areas EDC Entrepreneurship Development Cell EOU Export Oriented Unit EWS Economically Weaker Sections FDA Food & Drug Administration (USA) FDI Foreign Direct Investment FMTTI Farm Machinery Training & Testing Institute GATT Global Agreement of Trade and Traffic GDP Gross Domestic Product GERD Gross Expenditure on R&D GMP Good Manufacturing Practice GNP Gross National Product GSM Global System for Mobile Communications HAL Hindustan Aeronautics Limited HUDCO Housing and Urban Development Corporation Limited HYV High Yielding Varieties IARI Indian Agricultural Research Institute IAY Indira Awas Yojana ICAR Indian Council of Agricultural Research ICFRE Indian Council of Forestry Research and Education ICMR Indian Council of Medical Research ICT Information and Communications Technology IDBI Industrial Development Bank of India IDP Instrumentation Development Programme

xxiv
IF Impact Factor IFS International Food Standard IICT Indian Institute of Chemical Technology IIL Indian Immunological Ltd IIM Indian Institute of Management IISc Indian Institute of Science IIT Indian Institute of Technology ILO International Labour Organization INC Indian Nursing Council INPADOC International Patent Documentation Centre INSPIRE Innovation in Science Pursuit for Inspired Research IPC International Patent Classification IPR Intellectual Property Rights ISO International Organisation for Standardization ISRO Indian Space Research Organisation IT Information Technology ITI Industrial Training Institute IVRI Indian Veterinary Research Institute IWDP Integrated Watershed Development Program JNNURM Jawaharlal Nehru National Urban Renewal Mission KVIC Khadi and Village Industries Commission KVK Krishi Vigyan Kendra KVPY Kishore Vaigyanik Protsahan Yojana MCI Medical Council of India MNC Multinational Corporation MNRE Ministry of New and Renewable Energy MOEF Ministry of Environment and Forests MOP Ministry of Power MS Multicenter Study MSME Micro, Small and Medium Enterprises NABARD National Bank for Agriculture and Rural Development NAL National Aerospace Laboratory NBAGR National Bureau of Animal Genetic Resources NBCC National Building Construction Corporation NBFC Non Banking Financial Company NCERT National Council of Education Research and Training NCIPM National Centre of Integrated Pest Management NCL National Chemical Laboratory NDWM National Drinking Water Mission NFBS National Family Benefit Scheme NGO Non-Governmental Organisation NGP Nirmal Gram Puraskar NHHDC Nagaland Handloom & Handicrafts Development Cooperation NHRM National Rural Health Mission NIF National Innovation Foundation

xxv
NISCAIR National Institute of Science Communication and Information Services NIRD National Institute of Rural Development NISTADS National Institute of Science Technology and Development Studies NMBS National Maternity Benefit Scheme NMITLI New Millennium India Technology Leadership Initiatives NML National Metallurgical Laboratory NNRMS National Natural Resources Management System NOAPS National Old Age Pension Scheme NPL National Physical Laboratory NPO Non-Profit Organisation NPV Net Present Value NRDC National Research Development Corporation NREGA National Rural Employment Guarantee Act NRWSP National Rural Water Supply Program NSAP National Social Assistance Program NSF National Science Foundation NSIC National Small Industries Corporation NSSO National Sample Survey Organisation NSTEDB National Science & Technology Entrepreneurship Development Board NTSE National Talent Search Examination OCM Ocean Colour Monitor OECD Organisation for Economic Co-operation and Development OSDD Open Source Drug Discovery PASTER Programme Aimed at attaining Technological Self–Reliance PCI Pharmacy Council of India PCT Patent Cooperation Treaty PGI Post Graduate Institute of Medical Sciences PGS Public Guarantee System PHM Post Harvest Management PMGSY Pradhan Mantri Gram Sadak Yojna PPP Public Private Partnership PRI Panchayati Raj Institutions R&D Research & Development RCT Randomised Controlled Trial RNFS Rural Non-Farm Sector RRC Review of Reported Cases RRL Regional Research Laboratory S&T Science & Technology SAY Samagra Awas Yojana SBIRI Small Business Innovation Research Initiative SEETOT Scheme to Enhance the Efficacy of Transfer of Technology SGRY Sampoorna Grameen Rozgar Yojana SGSY Swarnjayanti Gram Swarozgar Yojana SHG Self-Help Group SIDBI Small Industries Development Bank of India

xxvi
SITRA Supply of Improved Tool Kits to Rural Artisans SMOI Silk Mark Organization of India SPREAD Sponsored Research and Development Programme SRA Strengthening Revenue Administration STAG Science and Technology Advisory Group STARD S&T Application for Rural Development STAWS S&T Application for Weaker Sections STPI Software Technology Parks of India TBT Technical Barriers to Trade TCAG Technology Coordination and Action Group TDB Technology Development Board TDPP Technology Development and Demonstration Program TDPU Technology Promotion, Development and Utilization TePP Technopreneur Promotion Programme TIFAC Technology Information, Forecasting & Assessment Council TIFR Tata Institute of Fundamental Research TRIPS Trade-Related Aspects of Intellectual Property Rights TRYSEM Training of Rural Youth for Self Employment TUFS Technology Up-gradation Fund Scheme UGC University Grants Commission UNDP United Nations Development Program UNESCO United Nations Educational, Scientific and Cultural Organization UNICEF United Nations International Children's Emergency Fund UNIDO United Nations Industrial Development Organization USPTO United States Patent and Trademark Office WHO World Health Organization WIPO World Intellectual Property Organization WTO World Trade Organization

IntroductionIntroductionIntroductionIntroductionIntroduction
The country is entering the age of knowledge when increasing returns would be ubiquitous. Surpassing the
boundaries of traditional modes of industry based upon decreasing returns, the knowledge based generation
of income and wealth should now permeate into agriculture, education and services. At this crossroad the
demands on S&T are novel and ambitious. Such expectations require beyond a hefty raise in the allocated
percentages of gross national products to the S&T, a deep as well as expansive redrawing of institutions that
are dedicated to S&T, but more importantly of other economic social and educational institutions as well.
Situated within this backdrop of expectations the ambition of offering a set of S&T indicators for the Indian
system was given up in favor of a broad set of analytic descriptions of states-of-affairs, because any
dedicated set of indicators must apprehend the potential future while describing the past. This future is
currently contested. Old institutions primarily of decreasing returns are overwhelmingly dominant and the
indicators would therefore portray a skewed picture. This report thus draws upon facets of economic, social
and educational life; where S&T has its footprints.
The democratic governance structures of this country have evolved, over the course of six decades, sets of
complex institutions systems and practices that bind or otherwise relate S&T to the other spheres. With
about four thousand research and development organizations, large organized systems of knowledge production,
millions of knowledge workers and an even larger number of citizens engaging in knowledge-based activities
ranging from agriculture through semi-skilled workers to industrial workers, coupled with the fact of the
country being especially gifted with immense diversity in natural resources –– the opportunity set of potential
outcomes are immense and invigorating.
Coordination and Governance
Governance of S&T is currently intertwined with governance of other institutions. One strategic shift that
the knowledge age demands is about putting S&T at the helm of governance. Such a shift could address
together the twin related issues of governance of S&T and of other systems and institutions. The desired
restructuring, in for example economic or educational institutions, could be achieved through allocating to
S&T a strategic fraction of the total funds dedicated to economic restructuring. Fund based coordination
could indeed offer better solutions to the problem of bridging, for example, the gap between S&T and the
economic entities. Over the last few years this country has adopted a few such fund-based mechanisms.
Coordination through fund dedicated to a national problem such as TB offers important learnings.
At present S & T participation is absent from several key executive governance systems of the country, at
the several tiers of government from the central to the local. Most executive functions however, employ
S&T in practice. The country has thus generated multiple islands of knowledge generation and utilization.
Coordination between such knowledge agencies could bring about strategic focusing of S&T, while allowing
fulfillment of democratic aspirations in the formulation of contesting S&T agendas. Directed research and
in particular directed basic research would open up novel possibilities. Fund based in contrast to executive

dependent directedness opens up even finer variations. The federated executive of the country has historically
employed diversity in adopting agenda, making decisions and in evaluating outcomes. S&T especially has
enriched from diversity of research agendas. Indeed this country can exhibit to the global societies how
diversified S&T agendas could be functional and remain governed. Indian achievement in democratizing the
agenda formulation of S&T is possibly amongst the best in the world. However, India has miles to travel to
embolden the feeble voice of poor millions and express their aspirations as well as demands from the S&T,
in shaping research agenda or the S&T outcome.
The long twentieth century in Indian S&T based developmental experiments, in particular at grass roots, has
thrown up immense volumes of data, facts and artifacts. The governance system, however, failed short of
accumulating such results and giving shape to such experiments in the country’s S&T based planning
processes. Participation of district non-governmental organizations or self-help groups and similar social
forms in the governance process offers potentially rewarding outcomes. Similarly, the flow of demands
bottom-up from within S&T organizations would offer another important envelope of developmental alternatives
based upon S&T. Indeed, today one major challenge to the country is how to support transition of currently
existing S&T organizations from states of relative inactivity to imaginative centers of resources.
Inclusive Growth and Well Being
In spirit and since the early years of the formulation of S&T policies and plans, this country often tacitly
accepted that S&T based restructuring and innovation are redistributive and justice could be brought about
through S&T and innovation. This radical definition of innovation as the key to undertaking redistribution of
income and rights to assets and to generation of future assets opens up the door. Innovation can be thus
several. This definition informs that there are several non-corporate innovators ranging from individuals
through social groups to tiny or small enterprises. Innovation accordingly offers not simply profit but more
importantly asset outcomes that by definition would be sustainable over a period.
Bringing about inclusive growth and well being for the country’s population are the agenda of S&T based
innovations. Enabling the ignorant with S&T driven skills, offering the potential entrepreneur and self help
groups with S&T based innovative product or process solutions, empowering the country’s population to
shift consumption frontiers to the innovated products and services, and helping sustain regeneration of
resources for inter-generational justice are among the few important goals of S&T driven inclusive
growth.
Geographies and Balance
A related dimension of justice and accesses to resources, current and future, is shaped by the geographical
outcomes. Regions and states in the knowledge-age specialize more intensely, spill over happens with greater
ease and opportunities are offered differentially in different areas. Such a movement has been happening
through inter-country movements of resources that have different values and across districts, regions and
states within the country. Geography based specializations and inter-geography competitive balance through
several modes of commerce, therefore become leading determinants of development of S&T.
Globalization of high value resources, such as the highly trained human resources or special skills and
products including of finance are currently shaping up the contours of geographic capacities and capabilities.
This country has in germinal form several types of inter-geographic consultation mechanisms and instruments
for transfer of resources, while the country has in lesser strength similar functionaries to address globalization
and inter-country regionalization. On both counts Indian efforts would need strengthening up.

Agencies for S&T and Innovation
An important mode of redistribution has been the profit motives of corporations and their large shareholders.
This country faces now the challenge from managerial corporations and finances; and yet much of recent
policies suggest that Indian initiatives in S&T and innovation have recognized the importance of redistribution
achievable through entrepreneurship and several forms of social networks and groups. Increasing returns
grow and vanish with ultra rapidity. Contemporary S&T institutions need to recognize such features.
For long organizations have remained agents undertaking S&T and innovation. Corporate valuation and
transfers of resources have remained the most significant drivers of growth. Nevertheless it has been
organizations again who as incumbents fiercely resisted innovative changes. Increasing returns based
institutions in contrast often depended less on large corporations, while drawing sustenance from nimble
small entities and social networks. In recognition Indian S&T and related institutions have initiated steps.
Yet much would be demanded in the coming years.
R&D as the Set Aside
An important proof of efforts towards generation of new resources has been the set asides defined as
investments in R&D. With continuous lowering of R&D life cycles especially in corporate accounting
practices along with opportunistic definitions on what constitutes R&D, a time has arrived where public
investment for long term set asides assume greater importance. The closest to such long term investments
are achieved in training very highly skilled human resources. In contrast the most liquid investments are
made in very short life cycle S&T and skill-development education. Investments in generic high technologies
offer rather long term scopes. The preparedness of a country to withstand radical shocks brought about by
ultra quick changes in knowledge and skills is an important determinant of technology strength to withstand
scorched earth blitzkrieg.
Permeating and widespread capacities to undertake R&D and similarly permeating capacities to educate
and undertake S&T would thus prove essential for the future. Investments in S&T and related institutions of
education and skill as well as in instruments and in workshops, for the long term would provide the strongest
bulwark against vicissitudes of technological changes.
S&T Data
A crucial issue emerges from this investigation. The country very badly needs a strong mechanism to
capture data related to S&T and innovation right from the regulatory or executive levels to source-points
where S&T output or innovations get generated. Indian economics statistics is enviably good. Borrowing
from the success of that economic data system, the country needs to put in place a similar system of data
capture, transmission, processing and distribution of S&T data.
The Roadmap
This Report presents several facets of Indian S&T. In lieu of attempting the development of a set of
traditionally known indicators of S&T, the attempt here has been to capture multiple facets of Indian economy
and society where S&T makes contributions. With unstated theoretical bases, contributors presented research
conclusions in the form of several portrayals. Given the fact that S&T interfacing the economy and society
has very large dimensions this Report could take up only a handful. Such a collage offers albeit a picture of
where Indian S&T is located.

Divided over six broad themes –– human resources, finance, structures and infrastructure, industry, output
and rural India –– the presentation might appear to offer a linear approach to S&T and innovation where
inputs processed through a black-box offer the desired output. The complex of Indian S&T, however, is not
amenable to such simple linear flows. This Report thus is crisscrossed with mentions of resources of skills,
for example, at the putative input stage, black-box system phase as also in output phase. Similarly finance or
output appears in multiple locations where output becomes an input or output becomes an indicator of
capacity and capability.
For convenience of a reader the Report presents a ready-reckoner on nearly all aspects of Indian S&T.
Contributors refrained from highlighting achievements and presented in each case syntheses of previous
research on that subject as- is done in a review of the state-of-art, while not loading a contribution at all with
academic footprints. This document is targeted at a wide readership ranging from policy makers and advisors
to academic readers as well as the common person.
This map of Indian S&T therefore captured facets of human resources, for example, with greater emphases
on issues of quality, performance right from high school, access, migration, vocational education or specialized
education including the investments the country has been making. Similarly, the subsequent theme took up
financing of S&T by multiple agencies especially post-liberalization, in multiple areas including on higher
education and specific areas of research, distributive dimensions of financing, the investments in R&D and
on S&T, definitional ambiguities, issues of funding related to coordination and governance.
The third theme takes up structures and thus the infrastructure of S&T in the country. Laying great emphasis
on hastened investment needed in S&T infrastructure this theme looks into the relation of governance with
the structure. It brings out issues of coordination, the complex web of Indian S&T structures, description of
sector targeted structures and policy instruments in particular on high technology areas, the S&T parks, the
structures of technology transfers, and similar others. The S&T structure diffuses into the public space
where science is talked about and with brief exposures the media presence of S&T, and the access to S&T
resources have been presented. The next theme on industry and S&T begins with the macro view and then
looks into economy-wide and inter-sector aspects of technological changes, and high technology trade. This
theme looks further into two dimensions of S&T interfacing with industry: first mode captures the R&D and
the second mode presents non-R&D aspects. On R&D including on data capture and definitions this theme
presents the impact of policy instruments that are primarily fiscal in nature. The non-R&D dimension asserts
that for a developing country the productivity raising aspects of innovation are important and a detailed
sector wise map gets presented. Further down this theme are issues of specific sectors, achievements of
fund-based technological changes as in textiles, and then other sectors of telecommunication, biotechnology,
pharmaceuticals, automobiles, biomedical offer instances of learning’s from Indian S&T sector policies.
The fifth theme is about tangible outputs from the S&T system. Detailed analyses offers pictures of publications
and patents, the two most central forms of outputs, and offer glimpses into regional achievements, agency
wise evaluations, inter-country comparisons and research collaborations, and sectors where the country has
been performing. The patent picture similarly offers a look into post-liberalization activities, and dips into
sectors such as biotechnology or information and communication technologies; and finally glosses on the
capability of this country to appropriate its knowledge assets. The last theme is related to S&T for rural
areas. Contributors consciously refrained from delving into S&T for farming. The focus is on non-farm
areas and particularly on manufacturing generative as well as agriculture-integrative areas where S&T can
quickly but sustainably, offer scopes for income and employment generation, asset generation and resources

regeneration. Beginning with mapping out rural off-farm potentials this theme looks into aspects of low cost
housing, farm implements and hand tools, fisheries, mushroom, horticulture, tiny scale manufacturing,
biopesticides, sericulture, and similar others. Brief discussion on public programs and schemes and policy
mechanisms offer a look into the preparedness of the country to bring into the developmental fold most of its
poor people.
Endnote
This printed version is about one fourth of the full Report, available at http://www.nistads.res.in/; and this is
the first of its kind from this country. An earlier attempt was made by the INSA and was undertaken at the
NCAER. The present Report is the first in this series. There are plans to bring out similar reports regularly
at two year intervals in future.

S&T Human Resources 1
S&T Human Resources
Overview
The role of S&T human resources in innovation and in the economic growth of a country cannot be disputed.
Skilled and educated, innovative and creative people remain the most important engine of growth. This
assumes greater importance for India, with the world’s largest number of young to be educated and where
knowledge-economy is being considered fundamental to the path of progress or the key to economic growth.
S&T manpower includes artisans, technicians and technologists, researchers, educators, and managers. In
addition, many others use their skills in a variety of nominally non-S&T occupations (such as writers, salesmen,
financial managers, and legal consultants), and many niches in the human resource market require them to
interpret and use the S&T knowledge. Two dimensions of human resources remain crucial: quantity and
quality. Most importantly, what policies and institutions could induct ever larger numbers of people into the
fold of S&T happens to be the cardinal issue.
A very large number of potentially school-going children, demands near astronomical expansion of educational
capacity right from pre-school level to doctorate level. At present the proportion of school-goers finally
finishing higher education and in particular doctorates is astonishingly small. Capacity creation remains
therefore the key policy imperative. With only a very large number of educated persons this country can
take to the path of knowledge based growth. This implies that the quality of education must remain at least
modestly high and also contemporary. A moot question would then be what mode of accretion of capacity
engenders quality; could these two dimensions be woven together! Further, the advanced society of the
future would require advanced and contemporary knowledge. Mere addition to the stock might not meet the
expectations of the future unless quality is hastened and contemporaneity gets ensured. Given the fact of
longer expected lifespan, the country’s policies on education must also look into the dynamic capability of
social and production systems to keep a person engaged meaningfully for no less than five decades. Our
current policies take care of only the first two and a half decades of the life of a person.
There is a shortage of S&T staff, in India. There is also a decline in the number of students opting for
science as career at higher secondary schooling, college and higher education levels. Shortage has multiple
dimensions: gap in quantity that is serious; gap between demand and supply of skill types; gaps in quality;
gaps existing in continuous learning including on-the-job; gaps in social institutions that can monitor and
redirect schooling at all levels; and of course gaps created through outflow or cross-sector flows of the
skilled and educated.
This theme starts with a description of the Indian state-of-affairs, underpinning generation of human resources,
through the enrolment pattern at different educational levels. This reflects upon the structural and institutional
capacity. The subsequent discussion on vocational education looks at the structure of vocational studies in
India, the premier institutes imparting training and new initiatives in the 11th Five year plan. Thereafter the

S&T Human Resources2
description is on educational infrastructure, highlighting the distribution across states. Then students’
performance in sciences at secondary/higher secondary levels is analyzed. Private investment in the education
sector in the post 90’s has resulted in a number of private educational institutions; however, the quality of
education might not have improved. The following parts look into interstate (secondary level) and international
migration of students respectively. The next discussion looks into measures to promote basic science. It
analyses the functioning of some schemes implemented by the government to promote basic science.
Subsequently, higher education and research training in S&T areas has been captured through data on the
production of doctorates. Subsequently an overview of generation of medical manpower in India and then on
gender dimensions, in recognition of the role gender plays in shaping scientific careers in India, have been
discussed.
The full text of these extended summaries is available at http://www.nistads.res.in

S&T Human Resources 3
Pattern of Enrolment at Different Educational Levels
Here the status of enrolment at various levels of education in India is presented. The information and data is
gathered from different sources. Figure 1-01.01 indicates that 44% of children (5-14 yrs) are unable to reach
up to the school level education. Till the middle (standard 8th) level the drop out becomes 78% of the total
population. The situation becomes more critical at UG and PG levels with 92% and 97.5% dropout, respectively.
At PhD level the total strength is a meager 0.02% of the total population.
Enrolment Trends at Different Levels
At primary level, enrolment of male and female students as a percentage of total enrolment is depicted in
Fig 1-01.02. It is clear that the enrolment was around 76% in 1991 and stands at 81% in 2007, which means
Secondary

S&T Human Resources4
a very small annual growth rate of 0.36%. In case of female students, the rise is more than for male
students, as it was 66% in 1991 and touched almost 75% in 2007 with a growth rate of 1.32%. At secondary
and higher secondary levels, the gross enrolment for males was nearly 12% in 1991 and rose to 19% in 2007,
with an annual growth rate of 2.6%. For females, though in 1991 it was only 6.53%, but it increased substantially
to 15.6% in 2007, with a growth rate of 5.25%. The overall growth rate for secondary remained at
3.6%. However, growth of male and female students as percentage of total enrolment is nearly static
(Fig 1-01.03).
At UG level the enrolment was 5.6% in 1991 and it increased to 8.3% in 2007, with an annual growth rate
of 2.34%. At PG level the enrolment was about 1.71% in 1991 which increased marginally in 2007 (2.6%).

S&T Human Resources 5
Discipline wise break-up of enrolment in higher education as percentage of total enrolment is given in Figure
1-01.04. It is optimistic that science is still the second choice of the students after humanities. It is interesting
to note that engineering is growing rapidly while law has declined over the years. Veterinary science is the
least preferred discipline for higher-level education. The status of overall doctorate students was very low,
as only 0.0186% students enrolled for Ph.D. in 2003 and 0.0339% in 2006, as percentages of total school
going population. Moreover, Ph.Ds produced in natural sciences are declining while Ph.D. in agriculture
discipline depicted a sharp growth after the year 2000. Ph.D. production in engineering is almost static, while
it is the lowest in medicine.
The key observations from Fig 1-1.05 to Fig 1-1.08 are as follows:
B.Sc.: Almost 78% of the students fail after entering B.Sc. levels in science. Therefore 22% is the passing
out population, which is eligible to go to next level of education; i.e. M.Sc. level.
M.Sc.: The second set of trend shows only 15% of UG entrants get admission into M.Sc. courses; which
means 7% do not enroll. This may be attributed to the fact that most of B.Sc. pass outs eventually join the
workforce thus never entering into M.Sc. level. Second trend (green hatchet line) shows the passing out
population at M.Sc. level. It is approximately 5% of the total enrolment at M.Sc. level. Out of this 2.8 % are
males and 2.15 % are females. This corresponds to 10% failure or dropouts at M.Sc. level.
Ph.D.: Approximately 4.0% of total at B.Sc. level get into Ph.D. level, which corresponds to a very high
success rate from M.Sc. pass outs becoming Ph.D. aspirants. It also shows that 2.45 % corresponds to
males and 1.54 % corresponds to females. Further, Uttar Pradesh and Maharashtra are the leading states in
producing doctorates while Tripura and Sikkim are least productive. In basic sciences Osmania University,
University of Calcutta and Aligarh Muslim University are the leading universities. Similarly, IIT Madras, IIT
Delhi and IIT Bombay are three leading IITs, which produce maximum number of Ph.Ds.

S&T Human Resources6
Pattern of Enrolment in Professional Courses
Enrolment in engineering at diploma level as well as at degree level has increased very fast after the year
2005. It is also observed that female enrolment is constantly increasing at degree level, contrary to diploma
level. Break-up data shows that Automobile engineering remained at the top with the highest Diploma to
Degree ratio, though it has shown sharp decline after the year 1991. Metallurgical engineering remained the
second most sought after branch after automobile engineering, with an increasing ratio. This shows that
material science may be one of the emerging branches in the coming years. Textiles engineering remained

S&T Human Resources 7
at third position followed by Civil, Electrical and Mechanical engineering. Statistically, Andhra Pradesh and
Tamil Nadu are top two states producing maximum number of engineers in the country followed by
Maharashtra, Karnataka and Uttar Pradesh. In the Northeast, Sikkim is the least engineers producing state.
In medical education Karnataka and Maharashtra are the leading states in the country, whereas Arunachal
Pradesh is at the bottom. Total enrolment in medical education increased after 1990, which may be due to
the entry of private players in higher education. It is also interesting to note that most of the students pass
their examination in medical stream.
VVVVVocational Education in Indiaocational Education in Indiaocational Education in Indiaocational Education in Indiaocational Education in India
Vocational education enables gaining skills and experiences directly linked to a career in future. Distributed
over several tiers, vocational education gets offered at school or for drop-outs, and at post-schooling, and
sometimes on-the-job. Both public and private provisioning prevails in the country. After finishing the course,
students are often offered placements in jobs. Vocational trainings in a way give students some work related
experiences that many employers look for. Two major gaps could be noticed: quality and mismatch. Because
of poor quality or mismatch with market demands certain skill sets trained at vocational centers suffer from
poor placement. According to a National Sample Survey Organization (NSSO) report (No. 517, 61st round,
2003) two types of vocational trainings are available in India: a) Formal and; b) Non-formal. Formal vocational
training follows a structured training programme and leads to certificates, diplomas or degrees, recognized
by State/Central Governments, Public Sector and other reputed concerns. Non-formal vocational training
helps in acquiring some marketable expertise, which enables a person to carry out her/his (often ancestral)
trade or occupation. In a way through such non-formal vocational training a person receives vocational
training through ‘hereditary’ sources. Often ‘Non-formal’ vocational trainings are also received through
‘other sources’. In such cases trainings are received by a person to pursue a vocation which is not ancestral
and is different from the trade or occupation of his/her ancestors. Data and graphs used here are all indicative
and not exhaustive.
Vocational Training in India is imparted mainly by two types of bodies: Public Industrial Training Institutes
(ITIs) and privately owned Industrial Training Centers (ITCs).
The main training schemes are the Craftsmen Training Scheme (CTS) and Apprenticeship Training Scheme
(ATS). In addition some other training schemes are also provided by DGE&T. There are about 5,114 Industrial
Training Institutes (ITIs) imparting training in 57 engineering and 50 non-engineering trades (Planning
Commission). Of these, 1,896 are State Government-run ITIs while 3,218 are private. The total seating
capacity in these ITIs is 7.42 lakh (4 lakh in government ITIs and 3.42 lakh in private). Figures 1-02.01 to 03
represent the detailed information on the number and capacity of ITIs/ITCs. A number of vocational training

S&T Human Resources8
institutes are being run by private training providers. The formal training system of India starts at Grade 8
and above. According to ILO, the DGE&T’s skills development competes with other formal and non-formal
programmes, such as higher vocational schools (10 plus 2 stream), colleges, polytechnics, etc. The share of
ITI-based training seems to capture around 10-12 per cent of the total number of school graduates at
Grade10.
Other Premier Organizations Providing Vocational Training (Govt. and Non-Govt.)
• Khadi and Village Industries Commission (KVIC) which provides EDP and Khadi Village Industries
training
• Tool Room & Training Centres (DC, MSME)
• Provisions through the National Manufacturing Competitive Council (NMCC)
• CAPART (Council for Advancement of People’s Action and Rural Technology)
• SRI, Ranchi (Society for Rural Industrialization)
• Ramakrishna Math and Ramakrishna Mission centres and many more.

S&T Human Resources 9

S&T Human Resources10
From these figures it may be concluded that Tamil Nadu holds the majority stake in private owned vocational
institutes and Maharashtra for Government owned vocational institutes.
Communities Trained by KVIC and its Major Activities
Rural Employment Generation Programme (REGP) is the flagship programme of KVIC. The main objective
of this programme is to generate employment in rural areas by setting up of new village industries (except
negative list) availing loan from the banks and margin money (middle end subsidy) from KVIC. Prime
Minister’s Employment Generation Programme (PMEGP) is a central sector scheme to be administered by
the Ministry of Micro, Small and Medium Enterprises (MoMSME). The implemented body will be Khadi and
Village Industries Commission (KVIC), a statutory organization under the administrative control of the
Ministry of MSME as the single nodal agency at the National level. At the State level, the Scheme will be
implemented through State KVIC Directorates, State Khadi and Village Industries Boards (KVIBs) and
District Industries Centres (DICs) and banks. The Government subsidy under the Scheme is channelized
through KVIC with the help of identified Banks for eventual distribution to the beneficiaries/entrepreneurs
in their Bank accounts. The implementing agencies are KVIC, KVIBs and DICs will associate reputed Non
Government Organization (NGOs)/reputed autonomous institutions/Self Help Groups (SHGs)/National Small
Industries Corporation (NSIC)/Udyami Mitras empanelled under Rajiv Gandhi Udyami Mitra Yojana
(RGUMY), Panchayati Raj institutions and other relevant bodies in the implementation of the scheme. Here
training formally or informally plays a crucial role for success of the schemes.
School – A Part of Vocational Education – A Brief Statistics
Other than ITI/ITC several Government and private bodies are equally important for the vocational
training system in India. They are the following: Schools also provide vocational training formally at 10
and 12th level. The following figure shows the percentage of the stake of all major states, provide vocational
training in India.

S&T Human Resources 11
It is observed that the above states like Maharashtra, Punjab, Orissa Tamil Nadu etc. are holding most of the
stake in number of schools which imparts vocational training. Schools have an important role on vocational
studies because one can start it from his/her schools days. More coverage in school with proper infrastructure
can create a large technical group in future which is now lagging behind.
Paramedical Practitioner Status in Rural India
From Fig 1-02.06 it is clear that out of 3,15,746 paramedical workers in rural India, 47% are female health
workers. But extension workers are hardly 1%. We also need to focus on the availability of Radiographers,

S&T Human Resources12
Pharmacists and Laboratory Technicians for rural India. To disseminate knowledge of basic health facilities
we need to train more paramedical workers for rural India.
Major Initiatives taken in 11th Five Year Plan
The Eleventh Plan has taken the initiative to launch a National Skill Development Mission that may bring
some changes in ‘Skill Development’ programmes. The Mission will be operative under Prime Minister’s
National Council on Skill Development (under the Chairmanship of Prime Minister) for apex level policy
directions, a National Skill Development Coordination Board, and a National Skill Development
Corporation/Trust involving many separate and service sectors. The State governments will emphasize
their Departments/Agencies into a State Skill Development Mission. The chosen private sector (mainly the
twenty high growth sectors) will be an important part as the private arm of the Mission with an outlay of Rs
22800 crores.
The National Skill Development Corporation will be constituted as Government Equity with a view to obtaining
about Rs 15000 crore, the public and private sector, and bilateral and multilateral sources for the promotion
of skill development and act as a non-profit company under the Companies Act with appropriate governance
structure (board of directors being drawn from the outstanding professionals/experts).
The National Commission for Enterprises in the Unorganized Sector (NCEUS): It has been set up as
an advisory body for the informal sector to bring about improvement in the productivity of these enterprises
for generation of large scale employment opportunities on a sustainable basis, particularly in the rural areas.
(details available at: http://nceus.gov.in).
Public Private Partnership (PPP): Major emphasis was given on the PPP mode in the Eleventh Five Year
Plan. It focuses on the following:
• Private Investment in Skill Training.
• National framework for domain specific standards and common principles.
• National database for location wise availability (and shortage) of skilled personnel will be
established.
• The system should provide the options of multiple entry and exit points and total mobility
between vocational, general and technical streams.
• Special emphasis on economically weaker sections.
• To overcome regional disparities due to diverse socio-economic factors, VGF approach
would be adopted to address regional imbalances through PPP.
Key Issues
• The structure of the job market is changing. Training courses lack focus at on-the job market. As a

S&T Human Resources 13
result, and as various reports suggest, the number of students is declining for long term vocational
courses,
• The job creation should be done regionally, not centrally, otherwise it creates regional imbalance of
trained manpower.
• Funding for the public ITIs in India is very low, whereas other countries like China, USA have a
special fund for this purpose and part of fund can take care of restructuring vocational training
systems in order to achieve international quality. In the 11th five year plan National Skill Development
Mission has been introduced, which is a welcome development.
• ITI’s must focus on low-literate youth and unorganised sector.
• Accountability and training supply management are also major problems for ITI’s, which need to be
tackled head on.
• Policy focus on the paramedical vocational studies might be important, particularly for rural areas.
• A central vocational training standardization system, accredited nationally and globally, for maintaining
the quality of the vocational education would be beneficial.
• Bridge organizations linking R&D institutes with the vocational education system might help the
vocational trainers and trainees to remain contemporary and act as grass root entrepreneurs.
• Vocational courses need to be made part of the school curriculum.
Educational Infrastructure in IndiaEducational Infrastructure in IndiaEducational Infrastructure in IndiaEducational Infrastructure in IndiaEducational Infrastructure in India
Education is a principal input to economic growth and investment in educational infrastructure remains a
critical indicator of expansion and improvement in quality of education. India has a large school going population,
therefore a strong educational infrastructure is required in order to accommodate the entire school going
population, and also to keep pace with the developing economy and provide it with quality manpower. A
related issue is about the institution of education and development of skill, which together constitute the
institution for an economy based on increasing return, immense connectivity and mobility. Infrastructure is
indicative of both physical organization and the institution.
Today Indian education requires more investment. This can lead to good quality infrastructure and education.
In 1961-62, public expenditure in educational sector was 1.52% of the GDP, which increased to 3.68% by
2004-05 (Fig 1-03.01). At elementary level the expenditure was 1.78% of GDP in 1990-91, which marginally

S&T Human Resources14
went up to 1.89% in 2004-05. Fluctuating trends were observed for secondary and higher secondary level
education. The expenditure on secondary/higher secondary level education was in the range 1.13 to 1.11%
of GDP during 1997-1998 to 2004-05. The expenditure on higher education, as percentage of GDP was
0.77% in 1990-91, which decreased to 0.62% in 1997-98 and then rose slightly to 0.66% in 2004-05. Similarly,
when compared to other sectors, the share of expenditure on elementary education to total expenditure on
all sectors was 6.19% in 2004-05, while on higher secondary education it was 3.85% for the same period.
Maharashtra and Uttar Pradesh are at top in enrollment, whereas A&N is at the bottom. Also pupil teacher’s
ratio (PTR) is very low in India as compared to developed nations, which needs to be improved. PTR is
pathetically poor at primary level and upper primary levels, figuring 46 and 34 respectively. However, it is
comparatively comfortable for higher institutes (PTR-25).
Years
1940 1950 1960 1970 1980 1990 2000 2010 0
100000
200000
300000
400000
500000
600000
700000
800000
900000
Number of Insti
0
2000
4000
6000
8000
10000
12000
Primary Schools Upper Primary Secondary/Senior Sec Gen Colleges Professional colleges (Engg, Med) Universities
Fig1-03.02: Growth of recognized educational institution from
1950 to 2004
Source: Selected Education Statistics, MHRD
1960 1970 1980 1990 2000 2010 0
250000
500000
750000
1000000
1250000
1500000
1750000
2000000
2250000
2500000
2750000
3000000
0
2
4
6
8
10
12
14
16 Total expenditure on
Total expenditure all GDP at current price
(1993-94) % Education Exp to
% of edu. Exp. To Estimates
Fig 1-03.01: Break-up of total expenditure
Source: Author

S&T Human Resources 15
Since enrolment at all educational levels is increasing, so to accommodate increasing students more educational
institutes are indispensably required. Both public and private agencies manage educational institutes; however,
government agencies manage more institutions than private agencies. Government and local bodies organize
more than 90% primary schools, whereas private agencies owned a small fraction of total schools and their
contribution was about 9.79% in 2004-05. In the case of Secondary/ Senior Secondary levels the growth of
institutes under different management bodies has also increased continuously. Since 1973-74, percentage of
government Secondary/Senior Secondary schools has increased from 26.5% to 33.1% in 2004-05. It is
apparent from the Figure 1-03.02 that number of institutes increased very fast after 1990-91. It may be due
to the new economic and education policy, which allows private partners in the educational field. According
to the Department of Higher Education during the period 1950-51 and 2004-05 the number of Primary
Schools increased by 3.66 times, while the Upper Primary Schools and Secondary/Hr. Schools increased by
more than 2.0 times each. The major growth took place in general education and professional education,
which is around 28 and 15 times respectively. Similarly, universities have also registered significant growth
after private investment was permitted. It is important to note that since 2001-02, number of Universities/
Deemed Universities has increased more rapidly as compared to other educational institutions. During this
period, Primary Schools increased by 1.2 times, Upper Primary Schools by 1.3 times, and Secondary/Senior
Secondary Schools by 1.1 times. Consequently, in higher education, colleges for general education increased
by 1.3 times, while Universities increased by 1.5 times. For higher education there were 407 universities
including deemed universities and institutes of national importance.
Performance in Sciences at SecondarPerformance in Sciences at SecondarPerformance in Sciences at SecondarPerformance in Sciences at SecondarPerformance in Sciences at Secondaryyyyy/////
Higher Secondary LevelHigher Secondary LevelHigher Secondary LevelHigher Secondary LevelHigher Secondary Level
Post 90’s witnessed a structural change in education. Private investment was allowed in the educational
sector. Consequently, a number of private educational institutions were established which increased the out
turn of students, although quality of education, some skeptics aver, has been declining. This may loosen up
competitiveness in education, particularly in science education which may in turn be disadvantageous for
Indian science and technology (S&T). To compete globally, quality and better performance in science education
is imperative. Therefore, a brief picture of performance in basic sciences viz. physics, chemistry, mathematics
and biology at the 10 years and 12 years schooling levels is presented in this section. Due to constraint of
adequate statistics, the review is confined to Central Board of Secondary Education (CBSE) and some state
boards.
Performance in CBSE (2007)
After independence, an economic development model was set up with the emphasis on science and technology.
Consequently in schools, science education received special attention in order to generate science professionals
and thereby better scientists in the country. However, studies show that over the last decade priority for

S&T Human Resources16
science is declining both at school and university levels whereas enrolment in other disciplines is increasing.
It is a matter of concern and if the trend continues for a long time consequences may be adverse. So, policies
should encourage students to opt science at secondary level. School education is the foundation of creativity
and skill development; therefore, this section deals with the performance of science students at secondary
level of the Indian education system. The information is gathered from CBSE. Fig 1-04.01 shows the
performance of those securing greater than 90% marks, greater than 75% marks and greater than 50% in
CBSE examination. Computation indicates that Physics and Chemistry are the most preferred subjects followed
by Mathematics and Biology in the science stream at 12th level, however, number of students clearing these
streams are more than from streams with Physics and Chemistry. In addition, more students score above
90% and 75% score in mathematics and number of students scoring more than 50% marks was more in
Chemistry followed by Physics and Mathematics.
Fig 1-04.02 represents comparative performance between science and non-science disciplines. It shows that
a larger fraction of science students score more than 90% among overall pass out students. Same trend can
be noticed for number of students scoring more than 75% and 50% marks. In all three categories (90%,
75% and 50%) male students dominate over female students. It is interesting to observe that in the case of
non-science stream the scenario is reversed where female students dominant over male students in all three
categories (90%, 75% and 50%). It was found that in CBSE board, science students prefer combination of
physical education, followed by computer science and painting at 12th standard level. It was estimated that
nearly 47% students opted physical education followed by computer science (24%) in the year 2007.
Accountancy is the least preferred subject among science students. Data indicates that more students opt for
science subjects than non-science subjects though percentage of passing out students in science subjects is
less than for non-science subjects.
Also, in CBSE board it was observed that intercity performance was identical at 12th standard. However,
students from Ahmedabad, Chennai, Jaipur and Kolkata and Bhopal are performing better in mathematics,
whereas in physics and chemistry performance is more or less same in all cities. Conversely, students from
Agra, Hyderabad, Vizag and small towns are performing better in Biology.

S&T Human Resources 17
Performance in State Boards (2007)
Based on the information gathered from 8 states namely UP, Punjab, Bihar, Manipur, MP, Maharashtra, Tamil
Nadu and Goa for secondary and higher secondary state boards following inferences regarding performance
in physics, chemistry, mathematics and biology (PCMB) may be drawn (Fig 1-04.03 to 1-04.06):
• Share of students appearing in PCMB has declined over the years in UP, Goa and Manipur; the declining
rate is highest in Bihar, whereas in Manipur, Tamil Nadu, Punjab and MP there is no much change.
• Percentage of students appearing in PCMB in UP, Bihar and MP is about 40% whereas in Punjab and
Goa about 20% students appeared in science stream.
• In Tamil Nadu and Manipur, more than 60% students appeared in PCMB in the year 2007.
• Passing and scoring 50% marks is relatively constant except Bihar showing continuous declining
trends while in Manipur it is increasing.
Further, performance in mathematics subject in UP, Bihar, Manipur, Maharashtra, and Tamil Nadu is declining.
It is obvious from the figure that approximately 20% students appeared in UP, Bihar, MP and Maharashtra
whereas less than 20% students opted mathematics in Goa and Punjab. Further, passing out condition is
pathetic in all the 8 states except Tamil Nadu where about 20% students got pass marks while in UP the
situation is worse. The performance in physics, chemistry and biology is similar to mathematics. This is a
matter of great concern as it is surely to affect India's S&T capabilities in future. Therefore, appropriate
measures are required to switch the problem.
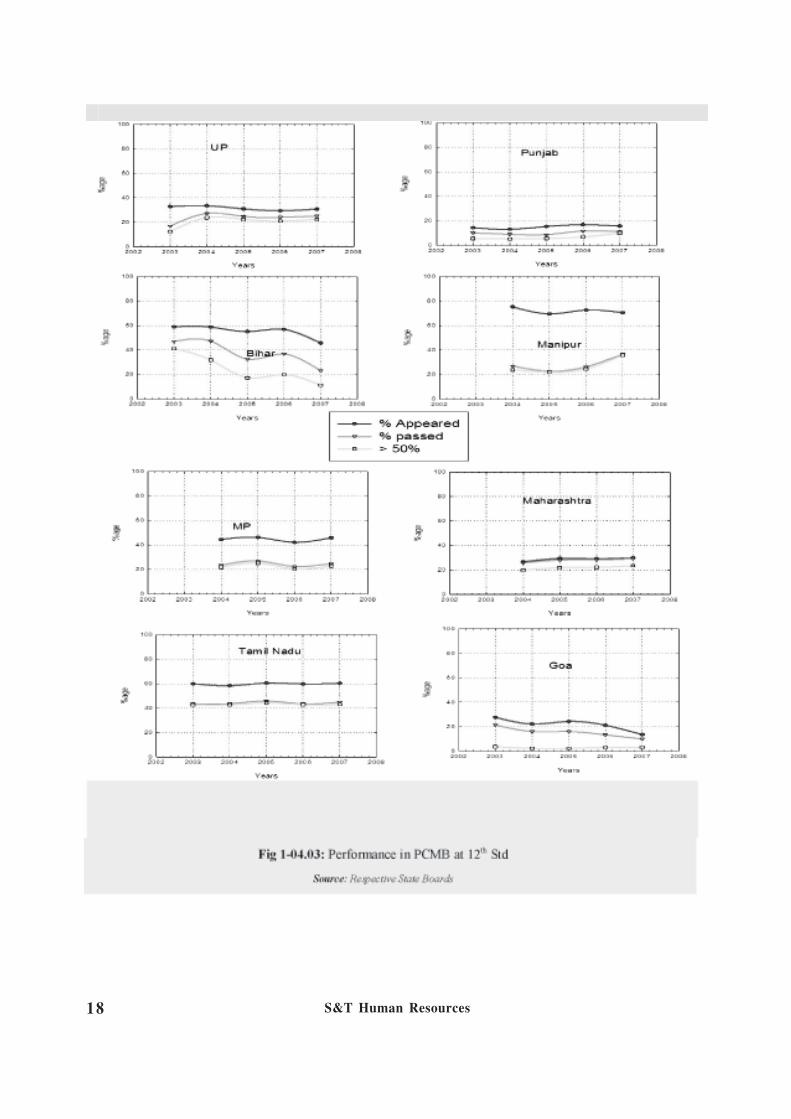
S&T Human Resources18
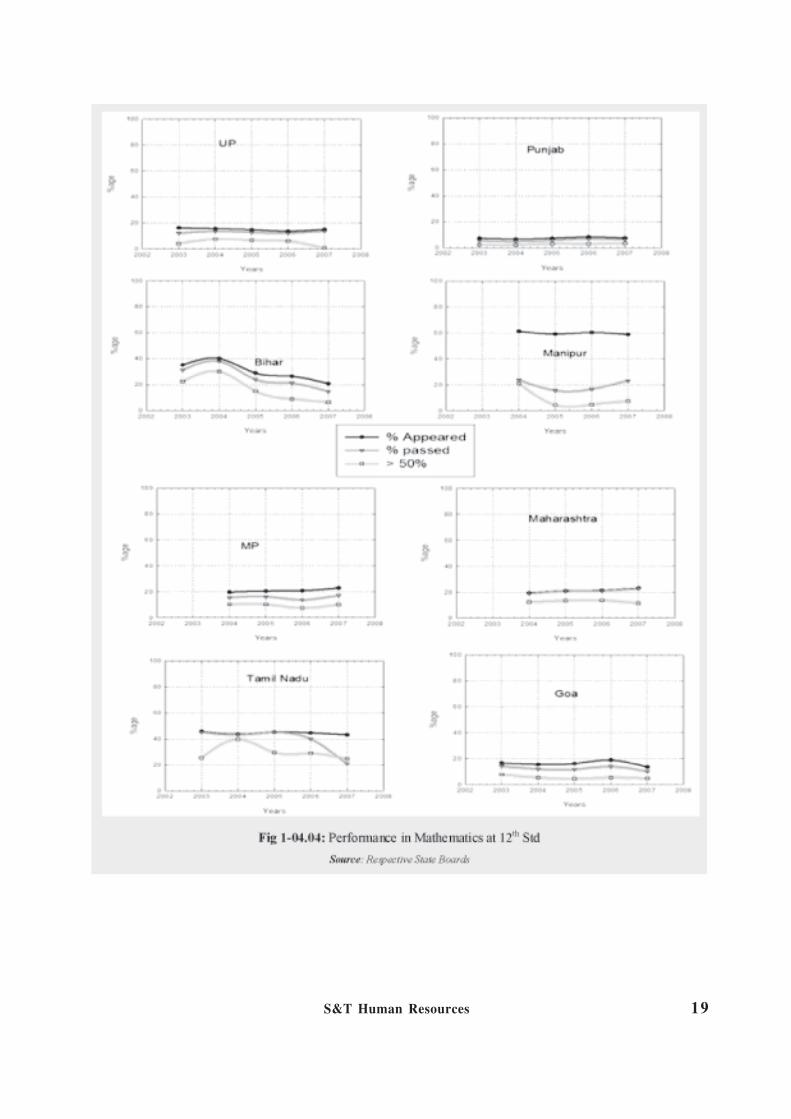
S&T Human Resources 19
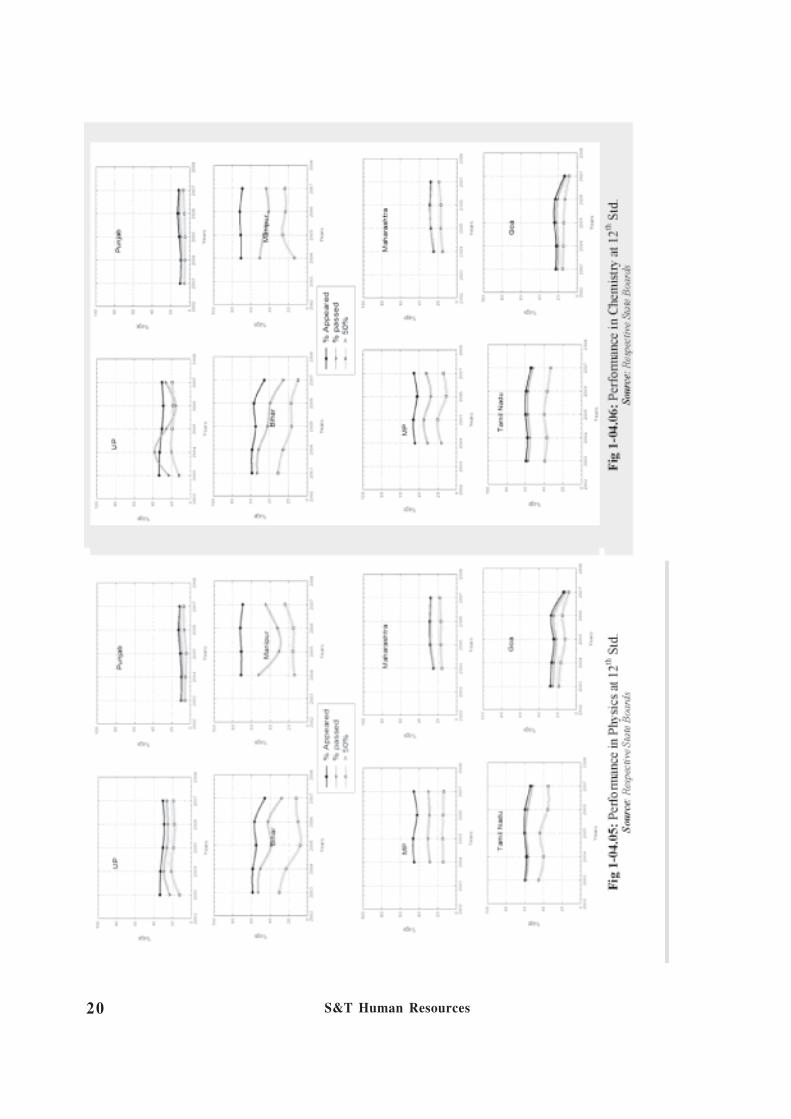
S&T Human Resources20

S&T Human Resources 21
SSSSStttttococococock of Indian S&T Mank of Indian S&T Mank of Indian S&T Mank of Indian S&T Mank of Indian S&T Manpopopopopowwwwwererererer
Here, an attempt is made to look at the stock of Indian manpower in Science & Technology (S&T). In
general, NSF and OECD both include engineers, natural scientists, social scientists and technicians in its
definition of S&T workforce, but in this section social scientists have been excluded. Following fields have
been included in the calculations - agriculture & forestry, engineering, education, medicine (allopathy), dental,
paramedical (nursing), apprentices, science (general) and veterinary science. It is assumed that a graduate or
equivalent remains active participant in the economy for about 35 years or more on average. For graduate
stock calculations, total estimated out-turns for last 35 years (e.g. 1966 to 2000 for getting stock for year
2001) were added. For getting relevant ratio, it was divided by relevant current active population (age group
20-59). For PhD stock calculations, total out-turns for last 30 years (e.g. 1971 to 2000 for getting stock for
year 2001) were added. For getting relevant ratio, it was divided by relevant active population (age group
25-59) of that particular year. Fig 1-05.01 shows the ratio and stock for S&T manpower.
Here it can be observed that over the last few years, rate of growth of highly specialized (PhD) manpower
is much less than growth in graduate S&T manpower. But an added problem is the migration of this manpower
to other countries. Fig 1-05.02 shows the enrolment of immigrant students from India and China in US higher
education system, in absolute numbers and percentages. In this figure it can be noted that in terms of number
of students going to US, a decade back there was significant difference between India and China but now
they are comparable. Similar trend can be observed in case of percentage of having Indian or Chinese
student as compared to all students from the world going to US. Such a share, although, is indicative more of
US immigration policy than of the quality of students. In fact, 2005 onwards, India and China exhibit nearly
same value in percentage.

S&T Human Resources22
According to NSF data of Asian recipients of U.S. S&E doctorates (1985-2005) as discussed in section on
'International Migration of Students', India was 4th in terms of its student getting doctorate degrees from US,
whereas China was at the top with more than double the number of Indian doctorates. If a comparison is
done according to the field between India and China, it can be seen here that in engineering, the ratio was
somewhat closer (China: 12,784, India: 8,172) but in science, number of Chinese students was far ahead
(China: 28,893, India: 10,540). Overall, performance and perhaps enrolment of Indian students in biology,
mathematics and physical sciences were very poor; only in computer science India fared relatively better. In
engineering subjects Indian position was not as bad as in biology and mathematics. Assuming that immigrant
stock is a resource, Indian resource in the USA is far less than what a small country such as Taiwan or Korea
could boast. Mainland China's stock is very large especially in biology. This situation should be indicative of
the domestic institutions. In other words: biology and mathematics, the two generic areas, suffer from poverty
in India. Engineering resources could be secured from USA.

S&T Human Resources 23
Fig 1-05.03 shows the domestic as well as US out-turn of Indian PhD students for the period 1985-2005. It is
remarkable to note that for engineering, the ratio is nearly same for out-turns in US and India. For the year
2005, it is somewhat better, but still the US generates one third of the total out-turn. This should be a matter
of great concern. Even if India can manage to call back half of the doctorate degree recipients in engineering
field, our S&T manpower will be increased greatly.
If attention is drawn to science (Psychology and Social Science have not been included, unlike in the US;
although much part of cognitive and other psychologies belong to hard core areas) subjects, comparison is
shown in Fig 1-05.04. Because of the unavailability of the data of these countries on their domestic out-turn,
the out-turns were compared based on number of doctorate recipients in US. Here it can be seen that, only

S&T Human Resources24
in computer sciences Indian students were slightly ahead of China and other countries. Specifically, Biological
Sciences, Mathematics and Physical Sciences are areas where India is trailing by a huge margin. Hence,
these should be the areas of focus.
To make the comparisons more realistic, the numbers of students were normalized with their active population
(age group 15-59; source: UN Population Data) for the year 2000. Fig 1-05.05 shows the number of recipients
of U.S. science doctorates, normalized by per million persons in home country. Here it can be clearly seen
that in terms of doctorates recipients per million persons, India is far behind Taiwan and South Korea.
Basically, this focuses attention on the serious lacuna in S&T manpower generation and this should be an
area of importance when designing policies for higher education.
IntIntIntIntIntererererer-S-S-S-S-Stttttatatatatate Mige Mige Mige Mige Migrrrrration at Secondaration at Secondaration at Secondaration at Secondaration at Secondary ley ley ley ley levvvvvelelelelel
It has been observed that a few Indian states having better educational infrastructure especially in the
Engineering and Medical education, attract students from the other states at secondary level. In this section
an attempt has been made to find out the link between student migration and the educational infrastructure of
these states. According to data and the information provided by state boards pertaining to students who
appeared in 10th class in 2005 and students who appeared in 12th class in 2007, it is observed that the flow of
students has taken place either into neighbouring states or to states where there is a difference in the
infrastructure. From Table 1-06.01 it may be noticed that some states are more venerable for out-flux of
students. Fig 1-06.01 is indicative of the migration pattern in select states of Rajasthan, Andhra Pradesh and
Maharashtra.

S&T Human Resources 25
Emerging pattern of inter-state-board migration of students is given in Fig 1-06.02. It shows Pearson's correlation
matrix for inter-state migration. Dark colour indicates low level of migration whereas lighter colour indicates
high level of migration.
International Migration of StudentsInternational Migration of StudentsInternational Migration of StudentsInternational Migration of StudentsInternational Migration of Students
Process of globalization has accelerated
international migration of students, particularly from
developing and Sub-Saharan countries to developed
countries. It has provided a global marketplace to
the host countries. According to United Nations
Educational Scientific and Cultural Organization
(UNESCO), students from Sub-Saharan Africa are
the most mobile; about 7% are studying in overseas
universities while only 0.40% students from North
America (the US, Canada and Mexico) go
overseas for higher education. Major share of
international flow of students is from developing
countries, particularly from India, due to such push
and pull factors. Consequently, many countries are
trying to open up markets for foreign students by

S&T Human Resources26
laying emphasis on attracting more foreign students, and maximizing the market potential of foreign study.
India, China may be a major source of education market in future for foreign study. However today, thousands
of students from India are looking towards US, Europe and Australia for higher studies. Although very few
students from developed country regions are coming to Asia. USA has been the favorite destination
for foreign students at post secondary (tertiary) level followed by UK, France, Germany, China, Australia,
and Japan, as shown in Fig 1-07.01.
However, of late, USA's share has been in decline. Despite this US, European Union and Australia host
nearly 81 percent of all foreign students. India, China, Republic of South Korea, Japan and Canada are the
top five countries contributing the largest share of students enrolling in USA, Australia, UK and Canada.
Flow of Students from India and China
India and China are the
major sources of foreign
students to overseas
countries and they have
been contributing
significantly, in particular,
to US research, which aids
USA's global
competitiveness. Science
and engineering are the
choice subjects of the
students from India and
China for their doctorate
degrees studies abroad. A
discipline-wise distribution
of students who got US
doctorates during 1985-
2005 and flow of students
from China and India is
given in Tables 1-07.01 and
1-07.02, respectively.
Simultaneously, the flow of students and scholars into China and India has also begun. Foreigners began
joining Chinese universities for education in late seventies and the number is growing steadily. It was estimated
that approximately 1,40,000 international students were enrolled for higher studies in China by 2005. South
Korea is the largest source of foreign students to China contributing 39.3%. The leading source countries of
foreign students to China and India are listed in Table 1-07.03, India is lagging behind China in attracting
foreign students (around 13,267 in 2005).
Thus, internationalization of education has created a worldwide market for higher education. Therefore,
universities are building links with universities in other countries to enhance their global reach in the area of

S&T Human Resources 27
higher education. Moreover, foreign students are contributing in ample measure to the host country's economy.
According to Open Doors Report (2005), foreign students contributed $13.3 billion to US economy in 2004/
05. US, UK and Australia, anticipating huge market for education, are demanding further liberalization of
trade in cross border education through General Agreement on Trade in Services (GATS). According to an
estimate, students from India to US may get doubled as compared to that from China. China may contrarily
attract more students from US than India by the year 2015 A.D. India must be ready to develop technical
education in order to attract foreign students with possible economic implications.

S&T Human Resources28
Migration of Indians AbroadMigration of Indians AbroadMigration of Indians AbroadMigration of Indians AbroadMigration of Indians Abroad
A large number of Indians have settled abroad. Fig 1-08.01 shows the number of Indian immigrants legally
admitted into the US according to their class of admissions. Others include Refugees & Asylees, Diversity
and Cancellation of removal etc.
As the figure suggests,
largest chunk of Indians
settled in the US have moved
because of employment
based preferences;
sometimes more than half of
total settlements (as in 2005).
On the other hand if Indian
workers who are temporarily
migrating to the US are
considered, their numbers
range from more than double
those of permanent
settlements (as in 1998) to
five times as many (as in
2007). Fig 1-08.02 shows the
number of Indian workers who have temporarily migrated to US, along with their class of admission. 'Others'
include nurses, agriculture workers, industrial trainees and exchange visitors. As can be seen in Fig 1-08.02,
specialty groups and intra-
company transferees form
the major part of the flow. It
shows that Indian workers,
who migrate to US, are
mainly some type of
specialists.
Another country where large
numbers of Indians migrate is
Australia. Fig 1-08.04 shows
the arrival and stock of
temporary residents and
students in Australia. Here,
it can be seen that in case
of Australia, more students
are immigrating as compared
to temporary residents.
Canada is another country

S&T Human Resources 29
which hosts large number of Indians. Fig 1-08.05 shows the entry and stock of Indian workers and students
as temporary residents in Canada.

S&T Human Resources30
The number of students going to these countries were compared with the estimated out-turn of graduate
students in S&T areas (refer section on 'Stock of Indian S&T manpower'). Fig 1-08.07 shows this comparison.
Here it can be observed that percentage of students going to these countries for higher studies has increased
over the years.
Measures to promote Basic ScienceMeasures to promote Basic ScienceMeasures to promote Basic ScienceMeasures to promote Basic ScienceMeasures to promote Basic Science
The major concern of the government and policy makers is the deviation of students from science stream to
other disciplines at higher education level. Hence, policy measures have been taken to increase enrolment at
higher education by initiating several scholarship schemes to attract students towards science. The National
Talent Search Examination (NTSE), Kishore Vaigyanik Protsahan Yojana (KVPY) and Innovation in Science
S&T Human Resources 31
Pursuit for Inspired Research (INSPIRE) are some of them. The former two schemes have been successfully
implemented without significant improvement in science education. The third scheme, which has been
inaugurated in 2008, has advantage over other schemes as its domain is quiet large from school level to Post
Ph.D. level. The brief outline of these schemes is as follows:
National Talent Search Examination (NTSE)
NTSE introduced in the year 1963, by National Council of Education Research and Training (NCERT), is a
national level scholarship program to identify and nurture talented students. Every year 750 to 1000 scholarships
are offered and the scheme is open to the students of Class VIII and Class X standard. These scholarships
are awarded for pursuing education up to doctoral level. The selection is based on a national level competitive
examination comprising the Mental Ability Test (MAT) and the Scholastic Aptitude Test (SAT). A stipulated
number of candidates qualifying these two tests are subjected to a face-to-face interview. The final awards
are made on the basis of composite scores obtained in the MAT, the SAT and the interview.
Kishore Vaigyanik Protsahan Yojana (KVPY)
KVPY was started during 1999 by the Department of Science and Technology (DST), Government of India
to encourage students of Basic Sciences, Engineering and Medicine up to Ph.D. levels to take up research as
a career. The selection is made through national level competitive examination.
Innovation in Science Pursuit for Inspired Research (INSPIRE)
DST introduced in 2008 another ambitious scholarship scheme "Innovation in Science Pursuit for Inspired
Research (INSPIRE)" to promote science education in the country. The proposed scheme INSPIRE includes
three components in different age groups:
(a) to provide Science innovation scholarship of Rs 5,000 for a total of one million young learners of
the age group 10-17, once in their school career, during the next five years for experiencing the joy
of innovations
(b) to provide a mentorship through global icons including 60-70 Nobel prize winners and 150-200
Indian leaders in science through a summer camp for the top 1% performers in the Class X and
XII examination every year for a period of five years
(c) to offer scholarship for doctoral research backed by an assured research career opportunity
scheme for a total of 10,000 young people leaving plus two level, for a period of five years after
their Ph.D. in sciences
This integrated approach will provide a handholding and safety net mechanism for identifying and nurturing
youth with aptitude and talent for research. This scheme is based on identifying early and building the required
human resource base for the country, within the absorption capacity of our current S&T system and R&D
base.

S&T Human Resources32
Higher Education and Research TrainingHigher Education and Research TrainingHigher Education and Research TrainingHigher Education and Research TrainingHigher Education and Research Training
A large part of the science and engineering doctorates out-turn of the country is provided by research
institutions, notably CSIR, DRDO, ISRO and other institutes under Department of Atomic Energy and
similar non-university bodies. Contribution of CSIR alone is quite significant and could be as high as 1,500
doctorates within next few years. Out-turn of doctorates from the university sector is skewed in nature, with
a few major universities (primarily the central universities which receive larger share of financing, have
larger number of faculties and lower student-teacher ratio) producing most of the doctorates. Further, there
are disparities in terms of quality.
Another prevalent problem relates to the recruitments. Not only some of the lesser known universities, even
the reputed institutes like IITs, TIFR and other well known national laboratories, such as the CSIR, face the
competition from corporate recruiters, the global universities and the foreign R&D centers; in all such
organizations including universities large number of teaching/ research positions have remained unfilled.
The country currently is planning to
deploy extraordinary amount of
public resources in higher education
in order to build a large number of
new universities and several new
research establishments. Securing
appropriately trained, highly educated
science and engineering manpower
for this expansion would therefore
prove to be the most critical. It should
not be ignored that the doctorate-level
research and training is being
undertaken in institutions other than
universities as well. Identification of
institutions, which are generators of
knowledge and training in advanced
areas of S&T, would therefore be
crucial.
This section will present data and
analyses on the doctorates from
various universities and research
institutions in Indian cities. First part
deals with the data collected through
case based opinion and the second
part deals with data derived from the
websites of various scientific
institutions in India. Two broad
groups of institutions could be
imagined for simplicity, the 'major'

S&T Human Resources 33
institutions comprise those who receive above-average resources such as the IITs, institutes of national
importance and similar, while the 'minor' institutions represent small and state universities and similar who
receive below average resources. The case data provides examples of instances and might not be exemplar
or cannot be used for estimation.
Fig 1-10.01 shows the employability of persons trained in domestic institutes vis-à-vis institutes in the USA
(interestingly it exhibits a pattern which is quite similar to the pattern being reflected in the website data
discussed in the second part). As only a few persons with doctorates from USA return for employment in
domestic R&D establishments, the picture is overwhelmingly skewed towards both major and minor domestic
institutions. There is also a difference in the pattern of employment.
Fig 1-10.02 describes the city-wise distribution of patterns of employment. It clearly exhibits that non-metropolitan
cities, such as Varanasi, employ more of personnel trained in domestic institutes.
Now we discuss the above findings
in relation to the analyses of data
gathered through browsing more than
thousand homepages of
academicians and researchers on
their organizations' websites. This
data exhibits the trends of
employment by major educational
and research establishments having/
possessing highly educated
manpower. Further, this data informs
us on the employment worthiness of
the manpower generated by the
domestic institutions of higher
learning and research. As most
universities and R&D laboratories do
not maintain websites that provide
access to individual homepages, the
data presented here too is partial and
non-representative. Organizations
we might describe as 'major' include
all IITs, TIFR, IISc, ISI, Bose
Institute, IMSc, and similar others.
The minor organizations will include
those with comparably much smaller
funding support.
Table 1-10.01 exhibits a few distinct
features, and the data, to recall, refers
only to persons employed in institutes
of teaching or R&D: small cities
retain a significant share of masters

S&T Human Resources34
out-turn while at the doctoral studies level the metropolitan cities Bangalore, Bombay, Delhi, Calcutta, Chennai
and a few small cities with IITs such as Kanpur or cities with major universities such as Pune garner the lion's
share. Other universities indeed hold little prospect. Additionally, turnover from minor institutes is small in
quantity. However, for both doctoral and post-doctoral, USA remains the most important geography of schooling.
Few domestic institutes offer post-doctoral training. This data cannot inform us on the actual turnover.
However, partial reflection on the nature of turnover in higher education along with preferences of the public
employers is both exhibited.
Table 1-10.02 offers further insights into quality of research training, employability of trained personnel and
the pattern of employment in most major and a few minor institutions of research and teaching. One may thus
conclude that the major institutions in India appear to be at par with global institutes, if not more preferred, in
turning over employable personnel at both doctoral and post-doctoral levels; however, minor institutes appear
to be more effective in turning over masters' level personnel.
MEDICMEDICMEDICMEDICMEDICAL MANPOAL MANPOAL MANPOAL MANPOAL MANPOWER IN INDIA : AN OWER IN INDIA : AN OWER IN INDIA : AN OWER IN INDIA : AN OWER IN INDIA : AN OVERVERVERVERVERVIEWVIEWVIEWVIEWVIEW
Medical education occupies a crucial position as it provides the country the healers and involves a close and
deep study of life itself and its vital processes. The Indian medical education sector is broadly classified into:
I. The modern system of medicine [allopathy, or Non-Indian System of Medicine (NISM)] and
II. Indian systems of medicine and homeopathy (ISMH) that include Ayurveda, Unani, Siddha and
Homeopathy.
The governance of Medical Education in India is routed through various councils in respective systems. The
Medical Council of India (MCI) and the Dental Council of India (DCI) controls the NISM system,
whereas the Central Council for Indian Medicine (CCIM) and the Central Council of Homeopathy
(CCH) prescribes and recognizes all standards of education in Indian Systems of Medicine viz. Ayurved,
Siddha, Unani Tibb and homeopathic medicine qualifications respectively. The Indian Nursing Council
(INC) and the Pharmacy Council of India (PCI) looks after the nursing education for Nurses, Midwives,
Auxiliary Nurse-Midwives and the pharmacy education up to graduate level respectively. All these councils
are autonomous bodies under the Ministry of Health and Family Welfare.

S&T Human Resources 35
NISM training for doctors in India is provided at several levels. The undergraduate degree, referred to as
MBBS (Bachelor of Medicine and Bachelor of Surgery) is of 5.5 years and the postgraduate degree programs,
M.D. (Doctor of Medicine) and M.S. (Master of Surgery), are of 3 years duration. D.M. and M.Ch are
super specialty programs in medicine after postgraduate education. Similarly, Dental Education in India starts
with the Bachelor of Dental Surgery (BDS) which is a four year course with one year of compulsory rotary
internship. Post Graduate training includes Master of Dental Surgery (MDS). In India, there are 215 dental
colleges offering BDS and 121 dental colleges offering MDS.
Indian systems of medicine and homeopathy (ISMH) that include Ayurveda, Unani, Siddha and homeopathy
is provided by offering degrees like BAMS (Bachelor of Ayurvedic Medicine and Surgery) and BHMS

S&T Human Resources36
(Bachelor of Homoeopathic Medicine
& Surgery). The course duration is 5½
years including one year of compulsory
internship. Post graduate courses
include M.D. in Homeopathy. There
are 98 ayurvedic colleges, 8 siddha
colleges and 40 unani colleges in India
offering different degree and diploma
courses.
Various committees of experts like the
Bhore Committee (1946), Mudaliar
Committee (1962), Chadha Committee
(1963), Mukherjee Committee (1965
&1966), Jungalwalla Committee (1967),
Kartar Singh Committee (1973), Shrivastav Committee (1975) were appointed by the Government of India
from time to time to render advice on different aspects related to health and education. The reports of these
committees have formed an important basis of health planning in India. There was a National debate in 1983
on standards of Health Science Education. An "Expert Committee for Health Manpower Planning, Production
and Management" was constituted in 1985 under Dr. J.S. Bajaj, then professor at AIIMS. It resolved that
there is a need to establish a separate Health Sciences Education Commission at National level at par with
UGC and Unitary Health Sciences Universities in the States.
Accordingly, for the purposes
of affiliating, teaching and
ensuring proper and systematic
instruction, training and
research in Modern System of
Medicine, Homoeopathic
System of Medicine, Ayurvedic
System of Medicine, Unani
System of Medicine, Nursing
Education, Pharmacy
Education, Dental Education, Education on Laboratory Technology, Physiotherapy, Speech Therapy and
Education on other paramedical courses several Universities of Health Sciences have come into existence
since 1986 in different states of India. Table 1-11.01 provides a list of such Universities of Health Sciences
with their year of inception. Such universities hope to foster and develop an intellectual climate conducive to
the pursuit of excellence, either independently or jointly with other centres of excellence of higher learning.
In recent years, India has been through an expansion in the number of medical colleges due to the growth of
private colleges. India, with a population in excess of 1.1 billion, has the largest number of medical schools
within one country (274), with an admission capacity to undergraduate medical courses (MBBS) measuring
31,298 per year. In 1980, there were 112 medical schools in India, whereas in 1994-95 there were 152,
admitting 12,249 students. The figures below are indicative of the fact.

S&T Human Resources 37
Changes have been brought, though not very speedily and effectively. The main concern seems to be to make
quantitative changes. There is a ten-fold increase in the number of medical colleges and the output of doctors.
This has been largely unplanned and has only resulted in a marked increase in output without any thought for
finding rewarding careers for them. This leads to frustration and thus the westward flood. As a result there
is a shortage of health professionals in the country. As per WHO's World Health Report for 2006 the number
of registered doctors in India
has increased from 61,800
in 1951 to about 645,825 in
2005 - that's 0.60 doctors for
1,000 people. The Joint
Learning Initiative, a global
health network launched by
the Rockefeller Foundation
findings suggest that India
has 0.59 doctors, 0.8 nurses
and 0.47 midwives for 1,000
people, which adds up to
1.86 health workers for
1,000 people. The statistics
for the state sector reveals
a pathetic scenario. According to the Union Ministry of Health and Family Welfare's (MoHFW's) Health
Information of India, 2004, the country had 67,576 government doctors: meaning one doctor was serving
roughly 15,980 people. Thus, the current availability of doctors does not meet the recommendations of several
past committees. The government's estimated requirement of specialist surgeons, obstetricians and
gynecologists, physicians and pediatricians in 2001 for community health centers in rural areas is 12,172, but
only 6,617 positions have been sanctioned and 4,124 positions have been filled. An 'Escorts Heart Institute
and Research Centre' document prepared in 2005 said India would need at least one million more qualified
nurses and 500,000 more doctors by 2012. Besides quantity, another criticism is that of neglect of rural and
remote areas and overproduction of highly trained persons with no corresponding increase in gainful
employment. There is a big gap in the distribution of health care personnel over rural and urban areas. The
promotion of medical colleges in the smaller cities in the districts has not made much of an impact on the
distribution of medical manpower. It is time we made a close study of this problem, which is basically a study
of manpower requirements and distribution.
Medical needs of an individual and a community, and mental health needs, disease patterns and prevalence
rates determine the plan for teaching/ practicing institutions. Changes and reorientation should be brought
about to make the education relevant to the needs of the largest group of poor. Proper vocational guidance
could be made available to the medical graduate, so that reliable data and rational thinking precede the choice
of future career. Perhaps, we might even think of a larger share and inputs in public health so that such a
career becomes attractive. To the traditional approach of how to provide clinical cure for individuals, we must
provide for and add care of well defined populations so that the medical student knows how to be useful to the
community at large. Excellence in medical education is not merely a vertical expansion and a set of
achievements. Maximum improvement of health and relief of suffering within available resources should be
our goal. There is thus a clear need to set up innovative models and bring about qualitative changes.
S&T Human Resources38
Gender and Science in IndiaGender and Science in IndiaGender and Science in IndiaGender and Science in IndiaGender and Science in India
Gender has figured in important ways in shaping the careers of scientists for centuries. Science and technology
has been considered 'masculine' for a long time. Gender bias and discrimination in science is observed in most
societies. To address these problems, changes in the society at large are absolutely essential. Science and
society are closely linked and there is need for change within the social processes and the institution of
science.
In the western countries, gender questions in science have been extensively raised. On the contrary, in India
the status of women in science has still not drawn adequate attention. The feudal, authoritarian values and
hierarchy have characterized Indian society. Are these reflected in Indian science as well? There are only a
few reports and studies on gender and science in India. They touch upon issues only in a random manner;
many times analyses have focused on differences, rather than on the inequalities associated with those
differences. Moreover these studies are scattered and there is no systematic mapping of women in science.
The question of women in science in India thus stands out. Some of the questions can be: a) What factors
help women in opting for scientific careers?; b) What are the constraints faced by women in pursuing science
education?; c) Do their career paths change after education?; d) Is the prevailing organizational culture of
scientific research and development institutions suitable to women scientists?; e) How far are existing
government policies for higher/science education gender sensitive and do they promote science education of
females in the country?
This section aims to examine the role of gender as a variable in determining the science careers in India. It
is divided into two sub-sections. The first sub-section deals with gender and education, analyses the available
data on the enrolment of females into various courses in science and engineering. Subsequently, through a
critical examination of the education and science policies, it addresses the current realities of women's
participation in science education/research. The second part will discuss an empirical study.
Historical Background
Modern education for women in India began in the early years of the nineteenth century and by the 1880s
universities started admitting them, Calcutta in 1877-78 and Bombay in 1883. The National Committee on
Women's Education submitted a report in 1959 and expressed great dissatisfaction at the slow progress of
women's education in the first decade of independence. The First to Fifth Plans (1951-79) continued to give
some attention to women but, as a subject of 'welfare'. The shift in the approach from 'welfare' to 'development'
of women could take place only in the Sixth Plan (1980-85). Committee on Differentiation of Curricula for
Boys and Girls, was also established in 1964. Subjects in which women's enrolment increased significantly
during the decade of 1970-1980 are commerce (3% to 16%); Science (18% to 28%) and Education ('36% to
48%).
Incongruities and oppositions can, however, be seen in case of women scientists in India both historically and
currently. Women were, for example, denied entry to C.V. Raman's laboratory. Women's participation has
been limited and confined to junior positions. Only a few women could make it to senior decision-making
positions. Organizational hurdles outweigh so called family constraints; unequal treatment and subtle
discrimination against women scientist and engineers in the behavioral and interpersonal relations also prevail;

S&T Human Resources 39
and the cultural and social context in which science is learned and practiced contributes to the gendering of
science and; discrimination component is much higher in scientific and technical fields in India than among
social sciences and other fields. The prevailing socio-cultural systems in India result in a 'triple burden' for
women in academic and scientific careers. Women in all professions perform a double role of managing job
and domestic responsibilities, which has been commonly referred to as a 'dual burden'. In science, the dual
burden is combined with various problems that are specific to scientific profession. Recently, Indian National
Science Academy commissioned a study to the Research Centre for Women's Studies, SNDT Women's
University, Mumbai to examine the socio-economic and institutional factors that limit women's participation in
science.
Contemporary Data
The participation of girls at all stages of education has been increasing steadily through the years. Table 1
shows the enrolment pattern of women in higher education by faculty/discipline in India over the last few
decades. It is observed that the highest representation of women is in education. Education, to a larger extent,
is considered to be most apt subject for women as it is compatible with other responsibilities of women as
mother and wife. This is followed by disciplines like arts and medicine. Lesser percent of women seem to opt
for fields like engineering. In the field of science, and engineering however it is good to note that, the women's
enrolment is on rise over the years as seen from Table 1-12.02. The participation of women in engineering
has remained negligible till the early 1980s. It is only in the past 15 years that their enrolment has shown an
increase.

S&T Human Resources40
Indian S&T Systems: the Place of Females
In India, a rapid expansion of science and technology has taken place in the post-Independence era.
Unfortunately, very few women have been part of these structures. The latest available data reveals that
in all, there are 41,198 women employed in R&D establishments, which is 13.9% of the total employed in
Fig 1-12.01: Proportion of women and men at different
hierarchical positions
Fig 1-12.02: Gender status of FellowsSource: Indian Academy of Sciences
such establishments. By the nature of
activity, 12% women are primarily
engaged in R&D activities, 11.5% in
auxiliary activities and 17.4% in
administrative activities. 84% of the total
women were employed in the
institutional sector. The majority of them
were engaged in administrative activities
(Research and Development Statistics,
2007). Are women equally represented
at top-tier institutions? Indian National
Science Academy (2004) reports that
the proportion of women in national
laboratories and prestigious universities
is less than 15%, except in the case of
DBT and ICMR where the percentage
exceeds 25%.
Fig 1-12.01 shows that the number of
females becomes lesser at higher
positions in the academic hierarchy. It
reflects the gendered nature of the
prevailing organizational culture of
scientific research and development
institutions.
Not only the poor statistical prevalence
of women scientists of concern, but also
females still do not get equal recognition
in the field of science as illustrated in
Fig 1-12.02.
Government of India, however, has recently taken many initiatives for women's education and for imparting
high level skills to them. Special scholarships and awards have been instituted to attract students in
general and women in particular to the science and technology streams, yet more needs to be done. But
certain things are clear. The extant data does indicate that there exist high wastage ratio of women S&T
personnel and wide gap exists between percentage of women studying science and percentage of women
doing science. We may thus conclude that gender plays an important role in the shaping of scientific
careers in India. Major attitudinal and institutional changes in the structure and procedures are probably
required in Indian science.

S&T Financing 41
S&T Financing
Overview
Innovation, the introduction of new goods, services, or processes contributes to national competitiveness as
well as social welfare. To achieve that goal, S&T is undoubtedly the key driver. In such a context, S&T
financing is the most important factor which plays a major role because the organizations that fund S&T
work, decide how it is done and what kinds of innovations the nation will ultimately produce. This theme
focuses on financial inputs and flows into S&T in the country at the government level (across several
ministries and departments) with special emphasis on some hidden expenditures on S&T which generally
remain untraced. Financing across some select sectors like health and environment has been looked into.
The theme also captures the trend of the private investment in Research & Development and in the area of
high technology trade over several sectors.
Beginning with a detailed examination of the various sources of S&T financing, the schemes and programs
under which financing of S&T takes place and the trends in financing of S&T, this theme then looks into how
financing takes place specifically for two important sectors: ‘health’ and ‘environment’. Subsequently,
investments in S&T and innovation get captured through analyses of multiple forms of expenditures on S&T.
Finally, this theme looks at the trends in high technology trade over several sectors like armament, scientific
instruments, pharmacy and computer office equipments. Between the years 1995 and 2006, India’s share in
global high technology trade has increased marginally from 0.14 percentage points to 0.23 percentage points. The
analysis indicates that India has performed relatively well in the knowledge intensive service industries.
The full text of these extended summaries is available at http://www.nistads.res.in

S&T Financing42
Financing of S&T in IndiaFinancing of S&T in IndiaFinancing of S&T in IndiaFinancing of S&T in IndiaFinancing of S&T in India
Here we describe the pattern of changes experienced in the allocation of financial resources to science and
technology (S&T) at the national and state levels since the beginning of the last decade. Changes taking
place at the national and state levels are delineated in respect of the scope and rationale, objectives and
targets, potential and instruments of allocation of financial resources to S&T in the public and private sector
in India. Changes in the sources, performers and targets of extramural R&D funding are analyzed. The
scope of analysis is confined to understanding the patterns of changes that have especially occurred in the
allocation and utilization of public finance made available for research and development (R&D) and technology
development by the Indian state. The period beginning with nineties has a special significance on account of
the changes occurring on account of the economic reforms in the macro economic situation in India. During
this period, the policymakers expected the sector of S&T to benefit quite significantly from the shift to the
model of market governance being erected for the management of economy, innovation, technology and
science in India.
Financial Resources for S&T
Analysis of the progress of plan expenditure on science and technology allocated to Central Scientific
Departments indicates that most recently an improvement has been experienced in the gross budgetary
support for S&T expenditure vis-à-vis other activities. S&T and Environment activities could receive a
higher priority in comparison with the allocations made to the activities to be undertaken by the Central
Socio-Economic Departments. Table 2-01.01 provides a synoptic view of the comparative trend of increased
percentage of plan expenditure on S&T and Environment, Education, Art & Culture and Health and Family
Welfare when computed in relation to total outlay made available from gross budgetary resources for Central
Plan. But it is also a matter of concern that the plan expenditure on agriculture, rural development and
industry and minerals as a percentage of total outlay on Central Plan has shown a steady trend of decline.
Public Funding of S&T by Scientific Departments in Central Plan: Funds for R&D and S&T in India
flow from three sources: from Central government allocation made through the Planning Commission; from
State governments and the private and business sector. The main performers of research in publicly funded
research organizations are controlled by the six Central Scientific Departments, namely Department of
Atomic Energy; Department of Space; Department of Science and Technology; Council of Scientific &
Industrial Research/Department of Scientific and Industrial Research; Department of Biotechnology and
Department of Ocean Development. The other important performers of research in publicly funded research
organizations are controlled by the Socio-Economic Ministries, namely Ministry of Defence/Defence Research
and Development Organization; Department of Agricultural Research/Indian Council of Agricultural Research;
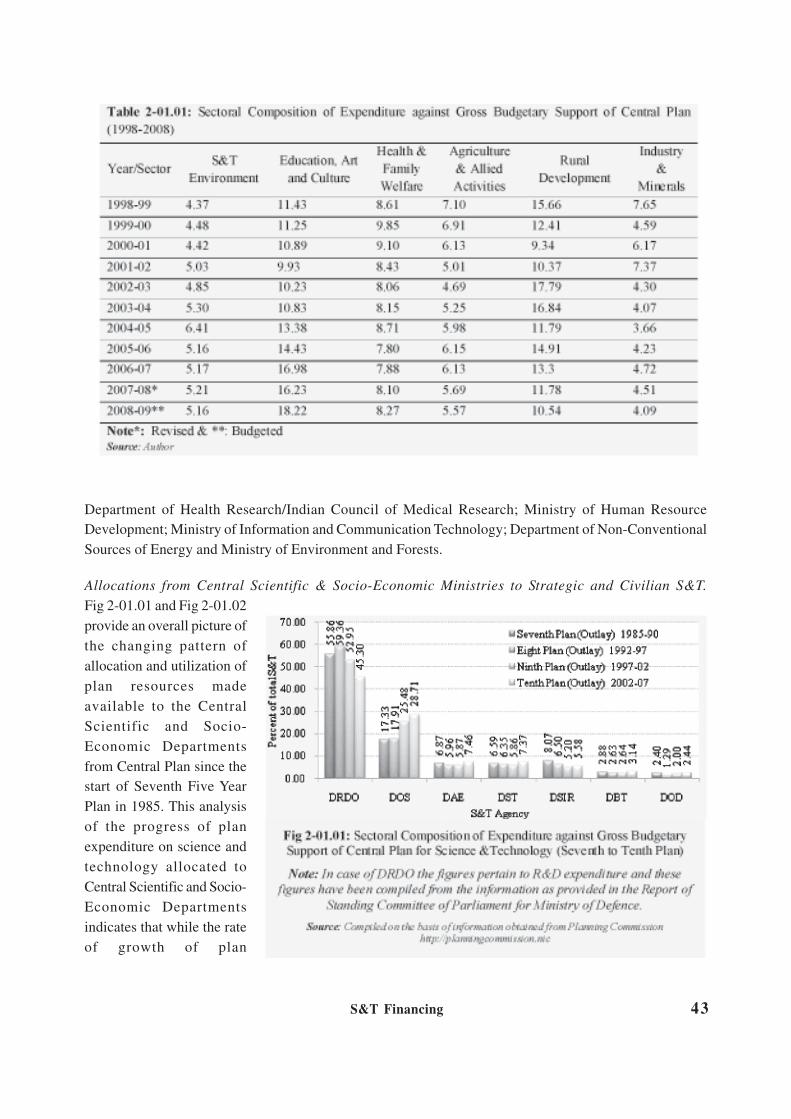
S&T Financing 43
Department of Health Research/Indian Council of Medical Research; Ministry of Human Resource
Development; Ministry of Information and Communication Technology; Department of Non-Conventional
Sources of Energy and Ministry of Environment and Forests.
Allocations from Central Scientific & Socio-Economic Ministries to Strategic and Civilian S&T.
Fig 2-01.01 and Fig 2-01.02
provide an overall picture of
the changing pattern of
allocation and utilization of
plan resources made
available to the Central
Scientific and Socio-
Economic Departments
from Central Plan since the
start of Seventh Five Year
Plan in 1985. This analysis
of the progress of plan
expenditure on science and
technology allocated to
Central Scientific and Socio-
Economic Departments
indicates that while the rate
of growth of plan

S&T Financing44
expenditure of Central
Scientific Departments
has almost doubled with
each plan period since
the start of Seventh Five
Year Plan, a
predominant proportion
of additional resources
have however, gone to
the three strategic
sectors, namely
Defence Research and
D e v e l o p m e n t
O r g a n i z a t i o n ,
Department of Atomic
Energy and Department
of Space.
It is also clear from the
assessment of shares of
civilian and strategic
S&T in the most recent allocations that India’s predominant proportion of R&D expenditure to the tune of
63.8% by the government is consumed by strategic sectors namely, Defence Research and Development
Organization (30.3%), Department of Atomic Energy (12.2%) and Department of Space (21.3%). The
civilian S&T agencies which draw priority in terms of R&D funding concern Council of Scientific and
Industrial Research (9.3%) and Indian Council of Agricultural Research (13.5%) which adds up to 22.8%.
The remaining around 15% of the total central government expenditure is accounted for by biotechnology,
information and communication technology (ICT), ocean development, non-conventional and renewable
energy sources, medical research and environment and forests. It may be mentioned that the least funded
research council continues to be the Indian Council of Medical Research.
Further, this analysis of the progress of plan outlays allocated to different socio-economic objectives indicates
a decline for the sectors of energy and water, information and communication technology, habitat, industry,
mines and chemicals. Furthermore, when we characterize the Gross Expenditure on R&D (GERD) by
objectives, the broad socio-economic objectives constitutes around 32%. The remaining objectives can be
said to be closer to the goals of advancement of science and technology areas and related fields. See Table
2-01.02 for the patterns of changes experienced in respect of R&D objectives during the last decade of the
nineties.

S&T Financing 45
Figure 2-01.03 outlines the trend of allocation of outlay and actual expenditure incurred by the State S&T
departments. In the leading states of Karnataka, Tamil Nadu, Kerala, Andhra Pradesh, Uttar Pradesh,
Madhya Pradesh, Himachal Pradesh, Haryana, Rajasthan and Punjab, allocations made to the state S&T

S&T Financing46
sector have declined in the Tenth Five Year Plan. The states that have picked up are Gujarat, West Bengal
and Maharashtra.
Financial Resources for R&D
The National Expenditure on R&D increased from 18,088.16 crores in 2002-03 to Rs. 28776.65 crores in
2005-06. The projected R&D expenditure would attain a level of Rs. 32,941.64 crores in 2006-07 and
Rs. 37,777.90 crores in 2007-08.
R&D Expenditure as percentage of
Gross National Product (GNP) in
2005-06 was 0.89% as compared
to 0.81% in 2002-03, which is an
improvement over the trend
witnessed earlier during the period
of nineties. See Fig 2-01.04 for the
pattern of changes in the national
expenditure on R&D as a
percentage of Gross National
Product (GNP).
However, when compared with rest
of the world, India still lags behind
the emerging economies of Brazil,
China and Russia in respect of the
R&D expenditure as a percentage of GDP. We have given in Table 2-01.03 a comparative assessment of
the current level of per capita national R&D expenditure in the case of BRIC group of countries which also
shows that the country is spending far less than others on
R&D. Further, even when we compare the evolution of
national R&D expenditure as a percentage of GDP over
time in the case of developed and developing countries, it
is obvious that the momentum is still not encouraging enough
to allow the country to catch up with rest of the world. See
Table 2-01.04 for a relative assessment of the pattern of
change in the level of national expenditure on R&D over
time in the case of both developed and developing countries.
See also Fig 2-01.05 for the latest available figures providing
a comparison of resources allocated to R&D in developed and developing countries.
Pattern of Changes in the Annual Rates of Change of R&D Expenditure: Though in absolute terms the
R&D expenditure has shown an increasing trend, the R&D expenditure as percentage of GNP is failing to
keep pace with the growth of gross national product. The annual rate of change of R&D expenditure
suffered a persistent decline. It declined in nominal as well as real terms. The annual rate of change of R&D
expenditure at constant prices declined from 20% in 84-85 to 1% in 94-95 and from 10.96 % in 96-97 to

S&T Financing 47
6.43% in 2003-04. While the annual rate of change grew somewhat in the latter period of nineties, but the
increases obtained in the rate of growth were not momentous enough to allow the country to catch up in
respect of R&D expenditure with the other emerging economies.
Sectoral Contributions: Although the share of Central Government itself declined from 79% to 71% in
percentage terms, it remains even today a major source of funds for the conduct of R&D activities in India.
Of course, the private sector is certainly a bigger contributor to national R&D expenditure than it was ever
in the past. See Fig 2-01.06 for the details of sectoral contribution of private sector to R&D expenditure over
time.
In 1985-86, the private sector accounted for 12.8% of GERD. It increased to 20.3% in 2002-03 and
witnessed a decline to 19.00 % of GERD in 2004-05. See Table 2-01.05 and 2-01.06 for the evidence of
changes in the pattern of growth of R&D expenditure during the decade of nineties. The share of private
Fig 2-01.06: Sector-wise Growth of R&D ExpenditureSource: R&D Statistics at glance 2007-08, www.dst.gov.in

S&T Financing48
sector is however still fluctuating. Furthermore, the contribution of private sector industry approximately
works out to only 0.15% of GDP. In terms of the significance of increase in the contribution of private sector
R&D expenditure, it may also be kept in mind that today the share of private sector industrial units accounts
for 81.9%.
During the period of reforms, the observed increase in the share of financial support to R&D by private
sector industry is linked to the declining share of financial support to R&D by public sector. There was a
major decrease in the proportion of national R&D expenditure incurred by the public sector. This share was
close to 10% between 85-86 & 94-95, which in 2002-03 was down to the meagre figure of 4.5%. Only
0.26% of Sales Turnover (STO) was spent on R&D in 2002-03 for public sector. Industrial sector as a
whole accounted for 21.8 % of total investment in 85-86, 26.4% of total investment on R&D in 94-95 &
24.8% of total investment on R&D in the country during 2002-03. However, when we assess the trend in
relation to GNP, it turns out that while the industrial sector spent 0.38% of GNP on R&D during 1985-86, its
current expenditure on R&D by industrial sector is down to 0.20% of GNP.
This is in spite of the fact that during the decade of nineties the agencies such as Council of Scientific and
Industrial Research, which houses over 37 laboratories, DST, DSIR, Department of Electronics and
Department of Biotechnology among
others, promoted science and industry links
far more vigorously compared to academic
sector of research system. DSIR has
initiated several research programmes to
forge science and industry links. Trained
manpower for in-house R&D at the
leadership level was also provided in many
cases to private sector from these
institutions only. Even it also does not augur
well for the growth of public-private sector
partnerships for R&D. But there is no systematic data available on the private extramural research expenditure.
There are two types of private extramural R&D funds being given to the public research systems. One type
is the mode of funding from Indian private business enterprises and industry to the S&T agencies such as
CSIR and universities. For instance, in the case of CSIR, external industrial funding to CSIR increased from
60.7 crores in 1997-98 to 255 crores in 2003-04.
Fig 2-01.07 outlines the shares of different states to scientific and agricultural research. The contribution of
expenditure incurred on state sector research institutions is concerned.
Financial Resources for Project Funding
Extra-mural project funding is the second most important allocation mechanism for public research funding
alongside intra-mural institutional funds allocated to research organizations and universities. Its share in the
overall funding is only four percent in India. In most European countries, it covers between a quarter and a
third of total public research funds. In 2007, the total budget for this source of project funding was about 350
crore rupees. In terms of focus, during the year 2007 much of the SERC funding was to go to nano science

S&T Financing 49
and technology field of studies. Below we analyze in detail the portfolio of managing agencies, the funding
instruments, the categories of beneficiaries and the disciplines benefiting from extramural funding. For the
managing agencies, we used a simple classification between national government administration offering
support to strategic and generic S&T through ministries, intermediary agencies including agencies with
higher level of autonomy from the state (research councils) and councils/commissions with the mandate for
providing support to higher and technical education and user departments.

S&T Financing50
The number of extramural R&D projects supported by scientific agencies increased from 2,718 in 2002-03
to 3,569 in 2005-06. The extramural R&D support by scientific agencies increased from Rs. 448.69 crores
in 2002-03 to Rs. 1,163.80 crores in 2005-06. The maximum extramural support for R&D of Rs. 572.11
crores (49.2%) was given by DST. This was followed by DBT with extramural R&D support of Rs. 174.73
crores. The Department of Science and Technology, Ministry of Communications & Information Technology
(MCIT) and Department of Bio-technology (DBT) were the three agencies which provided 80% of the total
extramural R&D support during 2005-06. In India, the share of extramural funding in the overall funding is
at the moment just seven
percent of expenditure on
S&T by Central Scientific
Departments. In fact, it has
only decreased from the
earlier level of nine percent of
total public research funds. In
most European countries, it
covers between a quarter and
a third of total public research
funds. Further, it can be seen
from Table 2-01.07 that the
strategic departments
receiving close to 63.8% of
the S&T outlays provide only
7.77% of the total EMR funds
and this share has only
marginally improved in the
latest period of 2001-2006.
Similarly, even in the case of
Socio-Economic Ministries the share of EMR funds is also small and decreasing.

S&T Financing 51
An important aspect of the extramural funding is the issue of changing relative shares of funds received by
the different types of disciplines. See Table 2-01.08 and Fig 2-01.09 for the progress regarding the changing
relative shares in respect of different disciplines. The relative shares have been stable for most of the fields
of natural sciences in the nineties. The fields of engineering and technology received maximum support
during the period of 1990-2006. Medical Sciences had the next highest share of 16.90% during the period of
1990-2006. Biological Sciences received the next highest share of 14% during the period of 1990-2006.
Chemical Sciences received a share of over 10% during the period of 1990-2006. Agricultural and Earth
Sciences received the next highest level of share of over 9%. Physical Sciences took a share of about
7.50% during the period of 1990-2006. Mathematical Sciences received the lowest relative share of 0.55%
during the period of 1990-2006.
Subject
Source : Compiled from the reports obtaining for the relevant period an extramural R&D funded projects,NSTMIS, DST, GOI

S&T Financing52
The relative shares of different sciences are stable; the only area showing spurt is medical sciences. The
share of medical sciences jumped from 6.7% during 1995-2000 to 23 % during 2001-2006. In terms of
number of projects being supported through extramural funding, the trend of rapid growth in biological and
medical sciences is also a noteworthy feature. The average cost of projects is on the rise in all fields. In the
fields of engineering and medical sciences, it is in the range of about 30 lakhs. See Fig 2-01.10 for the details
of changing relative cost of projects in different scientific disciplines.

S&T Financing 53
Another very important dimension of the extramural funding is the issue of changing relative shares of funds
received by the different types of performing institutions with different kinds of research cultures. See Table
2-01.09 and Fig 2-01.11 for the pattern of distribution of extramural R&D in terms of number of projects &
approved cost by types of research performing institutions during the Year 1990-91 to 2005-2006. In respect

S&T Financing54
of the magnitude of total approved costs during the period of 1990-2006, while the share of project funds
received by universities and colleges is highest it is the institutes of national importance that top the highly
skewed pattern of project funds being made available through extra-funds to the institutions with different
kinds of research cultures. The institutions belonging to the category of national laboratories receives the
next highest share.
The share of category of others which includes industry and NGOs is increasing. In the latest period of
2001-06, the share of others in project funds was close to 20%. See Table 2-01.10 for the details of the
pattern of changing relative shares of different kinds of research performing institutions. See also Table 2-
01.11 for the pattern of distribution of extramural funding in the issue of changing relative shares of funds
received in different disciplines by the different types of R&D performing institutions.
The share of national government administration offering support to strategic and generic S&T through
ministries in extramural funding increased from 55.08% during 20% 1995-2000 to 64.26% during
2001-2006. The share of intermediary agencies with higher level of autonomy from the state (research
councils) and councils/commissions with mandate for providing support to higher and technical education
declined from 24.40 % during 1995-2000 to 15.30 % during 2001-2006. The share of user departments too
declined but by a smaller margin. It decreased from 20.82% during 1995-2000 to 19.40% during 2001-2006.

S&T Financing 55
The mapping and classification of instrument types proved to be more difficult and (because a number of
instruments are, at the level of aggregation considered with extramural R&D funding) rather heterogeneous.
We resort to a classification distinguishing three types of specific cases: academic oriented, theme oriented
(where themes are defined from the beginning) and innovation oriented. See Table 2-01.12 for the pattern of
evolution of extra mural research supported under different instrument types during the period 2001-2006.
While considering the quantitative importance of the instrument types, the share of academic-oriented
instruments is over 42%. Theme-oriented instruments account for 47% of the total. Innovation-oriented
instruments account for only 1% of the total. In European countries, the share of academic-oriented instruments
varies from more than 40% for Switzerland to little more than 20% for Austria, Italy and Norway. Innovation-
oriented instruments account for 40% of the total in Austria, 20% in Italy, 17% in Norway, but less than 10%
in France and Switzerland.
Declining share in project funds in respect of the contribution of CSIR system, a research council to the
system of Universities and Colleges is an emerging feature. Intermediary organizations are now far less
important to universities and colleges in
respect of project funds. Since the
research councils have been overtaken
by the ministries and departments in
project funds as well as total approved
costs, the pattern of links of national
laboratories with research institutes can
be expected to undergo some changes.
Further, although the spread of
distribution of project funds in respect of
universities and colleges is far more now,
the pattern of distribution of project funds
is still highly skewed in favor of selected
Central Universities and Institutes of
National Importance. Among the Central
Scientific Departments, the share of
departments giving support to generic
fields in the contribution to universities
and colleges is on the rise. There has
been little improvement in the share of
strategic science and technology
departments in the contribution to
universities and colleges in project funds.
Across the fields and different scientific
disciplines, the contribution of strategic
science and technology departments to
universities and colleges is lower than
even the research councils. Only in the

S&T Financing56
field of physical sciences their contribution to universities and colleges in the project funds is significant.
But what is equally of concern is that the share of top ten institutions from EMR funds is itself about 23%
and there has been only one new entrant into the league of top ten institutions over the period of last fifteen
years (Table 2-01.13).
Technology Funding by TDB
The Government of India, in 1996, enabled the placing of the proceeds of the R&D Cess Act 1985, i.e. 5%
cess amount on the import of technology, into a fund called “The Fund for Technology Development and
Application”, in a dynamic economic environment. The R&D cess collected was Rs. 1,092.60 crores during
1996-2006, out of which Government has made available Rs. 501.42 crores to the TDB (1996-2008). To
administer the funds, the Government has constituted a statutory body, called Technology Development
Board (TDB), under the Department of Science and Technology. The Board has so far funded about 200
Institutions Institutions InstitutionsTotal
Approved
Cost
(Rs crores)

S&T Financing 57
projects having a total cost of
about Rs. 2,949.13 crores. It
has disbursed Rs.753.81 crores
as on 31 March 2008. It has
provided a real opportunity to
new entrepreneurs/
technopreneurs at the start up
and early stages. Twenty Seven
new enterprises were provided
financial assistance by the
Board during 2007-08. The
Board plays a pro-active role
encouraging commercial
enterprises to take up
technology-oriented projects
(Table 2-01.14).
Results of TDB’s Assistance: TDB’s assistance has resulted in the commercialization of Hepatitis–B vaccine
(Hepatitis vaccine), Interferon Alpha (Cancer Drug), Anti-infectives, Cardio-vascular drugs, Beta Carotene,

S&T Financing58
Vitiligo ointment, Oncology products, Pentavalent vaccine, Handheld computer (Simputer), Ointment for
diabetic ulcers, Irradiated power cable, Plasma display system, Drinking water purifiers, Industrial enzymes,
Automobile diesel engine, Light transport aircraft, Battery operated car, Sedan car, Growth enhancer for
crops, Automatic meter reader, Automatic automobile tracking system, etc.
Impact of TDB Funding and Societal Benefit: The impact of development and commercialization of
Hepatitis-B vaccine by a new firm in Hyderabad has been dramatic. While the country was importing 2 lakh
doses at a prohibitive cost of over Rs. 780 per dose during the early 1990s, today this firm alone is selling
annually over 7 million doses at a price less than Rs. 50 per dose. Clearly, the society has benefited
enormously from this success. It also emerges that such successes generate invaluable confidence for
developing therapeutic drugs.
The country’s first indigenously-built civilian aircraft, ‘SARAS’ recorded its maiden test flight at the HAL
airport, Bangalore on 29th May 2004. TDB has provided significant financial assistance for this project.
The Reva electric car project at Bangalore and the generation of electricity using municipal garbage in
Andhra Pradesh deserve special mention as these relate to environment friendly technologies.
Technology Development and Innovation Programme
This programme of the Department of Scientific and Industrial Research (DSIR), Govt. of India has two
new sub-components:
Technopreneur Promotion Programme (TePP) to nurture the innovative spirits of the individual, and
Technology Development and Demonstration Programme (TDDP) to support the technology development
efforts of the industry – R&D System.
The efforts of the industry in technology development and demonstration of the indigenous technologies,
as well as of the absorption of the imported technologies, are promoted by the Department of Scientific
and Industrial Research (DSIR) under its Plan Scheme “Technology Promotion, Development and
Utilization” (TPDU). The distinctive feature of the funding here is that it addresses innovations in
SME’s. Technology Development & Demonstration Programme (erstwhile PATSER Scheme) (TDDP)
under “Technology Promotion Development & Utilization Scheme (TPDU)” gives more thrust on
technology development. A distinctive feature of the Programme is that many of the projects also involve
government research laboratories, IITs, IISc or Universities. Under the TDDP about 200 projects with
considerable commercial potential have received support. The Scheme has been found successful in
synergizing the R&D efforts of industry and national research organizations. TDDP projects have
strengthened the linkages with more than 44 national research laboratories/institutions such as NAL,
Bangalore; RRL, Trivandrum; IICT, Hyderabad; CMRI, Dhanbad; IIP, Dehradun; C-DAC, Pune; NML,
Jamshedpur; Institute of Plasma Research, Ahmedabad; ER&DC, Trivandrum; Dalmia Centre for
Biotechnology, Coimbatore; CMTI, Bangalore; etc. DSIR has also been interacting with other ministries
for identification of technology development projects and, in this direction, task forces with Railways for
networking and technology development in the areas of signaling/communications and electrical equipment/
power electronics have been formed. More such interactions with other economic ministries are being
planned. The scheme has been successful in synergizing the R&D efforts of the industry. Fortyfive
have been completed and over 35 technologies developed under the scheme have been commercialized
or are under commercialization, besides, over 20 patents have been field, under filing/being scaled up
which would lead to their significant commercialization in the future.

S&T Financing 59
Special Technological Projects Funded by DST
The Department of Science and Technology, DST, Govt. of India, New Delhi, with a view to promoting the
development and demonstration of technology, provides financial support for Instrument Development
Programme, and Drug and Pharmaceutical Research.
Instrumentation Development Programme (IDP): The Department of Science and Technology (DST)
initiated the IDP in 1975 with a view to indigenize the development and production of instruments, continuous
updating of the technology for the instruments developed earlier; designing and development of modern
advanced and novel instruments, besides establishing an S&T base and the production techniques and extend
support to the developmental projects focusing on creative ways of addressing the needs of R&D labs and
industrial sectors. The IDP programme has identified the following priority areas:
• Analytical Instrumentation
• Medical Instrumentation & Health Care Systems
• Industrial Instrumentation, and
• Sensors and Allied Instrumentation
So far, around 500 projects have been funded under the IDP programme, out of which 30 technologies have
been transferred for commercialization by the industry. The latest technology that has been brought out to
the market relates to soil testing. Around 30,000 kits have been sold in the market.
Drugs and Pharmaceuticals Research Programme (DPRP): The DST, recognizing the profound influence
of undertaking R&D on the future prospects and opportunities for the growth of the Indian drug industry,
initiated a programme on drug development in 1994-95 for promoting industry — R&D labs collaborative
programme in drugs and pharmaceutical sectors, with the following specific objectives -
• Synergizing the strengths of publicly funded R&D institutions and Indian pharmaceutical industry, to
generate the collaborative R&D projects (Public – Private Partnership)
• Creating an enabling infrastructure, mechanisms and linkages to facilitate the new drug
development
• Stimulating skill development of human resource in R&D for drugs and pharmaceuticals, and
• Enhancing the national self-reliance in drugs and pharmaceuticals, especially in areas critical to national
health requirements
Enterprises engaged in drug development manufacturing with national R&D labs/academic institutions can
be provided with 50% cost of the project (other 50% should be borne by the industry). The DPRP supports
both human and veterinary drug development for all types of medical systems – be it traditional Indian
medicinal system or the modern one.

S&T Financing60
Grant-in-aid to Industry: The drug development process is highly risky, cost intensive and involves a long
span of 10-15 years of continuous efforts. The major funding for the project is required at the human clinical
trial plan (Phase-1 to Phase-3). Recognizing the need for the drugs that are required by the poor segment of
the society, the Government of India in June 2008, approved providing Grant-in-aid to industries for the
development of drugs for rejected diseases – malaria, filaria, kala-azar, TB etc. Rs.45 crores have been
allocated for the 11th Five Year Plan within the existing provision of Rs. 500 crores. The budget allocation
for the DPRP scheme is Rs.100 crores for 2007-08.
TIFAC’s Mission-Mode Programmes: TIFAC (Technology Information, Forecasting and Assessment
Council), New Delhi set up under the Union Department of Science and Technology, provides financial
support to the projects, coming under the preview of the:
• Sugar Technology Mission (STM)
• Advance Composites Mission and Fly Ash Mission
The Sugar Technology Mission is a joint project of TIFAC/DST and Department of Sugar and Edible oils
(Ministry of Food) Government of India, for the technology upgradation of the sugar industry; with a focus
on reducing sugar loses, energy conservation, superior product quality, minimization of pollution and value
addition to by-products. This is being done by the identification of technology gaps in the existing sugar
factories, as well as forging strong linkages between the research institutes and the industry, etc.
The Government of India, for this purpose has identified a special scheme of concessional finance through
the Sugar Development Fund of the Ministry of Food, New Delhi. The scheme provides soft loans of up to
60% of the project cost, at a simple rate of interest at 6% per annum, payable in the next 5 years with
interest from the date of the first disbursement of the loan amount.
The STM has made technical appraisal/evaluation of the level of technologies already available in many
sugar factories and has identified the gap areas. Modifications and value additions in plants and machinery
of a few factories have been made leading to their better efficiency/performance. Technologies developed
under the scheme STM are:
• Film Type Sulphur Burner
• PLC system for juice floor stabilization and control of Juice Lining and Sulphitation
• Separate clarification of vacuum filtrate.
• Syrup clarification process for the production of superior qualities sugar
• Decanter centrifuges for de-sweetening of clarifier under-flame.
These new technologies are now being replicated in 15-20 sugar factories. A dozen new promising technologies
is on trial, which aim to improve the overall productivity of the sugar factories in the country.

S&T Financing 61
Fly-Ash Mission is a joint activity of the Department of Science and Technology, Ministry of Power and the
Ministry of Environment and Forests, New Delhi - it is being implemented by TIFAC, since 1994 with the
close cooperation of thermal power plants, R&D agencies, industry, academia, government departments
and ministries. It has so far financially supported 55 projects towards confidence building in fly-ash disposal
and utilization technology, spread over 21 geographical sites in the country.
Gainful utilization of fly-ash has occurred in new areas like construction of roads, embankments, ash dykes
reclamative of low lying areas, uses in agriculture, manufacture of bricks, blocks, pavements, tiles, wood
structure, cement substitutes etc. Preparation of standards and protocols for the use of fly ash, are underway
with the Bureau of Indian Standards, New Delhi.
Facilitating the Patenting System: Under the new and emerging elements in the system of technology
financing and innovation support, for the management of Intellectual Property related activities under the
jurisdiction of Indian Patent Act-1970 (modified in 2002, under the guidelines of Global Agreement of Trade
and Traffic GATT) Patent Facilitating Centers have been set-up by the Council of Scientific and Industrial
Research (CSIR) and Technology Information Forecasting Assessment Council (TIFAC), New Delhi.
Fourteen Patents were granted, out of the 128 applications filed during the year 2007-08.
Development of Bio-tech Products
Small Business Innovative Research Initiative (SBIRI): The Department of Biotechnology (DBT)
Government of India, with a view to realize the full potential of bio-technology launched this scheme (SBIRI)
in 2005-06 for promoting the commercialization of new technologies and high-tech products in various bio-
tech industries. The scheme provides early stage funding for high risk, innovative commercial product
proposals. The model of a public-private partnership between industry and public funded institutes is being
encouraged. The distinctive features of the scheme are to:
• Boost public–private partnership efforts and
• Support high risk, pre-proof of concept of research and late stage development of small and medium
scale companies led by innovators, in lead areas of biotechnology and/or commercialization of biotech
products.
The SBIRI aims to:
• Strengthen existing private industrial units where product development is based on in-house innovative
R&D,
• Create opportunities for starting new technology based on knowledge-based business in biotechnology
by science entrepreneurs,
• Stimulate technological innovations and product commercialization,
• Use private industry as a source of innovation and enhance greater public–private partnerships, and

S&T Financing62
• Increase product development, and commercialization in the public–private sector from government
funded R&D projects.
The Department of Biotechnology has so far supported 48 projects with budget allocations of about
Rs. 57 crores (2006-08), on tissue culture, aquaculture, hybrid seeds, vaccine development, bio-fertilizers
and bio-pesticides. DBT has also set up a Biotech Consortium India Ltd (BCIL) – a SBIRI management
agency, for promoting, transfer and commercialization of biotechnologies in India.
Renewable Energy Projects
The Ministry of New and Renewable Energy’s (MNRE) policy for promotion of renewable energy broadly
considers development and demonstration of technologies, facilitating institutional finance from various financial
institutions, providing budgetary support for research and promoting private investment through fiscal incentives,
tax holidays, depreciation allowance and remunerative returns for power fed into the grid.
The Indian Renewable Energy Development Agency (IREDA), New Delhi, set up under the Ministry of
New and Renewable Energy (MNRE) provides financial assistance for the development of renewable
energy sources,
such as Hydro-
Energy, Wind
Energy, Bio-
Energy, Solar
Energy, New and
e m e r g i n g
Technologies ,
B i o - f u e l ,
Alternate fuels
Develop-ments/
act ivi t ies/new
initiatives, Energy
efficiency and
conservation.
As per the
Government’s
policy, the
Ministry of New
and Renewable
Energy (MNRE)
is providing
interest subsidies.
It provides thrust
and importance to
the renewable
energy sector, and IREDA implements the various schemes entrusted to it by the MNRE. Moreover
MNRE made IREDA the “fund manager” for its Interest Subsidy Scheme on ‘Accelerated Development
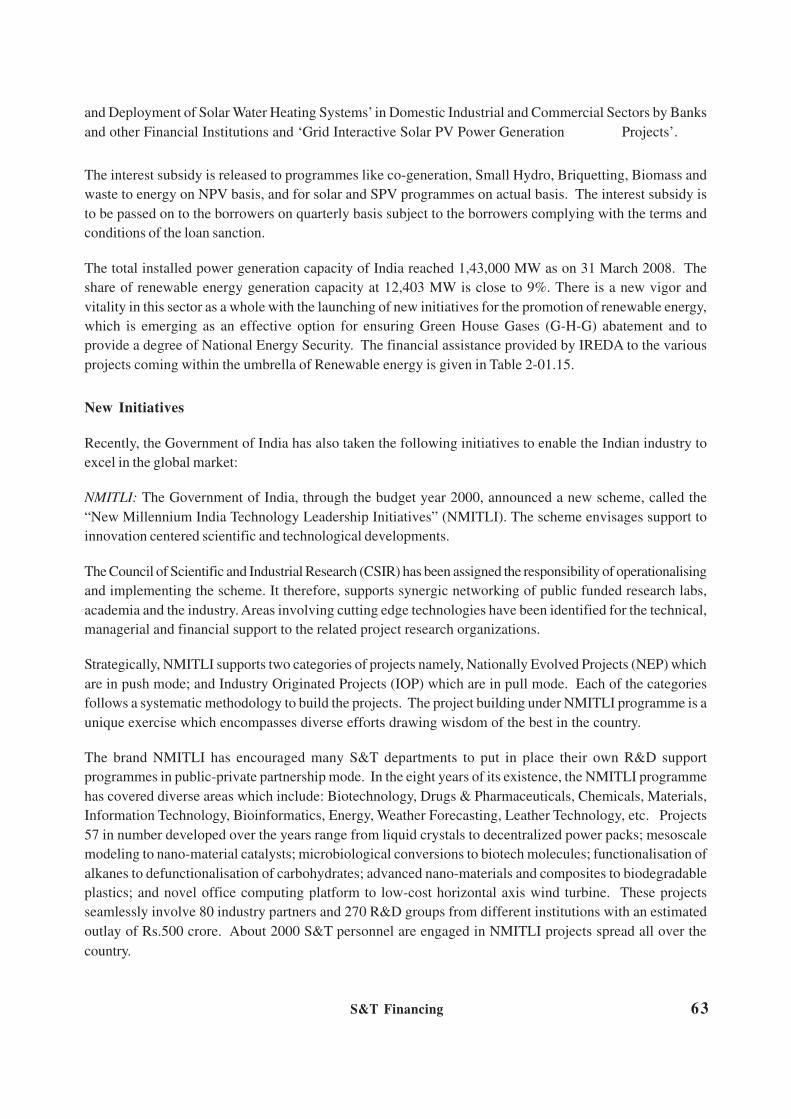
S&T Financing 63
and Deployment of Solar Water Heating Systems’ in Domestic Industrial and Commercial Sectors by Banks
and other Financial Institutions and ‘Grid Interactive Solar PV Power Generation Projects’.
The interest subsidy is released to programmes like co-generation, Small Hydro, Briquetting, Biomass and
waste to energy on NPV basis, and for solar and SPV programmes on actual basis. The interest subsidy is
to be passed on to the borrowers on quarterly basis subject to the borrowers complying with the terms and
conditions of the loan sanction.
The total installed power generation capacity of India reached 1,43,000 MW as on 31 March 2008. The
share of renewable energy generation capacity at 12,403 MW is close to 9%. There is a new vigor and
vitality in this sector as a whole with the launching of new initiatives for the promotion of renewable energy,
which is emerging as an effective option for ensuring Green House Gases (G-H-G) abatement and to
provide a degree of National Energy Security. The financial assistance provided by IREDA to the various
projects coming within the umbrella of Renewable energy is given in Table 2-01.15.
New Initiatives
Recently, the Government of India has also taken the following initiatives to enable the Indian industry to
excel in the global market:
NMITLI: The Government of India, through the budget year 2000, announced a new scheme, called the
“New Millennium India Technology Leadership Initiatives” (NMITLI). The scheme envisages support to
innovation centered scientific and technological developments.
The Council of Scientific and Industrial Research (CSIR) has been assigned the responsibility of operationalising
and implementing the scheme. It therefore, supports synergic networking of public funded research labs,
academia and the industry. Areas involving cutting edge technologies have been identified for the technical,
managerial and financial support to the related project research organizations.
Strategically, NMITLI supports two categories of projects namely, Nationally Evolved Projects (NEP) which
are in push mode; and Industry Originated Projects (IOP) which are in pull mode. Each of the categories
follows a systematic methodology to build the projects. The project building under NMITLI programme is a
unique exercise which encompasses diverse efforts drawing wisdom of the best in the country.
The brand NMITLI has encouraged many S&T departments to put in place their own R&D support
programmes in public-private partnership mode. In the eight years of its existence, the NMITLI programme
has covered diverse areas which include: Biotechnology, Drugs & Pharmaceuticals, Chemicals, Materials,
Information Technology, Bioinformatics, Energy, Weather Forecasting, Leather Technology, etc. Projects
57 in number developed over the years range from liquid crystals to decentralized power packs; mesoscale
modeling to nano-material catalysts; microbiological conversions to biotech molecules; functionalisation of
alkanes to defunctionalisation of carbohydrates; advanced nano-materials and composites to biodegradable
plastics; and novel office computing platform to low-cost horizontal axis wind turbine. These projects
seamlessly involve 80 industry partners and 270 R&D groups from different institutions with an estimated
outlay of Rs.500 crore. About 2000 S&T personnel are engaged in NMITLI projects spread all over the
country.

S&T Financing64
The launch of NMITLI has indeed given a boost to innovation led product oriented R&D in partnership with
industry. Today, NMITLI is India’s largest R&D programme in public-private-partnership mode. The
NMITLI has proved beyond doubt that success of a publicly run R&D support programme depends not only
upon flawless conceptualization and operationalization but also upon pro-active (R&D) management. The
NMITLI experience has brought forth that Indians too can work in large teams to deliver the goods.
Further, NMITLI is able to bring a paradigm shift in thinking with emphasis on innovation, performance and
time bound delivery. Early success of the programme has encouraged other funding agencies to replicate
the model. The experiment has thus proved to be a successful one. Efforts are underway to expand
NMITLI and bring in newer approaches and mechanisms so as to sharpen its delivery base. The expansion
of NMITLI will put India further on a higher pedestal. The country needs more such programmes to give a
fillip to innovation led R&D in the country.
The CSIR has also instituted a “CSIR Diamond Jubilee Technology Award” to be awarded every year to the
scientists involved in the development of new innovative technology-based product in India.
Erstwhile Technology Financing Schemes
The following three TF schemes were in operation for about a decade or so but have been recently
discontinued. These schemes played a remarkable role in sensitizing the industry about the importance of
undertaking technology development towards its commercialization purposes. Their contributions towards
this end are worth recording here to complete the picture. These were:
Programme Aimed at attaining Technological Self–Reliance (PATSER): The PATSER scheme since
1988 supported more than 100 projects for semi-commercialization purposes. With the following objectives,
the PATSER supported the industry, preferably as a joint project with any of the national R&D labs for:
• Technology absorption, development and demonstration,
• Building indigenous capabilities and commercialization of contemporary products and process of high
impact
Towards achieving these objectives, the DSIR provided, on a selective basis, partial financial support for
RDD (Research, Design and Development) projects of the industry in the:
• Development and demonstration of new/or improved products or process technologies, including those
for specialized capital goods, for both the domestic and export markets,
• Absorption and upgrading of imported technology.
The financial support was mainly for procurement of raw materials, prototype development, fees for testing
& evaluation and field trials etc in the field of metallurgical, electrical & electronics, instrumentations, chemical
and mechanical engineering, etc.
The PATSER projects strengthened the linkages with more than 25 R&D labs. Out of 110 projects, 20
patents were filed/granted, 45 projects were successfully developed, leading to the significant commercial
production of new technology-based products.

S&T Financing 65
Home Grown Technology (HGT): The TIFAC managed the HGT scheme during 1993-2006 with a view
to support the Indian industry for achieving competitive strength through technological innovation. It offered
financial-cum-techno-managerial assistance for scaling up of lab/bench scale technology to the pilot plant,
prototype, and semi-commercial level. About 100 projects were supported by TIFAC, under its HGT scheme:
the important ones were in the field of CFC substitutes, detonation spray gun coating, and safe disposal of
hospital waste by plasma; and also in aerations technology, coir pith blocks, ceramic crucibles and catalytic
converters, titanium scrap recycling, bio-fertilizers, etc.
Funding of R&D in Electronics Industry (F R&D, FRIEND): To respond to the R&D needs of the
electronics industry, the then Department of Electronics operated the FRIEND scheme for making the
electronic industry globally competitive. The financial assistance was provided to forge a strategic alliance
between government and industry to share R&D risks with academic and national R&D laboratories. The
technology financing support was catalytic in nature and the projects have led to the development of
commercial/sellable technology-based new products or processes, elevating thereby the confidence level of
the Indian industry, in the wake of meeting the challenge of the MNCs, in the emerging regime of
globalization.
All said and done, it may be noted that the technical products developed under the above mentioned schemes,
have found great acceptance in the domestic and world market.
Conclusion
This is a first cut exercise in the analysis of the progress of public funding of science and technology efforts.
It is indicating many areas of concern which would need to be addressed suitably by the government. Socio-
Economic Ministries and state level S&T councils need to be supported in a big way to give a boost to T&D
for civilian areas. Technology development and innovation related research efforts would also need a similar
increase in funding to make full use of the R&D investments being already undertaken in the country at the
level of directed and blue sky research. Detailed impact assessment expenditures as related to state level
and central level budgetary projections are evidently required for which institutional mechanisms for monitoring
on a real-time basis may be set up.
Financing of Health S&TFinancing of Health S&TFinancing of Health S&TFinancing of Health S&TFinancing of Health S&T
India has continually articulated its commitment to universal health care for all its citizens through the
conceptualization of several programmes and schemes since the dawn of independence. In this context, it
becomes essential to undertake an assessment of the available resources through which the state has attempted
to mould these policies and schemes into universal health outcomes, in order to understand the fit between
the stated objectives and prioritization of these resources. This section specifically attempts to provide an
insight into such prioritization of resources in terms of outlining some broad trends in the financing of Health
S&T schemes. The schematic outline of the section is as follows. At the outset, the section provides an
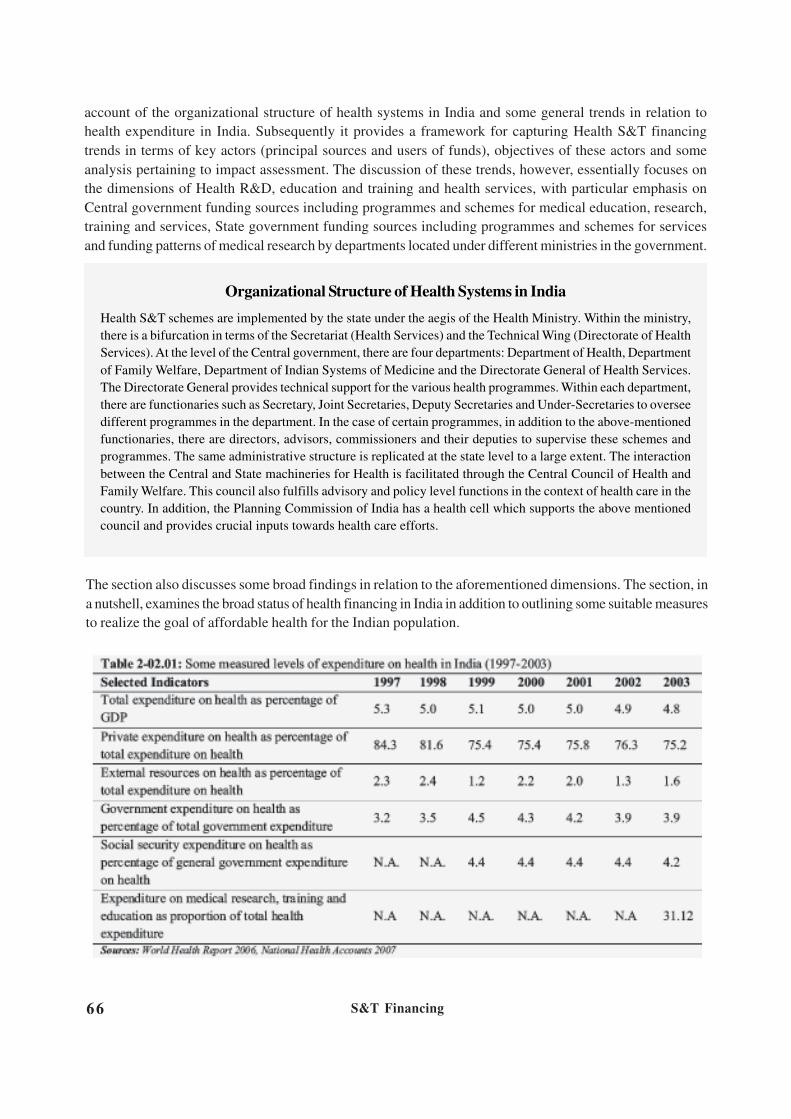
S&T Financing66
account of the organizational structure of health systems in India and some general trends in relation to
health expenditure in India. Subsequently it provides a framework for capturing Health S&T financing
trends in terms of key actors (principal sources and users of funds), objectives of these actors and some
analysis pertaining to impact assessment. The discussion of these trends, however, essentially focuses on
the dimensions of Health R&D, education and training and health services, with particular emphasis on
Central government funding sources including programmes and schemes for medical education, research,
training and services, State government funding sources including programmes and schemes for services
and funding patterns of medical research by departments located under different ministries in the government.
The section also discusses some broad findings in relation to the aforementioned dimensions. The section, in
a nutshell, examines the broad status of health financing in India in addition to outlining some suitable measures
to realize the goal of affordable health for the Indian population.
Organizational Structure of Health Systems in India
Health S&T schemes are implemented by the state under the aegis of the Health Ministry. Within the ministry,
there is a bifurcation in terms of the Secretariat (Health Services) and the Technical Wing (Directorate of Health
Services). At the level of the Central government, there are four departments: Department of Health, Department
of Family Welfare, Department of Indian Systems of Medicine and the Directorate General of Health Services.
The Directorate General provides technical support for the various health programmes. Within each department,
there are functionaries such as Secretary, Joint Secretaries, Deputy Secretaries and Under-Secretaries to oversee
different programmes in the department. In the case of certain programmes, in addition to the above-mentioned
functionaries, there are directors, advisors, commissioners and their deputies to supervise these schemes and
programmes. The same administrative structure is replicated at the state level to a large extent. The interaction
between the Central and State machineries for Health is facilitated through the Central Council of Health and
Family Welfare. This council also fulfills advisory and policy level functions in the context of health care in the
country. In addition, the Planning Commission of India has a health cell which supports the above mentioned
council and provides crucial inputs towards health care efforts.

S&T Financing 67
These indicators provide
a significant pointer to
the patterns of
i n v e s t m e n t s ,
expenditure, sources of
funding and proportion
of allocation for health
schemes and
programmes in relation
to the total allocation.
These indicators also
provide an
understanding of health
outcomes in relation to
the expenditure.
Investment on health,
family welfare &
AYUSH for the Tenth
plan (2002-07) was
Rs.31,020.3, Rs.27,125
& Rs. 775 crores
respectively while total
budgetary allocation
under health sector was
Rs.21,767.34 crores.
The government
expenditure on health as
a percentage of total
expenditure on health
was 24.8% while that of
the private sector was
75.2%. Public spending
on health increased
from 0.22% of GDP in 1950-51 to 1.05% of GDP during the mid-eighties and stagnated around 0.9% of the
GDP during the later years.
Public Health Expenditure
The link between equitable access to health care and better outcome indicators and increased involvement
of the State in health financing related activities is well disseminated. The following tables and diagrams
provide us with an understanding of sector-wise allocations and details of expenditures on health education,
training, research and services by central sector, state sector and departments of different ministries. They
also provide us with a bird’s eye-view on trends in public expenditure on health care in India and also
capture the spatial distribution and flow of healthcare related expenditure.

S&T Financing68
Central Sector
Table 2-02.03 utilizing
data from the Ministry
of Health & Family
Welfare reports,
outlines the scheme-
wise plan outlay and
expenditure for Health
during the Tenth Plan
period. It may be noted
that the approval outlay
in the eleventh plan is
provisional in nature.
Also during the Tenth
Plan, the Central
Schemes of Control/
Containment of non-
communicable diseases
such as for Cancer and
Mental Health have been
converted to centrally
sponsored schemes. The
table clearly highlights the
greater emphasis given
to vertical programmes.
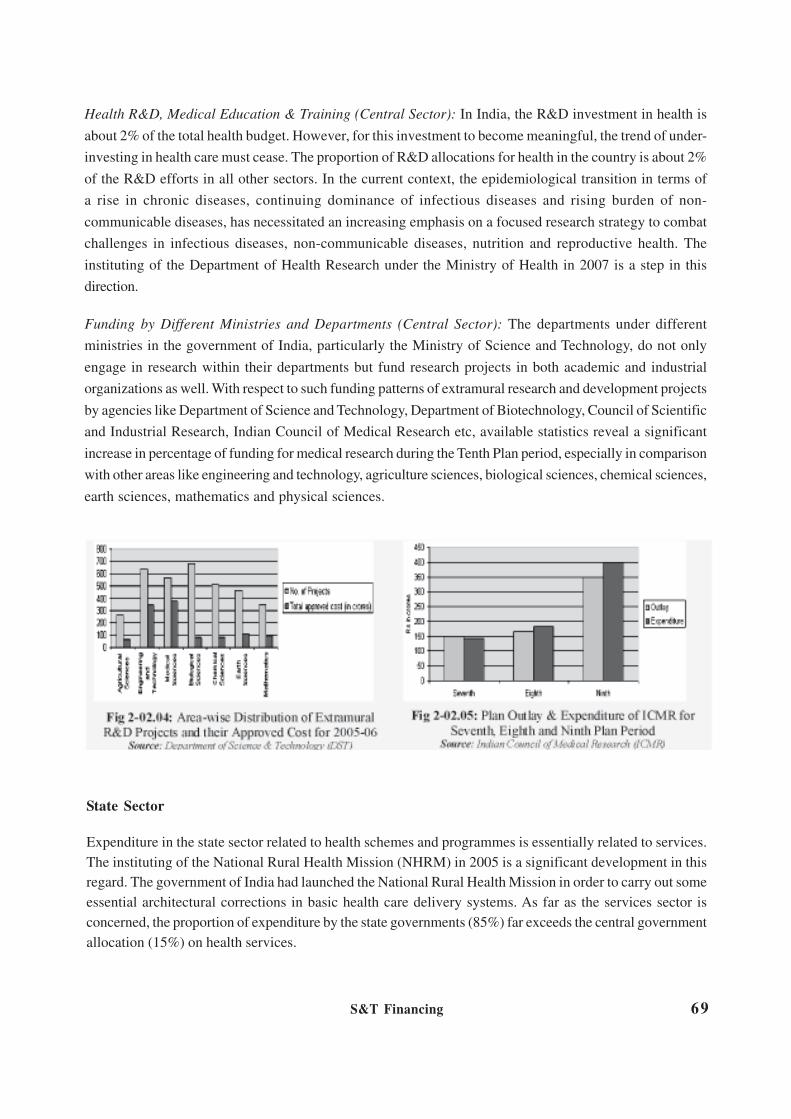
S&T Financing 69
Health R&D, Medical Education & Training (Central Sector): In India, the R&D investment in health is
about 2% of the total health budget. However, for this investment to become meaningful, the trend of under-
investing in health care must cease. The proportion of R&D allocations for health in the country is about 2%
of the R&D efforts in all other sectors. In the current context, the epidemiological transition in terms of
a rise in chronic diseases, continuing dominance of infectious diseases and rising burden of non-
communicable diseases, has necessitated an increasing emphasis on a focused research strategy to combat
challenges in infectious diseases, non-communicable diseases, nutrition and reproductive health. The
instituting of the Department of Health Research under the Ministry of Health in 2007 is a step in this
direction.
Funding by Different Ministries and Departments (Central Sector): The departments under different
ministries in the government of India, particularly the Ministry of Science and Technology, do not only
engage in research within their departments but fund research projects in both academic and industrial
organizations as well. With respect to such funding patterns of extramural research and development projects
by agencies like Department of Science and Technology, Department of Biotechnology, Council of Scientific
and Industrial Research, Indian Council of Medical Research etc, available statistics reveal a significant
increase in percentage of funding for medical research during the Tenth Plan period, especially in comparison
with other areas like engineering and technology, agriculture sciences, biological sciences, chemical sciences,
earth sciences, mathematics and physical sciences.
State Sector
Expenditure in the state sector related to health schemes and programmes is essentially related to services.
The instituting of the National Rural Health Mission (NHRM) in 2005 is a significant development in this
regard. The government of India had launched the National Rural Health Mission in order to carry out some
essential architectural corrections in basic health care delivery systems. As far as the services sector is
concerned, the proportion of expenditure by the state governments (85%) far exceeds the central government
allocation (15%) on health services.

S&T Financing70
Budget allocations for
Assam are the highest
while the lowest
allocations are for
Haryana, Goa and
Sikkim in comparison to
other states. The spatial
patterns of these
budget allocations also
signify expenditure on
services rather than
health research as the
main determinant.
States like Assam,
Tripura, Meghalaya,
Mizoram etc, which
have been allocated a
significant percentage of budgetary resources for health do not have too many health related S&T institutions
Future Initiatives
There is a need to carry out independent evidence based assessments of Central and State expenditure on
health research, education and services in addition to setting up of institutional mechanisms to monitor these
developments and analyze health R&D inputs and their utilization for health policy and programmes that
benefit the Indian population.
FFFFFinancing of Eninancing of Eninancing of Eninancing of Eninancing of Envirvirvirvirvironmentonmentonmentonmentonmental S&Tal S&Tal S&Tal S&Tal S&T
The Tenth Plan had recognized that environmental sustainability is not an option but an imperative. In India,
the funding of Environmental S&T comes from various departments and ministries like the MoE&F, DST
(CSIR, DBT, ICAR), UGC, UNICEF and DAE. The Ministry of Environment & Forests is the nodal
agency in the administrative structure of the central government for planning, promotion, co-ordination and
overseeing the implementation of environmental and forestry programmes. Thus, the MoE&F contributes
the bulk of funds for Environmental S&T activities, and due to constraints in availability of data, the main
focus of this section is on MoEF & its funding schemes. The data for the past 10 years is collected by visiting
websites of Govt. of India pertaining to the project and extracting annual reports, demands for grants,
performance budget etc.

S&T Financing 71
Financing of Environmental
S&T in the MoE&F takes
place under two major
heads; “Forestry and
Wildlife” and “Prevention
and Control of Pollution”.
Minor heads of “Education
and Training” and
“Research” come under
Forestry and Wildlife
whereas “Research and
Ecological Regeneration”
and “Environment
Education, Training/
Extension” come under
Prevention and Control of Pollution. Fig 2-03.01 shows the trend of financing of Environmental S&T taking
i n t o
consideration
the minor heads
w h i c h
contributed to
S&T in the last
10 years.
Fig 2-03.02 and
Fig 2-03.03
show the trend
of financing to
v a r i o u s
e d u c a t i o n a l
i n s t i t u t e s ,
colleges and
a c a d e m i e s
under the minor head of Education and Training. The three primary schemes working under the minor
head of Environmental Education, Training/Extension are – Environmental Education Training Scheme;
Workshop, Seminars & Symposia; and National Museum of Natural History. The trend shows that Workshop,
Seminars & Symposia always received the least budget and Environmental Education Training Scheme got
the highest. In the year 2001-02, Workshop, Seminars & Symposia got zero-budget and henceforth it was
closed. Environmental Education Training remained in the priority and got the highest budget allocation.
Ministry of Environment & Forests funding has been for multi-disciplinary aspects relating to environmental
and ecosystems protection, conservation and management at various universities, institutions of higher learning,
national research institutes and non-governmental organizations in identified thrust areas under its Research
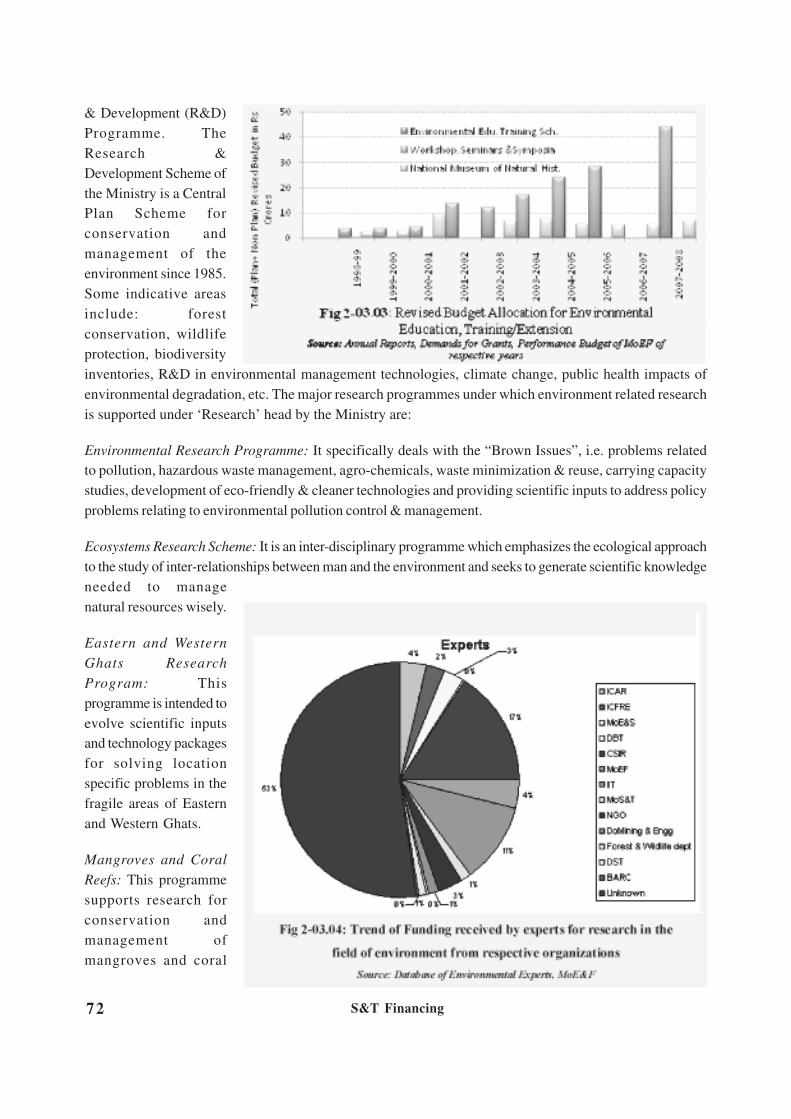
S&T Financing72
& Development (R&D)
Programme. The
Research &
Development Scheme of
the Ministry is a Central
Plan Scheme for
conservation and
management of the
environment since 1985.
Some indicative areas
include: forest
conservation, wildlife
protection, biodiversity
inventories, R&D in environmental management technologies, climate change, public health impacts of
environmental degradation, etc. The major research programmes under which environment related research
is supported under ‘Research’ head by the Ministry are:
Environmental Research Programme: It specifically deals with the “Brown Issues”, i.e. problems related
to pollution, hazardous waste management, agro-chemicals, waste minimization & reuse, carrying capacity
studies, development of eco-friendly & cleaner technologies and providing scientific inputs to address policy
problems relating to environmental pollution control & management.
Ecosystems Research Scheme: It is an inter-disciplinary programme which emphasizes the ecological approach
to the study of inter-relationships between man and the environment and seeks to generate scientific knowledge
needed to manage
natural resources wisely.
Eastern and Western
Ghats Research
Program: This
programme is intended to
evolve scientific inputs
and technology packages
for solving location
specific problems in the
fragile areas of Eastern
and Western Ghats.
Mangroves and Coral
Reefs: This programme
supports research for
conservation and
management of
mangroves and coral

S&T Financing 73
reefs ecosystems from
degradation, aforestation
of degraded mangrove
areas, maintenance of
genetic diversity,
especially of the
threatened and endemic
species and ‘coral reefs’
restoration/artificial
regeneration and
creation of awareness
among the people about
the importance of
mangroves and coral
reefs ecosystems.
Data regarding experts
working on environmental S&T and the grants they receive from MoE&F reveals that experts were from
ICFRE (53%), CSIR (17%), IIT (11%). Besides the Central Government, it is good to note that the State
Governments have also invested in environmental S&T as is evident from Fig 2-03.05.
It is found that financing of environmental S&T has gained pace over the years in India but if we look
at the achievements perhaps there are miles to go. Thus more efforts from different agencies, both
public and private, will add momentum to the developments achieved till now. In fact, achievements
can be fostered if environmental S&T related activities generate economic activity for the huge
unemployed workforce present in the country. The role of governments, donors, and other stakeholders
in creating the enabling policy and institutional framework for introducing market-based approaches
will remain very significant.
InInInInInvvvvvesesesesestment in S&T and Innotment in S&T and Innotment in S&T and Innotment in S&T and Innotment in S&T and Innovvvvvation in Indiaation in Indiaation in Indiaation in Indiaation in India
Investment and expenditure on S&T (and on R&D) in India has been rising over the years. Computation of
such spending is difficult because agencies ranging from public to private invest or spend, on several items
that may not be directly accounted for under the respective heads of either R&D or S&T. The latter is a
broader category while the former R&D is more inclusive and limited in scope. Moreover, there are several
types and tiers of public agencies in the federal setup who are engaged in investment in S&T. Further, there
are other modes of public funding especially as through the banking system or fund-based systems targeted
to S&T or R&D. Finally, apart from the foreign investment/engagement in R&D the domestic private sector
Fig 2-03.05: Trend of Investment in “Ecology and Environment” under Science
and Technology head of Development (2002-05 Actual expenditure; 2005-2007
Approved Outlays)
Source: Annual Plan documents of respective states
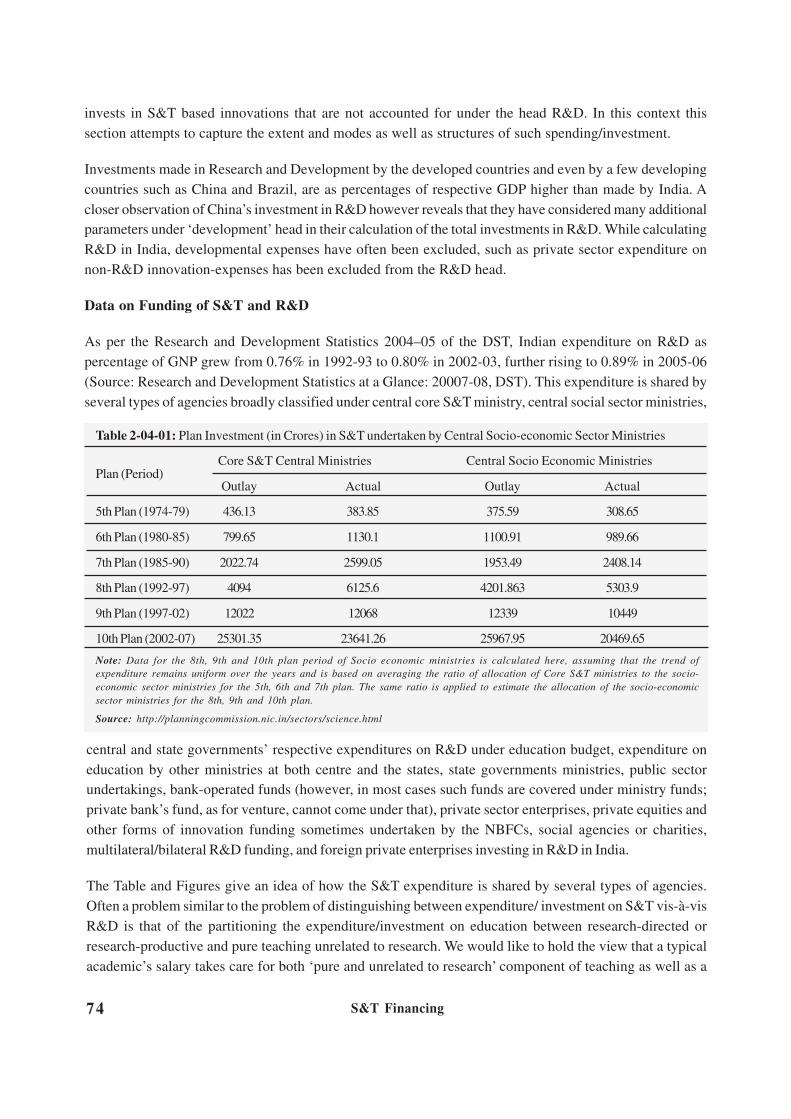
S&T Financing74
invests in S&T based innovations that are not accounted for under the head R&D. In this context this
section attempts to capture the extent and modes as well as structures of such spending/investment.
Investments made in Research and Development by the developed countries and even by a few developing
countries such as China and Brazil, are as percentages of respective GDP higher than made by India. A
closer observation of China’s investment in R&D however reveals that they have considered many additional
parameters under ‘development’ head in their calculation of the total investments in R&D. While calculating
R&D in India, developmental expenses have often been excluded, such as private sector expenditure on
non-R&D innovation-expenses has been excluded from the R&D head.
Data on Funding of S&T and R&D
As per the Research and Development Statistics 2004–05 of the DST, Indian expenditure on R&D as
percentage of GNP grew from 0.76% in 1992-93 to 0.80% in 2002-03, further rising to 0.89% in 2005-06
(Source: Research and Development Statistics at a Glance: 20007-08, DST). This expenditure is shared by
several types of agencies broadly classified under central core S&T ministry, central social sector ministries,
central and state governments’ respective expenditures on R&D under education budget, expenditure on
education by other ministries at both centre and the states, state governments ministries, public sector
undertakings, bank-operated funds (however, in most cases such funds are covered under ministry funds;
private bank’s fund, as for venture, cannot come under that), private sector enterprises, private equities and
other forms of innovation funding sometimes undertaken by the NBFCs, social agencies or charities,
multilateral/bilateral R&D funding, and foreign private enterprises investing in R&D in India.
The Table and Figures give an idea of how the S&T expenditure is shared by several types of agencies.
Often a problem similar to the problem of distinguishing between expenditure/ investment on S&T vis-à-vis
R&D is that of the partitioning the expenditure/investment on education between research-directed or
research-productive and pure teaching unrelated to research. We would like to hold the view that a typical
academic’s salary takes care for both ‘pure and unrelated to research’ component of teaching as well as a
Table 2-04-01: Plan Investment (in Crores) in S&T undertaken by Central Socio-economic Sector Ministries
Plan (Period) Core S&T Central Ministries Central Socio Economic Ministries
Outlay Actual Outlay Actual
5th Plan (1974-79) 436.13 383.85 375.59 308.65
6th Plan (1980-85) 799.65 1130.1 1100.91 989.66
7th Plan (1985-90) 2022.74 2599.05 1953.49 2408.14
8th Plan (1992-97) 4094 6125.6 4201.863 5303.9
9th Plan (1997-02) 12022 12068 12339 10449
10th Plan (2002-07) 25301.35 23641.26 25967.95 20469.65
Note: Data for the 8th, 9th and 10th plan period of Socio economic ministries is calculated here, assuming that the trend of
expenditure remains uniform over the years and is based on averaging the ratio of allocation of Core S&T ministries to the socio-
economic sector ministries for the 5th, 6th and 7th plan. The same ratio is applied to estimate the allocation of the socio-economic
sector ministries for the 8th, 9th and 10th plan.
Source: http://planningcommission.nic.in/sectors/science.html

S&T Financing 75
component of research even though the academic might not have received a separate grant for R&D. In
fact for dedicated R&D organizations the expenditure statement is accepted as the expenditure on R&D
even while the dedicated R&D organizations of the country are currently generating very large number of
doctorates and are training very large number of doctoral students. Our observation is based upon the notion
that teaching and R&D go together.

S&T Financing76

S&T Financing 77
The Expenditure Reports of
respective education
ministries under several
heads of ‘scholarships’,
‘R&D’, however provide
only an indication to the
directed R&D fund under
budgets of higher and technical education. The figures reflect the fact but there are many hidden expenditure
on S&T undertaken by the Department of Higher education as well as other socio-economic ministries
(Table 2-04.02).
Moreover with the current thrust of XI Plan S&T on ‘innovation’, our classification and data definition
system would need to capture much of the non-R&D that go into innovation. For private companies, we
have considered the CMIE database of listed companies.

S&T Financing78
Mode of Funding and Capacity in S&T
Most of funding of R&D/S&T happens through
planning and budgeting mode of the executive
ministry or departments; there is relatively little
change with variations in the ownership of
executing fund-recipient. Planning/budgeting
exercises undertaken at periodic intervals have
set up several mechanisms of executive based
coordination and monitoring. Hard budget
constraints and project/program monitoring at the
central level with the involvement of the Planning
Commission and a few inter-ministerial bodies is
one of the most significant mechanisms. At lower
tiers such allocation functions are undertaken
within the department/ministry through very similar processes, however, the lower the tier in hierarchy the
stricter are the constraints on flexibility in budgeting. Most often, at around the middle tiers of the hierarchy,
execution remains the main task and coordination through management of allocations across budget heads
or cash flows becomes difficult.
Demands for grants rise as one goes up the hierarchy, where at the higher tiers the bundling of demands is
undertaken. The current Plan, for example, has set the broad principles of bundling and one major norm is
‘Supra’ projects at supra-organizational level, or ‘Mega’ and ‘Inter-agency’ projects at multi-institutional
level or at cross-disciplinary level. Budget sets the goals and therefore monitoring standards and modes.
Inter-period monitoring of goals and outcome achieved and especially the capacity to spend within the pre-
fixed parameters of budgetary heads provide the cues to future release of funds. Several documents of the
government suggest that the systemic incapacity to spend is a major bottleneck to the growth of S&T
budget allocation. The two way process depends crucially upon the interactive mechanisms of bottom-up
and top-down flows of information that get bundled at multiple tiers preventing, perhaps often the systemic
capacity build up on its own and through these budgetary processes. Generation of projects, major programs
and in short the creation as well as generation of demand then is another goal of the entire executive process
of planning/budgeting. Relative weakness of the systems of S&T to voice demands reflects upon and
influences the slow buildup of the systemic capacity. Major projects or mega programs therefore appear to
be important. The XI Plan has emphasized amply this dimension. Another related dimension is the capacity
of the systems of the stakeholders, especially of the society who would voice and which in turn would boot
up demands for capacity.
Along with these executive based approaches to using planning/budgeting, a few other approaches have in
recent periods been considered as well as initiated by the government. One important landmark of XI Plan
regarding S&T is its underlying theme of innovation. Creation of demand pulls through innovations to generate
the subsequent flow of allocations that in turn would create, from within as well from without the public
system of S&T, the dynamism to create additional capacity to absorb funds and build up executive capacity,
is one of the principal pillars of the current plan. This approach has therefore created instruments for

S&T Financing 79
funding the ‘bridging’ or linkage functions. The emphasis has been on executive controlled departmental or
line ministerial linkages. Other modes of market based or social based linkages too are important. For
example, generation of standards or extensive modularization creates the pull for systemic build up through
market processes. Another mode less deliberated upon is the advanced standards-based public procurement
or utilization of part of public development fund or part of restructuring fund or of the infrastructure fund to
advance induction of new technology. In the current Plan such indications have been provided in relation to
the district-based system of S&T management or in relation to incubation of new innovations or in inspiring
youth into the folds of new sciences.
Another dimension of public investment is the foregone taxes, tariffs and similar others. The ensuing private
investment in new plants and machinery, new measures on quality, standards or say, productivity and efficiency
and especially on new technologies are to be set off against the forgone revenues. Private investments on all
this have not been computed, however, our preliminary observations on investments for on-R&D innovations
indicate that instead of setting off the investments in R&D alone the private enterprises have undertaken in
a few sectors the systemic build up of innovation capacity.

S&T Structure, Infrastructure and Public Space80

S&T Structure, Infrastructure and Public Space 81
S&T Structure, Infrastructure and Public Space
Overview
S&T infrastructure describes the enabling capacity allowing undertaking of advanced R&D as well as S&T
by constituent organizations of a country. In other words, structural distribution of capacities, their coordination
and governance, as well as goals of the constituents and the capital and knowledge intensity of experimental
and production facilities do indicate the degree of this enablement. The manner in which S&T structure can
aid in economic development is closely linked to the country’s S&T infrastructure. Performance of schools
and workshops, fabrication or prototyping facilities, laboratories and of advanced production and most
importantly, the innovation-performance of a country depends crucially on this S&T infrastructure. No wonder
a comparator, China, has made a special Plan initiative on S&T infrastructure. In India, policy initiative on
S&T infrastructure has appeared not as a special focus but as latent and incorporated under multiple programs
of the federated executive and public set up. The democratic governance implicit in this policy therefore
depends crucially on how S&T has filtered through the public space. This theme only briefly provides snapshots
into this whole complex and captures the huge S&T infrastructure existing in the country, with special
emphasis on the various modes of coordination and governance vis-à-vis indicative performance.
Beginning with an analytical description of various modes of governance existing in the S&T system of the
country, an overview exhibits the huge S&T infrastructure existing in the country. Reflections on the relative
performances and different modes of governance are traced through the evolution in regional governance
and regional innovation system. Subsequently, a brief overview of the S&T infrastructure across different
states of India is followed by several descriptions on performances, such as on technology transfer. A brief
profile of S&T in the state of Kerala provides an exemplar of regional S&T state of affairs. Briefly describing
technology parks, the theme takes up biotechnology parks and incubators and public initiatives in biotechnology.
The theme then covers a strategic player, the CSIR, a premier research organization and its achievements
and comments on various R&D partnerships in the country, their performances and the financing mechanism
in the partnership initiatives. Thereafter the attention shifts from organization to the social milieu, and an
analysis provides glimpses into the public space. Coverage of seven diseases- HIV/AIDS, Diabetes, Dengue,
Malaria, Tuberculosis, Chikungunya and Avian Influenza in three Indian English language newspapers for
the year 2007 and the coverage of science and technology related items in English language dailies in India
throw light on the quantum of space allocated to different subjects by different newspapers, positioning and
spread of S&T items, and identify newspapers that accorded priority to science and technology related
items.
The full text of these extended summaries is available at http://www.nistads.res.in

S&T Structure, Infrastructure and Public Space82
CoorCoorCoorCoorCoordination and Godination and Godination and Godination and Godination and Govvvvvererererernance: S&T snance: S&T snance: S&T snance: S&T snance: S&T strtrtrtrtructuructuructuructuructure ande ande ande ande and
infrastructureinfrastructureinfrastructureinfrastructureinfrastructure
Several policy documents of the Government of India, including several plan documents, have suggested
areas under ‘S&T’ as being broader in scope than areas ‘R&D’ could address. The S&T infrastructure of
India has therefore embraced large number of economic sectors and various social dimensions. Over several
decades of developmental investments and developmental democratic public governance, India has
experimented with and has evolved a very complex web of S&T infrastructure and of coordination and
governance. In its federated mode of governance, the S&T infrastructure remains governed by: multiple
central ministries, multiple ministries of the governments in the states, varieties of structures under the local
governments of the Panchayati Raj Institutions (PRI), public non-profit systems including varieties of universities
and schools or specialized training schools, several regulators in both the centre and the states, the institutions
of audit, the complex web of legal institutions, the federated structures of law-making institutions, scores of
establishments in both public sector and public-private cooperated sectors, private sector entities, foreign
investments in R&D and other science-related developments, and private charities.
Modes of Coordination & Governance
From the perspective of institutions of governance or from the perspective of comparative governance, the
three modes : (1) the executive-based governance, (2) the bank-based governance and (3) the market-
based governance, have coexisted, albeit for India the executive-based mode has retained overwhelming
control. The executive-based coordination and governance can be further subdivided into several modes,
namely: (1) central government, (2) state government, (3) local government, and (4) combinations of the
former along with, sometimes, public sector or private sector. Executive control in most cases relies ultimately
upon administrative services under the line ministry. Integrative governmental structures exist primarily at
the district level local government; however, S&T structures under the district governments are either non-
existent or extremely weak. However, in most states most state S&T/R&D institutions are under the line
ministries. The Planning Commission, as a quasi-administrative body, brings together the function of coordination
primarily through the processes of planning and budgetary measures. A few inter-departmental bodies also
function as coordination mechanisms. Regulators, when they exist, also serve as coordinators, however,
they cannot/do not fund.
Bank based or fund based financing mechanisms have not operated for S&T/R&D funding especially for
the S&T infrastructure including formation of laboratories. This mode of financing that has been operated in
few other countries, notably China, employs a small part (often about 5%) of most economic-restructuring
large funds, or most disaster-funds, or most developmental or public procurement funds towards inducting
new technologies or developing new technologies or for creating huge S&T infrastructure. Such set asides
have often employed new technology standards for creating a demand for knowledge goods from public
S&T laboratories or even from private sector by way of demanding goods based upon advanced technology
standards. The market-based mode has operated in conjunction with public modes in few countries, such as
USA, Germany, France, Japan and a few others. Several developing countries especially from West Asia
and China in recent times have seen the creation of large private charities for S&T. In India, such coming

S&T Structure, Infrastructure and Public Space 83
together had happened historically; however, currently the social foundation of S&T undertaking is considerably
weakened.
Governance types
A schematic presentation of the modes of governances of S&T structures and relative strengths of S&T
infrastructure, along with numbers of goals and purposes, as well as joint modes of governances - could be
presented as follows:
Modes of Funding
The funding mechanism, especially for the S&T infrastructure, is thus primarily now under the management
of line ministries. Instrumentation funding or experiment funding has been done in India through three broad
modes: (1) as part of a sanctioned project/program; (2) as part of instrument/capacity build up; and (3) as
part of a major national mission such as on space. Apart from the fund from line ministry, a proposing
organization may seek fund from extramural facility of another ministry, or from the instrument/capacity
build up funds from other line ministries.
A facility thus created is in general a dedicated (or laboratory) facility, not easily accessible to outside
researchers or outside private parties. Fees based laboratories do exist in India but their functions are almost

S&T Structure, Infrastructure and Public Space84
always limited to testing, standardization, certification areas and/or they happen to belong to public executive
authorities such as on standards. Private fees based laboratories do exist at higher secondary school science
level and at undergraduate levels. Infrastructure level research, experimentation facilities are yet to come
up.
Infrastructure dedicated to S&T
A large number of specialized research institutes have come up over the years. The Research and
Development Statistics 2007-08, from the Department of Science and Technology reported the presence of
3,960 R&D institutions in the country in 2006. The central sector core S&T ministries have only a few
laboratories under them; especially, the number of laboratories with the CSIR constitutes less than 1% of the
total number of R&D laboratories in the country.
State-wise distribution, as per the DST
Research and Development Statistics
at a Glance 2007-08, is: Maharashtra
with 835 R&D institutions, Tamil Nadu
with 402, Andhra Pradesh with 338,
Delhi with 321, Karnataka with 311,
Gujarat with 273, West Bengal with
260, Uttar Pradesh with 223, Kerala
with 139 and the rest of the states with
the remaining 858 R&D institutions.
Fig 3-01.01 and 3-01.02 show the
manner in which S&T institutes, which
are primarily of R&D nature, spread
across the Central Ministry of Science
and Technology and some independent
departments, e.g. Department of
Space and Department of Atomic
Energy.
Fig 3-01.03 gives an idea of the various
socio-economic sector central
government ministries with respective
number of institutions involved in
scientific research and training. There
are, moreover, a large number of
S&T/R&D institutes under central
science departments, the state
managed and state supported S&T/
R&D institutes, and institutes with
private sector or social sectors.

S&T Structure, Infrastructure and Public Space 85
A schematic presentation of governance structures and their status, in brief, for most of these organizations
is provided in Table 3-01.02

S&T Structure, Infrastructure and Public Space86
Schemes and Programmes for S&T Infrastructure Development
In recent years, great concern has been expressed about lack of infrastructure facilities for imparting good
quality higher education and conducting advanced research. Considering this, a new scheme “Fund for
Improvement of S&T Infrastructure in Universities and Higher Educational Institutions (FIST)” was launched
in 2000-2001 by Department of Science and Technology. The state-wise distribution of the Universities &
Departments identified & supported during 2000-2007 in FIST Program is available at http://www.fist-
dst.org/statewise_data.pdf. The Department of Biotechnology has initiated a programme to augment and
strengthen institutional research capacity in areas of Biotechnology through support for establishment of
Centers of Excellence (COE). The objective of this programme is primarily to strengthen an institution’s
research infrastructure through the establishment of a thematic research centre with multi-disciplinary research
effort. The Ministry of Human Resources Development has been running a few similar programmes, such
as on centers of excellence, for last several years. Earlier, few organizations resorted to funding from the
World Bank loan; public banking fund has not been deployed.
The private sector has R&D departments/units with respective economic enterprises and sometimes with
trusts supported by such private
enterprises. Moreover, there
are S&T/R&D units with
several social sector NGOs/
NPOs. The figures 3-01.04 and
3-01.05 exhibit the distribution
of only one type of private
R&D units/departments in
India.
Last few years have seen
foreign companies invest- ing
in owned R&D establishments
in India. Figure 3-01-06 based

S&T Structure, Infrastructure and Public Space 87
upon data for the year 2004 (current figure is higher) exhibits the distribution of such R&D
establishments.
Professional scientific societies or associations are weak in India relative to several advanced countries,
notably the USA. Role of professional control in management of S&T organizations has remained sparse,
few and far between, and is often exercised in conjunction with administrative organs and under typically
governmental administrative rules, budgetary practices, cash flow managements, information channel controls,
organizational processes, audit requirements as prevail in respective ministries/departments controlling the
concerned S&T/R&D organization.
The peer controls, the gate keeping roles and peer hand-holding or reviews etc. are naturally very weak and
do accommodate administrative rules and principles. The table below provides a sample of councils, associations
and boards formed by the Department of Commerce and the Department of Industrial Policy and Promotion
under the Ministry of Commerce and Industry with the objective to build up the S&T infrastructure of the
nation.

S&T Structure, Infrastructure and Public Space88
Table 3-01.04 provides clues to differences in performance and goals of some of the R&D institutes, directly
or indirectly, under the Ministry of Textiles. Large numbers of performance related to intangibles, often
remain unstated and are thus inscrutable.
Table 3-01.04 reflects the
fact that the S&T institutes
in India are currently
delivering multiple
knowledge goods, both
tangible and
intangible, licensed
exclusively or non-
exclusively or as simple
give-away; they are
providing both non-market
priced and free advisory/
consultancy, and similar
other services. As a result,
when computed by number
of papers published
especially in international
journals, patents or distinct
novel products, most
institutes fail to show up good
output. The charters/
agendas have demanded
variable outputs and administrative imperatives limit transferring output/knowledge. Thus it stands against
the notion that publications in journals of repute are central to measuring output. Social sector laboratories
might not show remarkable publication records, but they are working on other aspects of technology
development e.g. development of standards, undertaking prototyping, problem solving, providing consultancy
and training and similar other services. Now, while measuring the output of such institutions, it is often found
that their tangible performance is not uniform. Institutes generating relatively poor research output, however
often provide a variety of tangible and intangible outputs and services. It appears that the yardstick of
measurement needs to accommodate non-research but developmental dimensions of R&D, and it must
identify bridge organizations. Outputs and goals are closely related to coordination modes and governance
structure. Restructuring governance has remained the most active agenda in a few comparator countries,
notably in China. Diversity in capacities, capabilities and outputs of this complex web of democratized
federated structures of governance are assets that could be further strengthened by learning lessons from
comparative policies.
Lessons learnt
Thus, it is understood that although over the years growth of S&T infrastructure has taken place significantly,
the achievements are yet to become very promising. The socio-economic sector laboratories which are

S&T Structure, Infrastructure and Public Space 89
expected to harness S&T for the developmental aspects of the society quite often suffer from mismatch and
are expected to perform up to their expected targets. The key reasons behind such mismatch could be shifts
in and softening of governance, poor S&T infrastructure including laboratories and workshops, multiplicity
of S&T goals, changing S&T charters and research agenda, locked-up levels of skills and competencies of
personnel, among others. Absence often of transparent coordination mechanisms or instruments renders
this large structure weak. Goals multiplication and shifting charters/agenda often appear to have resulted
from changes in governance structures and governance imperatives. This in turn results in a fuzzy set of
expected deliverables and locked-up skills and competencies of personnel. Almost always research institutes
are run under administrative rules and structures analogous to those prevailing in, and for, the line ministries.
The public audit system too has very significant influence on modes of functioning and the capability to
deliver.
We also find that India has a huge S&T infrastructure in which there is wide variance in the governance
structure. The gains from such varied structures have definitely been very impressive, however, with one
caveat. Unlike a singular mode of governance where gains are defined well and beforehand and where
measurement of gains are easily computable, visible and are large – the Indian web of federated democratized
stakeholders-related governances have defined multiple goals, varied types of deliverables, complex modes
of negotiations and regulations and the Indian governances have therefore delivered very large number of
relatively inscrutable grass-root gain that are not easily amenable to accumulation. In fact, standard instruments
of direction such as laws and audit systems have accommodated, especially in the phases of implementation
of S&T based developmental programs, the roles of negotiation and aspirations of the local structures of
governance. The distinct gains from this very distributed mode of goals and governances are that widely
distributed capacity and very diverse capabilities have been sustained and generated. This is perhaps very
unique to India and few nations can be proud of such great diversities. The future of Indian S&T and the
developmental discourse needs to recognize these, albeit weak, very diverse capacities, capabilities, gains
and governances as the central feature.
The RThe RThe RThe RThe Regional Innoegional Innoegional Innoegional Innoegional Innovvvvvation Syation Syation Syation Syation Syssssstttttem: Tem: Tem: Tem: Tem: Trrrrracing tacing tacing tacing tacing thehehehehe
eeeeevvvvvolution in main rolution in main rolution in main rolution in main rolution in main regional goegional goegional goegional goegional govvvvvererererernancenancenancenancenance
characteristicscharacteristicscharacteristicscharacteristicscharacteristics
Innovation Performance and Policy Objectives
By 2006-07, the share of agriculture in GDP had declined to 18.5%, and the share of industry and services
had improved to 26.4% and 55.1%, respectively. The lower contribution of industry to GDP growth relative
to services in recent years is partly because of the lower share in GDP and does not adequately capture the
signs of industrial resurgence.
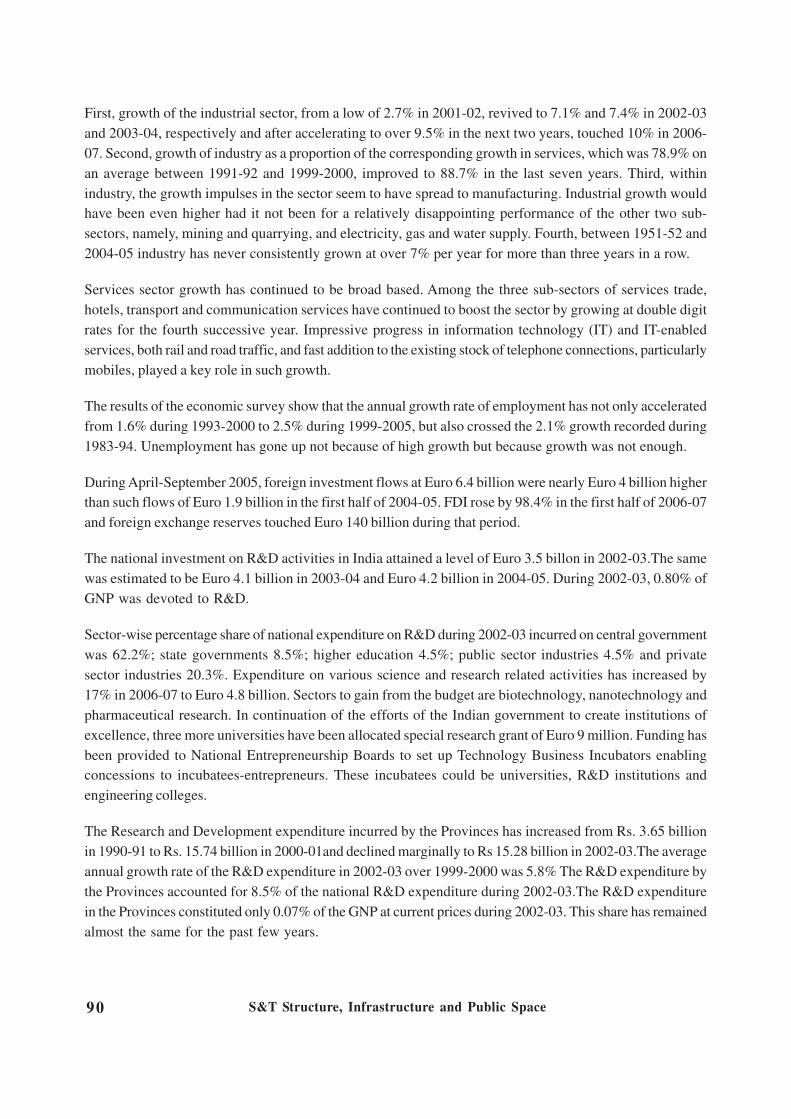
S&T Structure, Infrastructure and Public Space90
First, growth of the industrial sector, from a low of 2.7% in 2001-02, revived to 7.1% and 7.4% in 2002-03
and 2003-04, respectively and after accelerating to over 9.5% in the next two years, touched 10% in 2006-
07. Second, growth of industry as a proportion of the corresponding growth in services, which was 78.9% on
an average between 1991-92 and 1999-2000, improved to 88.7% in the last seven years. Third, within
industry, the growth impulses in the sector seem to have spread to manufacturing. Industrial growth would
have been even higher had it not been for a relatively disappointing performance of the other two sub-
sectors, namely, mining and quarrying, and electricity, gas and water supply. Fourth, between 1951-52 and
2004-05 industry has never consistently grown at over 7% per year for more than three years in a row.
Services sector growth has continued to be broad based. Among the three sub-sectors of services trade,
hotels, transport and communication services have continued to boost the sector by growing at double digit
rates for the fourth successive year. Impressive progress in information technology (IT) and IT-enabled
services, both rail and road traffic, and fast addition to the existing stock of telephone connections, particularly
mobiles, played a key role in such growth.
The results of the economic survey show that the annual growth rate of employment has not only accelerated
from 1.6% during 1993-2000 to 2.5% during 1999-2005, but also crossed the 2.1% growth recorded during
1983-94. Unemployment has gone up not because of high growth but because growth was not enough.
During April-September 2005, foreign investment flows at Euro 6.4 billion were nearly Euro 4 billion higher
than such flows of Euro 1.9 billion in the first half of 2004-05. FDI rose by 98.4% in the first half of 2006-07
and foreign exchange reserves touched Euro 140 billion during that period.
The national investment on R&D activities in India attained a level of Euro 3.5 billon in 2002-03.The same
was estimated to be Euro 4.1 billion in 2003-04 and Euro 4.2 billion in 2004-05. During 2002-03, 0.80% of
GNP was devoted to R&D.
Sector-wise percentage share of national expenditure on R&D during 2002-03 incurred on central government
was 62.2%; state governments 8.5%; higher education 4.5%; public sector industries 4.5% and private
sector industries 20.3%. Expenditure on various science and research related activities has increased by
17% in 2006-07 to Euro 4.8 billion. Sectors to gain from the budget are biotechnology, nanotechnology and
pharmaceutical research. In continuation of the efforts of the Indian government to create institutions of
excellence, three more universities have been allocated special research grant of Euro 9 million. Funding has
been provided to National Entrepreneurship Boards to set up Technology Business Incubators enabling
concessions to incubatees-entrepreneurs. These incubatees could be universities, R&D institutions and
engineering colleges.
The Research and Development expenditure incurred by the Provinces has increased from Rs. 3.65 billion
in 1990-91 to Rs. 15.74 billion in 2000-01and declined marginally to Rs 15.28 billion in 2002-03.The average
annual growth rate of the R&D expenditure in 2002-03 over 1999-2000 was 5.8% The R&D expenditure by
the Provinces accounted for 8.5% of the national R&D expenditure during 2002-03.The R&D expenditure
in the Provinces constituted only 0.07% of the GNP at current prices during 2002-03. This share has remained
almost the same for the past few years.

S&T Structure, Infrastructure and Public Space 91
While there is a huge variation in the education expenditures across different Provinces, there is also a large
difference in the enrolment and other patterns as well as in the number of educational institutes in the
Provinces. Indeed what matters is not so much the amount spent by various provincial governments on
education but the effectiveness of this, and that is judged by literacy rates and enrolment ratios. The per
capita spending of West Bengal and Punjab is higher than Kerala’s but it is Kerala that top the literacy charts
in the country.
Given its huge geographic area, not surprisingly, Uttar Pradesh has the largest number of universities, though
it is Maharashtra that has most colleges in the country. Uttar Pradesh accounts for the country’s largest
number of graduates (around 15.2%), followed by Maharashtra (13.7%) and Andhra Pradesh (8.1%).
Delhi has the most qualified population; around 16% of all persons living in Delhi have at least a graduate
degree. At all India level 6% of the country’s population (above the age of 10) is at least a graduate, and
another 12% has passed class 12 and/or has a diploma. Though Karnataka is considered to be the country’s
knowledge centre, it is Andhra Pradesh that has the highest proportion of science graduates in the country.
Of the12.1 million science graduates and diploma holders in the country, 14% are to be found in Andhra
Pradesh, Tamil Nadu is next with 11.9%, Maharashtra third with 11.1%, Uttar Pradesh fourth with 10.2%
and Karnataka gets into the list next with 7.5%. Not surprisingly, Maharashtra leads in terms of stock of
commerce graduates (22%). In terms of those enrolled in commerce at the graduate and higher levels in the
country, 16% are to be found in this Province. Gujarat again expectedly, ranks second with a 13.8% share in
the stock of commerce graduates. Indeed, over 30% of all Gujaratis who are either graduates or diploma
holders have studied commerce for their degrees. Of those who have enrolled in 2004, a third are studying
commerce.
In the year 2003-04, 2,469 patents were sealed out of which 1,078 patents were sealed by Indians from
Maharashtra region with a percentage share of 28.6%. USA topped the list of application for patents filed in
India by foreign countries with a share of 33.3%.
As on 1 April 2000, nearly 2,96,000 personnel were employed in R&D establishments in the country including
in-house R&D units of public and private industries. Of these, 31.7% were performing R&D activities,
30.4% were performing auxiliary activities and 37.9% were providing administrative and non-technical
support.
The modus operandi of the technology policy thus evolved has been two pronged as in the case of industrial
development in general. The policy has sought to provide protection to local technology/skills from the
imported ones, and on the other hand, the local generation of technology has been accelerated directly and
indirectly. The technological capability that has accumulated as a result of these policies is no doubt immense
and has brought the country near technological self-reliance in a number of industries. India has even been
able to export a wide range of technologies and products to other countries.
Indian software industry has made amazing progress over the last five years. Its export earnings were Euro
18.7 billion with a growth rate of 26% despite a slow-down in economy. India exports software to 95
countries; some of the major countries being USA, UK, France, Germany, Japan, China, South Korea,
Taiwan and Hong Kong. In the Drugs and Pharmaceutical industry, India has become a base for outsourcing
drugs having low cost of production.

S&T Structure, Infrastructure and Public Space92
Major Innovation Challenges and Policy Response
Challenge No. 1: Science and Technology capacity building in state enterprises and its impact on
innovation - With the establishment of scientific agencies like the Council of Scientific and Industrial Research
(CSIR), the Indian Council of Agricultural Research (ICAR) etc. India came to acquire a huge infrastructure
for science and technology, but excellence in technology development could not be achieved so as to compete
in the international market — the reason, India never had an export-oriented policy of economic development.
So far National Laboratories have only taken care of the protected domestic market. They have not oriented
themselves to developing highly sophisticated technologies. With the liberalization of the Indian economy late
in 1991, the competition has ratcheted up several levels. It is necessary for Indian Science and Technology,
therefore, to develop quality products and compete internationally. Scientific research and technological
development will benefit by developing self-reliance through learning-by-doing by way of focusing on state
enterprises as hubs for technology development.
Challenge No. 2: R&D excellence in Information Technology and Biotechnology - The IT industry is
highly knowledge intensive and requires R&D inputs on a regular basis. Most of the leading international
players especially those in Very Large Scale Integrated (VLSI) Chip design have set up their design and
R&D centres in India. Some Indian companies have also made successful entry into global R&D services
for developing world-class products. However, even though the software sector has done so well, there are
still a few challenges that have to be met.
The software export industry has been mainly concentrating on the services sector. Here, the overall
productivity, which is much lower than in the developed countries, needs to be increased. The IT services
sector has been able to provide sustained growth over the last decades. To continue with this growth Indian
industry needs to take immediate steps to move up the value chain. Though Indian professionals in the
software industry have contributed to the development of intellectual property, the Indian industry owns very
few patents. The performance of the software industry has been below expectations. For India to become
an IT superpower, it is necessary that an integrated approach that boosts the hardware and software sectors,
and strengthens manufacturing and lays emphasis on education, R&D and generation of IPR is evolved and
implemented.
India is well poised to embark upon Biotechnology-based national development. The underlying assumption
of the policy framework is that developments in the field of Biotechnology will have the greatest impact on
food, nutrition, health, environment and livelihood security.
Challenge No. 3: Technology development in manufacturing sector - Every sector of the Indian
manufacturing industry needs to be revamped by developing new innovations, whether it is information
technology, capital goods sector or pharmaceutical industry. India is quite well off in the software sector
through the innumerable outsourcing jobs undertaken for foreign companies but is far behind in the hardware
arena. For instance, India is exporting hardware goods worth only Euro 2 billion whereas China is exporting
hardware goods to the tune of Euro 40 billion. The reason India has a weak electronic component base is
because it is difficult to keep up with the latest technologies in microelectronics. The same is true for the
capital goods sector. India has to come up with an infusion of new technologies in the manufacturing sectors
to make them world class.

S&T Structure, Infrastructure and Public Space 93
Intensive efforts should be launched to develop innovative technologies of a breakthrough nature and to
increase the share of high tech products.
Innovation Governance and Policy Trends
India was the first country in the world to have, in 1951, a Ministry of Scientific Research and National
Resources for organizing scientific research for national development. The Scientific Policy Resolution
passed by the Parliament in 1958 laid down scientific objectives—pure, applied and educational. Active
pursuit of these policies bore fruit and educational institutions and scientific laboratories were established so
as to reap the benefits of scientific progress.
The next major landmark in the policy domain was the announcement of the technology policy of the
Government of India, at the Indian Science Congress held in January 1983 at Tirupati, Tamil Nadu. Apart
from reinforcing the above objectives, this resolution specifically called for developing internationally competitive
technologies with export potential, energy-saving technologies and technologies that would recycle waste
material. As for priorities, it called for consideration to be given to employment, energy efficiency of activities,
and environment.
In the field of acquisition of technology though, it called for a selective role of import of technology and
foreign investment. The policy specifically stressed the need for absorption, adaptation and subsequent
development of imported know-how through adequate investment in R&D for which importers of technology
were expected to contribute. In the context of the efficiency of the invention-innovation process, the role of
CSIR is of paramount importance.
Much has been written about the strengths and weaknesses of CSIR. The CSIR Review Committee in 1986
found that the multiplicity of objectives, sub-objectives, scale of operation, the lack of sustained and meaningful
interaction between the CSIR and its actual and potential users, and the lack of suitable incentive support
had in the past limited the usefulness of the CSIR. Some of the factors were beyond the control of the
scientific institutions; they were also affected by the industry’s influence and the regulatory regime.
Innovation governance: Key changes and issues: It is encouraging that CSIR issued a white paper, CSIR 2001:
Vision and Strategy. Among other things, it set the goal to achieve self-sufficiency in financing by 2001,
primarily through development of some niche areas in globally competitive technologies, holding of a patent
bank and realising 10% of operational expenditure from intellectual property licensing. Moreover, as a
strategy for achieving these goals, it called for development of an effective marketing system and adoption
of a stimulating intellectual property oriented outlook.
In 1991, the government introduced a liberalised policy for technology transfer. Apart from giving a large
number of tax concessions for R&D, the government also implemented a number of policy measures with
far-reaching significance in the field of science and technology. A Technology Development Board was
established with a three-fold strategy: a) facilitating development of new technologies, b) assimilating and
adapting imported technologies, and c) providing catalytic support to industries and R&D institutions to work
together.

S&T Structure, Infrastructure and Public Space94
Lately, the Science and Technology Policy–2003 declared by the Prime Minister recognises the changing
context of scientific enterprises to meet present and future national needs in the era of globalization
Trends in innovation policies: In the budget for 1994-95, the Fund for Technology Development and Application
was created wherein 5% cess on payment for royalty for imported technologies was credited. The budget
for 1995-96 strengthened this fund and released Euro 5 million. It proposed a one-time matching grant for
the modernization of laboratories of the CSIR and ICAR. Every commercial Euro that CSIR and ICAR
earn incrementally will be matched by another Euro from the budget.
In the draft of Eleventh Plan, among the specific issues that call for closer attention are: creation of a
conducive environment in the R&D institutions for minimizing hierarchical bureaucracy; emphasis on human
resources development and motivation as an element of qualitative fundamental research and applied research;
and development of scientific laboratories as nodal institutions forming consortia with the industry and other
departments.
The development of India’s technological capabilities may be reflected in the changes in sectoral composition
of gross fixed capital formation (GFCF) at constant prices. The share of machinery and equipment in GFCF
has gone up substantially. India has a history of some 40 years of manufacturing capital goods. Both kinds of
capital goods, the special purpose equipment for process plants (for chemicals, metals, minerals, consumer
goods, electrical power) and the general purpose machines amenable to mass production (machine tools,
transport equipment etc.) have been produced. In the process of vertical integration of manufacture from
assembly stage backward to individual components, a wide production base has been created. However,
capabilities of designing and further improving upon the product have not been developed for many kinds of
capital goods.
Future Actions and Opportunities for Policy Learning
What is the government’s role in advancement of science and technology up-gradation in a liberalized
market? In popular parlance, liberalization is equated to the withdrawal of state from the economic domain.
However, science and technology is a field where such a popular notion may turn out to be fallacious. It is
widely argued that there are three sources of market failure, viz., indivisibility, uncertainty and externalities.
R&D that seeks to generate knowledge suffers from all three types of market failure. Moreover, when
there is a wedge between private and social profitability; something that exists in pure research, private
finance may not be forthcoming. Thus, even in a deregulated regime, the state will have three specific and
selective roles in fostering science and technology, viz., financier of fundamental research, provider of
infrastructure, and regulator of property rights. The government is required to coordinate and guide technology
development since free markets might not suffice to create the technological dynamism that industrial growth
needs.
India has come a long way in her quest for scientific pursuit, both in material and intellectual spheres. Winds
of change have been blowing in the field of science in India. Information technology poses new challenges
and has opened up new opportunities. True, there is still much to be done in the policy and legal spheres. But
the direction is right. In the liberal environment, let thousands of ideas bloom and be trans-created into
innovative ventures by entrepreneurs. India has the talent, the skills and the resources to be in the forefront
of the technological revolution taking place in the new sectors of growth in the global economy.

S&T Structure, Infrastructure and Public Space 95
Science in Kerala – a snapshotScience in Kerala – a snapshotScience in Kerala – a snapshotScience in Kerala – a snapshotScience in Kerala – a snapshot
Having recognized that Kerala has had a long tradition of literacy and school education, it is of concern to
note that it is still behind leading states of the country, let alone comparative regions of the world (e.g. South
Korea, or the Scandinavian countries), when it comes to higher education and research. Although Indian
Scientific and Technological Research and Development activities have received substantial support, it has
still a long way to go to reach the level attained by the advanced economies. While a large number of R&D
establishments have been set up in the country, Kerala’s share in this has been insignificant. Opportunities
for those who are interested to pursue research in Kerala are meagre.
This section identifies the champions of research in Kerala and brings out a brief region-wise research
profile of Kerala on the national landscape. Data from SCOPUS (with emphasis on the output from Kerala
for the last ten to fifteen years) was used to do the analysis. It was found that leading researchers in the
state have either retired or are approaching retirement age. It is also to be noted that very few of them are
from the engineering area. So, there is an urgent need for generation of young researchers. Nevertheless,
the current resource can still be tapped as mentors and champions for spearheading the new initiative. They
also come from a few institutions, indicating that excellence in Kerala is highly concentrated in a few
premier centers.
To get the regional performance profile in terms of research intensity, the number of papers published from
various regions of Kerala was weighted for population of the corresponding cities (or conglomerations,
where appropriate). Thiruvananthapuram tops the list for research intensity, followed by Kottayam, Kochi,
Thrissur and Kozhikode (Fig 3-03.01). However, we also see that vast tracts of Kerala hardly have a
research culture. This should guide us to take remedial steps so that such imbalances are removed and bring
in the culture of research to regions where they do not exist now.
From a recent NISTADS study, it is seen that on Papers/Million of Population/Year basis, Kerala has only
a very middling performance, joining the company of states like Arunachal Pradesh and Mizoram. This is

S&T Structure, Infrastructure and Public Space96
worrying, given that Kerala has had a long and much vaunted tradition of literacy and school education. Fig
3-03.02 suggests that while a large number of R&D establishments have been set up in the country, and the
UTs and small states (Chandigarh, Pondicherry, Delhi, Goa) have benefited from this, Kerala’s share in this
has been insignificant.
The Council of Scientific and Industrial Research (CSIR) promotes scientific research in universities by
providing financial support for research projects under their Extramural Research Projects scheme. In a
four year period, Kerala completed four projects, of which three were in Life Sciences and one in Chemical
Sciences. No project in Physical or Engineering Sciences was proposed. Weak generation of demand from
Kerala reflects upon the state’s internal process. From an analysis of the current status of project grants
given by CSIR under its extramural research schemes in physics it was observed that even if all projects,
i.e. newly proposed, those actively under progress, and even those being terminated, are accounted for,
there is no current proposal from Kerala being funded by CSIR under this scheme! This is indicative of the
general poor health of Kerala’s research.
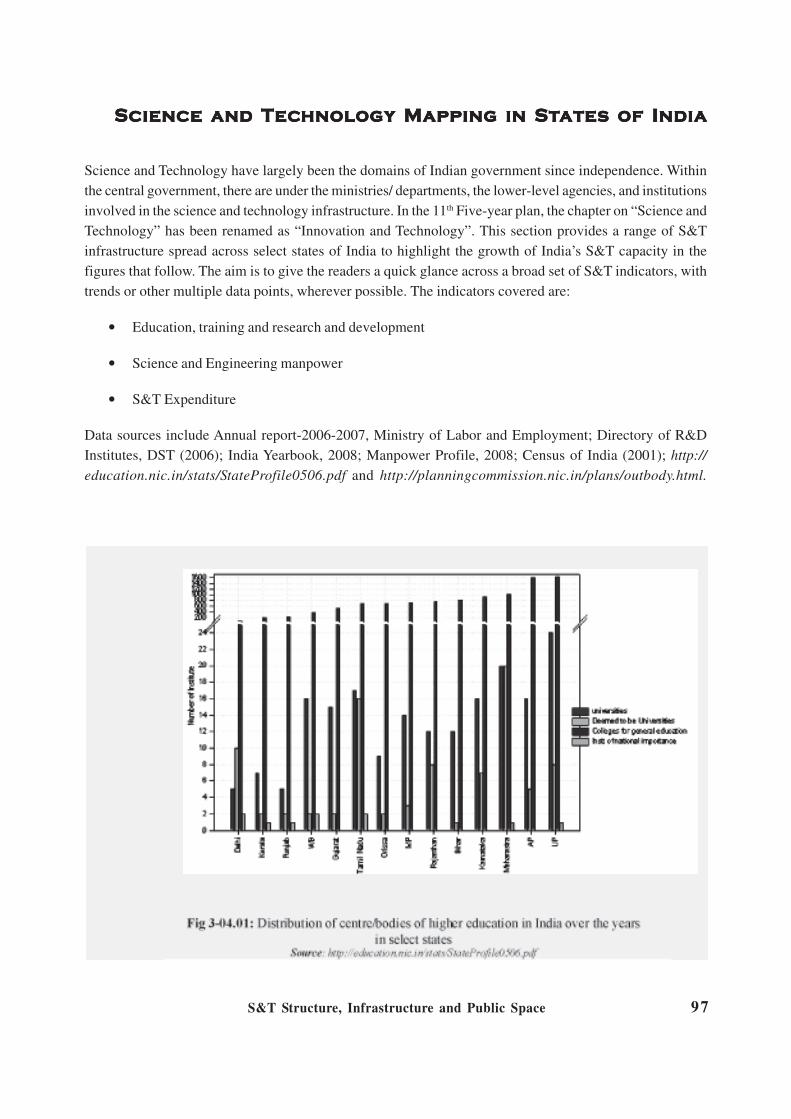
S&T Structure, Infrastructure and Public Space 97
Science and TScience and TScience and TScience and TScience and Tececececechnology Mapping in Shnology Mapping in Shnology Mapping in Shnology Mapping in Shnology Mapping in Stttttatatatatates of Indiaes of Indiaes of Indiaes of Indiaes of India
Science and Technology have largely been the domains of Indian government since independence. Within
the central government, there are under the ministries/ departments, the lower-level agencies, and institutions
involved in the science and technology infrastructure. In the 11th Five-year plan, the chapter on “Science and
Technology” has been renamed as “Innovation and Technology”. This section provides a range of S&T
infrastructure spread across select states of India to highlight the growth of India’s S&T capacity in the
figures that follow. The aim is to give the readers a quick glance across a broad set of S&T indicators, with
trends or other multiple data points, wherever possible. The indicators covered are:
• Education, training and research and development
• Science and Engineering manpower
• S&T Expenditure
Data sources include Annual report-2006-2007, Ministry of Labor and Employment; Directory of R&D
Institutes, DST (2006); India Yearbook, 2008; Manpower Profile, 2008; Census of India (2001); http://
education.nic.in/stats/StateProfile0506.pdf and http://planningcommission.nic.in/plans/outbody.html.
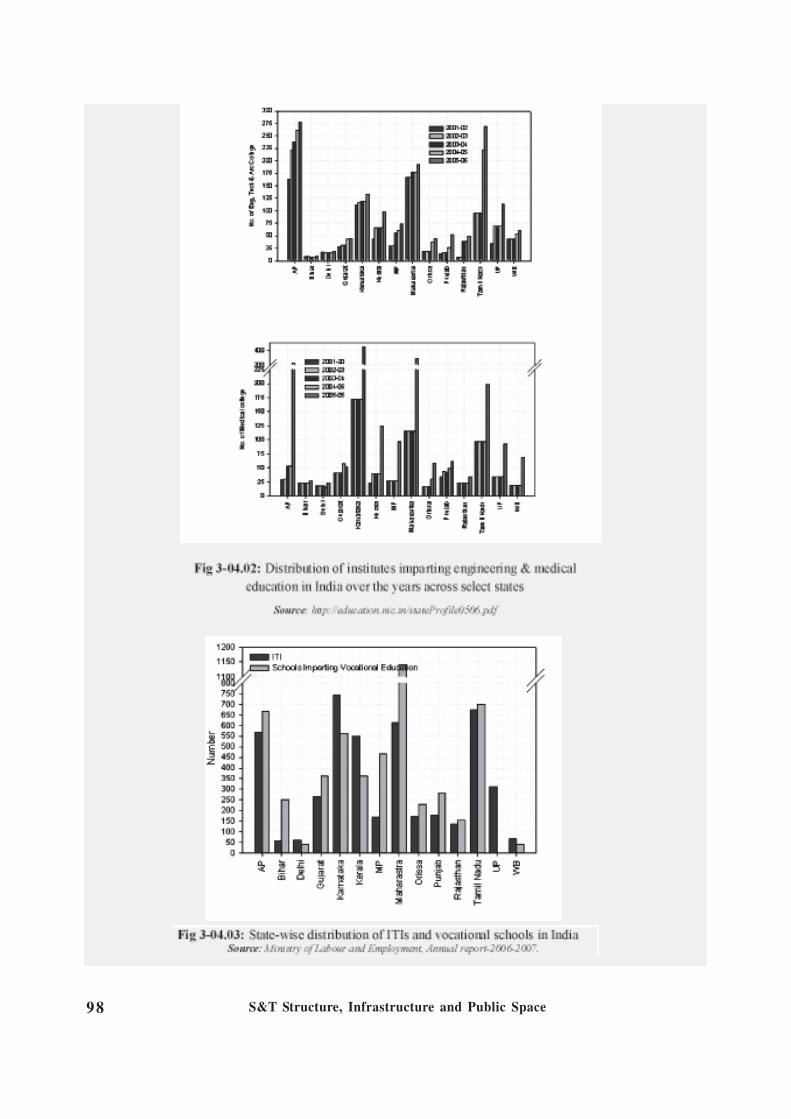
S&T Structure, Infrastructure and Public Space98

S&T Structure, Infrastructure and Public Space 99

S&T Structure, Infrastructure and Public Space100

S&T Structure, Infrastructure and Public Space 101
As reflected from the figures, some important observations are: the manpower generated in various states,
is not necessarily retained in the respective states. Moreover there exist disparities across states with
respect to presence of educational and R&D institutes, as well as in enrolment status. States like Andhra
Pradesh, Maharashtra, Karnataka and Tamil Nadu show large number of engineering and medical colleges
(Fig 3-04.02) due to presence of private institutes. Fig 3-04.07, however shows uniformity to some extent in
expenditure on education amongst the states. There is no wonder why Gujarat is a leading state as seen
from Fig 3-04.08, wherein the state expenditure on S&T is highest and at the same time it is increasing over
the years.
Technology Transfer Structure: GlimpsesTechnology Transfer Structure: GlimpsesTechnology Transfer Structure: GlimpsesTechnology Transfer Structure: GlimpsesTechnology Transfer Structure: Glimpses
Technology transfer (TT) from the linear perspective is the process by which basic S&T research is developed
into practical and commercially relevant applications and products for transferring to ultimate recipients. TT
from public funded research institutions to industry happens through:
a) Another organization acting as interface such as the National Research Development Corporation
(NRDC) and the Biotech Consortium India Limited (BCIL)
b) The efforts of research organizations.
The NRDC is a premier Knowledge Transfer Organization (KTO) in India. It is a Section 25 company
established in December 1953 under the Ministry of Science and Technology with a mandate to commercialize,

S&T Structure, Infrastructure and Public Space102
develop and promote indigenously developed technologies from universities, individual inventors, national
R&D Institutions, and similar bodies (www.nrdcindia.com/index.html). Up till 1986, NRDC had the sole
and absolute right to unencumbered intellectual property, produced by CSIR laboratories. Abid Hussain
Committee (1986) recommended an end to NRDC’s monopoly on knowledge generated in CSIR laboratories,
and CSIR laboratories became free to license and commercialize their technologies.
Mechanism of Technology Transfer - Value Addition: Actual transfer of technology takes place after a
legal agreement is executed by the client and NRDC which provides for certain initial payment and also
royalty at a fixed percentage of sales value for a specified period. Mechanical technology was dominant
during 1950’s, chemical technologies during in the 1960’s and later it was import-substitution and reverse-
engineering till economic liberalization in the 1990’s. At present, life science and biotechnology related
technologies are prominent. For the commercialization of many unproven lab scale technologies, the
Corporation does value addition by developing them either through equity participation or providing
developmental loans or grants. Amongst the very few profitable such entities the world over, the NRDC has
been earning modest profits. Over the years the Corporation has acquired more than 2,000 technologies and
licensed them to over 4,500 entrepreneurs. Trends in royalty earned, patents filed, number of technologies
received and the technology transferring agencies are shown in Fig 3-05.01, 3-05.02 and 3-05.03, respectivly.
Most technologies from the CSIR laboratories, post-1986, have been transferred directly to the transferees.
Case: Vaccine against Peste Des Petits Ruminants (PPR)
Technology Development: National Rinderpest Control Program was launched by Indian Council of Agricultural
Research during 1996. Indian Veterinary Research Institute (IVRI), Izatnagar undertook the research to develop
the vaccine against peste des petits ruminants (PPR) using a lineage 4 virus isolated in India. The developed
vaccine was tried on animals at laboratory level and then at state level. The technology was transferred to NRDC
for commercialization. However, the developed technology required further development for industrial use.
Value addition by NRDC: Corporation worked towards exact identification of the strain, basic engineering and
data generation for the upscaling the plant.
Commercialization of Vaccine: Technology was successfully commercialized by NRDC to two leading vaccine
manufacturing companies of India, Indian Immunological Ltd (IIL), Hyderabad and Intervet Ltd, Pune. NRDC
agreement with IIL was signed during 2004. Rs. 2.5 million was received as licensee fee (70% share for IVRI), with
a royalty at 3% for 10 years.
Results: IVRI at its Mukteswar and Izatnagar campuses has an annual sale of about Rs. 10 million since 2005/06.
Indian Immunological has sold vaccines worth more than Rs. 2 crores. Intervet has also scaled up the vaccine
production process.

S&T Structure, Infrastructure and Public Space 103
The BCIL was incorporated as a public limited company in 1990, under the Indian Companies Act 1956. It
is promoted by the Department of Biotechnology, Government of India and financed by the All India Financial
Institutions and corporate sector. BCIL has been actively involved in technology transfer along with
commercialization of other biotechnology related activities. BCIL acts as an interface between technology
sources and technology seekers both within and outside the country. By virtue of the network of national
and international linkages, it assists in technology sourcing, marketing tie-ups and identification of joint
venture partners. Technology transfer by BCIL involves screening for leads; evaluation of international
linkages; assistance in technology sourcing and marketing tie-ups; validation; scaling up; packaging; technology
pricing; entrepreneur selection; technology transfer; monitoring, support and consultancy. There are number
of technologies available and many of them have already been transferred to industries. BCIL makes efforts
for the successful commercialization of the technology by the licensee and continues to be a link between
the technology transferor and the technology recipient.

S&T Structure, Infrastructure and Public Space104

S&T Structure, Infrastructure and Public Space 105
TTTTTececececechnology Phnology Phnology Phnology Phnology Pararararark: Snapshok: Snapshok: Snapshok: Snapshok: Snapshotststststs
A Technology Park is an Industrial complex where all types of facilities are provided for the growth and
development of Technology Business Enterprises (TBE). However, the technology and business incubator
incorporates a new feature ‘graduation’, which implies that a start-up firm attains certain level of maturity
after a specific period of probation.
Software Technology Parks of India (STPI)
Set up in 1991, STPI is an autonomous organization under the aegis of Ministry of Communications and
Information Technology, with its headquarters in New Delhi. The very existence of STPI is to promote
100% export of Software and IT services. STPI acts as a single window in providing services to software
exporters and incubation infrastructure to SMEs. Companies are allowed complete duty-free import and
they do not need to pay corporate tax till 2010. At present there are 52 STPI Centers all over the country.
STPI- A case of Karnataka
The first Software Technology Park of India was set up in Bangalore (STPI-B) in 1990. STPI-B has in the
past incubated over 15 companies including the likes of Infosys in its early days. Fig 3-06.01 to Fig 3-06.04
below show the performance in terms of growth of software units, share in national export and export in
various categories.

S&T Structure, Infrastructure and Public Space106
Biotechnology Parks and Incubators: Glimpses
The biotechnology parks and biotech incubation centers provided a good template for the promotion of
biotech startup companies and for the promotion of public private partnerships. Such parks have been
established at Lucknow and Hyderabad. Other projects approved for Himachal Pradesh, Karnataka
and Kerala for setting up of biotech incubation/pilot plant facilities are at various stages of development.
These parks have come up through collaborations and are results of Central and State Government
initiatives. Some of them are:
Lucknow Biotech Park
Set up by the Department of Biotechnology on 8 acres of land provided by the Department of Science
and Technology, Government of Uttar Pradesh, the Biotechnology Park is now operational. It has a
number of facilities like a distillation unit, vermin-composting facilities, extraction plant, bio-business
centre and also a bio-informatics centre. Through the hardening facility for tissue culture, the park is
supplying hardened banana plants to State Horticulture Department for various districts. The park, in
collaboration with National Botanical Research Institute (CSIR), Lucknow has also supplied 3,70,000
elite quality Jatropha Curcas. There are around 17 tenant companies across various areas
(www.bitechcitylucknow.org).
MITCON Biotechnology Incubation Centre
MITCON Biotechnology Incubation Centre is sponsored by DST, Govt. of India & APCTT, New Delhi.
MITCON Biotechnology centre provides comprehensive updates on technologies that can be
commercialized, technical/entrepreneurial training, consultancy and product support services. The main
thrust area is agri-biotechnology (http://www.mitconindia.com/biotech_aboutus.htm).

S&T Structure, Infrastructure and Public Space 107
Shapoorji Pallonji Biotech Park Pvt. Ltd.
A joint venture Company with the Government of Andhra Pradesh. The park is a member of International
Association of Science Parks as well as Biotechnology Industry Organization, USA and has agreements
for mutual collaboration with the Research Triangle Park, USA, Technology Park Heidelberg, West
Germany and the Biotechnologies Park Luckenwalde, New Berlin. DBT has provided support for current
good manufacturing practices (cGMP) compliance for Pilot plant facilities. A pre-Biotechnology Incubation
Centre Process Generator (PBPG) Centre was set up at Indian Institute of Chemical Technology (CSIR),
Hyderabad (http://spbp.co.in/facilities.shtml).
Other BT Parks
Ticel Biopark Ltd: It has been established with joint venture of Tamil Nadu Industrial Development
Corporation Limited (www.tidco.com/bulid.html).
Akruti Biotech Park: It is a project undertaken by Gujarat Akruti TCG Biotech Limited (GATBL),
under mandate of the Government of Gujarat (www.akrutibiotech.com) and International biotech park
(IBP) is a joint venture project between the Maharashtra Industrial Development Corporation (MIDC)
and TCG Urban infrastructure Holding Ltd. (TCGUIH).
New Public Initiatives in BiotechnologyNew Public Initiatives in BiotechnologyNew Public Initiatives in BiotechnologyNew Public Initiatives in BiotechnologyNew Public Initiatives in Biotechnology
Biotechnology Industry Partnership Programme (BIPP)
Recently Department of Biotechnology (DBT) launched a highly industry-friendly initiative; the Rs 350
crore ($ 70 million), Biotechnology Industry Partnership Programme (BIPP). BIPP got formal federal cabinet
approval on November 8, 2008, a year after the unveiling of the New Biotechnology Policy, called the
National Biotechnology Development Strategy policy.
BIPP will run as a pilot project for two years, scaled up with additional resources after a thorough evaluation.
A notable feature of BIPP is that the operations of the scheme will be handled by an industry veteran who
will be assisted by a senior officer from DBT. The funds will be available to companies to take up really
innovative research programs and the government, for the first time, will assume all the risks associated with
it. The rewards will belong to the innovator/entrepreneur with a small royalty going back to the government
to shore up finances for further extension of the scheme. BIPP is also part of DBT’s public announcement
to allocate 30 percent of its budget allocations to the industry in the next five years. (http://
biospectrumindia.ciol.com/content/editorial/10812051.asp).
There are specifics goals of this proposed program like increasing the global competitiveness of Indian
industry. As a principle, BIPP would strictly promote high risk, transformational technology/process

S&T Structure, Infrastructure and Public Space108
development. No incremental development will be supported. On a broad basis, it is directed at path-breaking
research in frontier futuristic technology areas having major economic potential and making Indian industry
globally competitive, and focused on IP creation with ownerships by Indian industry (and where relevant,
collaborating scientists). Regarding relationship of SIBRI (an ongoing scheme) and BIPP; in SBIRI projects
require small initial resources whereas BIPP covers the whole value chain from early stage to late development
right through to commercialization.
Biotechnology Industry Research & Development Assistance Council (BIRAC)
BIRAC is being established by DBT to stimulate, foster and enhance the innovation capabilities of SMEs in
the Indian Biotech Sector. BIRAC is structured to offer a range of services specially designed to help
SME’s access key resources, new technologies, testing and validation facilities and financial assistance at
the right time. BIRAC would facilitate and promote industrial research through technology transfer and IP
management, technology acquisition and technology forecasting. In addition, there would also be a special
cell to address training and capacity building needs. The idea behind setting up of BIRAC is to have an
instrument of R&D and innovation within the companies, particularly SMEs, by creating a new organization
which has DBT, ABLE, BCIL as core partners. Their role in BIRAC would be independent of their role as
organizations. BIRAC is an agency, which will become the ‘innovation management agency’ of the government
in biotechnology. At present DBT has started the venture with Rs 350 crore.
Public R&D – PrPublic R&D – PrPublic R&D – PrPublic R&D – PrPublic R&D – Privivivivivatatatatate Induse Induse Induse Induse Industrtrtrtrtry Py Py Py Py Pararararartnertnertnertnertnershipsshipsshipsshipsships
Linkages between R&D agencies and industry in India, effected through the facilitating institutionalized
mechanisms of the government S&T departments and agencies as well as select academic institutions,
provide updates on the operational dimensions. Partnerships have assumed new importance in the context of
globalization. New paradigms in IPR generation and protection are posing novel challenges. Other factors
such as transition to a knowledge based economy, changing life cycles of products, the increasing cost of
doing R&D underscore the need for such partnerships.
In order to achieve better linkages India adopted a two pronged approach: one which relates to creating a
climate for indigenous development of technology in the country and the other for the transfer and adaptation
of technology imported from the advanced countries. However, accessing globally competitive industrial
technologies became more difficult due to the integration of the global trade/economy. Thus, in order to
survive, Indian industry had no option but to indigenously develop such technologies. The liberalized economy
gave Indian industry ample opportunity to develop new ideas and technologies, which could be sold globally.
The government has traditionally been supporting the ‘idea stage’ as part of its basic research efforts. The
idea generated having secured patenting needs packaging the technology or product into a saleable commodity,
which requires specialized skills in design and engineering. Commercial viability still remains uncertain and

S&T Structure, Infrastructure and Public Space 109

S&T Structure, Infrastructure and Public Space110
to overcome it the Government initiated various programmes/mechanisms and fiscal incentives, in the pre
and post-globalization periods (Table 3-09.01).
Under the zero based budgeting exercise, DSIR
has formulated the Technology Promotion,
Development and Utilization (TPDU)
programme by merging several existing
government schemes, viz. RDI; PATSER;
Scheme to Enhance the Efficacy of Transfer of
Technology (SEETOT) and the related activity
of APCTT. The specific components of the
scheme include Industrial R&D Promotion
Programme; Technology Development and
Innovation Programme; Technology
Management Programme; International
Technology Transfer Programme; Consultancy
Promotion Programme; and Industrial R&D and
Technology Information Facilitation
Programme.
Organization Specific Partnership Enabling Initiatives
Table 3-09.02 gives a snapshot of the partnership initiatives undertaken by premier R&D and educational
organizations of the country.
Besides these, several other initiatives are also taking place in a small way, e.g. the Entrepreneurship
Development Institute of India (EDI), an autonomous body set up in 1983, sponsored by apex financial
institutions, viz. IDBI, IFCI, ICICI and State Bank of India (SBI) and supported by Government of Gujarat
is committed to entrepreneurship education, training and research. To achieve its objectives EDI, with
sponsorship of NSTEDB of DST, has set up an Innovation Centre which is a national facility for innovations
and it prepares and maintains ‘Data Bank’ on innovative projects and new and advanced technologies.
Financial Institutions for Promoting R&D Agency-Industry Partnerships
Venture Capital (VC): The Indian VC industry is very young, but has matured fast. In 1988 the Technical
Development and Information Corporation of India (TDICI, now ICICI Ventures) was set up, soon followed
by Gujarat Venture Finance Limited (GVFL) and Andhra Pradesh Industrial Development Corporation
(APIDC) in early 90s, followed by entry of Foreign VC funds between 1995-1999 and emergence of
successful India-centric VC firms from 2000 onwards. Today there are about 150 VCFs (Government,
Overseas, Corporate, Domestic). The VC activity in India is mainly concentrated in a few places like
Mumbai, Bangalore, Delhi and Chennai.
Industrial Credit and Investment Corporation of India Bank Limited (ICICI): The Technology Group
of ICICI for the World Bank has been implementing the Sponsored Research and Development

S&T Structure, Infrastructure and Public Space 111

S&T Structure, Infrastructure and Public Space112
Programme (SPREAD), design of which was finalized after extensive discussions with the industry, CSIR
and other R&D agencies. The SPREAD programme’s objective was to encourage industry to substantially
increase R&D activities and the programme supported projects at all stages of the R&D cycle starting from
laboratory and pre-feasibility studies to prototyping and pilot plant operations. ICICI had assisted by about
2003/04, 101 projects with an aggregate assistance of about Rs. 70 Cr. Out of these, 48 have been
commercialized indicating a high success rate for R&D funding. Three industrial sectors, namely pharma/
biotechnology, electrical/electronic and chemicals/petrochem constituted ~65 % of the portfolio and the
projects in these sectors achieved more than 50% success rates. CSIR laboratories and institutes of higher
education (including IITs) played a major role in the success of the programme.
Industrial Development Bank of India (IDBI): Technology Financing Scheme of IDBI focused on
commercialization of indigenous technology, adapting imported technology for wider domestic applications
and on projects envisaging higher than normal risk with potential for commensurate high returns. It prefers
financing the technology development at the start-up level and provides the support in the form of equity,
conditional and convertible loans (preference share).
Small Industry Development Bank of India (SIDBI): The Technology Development and Modernization
Fund Scheme of SIDBI was launched to provide support for purchase of capital equipment, for need-based
civil works, for acquisition of additional land and need based additional margin-money for working capital,
acquisition of technical know-how, designs, etc.
Table 3-09.03 gives an account till 2005 of the various technology development funding mechanisms under
different schemes and programs of the government.
Cases of Technology Transfer
Various concepts employed in implementation of partnership programmes are:
• Lap race concept wherein equipment or technology(low end) development and transfer involves R&D
agency, industry and intermediary/promotional agency;
• Mother licensee concept wherein the promoter setting up the first project based on the invention
becomes the mother licensee;
• High technology, multi-ownership concept;
• Concept based on societal needs;
• Concept driven through Government legislation;
• Disruptive technology concept – which has very long gestation period, requires larger funds through
VC and a very large number of partnerships.
The partnerships may be formalized through formal or informal arrangements such as collaborative projects,
contracting or sponsoring research, consultancy, turn-key projects, or exchange of information/personnel or
sharing of facilities. In order to appreciate these modalities the summaries of fifteen cases of TT are
discussed in Table 3-09.04.

S&T Structure, Infrastructure and Public Space 113
case basis

S&T Structure, Infrastructure and Public Space114

S&T Structure, Infrastructure and Public Space 115
The CSIRThe CSIRThe CSIRThe CSIRThe CSIR
The Council of Scientific and Industrial Research (CSIR), established in 1942 is an autonomous society and
is an ensemble of 37 state-of-the-art institutes and 3 centers; over the years, the CSIR has served as a
springboard for scientific and technological activities in a wide variety of S&T domains. (Website:
www.csir.res.in/)
CSIR has a stock of highly specialized 4,600 scientists and 8,000 scientific and technical support personnel.
Apart from this it supports 7,000 research scholars at any given time for doctoral research in S&T throughout
the country and current project projection for annual production of doctorates in sciences and engineering is
about 1000 to 1500. CSIR is the single largest global source of expert manpower for the leather, food
processing, instrumentation and
mechatronics; with internationally
recognized training courses.
The research papers emanating from
CSIR’s laboratories are noted for their
quality with average impact factor/paper
showing an upward trend in the recent
years with nearly 4,000 papers in 2007
having an average impact factor/paper of
2.04 (Fig. 3-10.01). CSIR publishes about
17 research journals and two abstracting
journals and comprehensive state-of-the
art reports on specified subjects, and
databases such as the TKDL. As per WIPO Report 2007, among global public funded R&D organizations,
CSIR ranks eighth in PCT filing (98); and capture about 50-60 percent of total US patents granted to Indians
(excluding foreign assignees) during last several years. In India, CSIR tops the list of patent filers at IPO. It
currently holds a sizeable portfolio of about 1,800 foreign patents and about 1,500 Indian patents.
Inventions
Development of indelible ink, baby food from buffalo milk, tractor (Swaraj & Sonalika), pioneered DNA
fingerprinting, anti-malarial drugs, technology for early detection of diseases, transgenic crop plants, energy
foods, leather bio-processing, aircraft (HANSA & SARAS), energy saving buildings & Wealth of India
series of monographs, to name only a few.
Recent Initiatives
Open Source Drug Discovery (OSDD): A model similar to open source models in information technology;
it is an initiative to provide a global platform where the best minds can collaborate and collectively find
solutions associated with discovering novel therapies for tropical diseases like tubercularia.
CSIR 800: A project which enables 800 million poor Indians to enhance daily income through innovative
S&T based solutions in the areas of agriculture, energy and health.

S&T Structure, Infrastructure and Public Space116
New Millennium Indian Technology Leadership Initiative (NMITLI): A first of its kind model was initiated
to support R&D programmes in Public-Private Partnership (PPP) mode. It seeks to build, capture and retain
for India a leadership position by synergizing the best competencies of public funded R&D institutions,
academia and private industry.
Social Causes
Rural development: Rural development through inducting and infusing S&T based innovations in rural life
has been a vital mission for CSIR. Such S&T solutions cover a wide range of technologies from mechanized
agriculture, new cultivation techniques, water purification techniques, low cost housing and traditional ceramic
products utilizing locale-specific endowments etc. to name some.
Disaster management: A few examples - devastating Tsunami in 2004 or of floods in Bihar, CSIR undertook
the largest production of instant food by its R&D lab and provided 55 tonnes of food and also made available
sweet drinking water through reverse osmosis and electrodialysis techniques; and extended support through
large scale geoengineering experiments.
Drug development: But for technologies from the CSIR, the once costliest drugs could not have become
the globally cheapest; consistently working on affordable life saving drug development for the poor at a
global level, the CSIR has developed several processes and knowhow. It is worth mentioning that eleven out
of the fourteen new drugs developed in India are from CSIR. Some of them are anti malarial drugs- Elubaquine
& Arteether, technology for oral insulin and hepatitis B vaccine, anti-HIV cocktail etc.
Editors from India in Global JournalsEditors from India in Global JournalsEditors from India in Global JournalsEditors from India in Global JournalsEditors from India in Global Journals
A research journal as a forum for conducting discourses on science systematizes fields of knowledge. While
conducting discourses, the journal involves very large number of peer reviewers who indeed act as gatekeepers
and provide the field of knowledge an emergent structure. Readers of the journal appear only secondarily in
this process of discourse.
Countries in the periphery of S&T knowledge publish only a few research journals. More importantly, even
fewer number of peer reviewers of the submissions to journals published from the core developed countries
are drawn from the peripheries. Only a handful of journals publish such listing of peers. From the few
published sources it appeared that almost the entire community of peers resided and worked in proximate
geographies within the journal publishing developed countries. Dialogical space remained bounded therefore
within the geographies of publishing countries. From the journals, however, we computed country affiliations
of the editorial boards and/or editors who significantly influence the discourse. Such influences prove critical
in the selection of research problems. In other words journal editors often set the research agenda. The
following figure reflects on the distribution of editors.

S&T Structure, Infrastructure and Public Space 117
Distribution of publications infrastructures greatly varies over countries. We collected data about more
than thousand global journals and 40% of these appear from USA alone, 16% from UK, 8% from Germany,
6% from Japan, and the developed countries together (excluding Russia and Israel) publish 93% of these
journals. Only 1% of these come out from China (however, publishing business houses in recent time have
started bringing out more journals from China). India brings out less than 1% of these journals.
Disease CoDisease CoDisease CoDisease CoDisease Covvvvverererereragagagagage in We in We in We in We in Web Editions of teb Editions of teb Editions of teb Editions of teb Editions of thrhrhrhrhree Indianee Indianee Indianee Indianee Indian
English Language DailiesEnglish Language DailiesEnglish Language DailiesEnglish Language DailiesEnglish Language Dailies
The coverage of seven diseases- HIV/AIDS, Diabetes, Dengue, Malaria, Tuberculosis, Chikungunya and
Avian Influenza in three Indian English language newspapers for the year 2007 shows how public discourse
gets shaped by S&T. The newspapers selected for the study were web editions of Hindustan Times,
Times of India and Indian Express. Search was carried out using the name of the disease as the keyword.
Fig 3-12.01 and Fig 3-12.02 indicate the distribution of articles and words in different newspapers for
different diseases.

S&T Structure, Infrastructure and Public Space118

S&T Structure, Infrastructure and Public Space 119
S&T CoS&T CoS&T CoS&T CoS&T Covvvvverererereragagagagage in Enge in Enge in Enge in Enge in English-languaglish-languaglish-languaglish-languaglish-language Indian dailiese Indian dailiese Indian dailiese Indian dailiese Indian dailies
The coverage of science and technology related items in English-language dailies in India throws light on the
quantum of space allocated to different subjects by different newspapers, positioning and spread of S&T
items, and identifying the newspapers that accorded priority to science and technology related items.
The study is confined to a period of three months from 01-3-2008 to 31-05-2008. A set of 36 newspapers
published from different parts of the country were taken for the purpose and an attempt was made to cover
almost all the regions. In case of newspapers publishing multiple editions, only the main edition formed the
source of this study. The newspapers were scanned to identify the science and technology (S&T) related
items, which were subjected to content analysis. These S&T items were categorized into 31 different
subjects. The space occupied by each item was measured in square centimeters (cm2) and its positioning in
the newspaper along with column spread was also recorded.
The Times of India published from New Delhi emerged as the leading newspaper, which carried the maximum
number of items (577) allocating maximum space (77,412 cm2), followed by The Asian Age (177 items and
34,451 cm2), The Hindustan Times (155 items and 29,508 cm2). Among all the 31 subjects, the maximum
number of items (939) was published in the area of health, followed by environment (343), astronomy (162),

S&T Structure, Infrastructure and Public Space120
biological sciences (146) and space science and technology (133). These five subjects together accounted
for 72% of the items and ~ 66% of the total space. The rest of the space was distributed among 26 other
disciplines. The area of health and biological sciences together constituted 45% of all the items occupying
34% of total space. Fig 3-13.01 presents the total S&T space in different newspapers and Fig 3-13.02
depicts the broad distribution of S&T related items.

S&T and Industry 121
S & T and Industry
Overview
The role of S&T for the industry of the country in the age of increasing returns must be novel. Industrial
institutions developed over last six decades remained influenced by institutions under decreasing return. The
complex of banking and financial institutions, stock markets, regulatory institutions and fiscal, legal or the
executive and the managerial systems often celebrated structural models of industry that were expected to
grow large. Contemporary concerns refer to sustainability, resources constraints, globalisation of resources,
increased global control over commodities and increasing global cartel control over knowledge resources.
Justifiably S&T for industry needs to take care of national security, inter-generational security and ecological
sustainability, most importantly of generation of employment and wealth as well as its redistribution. The
global dominance of market-based institutional approach is currently suspect; a degree of balance between
complex wings of state political/executive control and market based institutions appear to be the preferred
middle path. Market institutions, moreover, when under influences of very large incumbent corporations
remain distorted. S&T is often expected to unleash the entrepreneurial bazaar of tiny industrial players that
would, assisted by increasing returns knowledge institutions, upturn the applecart of large incumbents’
domination.
Post-WTO the distance between domestic and global markets has shrunk. S&T for industry thus needs to
be politically strategic, taking into consideration the dynamics of globalisation and its imperatives, while
formulating policies for small local domestic markets. The country’s S&T policies for XIth Plan thus made
innovation the central theme. Innovation in the knowledge-age of increasing returns demands the setting up
of new policies, instruments, infrastructures and geographies, and especially of S&T capability as well as
capacity. Last few years witnessed several policy departures and experienced the process of setting up of
new mechanisms such as grants to R&D, restructuring funds, sector regulations, sector financing, skill
development funds and similar other funds. In parallel large private incumbents from industry undertook
more R&D; the small and medium units initiated productivity gaining innovations of non-R&D types. However,
large unemployment, inefficient use of resources and less than desired expansion of domestic market in
many sectors remained serious and Indian S&T for industry faces multiple tasks: care for the poorest
multitudes especially in the rural areas through envisioning a sustainable development model of knowledge
intensive resources-saving small centres of production; care for the high-tech ultra-rapid growth possibilities
of increasing return industries; care for security of the country; and support gains in productivity in old
industries.
The following description through coverage of multiple facets, bring out only certain saliencies. The challenge
to the country is complex and Indian S&T system requires a very large boost in building up of capacity,

S&T and Industry122
capability and increasing-returns institutions. S&T would provide the most important resources to the industry
of the near future.
In the following snapshots the description begins with a macro picture of three sectors and subsequently
captures through input consumption scenario the innovative changes in Indian industry at the inter-sector
level. The subsequent sections capture two major strands: the R&D based fiscal policy supported innovations,
and, other policy supported non-R&D innovations in industries. Further down the pages, new instruments
supportive of innovations such as the fund-based mechanisms and their successes have been captured. Still
later narrations capture S&T in conjunction with sectors of automobiles, biotechnology and pharmaceuticals,
telecommunications, herbal, biomedical, energy and advanced materials.
The full text of these extended summaries is available at http://www.nistads.res.in

S&T and Industry 123
Salient FSalient FSalient FSalient FSalient Featureatureatureatureatures of Gres of Gres of Gres of Gres of Grooooowtwtwtwtwth, Efh, Efh, Efh, Efh, Efffffficiency andiciency andiciency andiciency andiciency and
Technical Change in the Indian EconomyTechnical Change in the Indian EconomyTechnical Change in the Indian EconomyTechnical Change in the Indian EconomyTechnical Change in the Indian Economy
ooooovvvvver Sixty Yer Sixty Yer Sixty Yer Sixty Yer Sixty Yearearearearearsssss
After a moderate growth for over thirty
years since 1950, Indian economy
experienced a major structural change
whereby the growth rate jumped up
dramatically. But there was no
commensurate growth in employment.
The structural change also involved
changes in the composition of output
and employment in the major sectors.
In keeping with the trend for the overall
economy, a noticeable change in the
growth of manufacturing and services
has also been observed since 1979,
much before the initiation of economic reforms in the country. For the agricultural sector, the break occurred
long back, in 1965 marked by the introduction of Green Revolution technology.
The share of NDP originating in agriculture declined substantially from more than 50 percent in 1950-51 to
around 20 percent in 2003-04. As is clear from Fig 4-01.01, in manufacturing, income share has been rising

S&T and Industry124
at a slow rate from less than 10 percent in 1950-51 to around 15 percent in 2003-04. The services sector, in
terms of its income share, grew at a relatively faster rate.
One of the important features of rapid economic
growth has been the regional differentiation in
industrialization. Maharashtra and Gujarat
together account for almost 34 per cent of the
total value of gross output by the country’s
factory sector. Maharashtra has been continuing
to occupy the top position despite its share
declining from 24.7 percent in 1971-72 to 19.3
percent in 2001-02. Gujarat gained second
position by raising its share significantly from 10
percent to 15 percent during the same period.
The eastern region states, on the other hand,
have been continually losing their prominence.
West Bengal’s share in value added by India’s
factory sector declined drastically from 13.4 per
cent in 1971-72 to 4.4 per cent in 2001-02.
Rajasthan and Uttar Pradesh in the north-
west and Madhya Pradesh in the central
region experienced a marginal increase in their
shares, as did the three southern states of
Andhra Pradesh, Tamil Nadu and Karnataka
(Table 4-01.01).
An analysis of the growth performance in the
pre and post-reform periods indicates that a large
number of states namely, Andhra Pradesh,
Assam, Gujarat, Haryana, Karnataka, Madhya
Pradesh, Maharashtra, Tamil Nadu and Uttar
Pradesh were able to raise their output growth
rate of the registered manufacturing sector,
whereas it declined in the remaining states. The
phenomenon of job-destroying growth was quite
prominent in most states during the pre-reform
period, which has become more wide spread in
the post-reform period.
Indian industries also exhibit significant inefficiency, with the mean efficiency score varying from 32 percent
in 1970-71 to 84 percent in 2002-03. Productive efficiency had been accelerating in the second half of 1970s,
followed by a decelerating phase. At the end of this decade Indian industries experienced efficiency loss and
in the 1980s it showed a rising trend, although at fluctuating rates. In the early part of 1990s, the efficiency
State

S&T and Industry 125
was again decelerating which began to rise in the second half with a high degree of fluctuation. There has
been substantial inter-state variation in efficiency score in industrial activities. The mean efficiency scores in
industries of the western states over 1970-71 to 2002-03 are significantly higher than that of the other
regions. Maharashtra has been at the top in mean efficiency score over the past three decades and Gujarat
ranked third. West Bengal, in the eastern region, experienced relatively lower efficiency not only compared
to the western states but also compared to many other states of the country. During this period the mean
efficiency has been the lowest in Orissa. Mean efficiency score however, increased at varying rates in all
the states after deregulation – it was much higher for the western states and lower for the eastern states.
The time path of technical change follows a more or less rising trend, with some fall in early 1980s and late
1990s (Fig 4-01.02). Although technical progress had improved roughly consistently between these periods,
it started to deteriorate since 1997-98. There is a sharp variation in technical change across major states
(Table 4-01.02). Technology contributes relatively more in the industrial leading state of Maharashtra together
with some other states like Himachal Pradesh and Madhya Pradesh. Gujarat however, lags behind them and
many other states in the country in terms of technical change. Andhra Pradesh and Kerala experienced
lowest contribution of technology in the factory sector. Technical progress in West Bengal has been just
above these southern states. Technological advancement in industrial activities contributed more to output
growth during 1986-87 to 2002-03 compared to the earlier period at relatively faster rates in some states like
Gujarat, Maharashtra, Uttar Pradesh and West Bengal.
Technical Changes in the Indian Economy as EvidentTechnical Changes in the Indian Economy as EvidentTechnical Changes in the Indian Economy as EvidentTechnical Changes in the Indian Economy as EvidentTechnical Changes in the Indian Economy as Evident
frfrfrfrfrom Inom Inom Inom Inom Input-Output Tput-Output Tput-Output Tput-Output Tput-Output Tables 1ables 1ables 1ables 1ables 1993-9993-9993-9993-9993-94 and 2003-04 and 2003-04 and 2003-04 and 2003-04 and 2003-044444
Input-output (I-O) tables published by the Central Statistical Organization (CSO), Ministry of Statistics and
Programme Implementation, Government of India, provide details of the use of the output of one industry/
sector by all the other industries/sectors and the use of the outputs of all the individual industries/sectors as
inputs by each industry/sector for its production. The data on input is in terms of factor costs and cannot
indicate quantity of respective inputs. The Input-Output table also provides technology matrix where each
column represents different amounts of the various commodities, shown in the rows, required to produce
one unit of the commodity represented by the column.
A change in the elements of a column vector of the technology matrix over an interval of time represents
technological changes in the production of the commodity. Technological changes in the input-consuming
commodity production allow changes in inputs and technological changes in some or all of the input commodities
allow substitution or other kinds of changes in the input-vector constituents or in their relative weights.
Further, a technological change brings about changes in relative prices and thus we might argue that innovation
is about bringing about changes in relative prices which reflect the bargaining strength of respective producers
as captured by the changes in the column vectors of the I-O matrix in the post-innovation phase.

S&T and Industry126
Innovation in the Economy
A large number of descriptions of innovation remains limited to novelty within a firm or at the most within a
sector or within a competition milieu. A firm or a sector is embedded within a larger matrix of input-output
and therefore, changes within the former are bound to create repercussions within this I-O matrix. In the
inter-sector framework, innovation in one sector would thus entitle that sector to cheaper capital, cheaper
better resources, larger market and most importantly better or monopoly price entitling that innovator to the
innovator’s profit. Innovation is thus the dynamic engine operating a shift in the economic structure. In a two
period system of two matrices, this structural shift can be captured to indicate whether the economy as a
whole has innovated or failed to do so. Although there are alternative definitions of innovation, we would
simply describe the shifts in the inputs as descriptors of corresponding changes in both technology and
relative prices. In this section we have analyzed some sectors of the Indian economy by observing changes
in a few select inputs, such as energy, feedstock including agricultural inputs, machine tools and other mother
machineries.
Assuming increased use of machine tools and other capital machineries indicate enhanced capability and
innovation and lower use of energy also similarly enables better innovative positioning of a sector, the
following description provides a guide to the inter-sector movements in innovative capability.
Technological Changes in Relation to Crop Production
Among food crops, paddy, wheat, and pulses have experienced substantial raise in input consumption per
unit value of output primarily due to higher value of inputs coming from food crops (which in turn reflects
high increase in the prices of seeds) and industrial input, between 1993-94 and 2003-2004 (Table 4-02.01).
Energy input has increased substantially for rice, but for wheat input of electricity has in fact fallen. In all the
cases inputs from industry have risen (less so for maize) and correspondingly the inputs of innovations in
non-agricultural sectors have raised their relative share in the consumption by food crops production system.

S&T and Industry 127
Among the non-food crops, input value per unit value of output increased substantially for sugarcane and
cotton and moderately for jute and tobacco. Use of chemical inputs increased in most of the cases. Use of
allied agricultural products as inputs has increased only in sugar cane but declined in all other cases. Food
crops as input were found only for sugarcane where it increased substantially. In contrast to food crops,
inputs from industrial system in non-food crops had marginal rise over this period.
Technological Changes in Relation to Allied Agricultural Activities
In allied agricultural activities, input value per unit of output value increased only for other livestock products
and for rest of the cases it either remained constant (e.g. forestry products and fishing) or declined (milk and
milk products) as shown in Table 4-02.02. Use of food crops for the production of per unit value of milk and
other livestock products, although quite high per se, declined.
Technological Changes in Relation to Agro-processed Industries
In agro-processed industries, the input values per unit of output value are found to decline for vanaspati and
tobacco products and increase for sugar and edible oils. However, the input values are very high for both

S&T and Industry128
the set of years indicating very high level of consumption of industrial inputs. In sugar, the use of food crops,
allied agricultural products and textiles as inputs per unit value declined and that of food products, wooden
furniture, chemical and other machinery increased (Table 4-02.03). This indicates relative decline in the
prices of food crops vis-à-vis agro-processed products, inter alia this indicates lower outcome of innovation
for food crops vis-à-vis agro-processed products.
Technological Changes in Relation to Textiles
In textile industries such as Khadi, silk textiles, silk carpet weaving and readymade garments witnessed
increase in input consumption per unit value of output whereas for cotton, woolen, jute and miscellaneous
textiles products there has been marginal change in input consumption per unit value of output (Table 4-
02.04). In art silk and synthetic fibres, the major increase occurred for the inputs from chemical products
and the major decline occurred for the inputs like textiles, and other machinery. Predominance of a few
petro-chemicals producers enabled them to raise relative prices of their products like synthetic fibres or
filaments. In garments, the use of textiles as inputs declined to a large extent per unit value of output

S&T and Industry 129
reflecting larger value addition to fabric or changes in relative bargaining positions of the garmenting and
fabrication sectors. With the exception of carpet weaving, all the textiles categories raised the consumption
of energy inputs per unit value of output.
Technological Changes in Relation to Furniture, Wood Products, etc.
The industry groups: furniture, wood & wood products, paper, leather, food processing and leather products
- have reduced the use of other machinery as input per unit of value of output. Printing and publishing too has
reduced consumption of machine tools while increasing marginally the consumption of other machinery as
its input. The same pattern is noted with respect to the use of allied agricultural products as input. The use of
chemical products increased for furniture and wood & wood products and declined for paper, printing,
leather footwear and leather & leather products. In fact the input of products directly from industry has
decreased in most of the sectors. In wooden furniture and wood products and leather and leather products
energy inputs in the unit value of their outputs increased whereas it declined in the case of paper and paper
products, printing and publishing and leather footwear due to decline in electricity consumption.
Rubber, Plastic Petroleum and Coal Products
In rubber products the total input per unit value of output has slightly increased over the period. Among its
inputs major increment is found for chemical, and major decline is found for textiles. For the plastic products
the share of inputs in unit value of output increased significantly although the use of chemical and other
machinery declined. Total inputs cost decreased for petroleum products and for coal tar products. Energy
intensity declined for rubber, petroleum and coal tar.
Chemical Industries
Among the chemical industries major increase in the value of input per unit output is found for inorganic
heavy chemicals, organic heavy chemicals, fertilizers, synthetic fibres & resins primarily due to increase in
consumption of chemical products. Drugs & medicines and other chemicals also moderately raised consumption
of chemicals per unit value of their output. Pesticides, paints, varnishes and lacquers, soaps, cosmetics and
glycerin reduced consumption of chemical products but the first and last groups reduced total input consumption
in unit value of output. This would again reflect the corporate control of the industries wielding greater
market power and thus the ability to raise relative prices. Excepting inorganic heavy chemicals, fertilizers
and other chemicals, all the groups reduced energy intensity.
Non-metallic and Metallic Mineral Products
For most of the industry groups in this category the general trend has been towards reduced input values for
machine tool and other industrial machinery while the feedstock, most often from allied industrial sectors and
rarely from agriculture, either raised or failed to decline in general their respective input values. Quite likely
this decline in use of machinery reflects stagnation in technical changes. Increase in value of industrial
feedstock is also possible from a rise in relative price, consequent to technical stagnation and capacity
underutilization in respective feedstock industries. The broad picture might therefore indicate stagnation in
industrial technological changes.

S&T and Industry130

S&T and Industry 131
Machinery Industries
The uses of machine tools and other machines have substantially increased in the unit value of the output of
ships and boats, rail equipment, motor vehicles, motorcycles and bicycles. The use of wooden furniture on
the other hand declined in all these cases excepting rail equipment. As it appears, these two broad groups
have generated technological changes as reflected in their upward consumption of generative capacities
embedded in machine tools and other industrial machinery.
Imports of Technology Intensive Inputs
I-O Tables, along with the production and flow of different commodities across all the commodities, also
provide data on imports of different commodities. Although it is not possible to discern whether the imported
good is used for production or consumption, or to locate the industry using the particular good, looking at the
nature of the imported good one can have an idea whether it is used for production or consumption or both.
Estimates of the ratio of import to total production indicate that it substantially declined for machine tools
(34.5 to 19.2%) and other machinery (33.7 to 21.7%), transport equipment (26.9 to 9.4%) and chemical
products (15 to 13.9%) between 1994 and 2004. Energy sector, however, substantially raised the ratio from
19.8 to 28.9% over the period. The decline in the ratios for capital goods or heavy chemicals implies that
either the domestic capital goods sector is capable of meeting the demand generated by the domestic industries,
or the domestic demand for capital goods did not rise much during this period. But the actual domestic
production of these goods increased many fold as indicated by I-O tables. It needs to be mentioned that
since imported capital goods embody latest, often state of the art technologies, their decline would slow
down modernization of industries in general.
Trends in High Technology TradeTrends in High Technology TradeTrends in High Technology TradeTrends in High Technology TradeTrends in High Technology Trade
The Indian economy is now on a high growth trajectory, registering a growth of around 8 per cent in the present
decade. The economy is now more integrated with the world. While the process of reforms has moved the
economy to a higher plateau, the natural question is whether India can move up the technology ladder like the East
Asian tigers? It should be manifested in the growth of high-technology manufacturing industries and knowledge-
intensive service industries. It should be accompanied with the growth of India’s trade in the above two segments
in the global marketplace. Below, we have made an objective analysis to examine the status of the same vis-à-vis
other major economies.
What constitute high technology segments? The standard approach that is commonly used to identify technology-
intensive industries and products is the product approach. The product list is based on the calculations of R&D
intensity by groups of products (R&D expenditure/total sales). Exports and imports of these products comprise
high technology trade. According to European Union’s definition of high technology trade, the following commodities
comprise the same:

S&T and Industry132
(1) Aerospace (2) Computers-office machines (3) Electronics-telecommunications (4) Pharmacy (5) Scientific
instruments (6) Selected Electrical machinery (7) Selected Chemicals (8) Selected Non-electrical machinery
(9) Armaments
India’s high technology trade has increased from US $ 1,021 million in 1995 to US $ 4,463 million in 2006. During
the same period, the export of high technology trade of Brazil has increased 8 times, while that of China has risen
by 25 times! The share of high technology trade in India’s GNP at 0.49 percent in 2006, is the lowest among the
group of selected countries. If India has to emerge as an economic powerhouse in the 21st century, the country
needs to improve its position significantly in the arena of high technology trade. Between the years 1995 and 2006,
India’s share in global high technology trade has increased marginally from 0.14 percentage points to 0.23 percentage
points. India lags far behind China in capturing global market place. This is not surprising given the fact that India’s
share of high technology exports in total manufactured exports has hardly changed between the years 1995 and
2004.
With the opening up of the economy and easing of the embargo on high technology imports, India seems to
have improved its position between the years 1995 and 2006. India’s import of high technology trade has
jumped from US $2,621 million in 1995 to US $23 billion in 2006. This corresponds to a share of 1.16 percent
in world’s high technology imports in 2006 as compared to a partly share of 0.36 per cent in 1995. However,
its share in GNP is still small compared to other emerging/developed economies or BRIC member countries.
A principal reason for India’s insignificant position in the global space of high technology trade is her virtual
absence in some of the product categories. For instance, take the case of aerospace instruments. India exported
only US $5 million in 2006, whereas a country like Israel exported US $39 million, Korea US $547 million and
Brazil US $3,585 million.
India exhibits a better presence in the global market of trade in computer office equipments. India exported
US $275 million and imported US $3,760 million worth computer office equipment in 2006. Except China,
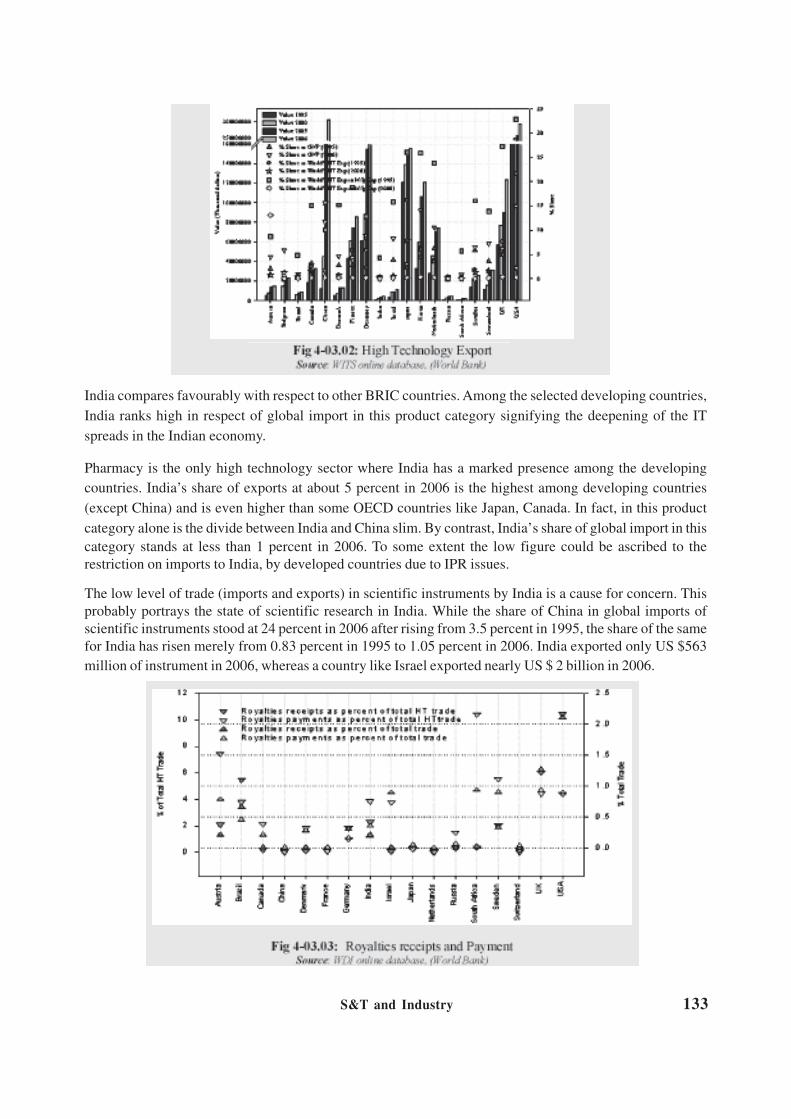
S&T and Industry 133
India compares favourably with respect to other BRIC countries. Among the selected developing countries,
India ranks high in respect of global import in this product category signifying the deepening of the IT
spreads in the Indian economy.
Pharmacy is the only high technology sector where India has a marked presence among the developing
countries. India’s share of exports at about 5 percent in 2006 is the highest among developing countries
(except China) and is even higher than some OECD countries like Japan, Canada. In fact, in this product
category alone is the divide between India and China slim. By contrast, India’s share of global import in this
category stands at less than 1 percent in 2006. To some extent the low figure could be ascribed to the
restriction on imports to India, by developed countries due to IPR issues.
The low level of trade (imports and exports) in scientific instruments by India is a cause for concern. This
probably portrays the state of scientific research in India. While the share of China in global imports of
scientific instruments stood at 24 percent in 2006 after rising from 3.5 percent in 1995, the share of the same
for India has risen merely from 0.83 percent in 1995 to 1.05 percent in 2006. India exported only US $563
million of instrument in 2006, whereas a country like Israel exported nearly US $ 2 billion in 2006.

S&T and Industry134
India is a late entrant in the global marketplace of armaments. Recently India has made a decision to be a
player in this market. India has been able to increase its exports of armaments from US $325 million in 1995
to US $4,363 million in 2006. Its share of 0.05 per cent in the global export market is currently low given the
size of her economy. There is no reason why India cannot improve her position in this category.
In the last two decades, the service sector has been growing faster than the manufacturing sector and is
driving economic activity around the world. The aggregative picture is encouraging. India’s commercial
exports have more than doubled between the years 1995 and 2006. The share of India in world exports of
commercial services stands at 0.64 percent in 2006, which is even higher than that of China, Korea, Israel,
South Africa. The category commercial services include transportation as well as travel, which is not a
knowledge intensive service industry. The share of computer, communication and other services in commercial
service exports of India, which basically represent knowledge intensive service industry, stands at 74 percent
in 2006. Thus, it indicates that India has been fairly successful in the global market of knowledge intensive
service industries. India’s position is the highest among the BRIC countries in this category.
By and large, India’s performance on the high technology manufacturing trade front is not too impressive.
Unlike China or Brazil, India is a small player in most of the product categories barring pharmacy sector. In
the last ten years period, India has not been able to increase her presence significantly in most of the
segments. By contrast, China, starting from a similar base like India in some of the segments, has exhibited
marked improvement. Since pharmacy is one sector where India is doing well, it would make sense to
nurture this sector. It is also surprising that India, with a large scientific base, occupies such a small share in
respect of trade in scientific instruments. As our analysis indicates that there is a direct link between royalties
and high technology trade, it is important to encourage this segment.

S&T and Industry 135
Our analysis indicates that
India has performed relatively
well in the knowledge intensive
service industries. However,
this has happened primarily
due to the significant growth of
the area of computer and
information services. However
in the coming years, other
segments like financial services,
insurance services, health
services, entertainment
services are more likely to
grow at a rapid pace. If India
is to emerge as an important
player in the knowledge
intensive service industries, we
need to improve our presence
in these segments. At present, we are small players in these categories.
Industrial R&D in India: Broad Indications
There are two sources of data on industrial R&D in India. The first one is a Department of Science and
Technology (DST) publication called “R&D Statistics” and the second one is the on line database “Prowess”
of the Centre for Monitoring Indian Economy (CMIE). The main difference between the two is that the
latter is much more disaggregated than the former. Moreover it is the only source from where one can get
firm level data. We use the DST data in this analysis.
DST based data: Three conventional indicators used are:
i) Trends in R&D investment;
ii) Trends in patenting;
iii) Trends in technology trade balance.
Trends in R&D Investment
Both in nominal and in real terms, there has been a decline in the overall Gross Expenditure on R&D
(GERD); and the GERD to GDP ratio has declined during the post reform period. From this, one has to be
very cautious in drawing any strong inferences about the innovative potential of the country. This is because

S&T and Industry136
much of the GERD of the country is performed in the public sector in defence, space, atomic energy, health
and agriculture. However the share of the business enterprises sector has shown sharp increases. It now
accounts for about 20 per cent of the R&D (Table 1-04.01). The corresponding figure for China is as much
as 64 per cent. The higher education sector represented by universities and research institutes accounts for
only 5 per cent of total R&D performed in the country. Notwithstanding data problems, it is clear that the
share of this sector has shown only slight increases during this period.
Growing privatization of Industrial R&D:
Increasingly much of the industrial R&D is
actually expended by private sector enterprises.
An important hypothesis is that one sees a
decline in the growth rate of industrial R&D
when increasingly that R&D is performed by
private sector enterprises (Table 2-04.02). Does
this mean that the private sector is experiencing
any Arrowian appropriability problems? This
hypothesis makes the study of external financing
of industrial R&D in India a relevant one.
During this phase when investments in R&D are declining one sees that the government is putting in place
a number of financial support measures that seeks to reverse this declining trend.
Industry-wide distribution of R&D: Within the industrial sector six industries (pharmaceutical, automotive,
electrical, electronics, chemicals and defence) account for about two-thirds of the total industrial R&D. The
Year
Year

S&T and Industry 137
pharmaceutical industry alone accounts for about 20 per cent of the total R&D expenditures. It may not be
incorrect to say that India’s national system of innovation is dominated by the sectoral system of innovation
of the pharmaceutical industry. Second in line is the automotive industry. Both the industries are also
characterized by competitive structures with a number of foreign and domestic manufacturers co-existing
and competing with each other.
Trends in Patenting
Among the BRICS (Brazil, Russia, India, China and South Africa) countries, India has registered the highest
growth rate in patenting (Table 2-04.03). From an earlier analysis, it is seen that most of the Indian patents
are by domestic companies and that too in the pharmaceutical area. However in the more recent period, the
share of patents secured by affiliates of MNCs based in India is on the increase.
Triadic patent data [patents secured by an inventor from three different patent offices (USPTO, European
Patent Office and Japanese Patent Office)] also show that India has registered one of the highest growth
rates in Triadic patent grants during the period 1975 through 1995.The performance of the country in patenting
confirms the results obtained in R&D investments, namely that most of the patents are secured by domestic
private sector companies that too in the area of pharmaceutical technologies.
Trends in Technology Trade Balance
India’s technology trade balance has been negative and rising all through the more recent years. However,
in the period since 2005, it has turned positive essentially due to the receipts under R&D outsourcing. India,
along with China has now become a major recipient of R&D outsourcing deals. Most of India’s R&D
outsourcing deals is in the areas of pharmaceutical and telecommunications industries.
Thus, based on the evidence presented it can safely be argued that India’s innovation performance has
actually improved if one takes the output measure of R&D. Regarding investments in R&D, although the
growth rates in GERD have actually declined; that expended by the industrial sector, led by private sector
enterprises, has actually shown an increase. Another point appears from the analysis is that the country’s
innovative performance is concentrated in certain specific industries such as the pharmaceutical and as
such is not widespread.
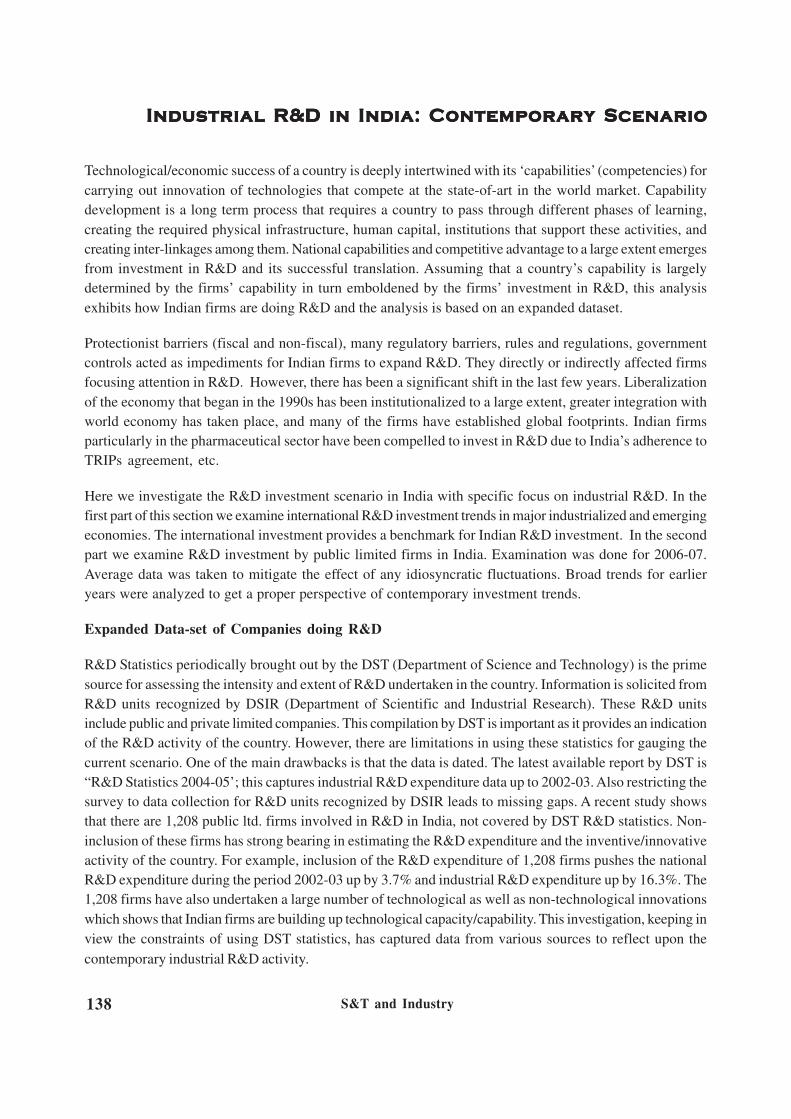
S&T and Industry138
Industrial R&D in India: Contemporary ScenarioIndustrial R&D in India: Contemporary ScenarioIndustrial R&D in India: Contemporary ScenarioIndustrial R&D in India: Contemporary ScenarioIndustrial R&D in India: Contemporary Scenario
Technological/economic success of a country is deeply intertwined with its ‘capabilities’ (competencies) for
carrying out innovation of technologies that compete at the state-of-art in the world market. Capability
development is a long term process that requires a country to pass through different phases of learning,
creating the required physical infrastructure, human capital, institutions that support these activities, and
creating inter-linkages among them. National capabilities and competitive advantage to a large extent emerges
from investment in R&D and its successful translation. Assuming that a country’s capability is largely
determined by the firms’ capability in turn emboldened by the firms’ investment in R&D, this analysis
exhibits how Indian firms are doing R&D and the analysis is based on an expanded dataset.
Protectionist barriers (fiscal and non-fiscal), many regulatory barriers, rules and regulations, government
controls acted as impediments for Indian firms to expand R&D. They directly or indirectly affected firms
focusing attention in R&D. However, there has been a significant shift in the last few years. Liberalization
of the economy that began in the 1990s has been institutionalized to a large extent, greater integration with
world economy has taken place, and many of the firms have established global footprints. Indian firms
particularly in the pharmaceutical sector have been compelled to invest in R&D due to India’s adherence to
TRIPs agreement, etc.
Here we investigate the R&D investment scenario in India with specific focus on industrial R&D. In the
first part of this section we examine international R&D investment trends in major industrialized and emerging
economies. The international investment provides a benchmark for Indian R&D investment. In the second
part we examine R&D investment by public limited firms in India. Examination was done for 2006-07.
Average data was taken to mitigate the effect of any idiosyncratic fluctuations. Broad trends for earlier
years were analyzed to get a proper perspective of contemporary investment trends.
Expanded Data-set of Companies doing R&D
R&D Statistics periodically brought out by the DST (Department of Science and Technology) is the prime
source for assessing the intensity and extent of R&D undertaken in the country. Information is solicited from
R&D units recognized by DSIR (Department of Scientific and Industrial Research). These R&D units
include public and private limited companies. This compilation by DST is important as it provides an indication
of the R&D activity of the country. However, there are limitations in using these statistics for gauging the
current scenario. One of the main drawbacks is that the data is dated. The latest available report by DST is
“R&D Statistics 2004-05’; this captures industrial R&D expenditure data up to 2002-03. Also restricting the
survey to data collection for R&D units recognized by DSIR leads to missing gaps. A recent study shows
that there are 1,208 public ltd. firms involved in R&D in India, not covered by DST R&D statistics. Non-
inclusion of these firms has strong bearing in estimating the R&D expenditure and the inventive/innovative
activity of the country. For example, inclusion of the R&D expenditure of 1,208 firms pushes the national
R&D expenditure during the period 2002-03 up by 3.7% and industrial R&D expenditure up by 16.3%. The
1,208 firms have also undertaken a large number of technological as well as non-technological innovations
which shows that Indian firms are building up technological capacity/capability. This investigation, keeping in
view the constraints of using DST statistics, has captured data from various sources to reflect upon the
contemporary industrial R&D activity.

S&T and Industry 139
Capturing data from public sources was confined to public limited companies as they divulge their detailed
data (i.e. as per legal requirements only public ltd. firms have to submit details of their various activities
including R&D to the Ministry of Company and Law Affairs). The limitations of this investigation are mainly
in two. Firstly, private firms make limited disclosures as they have no legal binding to divulge their capital and
other activities in details and therefore, sketchy account of their R&D expenditure and related statistics can
be gathered from secondary sources. Thus, these firms were not considered in this investigation. Secondly,
primary survey provides valuable insights which cannot be captured by secondary sources. However, a
good estimation of contemporary scenario of industrial R&D activity can be obtained by investigating public
limited companies, as studies have shown that they are the major driver of industrial activity in the country.
There are approximately 10,000 public limited companies that have time series data available at least for
three years. This constitutes the target population. All firms within this population that have shown R&D
investment is taken as the sample for this study. It is possible to get the time series data of the above 10,000
companies from CMIE, through their Prowess database. Among the reasons of using this database for the
above assessments is that these 10,000 or so companies contribute 70% of industrial revenues and are thus
indicative of the industrial activity of the country. This motivated the use of this data source to examine
industrial R&D in India. Annual reports, IBID (newspaper clipping database), red herring listings, company
websites were also used to enrich the data.
R&D Investment : International Scenario
R&D spending by a country is used as one of
the primary indicators in gauging the
competitive capability of a country (see for
example World Economic Forum, 2008).
India is the 4th largest economy of the world
in PPP (purchase power parity) terms after
US, China and Japan. However, it fares poorly
in the world map of R&D spending. Table 4-
05.01 highlights this aspect.
The low investment in R&D is an indication
that India is still involved in activities that are
not creating higher value at different levels.
This assertion can be made as expenditure in
research is an indication of commitment of a firm/research organization to search for novel ways of producing/
creating new products. It can also be observed from Table 4-05.01 that India’s spending has remained
constant from 2006 to 2008. China shows upward trends. Fig 4-05.01 depicts the source of R&D funding in
some major economies.
From Fig 4-05.01 two groups of countries can be discerned based on source of R&D funding. Mainly the
industrialised economies and some emerging economies (such as China) have industry as the major source
of R&D funding. On the other hand, government funding is the major source for R&D in developing economies
such as India, Brazil, and Hungary. Industrialised economies in general have R&D expenditures over 2%

S&T and Industry140
of GDP. Developing economies have
R&D expenditures ranging between
0.5% to 1.5% of GDP. From the
above we can deduce that R&D
investment by industry plays a major
role in pushing the R&D spending as
a share of GDP. One of the lessons
one draws from the above analysis
is the importance of industry in
investing in R&D activity.
The results of R&D spending are
reflected in various intangible (such as
patents) or tangible outcomes such as
new products/processes developed (or
more efficient products/processes), high
technology exports. Patenting
particularly in the US patent office
(USPTO) has been used as yardstick to
measure the competitive capability of a
country, and is widely used for inter-
country comparison on R&D
productivity. India’s overall patenting
activity in the USPTO in terms of granted
patents was less than the other major
Asian economies namely China, Israel, Korea and Taiwan (Fig 4-05.02). Further, it may be observed that
MNC’s in India and China were more active in patenting then domestic firms. India’s high technology
exports were also less than other Asian economies. For example in the total manufacturing export, India’s
high technology export was only 4.88% in comparison to China’s 29.19 % in 2005 (World Development
Indicator, 2006).
Industrial R&D-Indian Scenario
India has a huge R&D infrastructure with 400 national laboratories, 1,300 recognized in-house industrial
units, besides several government departments and private institutions and foundations engaged in scientific
research. R&D is also undertaken in the 358 universities in the country. There are approximately 500
foreign R&D centers in India. In spite of this impressive R&D infrastructure in the country, the amount of
funds invested in R&D is below 1% of GDP. However, during the last few years positive trends in R&D
investments were observed. The National R&D expenditure in 2005-06 was Rs. 28,776.65 crores and has
been projected to attain a level of Rs 32,941.64 crores in 2006-07 and Rs 37,777.90 crores in 2007-08 (R&D
Statistics at a Glance, 2008). The share of R&D expenditure as a percentage of GNP has also increased
from 0.58% during 1990-91 to 0.89% in 2005-06. Industrial R&D expenditure comprising both public and
private sector was about Rs. 8,748.20 crores. The investment in R&D has more than doubled for private
sector industries in 2004-05 from that in 2002-03. For 2005-06 private sector investment was Rs. 7,444.21

S&T and Industry 141
crores and is expected to reach Rs. 11,192.86 crores in 2007-08 (ibid). The industrial sector spent 0.55% of
its sales turnover on R&D activities in 2005-06.
Besides regular R&D budgets allocated to various organizations, extramural funding is also provided by
scientific departments/agencies to R&D organizations to build general R&D capabilities and provide special
encouragement to scientists to pursue research careers. The extramural R&D funding commitment by
Central government S&T departments/agencies was Rs 1,163.80 crores in 2005-06 (2007, Directory of
Extramural Research & Development). There were 3,569 projects approved for funding during 2005-06.
Biological sciences (682 projects) attracted the maximum number of projects. However, the maximum
extramural expenditure was in medical sciences; its 565 projects incurred an expenditure of 372.84 crores.
This was 49.16% of the total approved extramural grant during 2005-06. University Grant Commission
(approved 758 projects), Department of Biotechnology (approved 422 projects), and Council of Scientific
and Industrial Research (approved 247 projects); were the other prominent agencies involved.
As outlined earlier R&D has never been a major concern for Indian industry. Liberalization and subsequent
opening up of the Indian economy from 1991 onwards are beginning to make significant impacts. Lowering
of custom duties, amendment of the patent act, foreign investment and entry of multinational companies
with large R&D centers, corporate research centers and joint efforts with Indian partners are effecting the
change.
Table 4-05.02 highlights the firms undertaking R&D investment (this is drawn from the population of 10,064
firms, in different periods of time). R&D intensity is defined as R&D expenditure divided by sales.
Normalization of R&D by firm sales controls for the effect of firm size, which affects the return per unit of
R&D effort. It shows significant positive growth in number of R&D firms from 1990 to 1995 (we define a
firm as an R&D firm if it has undertaken R&D investment). The growth trend is slower after 1995 with
minor negative fluctuations in some years also. However, absolute value of R&D investment has significantly
increased over the years. There has been almost a 770% increase in R&D investment in 2007 from that in
1995; although the increase in number of firms undertaking R&D investment has been marginal. The number
of R&D firms in 2000 was more than that in 2007. However, R&D investment in 2007 was 387% more than

S&T and Industry142
that in 2000. The R&D intensity does not show these high growth rates as sales have also increased
significantly over the years. The proposition that R&D investment contributes to sales is supported by this
empirical data.
Characteristics of Firms Undertaking R&D in 2006-2007: There were 1,055 firms from the population
of approx. 10,000 firms that had made investment in R&D for the period 2006-07.
Key Findings
• Many of the firms were incorporated more than fifty years ago. It is however, not possible to ascertain
when individual firms undertook first investment in R&D.
• Western region was found to be the major centre of location of the R&D firms.
• Chemical sector emerges as the dominent sector in which firms had made R&D investment. Automobile,
Food & Beverages and Instrumentatation are the other sectors where firms had made R&D investment.
In the later period there is emergence of software firms.
• Small firms (sales < 100 crore) were the key drivers of R&D activity. Firms in this category devoted
almost 6% of their sales in R&D (this is on an agggregate) as compared to range of 0.45 to 1% for
firms from other categories (sales above 100 crores).
• R&D intensity was high for pharmaceutical industry (6.7%) and Chemicals (2.42%). Textile (0.19%),
Basic metals (0.15%) and Non-metallic (0.16%) were hardly contributing to R&D. Software sector
had moderate investment intensity (1.15%).
• Foreign promoter share (FPS) acted as an inducement for R&D investment. Firms that had FPS >
75% had R&D intensity of 1.68% in comparison to firms with no FPS (0.63%).
We should be cautious in making generalized interpretations from the above findings. Firstly, these statistics
emerge from a snapshot analysis of average activity in two year period 2006-2007. Secondly, the firms are
restricted to only public limited entities.
FDI in R&D in IndiaFDI in R&D in IndiaFDI in R&D in IndiaFDI in R&D in IndiaFDI in R&D in India
R&D internationalization is not a new phenomenon. It is an activity for resource exploitation and augmentation
through various channels beyond the national boundary. It is a global search for talented human resources,
conducive research environment and low cost for R&D activities. The implications are global, national and
at firm level. MNCs are expanding their domain of R&D activities overseas, in the following three ways:
Joint venture, Greenfield, Mergers and Acquisitions.

S&T and Industry 143
The focus of this investigation is on the following issues:
• How and why R&D internationalization is taking place?
Firms are decentralizing their R&D activities to different geographical regions as a part of their business
strategy. Why firms are looking beyond their home country for R&D activities is an important issue for
understanding global innovation networks.
• Patterns and trends in R&D internationalization (Global)
Global firms are seeking the shores of emerging economies to have access to their S&T resources.
More and more R&D centers of global firms are setting-up in India and China. This brings in a new
dimension to the issue of R&D internationalization.
• Indian Scenario
Presence of global firms in R&D activities is growing with more R&D investment coming in various
sectors like IT, drugs and pharmaceuticals, biotechnology, automotive etc. The pattern of flow of FDI
in R&D by various countries in different sectors in India is important here. It has resulted in R&D
clusters by MNCs. The other dimension of it has been that many Indian firms have also expanded their
R&D activities to other regions.
Internationalization of R&D
Internationalization of R&D is a phenomenon of the late eighties. Many MNCs set up production facilities in
the growing markets overseas through their subsidiaries, or through collaborations with local companies. In
many cases products have to be modified to suit local tastes, conditions, and also locally sourced materials or
components. R&D facilities were created to address such needs for modification of the products and
technologies. The present trend of internationalization of R&D, however, goes much beyond this practice.
The present trend is more about attaining or retaining global competitiveness by having access to R&D
infrastructure and capabilities from multiple sources; developing global networks.
New Trends in R&D Internationalization
Internationalization of R&D has entered a new phase, with MNCs’ overseas investments increasing in the
Asian region. China and India are emerging as the most preferred destinations for MNCs for setting-up their
dedicated R&D centers. According to ‘The Economists Intelligence Unit survey, 2007’, India emerges as
the most preferred destination for R&D location, followed by US and then China. Now, firms from India are
also expanding their R&D, production and marketing activities. Main reasons behind this new trend are:
• Escalating Demand on S&T Infrastructure
• Prohibitive Cost of Highly Skilled Manpower
• Resource Scarcity in Developed Countries
S&T and Industry144
According to Economist Intelligence Unit 2004, out of many reasons, India’s R&D activities and highly
skilled labor force have been the carrots for R&D FDI entering India. This gives a new perspective –
emerging economies being sought by the global firms for augmenting their knowledge resources.
Indian Scenario
Foreign R&D Centers in India: Internationalization of R&D and innovation in the Indian context is the
measure of FDI inflow and outflow in R&D (as a percentage of total R&D investment in India). MNCs,
Indian firms, universities and the public research institutes together contribute to the process of
internationalization. It is a measure of the nature and type of R&D activities undertaken by the MNCs in
India and also of the R&D activities of Indian firms outside India. It is also a measure of the extent of Indian
R&D and production system getting linked to the global R&D system, through MNCs R&D activities in
India.
According to a TIFAC report, over 100 foreign organizations (mainly MNCs) have opened R&D centres in
India over the last decade. The flow of foreign R&D is mainly concentrated in few areas like software
development, auto design, drug design and pharmaceuticals, hardware and product design. Earlier, many
MNCs had R&D set-ups as support structures to their production units. Latter entrants are however opening
dedicated independent R&D centers for taking up R&D activities in new/emerging research and high tech
areas. During 1996-2000, new countries established their R&D centers in India and countries that already
had R&D centers have established more during the same period. This has been a phase when India became
a centre for global R&D activities. There are 16 countries whose MNCs have established their R&D
centers in India. US have the maximum number of R&D centers with maximum R&D workers employed.
Country-wise R&D investment: Firms from different countries have been setting up their R&D centers in
India. USA has invested maximum of 860.88 million US $ in India followed by Korea, Germany, China, UK,
France, Netherlands, etc. These countries also established R&D centers in different locations in India. USA
was far ahead of all other countries (in 2003) with 53 R&D centers followed by UK, Japan and Germany,
each having 7 R&D centers. USA also employed maximum manpower in India. It is also evident that more
R&D centers were established during 1996-2000 when India was emerging as an R&D hub.
Sector-wise R&D units: Global firms have been setting up more R&D units in IT sector (71) followed by
automotive (23), drugs and pharmaceuticals (13), biotechnology (8), aerospace (7) and agriculture (6).
These firms have setup 128 R&D units in India.
Sector-wise foreign R&D investment by global firms: IT sector got maximum FDI investment in R&D
followed by automotive, biotechnology, aerospace, drugs and pharmaceuticals and agriculture during 1998-
2003.
Indian IT sector: Indian IT sector has attracted the maximum investment from global firms. This gives an
important insight to the issue of R&D internationalization where most of the global IT giants have their R&D
operations in India and have linkages with Indian R&D and production system.
It is seen that the top 7 globally spending IT firms have their R&D operations in India. They have set-up their
dedicated R&D centers. Many of the top global IT firms established their R&D centers in India around
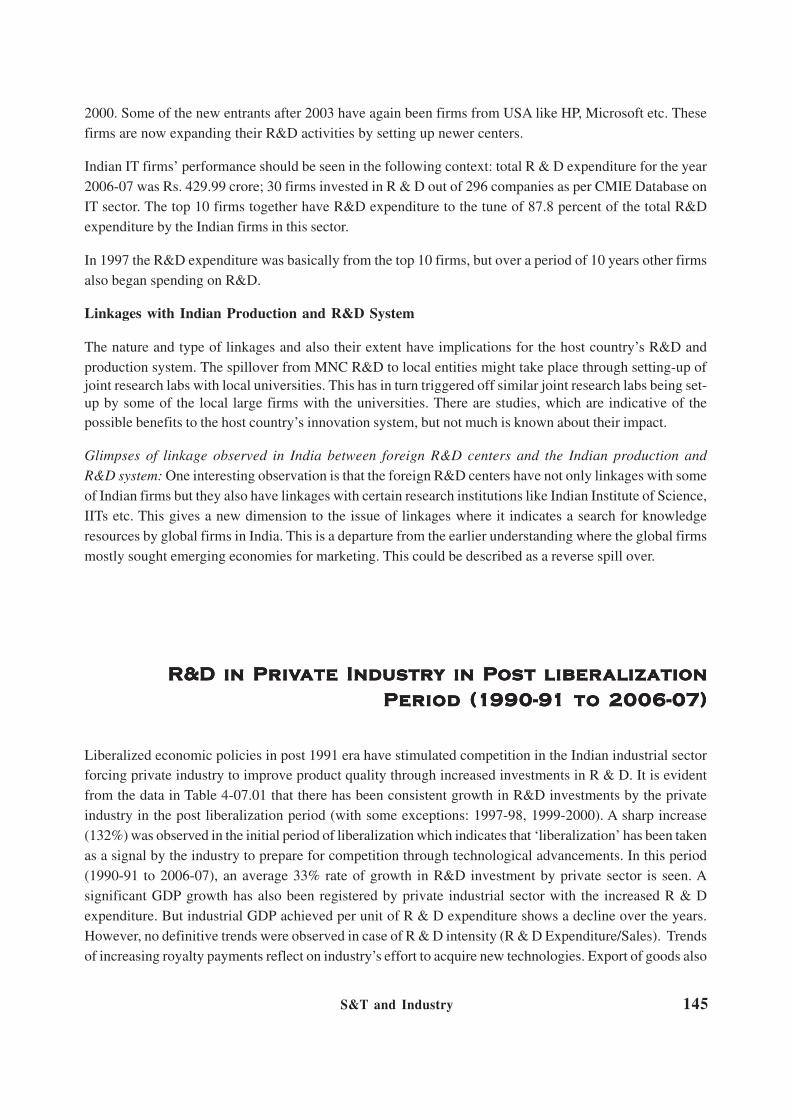
S&T and Industry 145
2000. Some of the new entrants after 2003 have again been firms from USA like HP, Microsoft etc. These
firms are now expanding their R&D activities by setting up newer centers.
Indian IT firms’ performance should be seen in the following context: total R & D expenditure for the year
2006-07 was Rs. 429.99 crore; 30 firms invested in R & D out of 296 companies as per CMIE Database on
IT sector. The top 10 firms together have R&D expenditure to the tune of 87.8 percent of the total R&D
expenditure by the Indian firms in this sector.
In 1997 the R&D expenditure was basically from the top 10 firms, but over a period of 10 years other firms
also began spending on R&D.
Linkages with Indian Production and R&D System
The nature and type of linkages and also their extent have implications for the host country’s R&D and
production system. The spillover from MNC R&D to local entities might take place through setting-up of
joint research labs with local universities. This has in turn triggered off similar joint research labs being set-
up by some of the local large firms with the universities. There are studies, which are indicative of the
possible benefits to the host country’s innovation system, but not much is known about their impact.
Glimpses of linkage observed in India between foreign R&D centers and the Indian production and
R&D system: One interesting observation is that the foreign R&D centers have not only linkages with some
of Indian firms but they also have linkages with certain research institutions like Indian Institute of Science,
IITs etc. This gives a new dimension to the issue of linkages where it indicates a search for knowledge
resources by global firms in India. This is a departure from the earlier understanding where the global firms
mostly sought emerging economies for marketing. This could be described as a reverse spill over.
R&D in PrR&D in PrR&D in PrR&D in PrR&D in Privivivivivatatatatate Induse Induse Induse Induse Industrtrtrtrtry in Py in Py in Py in Py in Pososososost libert libert libert libert liberalizationalizationalizationalizationalization
PPPPPerererereriod (1iod (1iod (1iod (1iod (1990-9990-9990-9990-9990-91 t1 t1 t1 t1 to 2006-0o 2006-0o 2006-0o 2006-0o 2006-07)7)7)7)7)
Liberalized economic policies in post 1991 era have stimulated competition in the Indian industrial sector
forcing private industry to improve product quality through increased investments in R & D. It is evident
from the data in Table 4-07.01 that there has been consistent growth in R&D investments by the private
industry in the post liberalization period (with some exceptions: 1997-98, 1999-2000). A sharp increase
(132%) was observed in the initial period of liberalization which indicates that ‘liberalization’ has been taken
as a signal by the industry to prepare for competition through technological advancements. In this period
(1990-91 to 2006-07), an average 33% rate of growth in R&D investment by private sector is seen. A
significant GDP growth has also been registered by private industrial sector with the increased R & D
expenditure. But industrial GDP achieved per unit of R & D expenditure shows a decline over the years.
However, no definitive trends were observed in case of R & D intensity (R & D Expenditure/Sales). Trends
of increasing royalty payments reflect on industry’s effort to acquire new technologies. Export of goods also

S&T and Industry146
shows a consistent growth in the earnings through exports of goods by the private industries. Rate of growth
for export of goods is found to be appreciable in the past few years (2002-03 onwards). However, in terms
of innovation, industry has shown a decreasing trend in terms of sales achieved per unit of compensation
given to employees, money spent on power consumption and raw material (Fig 4-07.01). A further analysis
in terms of geographical distribution for selected sectors i.e. cement, processed food and chemicals shows
lowest concentration of firms in eastern region of the country.
Expenditures in terms of R & D and Royalty; Sales, export of goods & export of services for top 10 sectors
(of the sectors covered here) of private industry has been shown in Fig 4-07.02. Similarly expenditures in

S&T and Industry 147
terms of R & D and Royalty, sales, export of goods & export of services for bottom 10 sectors of private
industry have been shown in Table 4-07.02. Both the top and bottom 10 sectors have been chosen on the
basis of sales during the period 1990-91 to 2006-07.
Fig 4-07.02 exhibits that there is very little or no correlation among different parameters. However, it can be
seen that manufacture of chemicals and chemical products has incurred highest expenditure on R & D
followed by manufacture of motor vehicles, trailers and semi-trailers. It can be seen that post and
telecommunication sector has incurred highest expenditure on royalty payments and has achieved highest
export in services. Highest sales and export of goods are achieved by manufacture of coke, refined petroleum
products and nuclear fuel.

S&T and Industry148
PPPPPattattattattattererererern of Innon of Innon of Innon of Innon of Innovvvvvation and R&D in Select Sectation and R&D in Select Sectation and R&D in Select Sectation and R&D in Select Sectation and R&D in Select Sectororororors bs bs bs bs byyyyy
Listed and Other Companies of IndiaListed and Other Companies of IndiaListed and Other Companies of IndiaListed and Other Companies of IndiaListed and Other Companies of India
Innovation behaviors of listed firms are likely to be different from business enterprises that are not listed,
such as privately held family firms. The listing entitles a firm access to supposedly cheaper capital market.
Listing also makes it obligatory on the part of companies to divulge performance and investment data beyond
what accounting standards require. This probe is based on much of such data provided by listed companies
as also by other companies and as provided by the Prowess database of the Centre for Monitoring Indian
Economy (CMIE).
Most stock exchanges globally and Indian exchanges too have either proved indifferent to or sometimes
even hostile to expenditure on R&D. Therefore, a company would choose between the following options:
(1) report on R&D to gain in tax savings or the company perhaps does not require to raise money from
capital market; (2) de-risk the listed company by hiving off the vehicle that would undertake R&D; (3) not
report on R&D and forego tax gains but invest in developmental projects; or (4) not undertake R&D or no
major developmental project.
Perhaps most important would be – what defines R&D expenditure? In fact very often firms abroad classify
activities of a not strictly R&D type under this head in order to gain tax rebates or to secure strategic
mileage. Most importantly a large number of firms are busy in innovative development, while not owning a
formal R&D set up. In this section, therefore, we would look into reported cases of R&D without looking
into issues of business strategies and the non-R&D elements of innovation.
Place of R&D and the Company Management Structure
Indian companies doing R&D generally locate the R&D unit only at one location, which is not necessarily
the head office of the company. Each factory/division would most often not have respective product R&D.
Size of a typical R&D unit is almost always very small and intra-company mobility across factories/divisions
shop floor or marketing and the R&D unit is rarely institutionalized. The head of R&D almost never is on the
board or often does not report to the chief of the company. In only a few cases has the chief taken a personal
interest in R&D. To recall, legal institution such as Companies Law, Factories Act, Competition policies or
similar others and other fiscal or capital market policies critically influence R&D behaviors/extent and in-
company structure and function of the R&D.
Rather recluse, R&D by an Indian company rarely encourages its personnel mobility across companies or
public R&D institutions/universities. Mobility is known in pharma and IT R&D. Nevertheless, many large
companies have commissioned studies or projects to public laboratories, especially the CSIR and also
sometimes to the universities. In few cases of large companies, one might discover competency centers.
Nature of Innovative Output
Development of new product, upgrading quality, adapting or improvising imported products or raising
productivity, developing novel solutions including new molecules, and consequently claiming patents and
other IPs are a few examples of the R&D output of a company. Rarely would company R&D personnel

S&T and Industry 149
publish research papers. Often it would be difficult to establish causal linkage between investment in R&D
and the innovative output. Measuring investment in R&D as reported in accounting report therefore, remains
often the only mode to apprehend R&D by a company. In fact output measurement often fails to indicate
investment.
Modes of Innovative Undertaking
Public-private partnership in R&D is rather old in India. The ARAI, textiles group such as the ATIRA,
CITRA have been working for decades under several types of mixed modes of governance structures
including sometimes under cooperative mode, involving private companies and public R&D. Perhaps lack of
strong interests has often weakened such partnerships. A recent initiative by the CSIR in this regard has
been the NMITLI; similarly the DBT and other ministries have also taken initiatives on partnerships in
R&D. Over the last few years, a few companies have floated foundations of R&D who in turn have
sometimes located respective R&D centers in universities / IITs and similar places. However, public-guided
cooperative research between competing companies on advanced areas has not been undertaken in the
manner of the USA, France or Japan. This appears to be an important aspect requiring attention.
In recent years some companies especially from the drugs and pharmaceuticals sector have begun business
in outsourced R&D (CROs) or outsourced R&D based manufacturing (CRAMs) or even value-add services
closer to R&D such as in analytics, solutions, clinical research, and similar others. In manufacturing, several
companies especially from the automobile and auto components sector have shared facilities and competencies
to undertake joint product development with firms from other countries.
Features of Innovation
A typical Indian company will often have
low cost strategy. Hence moving down the
cost ladder could be part of the innovation.
The present data set provides information
on dimensions like license fees paid, royalty
paid, foreign exchange earned through
services, and similar others. Such data
would provide insights into the technology
acquisition strategies of companies which
in turn would provide boosters to
innovation.
The structural dimensions of innovative
changes in the economy could be looked
at in three modes: (1) innovative behaviors
of individual companies, (2) innovation in
specific sectors of the economy as reflected through mostly the listed firms, (3) changes in inter sector
structure brought about by innovative value adding activities. These three modes, in turn would provide
scope for designing of innovation policy. Prowess database, that has been used here, provides firm-level

S&T and Industry150
data of large and medium Indian firms. The companies covered account for around 75% of all corporate
taxes and over 95% of excise duty collected by the Government of India.
Indian Companies and R&D
The investment/expenditure on R&D by a company is the most important indicator of innovation – providing
an eyehole peep into future directed efforts on new products/processes, new designs, novel solutions/discovery,
new packaging, etc. or on improving the quality of the services or goods. However, as discussed above,
R&D reporting entitles a company to saved taxes and most importantly extent and conversely spread/focus
of R&D is an important signal to competitors and in particular R&D acts as a deterrent to entry.
The cyclic increase and fall in number of companies reporting R&D activity is given in Table 4-08.01. It is
apparent that companies reporting R&D have under them most part of the market, close to 60%. However,
number of companies undertaking R&D constitute a small portion, currently only about 12% down from the
1998 share of 17%.
The percentage of listed companies having R&D expenditure was highest in 1997 (18.46%) and lowest in
2005 (11.91%). The annual percentage change in the number of companies doing R&D shows a highly
negative trend (Fig 4-08.01) except during 1999 and 2002. While the percentage of the companies investing
in R&D is decreasing, their corresponding share of the total sales turnover is almost continuously increasing.
R&D expenditure at current prices had steady
growth, and even taking care of inflation, the
expenditure had steady growth. The average
percentage of own sales turnover spent on own
R&D figure rose almost steadily from about
0.21% in 1995 to about 0.30% in 2005.
Observing sectors reporting R&D, is very
revealing. The drugs and pharmaceuticals
sector tops the list, rising steadily from 93
companies in the year 1995 to 112 in 2005. Other
sectors exhibiting considerable interest and
participation in R&D are dyes & pigments,
fertilizers, generators transformers &
switchgears, general purpose machinery and
few more.
Knowledge acquisition, including licenses against payment, is an important dimension beyond R&D that
needs a look. Among the R&D active companies, the percent increase in expenditure on R&D was much
higher in the year 1998-99 than that in 2002. During the year in which there is a negative growth in R&D
expenditure, there is corresponding increase in the expenditures in royalty, technical know-how and license
fee paid (Fig 4-08.02). During 2000, R&D expenditure shows about 30% fall, while the expenditure in
royalty, technical knowhow and license fee paid shows around 180%, 300% and 450% increase over the
expenditure during 1999. There is a strong complementarity between knowhow import in both embedded
and disembodied forms and R&D investment, the latter often follows the former.
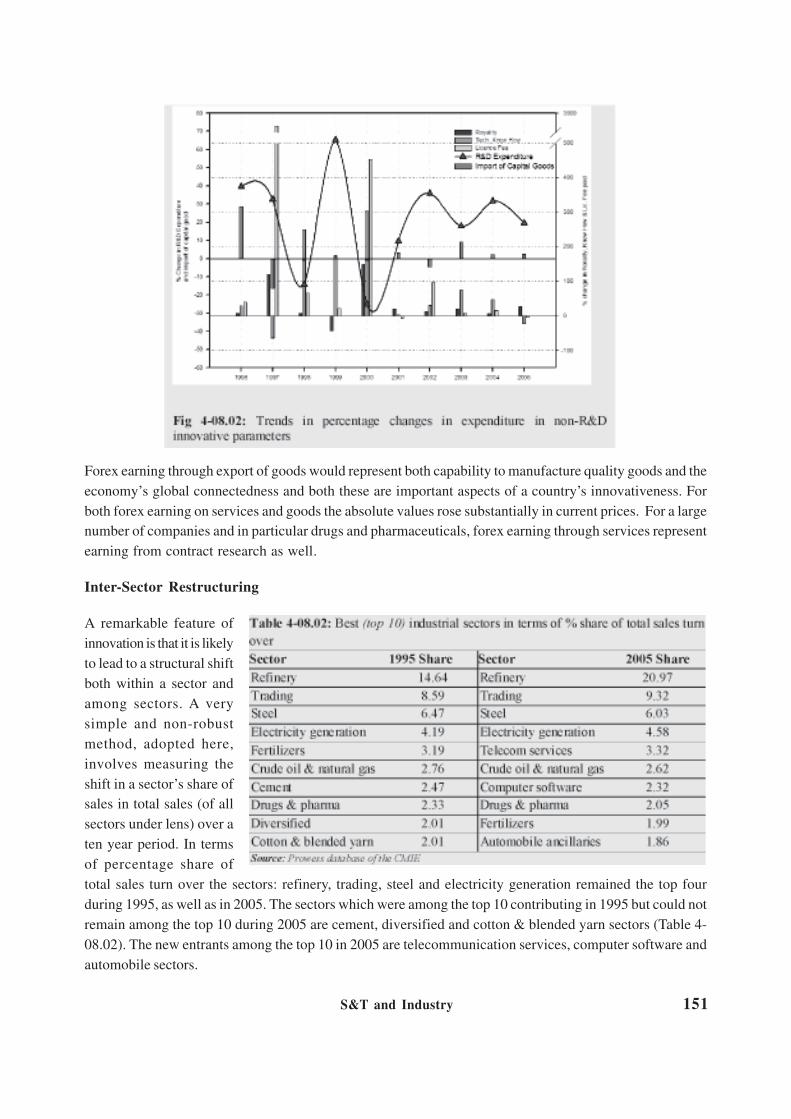
S&T and Industry 151
Forex earning through export of goods would represent both capability to manufacture quality goods and the
economy’s global connectedness and both these are important aspects of a country’s innovativeness. For
both forex earning on services and goods the absolute values rose substantially in current prices. For a large
number of companies and in particular drugs and pharmaceuticals, forex earning through services represent
earning from contract research as well.
Inter-Sector Restructuring
A remarkable feature of
innovation is that it is likely
to lead to a structural shift
both within a sector and
among sectors. A very
simple and non-robust
method, adopted here,
involves measuring the
shift in a sector’s share of
sales in total sales (of all
sectors under lens) over a
ten year period. In terms
of percentage share of
total sales turn over the sectors: refinery, trading, steel and electricity generation remained the top four
during 1995, as well as in 2005. The sectors which were among the top 10 contributing in 1995 but could not
remain among the top 10 during 2005 are cement, diversified and cotton & blended yarn sectors (Table 4-
08.02). The new entrants among the top 10 in 2005 are telecommunication services, computer software and
automobile sectors.

S&T and Industry152
Among the 10 least contributors of 1995, sectors like media broadcasting, ITES and media content have
performed well and are out of the ‘least 10’ of 2005 and are replaced by the three sectors, namely other
leather products, non-banking financial companies (NBFCs) and animation content provider (Table 4-08.03).
It is worth mentioning here that sectors with reduced R&D expenditure (as % of sales turn over) have
performed badly, a feature common to both top performing and least performing sectors.
In terms of net difference in the percentage share of total sales turn over during 1995-2005, refinery sector
retains the top position while the sector of electricity generation occupies the 10th position. This positioning is
independent of the scale of contribution of a sector in the respective years. A quick review of the R&D
expenditures of these sectors during these two periods partially confirms the hypothesis that sectors spending
on R&D are likely to improve relative positions vis-à-vis other sectors.
Non-R&D Innovation and R&D in Select Industry Sectors based on Mostly Listed Companies
It makes sense to identify sectors that influence the trend of R&D expenditure in the overall industries. It
was observed that the overall steep rise in industrial R&D expenditure during 1999 was largely due to the
high expenditure in software R&D and the moderate growth in R&D expenditure during 2002 was largely
contributed by the automobile sector (Fig 4-08.03).
All Manufacturing Industries: An overview of both R&D and non-R&D innovation by all listed companies
cutting across sectors indicates that R&D spending as % of sales remained nearly indifferent over a decade
and so have been all such payments as % of sales for knowledge, such as for royalty, licenses, knowhow
(Fig 4-08.04). Though both forex earning as well as forex spending per unit of sales shows an increasing
trend, the latter surpasses the former indicating increasing global dependence. Salaries per unit of sales are
decreasing which indicates enhanced labor productivity as well as white collar productivity and a declining
consumption of power per unit of sales implies improvement in energy efficiency.
Automobile industries: The most striking feature in this sector is the drastic increase in the number of
companies paying royalty, license fee etc from mere four in 1995 to more than hundred during 2005.
Consumption of power per unit of sales is decreasing indicating increasing energy efficiency. An increasing
trend in both R&D expenses as well as royalty paid per unit of sales indicates emphasis on innovation.

S&T and Industry 153
The tough competition among the individual companies in the automobile sector is apparent from the highly
fluctuating number of units in the top 10 per cent of turnover-based size, while the bottom 10 percent (though
showing improvement) is almost steady.
Tool Manufacturing: Companies paying royalty, license fee etc show a drastic increase especially beginning
2000. And the number of companies earning from foreign exchange is also on the rise. Consumption of
power per unit of sales is decreasing especially after 2001 indicating increased efficiency. This decreasing
power consumption is accompanied by an increasing expenditure in R&D as well as in royalty, license fee
etc.

S&T and Industry154
Paper Industry: Till 1998 no paper company was paying royalty, license fee etc. Total forex expenditure
per unit of sales has almost remained constant while forex earning per unit of sales is increasing, though it is
slightly declining after 2003, indicating net increase in export. Power consumption per unit of sales is also
declining which indicates improved efficiency. In this sector, R&D expenditure as well as royalty paid per
unit of sales appears to be very negligible indicating lack of innovation.
Cement Sector: Number of companies paying royalty, license fee etc also shows an increasing trend.
However, number of companies earning from foreign exchanges has slightly decreased over the same
period. Consumption of power in the cement industry shows an increasing trend. There is no significant
variation in R&D expenses per unit of sales. However, royalty paid per unit of sales shows a slight improvement
especially after 1999.
Steel Sector: Only a few companies are involved in R&D. However, companies paying loyalty, license fee
show an increasing trend. There is a declining trend in the consumption of power per unit of sales indicating
more efficiency of the processes employed. There is no significant variation in the R&D expenditure per
unit of sales.
Drug & Pharmaceutical Industries: Forex earnings in the drug and pharmaceutical sector have increased
considerably while forex spending has remained almost constant during the period 1995-2005. However, in
all the years, forex earning has been lower than forex spending. R&D expenditure is showing an increasing
trend which indicates that the sector is investing in order to remain innovative.

S&T and Industry 155
Forex earning indicates increasing outsourced R&D services to domestic firms. This therefore indicates
enhanced R&D capability. Similarly, R&D expenses also exhibit an increasing trend from 2000 onwards.
However, payment of royalty, license fee has remained almost negligible. Power consumption and salaries
per unit of sales does not exhibit any significant variation over the period 1995-2005.
Trading Sector: In the trading sector, it is interesting to note that several companies are engaged in R&D
though the number is showing a decreasing trend over the period 1995-2005. Even the number of companies
paying royalty, license fee is also in the rise. In terms of per unit of sales, forex expenditure is comparatively
higher than earning, though both exhibit an increasing trend. Power consumption per unit of sales is decreasing
which indicates more efficiency. The declining trend of R&D expenses appears to be compensated by the
steep rise in the amount of royalty paid per unit of sales especially beginning 2000.
Software Industries: Till 1998 very few companies in the software sector were into R&D related forex
transactions. Beginning 1999 there is a sharp rise in their number which, however, again starts to decline
from 2003. Nevertheless, the difference between the number of companies having forex earning and those
having forex spending is very small. In fact, the trend is reversed since 2004; the number of companies
spending on R&D is increasing. R&D expenditure and power consumption by software companies is almost
constant.
Regional Performances: Sector-wise & based on Mostly Listed Companies
Regional, in particular,
competition between
several governance
units of federal
governmental set-up
has proved strong
influencing factor in
many countries and
competition between
provincial states
appears to be
important in India as
well. However,
regional governments
in countries such as
China have exercised
much higher degree of
competitive autonomy
resulting in both gains
and perhaps
distortions, especially in fiscal areas. Indian states enjoy relatively more restricted fiscal autonomy and little
financial power.

S&T and Industry156
Maharashtra: In Maharashtra, more and more companies are going for R&D and are increasingly paying
royalty which probably led to a corresponding increase in the number of companies earning forex reserves
from export services. The most spectacular increment is in the number of companies paying royalty (specially
beginning 2000) and this is followed by the number of sectors covered by the above features. The point to be
noticed here is that a downward trend in all the parameters is evident since 2004.
Maharashtra accounts for around 30% of the listed and other large companies in the country contributing
about 39% of the national sales turn over from such companies and this share has been fairly constant
throughout the period. The number of companies doing R&D has increased from 287 in 1995 to 327 in 2005,
while the number of sectors covered by these companies has remained at 77 indicating more and more
companies are opting for in-house R&D. The share of the R&D activity companies to total state companies,
however, shows a declining trend but their share to total state sales turnover has increased from around 54%
in 2005 to around 77% in 2005, which indicates increased productivity.
Tamil Nadu: In Tamil Nadu, the most spectacular improvement is in the areas of royalty payment. The
number of enterprises has increased from mere 9 units in 1995 to 150 units 2005. The state is maintaining a
constant share (11%) of the national companies and the state sales turn over accounts for around 7% of the
national sales turn over. Around 1.5% of the state’s companies paid royalty during 1995 which increased to
about 17% by 2005.
Gujarat: Strangely the number of companies engaging in R&D involved in Gujarat is decreasing. However,
the number of companies earning from export services is showing an increasing trend, companies paying
royalty show a sharp increase since 2000, that again started declining from 2004 but the number of sectors
involved in royalty payment is declining. The share of companies paying royalty to total state companies
paying royalty was only 0.35% during 1995 which increased drastically to as high as 8.75% during 2005.

S&T and Industry 157
Punjab: In Punjab, both the number of companies doing R&D as well as the number of companies earning
from export of services is declining which is accompanied by corresponding decrease in the number of
sectors covered under each parameter. However, the number of companies paying royalty has drastically
increased from almost none in 1995 to more than 15 during 2005, accompanied by a corresponding increase
in the number of sectors covered.
Micro, SmaMicro, SmaMicro, SmaMicro, SmaMicro, Small and Medium Enterprises of India:ll and Medium Enterprises of India:ll and Medium Enterprises of India:ll and Medium Enterprises of India:ll and Medium Enterprises of India:
InnoInnoInnoInnoInnovvvvvation Sation Sation Sation Sation Stttttatus and Satus and Satus and Satus and Satus and Stttttatatatatate of Afe of Afe of Afe of Afe of Affffffairairairairairsssss
Overview
The Micro, Small and Medium Enterprises (MSMEs) segment of the Indian economy is vast, with largest
number of enterprises, very large numbers employed, highly dynamic in terms of the entry of new entrepreneurs
and the exit of a huge number of enterprises annually. Data from the Fourth Census is yet to be available. By
2001 this segment of Indian economy had employed 24.932 million persons in 10.521 million enterprises of
which 5.808 million were rural and the rest urban, and mostly in non-metropolitan towns/peri-urban areas;
and manufacturing sectors of the MSME enterprises were close to 40% of the total and the repairing and
maintenance sector enterprises constituting another 16% with total MSME gross output for 2001-02 at Rs.
2,822 billion and export at Rs. 141.79 billion.
Industrial Organization in Tiny Sector
Despite the network linkages that an MSME unit enjoys often along value chains or despite the fact that a
location has a mix of products, technologies and resources, there have been several locations of art genres
or skill genres and sometimes of traditional product brands, such as the Chanderi. As for the registered
clusters there are 1,223 clusters in 26 states covering 321 products with 16.99% of total gross output; Kerala
had highest number of such clusters; and there are 819 clusters of unregistered units in 25 states covering
250 products and with a share of 34.63% of total gross output. Close to 95% of the output of this sector is for
domestic consumption with one crucial constraint that only marginal amount of this 95% is consumed by the
large enterprises in the factory sector. Only 2.98% of the units are ancillary to large enterprises and another
small but unknown share would be fed into the logistics chains of large enterprises. However, as the NSSO
data suggests, these units often survive on the network relations governed by traditional master skill persons
or master traders. The large corporate sector is virtually absent in the governance of these MSME units.
Public Procurement for MSME
There is another potentially very large market – that of public procurement. The registered units enjoy, under
the current system, the facility of bidding for public procurement under NSIC based registration that entitles
them for DGS&D equivalence. However, the bids would be for standards set at DGSD where the NSIC
registered units have little voice and the bids would be competing with imports and outputs from the large

S&T and Industry158
sector. This Third Census revealed that only 2.27% of units had registered for NSIC. Amongst the states
Punjab, Haryana, Rajasthan, Uttar Pradesh, Gujarat, Andhra Pradesh (the largest number), Kerala and
Tamil Nadu had each no less than 5,000 such units registered with the NSIC. Volume of public procurement
through NSIC/DGS&D route has been meager, resulting in a weak and unattractive signal to MSME units,
who mostly therefore cannot depend upon public procurement. In turn, perhaps the most important route of
enforcing technological changes and innovation, through public procurement based upon standards, remained
inoperative.
Rural inputs into MSME
Rising energy bill with decline in investment in machineries indicates decline in general technological changes
in these sectors. General trend in MSME seems to indicate weakening of input ties with agriculture,
strengthening of inputs from urban industries, however, strengthening of MSME output to rural areas along
with continuation of dependence on traditional credit circuit. Weakened (as reflected in lower value of
factor) inputs from agriculture might indicate general weakening of materials-flow network between the
MSME and the agriculture and is a matter of serious concern. This might also indicate lowered relative
prices of inputs from rural milieu, indicative of lower technological changes in agriculture and allied sectors.
The agricultural input then might be drawn from local unorganized markets or from networks of input
providing wholesalers/ large traders through non-price transactions. In parallel, the relative rise in values of
several types of feedstock or inputs from industry reflects both advancing integration with the industrial
system for inputs (in comparison with inputs from agricultural system) and relative technical stagnation vis-
à-vis large industries. The other input, the financing, also appears to be drawn, as NSSO rounds suggest,
mostly from the traditional circuit of master traders/wholesalers. The Third Census on MSME reports that
about 7.39% of the units in the total SSI sector had outstanding loans as on 2002, with registered sector of
the SSI’s outstanding at 20.1% of all units and for unregistered sector at 5.48% only. Out of this outstanding
loan, institutional loans constituted only about 4.55%. This Census also reported that the surveyed units
reported acute problems in securing working capital. The rate of outstanding loan or of default therefore will
be very close to the share of total units under MSME group availing of loans from institutional sources. This
share therefore is unlikely to be more than 10% or 15%; the rest of the units would arrange capital from
family sources or from the network of master traders/ wholesalers et al.
Sustainability of MSME Enterprise
A striking feature nonetheless of the MSME is the sustainability of business models – about 32.35% of units
have survived for about two decades, 1.22% survived for five decades or more, about 11.21% of units for
about twenty five years and similarly. However, the growth story is dismal. Even hundred years old firms
exist at nearly the same volume of gross output as was a century back. There are only few cases of MSME
becoming large and super large. It appears the institutional backup and also the backup from organized
market of finance is missing. Very quick growth based on novel innovation and technology has remained
extremely scarce. MSME appears to be the backyard; with plants and machineries often very old and nearly
never replaced; the units survive on old technologies, skills, low wages and perhaps locked-up markets.
There are close to 451 units with plants and machineries as old as 100 years, again about 4,100 units with
about 80 years old, or about 8,588 units with about 60 years old, or 15,992 units with more than 40 years old
machinery and plants. About 36% of the currently working plants and machinery were installed during the
1970s and 1980s; and 56.36% units installed machineries during the 1990s. However, given the fact that

S&T and Industry 159
three out of four units had original value of plants and machineries at below Rs. 0.1 million, new entrants
over the last one decade had fixed investment in plants and machineries as low as in the previous decades –
it might be inferred that large number of newly installed plants and machineries were second hand or even
old vintages.
Know-how and Knowledge Flows for MSME
Nevertheless, a large number of units procure assistance of knowledge and competence that adapt to old
machines and methods, perhaps from outside sources. Through the traditional circuit the network aggregators
such as the master traders or crafts-persons or wholesalers, provide both tangible and intangible (such as
designs, colors, methods, products even skills in cases) resources at local market transaction rates.
Maharashtra, Manipur, Sikkim and Dadra & Nagar Haveli exhibit fairly large number of registered SSI units
securing technical know-how from domestic R&D units or from special agencies; while Uttar Pradesh,
Rajasthan, Punjab, Bihar, West Bengal, Gujarat, Karnataka, Tamil Nadu et al exhibit very low percentages
of units securing such know-how from the R&D/ special agencies. Such SSI units secure know-how from
three sources: abroad (presumably the output market aggregator abroad); domestic collaborating company
(presumably in the logistics chain or the parent aggregator); and the domestic R&D or special agency
presumably under public sector.
Entrepreneurship in Non Hi-tech MSME
This is perhaps the only segment of economy with such huge population of risk taking entrepreneurs entering
the fray annually; during 1980-84 period 0.1622 million or more entrepreneurs started up, during 1985-90
similarly 0.3247 million or more and during 1991-96 period 0.4215 million or more entrepreneurs started up
new ventures. Most entrepreneurs started up on the existing lines of business perhaps more because the
entrepreneurs did not have access to knowledge of any new business/ product/technology and less because
these starters were risk averse. The 1990s experienced a departure from previous decades through continuous
liberalization and de-reservation of the SSI sector, however, the structural pattern of MSME distribution over
several NIC codes of enterprises during the two decades of 1980s and 1990s and all over India exhibit
nearly no structural shift (especially) towards higher value adding or technology intensive sectors or
occupations. Further, in a few states, such as in Tamil Nadu which otherwise experienced large growth of
automobiles and related transports/components under the ASI-factory sectors in 1990s, experienced during
the same period a structural shift in MSME towards services and away from metal fabrication or metal
based products. Simultaneously, units exited business. Exiting old business happened from the same districts
where new units appeared. But, exits failed to send strong signals of despair. Table 4-09.01 exhibits a few
figures on annual exits in terms of percentage of incumbent units. No other segments of factory sector or
large sector of Indian economy experienced this entrepreneurial phenomenon and at such large volumes.
One might wonder how often locations/states with more advanced large factory sectors exhibited larger
incidences of MSME exit or sickness. For example, Delhi rural has 56.76% and urban has 53.09% registered
SSI units closed, or Punjab rural has 52.79% and urban has 57.45% of registered SSI units closed, or Tamil
Nadu rural has 35.08% and urban has 43.67%, similarly Maharashtra rural has 37.06% and urban has
40.11% units closed; however, Bihar rural has 27.70% and urban has 28.65% units closed. Exception is
Gujarat rural with only 15.37% and urban 24.62% units closed. The backyard of large-scale factory sector
has in general experienced increased closure/exit, which however, could not deter willing entrepreneurs
from setting up new enterprises.

S&T and Industry160
Innovation & Technological Change Agency: Governance and Monitoring
Based upon learning from this above on who could be the driver of innovation and technological changes and
who could monitor, support and govern such changes - a summary of the above learning informs us that:
1. Large corporate or large factory sector has insignificant role in governance and large sector cannot
perhaps be the driver of change.
2. Both input driven and output demanded routes of changes are important, however, current arms length
relations between large factories and MSME segments render the factor prices of changed inputs or
outputs prohibitively expensive, which in turn cause MSME exit and disallow governance and change-
agency to the large segment (given no appreciable investment or induction of new technology in MSME
through large sector).
3. Institutional/bank based governance including monitoring has been close to a non-starter and such
monitoring has remained very costly; as a result and unless current modes of monitoring or disbursals
are completely changed governance through this mode would appear in fructuous.
4. Traditional circuits/networks of input and output who have retained, notwithstanding de-recognition
and de-legitimating policies, very pervasive yet no longer very-strong ties with large part of the MSME,
have limited financial wherewithal and rather old knowledge on products, technological inputs, innovation
and growth possibilities, and management skills. However, these traditional networks have the most
intimate and low-cost access to information and can monitor intensively at the least cost, and more
importantly they appear to be very entrepreneurial. All this would suggest that policy based input/
output provisioning through this circuit along with the modernization of this circuit could be very promising;
for example, no stock exchange for the MSME could function without the monitoring and rating functions
being undertaken by them.
5. Bridge R&D and especially development organizations of several social sector ministries under both
the central and state governments (whose numbers are in thousands), have often been relegated to
being philanthropic suppliers of advanced inputs without being empowered to govern and monitor and
without fund allocation jurisdiction. In fact, often bridge R&D organizations have been bypassed and
funds are channeled through non-governmental organizations (NGO). Most importantly, inputs for
innovation and technological change could flow from such bridge organizations through the traditional
networks more effectively than currently prevailing. A model of innovation-governance that is only
germinal now, informs us: a mixed executive & market mode of governance involving bridge R&D
organizations as advanced inputs/standards provider and/along with the bank and traditional network
as the monitor and/or input/output providers, could be the answer.

S&T and Industry 161
6. Local executives at both line ministry levels, especially the District Industry Centers, and the district
magistrate/commissioners levels often have only partial/ truncated jurisdiction over one or a few
dimensions of MSME governance. The MSMEs cater to both local and supra-local or global markets.
A model of local-government based governance of MSME but with competition between local
governments encouraged through empowering those governments by way of funds transfer, say through
the Finance Commission, and through empowering them to issue bonds or charge taxes (lessons from
China could be important here - the JNUURM has limited scope in this regard) could be another
alternative (its germinal is present).
7. Cluster based approach has been adopted by several ministries and the UNIDO, and there are multiple
definitions and counting of clusters. However, clusters approach negates local diversity, the channel of
network, the random entrepreneurial distribution, skill pools and pools of other knowledge and resources
among others; more importantly – cluster does not appear to be the unit of governance. Only a handful
of cluster-inhabitants succeed and perhaps such successful entrepreneurs cannot provide leadership to
others in the same product category and within the same cluster.
8. Several other modes of quasi-governance often in public-private modes, such as through Commodity
Boards, Commissioners, trade associations or a group of regional MSME units along with public R&D
agencies have been providing important knowledge inputs, sometimes even standards or best practices,
to the MSME. However, very often there has been a delink between transactions in knowhow on the
one hand and fund or other inputs provisioning or even of provisioning of market/aggregation on the
other hand resulting in voluntary transactions of discrete kind.
Governance and monitoring provides teeth to leverage and thus technological changes happen (including
improvements in quality/productivity). Innovations (including prototyping, etc.) are hastened under governance
constraints.
MSMEs: IntroductionMSMEs: IntroductionMSMEs: IntroductionMSMEs: IntroductionMSMEs: Introduction
Small and Medium Enterprises (MSMEs) have a significant role in the Indian economy in terms of output,
employment generation, export etc. If we compare the MSME industry with big industries some interesting
facts could be found out. As per the third census of MSME, the employment-investment ratio is about seven
times for MSMEs compared to big ones. And investment-output ratio is better for MSME industry.
However, 3rd MSME census was carried out using older definitions prevailing during 2001-02. Number of
MSMEs, according to new definition gets enlarged to approximately 13 million. Out of the total labor force,
30 million are employed in this sector and it generates 40% of India’s total export. Its share in GDP stands
at 8-9%. Total annual credit flow to the Indian MSMEs adds up to $12.0 billion.

S&T and Industry162
Entrepreneurship in MSMEEntrepreneurship in MSMEEntrepreneurship in MSMEEntrepreneurship in MSMEEntrepreneurship in MSME
Entrepreneurship is exhibited in the number of new units set up. A unit may introduce new products or
services or may add value by copying old products or services. Table 4-09.02 exhibits the volume of setting
up of new enterprises in MSME. Such new units indicate emergence often of new entrepreneurs. As per

S&T and Industry 163
the MSME 3 rd
census the net of
entry and exit,
generation of new
MSME units was
positive during the
years 1992-1996
whereas the trend
became negative
after 1996, the ratio
of new units
(according to initial
year of production)
to closed units was almost 3:2, whereas the reverse happened after 1996 and the ratio was also almost
reciprocal. After economic liberalization in 1991 the entry of new entrepreneurs boomed. But after 1998 the
rate slowed down due to industrial credit crunch. The industry wise trends for generation of new entrepreneurs
in rural and urban India, for the pre and post economic liberalization periods are almost the same for service,
manufacturing and repairing based industries.
Ancillarization of MSME Units in India
About 98% of
MSME units in
India have almost
no relation with big
industries or
channel partners.
So, ancillarization
part of Indian
MSME is very
small. The
indicative figures
show the share of
number of units of
different sector
viz. manufacturing, repairing and services in MSME industry over pre and post liberalization periods for rural
India.
It is observed that almost the entire sector (85-86%) uses traditional knowledge in its production units,
domestic R&D organizations have a meager share in provisioning of knowledge, only about 5-7% of the
technical knowledge transactions are with public R&D.

S&T and Industry164
Skill-pull in Indian MSME
Most MSME units appear to employ
workers for the entire year, however, the
seasonal MSME units resort to a skill
pool. Those who are employed for year-
long do not enjoy although job security.
Such workers too join the pool. Workers
in such a pool often enjoy multiple skills
and job switch and occupation switch
happens frequently. A skill pool indicates
both low levels of skill requirement by
MSME production system and presence
of multi-skilled dexterous workers. The
rural and urban skill pools appear to share
similarities. Migration of workers is not
reported to be very common.

S&T and Industry 165
ExExExExExccccchanghanghanghanghange of Knoe of Knoe of Knoe of Knoe of Knowwwwwledgledgledgledgledge and Ote and Ote and Ote and Ote and Other Fher Fher Fher Fher Factactactactactororororors bes bes bes bes betwtwtwtwtweeneeneeneeneen
MSME and FMSME and FMSME and FMSME and FMSME and Factactactactactororororories in Difies in Difies in Difies in Difies in Difffffferererererent Geogent Geogent Geogent Geogent Geogrrrrraphiesaphiesaphiesaphiesaphies
MSME units are distributed
over villages and small towns
and over the large metropolitan
cities. The spatial dimension of
industrialization and
competition as well as
cooperation suggests the
hypothesis that a city and the
large industries there, would act
as the magnet polarizing and
catalyzing growth of
mushrooming small units in the
hinterland districts. Some of the
cities selected for investigation
into this hypothesis are Agra,
Pune, Chennai, Gurgaon and
Surat.
Manufacturing, repairing and
service sector MSME units
reportedly use traditional
knowledge as their source of
technological resource. The
MSME census and other data
from ASI suggests that in most
cities, all industries e.g.
manufacturing, repairing and
service sector industries
depend primarily on traditional
knowledge as their technology
source. The involvement of
domestic R&D institution/
companies in transactions of
knowledge and other factors
has increased in post
liberalization period.
In Agra there is an incremental
change in food & beverage,
textiles & apparel industries;

S&T and Industry166
whereas negative growth has been witnessed in non-metallic mineral product and machine equipment
manufacturing industries. MSME in Agra is dominated by 18, 26 and 52 NIC-codes while large industries in
UP are dominated by 15, 17, 24, 26, 28, and 31 NIC-codes. There is a marginal structural change in MSME
of Agra over pre and post-liberalization period. Pune is the prominent industrial city of India in the state of
Maharashtra. It has advanced manufacturing industries. Number of repairing and service MSME industries
increased in post liberalization period, while Pune is known for its large manufacturing enterprises. In Pune
the supply-linkage between MSME units and large industries appears to be weak. For Chennai, incremental
growth trend is observable in textiles, machine equipment and chemical industries. There is a stronger
structural change in MSME in Chennai in post-liberalization period. At Gurgaon, there is a positive change in
fabricated metal products, except for machinery and equipments and retail industry segments. There is little
linkage between large scale industrial sector of Haryana and MSME of Gurgaon Huge growth in service
sector and very moderate growth in the manufacturing industries in rural area of Surat is observed. Growth
in all the sectors in Surat over the pre and post-economic liberalization periods is noticeable. In rural areas of
Surat, the emerging sectors are food & beverage industries, wearing apparel and dressing material industries,
industries based on rubber and plastic products, maintenance of motor-vehicles, and household-service
sector in post-liberalization period. There appears to be little supply/manufacturing relation between the two
segments, the MSME and the ASI-represented large factories in Surat.
From the above discussion it is clear that in the major industry-oriented cities, MSME units lacked knowledge
support from the public/private R&D agencies/institutions and they do not have direct supply or support
linkage with large industries.
NNNNNon-R&D Innoon-R&D Innoon-R&D Innoon-R&D Innoon-R&D Innovvvvvation in Indian Oration in Indian Oration in Indian Oration in Indian Oration in Indian OrggggganizedanizedanizedanizedanizedFFFFFactactactactactororororory Enty Enty Enty Enty Enterererererprprprprprisesisesisesisesises
Innovation in Organized Sector
The system of organized business enterprise is amongst the important actors of the national innovation
system. Given the wide variations in ownership, size, nature of competition, there would be similar differences
in the depth and types of innovative activities. The economic dynamics of this group of enterprises is very
diverse, allowing investigation into changes happening beyond an individual enterprise. For instance, within
the manufacturing group of relatively large enterprises, changes towards improved performances that could
be described as innovative can be portrayed at three levels of (1) units (2) sector and (3) inter sector. All the
3 levels of innovation have dissimilar inputs and those at sector and inter sector levels are often macro in
nature, flowing out of public policies.
Policy Targets for Innovation
Looking at and limiting innovations to the unit level would negate the scope for optimum achievement possible
as a consequence of the innovation. Policies should therefore be designed for systemic changes, including

S&T and Industry 167
system governance. Gains through policies could similarly be measured at the system i.e. sector or inter
sector levels. Further, innovation in one enterprise/sector is influenced by plethora of economic policies and
therefore we need to look beyond policies relating to promotion of R&D alone. Tax concessions on R&D
expenses might incentivize enhanced reporting on R&D. Contrarily, non-R&D innovation when happening
at enterprise level might not get reported. Typically policies relating to non-R&D innovation during pre-
liberalization phase addressed exemptions in customs duty, depreciation and investment allowance and weighted
tax deduction for using/commercializing technologies developed domestically. The post-liberalization phase
extended benefits such as duty free imports or depreciation allowance for technologies developed in domestic
entities.
Innovation Policy Types
In short, the governance mechanism during the later phase embraced two modes – the executive based and
executive monitored instruments of taxation (and likes, broadly under fiscal category), and the second mode
being fund based or bank based and bank monitored fund. Deployment of funds for promoting innovation or
for creating markets for innovative products is also critical. Another related set of policies could be described
under broadening and deepening of market. As much of R&D relates to corporate policies on barriers to
entry and collusion, the competitive aspects of corporate non-R&D innovation assume larger significance
especially for a country such as India facing both dumping and liberalized import. Other policies under
market dimension, such as the Electricity Act or the recent Warehousing (Development & Regulation) Act
2007 – belong to non-fiscal often legal market development sets of pro-innovation instruments and institutions.
Both market related and bank related sets of policies appear to be more important for two robust reasons:
(1) fiscal types of policies as experience shows could not often match expectations, and (2) fiscal related
instruments might be more incumbent friendly hence less restructuring. A related but important issue is that
a legal instrument frees governance structures and therefore helps generate non-executive modes of
governance of innovation. Advantage of legal policies is that agency of innovation then shifts to institution.
Policy and Governance of Innovative Changes
Management of the process of change is the next important aspect. Governance of innovation can be
classified in to three broad types: (a) executive based, (b) bank based, and (c) market based. Several
countries have followed a mix of two types of policies. Governance of the innovative transition assumes
crucial importance when we talk about normative policies/interventions especially by public agencies. Indian
policies in the pre-liberalisation phase have been predominantly executive-based, while in the post-liberalization
phase we observe minor influence of bank based policies although the dominance of executive based policies
has continued. Market based governance appears to have insignificant influence on innovation outcome.
Further, several units and in a few cases respective associations of enterprises have been having transactions
with public R&D systems and the university systems for knowledge and capacity building. Systemic
knowledge, the social flow of skill and the abundance of skill pools are major factors in the system of
innovation; but this is different from the agency of the executive. Therefore we can add a fourth type of
governance - the social knowledge based governance.

S&T and Industry168
Innovation Policy Schematic
We may for the convenience of description devise a simple schema of policy types. The first tier might be
described in terms of governance as above. The second tier could be policies classified under fiscal, fund,
infrastructure, managerial, legal, and asset-based. Fiscal includes tax and similar; fund includes bank based
and similar; infrastructure includes cluster, S&T parks or public R&D lab/training; managerial includes
handholding, VC manager; legal includes laws relating to company, patents, competition; and asset includes
an item with future exchange value like a patent. There could be a third tier to indicate the target of the
policy. This tier could have unit enterprise, sector, inter-sector, and finally institution.
Nature of Innovative Changes
Innovativeness of enterprises gets reflected through a range of parameters from cost containment to hastened
import of embedded knowledge. This section looks at the larger picture of innovative improvements, mainly
in terms of cost containments. Another dimension of the outcome of innovation is changes in inter sector
input-output relations or structural balances, and such a picture presents us a broad picture of the directions
of the economy. In this section, we will provide an indicative pointer towards the direction of innovation in
the economy. A few sectors of crucial importance to higher value addition in the entire economy, such as
machine tools, transport equipments, other machineries would be specially picked up to observe whether
their intensive or larger use brought about inter sector restructuring towards higher value addition.
A description of this large group is best afforded by the data from the Annual Survey of Industries (ASI)
series. The data is non-accounting and is on organized manufacturing factory sectors classified according to
the NIC.
Innovation Patterns in Organized Factory-based Enterprises
Industrial sector is a major contributor to the growth of Indian economy which grew by more than 9% during
2005-08. Innovation has been one of the most important factors in growth of the Indian economy. However,
over emphasis on R&D has somewhat shadowed the important gains in enterprise performances achieved
through non-R&D investments or innovative activities. This scrutiny tries to realize the pattern of non-R&D
based innovation in the organized manufacturing.
Innovation trends in select sectors of industry that are generic, technology intensive would hold higher
promises than innovation in other sectors. Accordingly we captured the pattern of innovation in selected
sectors – Manufacturing, Automobiles, Leather, Electronics and Computers, Small Electronics Equipment,
Tools Manufacturing, and Processed Food Industries.
Cost containment is perhaps the principal feature of innovation in Indian industry. Other aspects like
development of new products or entering new markets are important as well although from the present data
we cannot infer anything about these other features. Following parameters were taken into consideration to
study cost cutting innovation patterns in the industry: fixed capital, total emoluments, fuel consumed, material
consumed, and total stock.
Ratio of these parameters with respect to ‘value of output’ and ‘net value added’ when calculated, exhibits
several modes of cost cutting. A lower value of the ratio indicates consumption of fewer resources to

S&T and Industry 169
achieve one unit of output or net value added. These ratios were calculated on aggregate basis for the
selected sectors.
Innovation in Total Manufacturing Industries
In the post liberalization period, the number of unit enterprises increased from 1,10,179 in 1990-91 to 1,36,353
in 2004-05 with an Average Annual Growth Rate (AAGR) of 1.62 per cent. Fixed as well as the invested
capital grew by around 11 per cent per annum, net income and gross capital formation by around 15 per cent
or gross fixed capital formation by about 14 per cent. Overall, the intensity of capital use increased significantly.
Labor productivity in the overall factory based manufacturing too grew. However the disconcerting aspect
was very high growth of addition to stocks which would indicate higher gross delink; inter-sector or inter-
factory.
There has been a drastic improvement in the performances of the Indian industries during the period 1990-
91 to 2004-05. Parameters related to manpower such as workers per enterprise, employees per enterprise
and total persons engaged per enterprise are showing a declining trend (Table 4-10.01) which actually is an
indication of increase in labor productivity. Improvement in performance happens owing both to increased
labor productivity and improvements in managerial functioning. The latter is evidenced further in the increased
wages and increased emoluments per factory. In fact, this increase indicates that skill/knowledge level in
use by a factory has increased significantly. Increase in gross fixed capital formation per factory exhibits
increased use of advanced and recent machineries.
An increasing trend for material consumed
with respect to ‘Net value added’ indicates
more material is being consumed to
achieve addition of value to one unit of
output, a trend perhaps not welcome;
however, it could contrarily indicate
increased commodity prices and hence
might not indicate increased consumption
of material weights/quantities (Fig 4-
10.01). However, the increase in stocks
are perhaps owing to unsold stocks failing
to add value In other words, stocks per
value added could be considered a macro
or systemic indicator of innovation. For
fixed capital with respect to ‘Value of
output’ and ‘net value added’, under the
condition of enhanced capital stock - a
declining trend in the ratio could represent
increase in innovation because of enhanced
capital productivity.
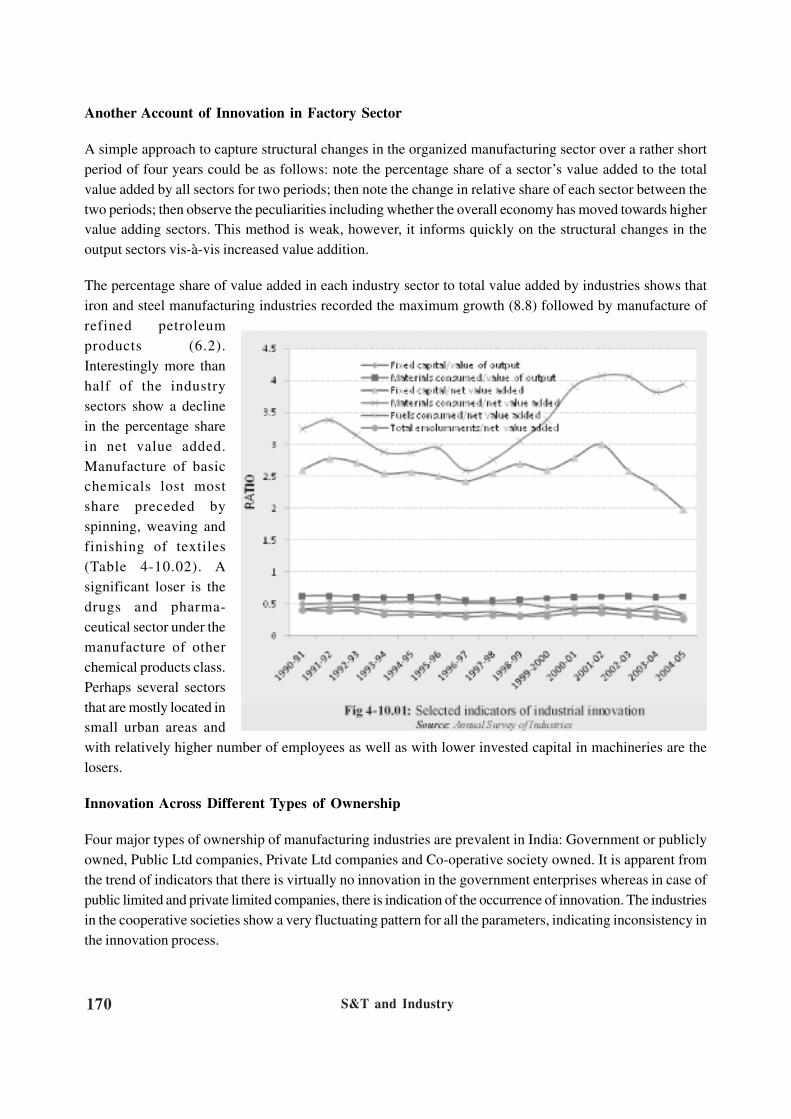
S&T and Industry170
Another Account of Innovation in Factory Sector
A simple approach to capture structural changes in the organized manufacturing sector over a rather short
period of four years could be as follows: note the percentage share of a sector’s value added to the total
value added by all sectors for two periods; then note the change in relative share of each sector between the
two periods; then observe the peculiarities including whether the overall economy has moved towards higher
value adding sectors. This method is weak, however, it informs quickly on the structural changes in the
output sectors vis-à-vis increased value addition.
The percentage share of value added in each industry sector to total value added by industries shows that
iron and steel manufacturing industries recorded the maximum growth (8.8) followed by manufacture of
refined petroleum
products (6.2).
Interestingly more than
half of the industry
sectors show a decline
in the percentage share
in net value added.
Manufacture of basic
chemicals lost most
share preceded by
spinning, weaving and
finishing of textiles
(Table 4-10.02). A
significant loser is the
drugs and pharma-
ceutical sector under the
manufacture of other
chemical products class.
Perhaps several sectors
that are mostly located in
small urban areas and
with relatively higher number of employees as well as with lower invested capital in machineries are the
losers.
Innovation Across Different Types of Ownership
Four major types of ownership of manufacturing industries are prevalent in India: Government or publicly
owned, Public Ltd companies, Private Ltd companies and Co-operative society owned. It is apparent from
the trend of indicators that there is virtually no innovation in the government enterprises whereas in case of
public limited and private limited companies, there is indication of the occurrence of innovation. The industries
in the cooperative societies show a very fluctuating pattern for all the parameters, indicating inconsistency in
the innovation process.

S&T and Industry 171
Location Based Innovation in Industries
Industries based in both rural as well as in the urban areas exhibit almost similar patterns of innovations
during the period 1989-90 to 2004-05. Declining ratios like invested capital per gross output, wages per gross
output and invested capital per net value added indicate innovation in manufacturing; but the decrease in
wages per gross output is very small indicating little gains in labour productivity and the recorded innovation
is perhaps due to the use of advanced or efficient technologies.
An increasing input to output ratio in both the rural and urban industries is an indication of overall low
productivity. However, the degree of increase of the input to output ratio is higher in the urban industries
(0.79 to 0.82) indicating that the urban industries are comparatively less productive than their rural counterparts
whose input to output ratio has increased from 0.79 to 0.81 during the same period.
Inter-state Comparison of Industrial Innovation
Two patterns of innovation trend can be observed among the states. Some states such as Andhra Pradesh,
Uttar Pradesh, Gujarat, and Karnataka exhibit almost continuous decreasing trend of indicators like capital
intensity of output and of net value added, and emoluments intensity of output and net value added (Fig 4-
10.03). This clearly indicates that the innovation process in the industries of these states is a nearly continuous
one excepting a few kinks. The remaining states exhibit fluctuating pattern of the ratios, increasing first and
then decreasing which indicates these states are also at last becoming innovative. These states are West
Bengal, Bihar, Tamil Nadu, Punjab, Maharashtra and Madhya Pradesh.
However, if we consider states having lower values of the ratios as more innovative, then in general
Maharashtra and Punjab go neck-in-neck to top the list of most innovative states. Rest of the states in
descending order of innovativeness or more efficient use of capital and white collar employees or the
organizational processes – would be like Uttar Pradesh > Karnataka > Gujarat > Andhra Pradesh > West
Bengal > Tamil Nadu > Bihar > Madhya Pradesh.

S&T and Industry172
Innovations in Sectors – Non R&D Aspects
Innovations across several sectors can be appreciated from decreasing per unit consumption of materials,
fuels, emoluments, fixed capital, and stock-held for every value added or every value of output. The period
of data is very small, only for 5 years 2000-01 onwards. A secular decrease, in particular a steep fall would
indicate that the corresponding factory sector has done remarkably well in innovation. We should note that
value added includes wages or emoluments and additionally also the capability of that sector to price its
output, and also the capability to manage cash and intangibles.

S&T and Industry 173
Most importantly, investments in innovation are not captured in data on R&D expenditure. The fact that
sectors undertake innovation and incur expenditure on R&D aspects is pointer to this often ignored dimension
of innovation. Tax gains as policy may not have influenced the undertakers of the innovation, neither do
these undertakers use innovation as signals to the capital market. In contrast such innovations appear to
have been influenced by the sector’s competition landscape and inter-sector competition landscapes. Policies
that are targeted to competition and other legal dimensions including a few non-R&D aspects of fiscal
policies have together influenced sector innovation outcomes. Input prices including of commodity, for example,
might have been more influential than gains through tax deductions on R&D expenses to invest in innovation.
Automobile Industries: In the automobile sector, there were 4,412 industries in 2000-01 which increased to
4,957 during 2004-05. In this sector, material consumption is decreasing in terms of value of output and net
value added to the product (Fig 4-10.04). The sharp fall evidences significant innovation in automobiles.
Great gain in the productivity of capital signifies another dimension of innovation. The ratio of emoluments
paid to the employee (Worker/Supervisor) to both output value and net value added, however, shows
indifference. Another important dimension of innovation that relates more to inter sector than to the sector is
about the stock held. High value of stock to per unit value add is therefore a drag on the company and the
automobile sector exhibits a near indifference to this ratio over this five year period.
Leather Industries: In leather manufacturing, material consumption per unit value of output as well as per
net value added shows fluctuations or an increasing trend, exhibiting poor state of innovation in materials
efficiency. However, innovation in capital employed especially fixed capital per value of output has shown
slight improvement. Emoluments trend exhibits indifference to innovation. The total number of enterprises in
this sector was 2,378 in 2000-01 which decreased to 2,293 in 2004-05. In this sector there appears to be
insignificant innovation in terms of fuel consumption as well as in terms of addition of stocks.
Electronic/Computer Industries: This sector exhibits poorer show on innovation front compared to the
previous two sectors especially compared to automobiles. In the electronics and computer sector, material
consumption in terms of value of output as well as net value added is increasing indicating inefficiency in
material consumption. Whereas fixed capital invested in terms of net value added or value of output is
decreasing over the period 2001-05. Wages per value of output or net value added is almost constant
exhibiting indifference to innovation. There is no significant innovation in fuel consumption also. In this
sector, the number of industries increased marginally from 3,742 in 2000-01 to 3,797 in 2004-05.
Small Electronic Equipment Industries: Similar to the sector above, the small electronic equipment industries
sector exhibits a poor show in innovative activities with negative or indifferent trends of innovation. In this
sector material consumption in terms of value of output as well as net value added shows upward trend over
the period 2001-05 indicating material consumption inefficiency. Fixed capital invested per value of output as
well as net value added is almost constant. On other aspects, such as stock held or on emoluments related
business innovation, this sector remained indifferent. In this sector, the number of industries has reduced
from 2,167 in 2000-01 to 1,993 in 2004-05.
Tools Manufacturing: Perhaps the poorest show of innovation is evidenced in this sector. Material
consumption in terms of value of output as well as net value added shows a continuous increase over the
period 2001-05. The stocks held too show upward trend. Materials consumption could be reduced per value

S&T and Industry174
add through innovations within the enterprise while innovations in stock held would require improvements in
cross-sector linkages of systemic nature. But fixed capital invested per value of output as well as net value
added is showing a decreasing trend, exhibiting marginal innovative gains along this aspect alone. Number of
units was 8,600 and 8,681 in 2000-01 and 2004-05 respectively.
Processed Food Industries: This is another sector with negative or indifferent state of affairs in innovative
activities with marginal improvements only in stock held aspect of innovation and that too only in the later
part of the period. In the processed food sector, material consumption in terms of value of output as well as
net value added is increasing or indifferent. Fixed capital investment per value of as well as net value added
is also indifferent. This sector is having the highest number of industries among the sectors under consideration.
During 2000-01, the number of industries in this sector was 22,171 which has increased to 23,216 during
2004-05.
Textiles: Another poor show of innovative activity or absence of non-R&D innovation is evidenced in the
textiles sector enterprises. In the industries involved in textiles material consumption in terms of value of
output as well as net value added is almost constant over the period 2001-05. Fixed capital investment per
value of output as well as net value added is also almost constant, however, with marginal improvements
exhibiting better utilization of capital. This sector has the second highest number of enterprises after those in
the processed food sector. The number of industries was 16,914 and 16,906 during 2000-01 and 2004-05
respectively.
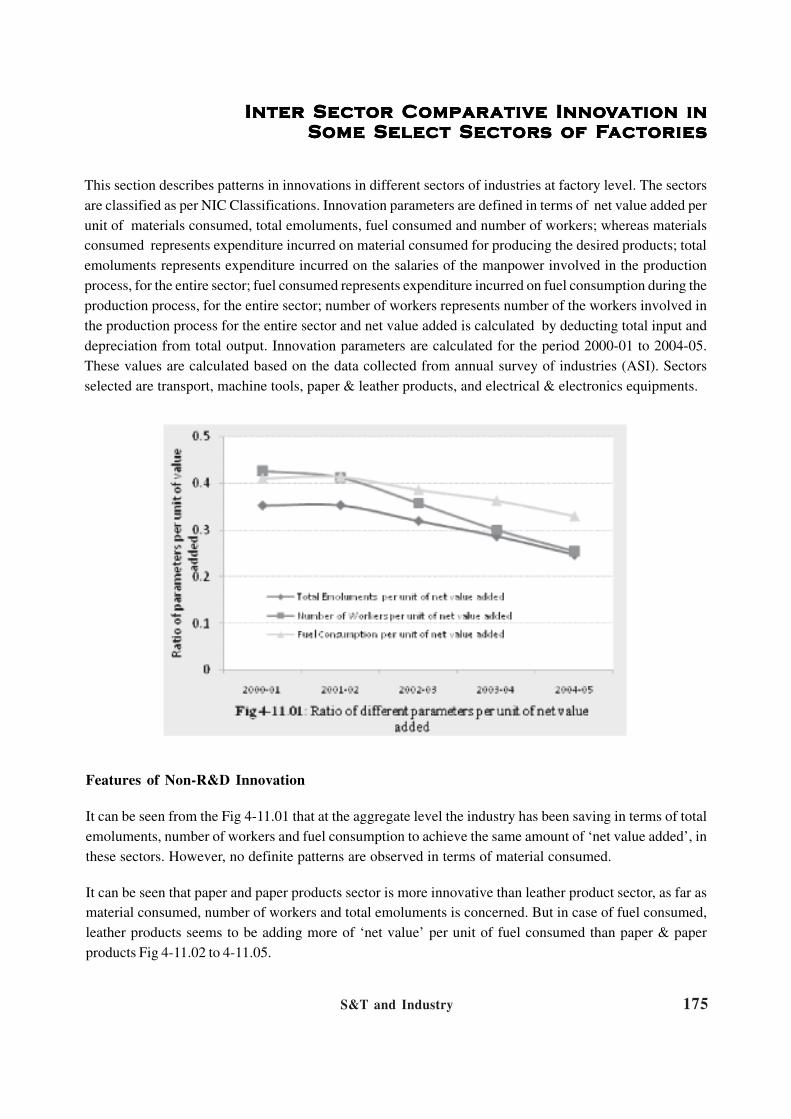
S&T and Industry 175
IntIntIntIntInter Secter Secter Secter Secter Sector Comor Comor Comor Comor Comparparparparparativativativativative Innoe Innoe Innoe Innoe Innovvvvvation ination ination ination ination inSome Select SectSome Select SectSome Select SectSome Select SectSome Select Sectororororors of Fs of Fs of Fs of Fs of Factactactactactorororororiesiesiesiesies
This section describes patterns in innovations in different sectors of industries at factory level. The sectors
are classified as per NIC Classifications. Innovation parameters are defined in terms of net value added per
unit of materials consumed, total emoluments, fuel consumed and number of workers; whereas materials
consumed represents expenditure incurred on material consumed for producing the desired products; total
emoluments represents expenditure incurred on the salaries of the manpower involved in the production
process, for the entire sector; fuel consumed represents expenditure incurred on fuel consumption during the
production process, for the entire sector; number of workers represents number of the workers involved in
the production process for the entire sector and net value added is calculated by deducting total input and
depreciation from total output. Innovation parameters are calculated for the period 2000-01 to 2004-05.
These values are calculated based on the data collected from annual survey of industries (ASI). Sectors
selected are transport, machine tools, paper & leather products, and electrical & electronics equipments.
Features of Non-R&D Innovation
It can be seen from the Fig 4-11.01 that at the aggregate level the industry has been saving in terms of total
emoluments, number of workers and fuel consumption to achieve the same amount of ‘net value added’, in
these sectors. However, no definite patterns are observed in terms of material consumed.
It can be seen that paper and paper products sector is more innovative than leather product sector, as far as
material consumed, number of workers and total emoluments is concerned. But in case of fuel consumed,
leather products seems to be adding more of ‘net value’ per unit of fuel consumed than paper & paper
products Fig 4-11.02 to 4-11.05.

S&T and Industry176
Trends in innovation parameters for transport sector have been shown in Table 4-11.01 and 4-11.02. It can
be seen that manufacture of transport equipment has emerged as most innovative in terms of fuel
consumption, while manufacture of motor vehicles has emerged as most innovative in terms of number of
workers. Manufacture of parts and accessories for motor vehicles and their engines has emerged as most
innovative in terms of material consumption.
Electrical & electronics equipments covered following sub-sectors:
Manufacture of office, accounting and computing machinery; Manufacture of accumulators, primary cells
and primary batteries; Manufacture of television and radio transmitters and apparatus for line telephony and
line telegraphy; Manufacture of electric motors, generators and transformers; Manufacture of electric
lamps and lighting equipment; Manufacture of television and radio receivers, sound or video recording or
reproducing apparatus, and associated goods; Manufacture of electricity distribution and control apparatus;
Manufacture of other electrical equipment; Manufacture of insulated wire and cable; Manufacture of
electronic valves and tubes and other electronic components

S&T and Industry 177
In terms of total emoluments per unit of net value added, sectors like manufacture of accumulators, primary
cells and primary batteries, manufacture of office, accounting and computing machinery and manufacture
of electric motors, generators and transformers emerged as most innovative.
In terms of numbers of workers, manufacture of television and radio receivers, sound or video recording or
reproducing apparatus, and associated goods, manufacture of electric motors, generators and transformers,
manufacture of office, accounting and computing machinery emerged as top three sectors.
valu
e a
dd
ed
valu
e

S&T and Industry178
In terms of innovation achieved in fuel consumption, the top three sectors are manufacture of electric
motors, generators and transformers; manufacture of office, accounting and computing machinery and
manufacture of electricity distribution and control apparatus.
In case of material consumption, following sectors emerged as most prominent
• Manufacture of office, accounting and computing machinery
• Manufacture of accumulators, primary cells and primary batteries
• Manufacture of television and radio transmitters and apparatus for line telephony and line telegraphy
Machine tool sector was further divided into ‘manufacture of special purpose machinery’ and ‘manufacture
of general purpose machinery’ for observing trends in innovations. However it was found that both the
sectors showed a decline in innovation in terms of material consumed, showing an improvement in terms of
number of workers involved in the production process from year 2002 onwards.
Recent Trend in Technology Up-gradation in theRecent Trend in Technology Up-gradation in theRecent Trend in Technology Up-gradation in theRecent Trend in Technology Up-gradation in theRecent Trend in Technology Up-gradation in the
Indian Textile IndustryIndian Textile IndustryIndian Textile IndustryIndian Textile IndustryIndian Textile Industry : Need for S&T Intervention: Need for S&T Intervention: Need for S&T Intervention: Need for S&T Intervention: Need for S&T Intervention
The importance of textile industry in the national economy can be found in its substantial contribution to
employment, value addition and export earnings. In 2005-06 textile sector contributed 17.4 per cent in total
exports of the country. The following summary account of the sector exhibits a few features of importance,
and these are: (1) industry structure with significant presence of small sub-sectors; (2) under-capitalized
units and low labor productivity holding up; (3) skill sets in need of improvement – and all this calls for
technological intervention.
The textiles and clothing industry can be broadly divided into five stages of production, namely, ginning,
spinning (yarn), weaving (fabrics), made-ups, and garments. According to the Handbook of Statistics on
Textile Industry (HBSTI) (2008), non-SSI textile mills including spinning employed 8.53 lakh workers in
2007 with the average size of employment per mill being 472 and the SSI spinning mills employed 42,270
workers with average employment per mill being 32 workers. Bedi’s (2008) estimates indicate that
approximately 52.5 lakh textile and clothing units existed in India in 2000–2001 and around 99.9 per cent of
these units operated with gross value of plant and machinery (GVP&M) less than or equal to Rs 1 crore.
Total value-addition by this sector amounts to Rs 37,127 crore of which ginning, cleaning and bailing shared
0.1 percentage, spinning 28.9 per cent, weaving 19.4 percent and the finishing, made-up and garment
7 per cent, 16.2 per cent and 28.5 per cent respectively. It employed around 124 lakh people and the share
of ginning, cleaning and bailing was 0.2 percent, spinning 7.6 percent, weaving 26.3 percent, finishing
3.8 per cent, made-ups 22.9 per cent and garments 39.2 per cent. Value added per worker turns out to be
only Rs 24 thousand.

S&T and Industry 179
Gross Fixed Capital Formation (GFCF) indicative of addition of new plants and machinery embodying new
or improved technology followed a cyclical pattern as per ASI data (at 1993-94 prices) - it first increased
rapidly during 1991-1996, then started declining and reached the trough of the cycle in 2002 and thereafter
it started moving upward and continued till 2005 (for which latest data are available). Average annual
investment was Rs 3,129 crore during 1991-94, which rose to Rs 5,769 crore during 1995-98 and then
declined substantially to Rs 3,815 crore during 1999-2003 and it again rose to Rs 4,358 crore during
2003-05. Disaggregated data indicate that the three segments namely spinning, weaving and finishing of
textiles received the major share of the investments. Steady and a sizeable growth of investment in the
periods 1999 onwards however took place in made-up textiles, knitted and crocheted fabrics and articles,
and wearing apparel. The rapid growth of the investment in textile machines reflect to an extent the effect
of Technology Uprradation Fund Scheme (TUFS) which started in 1999 in order to compensate for the
global disadvantages faced by the Indian textile industry in the field of power, transaction costs and additional
costs borne by the industry due to poor infrastructure.
There are various subventions under TUFS for different forms of capital subsidy/interest subsidy. But on an
average Government outflow under the scheme has been around 5% of the amount disbursed (by the banks
and financial institutions in the form of loans/advances, etc). It was initially launched for five years only, but
later on it was further extended and modified several times and the latest extension is up to March 31, 2012.
TUF scheme has been an important contributor to investment and modernization of the textiles and clothing
industry since the inception of the scheme. Till March 31, 2008 a total of Rs. 54,229 crore had been
sanctioned and Rs 44,917 crore had been disbursed under TUFS to various textiles and garment units.
Spinning mills availed the maximum benefit from TUFS with disbursement of Rs. 14,841 crore (i.e.33.04%
of the total disbursed amount). Other major beneficiaries are units of processing of textiles and garments,
weaving, garment manufacturing, viscose filament yarn manufacturing, synthetic filament yarn, texturising,
crimping & twisting and knitting. However there has been a gradual shift in relative importance of different
segments - for instance, share of composite mills decreased from 30.74% as on March 31, 2002 to 18.88%
on March 31, 2008; the share of weaving units increased from 6% to 8.58 %; ‘others’ including cotton
ginning and pressing, CPP on stand-alone basis, fabric embroidery, jute industry, silk reeling and twisting,
wool scouring and combing, etc increased from 2.37% to 14.27%. This indicates the beneficiaries of TUFS
are becoming more and broader based. Loans availed through TUFS make a significant contribution of
project costs of the units that had applied for TUFS - in the spinning segment it covered 47-57% of the
project cost, in composite mills 37-45% and in garments 45-56% during 1999-2008.
A major drawback with TUFS is that it does not take into account the textile machinery manufacturing
sector which could have been a leading and thriving sector given the rapid growth in domestic demand for
textile machinery. This sector is stagnating with little investment in capacity building or modernization. Existing
capacity is largely underutilized. Thus with growing demand the textile industry has been importing larger
and larger share of its total machinery requirement. Imports of even conditioned (second hand) machinery
are also quite substantial at present. In this context extending TUFS to machinery manufacturing sector and
allotting a percentage of that for R&D would in the long run raise its scale of operation and make it globally
competitive as may be seen in the case of a similar policy in China. This would also save the textile sector
from the problems of currency fluctuation for importing machines as it is happening at present.

S&T and Industry180
In summary, Indian textile industry is in need of technology up-gradation so as to make it globally competitive.
Although this up-gradation process is going on, particularly after the introduction of TUFS, it is rather slow
and too much dependent on imports of machinery. In view of the large demand for textile products a large
variety of machinery is being imported. Keeping in view this huge domestic demand for machinery, suitable
machine tools industry can be developed and that can also achieve scale economy. Along with this substantial
amount of R&D would be needed to develop state of the art technology. Because of inappropriate technology,
the existing Indian textile machinery manufacturing industry is not merely facing severe underutilization of
capacity, most of its produce is not used by the Indian textile manufacturers. It is suggestive that a part of
the TUFS money can be earmarked for R&D in the machine tools industry segment that is engaged in
developing textiles machinery.

S&T and Industry 181
Indian AIndian AIndian AIndian AIndian Autututututomoomoomoomoomotivtivtivtivtive Induse Induse Induse Induse Industrtrtrtrtryyyyy : Inno: Inno: Inno: Inno: Innovvvvvation and Gration and Gration and Gration and Gration and Grooooowtwtwtwtwthhhhh
Chronology and typology of India’s automotive growth
The growth of Indian automotive industry from the pre-independence period till date shows distinct phases.
It all started in 1940s: the embryonic automotive industry emerged in pre-independent India. Despite the
sluggish growth of the economy during 1950-1980, the automotive industry began to witness a relatively fast
growth during 1970-1980 mainly due to the leading production role of Telco, Ashok Leyland, Mahindra &
Mahindra, Hindustan Motors, Premier Automobiles, and Bajaj Auto. The growing demand for more cars
since 1980s has changed the whole growth scenario. During 1980-1985 the first major change was sighted
as Japanese manufacturers began to build car and commercial vehicle factories in India in partnership with
Indian firms. At the same time, component manufacturers also entered the joint-venture scenario with
European and US firms. Between the years 1985-1990 a noticeable change took place in the Indian automotive
industry. The industry marked the entry of Maruti Udyog into the production of passenger cars: persistent
high import tariffs were relaxed to a great extent, and with lesser import cost adding to the overhead
production cost, higher productions were possible leading to the start of growing exports.

S&T and Industry182
Growth Dynamics of Automotive Segment
There has been a considerable growth in the passenger car segment in comparison to the MUVs/jeeps
during the same period as shown in Fig 4-13.04. It is evident that the major contribution to the growth of the
total volume is from the car segment.
Automotive industry of India also started exporting slowly after the liberalization. Here again, MUL and
TELCO have been the leading exporters, accounting for 95 percent and 86 per cent of passenger cars and
commercial vehicle exports respectively in late 1990s. The automobile industry, along with the component
industry, has significantly raised exports only in more recent years. In fact, the volume of exports was very
small and had shown a downward trend in the later part of 90%. Afterwards, the trend started to reverse,
however. For example, during the year 2002-03 the export of automobile industry had registered a growth
rate of 65.35 per cent. Technological sophistication of the industry has also picked up after India adhered to
the global environmental norms regarding emission standards as well as quality certifications. The upward
trend in exports also reflects the changing nature of technological sophistication of the Indian automotive
sector. Structural and technological changes in the automotive industry also have multiple trickle-down
effects on its allied components segment as the latter is inextricably linked to the former in the value chain.
The intricate nature of automotive industry’s intra-sector relationships due to its tiered structure, and the
Years

S&T and Industry 183
dynamics of international automotive market developments make it hard to disentangle the effects of the
changes in both the sectors.
Auto Component Industry – Recent Performance Indicators
Trends in production: To cater to existing and new vehicle manufacturers’ requirements a continuous
expansion of the automotive components sector has been occurring after 1980s. With the opening up of the
economy, a renewed optimism of market growth prospects inspired higher investment and output in this
sector. In 1996-97, the investment in the component sector marked a little above 1,500 million dollars, but in
2001-2002, the investment rose to 2,300 million dollars which is a remarkable growth of 30 per cent in over
five years (Fig 4-13.09), notwithstanding the existing structural bottlenecks like poor road infrastructure.
The total production of auto components has been increasing at about 19 per cent per annum since 1960s.
However, the gross output in value terms was quite miniscule till mid 70’s and picked up only after 80’s. As
can be gleaned from Fig 4-13.10, the volume of production was almost negligible in the 1960s. It is only after

S&T and Industry184
1975 that some respectable production started (Fig 4-13.10), and in the subsequent years total auto component
production has grown almost exponentially. Following the high growth of total production is the growth of
engine parts and drive transmission and steering parts. All through the period, engine parts, being high value-
added in nature, have been contributing the most to total production.
The direction of component export of the developing countries, i.e., whether they are exporting more to the
developed or developing nations, is an important indicator of the competitiveness of the industry in the world
market. Generally, exports of components mainly to the OECD countries would indicate technologically
superior products, which cope up with international competition. India’s auto component exports have marked
a global presence in recent years. For instance, before 1993, the share of exports going to the non-OECD
countries was higher than that for the OECD block (Fig 4-13.12). But as the impact of liberalization started
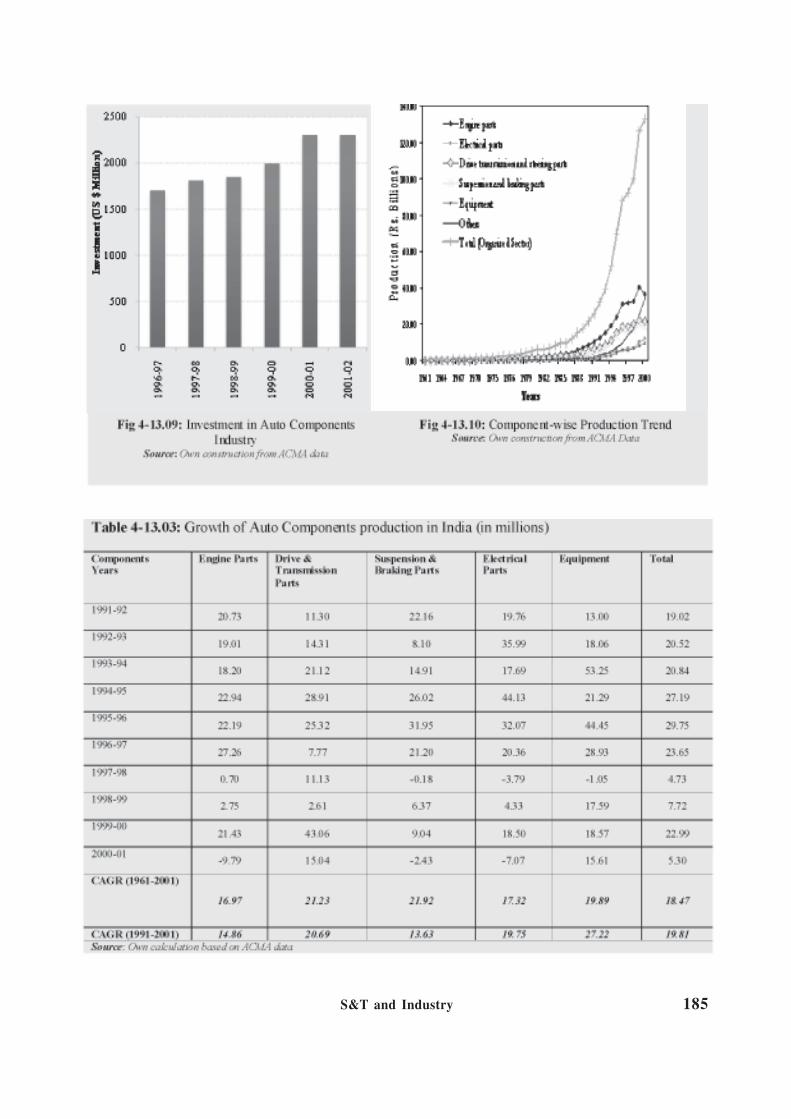
S&T and Industry 185

S&T and Industry186
to flourish, the direction of the exports reversed after 1994; exports to OECD countries have been growing
significantly. Currently, of the total auto component exports, developed markets such as the US and Europe
together account for about 56 percent, Asia accounts for 27 percent and Africa accounts for 11 percent of
the export earnings. The rise of exports in India was also partly led by the overcapacity in the domestic
market that resulted from the sudden influx of FDI in 1990s. However, the focus on export markets opened
up many avenues and challenges alike. While with growing exports, Indian companies gained increasing
stakes in the global sourcing, at the same time they became aware of their technological capabilities in the
‘global industry’.
Inflow of foreign direct investment (FDI) and rise in foreign collaborations: Endowed with the potential
of low-cost manufacturing along with a high engineering skills workforce, India edges over other developing
countries with respect to component manufacturing. Many international component manufacturers such as
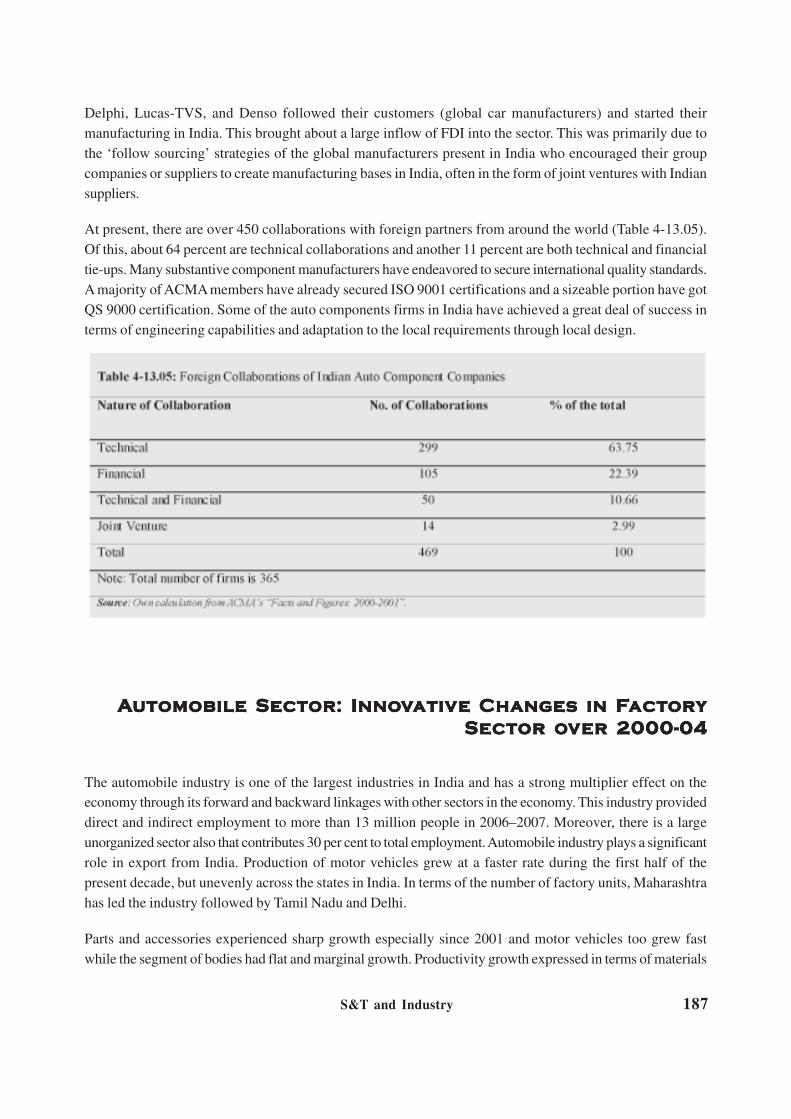
S&T and Industry 187
Delphi, Lucas-TVS, and Denso followed their customers (global car manufacturers) and started their
manufacturing in India. This brought about a large inflow of FDI into the sector. This was primarily due to
the ‘follow sourcing’ strategies of the global manufacturers present in India who encouraged their group
companies or suppliers to create manufacturing bases in India, often in the form of joint ventures with Indian
suppliers.
At present, there are over 450 collaborations with foreign partners from around the world (Table 4-13.05).
Of this, about 64 percent are technical collaborations and another 11 percent are both technical and financial
tie-ups. Many substantive component manufacturers have endeavored to secure international quality standards.
A majority of ACMA members have already secured ISO 9001 certifications and a sizeable portion have got
QS 9000 certification. Some of the auto components firms in India have achieved a great deal of success in
terms of engineering capabilities and adaptation to the local requirements through local design.
AAAAAutututututomobile Sectomobile Sectomobile Sectomobile Sectomobile Sectororororor: Inno: Inno: Inno: Inno: Innovvvvvativativativativative Change Change Change Change Changes in Fes in Fes in Fes in Fes in Factactactactactorororororyyyyy
SectSectSectSectSector oor oor oor oor ovvvvver 2000-0er 2000-0er 2000-0er 2000-0er 2000-044444
The automobile industry is one of the largest industries in India and has a strong multiplier effect on the
economy through its forward and backward linkages with other sectors in the economy. This industry provided
direct and indirect employment to more than 13 million people in 2006–2007. Moreover, there is a large
unorganized sector also that contributes 30 per cent to total employment. Automobile industry plays a significant
role in export from India. Production of motor vehicles grew at a faster rate during the first half of the
present decade, but unevenly across the states in India. In terms of the number of factory units, Maharashtra
has led the industry followed by Tamil Nadu and Delhi.
Parts and accessories experienced sharp growth especially since 2001 and motor vehicles too grew fast
while the segment of bodies had flat and marginal growth. Productivity growth expressed in terms of materials

S&T and Industry188
consumed per output and also fuel
consumed per output was very high for the
integrated production system of motor
vehicles while for bodies the productivity
in fact dropped for the materials consumed
per output, and strangely the productivity
dropped on both two measures for parts
and accessories production, done mostly
under SME segment. The data for five
years indicate organizational and process
as well as system innovation had helped
very significantly the motor vehicles
producing large sector, however, small
organizations could not achieve such
innovations.
Data from unit factory level suggest that
organizational and systemic innovation
played crucial role in shaping productivity
and competitiveness outcomes. Wages
remained higher during the four years
2001-04 in the states of Maharashtra
followed by Jharkhand than in Haryana,
Tamil Nadu; in West Bengal wages
decreased, however, remained higher
compared to wages in small units in Delhi, Gujarat, Rajasthan. Delhi with a fall in wage offered the lowest
of all.
Value added per worker was the highest in Jharkhand where in fact it grew sharply during these four years,
followed by Haryana and followed by Rajasthan and then Maharashtra. Worker productivity grew slowly in
Rajasthan, then Haryana and at even lower pace in Maharashtra. West Bengal exhibits abnormally low and
the lowest labour productivity. The fabulous gain in labour productivity in Jharkhand is not attributable to
huge additional investment in capital machineries. In fact states with larger investment in capital machineries
such as Uttar Pradesh, Andhra Pradesh, or Gujarat (even Maharashtra) experienced often very low labour
productivity or gains in such productivity. Jharkhand’s gain appears to be systemic and organizational.
Fig. 4-14.01: Trends in values of output (in lakh Rs.)
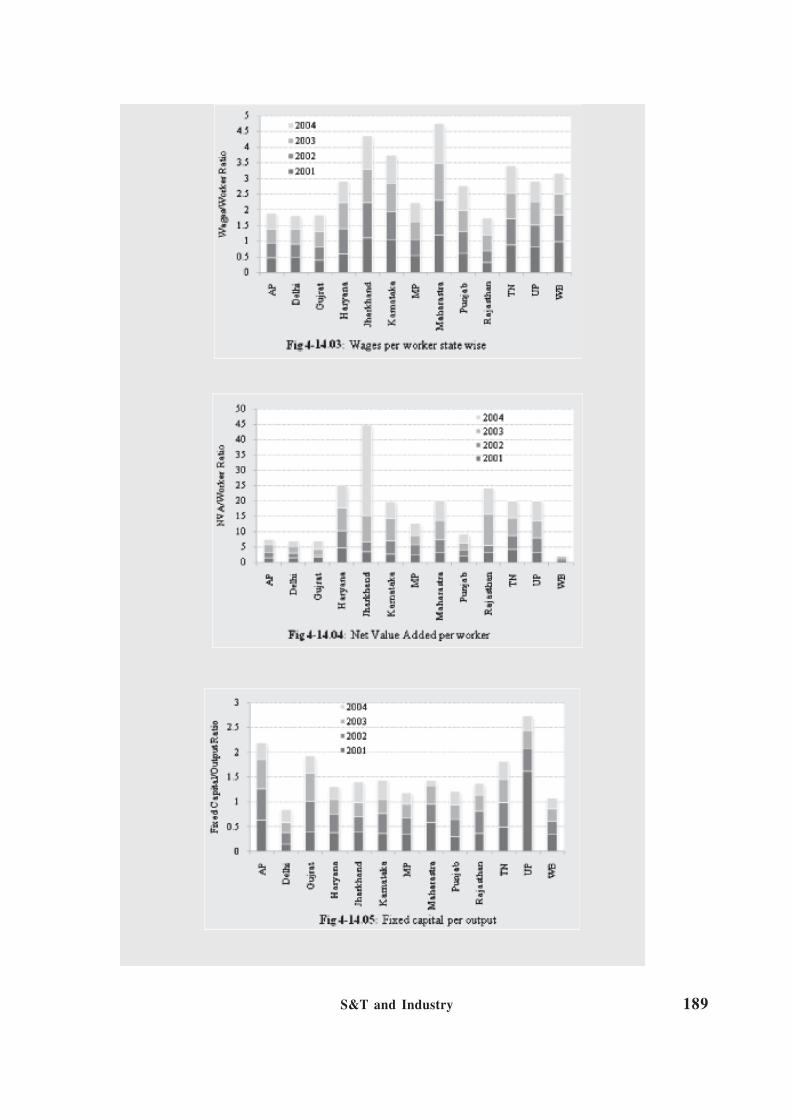
S&T and Industry 189

S&T and Industry190
TTTTTyryryryryre Induse Induse Induse Induse Industrtrtrtrtry in Indiay in Indiay in Indiay in Indiay in India
Technology generation in the Indian tyre industry has witnessed a fair amount of expertise and versatility to
absorb, adapt and modify international technology to suit Indian conditions. This is reflected in the swift
technology progression from cotton (reinforcement) carcass to high-performance radial tyres in a span of
four decades.
KEY FEATURES
Major players: At present there are 40 listed companies in the tyre sector in India. Major players are MRF, JK Tyres,
Apollo Tyres and CEAT, which together account for 63 per cent of the organized tyre market. The other key players include
Modi Rubber, Kesoram Industries and Goodyear India, with 11 per cent, 7 per cent and 6 per cent share respectively.
Dunlop, Falcon, Tyre Corporation of India Limited (TCIL), TVS-Srichakra, Metro Tyres and Balkrishna Tyres are some of
the other significant players in the industry. While the tyre industry is largely dominated by the organized sector, the
unorganized sector is predominant with respect to bicycle tyres
Raw Material Intensive: The sector is raw-material intensive, with raw materials accounting for 70% of the total costs of
production The industry is a major consumer of the domestic rubber market. Natural rubber constitutes 80% while synthetic
rubber constitutes only 20% of the material content in Indian tyres. Interestingly, world-wide, the proportion of natural to
synthetic rubber in tyres is 30:70
Production: Total tyre production figures in tonnage is 11.35 lakh M.T and total production (in nos.) of tyres in all
categories is 811 lakh (2007-08)
Radialisation: Current level of radialisation includes 95% for all passenger car tyres, 12% for light commercial vehicles and
3% for heavy vehicles (truck and bus)
Import related trends: Restrictions have been placed on import of used /retreaded tyres since April 2006. Import of new
tyres & tubes are freely allowed except for radial tyres in the truck/bus segment which has been placed in the restricted list
since November 2008
Export: Total value of tyre exports in India is approximately Rs 3000 Crore (2007-08)
Demand: Some major factors affecting demand for tyres include level of industrial activity, availability and cost of credit,
transportation volumes and network of roads, execution of vehicle loading rules, radialisation and retreading.
Source: CMIE & ATMA
R&D Efforts, Exports & Sales
A significant proportion of R&D effort is being carried out by the top ten companies. The proportion of raw
material expenditure in relation to sales has been relatively stable for top ten companies while in the case of
sectoral aggregates, it has witnessed a sharp spurt in 2007. The proportion of exports to total sales continues
to be negligible.
Technology Generation
Technology generation is geared towards developmental research, involving the changing of tread design,

S&T and Industry 191
reinforcement material etc. Most of the major players do not engage in basic research due to high costs. The
source of technology for the domestic firms has been through reverse engineering, joint ventures and
collaborations. The emphasis on applied research, setting up of well equipped in-house R&D centers by the
companies, manned by experts have all helped in technology upgradation. Indian tyre industry has exhibited
versatility in maintaining inflow of technology through foreign collaborations and tailoring the same to domestic
needs. R&D is essentially business or market driven. However, raw material suppliers could also help in
conceiving new projects. Tackling compound development and in-process problems has been main thrust of
in-house R&D.
Automation
Tyre production traditionally, is multi-stage, with significant inter-stage differences in the intensity of labour
requirement and a highly complex process involving the use of around 37 different materials, including
rubber, steel, fabrics and vulcanizing materials. The production system has been traditionally very labour
intensive. The automation of manufacturing processes has increased gradually, which has slashed the size
of the workforce to a considerable degree and has effected a change in its composition. The degree of
automation has been greater in the area of radial technology, while cross-ply technology is still labour
intensive. Firms have been resorting to automation to tackle the problems related to labour unionization and
indiscipline in the sector. The rationale provided by the firms for automation has been that high quality and
standardization cannot be guaranteed with a labour intensive process.

S&T and Industry192
Recent Initiatives
The tyre industry in India has had to grapple with raw material price volatility, rupee appreciation and cheap
Chinese imports. In this connection, some recent initiatives by the government to facilitate the growth of the
sector include no restrictions on the importing of all categories of new tyres except truck/bus (radial tyres),
which has been placed in the restricted list from November 2008, no WTO bound rates for tyres and tubes,
no restrictions on the import of all raw materials required for tyre manufacture except carbon black and
increasing thrust on development of road infrastructure.
The Indian tyre industry is expected to show a healthy growth rate of 9-10 per cent over the next five years,
according to a recent study by Credit Analysis and Research Limited (CARE). While the truck and bus
tyres are set to register a compounded annual growth rate (CAGR) of 8%, the light commercial vehicles
(LCV) segment is expected to show a CAGR of about 14 %. The growth of the sector is closely linked to
the expansion plans of the automobile companies, the government’s thrust on development of road

S&T and Industry 193
infrastructure and the sourcing of auto parts by the global Original Equipment Manufacturers (OEMs),
exploring newer markets, increasing degree of radialisation, innovation and emphasis on product differentiation.
IndiaIndiaIndiaIndiaIndia’’’’’s Ts Ts Ts Ts Telecommunications Induselecommunications Induselecommunications Induselecommunications Induselecommunications Industrtrtrtrtryyyyy
The phenomenal growth of the IT industry in India has brought to the fore the growing importance of India
as a knowledge powerhouse. But this competitiveness is restricted to the services sector. In fact the service
sector in general has come to occupy pre-eminent position in India’s economy in terms of its contribution to
overall GDP, exports and as a destination for Foreign Direct Investments. An interesting dimension of high
technology production in India is that this capability is largely in the realm of services, rather than in
manufacturing. And an industry where it is very clearly visible is in the area of telecommunication where a
revolution of sorts is taking place.
Contribution of Telecommunications Sector to India’s Economy
The sector accounts for about 4 per cent of GDP and with its rather high rate of growth contributes about
11 per cent of the growth in overall GDP of the country. Of the Information and Communications Technology
(ICT) sector of the economy, it is again the communications sector that is more important. Around
63 per cent spending on ICT was done in communications (Figure 4-16.01).
The communication sector is
composed of both services and
equipment manufacturing although
in the above characterization the
data refers only to the services
segment. The domestic production
of telecom equipments has shown
some impressive increases during
the period since 2001, but even
now (2006), it accounts for only
about 15 per cent of the total
telecom industry. Even then with
some fluctuations the equipment
sector is slowly decreasing its
share in the total revenues of the
telecommuni-cations industry.

S&T and Industry194
Dimensions of the Growth Performance of Telecommuni-cations Services
In India, the number of telephone subscribers has increased from 5 million in 1991 to 385 million by the end
of 2008 showing an average annual growth rate of over 27 per cent. No other country in the world, other
than China, has shown such high rates of growth. Tele-density which was below 1 telephone per 100
persons has now risen sharply to about 33 (Table 4-16.01). Among the infrastructure industries,
telecommunications is the only industry that has shown significant improvements over the reform period.
There are at least, seven dimensions of this growth performance that merit attention:
i) Dominance of wireless technology than wire-line: Almost the entire increase in the availability of
telephones has been contributed by wireless technologies. India has one of the highest ratios of wireless
to wire-line technologies, which is now almost 9. This rather heavy reliance on wireless technologies,
while extremely positive from the availability point of view, has some implications for the diffusion of
internet in the country.
ii) Monthly addition to mobile subscribers and the growing market for telecom handsets: There has
been a steady increase in the average number of mobile subscribers per month since 2003. In 2003, on
an average 1.5 million new subscribers were added to the existing stock. This has since increased to
approximately 9 million per month in 2008. However, the very sharp reduction in the number of
subscribers in March 2007 was due to a governmental security regulation. Consequently, a huge
domestic market for telecom equipments has suddenly emerged in the country spawning the creation

S&T and Industry 195
of a significant manufacturing base. The South Indian city of Chennai has become a thriving cluster
for mobile handsets manufacturing and this has important implications for the downstream industries
such as the semi-conductor industry.
iii) Increasing privatization of the telecom services industry: The distribution of telecom services in
the country was entirely in the hands of the public sector for a very long time until the middle of the
1990s. The new telecom policy of 1994 changed all this. The share of the private sector in the overall
telecoms industry has been rising (Fig 4-16.02) and the ratio of private to public has actually crossed
unity in 2006. This again is due to the fact that the public sector is more dominant in wire-line (or
fixed) and the private sector is dominant in the wireless (mobile) segment.
iv) Competition in the provision of telecom services: (Fixed vs. Mobile and within Mobile GSM vs.
CDMA): An interesting feature of the industry is that after a very long time, it has suddenly become
very competitive. There are three dimensions to this competition. First, it is a competition between
two standards or technologies, namely Global System for Mobile Communications (GSM) vs Code
Division Multiple Access (CDMA) standards. Second, it is a competition between various service
providers. Still another dimension is the type of market - Local telephone market; Long distance or
national telecom services; and Foreign or the overseas market.
A. Competition in Fixed and Mobile technologies: The markets for mobile services are much
more competitive than the one for fixed line services. In the latter the incumbent service provider,
BSNL continues to have a lion’s share of the market. However, the existence of mobile
communication services have made the market for fixed line services contestable and as a result
despite high concentration, prices of fixed telecom services kept falling or were kept under
check over the last five years or so.
a) Competition in fixed telephone services: The market for fixed telephone services is
much more concentrated than the one for mobile services (the Herfindahl Index for fixed
services for the nation as a whole works out to 0.6899 while the one for mobile services
work out to 0.1592). This national level picture hides the level of competition that exists at
the sub national level. In order to gauge this, the structure of the market for fixed telecom

S&T and Industry196
services in each of the 28 telecom circles that the country is divided into, have been computed.
As can be seen from Table 4-16.02, the market for fixed telecom services is highly
concentrated in all the telecom circles, although in some of them, namely Delhi-NCR,
Chennai, Madhya Pradesh, Mumbai, Punjab and Karnataka, the H Index has a value less
than 0.8000. There are two dimensions to this level of competition for fixed services.
First, as has been argued earlier, the consumers are increasingly substituting mobile for
fixed services, so the fixed service providers face intense competition from mobile services.
Second, the existence of a telecom regulator too has acted as a check on the dominant
service provider, BSNL from charging high prices.
b) Competition in the mobile services industry: If one computes the H-Index for the industry,
at the national level (which is not exactly meaningful as some of the providers are only at
specific telecom circles), it shows a mild increase: the H-Index for the industry increased
from 0.1370 in 2002 to 0.1593 in 2007. However, this increase hides considerable variations
at the circle level. Most of the service providers have focused on specific regional markets,
with the exception of Bharti (the largest mobile service provider). In fact there are only

S&T and Industry 197
four service providers who have a presence in at least 20 of the 29 circles. It is also
interesting to see that the circles where BSNL has a monopoly position are also those with
very low revenue potential. In other words, the private sector providers have positioned
themselves in the most revenue earning circles. Also it is seen that it is in the circles with
high revenue earning potential that one sees an increase in the intensity of competition- the
metros of Delhi, Mumbai and Chennai for instance.
B. Competition between mobile standards: Since the introduction of mobile phones towards the
latter half of the 1990s and until the end of 2002, the market was dominated by just one technology,
the GSM. But in December 2002, a firm called Reliance Infocomm Ltd. launched CDMA services
across 17 circles on a countrywide basis. Most Indian consumers are unaware of the nitty-gritty
of the two technologies. So the deciding factor between the two technologies is often based on
price and other conditions of offer. Given this sort of a possibility of perfect substitution between
the two types of technologies, the existence of the two standards have made both the markets
for GSM and CDMA services very competitive. What is being argued here is that despite being
highly concentrated CDMA service providers have to compete with GSM service providers and
this has prevented the CDMA service providers wielding any excessive market power.
One of the most important institutional requirements for competition to emerge and sustain is the
introduction of number portability. TRAI had recommended in March 2006 to the Department of
Telecommunications (DoT) that mobile number portability be introduced by April 2007. It appears that
DoT has not accepted this recommendation citing technical reasons such as non-availability of dual
technology handsets that can handle both GSM and CDMA handsets. It is generally held that major
opposition to number portability came from GSM service providers while the CDMA providers were
welcoming it with the hope that it would allow them to expand their market share.
v) Price of telecom services: Before the deregulation of the telecom services industry and indeed the
entry of mobile service providers, the telecom consumers were periodically subjected to increase in
the tariff. Based on estimates made by TRAI (2006), the minimum effective charge derived out of an
outgoing usage of 250 minutes per month per quarter during 2003 through 2005 has been plotted for
both fixed and mobile services. Although charges for both the calls have come down, a higher reduction
is noticed in the case of mobile services.
The two state-owned service providers, BSNL and MTNL have launched “One India Plan” with effect
from 01.03.2006. Under this plan a three minute local call and a one minute national long distance call
(referred to as STD call) will cost only Re. 1. The “One India” plan, also, for the first time, takes away
the distinction between the fixed line tariff and the cellular tariff and thus, makes the tariff “technology
independent”. A similar plan has also been introduced for the customers of post paid and pre-paid
mobile services of BSNL and MTNL.
vi) Institutional support: An interesting feature of the growth of telecommunications industry in the
1990s and beyond, compared to the earlier period, is the strong public policy support that the industry
has received. It manifested in the form of the following acts/policies.

S&T and Industry198
National Telecom Policy of 1994:
• Telecom Regulatory Authority Act of 1997
• New Telecom Policy of 1999
• Broadband Policy of 2004
Other policies having an indirect effect are: FDI policy, the Electronic Hardware Policy of 2003, and
the Semiconductor Policy of 2007. Among these four main policies, the most important piece of legislation
that is determining the growth performance of the industry is the establishment of a regulatory agency
in the name of Telecom Regulatory Authority of India (TRAI).
ii) Growing R&D outsourcing: It is generally held that India has emerged as a major R&D hub. The
total receipt on R&D services have doubled itself from US $ 221 million in 2004-05 to US $ 519
million in 2005-06. Telecom along with the pharmaceutical industry is a major recipient of these
investments. The innovative performance of this segment can be gauged from the fact the number of
US patents issued to inventors from India (including MNCs having operations in India) in the area of
telecom technologies has increased from just 1 in 2001 to 13 in 2005 (Table 4-16.03).
GrGrGrGrGrooooowtwtwtwtwth Ph Ph Ph Ph Perererererfffffororororormance of Tmance of Tmance of Tmance of Tmance of Tececececechnology Orhnology Orhnology Orhnology Orhnology Orientientientientientededededed
Industries in India: Case – BiotechnologyIndustries in India: Case – BiotechnologyIndustries in India: Case – BiotechnologyIndustries in India: Case – BiotechnologyIndustries in India: Case – Biotechnology
Biotechnology (BT) can be defined in at least two ways. It can mean any technique which uses living
organisms or parts thereof to make or modify products, improve plant or animal productivity or to develop
micro-organisms for specific use. This definition encompasses new biological tools as well as ancient uses.
A second and narrower definition refers to new “high-end” biotechnology, involving recombinant DNA, cell
fusion and novel bio-process engineering techniques such as gene transfer, embryo-manipulation monoclonal
anti-bodies and so on. In India earlier the first definition was used, but it is being replaced gradually by the
second one in the last few years.

S&T and Industry 199
R&D intensiveness, long gestation periods, high investment, high value addition, heavy risk, stringent &
evolving regulatory norms, uncertain levels of acceptance of BT products, ethical concerns etc. make BT
very distinct from other technologies and especially from the point of view of investing in the field at research
or commercialization level. The cost of product development in the bio-industries is high. Taking a new
diagnostic kit from R&D to market might cost from $2 to $30 million and take up to 5 years. A new pharma
product or crop variety might take 12-15 years and over $ 200 million to reach the market.
A look at the allocations & expenditure by the Department of Biotechnology and other public bodies over the
years gives evidence of the importance assigned by the Government and the commitment to make India one
of the advanced countries in BT in the developing world. The government initiatives involve establishment of
infrastructure for research in universities and public funded R&D institutions. The efforts included generation
of manpower for research and also for absorption by industries in Biotechnology area. Department of

S&T and Industry200
Biotechnology which played a pivotal role in these efforts has also created mechanisms for technology
transfer and guidelines for regulation of GMOs and GMO based products.
Indian Biotechnology industry started after the research capabilities and infrastructure were developed.
Most of BT commercialization occurred basically in two phases. First in the late 1980s in the form of low
end biotech ventures, in the form of tissue culture companies and ELISA or other formats of in vitro diagnostics.
But most of the companies which were active in these areas slowly disappeared by mid 90s. The second
phase had companies which are mostly diversified pharma companies which expanded their operations in
the area of biotechnology. The new Biotech companies started as dedicated units which were small and had
narrow focus with a couple of products. The other breed of small companies mostly took a service role of
doing research at the basic level or generating clinical data or bioinformatics.
Structure of Biotech Industry
There are about 130 companies which are privately owned, another 75 by public, 13 MNCs and around 10
companies about which information is not known. Out of the 300 odd companies 56% are small, ~15% are
medium and 28% companies are large in size.
These companies do differ in their activities. Some of them undertake research, production and marketing,
while some do only research or marketing. Some companies are involved in production and marketing.
Distribution of these companies according to the product segments shows that they are spread over a wide
range (from aquafeed to biotherapeutics). They are also spread over 10 States in India, though there is a
higher concentration in southern and western states.
Manpower involved in the biotech industry has increased over the years. But still there is widespread
dissatisfaction about the quality of manpower available to the industry in India.
Biotech Market in India
World market for biotech products is more than $100 billion and this is expected to grow to $170 billion by
the year 2005. India’s share in global biotech market is just 2%. The market for biotech products in India has
increased five-fold from its size in 1997 and is at present valued at $2.5 billion
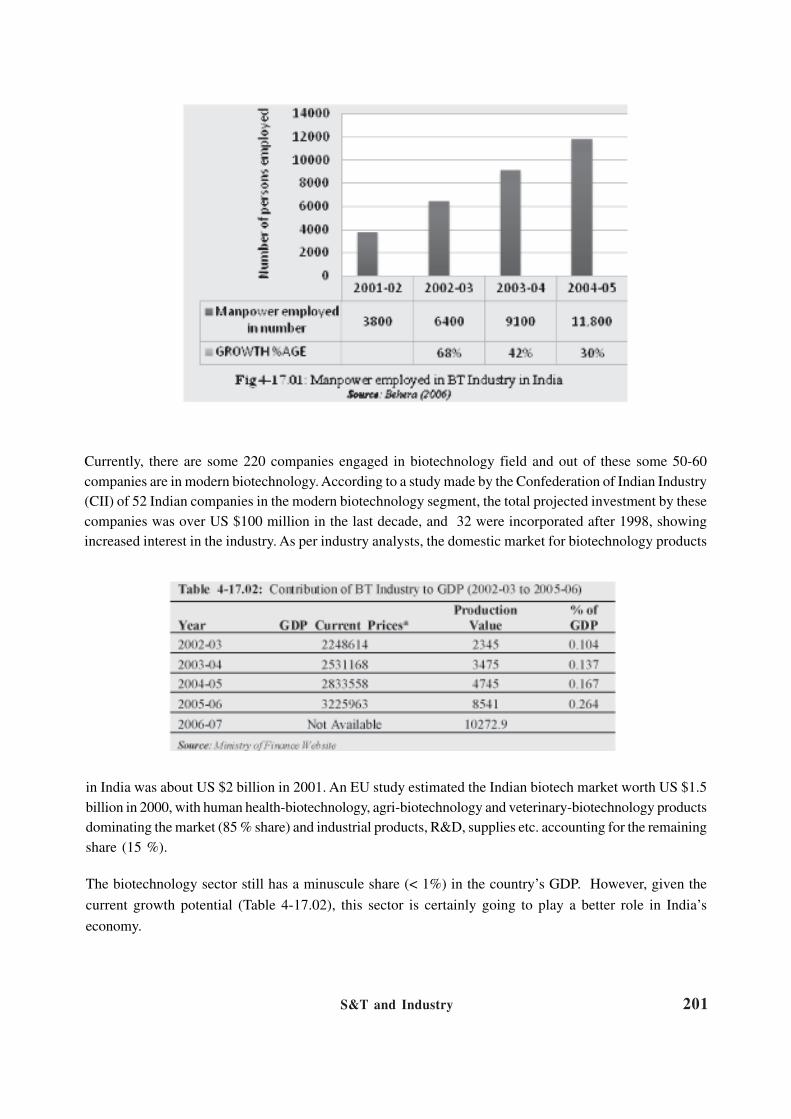
S&T and Industry 201
Currently, there are some 220 companies engaged in biotechnology field and out of these some 50-60
companies are in modern biotechnology. According to a study made by the Confederation of Indian Industry
(CII) of 52 Indian companies in the modern biotechnology segment, the total projected investment by these
companies was over US $100 million in the last decade, and 32 were incorporated after 1998, showing
increased interest in the industry. As per industry analysts, the domestic market for biotechnology products
in India was about US $2 billion in 2001. An EU study estimated the Indian biotech market worth US $1.5
billion in 2000, with human health-biotechnology, agri-biotechnology and veterinary-biotechnology products
dominating the market (85 % share) and industrial products, R&D, supplies etc. accounting for the remaining
share (15 %).
The biotechnology sector still has a minuscule share (< 1%) in the country’s GDP. However, given the
current growth potential (Table 4-17.02), this sector is certainly going to play a better role in India’s
economy.

S&T and Industry202
Presently, foreign trade data for biotech products is not available separately (it is clubbed with the related
areas, e.g. pharma products, seeds). The import and export data for pharmaceutical products (ITC/HS
Chapter 30) and seed-sowing (ITC/HS Code 1209) are briefly mentioned below in Table 4-17.03:
The industry analysts have projected the consumption of biotech products in India at a level of US $4.27
billion by 2010, with sub-sector forecast for human and animal healthcare products ~ US $1.7 billion; agriculture
products including seeds ~ US $1.4 billion; industrial products ~ US $978 million; and other products ~ US
$145 million approximately. India is expected to have a market share of about 8% in the world market for
biotech products by 2010. Importantly, the market segment for modern biotechnology products and services,
i.e. products involving recombinant processes, is rather small at the moment, but this segment is expected to
grow at a comparatively higher average annual rate of 35-40%. The Indian government has already granted
marketing licenses for about 25 recombinant protein therapeutics. The present market for diagnostic/vaccines
is valued at US $200 to US $500 million (depending upon how a biotech product is defined). Currently, 50%
of diagnostic products in India are imported, and as the healthcare market is expanding, there is a big
potential to be tapped by foreign companies. In the agriculture segment, India, being one of the largest food
producers, offers a huge market for agri-biotechnology products. Indian scientists have traditionally been
introducing hybrid seeds using tissue culture techniques. However, the genetically engineered seed market is
very small at the moment, worth an estimated $2.5 million out of a total seed market (worth US $450-500
million), but is expected to expand once controversies over GM products settle down. Furthermore, there
are good market/R&D prospects for bio-pesticides and bio-fertilizers, bio-remediation products/processes,
bio-fuels, bio-indicators, and bio-sensors.
Performance of Biotech Industry in India
The performance of the industry at the level of the economy can be evaluated in terms of – contribution to
GDP, export, quantum of sales etc. It could also be evaluated at the level of technology in terms of –
capability to innovate, nurture innovation and compete locally and globally through introduction of
products.
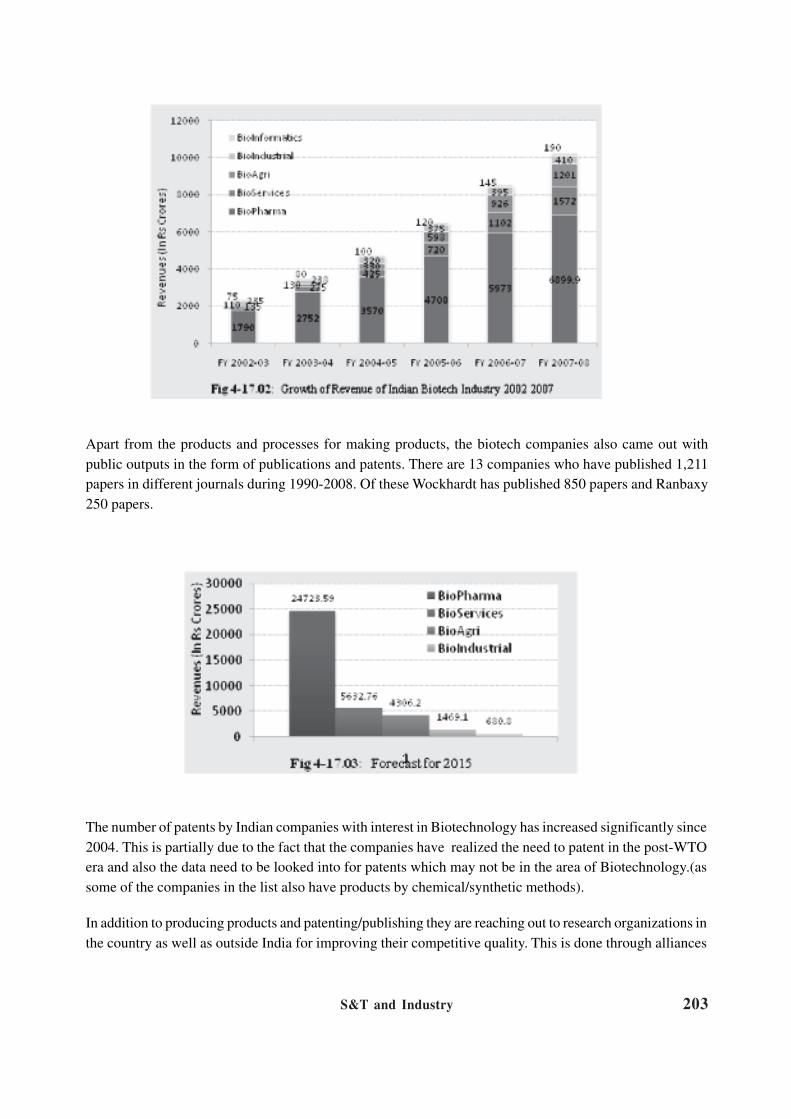
S&T and Industry 203
Apart from the products and processes for making products, the biotech companies also came out with
public outputs in the form of publications and patents. There are 13 companies who have published 1,211
papers in different journals during 1990-2008. Of these Wockhardt has published 850 papers and Ranbaxy
250 papers.
The number of patents by Indian companies with interest in Biotechnology has increased significantly since
2004. This is partially due to the fact that the companies have realized the need to patent in the post-WTO
era and also the data need to be looked into for patents which may not be in the area of Biotechnology.(as
some of the companies in the list also have products by chemical/synthetic methods).
In addition to producing products and patenting/publishing they are reaching out to research organizations in
the country as well as outside India for improving their competitive quality. This is done through alliances

S&T and Industry204

S&T and Industry 205
and also through patenting in other countries where they believe they have markets. Some of the major
players in this respect are Dr. Reddy’s, Ranbaxy, Wockhardt and Panacea Biotech. Major collaborating
companies with Indian public research system have been Cadila, Bharat Biotech, Biological E and Shantha
Biotechnics.

S&T and Industry206
Apart from their activities in production, marketing and collaboration, the biotech industry in India also
engages actively in participation in shaping policies for development of Biotechnology. They had been
associated with resource allocation and prioritization by taking part in committees and task forces for these
purposes. Through the Association of Biotech Led Enterprises (ABLE), they have been able to communicate
the problems faced by the industry and have helped in the formulation of the new Biotechnology Policy. The
industry’s influence has led to the formation of new financing mechanisms like SBIRI and a new single
window regulatory body NBRA. Their active involvement has led to the coming up with a type of Bayh Dole
Act for India. Their vocal expression of the quality of the manpower developed has been taken seriously and
made as one of the priority items in the new Biotechnology Policy.
Pharmaceutical IndustryPharmaceutical IndustryPharmaceutical IndustryPharmaceutical IndustryPharmaceutical Industry
Indian pharmaceuticals industry (IPI) is one of the largest and most advanced among the developing countries.
It has over the years made significant progress in infrastructure development, technological capability and
hence produced a wide range of products. The industry now produces bulk drugs under all major therapeutic
groups. It has a sizable technically skilled manpower with prowess in process development and downstream
processing. With a capital investment of about Rs. 2,150 crores it produced bulk drugs of value of Rs. 3,777
crores and formulations worth Rs. 15,860 crores in 1999-2000. It is estimated that the figures for the above
could rise up to Rs. 4,344 and 17,843 crores respectively. The balance of trade in the pharma sector, which
was Rs. 16.05 crores in 1960-61 and Rs. 650.6 crores in 1990-91, has grown to an imposing Rs. 5129.0
crores. There is an increasing interest and investments in R&D. Bulk drugs have grown at a rate of
approximately 15%, formulations by 20% in the nineties. It provides employment for over 28,00,0000 persons
both directly and indirectly (employment in ancillary industries and distribution trade). The industry is highly
fragmented. It has about 250 large units and around 2,500 small units in operation. At present 70% of the
requirement of the country in bulk drugs and all the demands for formulations are met by the domestic
industry.
Structure
Data from CMIE on 597 listed companies were found and after deleting companies in Ayurvedic medicines
591 companies remained. A total of 46 companies (7.78%), of the 591 listed companies, are foreign companies
and 200 companies have gone through some type of merger and acquisition activity in the past 12 years.
FDI inflow in the pharmaceutical sector for the years 1991-2008 exhibit a significant decrease in number of
financial cases since 2004 and a similar drop in technical cases from 1999.
Performance
Both imports and exports grew at a significant rate over the past 7 years.

S&T and Industry 207
Figure 4-18.03 gives the market share of Indian and foreign companies from 1999 to 2003. It clearly shows
that the market share of Indian companies has risen in this period.

S&T and Industry208
We find that there has also been an increase in both Annual Sales and Annual R&D Expenditure. R&D
Intensity (RDI) is defined as the ratio of expenditures by a firm on research and development to the firm’s
sales and the exhibit presents the poor average states of affairs for 64 companies.
Out of these 64 companies, 10 are foreign companies, 53 are private Indian companies while one is a joint
state and private venture. A comparison shows that the average turnover of the 10 foreign companies is
slightly more than that of the 53 Indian companies (Fig 4-18.06). However, when we compare Annual R&D
Expenditure (Fig 4-18.07) and RDI (Fig 4-18.08), we find that there is a significant gap between the R&D
inclination of Indian and foreign companies. The average RDE and RDI values for the Indian companies are
higher than those of the foreign companies.
Table 4-18.01 gives figures for the royalty paid by pharmaceutical companies from 2003-2007. Although the
number of companies paying royalty has decreased slightly in 2007 when compared to 2003, there are still
many companies who are acquiring and absorbing new technologies to compete in the global marketplace.
This decrease could possibly be due to the increasing amount of money spent on in-house research facilities.
The patent data has been collected for these 591 companies from Ekaswa C, a database of the Patent
Facilitating Centre (http://www.indianpatents.org.in/db/db.htm). The foreign MNC’s whose patents have
only come from their parent company, and none from Indian subsidiaries, have been placed in the zero
patents category (Table 4-18.02).

S&T and Industry 209

S&T and Industry210
Structure and Performance of Small and MediumStructure and Performance of Small and MediumStructure and Performance of Small and MediumStructure and Performance of Small and MediumStructure and Performance of Small and Medium
Scale Pharmaceutical FirmsScale Pharmaceutical FirmsScale Pharmaceutical FirmsScale Pharmaceutical FirmsScale Pharmaceutical Firms
The pharmaceutical SME sector is a fragmented and heterogeneous sector, with firms having very varied
levels of technological capability and expertise. The upper cut-off value of plant and machinery for
pharmaceutical SSIs has been gradually increased from Rs 1million in 1975-76 to Rs. 2 million in 1980-81,
then to Rs 10 million in 1999-00 and finally to Rs 50 million in 2003.
Brief Profile
Total strength: Around 6470 units, comprising both registered and unregistered units. Accurate and recent post-
patent regime estimates not available.
Type of Units: Mostly bulk drug units, formulation units and units producing intermediates.
Therapeutic Expertise: Majority of the small firms produce anti-infectives, anti-bacterials, nutritional supplements
and anti-inflammatory drugs. A few medium scale firms manufacture some specialized drugs.
Contribution to total pharmaceutical production: 42% of total .Geographical concentration: Maharashtra, Gujarat,
Andhra Pradesh & U.P.
Technological activities: Manufacture of generic fixed dose combinations and conventional dosage forms
(formulation units). Process related activities related to generic drugs by small processes and new processes by
some medium scale firms (bulk drug units).
Quality certification: Local GMP until Schedule M was introduced in 2001. Deadline later extended to June 2005.
Significant percentage of the units has been unable to comply with new Schedule M requirements and up-
gradation as yet. Najma Heptullah Subordinate Committee report on issues related to Schedule M compliance
tabled in Parliament recently.
Post-patent regime strategies: Contract manufacturing of generics for the organized sector, mostly in the form of
sub-contracting and loan-licensing activities.
Problems faced by sector: Gradual reduction of list of drugs under DPCO, inability to generate investments for
Schedule M requirements and automation, paucity of skilled labour, lack of consistency and standardization in
drug quality requirements, imitation not feasible under new patent regime, under-utilization of plant capacity, lack
of adequate information about the new patent regime and its consequences .
Strengths: Provides life saving drugs at affordable prices, particularly in rural India.
Initiatives by the government: Development of clusters through involvement of industry associations, interest
subsidy and provision of soft loans for technological up-gradation through PTUF scheme, providing technical
and marketing related skills, proposal to build common quality control and testing facilities for small firms.
Source: Planning Commission report 2006; ASI database; MSME database, Third Census

S&T and Industry 211
New Initiatives for SMEs
• Development of Pharmaceutical SEZs which facilitates the availability of infrastructure, market access,
boosts capacity utilization, encourages exports and facilitates excise relief
• The National Pharmaceutical Policy 2006, has included some initiatives like reduction in excise duty
from 16% to 8%, enhancing the exemption limit for excise duty from Rs.10 million to 50 million and
setting up of a dedicated research fund, Pharma Technology Up-gradation Fund (PTUF), for providing
interest subsidy on borrowings to SMEs towards building necessary infrastructure for standardization
of their products.

S&T and Industry212
• The Najma Heptullah Subordinate Committee on Schedule M has recommended the adoption of clear
guidelines on Schedule M related up-gradation of firms. The Committee has recommended some
flexibility with respect to space stipulations and air handling units and has noted that 80% of the
Schedule M norms required change in mindset of technical persons and good practices and only 20%
of the norms required change in infrastructure facilities, which entailed some financial investment. The
Committee also referred to the proposal initiated by the Department of Chemicals and Fertilizers,
pending approval by the Planning Commission, which would provide a 5% interest subsidy on an
amount up to Rs 1 Crore. The Committee also recommended the promotion of Credit Linked Capital
Subsidy Scheme (CLCSS) and Credit Guarantee Fund Scheme, rationalization of fiscal incentives and
stated that it was in the process of gathering statistics pertaining to Schedule M up-gradation and
related closure of small pharmaceutical firms.
• Establishing formal linkages between Pharma SMEs and pharmaceutical research and educational
institutions for technical up-gradation and know-how related to R&D, and auditing and monitoring of
quality control. The government has initiated a step in this direction through the efforts of National
Institute of Pharmaceutical Education and Research (NIPER) and through the building of a specimen
Schedule M unit and utilizing the efforts of the institute to act as an intermediary organization in
providing technical support and training under the new regulatory regime.
Regulatory Issues in the IndianRegulatory Issues in the IndianRegulatory Issues in the IndianRegulatory Issues in the IndianRegulatory Issues in the Indian
Pharmaceutical IndustryPharmaceutical IndustryPharmaceutical IndustryPharmaceutical IndustryPharmaceutical Industry
This section undertakes a review and assessment of regulatory issues in the Indian pharmaceutical industry.
Understanding the current regulatory scenario in this sector is extremely crucial in the context of the rapid
and ongoing changes at the global level, largely with reference to good manufacturing practices (GMP),
good clinical practices (GCP) and good laboratory practices (GLP) and also due to the onus on the Indian
regulatory bodies to ensure the production and marketing of safe and efficacious drugs at affordable prices
in the domestic sphere and to sustain current growth prospects in the global markets.
Temporal Progression of Drug Policies and Acts
The Patents Act of 1970, Drug Price Control Order 1970, Foreign Exchange Regulation Act 1973 & New
Drug Policy, 1978 helped in the building of indigenous capability and availability of quality drugs at low
prices. DPCO 1987 heralded increasing liberalization and reduction of the number of drugs under price
control to 143. DPCO 1995 focused on regulation of monopoly, decreased the number of drugs under price
control to 74 and led to the inclusion of products manufactured by small scale producers under price control
list.
In 1997, the National Pharmaceutical Pricing Authority was constituted in order to administer DPCO and
deal with issues related to price revision. The Pharmaceutical Policy 2002 carried forward earlier governmental

S&T and Industry 213
initiatives in terms of ensuring
quality drugs at reasonable prices,
strengthening of indigenous
capability for cost-effective
production, reducing trade barriers
and providing active
encouragement to in-house R&D
efforts of domestic firms. In 2003,
the Mashelkar Committee
undertook a comprehensive
examination of the problem of
spurious and sub-standard drugs
in the country and recommended
a series of stringent measures at
central and state levels. The
regulatory body came in for
censure with the committee noting
that there were only 17 quality-
testing laboratories, of which only
seven laboratories were fully
functional. The National
Pharmaceuticals Policy 2006,
among other initiatives, has
proposed a slew of measures such
as increasing the number of bulk
drugs under regulation from 74 to
354, regulating trade margins and
instituting a new framework for
drug price negotiations in a move
to make drugs more affordable for
the Indian masses.
Patents and Data Protection related Issues
The Indian Patent Act, 1970 was amended through the Patents Amendment Act (2005). A technical expert
group was constituted under the chairmanship of Dr. R. A. Mashelkar, the then Director General of the
CSIR. The Mashelkar Committee decision was that it would be TRIPS incompatible to limit the grant of the
patent for pharmaceutical substance to new chemical entity or new medical entity involving one or more
inventive steps and also that it would not be TRIPS compatible to exclude microorganisms from patenting.
The committee opposed the granting of frivolous patents and ever-greening and recommended the formulation
of detailed guidelines to ensure that only those patents proving ‘substantial human intervention’ and ‘utility’
were granted. As per the provisions of Article 39(3) of the TRIPS Agreement, member countries are obliged
to provide protection to regulatory data submitted for receiving market approval of pharmaceutical products
Fig 4-20.01: Regulation in Indian Pharmaceutical sector
Major Pharmaceutical Policies
Drug Policy 1986
Pharmaceutical Policy 2002
National Pharmaceuticals Policy 2006
Quality
Control
IPR Price
Control
On Prices On Margin
Bulk drugs Formulations
GMP
Issues Amended
Patent
Laws
Governing
Policies
Drugs &
Cosmetics Act 1940
Schedule M
Essential
Commodities Act,
1955
DPCO 1995
Patent Act 1970
Product Patent 2005

S&T and Industry214
under specific circumstances. The Government of India constituted an expert committee under the
chairmanship of Mr Satwant Reddy to formulate adequate steps to deal with the issue of data protection.
The Reddy Committee report, brought out in 2007, stated that in the context of pharmaceuticals, the present
legal regime was not adequate to address the issues relating to data protection with respect to Article 39 (3)
provisions. It also called for more clear and stringent mechanisms within the Drugs and Cosmetics Act to
ensure that undisclosed test data was not put to unfair commercial use in India.
Drug Pricing
Price control on medicines was first introduced in India in 1962 and has subsequently persisted through the
Drug Price Control Order (DPCO). As per the directive of NPPA, the criterion for price regulation is based
on the nature of the drug in terms of whether it has mass consumption and in terms of absence of sufficient
competition for the drug. The year 1978 witnessed selective price controls based on disease burden and
prevalence. The list of prices under DPCO subsequently witnessed a gradual decrease over a period of
time. Around 80% of the market, with 342 drugs, was under price control in 1979. The number of drugs
under DPCO decreased from 142 drugs in 1987 to 74 in 1995. Drugs with high sales and a market share of
more than 50% are targeted for price regulation. These drugs are referred to as scheduled drugs. The
NPPA also regulates the prices of bulk drugs. The MRP excise on medicines was levied by the Finance
Ministry in 2005. The objective was to increase revenue and lower prices of medicines by using fiscal
deterrent on MRP. This change may have had some impact in terms of magnifying the advantage to industries
located in the excise free zones. This also succeeded in attracting some small pharmaceutical firms to these
zones. As the report by NIPER, submitted to the Ministry of Chemicals and Fertilizers in 2007 points out, this
may have led to tax disparities among firms located in tax exempt zones and tax non exempt areas. This has
also led to small firms in non-exempt areas requesting for tax subsidies from the government. For drugs not
under price control, firms can set the Minimum Retail Price (MRP). The NPPA only intervenes in cases

S&T and Industry 215
where drugs have significant sales and where the annual price increases by 10%. This is a recent development,
which came into effect in 2007, as in the past the NPPA would intervene only if the annual price increases
were more than 20%. This development indicates the heightened sensitivity of the government towards
consumer access to medicines at reasonable prices and keeping a check on profit mongering by the industry.
Good Manufacturing Practices (GMP)
• Constitute an international set of guidelines for the manufacture of drugs and medical devices. GMP
protocols are being followed in over 100 countries either in the form of regulations (Japan, Korea &
U.S.), or Directives (EU) or Guides (UK).
• Objective is to minimize risks with regard to manufacturing, packaging, testing, labelling, distributing
and importing of drugs, cosmetics, medical devices, blood and blood products.
• Protocols concerned with parameters such as drug quality, safety, efficacy and potency.
• WHO GMP protocols instituted in 1975. India is one of the signatories to the certification scheme. The
certificate, which has a two-year validity may be granted both by central and state drug authorities in
India after inspection of premises.
International Regulatory Certification
• A large number of domestic players are seeking international regulatory approval from agencies like
US-FDA, MHRA-UK, TGA-Australia & MCC-South Africa in order to export their products, mostly
generics, in these markets.
• India has the distinction of having the largest number of US-FDA approved manufacturing units, totaling
100, outside of the United States.
• Around 814 manufacturing units in India have WHO-GMP certification. Most of these units are
concentrated in the states of Gujarat (307), Maharashtra (136), Andhra Pradesh (138) and Karnataka
(52). WHO GMP certification is essential in order to compete for exports to CIS countries and other
Asian markets.
Recent Trends
Clinical Trials to establish the safety and efficacy of drugs constitute nearly 70% of research and development
costs. The clinical market in India is expected to grow at a consistent rate of 20-25 %. The recent regulatory
revisions in the pharmaceutical industry and stricter patent laws have made it easier to conduct trials, making
it the fourth largest market in terms of volume. India’s clinical development sector has witnessed a tremendous
growth in recent times. In 2005, the revenues from contract R&D for international sponsors totalled $100
million and the sector enjoys an annual growth rate of about 40 per cent. Several global Contract Research
Organizations (CROs) have entered the Indian market in the last few years. Some of these have also
entered into alliances with local CROs. In 2005, Drugs Technical Advisory Board (DTAB) made GLP
practices mandatory for all laboratories and in-house units of pharmaceutical firms and CROs. In 2007,

S&T and Industry216
norms pertaining to the Phase lag have also been revised and Schedule Y now permits Phase I trials to be
carried out concurrently in India along with the rest of the world. For an efficient and ethical growth of the
clinical trials industry, the appropriate mechanisms to be adopted include the presence of a strong centralized
regulatory regime to effectively monitor GCP guidelines and ensure transparency in the functioning of
Institutional Ethics Committees (IECs).
Limitations of the Present Regulatory Regime
• Proliferation of spurious and substandard drugs in the Indian market.
• Dual licensing mechanism acts as a deterrent to uniform implementation of regulatory procedures.
• Lack of transparency in licensing procedures.
• Inadequate regulatory expertise and testing facilities to implement uniform standards.
• Need for greater thrust on institutional support to small scale firms to enable speedy implementation of
Schedule M up-gradation and standardization of drug quality.
• Need for greater clarity on patentability of pharmaceutical substances and conditions under which
firms can apply for compulsory licenses to prevent legal battles between local firms, MNCs and civil
rights groups.
• Need for greater coordination and transparency among different ministries concerned with drug
regulation.
New Initiatives
• Integrated regulatory system through the constitution of a National Drug Authority so that quality
regulation is performed by a centralized body.

S&T and Industry 217
• Establishment of pharmaco vigilance centres at national, zonal and regional levels to monitor adverse
drug reactions.
• Move to bring nearly 374 bulk drugs under price control and regulate trade margins.
• Capability strengthening to monitor clinical trials, including the setting up of the Clinical Trials Registry
of India (CTRI).
Indian Herbal sectorIndian Herbal sectorIndian Herbal sectorIndian Herbal sectorIndian Herbal sector
India perhaps has the world’s oldest as well as largest
tradition of traditional systems of medicine. The term Indian
Systems of Medicine covers both the systems which
originated in India as well as outside but got adopted in India
in course of time. These systems are Ayurveda, Siddha,
Unani, Homoeopathy, Yoga and Naturopathy. They have
become a part of the culture and traditions of India. India
with its strong base in traditional knowledge on herbal
medicine and vast plant biodiversity has a great potential in
this sector.
Infrastructure
The health services provided by this network largely focus on primary health care. The sector has a marginal
presence in secondary and tertiary health care.
1 crore to 5 crore

S&T and Industry218
Industry
The recent upsurge in use of herbal medicines has led to a sudden increase in herbal manufacturing units. In
India, there are about 14 well-recognized and 86 medium scale manufacturers of herbal drugs. Other than
this about 8,000 licensed small manufacturers are on record. In addition, thousands of Vaidyas also have
their own miniature manufacturing facilities. The estimated current annual production of herbal drug is
around Rs. 3,500 crores.
Whereas, the largest number of such manufacturing units are registered as ‘pharmaceuticals’, there are
others that are engaged in making plant based cosmetics and food supplements. Even within the pharmaceutical
units, there are manufacturers of Ayurveda, Siddha, Unani and Homeopathic formulations (Fig.4-21.01)
with a few even making western medicines. Another group of manufacturing unit are engaged in making
extracts and distilling oils for use by other industries and for exports.
Government Stand
Ayurveda, Unani, Siddha, Naturopathy, Homeopathy and Yoga are all recognized by the Government of
India. The first step in granting this recognition was the creation of the Central Council of Indian Medicine
Act of 1970 while the Central Council of Homeopathy was constituted in 1973.
A separate Department was constituted in November 2003, named as Department of Ayurveda, Yoga and
Naturopathy, Unani, Siddha and Homoeopathy (AYUSH).
To ensure and enhance the quality of ASU medicines, the Government of India has notified Good Manufacturing
Practices (GMP) under Schedule ‘T’ of the Drugs and Cosmetics Act 1940.
IPR Issues
The Legal protection accorded to traditional knowledge in India is through its:
• Patent laws with the Amendment Act of 2005, which contain provisions for mandatory disclosure of
source and geographical origin of the biological material used in the invention while applying for patents
and also allow the composition of a drug to be patented.
• The Indian Biodiversity Act 2002, which follows the Convention of Biological Diversity guidelines
regarding benefit sharing.
• India has established a central authority “National Biodiversity Authority” to monitor and control foreign
access to Indian biological resources including traditional medicine.
• Development of a database called “Traditional Knowledge Digital Library” (TKDL) that will document
as well as establish the prior art to hinder patenting Indian knowledge. This task has been entrusted to
NISCAIR, a CSIR laboratory.
Loss to the country
The rich heritage of traditional systems of medicine and vast repository of natural resources put India at a
prominent position in global scenario of herbal sector. But to revitalize these traditions, the route employed is

S&T and Industry 219
being considered as erratic. Medicines produced in large scales are generally being compromised on their
quality resulting in poduction of substandard or spurious drugs. There is no due to absence of strict regulation
way to keep a rein on it. This has projected indigenous medicines in a bad repute. The concept of Vaidyas
prescribing and formulating medicines according to the need of an individual has been replaced by University
educated doctors prescribing OTC medicines. The holistic and individualistic approach, one of the keystones
of the systems is now critics aver, antiquated. The traditional lineage of Vaidyas/Hakeems is being lost. So,
at present there is a need to revive the systems along the lines of prevalent traditions and promote the usage
of herbal medicnes otherwise our heritage will be lost, resulting in a great loss to the country.
Human VHuman VHuman VHuman VHuman Vaccine Science and Taccine Science and Taccine Science and Taccine Science and Taccine Science and Tececececechnologyhnologyhnologyhnologyhnology
SSSSStttttatus in Indiaatus in Indiaatus in Indiaatus in Indiaatus in India
India was one among leaders, when vaccine research began to gain importance in the rest of the World and
India continues to retain so even today despite some lag periods during I & II world wars and the subsequent
period till 1970s. Several dedicated vaccine R&D institutions were set up during 1950-80s with the help of
Rockefeller Foundation, United Nations Children Fund (UNICEF) etc. The real emphasis on vaccine
research was initiated and promoted by the Department of Biotechnology (DBT) that was set up in 1986.
In fact, DBT’s initiative provided tremendous boost to vaccine research and development (R&D) in this
country.
Vaccine R&D Status in India
There are around 26 vaccine R&D institutions in India that are actively engaged in research and development
of vaccines, 2 institutes under DBT (came up in the late 1980), 11 under Indian Council of Medical Research
(came up between 1950 - 1990), 6 under Council of Scientific and Industrial Research, and others include
university departments and other autonomous institutions like All India Institute of Medical Sciences (New
Delhi), Indian Institute of Science (Bangalore) etc. (Fig 4-22.01). Some of the vaccine R&D organizations
such as Central Research Institute (Kasauli), Haffkine Institute (Mumbai), King Institute of Preventive
Medicine (Chennai) and Pasteur Institute of India (Coonoor) are century old institutes that came up during
British India, whose institutional structures are based on the innovation model where R&D and production
exist under the same roof. This was basically to facilitate and conduct research that would lead to vaccine
development against particular disease and transfer of technology to the production division. This model
facilitated better and faster coordination between R&D and production division; for scaling up technology
and other improvements and technological up-gradation. The research institutions that were set up after
independence are only dedicated to research and development of vaccines.
Vaccine R&D Efforts
The genetically engineered vaccines against HIV/AIDS, cholera, leprosy, malaria and TB (mycobacterium
habana) were developed from indigenous strains and reached various stages of clinical trials. Basic research

S&T and Industry220
and development efforts are for developing candidate molecules against HPV, rotavirus, edible cholera
vaccine (edible, subunit), anti-rabies (tissue culture based), improved BCG vaccine, filarial, dengue, JE
(tissue culture based, chimeric peptide), typhoid, HIV, filarial (recombinant), Pneumococcal (thermostable)
and Hepatitis E (vaccine like particles). Out of these few, the rotavirus vaccine, HIV/AIDs type C and
malaria candidate vaccines have been developed under Indo-US bilateral programme called Indo-US Vaccine
action Programme (Indo-US VAP), which was initiated in 1987 between India and US. Around 35 collaborative
research projects have been funded so far to develop vaccines and diagnostics.
Highlights of Indian Vaccine R&D Achievements
Institutions like National Institute of Virology (Pune), National Institute of Immunology (Delhi), All India
Institute of Medical Sciences (Delhi) are actively engaged in identifying and developing several vaccine
candidate molecules which are at different stages of development.
• So far 10 institutions have developed around 12 vaccine candidate molecules and transferred the
technology to industry.
• Anti-leprosy vaccine (immuvac) developed by National Institute of Immunology (NII) has been
transferred to Cadila Ltd., Ahmadabad and the technology has been commercialised.

S&T and Industry 221
• The collaborative effort of three institutions namely Institute of Microbial Technology (IMTECH),
Chandigarh, National Institute of Cholera and Enteric Diseases (NICED), Kolkata and Indian Institute
of Chemical Biology (IICB), Kolkata led to the development of a indigenous recombinant cholera
vaccine which is currently undergoing phase II clinical trials. The technology has been transferred to
Shantha Biotech Ltd., Hyderabad.
• Indian Immunologicals Ltd. (IIL) Hyderabad, a public sector company developed human anti-rabies
vaccine indigenously and launched in the market in 2002.
• National Institute of Immunology (Delhi), developed a tissue culture based JE vaccine and
National Institute of Virology (Pune), developed a synthetic peptide vaccine against Japanese
encephalitis.
• International Centre for Genetic Engineering and Biology, Delhi is actively engaged in malaria vaccine
research and the candidate vaccine molecules against P.vivax and P. falciparum are undergoing trials
now. The technology has been transferred to Bharat Biotech International Ltd., Hyderabad.
• Several indigenous technologies like hepatitis B, typhoid, anti-rabies, DTP-HB, DTP-HB-Hib, mOPV
type1, leprosy, hepatitis A have been commercialized during the last decade. Prominent Indian companies
that have commercialized indigenous vaccine technologies are Shantha Biotech Ltd, Bharat Biotech
International Ltd (BBIL), Panacea Biotech, Cadila Pharaceutical Ltd., USV Biopharmaceuticals and
Indian Immunologicals Ltd., a public sector company.
KnoKnoKnoKnoKnowwwwwledgledgledgledgledge Capability and Capacity ine Capability and Capacity ine Capability and Capacity ine Capability and Capacity ine Capability and Capacity in
Biomedical fieldBiomedical fieldBiomedical fieldBiomedical fieldBiomedical field
Generation of knowledge, capability and the capacity of a country in the biomedical area are largely determined
by the complex structures and institutions of the biomedical market involving the interplay of drugs, the
medical devices and the physicians. Contests among these three institutions define the current endowment
of resources, flow as well as the allocation of future resources, formation of coveted assets, capabilities and
capacities.
Resources are distributed over several markets, governed by distinct and different sets of rules, where
multiple institutions compete between them for getting access to as also in engendering greater resources.
Contests between institutions result in movement of resources across boundaries of institutions implying that
the circuit of governance reaches beyond the inside of the organisation to the domain where a firm/organization
competes for negotiating power.

S&T and Industry222
Contests between drugs, devices and the physicians take place through sets of institutionalised practices/
rules. These are broadly: the clinical observational and interactive practices undertaken by the physician
(often in hospital); next is the theory-driven and theory-building open and not-for-profit knowledge practices
of the university; and the third is the closed-door, for-profit organized science-research often controlled by
the pharmaceutical firms. The devices research while in practice shares the same institution with the drug
firms, in market these are fiercely competing for the grab and they compete to define different sets of
practices for the patient. Institution of devices maps a body differently from the mapping enforced by the
drug firm. Institutional contests for domination refer to the power to: define agenda; influence and shape
practices; therefore decide definition of what constitutes an asset and, ultimately induce flow of most of
funds and other resources to a particular institution.
The fact that an average physician in India examines very large number of patients afflicted with multiple
diseases provides the doctors with extremely rich repertoire of clinical knowledge. Further, genetic diversity
in India is perhaps the highest in the world. Doctors thus possess the richest source of knowledge for
advancing innovations in biomedical areas. However, research systems of development of drugs and clinical
healing practices, the two institutions, share very little complementary knowledge and experiences, and the
sharing between devices and clinical practices is perhaps nil.
Most business firms and public R&D as well as University R&D in drugs and pharmaceuticals have therefore
developed upon the relatively cheaper and surer chemical routes as the country has more advanced
biochemistry knowledge compared to biology knowledge. The business of drugs received a fillip with the
opening up of the market for generics in the USA as well as from the parallel growth of the domestic market.
Firms could take up manufacturing generics and later even discovering new molecules of drugs with the
assistance from the public R&D. Production, mostly of old and off-patent formulations, has increased rapidly
– within two decades since 1980 it increased by more than 100 times in value terms. Because of cheaper
costs exports grew and since the end of 1980s the country has remained net exporter. By 2003, there was
400 bulk drugs manufacturer with output valued at Rs. 78 billion. In generics or formulations there are
60,000 items spread over 60 therapeutic categories and total export has crossed Rs. 141 billion by 2003.
However, following WTO and TRIPS and changes in business strategy of very large global drug firms of
taking generics into fold over the last few years together have forced domestic drug firms and domestic
R&D systems rethinking on the sustainability of the previous research as well as business strategy.
A large number of pharmaceutical firms are small or medium, most often unlisted and the total of firms is
about 10,000 out of which only about 300 are in the listed organized category. A large number of these listed
firms have US FDA approved GMP certificates; a few have the WHO certified GMP. By 2003, number of
Drug Master Files (DMF) filed with US FDA was 126. With industry-total of R&D expenditure at Rs. 6.6
billion by 2002-03 with industry turnover of Rs 226 billion, only a handful of firms could claim around 2003
spending about 6% of sales turnover on R&D with the rest spending below 2%. Few domestic firms have
been developing new molecules for new discovery drugs. Currently, more than 10 molecules are under
various stages of development.
A typical discovery process passes through several stages spreading beyond 10 years in general and the cost
particularly in different phases of clinical trials is very large therefore, unaffordable to the domestic drug
firms. As a result, in all cases of new molecules, local firms have entered into alliances with large global

S&T and Industry 223
firms. Several other firms have entered the new fields of contract research and contract manufacturing.
Large part of the former is devoted to the undertaking of clinical trials, a field that has recently opened up
and is currently experiencing high growth. However, in most cases these two types have left out the very
large and distributed knowledge base with the doctors, the real repositories of ground data.
Journals rarely reach a doctor. Evidence based practices are most often unknown. There is no regulation or
regulatory body on evidence based medicine. A doctor retains, close network linkages with her local peers
and her potential and current transactions partners. Reputation asset remains therefore highly localized.
Network-routed information sends signals to a practitioner on practices including surgical methods, on local
epidemiological trends, on the local portfolio of drugs and devices and similar others. The important asset
with this doctor is her knowledge of the local bodies and her knowledge of how to investigate a local body.
The worlds of organized research and that of the University are very far from the world of clinical practice
in India.
However, networks between major Indian research centres/Universities and the Indian organized public and
private research on the one hand and the global majors on the other hand, are very active. The Indian
counterparts often become a partner in the global program somewhat as a laggard and as a supplier of
human resources. The same are however, not true for both the institutions of distributed innovations and the
clinical practice.
Clinical practice institution in India thus has two faces - its practices are most genuine to the patient in which
the doctor and patient together heals body and at the same time the clinician informs us that little contemporary
advances reaches her. Biomedical innovation in India hence must stand on these three pillars namely, drugs,
devices and practices.
RRRRResearesearesearesearesearccccch frh frh frh frh from Hospitom Hospitom Hospitom Hospitom Hospitals: Evidenceals: Evidenceals: Evidenceals: Evidenceals: Evidence
The extent of research conducted and research capability in medical and non-medical streams have been
estimated by using a public database, PubMed MEDLINE (http://www.ncbi.nlm.nih.gov/PubMedOld/
medline.html). A comparison of research output has been made between eight countries, namely, USA,
UK, Israel, India, Singapore, Malaysia, China and Chile (for the period 1995-2007). The overwhelming
dominance of USA can be appreciated from the fact that six years output of USA when compared to the
total output of seven countries for eleven years, the former alone retains a share of 69.8%, followed by UK
with 17.7%, Israel with 4%, China 3.8%, India 3.1%, Singapore 0.7%, Chile 0.6% and Malaysia 0.2%
(Fig. 4-23.01).
MEDLINE data covers about 10 million articles that are classified into several publication types (PT). PT
relevant for the present exercise include (i)Clinical Trial (CT): pre-planned clinical study of diagnostic,
therapeutic or prophylactic drugs, devices or techniques on humans; (ii) Randomised Controlled Trial (RCT):
clinical trial involving at least one test treatment and one control treatment and also involves randomized

S&T and Industry224
selection of administered treatment; (iii) Controlled Clinical Trial (CCT): clinical trial involving one or more
test treatments, at least one control treatment and pre-specified measure for evaluation; (iv) Multicenter
Study (MS): controlled study conducted in several cooperating organizations relating to administration of
drugs or a new procedure or devices, it thus involves PH (physician as healer)/RP (researcher as physician)
in research directed or influenced by non-medical such as pharmaceutical firm or equipment firm; (v)
Practice Guideline (PG); (vi) Clinical Conference (CC) of physicians on their observations of patient at
bedside; (vii) Review of Reported Cases (RRC) in literature on all known cases of a disease; (viii) Case
Reports (CR) on patient cases, this group of research refers to dominant role of physician as researcher,
and the RP relates directly to the patient as a healer and much less as a provider of certain drug or technique
or device.
It may be seen in Table 4-23.01 that the first group of research consisting of CT, RCT, CCT and MS where
physician acts more as provider of clinical services, globally has grown faster than the second group consisting
of PG, CC, RRC and CR where physician acts more as healer-researcher. It is apparent from the table that
PH is increasingly becoming a RP; and RP is increasing the Mode-2 type of research with physician as the
key to research while possibly, and may be equally significantly, systemic pressures are increasing on
physician to cooperate often as the second fiddle on research agenda set by non-medical business interest.
Cross country comparison of publications (Table 4-23.02) reveals that while the relative distribution of
publications from a country over four types in the first group remain similar, in both USA and China the MS,
organized by either the country bureaucracy (as in China) or by the large and powerful business interests
from pharmaceuticals or devices firms (as in the USA), occupies importance. In India MS occupies a weak
position. If we compare the relative contribution of a country in the global total of type-publication (such as
in CT) both India and China contribute less than on average 0.5%, Israel contributes about 1%, USA about
15% (however, in MS the contribution by USA is above 25%) and UK about 4%.
In the case of second group, the contribution from India and China are better compared to the contribution
from USA. Further, in both CC and RRC India’s relative contribution is higher and in fact much ahead of
China. The CR too suggests a similar strength. Moreover, in terms of share in the global total of publication,

S&T and Industry 225
USA contributes less than 10% in CR and about 10% in RRC, India is close to 1% in both. CC in particular
represents a domain of the physicians and USA shares about 30% of global reporting. Given the high shares
of CC and RRC, Indian physicians appear to enjoy higher autonomy, larger public sphere and less occupied
to serve organized health delivery. Conversely physicians here are less subjected to the institutional compulsions
to undertake clinical trials or follow guidelines suggested by non-medical systems of knowledge. Israel has
certain strangeness; it shows coexistence of both organized and directed clinical practice together with less-
organized and relatively autonomous actions by physicians. USA and UK exhibit dominance of organized
and directed physician practice, however, USA simultaneously represent the existence of spheres of autonomy.
Global Biomedical Research
Another important aspect is the emergence of voluminous data which to a large extent determine the course
of innovation and research in biomedical. USA enjoys strong dominance in this data based research; however,
some other OECD countries too are strong contenders. Research in biomedical is conducted by physicians
on patients often as part of ongoing clinical investigation or healing. A typical stand-alone investigation or
experiment can be budgeted for under R&D and can be conducted under a separate entity. However, in
order to appreciate the
extent of research in
biomedical it would be
preferable to consider
statistics not of R&D
expenditure instead it
should be output that are
published or patented.
Since the researches are
context specific, the
knowledge or publication
can hardly be
appropriated. In Mode-1,
research inferences
based on past data are
made by a physician on
another new specific
context without framing a general rule. Each Mode-1 inference therefore, generates another context-specific
data, and the field of applicability of data increases. In Mode-2, however, rule formation is the principal
objective. Past data are now made amenable to all future contexts.

S&T and Industry226
Typically, business firms from pharmaceuticals follow this latter route. This generalization generates a property
right that can be appropriated at any future space and time. Traditionally, a multinational pharmaceutical
firm alone used to look for global data. Local physicians could care little for global data because the data was
out of reach. However, with increasing digitization the reach of both group are increasing and as a result it
is necessary for us to care for global comparisons of research and data-generation.
Institutional Distribution of Biomedical KnowledgeInstitutional Distribution of Biomedical KnowledgeInstitutional Distribution of Biomedical KnowledgeInstitutional Distribution of Biomedical KnowledgeInstitutional Distribution of Biomedical Knowledge
Geographic distribution of knowledge assets compounded by the institutional distribution followed by
organizational compounding characterizes the distribution of knowledge asset in a country. Distribution of
biomedical research from the University institution of India exhibits characteristics similar to China. In
several cases of Indian Universities, such as with the Banaras Hindu University (BHU), the output is indeed
from the hospital system and is not
from the University departments.
BHU tops the list of Indian
University institution whose
contribution to the country total at
lowers than 24.8% is much smaller
than its Chinese counterpart. Second
highest contribution is from the IISc.
at Bangalore, followed by Delhi and
Punjab University, followed by in
close succession the two universities
from Kolkata, and similar others.
Regionally as well as spatially
somewhat evenly balanced research
assets in biomedical is also characterized by non-dominance of any particular university organization.
Research assets in biomedical contributed by public organized research is, however, geographically skewed.
Hospital institution contributes most to biomedical research in India; at above 51% of country total, the

S&T and Industry 227
distribution of research assets across
hospital organizations and regions is,
however, skewed. The specialty
research-based hospitals contribute a
very large proportion of research at
above 32% of country total. AIIMS
in Delhi tops the list, followed by the
PGI at Chandigarh, followed closely
as fourth the SGPGI from Lucknow.
From South a large contribution
appears from Vellore based CMC,
from the western part Mumbai based
TMH too contributes a bit. However,
from amongst these major research-intensive hospitals there are only a few from east, such as from Kolkata
the contribution is less than 2% and from Kerala in south less than 1%. The ‘others’ segment is little above
half of the country total, and to this segment belong the large number of hospitals spatially well distributed.
China has sharp coastal-geography based assets. The UK too evidenced three major asset-geographies.
Israel and Malaysia too exhibited geographic patches. India alone possibly remained most distributed. In
USA, as in China, there are two strong geographies in the Northeast (NE) and in the Southwest (SE),
although Texas evidences strong research assets. The NE is dominant.
Concentrated geography while reducing transaction costs and hastening spillovers, does make it easier for
institutions and respective affiliating organizations to compete with each other. Competing research agenda
might in lieu of becoming cumulative be non-cumulative and dissimulative. Possibly more important is that
close and intensified geography makes it easier to compete, and especially for an institution and its powerful
member organization to be in a position to effectively influence the research agenda, the research processes
and the flow of finance as well as the generation and flow of human capital to the competing institution and
its member organization. In short, geographic corporate governance appears feasible.

S&T and Industry228
For a country governor from India for example, it would be easier to monitor funding and increase output per
funding if organizations were more concentrated. Possibly more importantly, the large and diffused research
base such as in Indian hospital institution could prove a threat as well as act as deterrence to the dominant
global paradigm of organized research. With increasing manipulation of research agenda in another institution
such as in hospital or the university, the organized research would cherish enhanced organizational dominance,
such as through opening more research University or research hospitals that could suck off most of the
finances and human resources available.
RRRRRole of hospitole of hospitole of hospitole of hospitole of hospitals in rals in rals in rals in rals in researesearesearesearesearccccchhhhh
Research from hospitals or the clinical system is distinctly different from the research undertaken at University
system or at research laboratories. For instance, (1) a physician even while performing a research must
remain primarily a healer and this concern for the well being of the patient sets the core ethical guidelines
whereas a University professor or a researcher may not be guided by such a code. This difference sets in a
specific methodology of inquiry, specific goals of research and important constraints on research. (2) physician
is driven by practice while a professor would be driven more by theory or experiment; (3) research goals of
a physician cannot often be set beforehand and the goals are in general emergent, while goals are pre-
determined for a professor; (4) medical theories can be built when feasible from data, and often in lieu of
theories there would be a plethora of guidelines, rules or standards and observation while non-medical
research is least driven by data and facts and are directed to refuting or revisioning of existing theory-pieces;
(5) much of data generation and of observation is dependent upon the skill of a physician and this is so even
after healing practices been made dependent upon medical devices, and thus medical research presents a
classical locus of serendipity, however, non-medical research has increasingly removed any element of
serendipity.
per cent

S&T and Industry 229
Finally, hospital represents a system which unlike a business corporation generates and perpetuates a distinct
mode of autonomous inquiry dependent much up on serendipitous formulation of the ‘problem’ in the patient.
This research refers least to problem solving approach. Reputation plays great role in medical profession
and in its research, and much of reputation builds upon this faculty to formulate a problem that can be solved.
A physician is at the center of multiple relationships. The physician relates to the patient, to the medical
profession and to the hospital or clinic, to the pharmaceutical company and to the payment system in practice
in the country. Several parties to the relations can be ingratiated and the physician has often been accused of
opportunistic behaviour. A professor does not have many relations to be ingratiated, and scope for opportunistic
behaviour is extremely limited. Much of property rights in medical research are generated through
pharmaceutical firm initiated clinical research. These differences in economic incentives set up different
patterns and different rights to access in these two systems of research, i.e., from hospital and that from
University and research centres.
Out of the total publications from the medical and hospital systems of the eight countries, India, China,
Malaysia, Singapore, Israel, Chile,
USA and UK, the USA alone
accounted for 67.8%, UK
accounted for 17.6%, Israel for
4.9%, China for 4.7% and India
for 3.9% of the total. Other
countries accounted for negligible
share of the total. Similarly, out
of the total publications from the
University systems including from
other research bodies, USA
contributed 54.2%, UK 24.9%,
Israel 6.9%, China 6.6% and
India 4.3%. Other countries such
as Malaysia or Chile contributed
insignificant share. Remarkably
for USA, the relative contribution
in biomedical research by
Universities is significantly lower
than the contribution from the
hospital system. Contrarily, in UK
the University system contributes
significantly higher proportion of
output. For both Israel and China
University system’s contribution
is growing and for India
contribution from the University
system (several medical colleges
come under University though) is
marginally above that from hospitals.

S&T and Industry230
In UK, hospitals contributed nearly twice the output from university and other research bodies. During 1991-
2001, output from hospitals grew by 100%, from university by about 500% and from other research bodies
by 300%. In China, growth has been spectacular. Output from Universities grew by more than 1500% and
from hospitals by about 500% whereas it declined for research bodies. India, however, experienced a modest
growth - from hospitals by about 160%, from Universities by about 200% and from other research bodies by
about 200%. However, because of the early lead the hospitals still retained their higher position. In the US all
the three segments grew about the same rate, the other research bodies had the early lead with their output
above the hospitals both during 1995 and 2001.
Role of Hospitals in India and China
Hospital, provide for the scope to undertake integrated research, and research on a very large number of
patients with all possible types of diseases. Both India and China have very large population and this alone
provides for a very large research pool. However, the genetic pool in India is much diverse and India offers
a virtual microcosm of global genetic abundance. More importantly, in both the countries hospitals, are the
most important providers of health care.
Organized research under publicly funded system has contributed significantly to Indian Medical System
(Fig 4-23.08) - Universities contributed 37.9%, organized public research contributed 15.6% and higher
research-teaching establishments such as the Indian Institutes of Technology (IIT) and the Indian Institute
of Science (IISc) contributed 9%. Private research and private medical research contributed 0.3% and
1.7% respectively while pure hospital-based research contributed 32.5%. However, the output of organized
research and of the hospitals including from the universities are often joint. Apart from making the data
regarding origination of research a suspect, the major role of such joint research is in influencing the research.
In India, University system (when medical universities are taken out) contributes far less and even the non-
medical organized research pursuing such problems as genomics, proteomics, drug design, and other chemical-
biological problems in biomedical research contributes far less compared to both USA and UK.
Biomedical knoBiomedical knoBiomedical knoBiomedical knoBiomedical knowwwwwledgledgledgledgledge assee assee assee assee assets in Indian citiests in Indian citiests in Indian citiests in Indian citiests in Indian cities
Medical practice and medical case-based knowledge assets exhibit excellently the characteristic of severalty.
In case accumulation of quantity of knowledge asset is possible, severalty of assets would be undervalued
while large quantity amassed under one category or the efficiency of operation would be valued. Possibly a
good amount of non-serendipitous research knowledge in areas such as chemistry or biotechnology belong
to these classes.
In the type of assets where severalty is valued, the spatial distribution and spatially unique characteristic of
for example medical knowledge receives high value. This space could refer to physical geographical space,
the genetic space, or the temporally observed series of facts on a group of subjects belonging to a single
locality. It follows then distribution characteristics of assets within institutions of knowledge are important.

S&T and Industry 231
Spatial distribution of medical knowledge generation should be considered highly desirable. Spatial concentration
of chemical or biotechnological knowledge could in contrast be desired, especially because both spillovers
would be higher and the transactions costs lower in concentrated space. A market in such a case would be
constituted by transactions between organizations. In the other type of medical knowledge, assets would
better remain dispersed, often even through physicians’ networks and the market would be constituted the
least through inter-organizational transactions.
Fig 4-23.09 presents the distribution of cumulative biomedical publications over eleven years across several
cities, and a detailed annual break up of publications over thirty-five smaller cities from India exhibiting
interesting pattern. Publication is an asset in so far as the institution can appropriate it. Publishing personnel
are otherwise the assets, and publication as a dummy can represent distribution of active asset-holding
personnel. The institution of hospital contributes the larger part of the output from the large cities such as
Delhi, Bangalore, Kolkata, Mumbai, Lucknow or Hyderabad and Madras. Further, the contribution from
non-major cities for example Patna, Mangalore, Coimbatore, Guahati and similar others are largely due to hospital.
Mumbai offers sharply contrasting features: (1) large number of hospitals participating in research process,
(2) total contribution by hospitals are dominant, and (3) non-dominance of organized research. More than
thirty-two hospitals out of forty non-major contributors from Mumbai (such as the Tata Memorial hospital,
the Edward, the Nair, and similar others with contributions above 2% of the city total) have participated in
research during the last decade. University has low participation, and organized research from the BARC,
the TIFR and others put together contribute little above 25%. No single organization in Mumbai has contributed
more than 15% of total city publication, while IISc in Bangalore alone has contributed about 49%. Hyderabad
and Kolkata exhibit features intermediate between Mumbai and Bangalore. No single organization from
Hyderabad and Kolkata contributes above 29% and 14% respectively of total city publications. There are
eight and seven non-major hospitals in both the cities out of a total of fifteen non-major participants in
biomedical research. Distributions in both these cities are not sufficiently long-tailed.
per cent

S&T and Industry232
Chennai has, however, a long tail, quite close to what we observe for Mumbai, and this distribution is very
different from what we see at Lucknow. Organized research is relatively weak with about 13% contribution
to the city total. Hospitals are many, and none dominating the research, a feature, which even Mumbai
cannot display. Most research-intensive hospital contributes about 5% of city total, and there are four of
them. Large hospitals contribute about 30% of city total of publications. Research in Lucknow has been
parcelled between a handful of organizations most of whom are from public organized research, which
contributes about 52% of total city publication. Delhi has some other kind of uniqueness. Its tail end is as
long as Mumbai, however, its distribution is more skewed than Mumbai. The AIIMS, a specialty research
hospital, alone contributes the dominant share of 33.6%, followed by the next most-contributing hospital the
Maulana Azad with only 3.1%. University system in Delhi contributes a little above 12%, with nearly the
total output shared by the two major universities of the city, the Delhi University and the Jawaharlal Nehru
University. Organized research contributes only about 7% of city total.

S&T and Industry 233
The ‘others’ category of each city provides an insight. Delhi has the highest figure, at 40.7% of city total,
followed by Kolkata at 35.5% of city total, followed by Chennai at 26.7%, then Mumbai, Bangalore and
Hyderabad at par, and Lucknow with the lowest figure of 4.4% of city total being contributed by the ‘others’.
The number of non-major organizations is also indicative: Delhi and Mumbai both at 44, Chennai at 24,
Bangalore at 21, Kolkata and Hyderabad at 15, and finally Lucknow at 5.
Another way of characterizing these cities would be along the dominance of institution. Bangalore is dominated
by organized research, undertaken mostly at the research-university of the IISc. Hospital institution dominates
Mumbai. However, no single organization dominates the medical research there. Hospital institution dominates
Delhi too, however, there exists organisational dominance. Chennai is equally shared between institutions,

S&T and Industry234
although when one takes into account medical research under university as belonging to hospital institution,
the latter as institution dominates. The institution of organized research dominates Kolkata. In fact, most part
of the university contribution comes from the hospital system. Hyderabad too shares similarity with Kolkata
but with one difference that university institution is strong at Hyderabad. Two institutions, and two organizations,
one each from each institution dominate Lucknow, the CDRI from public organized research and the Sanjay
Gandhi from hospital institution. These cities are distributed along the entire geography of India. Mumbai is
from West, Chennai and Bangalore from South, Hyderabad from Central, Delhi and Lucknow from North
and Kolkata from the East keep the geographical balance. Each geography offers distinct knowledge or
asset pool. This, however, is not the status of some other countries. China shows a distinct geographical
concentration. Research assets in China appear to be highly concentrated in the coastal ring, which contributes
above 81% of China total. While London-Cambridge output is cornering about 50% of the output of UK, two
poles of biomedical research in US- North-Eastern pole and South-Western pole, together produce the
majority of US research.
IndiaIndiaIndiaIndiaIndia’’’’’s Capability and Coms Capability and Coms Capability and Coms Capability and Coms Capability and Compepepepepetttttence inence inence inence inence in
Energy sector R&DEnergy sector R&DEnergy sector R&DEnergy sector R&DEnergy sector R&D
Energy requirement of Indian economy is enormous and growing fast. Growth of industry implies growing
requirements for energy. Coal, oil, and natural gas are the three primary commercial energy sources. Huge
parts of this demand for energy are met through imports of energy resources. The recent energy policy and
before that the Prime Minister’s statement has laid out a broad policy framework on energy. Given such a
framework and global vicissitudes, this section explores the country’s capability to identify, cultivate, develop
and harness novel energy resources based on novel applications of S&T.
Demand and supply scenario
Coal: Coal is the major source of energy in India; it contributes 55% of total energy demands. The
consumption of raw coal has increased in the period of 1970-2007. Till the mid 70’s railways were the major
consumer of coal followed by steel, electricity generation, and cement industries. Gradually railways upgraded

S&T and Industry 235
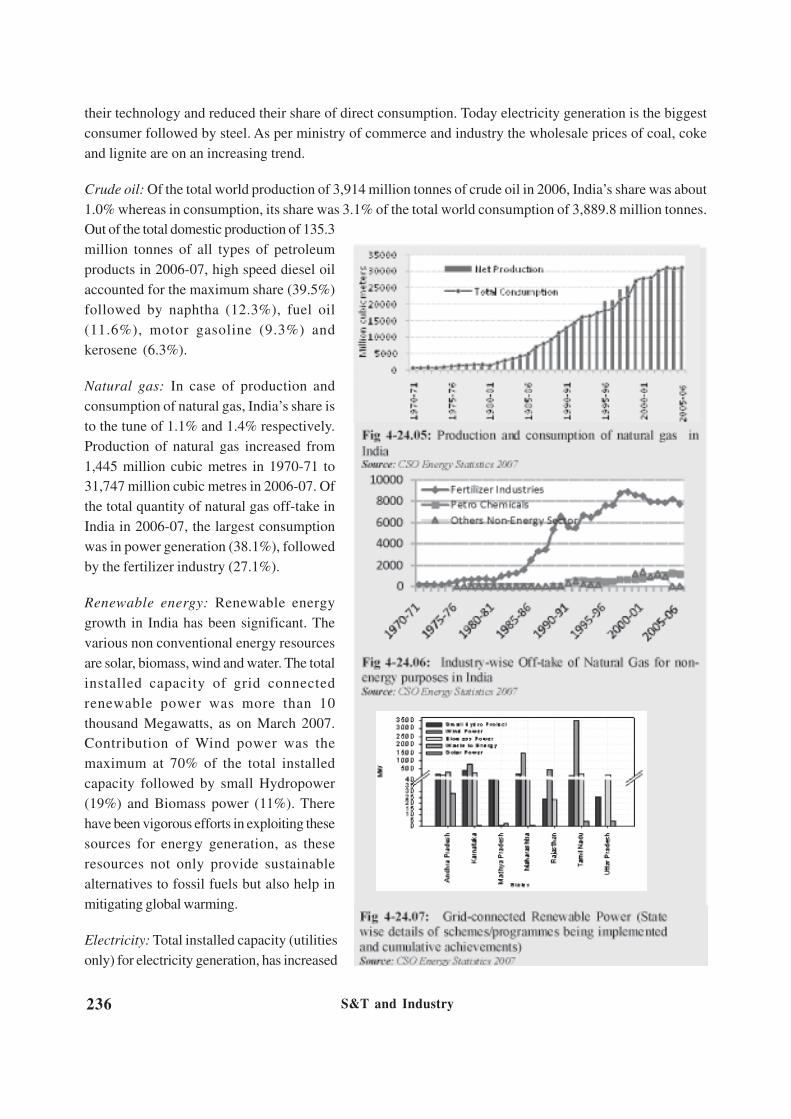
S&T and Industry236
their technology and reduced their share of direct consumption. Today electricity generation is the biggest
consumer followed by steel. As per ministry of commerce and industry the wholesale prices of coal, coke
and lignite are on an increasing trend.
Crude oil: Of the total world production of 3,914 million tonnes of crude oil in 2006, India’s share was about
1.0% whereas in consumption, its share was 3.1% of the total world consumption of 3,889.8 million tonnes.
Out of the total domestic production of 135.3
million tonnes of all types of petroleum
products in 2006-07, high speed diesel oil
accounted for the maximum share (39.5%)
followed by naphtha (12.3%), fuel oil
(11.6%), motor gasoline (9.3%) and
kerosene (6.3%).
Natural gas: In case of production and
consumption of natural gas, India’s share is
to the tune of 1.1% and 1.4% respectively.
Production of natural gas increased from
1,445 million cubic metres in 1970-71 to
31,747 million cubic metres in 2006-07. Of
the total quantity of natural gas off-take in
India in 2006-07, the largest consumption
was in power generation (38.1%), followed
by the fertilizer industry (27.1%).
Renewable energy: Renewable energy
growth in India has been significant. The
various non conventional energy resources
are solar, biomass, wind and water. The total
installed capacity of grid connected
renewable power was more than 10
thousand Megawatts, as on March 2007.
Contribution of Wind power was the
maximum at 70% of the total installed
capacity followed by small Hydropower
(19%) and Biomass power (11%). There
have been vigorous efforts in exploiting these
sources for energy generation, as these
resources not only provide sustainable
alternatives to fossil fuels but also help in
mitigating global warming.
Electricity: Total installed capacity (utilities
only) for electricity generation, has increased

S&T and Industry 237
from 14,709 MW in 1970-71 to
132,329 MW in 2006-07. Average
generation of electricity per
Kilowatt of the installed capacity
in India is found to be the highest
for Thermal (5,711 KWH)
followed by Nuclear (4,771
KWH) and Hydro (3,271KWH).
Of the total electricity consumed
in 2006-07, industry sector
accounted for the largest share
followed by domestic, agriculture
and commercial sectors.
However, electricity consumption
in domestic sector and agriculture
sectors has increased at a much
faster pace compared to other
sectors during 1970-71 to 2006-07.
It is a cause of concern that
transmission losses have increased
from about 17% in 1970-71 to
about 30% in 2006-07.
Government policy: On 26 Dec
2008, Government of India
approved the “Integrated Energy
Policy” which envisions a road map
for sustainable growth with energy
security to be achieved over a
reasonable period of time. This
was conceived to ensure better
coordination among different
energy sectors set up by different
ministries. The policy prepared by
Planning Commission of India
seeks to make energy markets
more competitive, have market-
determined energy pricing and
resource allocation, transparent
and targeted subsidy disbursal and
improved efficiency, optimal

S&T and Industry238
exploitation of domestic energy resources, and exploring and acquiring energy assets abroad to attain energy
security for the country.
Role of Private Sector in Energy Sector R&D
The major energy consuming industries are manufacturing, agriculture, mining, transportation and construction.
Industries use energy for a wide range of activities such as process and assembly uses, space conditioning,
and lighting. The rising cost of energy and the growing concern over climate change and global warming has
led industries to undertake R&D on new technologies aimed among other things, at reducing the environmental
impact of energy production and consumption. In year 2005, there were around 188 listed Indian industries
dealing in energy sector in areas of coal & lignite, electricity generation, crude oil, dry cell, storage battery,
refinery & solar energy. Out of these 33 companies were directly involved in R&D, while 38 were paying
royalty for technical know-how. Within the last ten years the private and public company expenditure on
R&D has remained nearly constant. If we look at the power consumption of the industries with respect to
their sales, it shows that it has decreased considerably.
This proves that there has
been considerable amount of
technological innovation
regarding enhancing energy
efficiency in the industries
which is reflected from the
data showing lowered power
consumption. It also seems
that at present this innovation
is largely dependent on
technical know-how from
outside rather than from in-
house R&D. But with the
increase in rate of forex
earnings compared to
expenditure, a time is not far
when the earnings will
surpass expenditure and
India will be the hub of R&D.
Role of Public sector in
Energy Sector R&D
Coal: An overview of
scientific articles published in
coal sector between 1995
and 2007 reveals that Indian
share of published papers is

S&T and Industry 239
increasing gradually, with an exception for
the year 2006 which showed a reverse
trend. However, the number of citations
of these research papers shows a
dismissal picture. The rate of citations
presently is abysmally low as compared
to earlier years. In India, scientific
research on coal related areas is being
conducted by both universities as well as
institutes. Among institutes CSIR holds the
maximum number of research papers in
coal area followed by the Indian Institutes
of Technology while in academic sector
BHU holds the maximum number of
research papers. Moreover CSIR and IITs
are far ahead in paper publishing as
compared to other institutes and
universities.
Petroleum: The trend in number of
research papers published in petroleum
sector has remained stable by and large
though an increase was seen during 2007.
However a large increase was seen in the
involvement of authors (numbers)
publishing those papers. This shows that
the scope of research is high in this area.
Solar energy: An increasing trend was
seen till 2004 but after that a negative
growth in number of research papers
output in solar energy as well as in number of authors involved was seen. Even the citations are abysmally
low. IITs hold maximum number of papers in solar energy research and are way ahead followed by DRDO
and CSIR. Among the universities, Shivaji University tops the list with 50 publications.
Bio-energy: Bioenergy includes energy from biofuels as well as from biomass. The trend on number of
research papers published during the last 10 years pertaining to Bio-Energy research has more or less
remained stable, with an exception in 2007 when it showed significant increase.
In the beginning of the millennium, both, number of papers and authors, decreased but after that there has
been a significant increase in number of researchers and papers till date. Citations of papers published in
bio-energy sector show a decline.
Gas hydrates: In India scientific work on gas hydrates was initiated during 1997 and is still in its nascent

S&T and Industry240

S&T and Industry 241
stage. Since 2004 there has been a slight increase in Gas Hydrate research in India. Similarly the authors
involved in publishing their research are on an increase, that too significantly from 2005 onwards.
Hydrogen: Though in recent years publication output and researchers involved in hydrogen field has increased
but a sharp fall is seen in the paper citations especially after 2001. IITs holds maximum number of research
papers in Hydrogen energy and are quite ahead of other institutes. They are followed by CSIR. In academic
sector BHU heads the list.
Battery: The number of publications has increased two fold in battery research during the last 10 years
while the number of authors involved has tripled thereby showing an increase in interest in this area. Paper
citations show a reverse trend with a sharp drop in year 2007 indicating that more and more researchers are
entering this field. In battery research India holds 11 patents.
Endnote
According to various projections, in near future, India’s demand of energy would rise so sharply, that it would
be quite difficult for India to sustain itself in this competitive world. So, how can India become self reliant or
achieve security in energy? Increasing the supply of energy is one way of dealing with energy shortage in
our country. A second way is to improve energy efficiency or reduce energy requirements. The challenge
therefore before the nation is to focus R&D on technologies that seek to achieve progressively higher levels
of efficiency covering all the different stages and forms of energy conversion, as well as those that seek to
improve the efficiency at the end use stage. The other broad concern of energy R&D would be to identify
new and novel resources/methods of energy generation (especially renewable), improve technology to tap
known but uneconomic and novel energy resources, develop energy conversion systems with higher efficiency,
develop standards for new energy sources, etc. As a result, R&D in the energy sector is quite critical for
India’s energy prospects.
Put together the country needs to develop critical capacities and capabilities in new energy research and this
has to be achieved by a set of policies already enshrined in the framework enunciated by the Prime Minister
and by the Energy Policy.
The main challenge facing India’s energy sector would be to increase its efficiency in an environmentally
and socially acceptable manner. It needs to augment its domestic energy resources. It is a long term imperative
that renewable resources are exploited optimally as India’s sustained economic development is vitally dependent
on its energy security and on the promotion of sustainable and environment friendly energy technologies.
The underlying assumption therefore is that novel S&T capability and capacity would endow the country
with required energy resources.
MatMatMatMatMaterererererials R&D and Innoials R&D and Innoials R&D and Innoials R&D and Innoials R&D and Innovvvvvationationationationation
Due to their influence on the extent of sophistication and standard of living, materials have defined the ages
of mankind. The development of the field is determined to a great extent by societal needs ranging from

S&T and Industry242
national security and communications to health and housing. Aspiration of India to become a developed
nation by 2020 necessitates development of novel materials. At the same time increasing the availability and
affordability of traditional materials is also
essential to sustain and improve the quality of
her people. Fulfilling these ambitions or
promises requires a strong R&D foundation;
public, private and/or joint initiatives.
Materials Production in India
One segment of materials production
comprises of production of raw metal ores and
production of metal products. National
production of metal ores has increased with
an AAGR of around 16% except for a bit of negative growth (-1.3%) during 1996.
Zinc ore and its concentrates contribute on an average 77% to the total metal ore production followed by
iron ore and its concentrates (21%) and gold ore and its concentrates have the lowest contribution. This
production dynamic may be indicative of the country’s reserves of the ore and hence has significant implications
in shaping national materials R&D.
Production of metal products implies value addition and the AAGR of production of metal products is only
about 2% and the lowest (negative) growth (-4.14%) was observed in the year 2004. Production of iron
products accounts for maximum share (90%) of production of metal products.
India’s Materials Trade
India trades materials in
different forms; raw
metals, metal products as
well as fabricated metal
products including
machinery and equipments
in finished form. The share
of material trade in total
trade is about 23%. During
the 90s and the first decade
of this century, on an
average, the percentage
share of material exports
(24.57%) is higher than the
percentage share of
material import (21.81%)
in total Indian material

S&T and Industry 243
trade.
Monetarily, materials trade has increased at an average annual growth rate of 16.73% during the period
which is higher than the average annual growth rate of the volume of trade of all commodities. The volume
of export and import of materials has grown by 15.93% and 17.85% respectively. The trade of materials in
terms of quantity has increased steadily especially after 2001. There is positive trade balance especially
2003 onwards, which was of course due to the higher export of raw materials indicating the lack of value
addition and hence technological inefficiency.
Materials R&D Strategy of India
From the preceding paragraphs it is apparent that the dynamic of foreign trade in materials is better than
foreign trade of all commodities put together. However, increasing the availability as well as affordability of
traditional materials and development of novel materials depends to a large extent on the country’s materials
R&D status. The world
emphasis on materials is
shifting from the present
silicon based approach to
diverse and novel
materials like nano
materials, cryogenic
materials, biomaterials,
and mesoscopic
materials, energy
materials, biomaterials,
etc. Accordingly, the
national S&T policies on
materials science could
focus on three basic
facets:
1. Domestic value addition: India exports more of raw materials than metal products and metal fabricated
products. Policies could be formulated in such a manner as to encourage more value addition in domestic
produce. This will enhance forex earnings.
2. Technology for processing advanced materials: Another feature of India’s material industry is that
we are short on, rather virtually nil in strategic materials like Vanadium, Uranium, and Lithium etc.
Non-availability of a resource is a natural phenomenon and the country needs to enhance technological
capacity to process those strategic materials or their substitutes in order to have substantial bargaining
power in the market.
3. Capability and capacity to produce novel materials: To meet the growing national demands of
health, hygiene, sanitation, housing, energy and to improve the standard of living should be the third
objective of national materials science strategy. There is an urgent need to enhance the capability and

S&T and Industry244
capacity to develop advanced and novel materials.
In the following paragraphs the present state of affairs of materials science research in India has been
captured as a pre-requisite to
formulating a strategic plan.
Materials R&D in the Private
Sector
Among the listed companies, the
number of companies doing materials
related R&D decreased over the
period 1995-2005. Likewise, there is
also a decline in the number of
companies paying Royalty and License
fee etc. However, there has been a
rise in the number of companies’
earnings from forex. The quantity of power consumed per unit of sales has been on the decline which
indicates efficiency of the technology or product used. The amount of royalty paid, license fee paid per unit
of sales is also decreasing over the considered period. Both forex expenses as well as forex earning per unit
of sales is increasing. What is more serious is the decreasing R&D expenditure per unit of sales, which
needs immediate attention.
Materials R&D in the Universities/Research Organizations: Knowledge Generation
Research Institute and Universities play a major role in advanced knowledge generation through both
fundamental non-commercial and development research. The knowledge generated is communicated or
disseminated in the form of publications and protected mainly through patents. This knowledge becomes the
feedstock to bridge organizations for development of engineering solutions for industries who convert the
knowledge to commercial
products or processes.
Overall output in Material
Science: The average annual
growth in material science
research in India is about
10%, over the period 1995-
2007. There has been
approximately 3 fold increase
in the number of publications
in a span of 13 years. Indian
publications in material
sciences is concentrated more
in the conventional disciplines of material research. Highest number of papers have been published in the

S&T and Industry 245
polymer (7,079 nos.) followed by
those in alloy (4,007). Though India
has publications in as high as 24 of
the 25 areas of materials science
outlined by NSF, only the top 12 areas
are worth mentioning.
Based on the total publications in these
12 areas, the IITs together occupy the
top position with 3,376 papers followed
by CSIR (2,516 papers) and IISc
(1,212 papers). However, in terms of
number of areas, only three institutes
namely IITs, CSIR, and IISc have published in all the 12 top areas of material science followed by BARC
(11 areas), BHU (10 areas). Indian Association for Cultivation of Science and Annamalai University are the
two institutes having publications in 9 areas. Both TIFR and Delhi University have published in 8 areas. But
rest of the institutes have publications in only 1 or 2 areas of material science. About 27.75% of publications
are 3-authored papers and around 27.3% are 2-authored papers. In terms of collaborative publication, there
appears to be a good understanding between Indian and German researchers (627 joint publications), followed
by USA and Japan (Table 4-25.03). There are joint publications with authors from the countries other than
the listed one, but those are not significant. This is actually the position of the top 10 foreign countries with
which India has joint publications.
Area-wise scenario of Material Science Research in India: Further, knowing whether the publication in
a particular sub-area e.g. Polymer is increasing or decreasing, or what is the standard of their publications
(read citations), or who are national leaders (institutes) etc. is critical for formulating suitable strategies.

S&T and Industry246
The output in Polymer
research has increased
gradually in last 13 years.
The involvement of authors in
this area has shown a sharp
increase after 2005. In Alloy
research, number of research
papers shows an increasing
trend over the period, but that
increment is very low,
whereas the number of
researchers increased rapidly.
The output in Semiconductor
research has grown, in India,
over the last 13 years.
Increase in number of authors creates more scope for further research in this area. In Ferro-Electric research
in India, the number of papers has constantly increased over the last 13 years.
The number of authors involved
in these fields also increased
significantly; this shows greater
scope for further research
opportunities in this area. The
output in Super-conductivity is
almost constant over the time
period of last 13 years. But there
is certain increment in number of
authors involved in this area.
In terms of institutes, IITs top the
list by having highest publications
in 7 out of the 12 fields of
material science, followed by
CSIR having maximum
number of research papers in 2 fields and TIFR, CLCRI and IISc each having maximum publications in 1
field only (Table 4-25.04). The IITs have published highest number of papers in alloy (1,021) while CSIR’s
highest publication is in the field of polymer (1,257). Among the universities, Annamalai University has
publications in 3 fields followed by Jadavpur University in 2 fields. Though BHU has published in only one
field (Alloy), but it has the highest publication among all the universities, irrespective of number of fields.
Neither single authored papers nor papers authored by more than 3 authors could lead in any of the 12 fields.
This is a clear indication that 2 or 3-authored paper is the ideal form of collaboration.
United States of America appears to be the most preferred foreign collaborator for Indian material science

S&T and Industry 247
researchers. As many as 9 out of the 12 fields have USA as the leading collaborator, followed by Germany
(2 fields) and then Japan (one field).
The Way Ahead
The present investigation shows that materials trade has a comparatively better trade balance than the trade
balance of all commodities. This picture of material trade balance owes partially to the increased investment
on R&D and innovation by the industries. Perhaps, more emphasis on novel materials like nano materials,
cryogenic materials, biomaterials and mesoscopic materials, energy materials etc by the research organizations
and institutions to generate adequate feeding material for the industries may improve the status of materials
trade, or at least keep up the present trend. More importantly, enhanced research activity in novel materials
is essential for security and for meeting the national requirements.

S&T Output and Patents 249
S&T Output and Patents
Overview
The ability to generate, access and exploit new scientific and technological knowledge is becoming increasingly
strategic and decisive for the economic performance of countries and regions in the present competitive
globalized economy. Contributions under this theme reflect upon the performance of Indian science and
technology as indicated by its publications and patents output and may help therefore to understand its
strategic abilities to generate and exploit the new scientific and technological knowledge. The Scientific
Policy Resolution, 1958; the Technology Policy Statement of 1983; and the Science and Technology Policy,
2003 of the Government of India indicate continued political commitment to the support of science and
technology and embody a vision for its development in the country. This political commitment led to the
creation of a vast S&T infrastructure within government R&D institutions, universities, non-governmental
organizations and firms in the industry; which have been playing a major role in the development of new
scientific and technological knowledge in various fields of science and technology and utilizing such knowledge
to meet the challenges and opportunities before the country.
Over the years, science and technology have become closely intertwined, and to be effective need to
reinforce each other. The publications brought out by scientists and patents obtained by them, broadly
indicate the output of science and technology, that can be used to understand growing Indian capacities and
potential in different fields of science and technology. A review of these indicators may provide significant
insights into the national R&D capacities, emerging priorities, performance and future directions of scientific
and technological institutions in the country. Several contributions under this theme focus on some such
salient dimensions. The analysis based on the publications data from SCOPUS database examines India’s
performance on several measures including country’s publication share in the world research output and
country’s publication share in various subjects in the national context and in the global context. In addition,
it profiles high productivity institutions, scientists and cited papers and the share of international collaborative
papers at the national level as well as across subjects. The Indian Science Abstract presents an alternative
dataset of the Indian S&T literature published in Indian S&T journals, the analysis of which has been made
to reflect the performance of government and academic institutions. The publications output in specific
cases of mathematics and global malaria vaccine research has also been examined. The health of scientific
journals is important for effective communication and dissemination of the results of research and the
performance of the S&T enterprise. The salient features of which are examined under: Profile of Indian
Science Journals, Membership of editorial boards of US and UK journals in Clinical Medicine field, Access
to international journals using citations: a case study of medical science research in India. The contribution
– Appropriation and value of assets signifies the role of citations in the publications process.

S&T Output and Patents250
The analysis of patent output indicates the characteristic features of the spurt in growth of patenting in India
and the Indian industry’s growing inventiveness and competitiveness. Indian industry has expanded its
commercial base across countries as indicated by the patent protection sought by them for their inventions in
countries synonymous with their commercial interests. The Indian publications and patents output has been
examined in specific cases of Information and Communication Technology, and nanotechnology. A review
of the Indian patents in biotechnology signifies the emerging national potential in this field. The contribution
on strategic worth of patenting delves on the citations made in Indian patent documents.
The full text of these extended summaries is available at http://www.nistads.res.in

S&T Output and Patents 251
SSSSStttttatus of India in Science and Tatus of India in Science and Tatus of India in Science and Tatus of India in Science and Tatus of India in Science and Tececececechnology ashnology ashnology ashnology ashnology as
reflected in its Publication Output in Scopusreflected in its Publication Output in Scopusreflected in its Publication Output in Scopusreflected in its Publication Output in Scopusreflected in its Publication Output in Scopus
IntIntIntIntIntererererernational Datnational Datnational Datnational Datnational Database, 1abase, 1abase, 1abase, 1abase, 199999999997-2007-2007-2007-2007-20077777
Indian publications for the period 1997-2007 can be examined for (i) analyzing India’s current publications
rate and its share in global publications in comparison with select leading countries, (ii) comparing and
understanding similarities between India’s national research profile and of select leading productive countries,
(iii) determining the most productive and weak subject areas of research in Indian science and technology,
(iv) determining India’s share of international collaborative papers in its total output, leading co-author countries
collaborating with India as well as its publications share across main subject areas, (v) determining the most
productive and weak geographical regions, and (vi) understanding the characteristics of highly productive
institutions, scientists and of cited papers.
The output data is as indexed by Scopus database, indexing over 15000 international peer reviewed journals
in science and technology, besides more than 500 international conference/seminar proceedings. The study
uses 11 years publications data from 1997 to 2007 on India. In addition, it used citations data for measuring
quality and visibility of Indian research output. Three years, two year and one year citations window has
been used for computing average citations per paper for all S&T papers published by India during 1997-
2004, 2005 and 2006. The study has used a number of absolute publications, citation and collaborative
measures for developing S&T indicators, as needed for depicting India’s status in science and technology
from 1997 to 2007.
India’s Publication Share and Rank in World
As reflected in the Scopus database, India published 3,22,956 research papers during 1997-2007, with an
average output of 29,360 papers per year. The cumulative output of India increased from 65,601 papers
during 1997-99 to 121518 papers during 2005-07, showing a growth rate of 85.24%. The country achieved
an annual average growth rate of 7.76% per annum during 1997-2007. It also improved its annual average
growth rate from 4.31% during 1997-2002 to 11.21% during 2003-07. India holds 12th rank among the top 20
productive countries in science and technology with its global publications share of 2.11% as computed from
cumulative world publications data for 1997-2007. The country has shown a rise in its global publications
share, rising from 1.86% to 1.97%, and to 2.55% from the year 1997 to 2002, and to the 2007, respectively.
Correspondingly India improved its world ranking from 13th position in 1997 to 12th in 2002 and to 10th in
2007. Table 5-01.01 lists 20 most productive countries based on the cumulative output of these countries for
the period 1997-2007.
Subject Profile of India in Science and Technology
As per cumulative publications output data for 1997-2007, India’s research profile by broad disciplines

S&T Output and Patents252
indicates that the physical science subjects together contributed the highest publication share (41.07%),
followed by life sciences (29.68%), engineering sciences (29.59%) and health sciences (22.06%).
Among top 20 most productive countries of the
world, India has close subject similarity with four
other international countries, namely, Russia,
China, South Korea and Taiwan. This is because
all of them have strong to moderately strong
emphasis in physical sciences and engineering
sciences, but are weak in health sciences.
Medicine, chemistry, physics, agricultural &
biological sciences, engineering, biochemistry,
genetics & molecular biology and materials
science are considered as the seven high priority
areas of India in S&T, each contributing
publication share between 12.0% and 19.15% in
the cumulative national publication output during
1997-2007.
Earth & planetary sciences, environmental
sciences, pharmacology, toxicology &
pharmaceutics, chemical engineering,
mathematics, immunology & microbiology,
veterinary sciences and computer science are the
eight medium productive subjective areas of
Indian research, each contributing between
2.65% to 6.36% share in the cumulative
publication output by India during 1997-2007.
Energy and neurology are the two low productive subject areas contributing publications share between
1.33% and 1.84% in cumulative publication output by India during 1997-07. In addition, public health nursing
and dentistry are the three least productive Indian subject areas contributing each less than 1% publication
share in cumulative publication output for the same period.
The largest increase of 3.68% (from 16.57% to 20.25%) in national publication share from 1997-99 to 2005-
07 has been observed in medicine, followed by 2.63% (from 11.68% to 14.31%) in biochemistry, genetics &
molecular biology, 1.34% (from 3.09% to 4.43%) in computer science, 1.03% (from 12.75% to 13.78%) in
engineering, 0.93% (from 11.51% to 12.44%) in materials science, 0.77% (from 3.42% to 4.14%) in
immunology & microbiology, 0.53% (from 6.11% to 6.64%) in pharmacology, toxicology & pharmaceutics,
0.50% (from 5.93% to 6.43%) in environmental science, 0.23% (from 5.87% to 6.10%) in chemical
engineering, 0.23% (from 0.40% to 0.63%) in public health, 0.20% (from 0.09% to 0.29%) in nursing and
0.15% (from 1.20% to 1.35%) in neurology. In contrast, the largest decrease of 2.37% (from 14.55% to
12.18%) in national publication share from 1975-99 to 2005-07 was observed in agricultural & biological

S&T Output and Patents 253
sciences, followed by 1.33% (from 5.71% to 4.38%) in earth & planetary sciences, 1.00% (from 3.15% to
2.15%) in veterinary science, 0.87% (from 15.10% to 14.23%) in physics, 0.22% (from 2.09% to 1.87%) in
energy and 0.15% (from 4.37% to 4.22%) in mathematics.
In terms of global publication share in 20 broad subject areas during 1997-2007, the largest share (5.36%) is
accounted by veterinary science, followed by chemistry (4.57%), agricultural & biological sciences (4.05%),
materials science (3.41%), pharmacology, toxicology & pharmaceutics (3.39%), chemical engineering
(2.77%), environmental science (3.32%), physics (2.73%), mathematics (2.31%), earth & planetary sciences
(2.27%), immunology & microbiology (2.22%), biochemistry, genetics & molecular biology (2.11%), energy
(2.02%), engineering (1.69%), computer science (1.49%), medicine (1.48%), dentistry (1.36%), neurology
(0.91%), public health (0.73%) and nursing (0.30%).
India has substantially improved its global publication share in 16 broad subjects out of 20 subjects over the
years, but the largest increase (1.89%) is achieved by chemistry (from 3.73% to 5.62%) from the year 1997
to the year 2007, followed by 1.84% (from 0.82% to 2.66%) in dentistry, 1.74% (from 1.55% to 3.29%) in
immunology & microbiology, 1.25% (from 2.67% to 3.92%) in environmental science, 1.24% (from 1.62%
to 2.86%) in biochemistry, genetics & molecular biology, 1.17% (from 3.10% to 4.27%) in materials science,
0.92% (from 0.61% to 1.53%) in neurology, 0.78% (from 3.60% to 4.38%) in agricultural & biological
sciences, 0.76% (from 3.23% to 3.98%) in chemical engineering, 0.75% (from 1.01% to 1.76%) in medicine,
0.71% (from 2.61% to 3.32%) in physics, 0.62% (from 0.45% to 1.07%) in public health, 0.42% (from
1.71% to 2.03%) in engineering, 0.37% (from 0.11% to 0.48%) in nursing, 0.24% (from 1.66% to 1.90%) in
computer science and 0.05% (from 2.42% to 2.47%) in earth & planetary sciences. In contrast, the largest
decrease in India’s global publication share (1.70%) from the year 1997 to the year 2007 was observed by
pharmacology, toxicology & immunology (from 5.09% to 3.39%), followed by 0.49% (from 2.67% to 2.18%)
in mathematics, 0.34% (from 2.92% to 2.58%) in energy and 0.13% (from 5.41% to 5.28%) in veterinary
science.
Status of India’s International Collaboration in Science & Technology
Based on publications output data for India in science and technology for 1997-2007, it is found that India’s
average annual share of international collaborative papers to its total cumulative publication output during
1997-2007 has been 15.21% (Table 5-01.02). India witnessed marginal rise in their share of internationally
collaborative papers from 14.30% during 1995-97 to 17.08% during 2005-07. Compared to India, developed
countries’ share of collaborative output in their total national output during 1997-07 was significantly higher.
India’s collaboration with Europe and North America contributed the largest share of international collaborative
papers (43.54% and 42.47%), followed by Asia (25.63%), Oceania (4.43%), South America (2.97%) and
Africa (2.83%) in the cumulative collaborative publications output by India during 1997-2007.
Among the 25 leading collaborating countries with India, the major ones from the developed world are:
United States with 37.30% share, followed by Germany (13.94% share), United Kingdom (12.88% share),
Japan (10.11% share), France (7.50% share), Canada (5.64% share), Italy (4.33% share), Australia (3.83%
share), Netherlands (2.98% share) followed by three countries Switzerland, Russia and Spain (2.81%, 2.41%
and 2.47% share), and four countries Sweden, Belgium, Poland and Hungary (1.93%, 1.43%, 1.38% and

S&T Output and Patents254
1.07% share). Similarly, leading countries from the developing world collaborating with India are: South
Korea with 4.08% publication share in the total collaborative publications during 1997-07, followed by China
(3.09% share), Taiwan (2.64% share), Brazil (2.10% share), Malaysia (1.80% share), Singapore (1.80%
share), Columbia (1.66% share), Mexico (1.61% share) and Israel (1.31% share).
India witnessed shift in its share of
collaborative papers with different
countries from 1997-99 to 2005-07.
With developed countries, like
United States, Canada, Italy,
Netherlands, Russia, Columbia and
Hungary, India witnessed decline
in its share of collaborative papers
and with other countries, such as
UK, Japan, Sweden, Switzerland,
Australia, Spain, Russia, Germany,
France, Netherlands and Belgium,
it witnessed rise in its share of
collaborative papers from 0.16% to
0.93% for the same period. With
developing countries, like South
Korea, Taiwan, Malaysia, China,
Brazil, Israel, Singapore and
Mexico, India witnessed rise in its
share of collaborative papers ranging from 0.26% to 4.52% and with Columbia, it witnessed decrease
by 0.14% from 1997-99 to 2005-07. This analysis is based on India’s cumulative publication output during
1997-07.
Among the various subjects, the largest share (27.84%) of international collaborative papers is recorded by
India in physics during 1997-2007, followed by mathematics (27.66%), nursing (25.04%), computer science
(23.70%), earth & planetary sciences (22.24%), biochemistry, genetics & molecular biology (19.51%),
immunology & microbiology (19.36%), materials science (17.29%), public health (16.67%), neurology
(16.34%), energy (16.27%), engineering (14.38%), chemistry (13.75%), chemical engineering (13.73%),
agricultural & biological sciences (11.87%), medicine (11.14%), environmental science (10.80%),
pharmacology, toxicology & pharmaceutics (9.10%), dentistry (6.54%) and veterinary science (4.0%)%).
India’s share of international collaborative papers has increased in 16 out of 20 broad subjects from 1997-99
to 2005-07. The largest increase (6.29%) in international collaborative papers share has been recorded by
neurology from 1997-99 to 2005-07, followed by earth & planetary sciences (6.05%), public heath (5.53%),
materials science (5.30%), medicine (4.31%), agricultural & biological sciences (3.44%), environmental
sciences (3.29%), nursing (2.98%), chemical engineering (2.98%), pharmacology, toxicology & pharmaceutics
(2.68%), veterinary science (2.51%), mathematics (2.31%), biochemistry, genetics & molecular biology
(2.28%), chemistry (2.14%), physics (1.40%) and engineering (1.12%). In contrast, there is a decrease
(10.10%) in international collaborative papers share of India from 1997-99 to 2005-07 by computer science,
followed by dentistry (6.96%), energy (1.08%) and immunology & microbiology (0.26%).

S&T Output and Patents 255
Output & Impact of National Funding
In terms of publications output, the largest number of publications (36,501) during 1997-2007 was contributed
by 7 Indian Institutes of Technologies (IITs), followed by the Council of Scientific & Industrial Research
(CSIR) (26,976), Department of Atomic Energy (DAE) (17,524), Ministry of Health & Family Welfare
supported institutes (13,271), Department of Science & Technology (DST) supported institutes (11,376),
etc.
The CSIR scored highest in terms of total citations secured, and the followers were the seven IITs, the DAE
institutes, the DST institutes, and similarly. Ranking in terms of publications impact as measured through
citations per paper, the Department of Biotechnology (DBT) supported institutes lead with 4.09 citations per
paper, followed by Department of Atomic Energy (DAE) institutes (3.64) and others as shown in
Table 5-01.03.
High Productivity S&T Institutions in India
A total of 36 organizations were identified as high productive ones publishing more than 800 papers during
1997-2007 (Table 5-01.04). These 36 organizations include: (i) Nine institutes of national importance (ii) Ten
research institutes and (iii) Seventeen universities. These top 36 organizations together contributed 45.98%
papers to the total cumulative research output by India during 1997-2007. These organizations individually
published between 881 and 12,856 papers in 11 years, with an average output of 4,243 papers per organization,
of varying size of manpower. Some of these organizations are many times larger than the smaller organizations.
Some fields of research have very large population of researchers and hence both high rate of publications
and citations. Only 13 organizations have contributed publications output above the 36-organizations average
(4,243 papers per institution) during 1997-2007. The publication share of these 36 organizations to the total
output by India showed decline over time from 46.19% in 1997-2002 to 45.85% in 2002-07.
These 36 organizations witnessed average growth in their publications output over time (1997-2001 to
2002-07) by 48.52%. Of these, 17 units showed growth rate higher than the 36-organizations-average. The
average h-index of these 36 organizations during 1997-2007 was 43.69. Of these, 20 organizations showed
h-index higher than the 36-organizations averages. The average citation per paper recorded by these institutions
during 1997-2007 was 2.64. Of these, 12 organizations showed citations performance above 36-organizations’

S&T Output and Patents256
citations average. The average share of the international collaborative papers of these 36 institutions during
1997-2007 was 18.28%. Only 15 out of 36 organizations have shown higher share of international collaboration
papers than the average share of 36 units. To recall, these organizations are of different sizes and are
contributing in different fields.
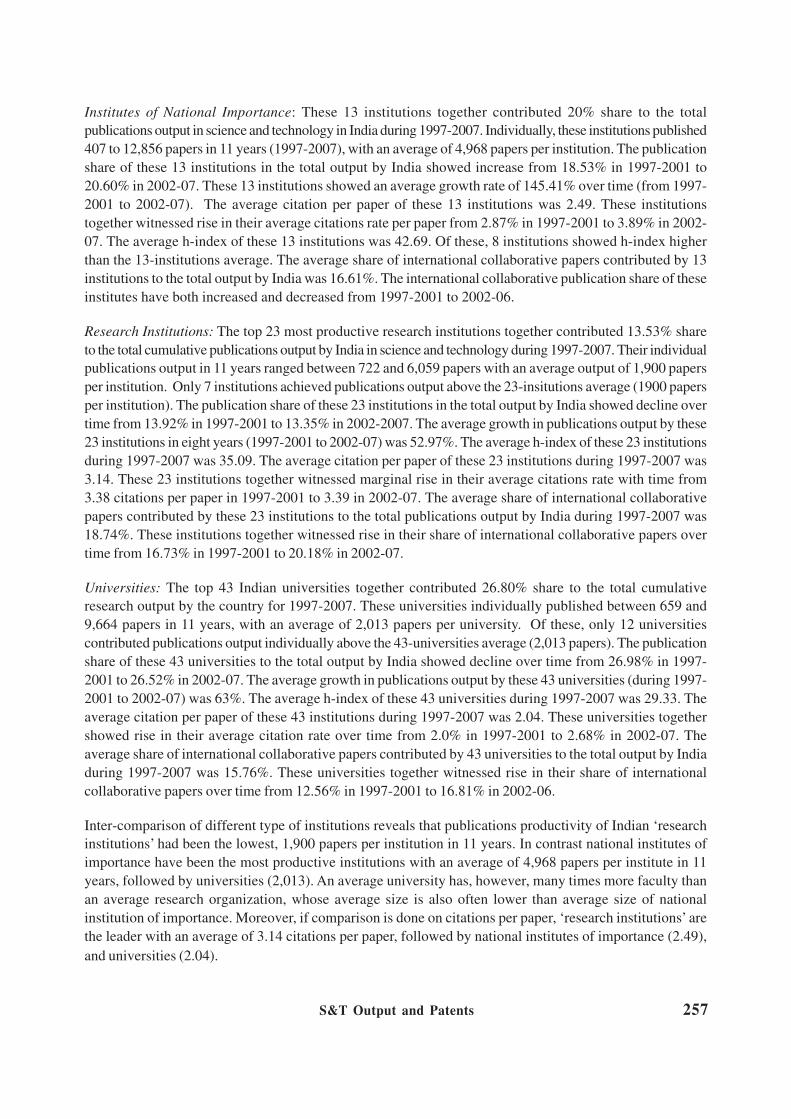
S&T Output and Patents 257
Institutes of National Importance: These 13 institutions together contributed 20% share to the total
publications output in science and technology in India during 1997-2007. Individually, these institutions published
407 to 12,856 papers in 11 years (1997-2007), with an average of 4,968 papers per institution. The publication
share of these 13 institutions in the total output by India showed increase from 18.53% in 1997-2001 to
20.60% in 2002-07. These 13 institutions showed an average growth rate of 145.41% over time (from 1997-
2001 to 2002-07). The average citation per paper of these 13 institutions was 2.49. These institutions
together witnessed rise in their average citations rate per paper from 2.87% in 1997-2001 to 3.89% in 2002-
07. The average h-index of these 13 institutions was 42.69. Of these, 8 institutions showed h-index higher
than the 13-institutions average. The average share of international collaborative papers contributed by 13
institutions to the total output by India was 16.61%. The international collaborative publication share of these
institutes have both increased and decreased from 1997-2001 to 2002-06.
Research Institutions: The top 23 most productive research institutions together contributed 13.53% share
to the total cumulative publications output by India in science and technology during 1997-2007. Their individual
publications output in 11 years ranged between 722 and 6,059 papers with an average output of 1,900 papers
per institution. Only 7 institutions achieved publications output above the 23-insitutions average (1900 papers
per institution). The publication share of these 23 institutions in the total output by India showed decline over
time from 13.92% in 1997-2001 to 13.35% in 2002-2007. The average growth in publications output by these
23 institutions in eight years (1997-2001 to 2002-07) was 52.97%. The average h-index of these 23 institutions
during 1997-2007 was 35.09. The average citation per paper of these 23 institutions during 1997-2007 was
3.14. These 23 institutions together witnessed marginal rise in their average citations rate with time from
3.38 citations per paper in 1997-2001 to 3.39 in 2002-07. The average share of international collaborative
papers contributed by these 23 institutions to the total publications output by India during 1997-2007 was
18.74%. These institutions together witnessed rise in their share of international collaborative papers over
time from 16.73% in 1997-2001 to 20.18% in 2002-07.
Universities: The top 43 Indian universities together contributed 26.80% share to the total cumulative
research output by the country for 1997-2007. These universities individually published between 659 and
9,664 papers in 11 years, with an average of 2,013 papers per university. Of these, only 12 universities
contributed publications output individually above the 43-universities average (2,013 papers). The publication
share of these 43 universities to the total output by India showed decline over time from 26.98% in 1997-
2001 to 26.52% in 2002-07. The average growth in publications output by these 43 universities (during 1997-
2001 to 2002-07) was 63%. The average h-index of these 43 universities during 1997-2007 was 29.33. The
average citation per paper of these 43 institutions during 1997-2007 was 2.04. These universities together
showed rise in their average citation rate over time from 2.0% in 1997-2001 to 2.68% in 2002-07. The
average share of international collaborative papers contributed by 43 universities to the total output by India
during 1997-2007 was 15.76%. These universities together witnessed rise in their share of international
collaborative papers over time from 12.56% in 1997-2001 to 16.81% in 2002-06.
Inter-comparison of different type of institutions reveals that publications productivity of Indian ‘research
institutions’ had been the lowest, 1,900 papers per institution in 11 years. In contrast national institutes of
importance have been the most productive institutions with an average of 4,968 papers per institute in 11
years, followed by universities (2,013). An average university has, however, many times more faculty than
an average research organization, whose average size is also often lower than average size of national
institution of importance. Moreover, if comparison is done on citations per paper, ‘research institutions’ are
the leader with an average of 3.14 citations per paper, followed by national institutes of importance (2.49),
and universities (2.04).
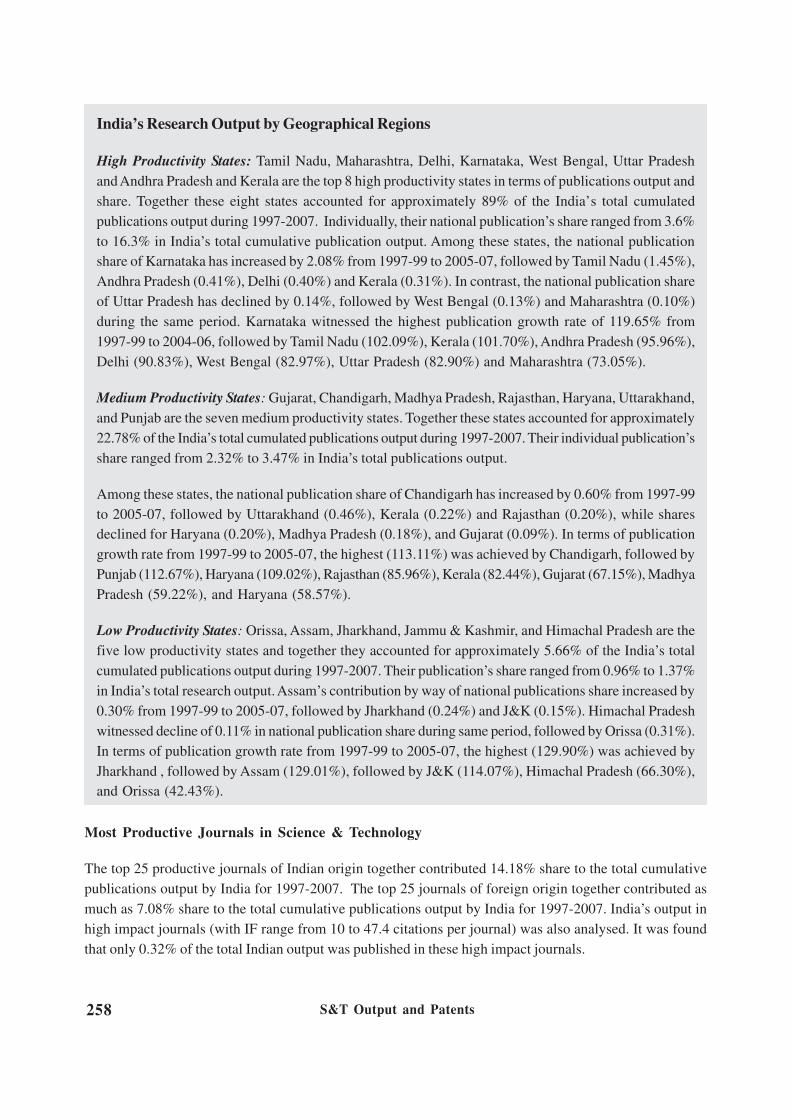
S&T Output and Patents258
Most Productive Journals in Science & Technology
The top 25 productive journals of Indian origin together contributed 14.18% share to the total cumulative
publications output by India for 1997-2007. The top 25 journals of foreign origin together contributed as
much as 7.08% share to the total cumulative publications output by India for 1997-2007. India’s output in
high impact journals (with IF range from 10 to 47.4 citations per journal) was also analysed. It was found
that only 0.32% of the total Indian output was published in these high impact journals.
India’s Research Output by Geographical Regions
High Productivity States: Tamil Nadu, Maharashtra, Delhi, Karnataka, West Bengal, Uttar Pradesh
and Andhra Pradesh and Kerala are the top 8 high productivity states in terms of publications output and
share. Together these eight states accounted for approximately 89% of the India’s total cumulated
publications output during 1997-2007. Individually, their national publication’s share ranged from 3.6%
to 16.3% in India’s total cumulative publication output. Among these states, the national publication
share of Karnataka has increased by 2.08% from 1997-99 to 2005-07, followed by Tamil Nadu (1.45%),
Andhra Pradesh (0.41%), Delhi (0.40%) and Kerala (0.31%). In contrast, the national publication share
of Uttar Pradesh has declined by 0.14%, followed by West Bengal (0.13%) and Maharashtra (0.10%)
during the same period. Karnataka witnessed the highest publication growth rate of 119.65% from
1997-99 to 2004-06, followed by Tamil Nadu (102.09%), Kerala (101.70%), Andhra Pradesh (95.96%),
Delhi (90.83%), West Bengal (82.97%), Uttar Pradesh (82.90%) and Maharashtra (73.05%).
Medium Productivity States: Gujarat, Chandigarh, Madhya Pradesh, Rajasthan, Haryana, Uttarakhand,
and Punjab are the seven medium productivity states. Together these states accounted for approximately
22.78% of the India’s total cumulated publications output during 1997-2007. Their individual publication’s
share ranged from 2.32% to 3.47% in India’s total publications output.
Among these states, the national publication share of Chandigarh has increased by 0.60% from 1997-99
to 2005-07, followed by Uttarakhand (0.46%), Kerala (0.22%) and Rajasthan (0.20%), while shares
declined for Haryana (0.20%), Madhya Pradesh (0.18%), and Gujarat (0.09%). In terms of publication
growth rate from 1997-99 to 2005-07, the highest (113.11%) was achieved by Chandigarh, followed by
Punjab (112.67%), Haryana (109.02%), Rajasthan (85.96%), Kerala (82.44%), Gujarat (67.15%), Madhya
Pradesh (59.22%), and Haryana (58.57%).
Low Productivity States: Orissa, Assam, Jharkhand, Jammu & Kashmir, and Himachal Pradesh are the
five low productivity states and together they accounted for approximately 5.66% of the India’s total
cumulated publications output during 1997-2007. Their publication’s share ranged from 0.96% to 1.37%
in India’s total research output. Assam’s contribution by way of national publications share increased by
0.30% from 1997-99 to 2005-07, followed by Jharkhand (0.24%) and J&K (0.15%). Himachal Pradesh
witnessed decline of 0.11% in national publication share during same period, followed by Orissa (0.31%).
In terms of publication growth rate from 1997-99 to 2005-07, the highest (129.90%) was achieved by
Jharkhand , followed by Assam (129.01%), followed by J&K (114.07%), Himachal Pradesh (66.30%),
and Orissa (42.43%).
S&T Output and Patents 259
High Cited Papers from India
India published a total of 100 high-cited papers in science and technology as seen from the publications
output data for 1997 to 2007. Since their publication between 1997 and 2007, these select papers received
between 221 and 2,995 citations per paper. These were much higher than the citations their counterparts
received during the same period. Of these 100 papers, 82 were articles, 16 review papers, 1 each note and
short survey. All these 100 high-cited papers were collaborative papers. Indian institutions and authors were
the lead authors in 42 papers and foreign institutions and authors were the lead authors in 58 papers. In
overall, Indian participation in these 100 papers was confined to 55 institutions, which included 9 institutes of
national importance, 21 research institutes, 19 from universities & colleges, 2 international institutes, 3 hospitals,
and 1 was from industry. Among the various institutes, the largest numbers of high cited papers (8) were
from IISC-Bangalore, followed by University of Hyderabad (7), AIIMS-Delhi (5), IIT-Chennai (4), IIT-
Kharagpur (4), IIT-Mumbai (4), Punjab University- Chandigarh (4), University of Jammu (4), etc.
These 100 high cited papers were published in 60 journals including 8 papers in Nature, 8 papers in Physical
Review Letters, 7 papers in Chemical Reviews, 6 papers in Science, 4 papers in Physics Report, 3 papers
in Journal of American Chemical Society, 2 papers each in Circulation, Chemical Communications,
Chemistry of Materials, IEEE Communications Magazine, IEEE Personal Communications,
International Journal of Modern Physics D, Lancet, Microbiology and Molecular Biology Reviews,
Nuclear Instruments and Methods in Physics Research Section A, Nuclear Physics A and Physics
Review D, and one each in 44 other journals. Many of these high-cited papers were published in high impact
factor journals.
Endnote
Based on analysis of publications output data for India for 1997-07 it is seen that India’s scientific activity is
on the rise; it is growing at an average rate of 7.76% per annum. However, despite the significant rise in its
average growth rate, India’s global share for 1997-07 is still very small (2.11%) compared to leading world
economies especially China.
India still lacks equable distribution of resources as many geographical states in India still contribute very
little publications share (less than 1% each) in science and technology. Some of such least productivity states
are: Chhattisgarh, Pondicherry, Bihar, Goa, Meghalaya, Manipur, Arunachal Pradesh, Tripura, Sikkim, Nagaland,
Mizoram, Andaman & Nicobar, Lakshadweep, Dadra & Nagar Haveli, and Daman and Diu.
The country needs to improve publications productivity especially in the university sector, as its average
productivity compared to national institutes of importance and research institutions is still the lowest. This is
an issue that policy makers in India need to address seriously so that universities, the knowledge centers of
the country are able to improve their quality and productivity in science.
India’s share of international collaborative papers in the cumulative publications output by the country during
1997-07 was 15.21%. Its collaboration with countries from America continent contributed the largest share
of international collaborative papers (44.33%), followed by Europe (43.24%), Asia (26.92%), Oceania (4.09%),
and Africa (2.85%).

S&T Output and Patents260
Indian Scientific Output as seen throughIndian Scientific Output as seen throughIndian Scientific Output as seen throughIndian Scientific Output as seen throughIndian Scientific Output as seen through
Indian Science AbstractsIndian Science AbstractsIndian Science AbstractsIndian Science AbstractsIndian Science Abstracts
Numerous studies have been reported in literature on the assessment of Indian scientific output using Science
Citation Index (SCI) or Science Citation Index Expanded (SCI-E). Both these databases have a poor coverage
of Indian science journals as compared to journals indexed by Indian Science Abstracts (ISA). To envision
a complete picture of Indian scientific output it becomes imperative to use a more comprehensive database
like ISA, which is more suitable to assess the Indian scientific output.
Data, from the web-edition of ISA for the years 2006, 2007 and 2008, covering all journals including those
that are published behind schedule were analyzed for distribution of output according to different agencies,
institutions and disciplines.
During 2006 ISA abstracted 18,224 articles from 445 journals published from India. These articles originated
from 3,439 institutions located in different parts of the country. Of these, most prolific 50 institutions contributed
4,508 (~ 25%) of the total output and the remaining 2,894 institutions contributed 13,716 (~75%) publications
(including individuals and anonymous authors).
Academic institutions (universities and colleges) are the major contributors (~35%) of the total output,
followed by output from State Agriculture Universities (18%) and medical colleges (17.5%). The remaining
output came from engineering colleges including IITs (4.9%), ICAR (6.7%), CSIR (2.8), State Government
institutions (1.7%), Ministry of Environment and Forests (1.2%), DST (1.2%) and DAE (1.0%), private
sector industrial R&D units (3.7%) and institutions under different economic ministries (1.7%). Contributions
from DRDO, ICMR, and DOS were less than 1%.
Medical science and veterinary medicine as well as agricultural sciences including forestry, animal husbandry
and fisheries each contributed about one-fourth of the total output. Thus, these two disciplines together
constitute about half of the total Indian output. Remaining half of the output is scattered among other 15
disciplines, among which chemistry, botany and engineering contributed more than 5% of the output.
Most prolific 41 journals published 34% of the total output. However, 119 journals account for 65% of the
total Indian output in ISA. These observations must be taken into account while formulating initiatives to
enhance the publication output of the Indian S&T system.
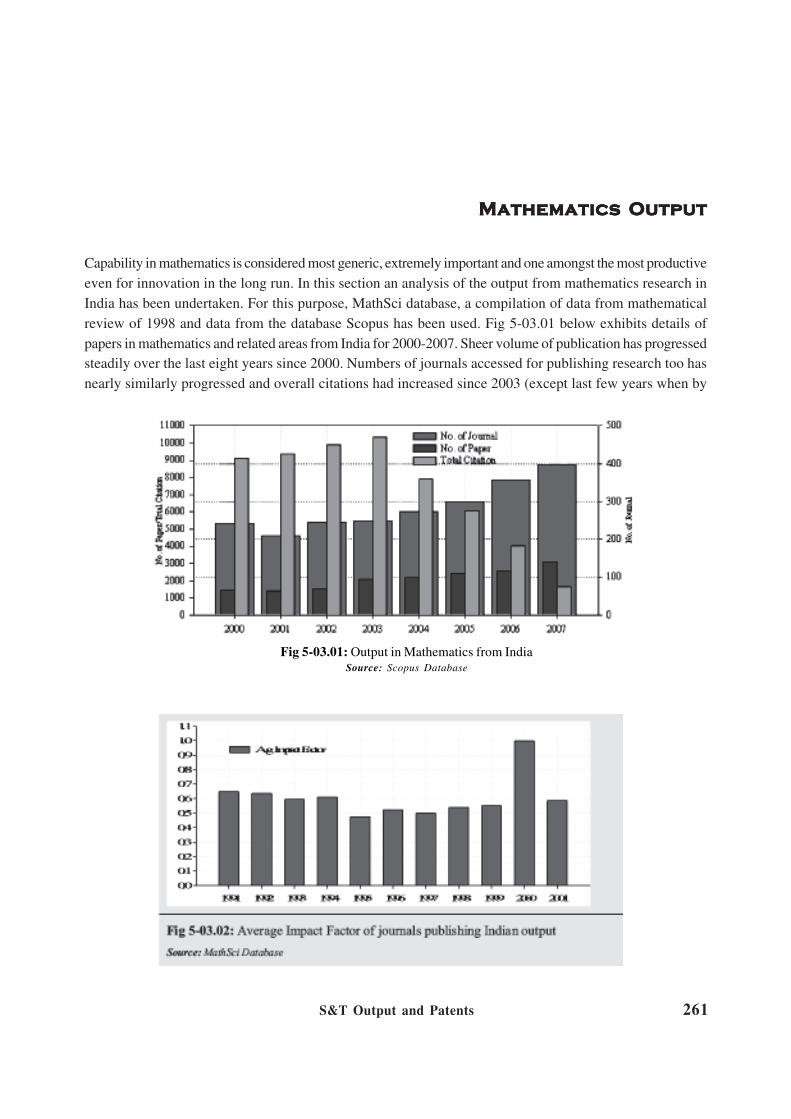
S&T Output and Patents 261
Mathematics OutputMathematics OutputMathematics OutputMathematics OutputMathematics Output
Capability in mathematics is considered most generic, extremely important and one amongst the most productive
even for innovation in the long run. In this section an analysis of the output from mathematics research in
India has been undertaken. For this purpose, MathSci database, a compilation of data from mathematical
review of 1998 and data from the database Scopus has been used. Fig 5-03.01 below exhibits details of
papers in mathematics and related areas from India for 2000-2007. Sheer volume of publication has progressed
steadily over the last eight years since 2000. Numbers of journals accessed for publishing research too has
nearly similarly progressed and overall citations had increased since 2003 (except last few years when by
Fig 5-03.01: Output in Mathematics from India
Source: Scopus Database

S&T Output and Patents262
definition citation data remained incomplete), the gross average of citation per paper failed to exhibit that
trend.
Fig 5-03.02 represents the average values of the IF’s of all journals in which Indian publications appeared in
that year as per the MathSci database.
Fig 5-03.03 takes a look at the possible relation between IF value of a journal and the number of papers that
it publishes from India. It shows clearly how both the journal-sets publishing only one, and publishing between
5 and 10 share rather similar values of IF over the decade of 1990. Possible irrelevance of IF could be the
answer. Fig 5-03.04 shows the distribution of papers over journals in which Indian contributions appeared in
1991, 1994, 1997 & 2001 along three categories – IF, non-IF and Indian, non-IF and international.
Output data of four years from MathSci shows a particular distribution of authorship across organizations.
Figure 5-03.05 captures this, showing that contributions from the IIT system constitutes more than half of
total. This distribution also captures the fact that a fairly large number of publications in mathematics
originate in organizations and research projects belonging to areas of engineering and biology. Mathematics
papers having received reviews in the four-year period subsequent to publications in journals also could be
considered to have higher qualities. Figure 5-03.06 shows organization-wise distribution of numbers of such
reviewed and therefore of higher quality papers. ISI occupies the most coveted position followed by the
TIFR.

S&T Output and Patents 263

S&T Output and Patents264
Global MalarGlobal MalarGlobal MalarGlobal MalarGlobal Malaria Via Via Via Via Vaccine Raccine Raccine Raccine Raccine Researesearesearesearesearccccch:h:h:h:h:
Reflections from PublicationReflections from PublicationReflections from PublicationReflections from PublicationReflections from Publication
The study evaluates malaria vaccine research carried out in different parts of the world during 1972-2004
using Pub Med (web edition) as a source of data. The study examines pattern of growth of the output, its
geographical distribution, profile of different countries in different sub-fields of malaria vaccine research and
pattern of citations using GOOGLE Scholar.
Malaria vaccine research constitutes about 9% of total malaria research output. The study indicates that a
total of 2,007 publications scattered in 352 journal titles originating from 40 different countries including India
were published on malaria vaccine. As expected, the number of publications was less in the first five blocks
i.e. 1972-1986, which started increasing during the later blocks and reached the peak in the year 1990-1992.
After a slight decline during 1993-1995 and 1996-1998, it started increasing again. The highest number of
publications was in the last block i.e. 2002-2004.
USA, UK and Australia together contributed more than half (~57%) of the total publication output. India
contributed only 4% of the total output. Publication activity has decreased in Switzerland and Sweden, but
has increased in Brazil, China, Japan and India. Total publication output 1972-2004 came from 420 institutions
scattered among 59 countries. However, most of these institutions were concentrated in the USA, the UK,
France and Australia. International Centre for Genetic Engineering and Biotechnology (ICGEB) of India
was one amongst the most prolific contributor.
Different countries concentrate their research efforts in different sub-disciplines of malaria vaccine research.
Development of asexual blood stage malaria vaccine has received more attention as compared to pre-
erythrocytic and transmission blocking malaria vaccine.
The pattern of citations of the research output indicates that 2,007 papers received 35,299 citations during
1972-2004. The average rate of citation is ~ 18. Of the 2,007 published papers, 264 (~13%) papers did not
get any citation and the rest 87 % got one or more citation. Of the cited papers, ~ 26% papers were cited 1
to 5 times and the rest 74% were cited more than 5 times. About 2% (36) papers received more than 100
citations.
The pattern of citation varies among different countries and most of the highly cited papers originated from
USA. Citation per paper is also highest for USA. However, most of the developed countries have less than
average value of citation per paper, which implies that their work is not quoted quite often. The value of RQI
is highest for Papua New Guinea followed by USA. Most of the prolific institutions are situated in the USA.
Among the prolific institutions John Radcliffe Hospital (UK) had the highest value of citation per paper,
while University of Edinburgh (UK) had the highest value for RQI. Citation per paper and incidence of high
quality papers for the USA, the UK, Papua New Guiana and Denmark are more than the average.
The results of the study may be taken into account while formulating policy for future malaria vaccine
research and for the control of malaria.

S&T Output and Patents 265
Profile of Indian Science JournalsProfile of Indian Science JournalsProfile of Indian Science JournalsProfile of Indian Science JournalsProfile of Indian Science Journals
This section presents the status of Indian science journals as reflected by their coverage in different data
sources such as Ulrich International periodical directory, SAARC directory of periodicals, journals subscribed
at National Science Library and journals indexed by Indian Science Abstracts. The list is not exhaustive as
many more titles still remain to be included in the database.
Scientific publication activity in India dates back to early 19th century. Fig 5-05.01 presents the data on the
growth pattern of the journals published from India prior to the year 1900 in blocks of ten years. In the initial
blocks, the number of periodicals published grew slowly; however, there was a sharp rise during 1951-1960,
which reached a peak in 1981-1990.
Highest numbers of periodicals
published in India are in the
discipline of medical and health
sciences (23%) followed by
agricultural sciences (20%). Share
of publications in other disciplines
are engineering and technology
(14%), life sciences (12%),
environmental sciences (6%),
physical and earth sciences (7%),
chemical and mathematical
sciences each 5%, and the rest are
in the category of general S&T,
psychology, information &
communication technology and energy.
S&T Output and Patents266
Most of these periodicals are published as monthly, quarterly, or half-yearly publications. Publications in
these three categories constitute about 75% of periodicals. Only miniscule portion of periodicals are published
weekly and fortnightly. Societies and associations publish the maximum number of periodicals. Private
publishers also contributed significantly to the publication of S&T periodicals.
ApprApprApprApprAppropropropropropriation and Viation and Viation and Viation and Viation and Value of Publications,alue of Publications,alue of Publications,alue of Publications,alue of Publications,
ttttthe Knohe Knohe Knohe Knohe Knowwwwwledgledgledgledgledge Assee Assee Assee Assee Assetststststs
The value of published papers as assets lies in size of the asset-class, herd-beliefs and herd-betting of
publishing population, and the presence of credible index journals which together make or unmake the value
of both a knowledge asset and a class of knowledge assets. Citation is an important indicator reflecting this
process of valuing. Higher citation to a paper increases the asset value, and the higher citations that all
papers receive in a journal increase the credibility of the journal.
The different types of knowledge institutions, say from the areas under the knowledge of biomedical-university
and hospitals are in general norm-following. The institution of organized research especially from the private
business does not follow norms in general. To take up cross-country comparisons, countries with organized
exchange mechanisms such as journals, editorial boards and the peer reviewers would be accessing more
assets generated in several other countries, while the others not having similar institutions of journal-based
exchanges would face difficulty in terms of higher costs of appropriation of knowledge assets as also in
accessing rights to prior arts.
Citation patterns to research assets generated in India, China, Singapore and Israel support this point when
we look at the knowledge asset classes of microbiology for India and China, and bioinformatics for all four
countries and nano (including nanotechnology, nanomaterial and nanoparticle) for India, China and Israel
(Fig 5-07.01).
India does not publish global journals of high standing, and as appears Indian publications cite Indian papers
less and are in turn cited lesser, compared to China. China very actively cites domestic publications and is
accepted as more worthy of citations by all countries in these areas.
Average citation for a single paper from China though is comparable to what on average an Indian paper
would receive. Citations that a Chinese paper receives from several countries are also closely linked with
the large number of inter-country collaborative researches going on in China. Reading these together, one
gathers that China has been able to organize its research-assets production and valuation more intensively
than accomplished by India.

S&T Output and Patents 267
Citation and capability to appropriate valuation also depends on the country’s capacity. One measure of
capacity is the access to journals by the publishing/researchers community. The fig 5-07.02 exhibits this
dimension through the Lorenz curve estimation of the distribution of citation patterns and hence access
across publishing cities from India. No wonder, the skewed up right side of the curve evidences metropolitan
cities of Bangalore, Chennai, Delhi, Pune, Mumbai, Calcutta and a few large other cities.
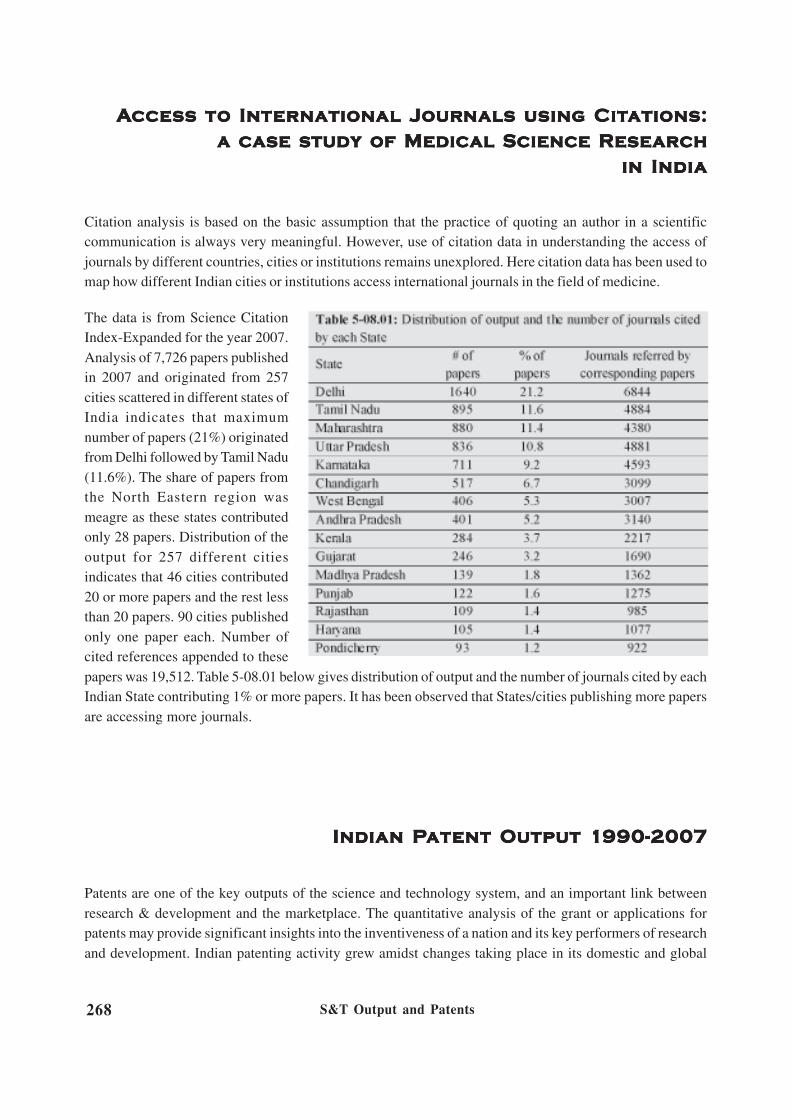
S&T Output and Patents268
AAAAAccess tccess tccess tccess tccess to Into Into Into Into Intererererernational Journational Journational Journational Journational Journals using Citnals using Citnals using Citnals using Citnals using Citations:ations:ations:ations:ations:
a case study of Medical Science Researcha case study of Medical Science Researcha case study of Medical Science Researcha case study of Medical Science Researcha case study of Medical Science Research
in Indiain Indiain Indiain Indiain India
Citation analysis is based on the basic assumption that the practice of quoting an author in a scientific
communication is always very meaningful. However, use of citation data in understanding the access of
journals by different countries, cities or institutions remains unexplored. Here citation data has been used to
map how different Indian cities or institutions access international journals in the field of medicine.
The data is from Science Citation
Index-Expanded for the year 2007.
Analysis of 7,726 papers published
in 2007 and originated from 257
cities scattered in different states of
India indicates that maximum
number of papers (21%) originated
from Delhi followed by Tamil Nadu
(11.6%). The share of papers from
the North Eastern region was
meagre as these states contributed
only 28 papers. Distribution of the
output for 257 different cities
indicates that 46 cities contributed
20 or more papers and the rest less
than 20 papers. 90 cities published
only one paper each. Number of
cited references appended to these
papers was 19,512. Table 5-08.01 below gives distribution of output and the number of journals cited by each
Indian State contributing 1% or more papers. It has been observed that States/cities publishing more papers
are accessing more journals.
Indian PIndian PIndian PIndian PIndian Patatatatatent Oent Oent Oent Oent Output 1utput 1utput 1utput 1utput 1990-200990-200990-200990-200990-20077777
Patents are one of the key outputs of the science and technology system, and an important link between
research & development and the marketplace. The quantitative analysis of the grant or applications for
patents may provide significant insights into the inventiveness of a nation and its key performers of research
and development. Indian patenting activity grew amidst changes taking place in its domestic and global

S&T Output and Patents 269
economic policy environment. The
twin objectives of the post-1991
economic reforms of the
Government of India were to
promote competition and
simultaneously increase the ability
of producers to meet such
competition, by removing policy
barriers and distortions. The
Government of India launched a
national campaign for creating
awareness about patents and
intellectual property rights (IPR)
in the country in 1995 which may have impacted the generation of patents by R&D institutions in the
country.
The data for analyzing the Indian patent output was extracted from the patent collections of United States
Patent Office – granted patents, European Patent Office – granted patents, German patents granted, Patent
Abstracts of Japan – unexamined patent applications, WIPO.
PCT publications and INPADOC patent collections (granted or filed) covering data from 42 different countries
including India. The Delphion patent database (https://www.delphion.com/) was used and a search was
made to obtain patents owned by Indian assignees for the period 1990 to 2007. The Delphion database
included data of patents granted by India to Indian assignees, up to 2004 only. This data for the period 2005–
2007 was taken from the website of Indian Patent Office which included the data on patents granted by
India. The data was cleaned and analyzed. Fig 5-09.01 gives the pattern of growth of Indian patenting output.
Salient Highlights of the Findings
• The spurt in growth of the Indian patent output may be directly attributed to Indian industry’s growing
inventiveness and competitiveness, as its share in patenting grew from about 40% patents in 1990-
1999 to around 60% patents in 2000–2007.
• The leading assignees from the domestic private sector include mostly firms belonging to the drugs and
pharmaceuticals sector, which together obtained more than 3,600 patents during 2000-2007 as against
just around 100 patents during 1990-1999 indicating a direct response of the Indian pharmaceuticals
industry to the global challenge and competition in the field.
• Indian firms have increasingly been penetrating foreign markets and taking patents abroad since the
initiation of economic reforms in early 1990s. The number of countries in which Indian firms have
sought patents rose from 29 countries in 1990-1994 to 52 countries in 2000-2004 – a growth of 79%;
and another 49 countries in the following three year period 2005-2007. The Indian assignees had
maximum interest in protecting their inventions in North America, viz. USA and Canada till 2000-2004,
after which their patenting activity expanded significantly in Europe, Asia and Latin America
(Fig 5-09.02).

S&T Output and Patents270
• The Council of Scientific and Industrial Research pioneered the Indian patenting activity during 1990-
2007 and is the leading patent assignee with more than four thousand patents to its credit during this
period. Many other government S&T departments and institutions increased their patenting activity
particularly after 2000. These include Defence Research and Development Organization, Department
of Biotechnology, Department of Science and Technology, National Institute of Immunology, Sree
Chitra Tirunal Institute for Medical Science & Technology, Jawaharlal Nehru Centre for Advanced
Scientific Research, Centre for DNA Fingerprinting and Diagnostics, and the Department of Atomic
Energy.
• Indian patent output is significantly high in the areas of chemistry, chemical technology and related
areas, and drugs and pharmaceuticals. Indian patenting activity also established itself in newer areas
like food products and technology, micro-organism and genetic engineering, information and
communication technologies including computer and automated business equipment, optical computing
devices, electrical digital data processing and telecommunication.
• Of the total patents obtained by Indian assignees during 1990-2007, about 15% patents were jointly
owned by performers in industry, university or government sectors. The joint ownership of patents
between government institutions shows an increase, while that between universities it is almost negligible.
Foreign firms have played a positive role in the growth of Indian patenting activity wherein their joint
patents with domestic Indian firms, as well as with their affiliates, have increased significantly during
the period.
• The overall pattern of citations received by Indian patents during 1990 to 2007 indicates that of the total
2,132 patents, 764 patents (36%) received one or more citations, indicating their high value and continued
technological significance. There were 179 patents (23% of the total) that received 1,494 citations
(49% of the total), while the remaining 585 patents (76% of 764) received 1,076 citations (35% of the
total).

S&T Output and Patents 271
Indian Publications and PIndian Publications and PIndian Publications and PIndian Publications and PIndian Publications and Patatatatatents Output inents Output inents Output inents Output inents Output in
Information and Communication TechnologyInformation and Communication TechnologyInformation and Communication TechnologyInformation and Communication TechnologyInformation and Communication Technology
Information and Communication Technology (ICT) is one of the vibrant sectors of the economy, which plays
significant role in promoting economic growth, expanding economic opportunities and providing employment.
The industry displays considerable variations in terms of technological development and performance. Here
an analysis of the Indian contributions in the field of ICT as reflected in terms of the publications and patents
output is presented. The source of data is the Scopus database (http://www.scopus.com) and on patents it
is Delphion patent database (http://www.delphion.com), searches made using keywords and other relevant
features. A set of 4,438 publications data and a set of 742 patents were taken for the purpose of present
analysis.
Growth in Publications
The Indian publication activity in the field of Information and Communication Technology (ICT) grew slowly
during 1990 to 2001 and gradually picked up, thereafter, during 2002–2006 and showed a significant rise
during 2007. The highly productive areas of Indian publications in the field of ICT include communication
systems, cyber security systems and network management; while its core strengths as indicated by patenting
activity are in the areas of digital computing devices, transmission of digital information, computing, calculating
and counting. The most productive academic institutions that have published nearly nine hundred publications
(20% of the total) include Indian Institutes of Technology (Delhi, Kharagpur, Kanpur, Bombay, Roorkee,
Chennai and Guwahati) and Indian Institute of Science. Government institutions and the firms in the industry
have also made publications in the field. Indian authors have joint publications with authors from foreign
academic or industrial firms.
Growth in Patenting
The Indian patenting activity in the field of ICT has also grown slowly since 1990, but indicates a sudden
spurt in growth during 2002-2007. The major contributions to patents (40% of the total) have come from
domestic Indian industries that include key players like Vaman Technologies, Sasken Communication
Technologies, Tata Consultancy Services Ltd., Reliance Infocomm and Satyam Computer services Ltd. The
analysis of publication and patenting activity indicates the growing Indian R&D and technological capacity in
the field of ICT. Industrial firms have also made contributions to the field of ICT through publications, but
they are more active in patenting activity.
Indian Publications and PIndian Publications and PIndian Publications and PIndian Publications and PIndian Publications and Patatatatatents Output inents Output inents Output inents Output inents Output in
NanotechnologyNanotechnologyNanotechnologyNanotechnologyNanotechnology
The creation of R&D capacity for the development of new technologies and products in the field of
nanotechnology are of key importance for a developing country like India. India launched its national

S&T Output and Patents272
nanotechnology initiative in 2001. Indian contributions in the field of nanotechnology as reflected in publications
and patents output is analysed here based upon data on publications from Scopus database (http://
www.scopus.com) and data on patents from the Delphion database (http://www.delphion.com). A set of
11,000 publications were taken for analysis. Counting the contribution of each author as one publication, the
total number of publications rose to nearly 21,000, implying multiple contributions from a single institute. A
set of 167 patents was taken for analysis.
Salient Results
Growth in publications: The rate of growth of Indian publications in the field of nanotechnology is much
higher during 1998-2007 in comparison to that of 1990-1997 (Fig 5-11.01). The analysis indicates that publication
activity accelerated after the launch of the national nanotechnology initiative in 2001. Major contributions to
these 21,000 publications, nearly 48% of the total, have come from the academia; 28% from government
R&D institutions; and 1.3% by industrial firms. Of the share of industrial firms, nearly 80% is contributed by
domestic firms and 20% by foreign firms operating in India. Foreign academic institutions contribute/collaborate
in nearly 22% of these publications.
The highly productive
academic institutions in the
field of nanotechnology
include Indian Institutes of
Technology (Kharagpur,
Kanpur, Delhi, Mumbai,
Chennai, Roorkee, and
Guwahati), Indian Institute of
Science, Tata Institute of
Fundamental Research,
Jadavpur University,
University of Delhi, and
University of Pune. Of the
government institutions, the
most productive contributions
have come from Bhaba Atomic Research Centre, Indian Association for the Cultivation of Science, Indira
Gandhi Centre for Advanced Research, Kalpakkam, Saha Institute of Nuclear Physics, and the Centre for
Materials for Electronics Technology. Productive contributions have also come from the Laboratories of
CSIR that include National Chemical Laboratory, National Physical Laboratory, National Institute for
Interdisciplinary Science and Technology (formerly Regional Research Laboratory, Trivandrum), Indian
Institute of Chemical Technology, National Metallurgical Laboratory, and Central Electrochemical Research
Institute.
Growth in patenting: The growth of patenting activity in the field of nanotechnology by Indian inventors
indicates that the intensity of patenting grew slowly during 1990 to 2000 but rose suddenly during 2001 to
2007; almost exponentially. Of the total 167 patents, 64 patents (39% of the total patents) are owned by the
government institutions, 45 patents (27% of the total) by firms in the industry, and 10 patents (6% of the
total) by academic institutions. There are 37 patents (22% of the total) that are owned by individual inventors.

S&T Output and Patents 273
The major technological areas of patenting in the field of nanotechnology include its applications related to
drugs and pharmaceuticals, chemical sciences and technologies e.g. catalysis, colloid chemistry, separation
and non-metallic elements and materials, analyzing materials by determining their chemical or physical
properties and methods/filters implantable into blood vessels.
The analysis indicates growing Indian competence in the field of nanotechnology, particularly since 2001
onwards. There is significantly more number of publications than patents. The academic institutions have
made significant contribution in terms of publications. In contrast they have limited patenting activity. Although
firms from industry have been active in taking patents, there is almost negligible publication activity by them.
In an emerging field like nanoscience and nanotechnology, competence in basic research plays a significant
role in developing new technologies. Therefore, it is essential for the firms in the industry to develop basic
research capacity and contribute more towards publications. The analysis indicates that institutions in each
of the sectors of academia, government and industry should complement their R&D capacity and technological
strengths by enhancing greater collaboration amongst them.
Indian PIndian PIndian PIndian PIndian Patatatatatents in Bioents in Bioents in Bioents in Bioents in Biotttttececececechnologyhnologyhnologyhnologyhnology
Indian patenting in biotechnology (BT) is exhibited here through analyses of data from the Indian Patent
Office journal 2001-07, falling under IPC codes pertaining to BT as per OECD, 2004. The data for 2004 was
not available.
Salient Features
1. No. of Patents filed, published and granted in all fields have increased continuously during 2001-07
(Table5-12.01)
2. Among fields related to Biotechnology there is no
general increase in food patents, unlike the scenario
for chemicals and drugs. (Table 5-12.02)
3. The proportion of biotech patents in all patents
published is < 3%. There is an increase in the number
of BT patents during 01-07. But increase of Indian
component is not significant (Fig 5-12.01).

S&T Output and Patents274
Number of domestic patents
in BT has increased from 126
during 2001-03 to 181 during
2005-07. The BT patents by
domestic applicants were ~ 3
times more than patents by
foreign applicants during
2001-03. The trend reversed
during 2005-07, during which
BT patents by Indians formed
only 12% of all patents. This
drastic change in the
proportion of Indian compared
to foreign patents in BT can
be seen in Table 5-12.03.
4. The Number of
c o u n t r i e s
contributing has
increased over the
years during 2001-
07. This fact
explains the
increase in number
of patents during
this period to a
limited extent
(Fig 5-12.02).
5. Major countries applying for Indian BT patents were led by USA. India occupies 2nd position. These
two were followed by Germany, UK, Denmark, Switzerland and Netherlands.
Nature of Applicants for Indian BT Patents
Basically three types of institutions apply for patents in biotechnology: universities & public research institutions,
private (profit oriented) companies, and non-profit organizations & research foundations. Their behavior,
during the period 2001-2007, can be observed in Table 5-12.04.
6. The contribution of public vs. private institutions among Indian and foreign applicants for 2001-07, is
given below:

S&T Output and Patents 275
• Indian Public:Private: 68:32
• Foreign Public:Private: 12:8
Of the total patents, 77% come from the private applicants, while public research institutions contribute
a mere 19%. Remaining 4% patents are applied for by individuals and nonprofit organizations.
The countries
that contribute
in a big way
together have
a share of
80% of all
p a t e n t s
published in
BT during the
period under
study. Of
these, top five
c o u n t r i e s
(USA, India,
Germany, UK
and Denmark)
have 73%
contribution. When the contributions from Switzerland and the Netherlands are added to the contribution
by the top five countries, 81% of patents in BT are covered (Fig 5-12.03).
7. During 2001-07 the largest and consistent contributor from India is CSIR. The trend of Indian applicants
is presented in Fig 5-12.01. There is an increase in the number of applicants from India in this period.
Increased interest of Indian companies in going for patents becomes evident when figures for 2005-07
are compared to those for 2001-03 (Fig 5-12.04).

S&T Output and Patents276
Focus of Indian Biotech Patents
8. Codes based distribution of patents published during 2001-07 show that there is an increase in the
number of patents that come under the IPC codes A61K. The codes C07K, C12Q have made significant
and consistent appearance in the period 2005-07. This would mean that production related patents
have increased in 2005-07. This corroborates with the observation that during this period more private
industry applicants have applied for patents with Indian Patent Office (Fig 5-12.05).
9. Based on the major codes of IPC relevant for Biotechnology we find that the focus is more in A61K,
C07K, C12N and C12Q. There is a slight shift in the focus from 90’s during 2000’s; A61K which was

S&T Output and Patents 277
very prominent and the only prominent specialization of focus during the 90’s has become less prominent
during 2000 and its place is occupied by C12N, C12Q and C07K (Fig 5-12.05).
10. Focus in terms of applications in various areas like agriculture, industrial enzymes, healthcare and
environment during 90’s and 2000 has shown that environmental BT patents (C20F) are very few and
the importance given has not changed in the two periods. Health care BT patents, indicated by A61K,
C07K, C12N, C12Q and G01N have been in focus. Though there is a change in their
performance, between them and during 90’s and 2000’s – prominence of codes C12N, C12Q, C12M,
C12S indicate
focus on
Industrial BT
i n v o l v i n g
enzymes. Of
these C12S
could also
i n d i c a t e
h e a l t h c a r e
r e l a t e d
products; focus
on this area
has also
i n c r e a s e d
nominally. The
c o d e s
indicating AO1H, agriculture process of obtaining new plants and modifying genotypes have not increased
from the 90’s (Fig 5-12.06).
11. From this trend it appears, Indian institutions as well as foreign applicants feel that there is a larger
opportunity for health care BT related patents to be worked in India compared to industrial BT or Agri-
biotechnology. Environmental Biotechnology does not seem to be in focus of applicants from India or
abroad.
Conclusion
Patenting activity in India in BT has increased from 90’s and significant increase in the number of patents
has been observed during 05-07. Patenting activity by a number of countries from outside India plays a
dominant role, accounting for ~70% of BT patents. Then there is an increasing patent activity by Indian
private sector as well. Significant increase in number of institutions both private and public from foreign
countries has also been observed. The focus of patenting activity seems to be healthcare, followed by
Industrial enzymes. Low level patenting activity is observed in the area of agriculture and environment.

S&T Output and Patents278
SSSSStrtrtrtrtratatatatategic Wegic Wegic Wegic Wegic Worororororttttth of Ph of Ph of Ph of Ph of Patatatatatentingentingentingentingenting
Citation reflects the strength of herding and organized betting. This increases value of assets. Therefore
citation can be considered as dummy of strategic worth or value of an asset. Patent portfolio strategy is also
captured through citations. This value becomes more important when we consider patents in lieu of research
publications. Further, strategic worth of patents that reflects rights to excludability is often more significant
than the licensing values.
Data from USPTO on Indian patents in USA in areas such as protein, polymer, drugs and similar others
since 1976 (up to 2004) were considered. We looked for citations to patents in patent applications by Indian
organizations and individuals.
Some Observations
• Nearly 80% Indian patents did not cite
any other Indian patents, and then only
a handful cited Indian patents alone.
Such absence shows that there are
little or no relations between patents
filed by even the same organization
(Fig 5-13.01).
• Significant numbers of these
organizations are private and corporate.
• The explanation for this may be due to
the fact that prior arts from India did
not have any relevance. Assets in an
Indian undertaking failed to garner the
minimally required domestic mass
behind it and failing that the value of
patents, very similar to the fate of
research papers, nose-dived.
• Indian patents appear to have little worth
for litigation and turf-protection.
• Only patents from drugs-
pharmaceuticals sector received any
citations, and out of such 225 drug
patents only 30 had positive values of
SI (Fig 5-13.02).
Conclusion: In this context, absence of citations to any Indian patents from any other country for such a
large group of Indian patents definitely raises doubt on the market worth or strategic worth. It appears that
prior art from India does not evoke responses from patents being filed later. These assets therefore fail to
attain value because of the absence of herd betting.

S&T for Rural India and Inclusive Growth 279
S&T for Rural India and Inclusive Growth
Overview
S&T perhaps can empower best the poor most of whom stay in rural India. Such a dimension of S&T is
likely to demand radical departures from the contemporary modes of organizing sciences and technologies,
including even their contents. A crucial aspect enabling this departure would be how S&T integrates with
and remains answerable to or is governed by the rural people of poor disposition. The urban-based supply
side and linear approach (from the concept to technology use) to pushing S&T - needs a serious relooking.
S&T research problems formulation and technological solutions are currently organized around the industrial
model. The supportive institutions of law, banking and regulations, including that of the executive, have been
designed primarily for volume-based energy and materials intensive, low-employing and often unsustainable
economically and environmentally, modes of high-growth production. Such production modes when simply
scaled down for rural production, especially of manufacturing types, bring about breaks in the integrated
living of rural communities. Life in rural India as it is elsewhere has an integrative approach to the agricultural
and other than agricultural modes of wealth creation. This latter is our focus. Prosperity in India can come
primarily from rural capacities and capabilities to manufacture, value add, innovate and remain sustained
with agricultural production. The new role of S&T to empower rural poor could be addressed, in the immediate,
by focusing on non-farm earth resources sustaining modes of production.
Innovation, to recall, is a mode of redistribution. Innovation redistributes assets, capacities, capabilities,
earnings and consumptions. Empowering rural poor through manufacturing within rural areas could thus be
brought about only by innovation, however, of a variety that is very different from the high growth oriented
often unsustainable and high resource-consuming as well as waste generating modes of innovation. Most of
our institutions including of the S&T have been designed for the latter variety of innovation. Therefore, in
order for S&T to be innovative for rural living – institutions and structures of not only S&T but others as
well, need restructuring and refocusing. Over the last six decades the democratic governance system of the
country has created a very large number of structures and institutions whose original purpose very often
was to address the innovation befitting rural India. However, the agenda capturing power of the dominant
urban institutions appears to have taken over much of the original intent and today S&T for rural manufacturing
has virtually been reduced to a subset.
S&T for the rural non-farm sector requires most immediate attention. Such a refocus could target amongst
others creation and sustenance of assets, capacities and capabilities; in particular the ‘concentric circles’
model of Mahatma Gandhi would inform us that refocused S&T and institutions could especially address
inter-rural markets for expansion and commerce. A moot question would be around coordination and
governance. The country has a very large S&T infrastructure devoted to rural areas; change in coordination

S&T for Rural India and Inclusive Growth280
and governance with special emphases on local government could bring about miracles. The great resources
of diversity, earth resources, knowledge and skills that rural India possess could thus be greatly enhanced
through innovations in and brought about by S&T. This theme has been partially explored by looking into
several facets of potential areas where S&T could bring very important changes in the lives, health and
economics of the rural Indian.
Rural development in India has evidenced several changes over the years in its emphasis, approaches,
strategies and programmes with a view to improving the socio-economic conditions of the people: in providing
good infrastructural facilities, support services and employment opportunities. Many organizations of the
government like Khadi and Village Industries Commission (KVIC), Council for Advancement of People’s
Action and Rural Technology (CAPART), National Institute of Rural Development (NIRD), Department of
Science and Technology (DST), National Research Development Corporation (NRDC), Council of Scientific
and Industrial Research (CSIR) and Indian Council of Agricultural Research (ICAR) support the generation
and promotion of appropriate technologies under various schemes. In addition, engineering based educational
institutions, state government organizations, non-government organizations, voluntary agencies and private
establishments augment these efforts. In spite of the advances made, there still remains much to be done to
bring prosperity in the lives of the people in the rural areas, thus ending the so-called divide between Bharat
and India.
In the present theme, an attempt is made to document briefly the approaches and strategies adopted by the
government in the field of rural development, the recent trends and the programmes implemented under the
restructured departments of Ministry of Rural Development. The scope of non-farm activities in rural areas
is huge and can effectively be exploited as potent stimulator for economic growth. A short review of the
rural non-farm sector (RNFS) has been made focusing briefly on the structure, growth and trends in
employment and income generation. Management and distribution of safe drinking water are essential and
critical for better livelihood. Power is a key requirement in rural areas, for agricultural as well as non-
agricultural and domestic uses. Technology is now capable of providing reliable power at comparatively low
cost in a decentralized manner. It needs to be upgraded and scaled-up in a big way with emphasis on
renewable and non-polluting technologies. Deployment of technologies for post-harvest processing, cold
storage and cold-chains for transportation to market and other means of adding value are required to enhance
rural employment and incomes. In this theme, various issues in the field of rural development like shelter,
food grains, sanitation, energy, medicine, post harvest management, livestock mixed farming system, bio-
pesticides and genetically modified crops etc have been discussed. In addition to this some sectors like
fisheries, mushroom culture, horticulture and sericulture were identified as ideal and potential avenues for
socio-economic development of the rural communities. The role of information technology in agriculture
marketing i.e. in providing information related to commodity prices, transportation, agricultural practices,
weather, etc. to the farmer has also been discussed. The scope for application of Geospatial information
technologies for rural development, strategies for alleviation of rural poverty, a review of the use of tools and
modern implements, an appraisal of rural artisans, of the mechanisms and standards for developing and
fixing food standards and a proposal for an agricultural innovation policy are some other things that the
theme explores.
The full text of these extended summaries is available at http:www.nistads.res.in

S&T for Rural India and Inclusive Growth 281
Science and Technology for Rural Development:Science and Technology for Rural Development:Science and Technology for Rural Development:Science and Technology for Rural Development:Science and Technology for Rural Development:
a synergy approacha synergy approacha synergy approacha synergy approacha synergy approach
Presently in India, around 58% of the work force and nearly 70% of the population still continues to depend
on agriculture and allied sectors. However, share of agriculture and allied sectors in GDP has declined from
24.02% in 2000-01 to 18.6% in the current year. This reflects a huge divide in rural and urban incomes,
social and physical infrastructure, quality of life, and consequently in human capabilities and entitlements. In
fact, the rural economy in India has been contending with a complex set of adverse factors like poor
infrastructure, insufficient capital and investment, inadequate farm infrastructure and limited access to
information, health, education and markets etc. Although some developmental initiatives under ‘Bharat Nirman’
and ‘PM’s Gram Sadak Yojna’ and in Health, Education and Agriculture do facilitate greater access to
markets and inputs, by upgrading capabilities of the rural people, there is however, still a big gap to be bridged
in order to wipe out developmental imbalances between rural and urban economy. Therefore, it is imperative
to look into the present pattern of rural technology development, its systemic deficiencies and the factors for
poor dissemination of technologies with a view to putting in place a reformed S&T system for rural development,
ensuring full participation of stakeholders in the technology development process. We undertake a short
appraisal, and it contains suggestions, for re-structuring the system of technology development and dissemination.
Problems in Technology Dissemination
• S&T System is central government driven, as practically all major institutions for S&T education,
research and training are funded and managed by the central government, with little S&T capacity in
the states, both at the departmental and state university levels.

S&T for Rural India and Inclusive Growth282
• Scientific Research is taken up by the Central S&T system on its own volition and priorities. Therefore,
few local research-needs are identified and consequently, development of technology solutions is not
really demand driven due to near absence of interface with the states.
• State S&T Councils are mostly ineffective except in a few states such as Madhya Pradesh, Uttarakhand,
Tamil Nadu and Karnataka. They are not geared to integrate S&T system into the development activities
and to create state or region specific S&T capability, which is so vital for a country of India’s size &
diversity.
• A kind of central technology dependency syndrome is prevailing because the line departments of the
states implement only those technologies which are sponsored and built into the Plan/Central Sector/
CSS or externally assisted programmes and lean on the central nodal ministries for technology assistance.
• Various coordination committees at the district level deal with sectoral implementation issues and not
technological issues and do not add up to a District level S&T forum capable of taking a view on
technology gaps and needs of the District in a comprehensive manner.
• The University system in states has long ceased to be providers of technologies or partners in
development; societal S&T capacity at the district level and below at the community level is virtually
absent primarily because the civil society has been weak in S&T and has not forged a partnership with
S&T institutions located in the state except in few areas.
• Centrally funded agencies like the District Rural Development Agencies (DRDA) set up in every
district for carrying out poverty alleviation programmes have not been provided with S&T back up to
look into the technology aspects of anti-poverty programmes.
Suggested Approach (A Framework of Synergistic Mechanism)
• The S&T Council should be restructured to function as the Science and Technology Advisory Group
(STAG) responsible for integrating S&T inputs from all S&T institutions located in the state, by making
them partners in development. The activities of the partnership mode may include identifying technologies
already developed for dissemination and prioritizing research work with emphasis on problems emerging
from the field.
• Technological empowerment of the communities to assess their problems and participate in the process
of choosing of technologies. For this, a consultative Group of Local S&T institutions comprising of
concerned department officials and S&T capable NGOs may be formed by the collector with the
involvement of PRI’s; one of the S&T institutions may be selected as the nodal agency.
• In line with the concept of Mother NGO, a NGO may be selected to conduct survey of S&T needs and
technology gaps sector wise, especially non-farm sector and identify areas for entrepreneurship
development; assess need for field trials and adaptive research; select field NGO’s who could be
trained and supported to develop competency in S&T intervention and to act as incubators for enterprise
growth; arrange training for NGO partners in project activities in the area; collaborate with the nodal
S&T Institutions and to act as a clearing house for rural technology related information and also with
NABARD and institutional financial agencies; mobilize expertise from the state S&T system including
Universities on consultancy basis for S&T intervention and to provide S&T support to District Plan.

S&T for Rural India and Inclusive Growth 283
• The consultative body with three wings like Nodal S&T Agency, Local Department and Lead S&T
capable NGO backed by a network of field S&T NGO’s may emerge as Technology Coordination and
Action Group (TCAG); to serve as a Scientific Advisory Body to the Collector and the Zilla Parishad.
The incremental non-recurring and recurring costs in setting up TCAG in the District may be supported
financially by the state DST and a local official of DST may be nominated as Member Secretary.
• Technology Coordination and Action Group (TCAG) may be registered as a society to give it the
necessary authority and flexibility with a broad charter so that it could lead all S&T interventions and
bring the departments, S&T institutions and the committees under one forum, which does not exist at
present.
The institutional reform proposed here would be a means towards achieving the national goal of
“harnessing S&T for improvement of livelihood, employment generation, environment prediction and
ecological security” (Tenth Plan Document). Our S&T system is not, as the cliché goes, a giant with a
feet of clay, but is rather like giant with a strong feet but suffering from weak joints which could be
remedied to enable it to take India on a ‘peoples’ science based development path.
NNNNNon-Fon-Fon-Fon-Fon-Farararararm Occupation in Rm Occupation in Rm Occupation in Rm Occupation in Rm Occupation in Rururururural Indiaal Indiaal Indiaal Indiaal India
Rural non-farm economy in recent times is considered as an effectual strategy for decentralization of
economic activities to rural India. Rural-Non-Farm-Sector (RNFS) includes all economic activities viz.,
household and non-household manufacturing, handicrafts, processing, repairs, construction, mining and
quarrying, transport, trade, communication, community and personal services etc. in rural areas. The Economic
Census of India estimates that around 41.89 million of rural people are employed in non-agricultural
establishments, which registered a growth rate of 4.56 % during 1998-2005 (Table 6-02.01). This section

S&T for Rural India and Inclusive Growth284
reviews the strengths and weaknesses of the rural-non-farm-sector in India, analyzing the structure and
growth of rural-non-farm-sector and potentiality of the sector towards employment and income generation,
to arrive at certain inferences like formulation of possible approaches with a view to promote rural-non-
farm-sector as a self-sustaining entity in the changing competitive environment.
Structure and
growth of rural-
non-farm-sector:
The non-agricultural
e s t a b l i s h m e n t s
accounted 19.83
million in the rural
area. Out of 19.83
million, 13.26 million
(66.89%) were own
a c c o u n t
establishments and
remaining 6.56
million (33.11%)
were establishments
with hired workers.
Retail trade
(39.28%) was the dominant activity followed by manufacturing (26.02%) and other community, social and
personal services (8.15%) of the non-farm establishments (Fig 6-02.01).
Trends of
n o n - f a r m
employment
and income:
There were
41.89 million
p e o p l e
working in
n o n -
agr icul tura l
establishments
( E c o n o m i c
Census of
India, 2005).
Of these,
17.30 million
persons (41.30%) were employed in own account establishments and the remaining 24.59 million (58.70%)
in establishments with hired workers. Female workers constituted 21.96% of total employment in rural non-
farm sectors and proportion of female employment was found comparatively higher (24.32%) in establishments

S&T for Rural India and Inclusive Growth 285
with hired workers than own account establishments (18.59%). A trend in employment status of rural labour
in India is presented in Fig 6-02.02.
Labour force growth and employment requirements: The labour force projected to increase by 40.02
million in special group and 55.82 million in working age group (15+) during the period of 2007-12 implies the
need for an increase in the pace of creation of additional work opportunities commensurate with the growth
of labour force (Table 6-02.02). Unemployment is estimated at 21.15 million, 5.11% of the total population
(Table 6-02.03). To achieve full employment by 2011-12, it is estimated that employment should grow at
2.7% per annum based on the proposed policy and programmes in the Tenth Plans. This would require GDP
to grow at 8% per annum.
Quality of employment: Surveys revealed
substantial increase of illiterates among the
unemployed persons (Table 6-02.04). Over the
period of 1993-2005, the proportion of those with
educational level up to primary among the
unemployed increased from 1.9-3.0% and 2.6-
3.1% in case of male and female respectively,
while unemployment decreased from 8.3 to
6.5% among those at secondary school or higher
educational level and increased from 9.8 to 18.2% in case of females.
Non-farm activities are
either detrimental to keep
the poor falling into deeper
poverty or advantageous to
lift the poor above the
poverty line. Keeping this in
view, it becomes imperative
to identify the strengths and
weaknesses of the non-farm
sector in India to focus on, in order to alleviate poverty.
Strengths
Institutional basis: In India, the institutions underlying the development of the rural non-farm sector are
very strong. These include secure property rights; a well-developed financial system with preferential access
to credit for the sector; supporting institutions such as the KVIC, State Khadi Board, NHHDC, Small
Industries Development Bank of India (SIDBI), State industrial corporations; policies and programs promoting
linkages with agriculture, especially agro-industries; domestic marketing channels for rural non-farm production;
as well as government support in export promotion.
Decentralization process: Over the last two decades the State governments in India have been able to
exercise far more independence in decision-making than in the pre-1980 period. Regional parties are an

S&T for Rural India and Inclusive Growth286
integral part in coalition governments at the Centre. In turn, they have negotiated economic autonomy in the
formation of state specific policies for development.
Weaknesses
Infrastructure: The most significant bottleneck in generating higher levels of rural non-farm activity in India
is the quantity, quality and reliability of infrastructure. Power outages appear to be one of the most serious
obstacles to the development of the non-farm sector.
Regulatory restrictions: Regulation of the small-scale sector constitutes an important aspect of non-farm
development policy in India. In the initial stages, capital investment restrictions were imposed to protect the
small-scale sector, especially in rural areas, from predation by large industry. Reservation of products for the
sector was initiated to create a domestic market and quantitative restrictions imposed to protect them from
competition from imports. At the end of the 1990s, however, these very policies have become detrimental to
the dynamism of the small-scale sector, especially in the rural areas. Capital investment limits have discouraged
economies of scale, and concessions offered to small industry have created adverse incentives against re-
investment.
Quality of manpower: High levels of illiteracy in rural India have hampered the growth of the rural non-
farm sector. In the rural areas, lack of education leads to labour being stagnant in agriculture, or moving to
casual work occupations in the non-farm sector, and not to salaried employment with higher wages and
benefits. Together with lack of technical skills, there is little incentive for rural forms to invest in technology,
leading to low levels of labour productivity in the rural manufacturing sector compared to urban manufacturing.
Forward and backward linkages: Absence of appropriate forward and backward integration greatly
affects performance of non-farm activities in rural areas. In case of forward linkages, the RNFS serve as
inputs to other sectors, whereas in backward linkages the RNF sector demands the outputs of other sectors.
Gaps in the integration of the production linkages brought about by poor infrastructure, low accessibility of
market, support service and skewed intervention of middle men have constrained the development of non-
farm-enterprises in India.

S&T for Rural India and Inclusive Growth 287
The rural non-farm sector is increasingly playing an important role in the development of rural areas in terms
of its contribution in employment and income generation for rural folk. Efforts are needed to identify appropriate
and effective institutional vehicles for development of non-farm sector policy and interventions for creating
employment opportunities. China’s labour-intensive township and village enterprises (TVEs) often described
as the “engine of growth” behind that country’s remarkable growth during the past decades represents the
vanguard in China’s new capitalism. The TVEs are hybrid institutions, generally unusual alliances between
TVE entrepreneurs and local government officials (acting in the capacity of “owners” of TVE enterprises).
In this regard, the role of government is crucial especially in the provision of necessary infrastructure and
other support services in the country. It is also vital to improve the market links between the village entrepreneurs
and the larger business firms located in the towns/cities. Such strategic alliances or partnerships can contribute
to enhance the sustainability of small village and tiny enterprises in the rural areas. Other important
considerations that need to be focused on may include human resource development, financial/credit facilities,
research and development and women’s participation with a view to making these activities self-sustaining
in the changing competitive environment.
RRRRRururururural Deal Deal Deal Deal Devvvvvelopmentelopmentelopmentelopmentelopment: A s: A s: A s: A s: A strtrtrtrtratatatatategy fegy fegy fegy fegy for poor poor poor poor povvvvvererererertytytytyty
alleviation in Indiaalleviation in Indiaalleviation in Indiaalleviation in Indiaalleviation in India
Of late, rural development has assumed global attention especially among the developing nations. A country
like India where majority of the population (around 65% of the people) lives in rural areas has great significance.
This section overviews the role and function of the Government and its’ programmes for rural development
in India. In addition, some important science and technological achievements in the field of rural development
have been highlighted briefly.
The aims and objectives of rural development are alleviating poverty, improving the livelihoods of rural
people in an equitable and sustainable manner both socially and environmentally through better access to
assets, services and control over productive capital. The Ministry of Rural Development, comprising of
three departments viz., Department of Rural Development, Department of Land Resources and Department
of Drinking Water Supply is the apex body for formulating policies, regulations and acts pertaining to the
development of the rural sector in India. The primary responsibilities assigned to the Ministry are to encourage,
promote and assist voluntary action in the implementation of projects for the enhancement of rural prosperity,
strengthen and promote voluntary efforts in rural development with focus on injecting new technological
inputs, act as the national nodal point for co-ordination of all efforts at generation and dissemination of
technologies relevant to rural development and promote programmes aimed at conservation of the environment
and natural resources. However, several other ministries in the central government are also engaged directly
or indirectly in implementation of many programs and schemes for the development of rural areas. Various
strategies and programs of the Government of India for rural development has been briefly presented in
Box.

S&T for Rural India and Inclusive Growth288

S&T for Rural India and Inclusive Growth 289
The thrust of these programmes is economical and social transformation of rural India through a multi
pronged strategy aiming to reach the most disadvantaged sections of the society. In addition, several new
schemes viz., State Rural Road Connectivity, State Rural Housing, State SGSY, Training, Master Plan and
Sutradhar are proposed for XIth Five Year Plan and given below in short-
• State Rural Connectivity: Under Pradhan Mantri Gram Sadak Yojana, construction of all weather
roads is not permitted if the villages are less than 500 meter away from the main road. Such left out
roads and bridges can be covered and connected under the scheme with state support.
• Mukhya Mantri Awas Yojana: The Scheme is being under the Bharat Nirman with the main
objective to accelerate the rate of diffusion and provide housing to the houseless SC/ST families.
• State SGSY: An initiative to constitute SHG Federation based on activity and geographical location
to strengthen SHG movement.
• Training IEC Scheme: A scheme for training on project implementation and its monitoring.
• Working Plan for Water Storage: It is plan on the basis of survey of the catchment areas and flow
of water direction on the basis of watershed area and then identification and cost estimation of the
probable water harvesting structures.
• Sutradhar Yojana: Establishment of kiosks to facilitate access in rural areas to electronic
communication and information and government schemes and programmes.
Ministry of Science and Technology plays a pivotal role in the promotion of science & technology in the
country. Some of the important initiatives undertaken by this ministry are-
• S&T Application for Rural Development (STARD): Aims to facilitate development of promising S
& T based field groups and innovative technologies related to rural development.
• S&T for Women: Aims to promote research, development and adaptation of technology, improve
the life, working conditions and opportunities for gainful employment of women especially in rural
areas.
• S&T Application for Weaker Sections (STAWS): Aims to develop economically weaker sections
of the society in rural and urban areas.
• Tribal sub-plan: Aims to improve living conditions of scheduled tribes based on sustainable science
and technology activities.
• Special Component Plan (SCP): Aims to improve lot of the poor sections of SC community through
intervention of Science & Technology.
Appropriate rural technology focuses mainly on those technologies which are simple and within the reach of
the ordinary people for their own benefit and the benefit of their community and harness the local or regional
capacity to meet local needs without increasing dependence on external factors. A large number of

S&T for Rural India and Inclusive Growth290
organizations viz., NRDC, CAPART, TRCS, NIRD, DST / DBT, CSIR, ICAR, IITs, IIMs, KVKs and
voluntary organizations etc. are involved in developing technologies for rural areas. Some of the important
S&T achievements in the field of rural development are summarized below-
• Swaraj - India first indigenous tractor to facilitate mechanized agriculture.
• Value addition through post-harvest technologies like essential oil/ menthol production.
• Cheapest water purification technology including terracotta purification disc, portable arsenic detection
kit, ultrapore membrane-based purifiers for removing virus & bacteria.
• Over 365 technologies passed on to the rural masses through publications, training sessions, etc.
• Construction of around 30,000 dwelling units using cost-effective construction technologies.
• Reverse Osmosis plant for desalination in Andaman & Nicobar Islands, Gujarat and Tamil Nadu.
Such concerted efforts initiated by the Government of India through several plans and measures to alleviate
poverty in rural India need even greater attention to the core issue of rural prosperity. At present technology
dissemination is uneven and slow in the rural areas. Good efforts of organizations developing technologies,
devices and products for rural areas could not yield high success. Experiences of many countries suggest
that technological development fuelled by demand has a higher dissemination rate. However, in India, technology
developers for rural areas have been catering for needs (with small improvement), rather than creating
demand. There is no industry linkage institution that can create demand-based-technology market for rural
communities. Besides, there is also an imbalance between strategies and effective management programmes.
Propagation of technology/schemes for rural development is slow, lacking a wider participation of different
stakeholders. An ideal approach may therefore, include the government, panchayats, village personnel,
researchers, industries, NGOs and private companies to not only help in reducing this imbalance, but also to
have a multiplier effect on the overall economy.
National Innovation Foundation
The National Innovation Foundation (NIF, www.nif.org.in), Ahmedabad, Gujarat is an autonomous
organization established under Department of Science and Technology, Government of India on Feb
28th 2000, with the main goal of providing institutional support in scouting, spawning, sustaining and
scaling up grassroots green innovations and helping their transition to self supporting activities.
The main network partners of NIF are Honey Bee network, Society for Research and Initiatives for
Sustainable Technologies and Institutions (SRISTI) and Grassroots Innovation Augmentation Networks
(GIAN). NIF known for its passion for producing an environment congenial for grassroots innovations
strives to support innovative minds and their creations. It conducts pollens for documenting and spreading
these innovations through its network. It even selects and supports innovations both financially and
intellectually for patenting and trademarks by involving project/ technology disseminating agencies for
selective transfer of technology.
Till date more than 100,000 innovations and traditional knowledge practices have been scouted from
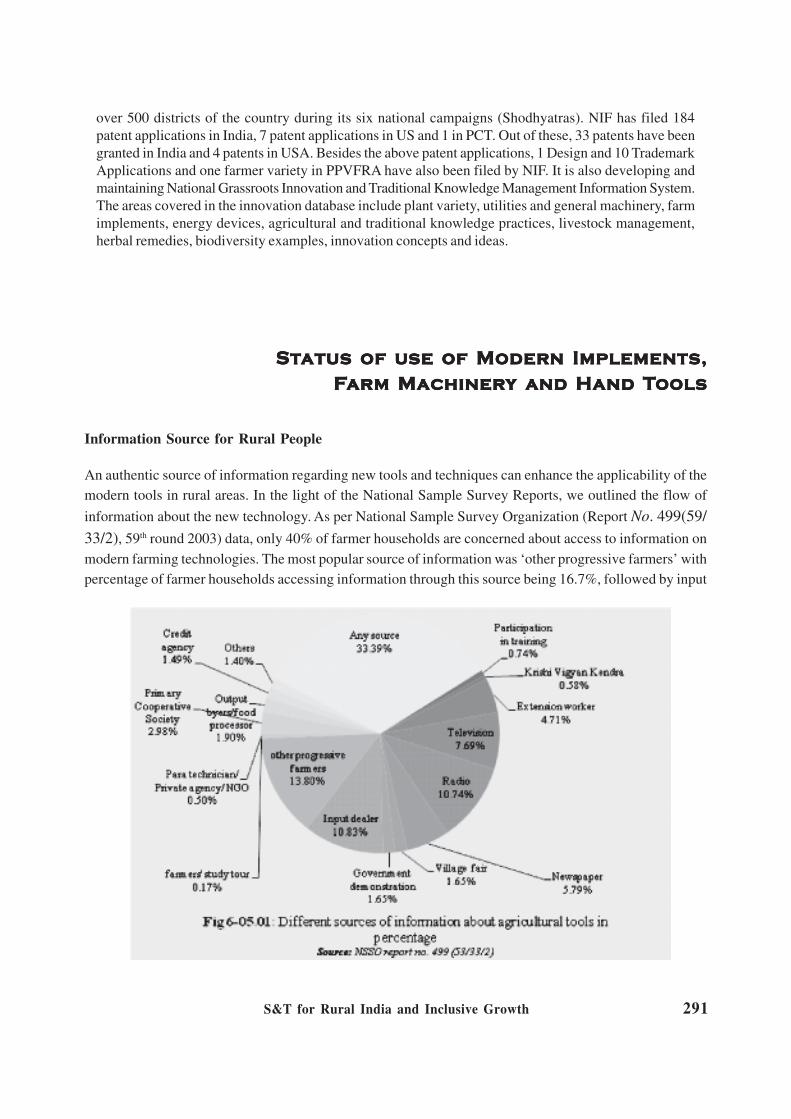
S&T for Rural India and Inclusive Growth 291
over 500 districts of the country during its six national campaigns (Shodhyatras). NIF has filed 184
patent applications in India, 7 patent applications in US and 1 in PCT. Out of these, 33 patents have been
granted in India and 4 patents in USA. Besides the above patent applications, 1 Design and 10 Trademark
Applications and one farmer variety in PPVFRA have also been filed by NIF. It is also developing and
maintaining National Grassroots Innovation and Traditional Knowledge Management Information System.
The areas covered in the innovation database include plant variety, utilities and general machinery, farm
implements, energy devices, agricultural and traditional knowledge practices, livestock management,
herbal remedies, biodiversity examples, innovation concepts and ideas.
SSSSStttttatus of use of Moderatus of use of Moderatus of use of Moderatus of use of Moderatus of use of Modern Imn Imn Imn Imn Implements,plements,plements,plements,plements,
FFFFFarararararm Macm Macm Macm Macm Machinerhinerhinerhinerhinery and Hand Ty and Hand Ty and Hand Ty and Hand Ty and Hand Toolsoolsoolsoolsools
Information Source for Rural People
An authentic source of information regarding new tools and techniques can enhance the applicability of the
modern tools in rural areas. In the light of the National Sample Survey Reports, we outlined the flow of
information about the new technology. As per National Sample Survey Organization (Report No. 499(59/
33/2), 59th round 2003) data, only 40% of farmer households are concerned about access to information on
modern farming technologies. The most popular source of information was ‘other progressive farmers’ with
percentage of farmer households accessing information through this source being 16.7%, followed by input

S&T for Rural India and Inclusive Growth292
dealer (10.83%) and radio (10.74%). Percentage of farmer households accessing information through ‘other
progressive farmers’ was highest in Andhra Pradesh (34%), followed by Gujarat (30%) and West Bengal
(25%). In the case of accessing information through ‘input dealers’ it was higher in West Bengal (36%),
Andhra Pradesh (30%) and Gujarat (24%). ‘Radio’ was highest in Jammu & Kashmir (36%), followed by
Kerala (31%) and Assam (29%). It is also indicated that the two most popular sources namely, ‘other
progressive farmers’ and ‘input dealer’ were contacted by the farmer households mainly on ‘need basis’ or
‘seasonally’. The overall picture of India regarding sources of information is represented in the following
Fig 6-05.01.
Finance for Farmers
According to the report from NABARD, GoI set a target of Rs. 1,75,000 crore for credit flow to agriculture
for 2006-07 against which disbursements by all agencies stood at Rs. 2,03,296 crore, exceeding the target by
16 per cent. Commercial banks, co-operative banks and Regional Rural Banks disbursed Rs. 1,40,382;
42,480 and 20,434 crore achieving 118, 104 and 136 per cent of their targets, respectively. During the same
year, 83.50 lakh new farmers were brought under the institutional fold, 74.70 lakh fresh KCCs were issued,
631 agri-clinics financed, debt relief worth Rs. 4,873.37 and. 673.90 crore was provided to farmers in
distress and in arrears, respectively. An amount of Rs. 460.06 crore was provided by banks to small/marginal
farmers under one time settlement scheme. Banks also extended loans to the extent of Rs. 73.41 crore to
27,810 farmers, to redeem their past debts availed from informal sources. In some cases, subsidy is also
available for the purchase of agricultural equipments. Agricultural equipments namely, tractors, power tillers,
power threshers, sprinklers, drip irrigation, self propelled reapers, rotavators etc. are available on subsidy
under Central Sector Plan Schemes. The subsidy is available to the farmers @ 25% of the cost of equipment,
subject to certain ceiling limits.
Most recently, Government of India released a debt waiver scheme in 2008 to the farmers for the welfare
of poor farmers. This may be a short-term relief for the small and marginal farmers. But for the long-term
gain we need to focus on capacity building of these farmers to sustain on adverse condition with more credit
solution.
Major Farm Machinery Training and Testing Institutes in India
The Farm Machinery Training & Testing Institutes (FMTTI) at Budni (M.P.), Hissar (Haryana), Garladinne
(A.P.) and Bishwanath Chariali (Assam) established by the Government of India have been playing a vital
role in promoting agricultural mechanization.
The numbers of central farm machinery testing and training centre are less compared to the agricultural
area of India. It is obvious that to enhance the facility there is a need to create more centers in India. To
aware rural marginal farmers we need to decentralize the training and certification system. In fact, another
gateway of job creation in rural India by imparting training to some nodal rural persons about standards and
give them rights to certified the rural unorganizedly made small agri-machinery and tools on reasonable
payment basis. In this way we may think of inclusion of large unorganized hand tool and agri-machinery
industry into our organized system with proper safety measures and global acceptance.

S&T for Rural India and Inclusive Growth 293
Usage of Modern
Farm Implements
It is clear from the
Fig 6-05.02 that the
tendency of utilization
of wooden plough is
higher than the iron
plough. The other Fig
6-05.03 clearly
reveals that use of
indigenous water
lifting device is much
more than the use of
mechanized pumps
except in case of the
large farmers.
The above figures
show the pattern of
the usage of modern
farm implements in
rural India. The
pattern shows that
farmers with larger
land holdings are the
ones who mainly use
the improved farm
implements.
A g r i c u l t u r a l
equipment based
market basically for
tractors in India is
dominated by private
players like
Mahindra &
Mahindra (M&M)
and TAFE which
constitutes for
around 40% (out of
which 75% is
occupied by M&M)

S&T for Rural India and Inclusive Growth294
of the total market, Escorts and PTL together occupy 25%, while others hold 35% of total market share
(Tractor manufactures association 2004-05). These players not only do well in national market but also in
international market. According to United Nation ESCAP report, the present requirement is about 2.75
million additional tractors. The average annual demand will be about 3.43 lakh tractors over the next 8
years. For intensive cropping, farm power availability needs to be increased from 1.35 kW/ha to 2 kW/ha by
2010, mainly due to increased use of tractors and power tillers and by 2010, the tractor population needs to
be increased from 2.76 to 4.13 million tractors. Approximately annual use (in hours) of tractors is currently
between 600-700 h/year.
Export Import Scenario
The following graphs show
the trend of export-import
data for soil machinery,
dairy and milking machines
and for the tractors over
last 12 years. It is based on
the values (in 1000$) of the
particular item imported or
exported as reported in
FAOSTAT. These trends
show the revenue
generation through the
export of agriculture
machineries.
Status of
Hand Tools
There are an
estimated 2500
small scale and
tiny units in
India, of which
around 350
units are
concentrated in
Jalandhar and
more than 100
in Ludhiana,
besides 7 large
units. The
s m a l l - s c a l e
industry for
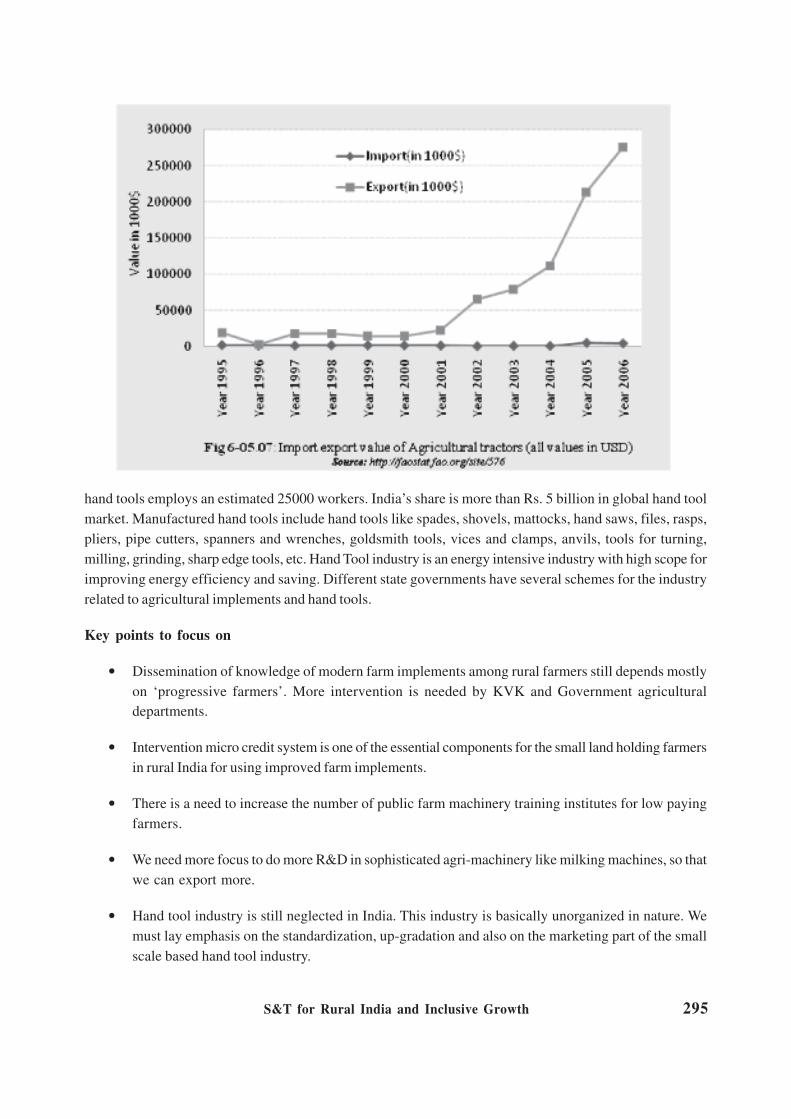
S&T for Rural India and Inclusive Growth 295
hand tools employs an estimated 25000 workers. India’s share is more than Rs. 5 billion in global hand tool
market. Manufactured hand tools include hand tools like spades, shovels, mattocks, hand saws, files, rasps,
pliers, pipe cutters, spanners and wrenches, goldsmith tools, vices and clamps, anvils, tools for turning,
milling, grinding, sharp edge tools, etc. Hand Tool industry is an energy intensive industry with high scope for
improving energy efficiency and saving. Different state governments have several schemes for the industry
related to agricultural implements and hand tools.
Key points to focus on
• Dissemination of knowledge of modern farm implements among rural farmers still depends mostly
on ‘progressive farmers’. More intervention is needed by KVK and Government agricultural
departments.
• Intervention micro credit system is one of the essential components for the small land holding farmers
in rural India for using improved farm implements.
• There is a need to increase the number of public farm machinery training institutes for low paying
farmers.
• We need more focus to do more R&D in sophisticated agri-machinery like milking machines, so that
we can export more.
• Hand tool industry is still neglected in India. This industry is basically unorganized in nature. We
must lay emphasis on the standardization, up-gradation and also on the marketing part of the small
scale based hand tool industry.

S&T for Rural India and Inclusive Growth296
One Segment of UOne Segment of UOne Segment of UOne Segment of UOne Segment of Unornornornornorggggganized Sectanized Sectanized Sectanized Sectanized Sector Wor Wor Wor Wor Worororororkkkkkererererers:s:s:s:s:
Rural ArtisansRural ArtisansRural ArtisansRural ArtisansRural Artisans
An important component of non-farm segment is the unorganized sector of workers, especially rural artisans
in the village areas. These artisans comprise blacksmiths, carpenters, weavers (of carpets, durries, khesh,
sarees, etc.), potters, mudha makers, hand tool makers, farm implement makers, metal ware (sliver, brass,
copper) makers, sculptors (wood, metal, clay, stone), handicraft makers, etc. These artisans, on one hand,
are regarded as custodians of the heritage of India, and on the other, play an important role in the village life
through their repair and maintenance services. This informal sector possesses vast potential for opening-up
employment opportunities, generation of rural income, and strengthening of purchasing power of the rural
people. A special feature of these artisans is that they live in clusters, some of which are:
Potters: Nawalgarh & Dundlod (Rajashan), Narola & Dhulkari (Himachal Pradesh), Khandwa &
Khadgao Kalan (Madhya Pradesh), Ranibandh (West Bengal), Thozukkal (Kerala) and
Kasharipara (Meghalaya)
Blacksmiths: Loharpura (Rajasthan) and Sampla (Haryana)
Carpenters: Landnu (Rajasthan) and Chhuchhukwas (Haryana)
Present Scenario
The skill of rural artisans continues to be old and technology traditional. Their economic status is far from
satisfactory, which makes their marketing power also weak at both selling and buying levels. Their education
level is low and their linkages with rural developmental institutions are either non-existent or weak. Their
shyness, weak communication power, and tendency to remain ‘small’ and ‘satisfied’ are some of their other
problems. It has been found that the main reason behind the fruits of S&T developments not reaching these
artisans is their non-involvement in rural development programs. In most cases, the technologies remain
confined to R&D institutions. As a result, the overall goal of improving the quality of life of rural people
remains far from being satisfactorily realized.
Some Insights from Rural Artisans
• Neglect by State and Central Governments
• Non-Involvement in Rural Developmental Programs
• Lack of Skill Improvement and Technology Up-gradation
• Lack of Specialized Markets
• Non-existence of Infrastructural Facilities
• Non-Availability of Quality Raw Materials

S&T for Rural India and Inclusive Growth 297
• Weak Financial Power
• Inability to Get Bank Loans
• Poor Access to Information
• Lack of Linkages with different Developmental Institutions
• Need of Social Security Mechanism
A survey of the felt-needs of rural artisans revealed the requisites of awareness generation, linkages
development, training and confidence development in them. Following strategies were adopted:
i) Study of techno-economic status of artisans
ii) Awareness generation meetings
iii) Visits of R&D scientists to the workshops of artisans
iv) Organization of trainings
Organization of Trainings
To upgrade the skill of artisans and to innovate on their technologies, technical trainings were organized for
them in the appropriate technical training institutions, such as Division of Agricultural Engineering, Indian
Agricultural Research Institute (IARI), New Delhi. In these trainings, artisans could get exposure to different
machines used in the manufacture of agricultural implements. They also received a chance to get acquainted
with and work on some of the latest machines.
Impact: A comparative survey of the levels of awareness among artisans on various aspects having a direct
relation with them in 2004 and 2007 clearly depicts the significant rise in their awareness levels.

S&T for Rural India and Inclusive Growth298
Policy Implications
On the basis of the study carried out in different clusters of artisans following policy implications have been
suggested:
• Trainings: Based on the predominant trade in a cluster
• Awareness Generation Meets
• Collateral-Free Loan Facilities
• Artisan Credit Cards
• Participatory Approach in all rural development programs
• Cluster–based Technical Education
• Marketing: Specific markets for artisans on the model of Anaaj Mandies
• Easy Access to Information
• Social Security Support
These will lead to skill up-gradation of rural artisans, which will help in income and employment generation
and also stop migration of rural artisans to urban centers.
Shelter: A Big Challenge for Rural IndiaShelter: A Big Challenge for Rural IndiaShelter: A Big Challenge for Rural IndiaShelter: A Big Challenge for Rural IndiaShelter: A Big Challenge for Rural India
Owning a house ensures certain degree of economic as well as social security to a citizen. Providing weather
resistant and hygienic accommodation to its citizens remains one of the most serious challenges India is
facing today. The problem of inadequate housing is more acute in the rural areas where bulk of the BPL
population lives. Our focus is on the requirements of housing in rural India, present government initiatives
and most importantly the technological requirements for constructing low-cost sustainable houses. At the
end deliberations are made on the possible future course of action for ensuring shelter to all. Throughout the
discussion, a person without a permanent house (as defined in Census of India 2001) is referred to as
homeless.
Present Scenario of Housing
The world’s homeless population is estimated to be around 1 billion people. In India, around 1% of the total
population is without a home (2001 Census). Approximately 60% of the homeless population is from the
rural areas. In terms of housing units, the housing shortage is estimated to be 148.33 lakh houses as per the
2001 Census. The housing shortage has increased @ 0.89 million houses per year during 1991-2002.

S&T for Rural India and Inclusive Growth 299
The Working Group on Rural Housing for the 11th Five Year Plan estimated the total rural housing shortage
during 2007-12 at 47.43 million houses. Of these 42.69 million or 90% of the total shortage pertains to BPL
families. It is a matter of grave concern that even in advanced states like Gujarat and Maharashtra the
extent of housing shortage is still very serious.
Government Efforts in Rural Shelter
The earliest known government initiative for housing was for rehabilitation of refugees immediately after the
partition of the country. But, rural housing initiatives in its true sense and vigor in India began with the Indira
Awaas Yojana (IAY) during 1985-86.
Indira Awaas Yojana (IAY)
The initial objective of the scheme was to provide dwelling units free of cost to the members of Scheduled
Castes, Scheduled Tribes and freed bonded laborers living BPL. In 1993-94, its scope was extended to
cover non-scheduled castes and tribes and later on the scheme was extended to families of servicemen of
the armed and paramilitary forces killed in action. Since the time of inception, the number of houses constructed
under the IAY has increased constantly over the years. During the financial year 2006-07, around 14.5 lakh
houses were constructed and the achievement is 93.6% of target.
Technological components in IAY: If the beneficiaries’ desire, government departments can provide technical
assistance or arrange for coordinated supply of raw materials like cement, bricks etc, but it is not innate with
the scheme itself. Though, 85 Rural Building Centers (RBCs) set up by the Ministry to enable people in
different parts of the country to access appropriate technologies and aid capacity building at the grassroots

S&T for Rural India and Inclusive Growth300
level, were delinked from the scheme after 2004, these centers are expected to continue to support technology
transfer and produce cost-effective material.
Recent developments in IAY: Since August 2005, the scheme has been brought under the ambitious Bharat
Nirman Programme and has been set the target of constructing 60 lakh houses during the period 2005-09.
Recently, the unit cost of IAY houses has been increased from Rs. 25,000 to Rs. 35,000 w.e.f. from 1st April
2008.
State-run Housing Schemes
Long before the Central government introduced any scheme for rural housing some state governments had
rural housing programs. Currently, around 15 States/UTs like Andhra Pradesh and Tamil Nadu have their
own schemes, whose scope extends much beyond than those of the IAY. These states through their own
schemes have together constructed 27 lakh houses in rural areas during 2001-05.
Financing Rural Housing
In addition to the government undertaken fully subsidized IAY, there are other national as well as regional
financial institutions which provide loans at concessional rates.
Housing and Urban Development Corporation Limited (HUDCO)
HUDCO provides housing loans mainly to Economically Weaker Sections (EWS) whose monthly household
income is less than Rs. 2500. Another feature of HUDCO’s work is assistance for reconstruction of rural
houses in natural calamity affected areas.
National Housing Bank (NHB)
It promotes housing finance institutions at the local and regional levels by providing financial support in the
form of equity and refinances to cater to the housing credit needs of all segments of population through
primary lending institutions like commercial banks, housing finance companies (HFCs) and cooperative
institutions.
Research Agencies in Rural Housing
This sub-section highlights some institutions working in developing suitable building materials and designs
Central Building Research Institute (CBRI), Roorkee: The institute has developed a number of technologies
for making housing materials like clay bricks, machines for making the materials like brick making machine
etc. Most of these technologies are under commercial use, while some are ready for commercialization.
National Institute of Rural Development (NIRD), Hyderabad: A recent initiative by the institute is the
establishment of a National Rural Building Centre within the Rural Technology Park. This centre showcases
the technologies of constructing region-specific affordable houses with eco-friendly local materials rather
than conventional concrete and steel.

S&T for Rural India and Inclusive Growth 301
Advanced Materials and Processes Research Institute (AMPRI), Bhopal: The institute has developed a
number of innovative, cost-effective alternative building construction materials using industrial wastes like
Fly-ash and organic fibre like Sisal fibre as reinforcement in polymer matrix. The salient features of the
products are:
• High strength and durability
• Cost effective
• Versatile technology for building industry
National Building Construction Corporation Limited: NBCC was established in 1960 as wholly owned
Government enterprise to implement management practices that encourage value-added, innovative
construction services delivery.
Building Materials and Technology Promotion Council: The BMTPC was set up in 1990 in order to
bridge the gap between research and development and large scale application of new building material
technologies especially promotion of low-cost, new waste based building materials and components.
Creating a Market for Innovation in Housing – a Push and Pull Approach
What is perhaps required is the creation of a demand (market) for the technologies developed by the research
organizations. It can be created through the instrument of “Public Procurement” much in the line suggested
by the Aho Committee in Europe. The Aho Committee suggested, providing an innovation-friendly market
for Europe to be innovative.
The government may ensure public procurement by linking it with publicly funded housing schemes like IAY
with necessary riders on standards and designs, and especially linking procurement to local raw materials,
local standards, and local masonry skill.
This creation of demand through public procurement will push up enterprises in taking up ventures in low-
cost innovative building materials which in turn will push the R&D institutes to be more innovative. The
developed products will be pulled, in turn, through the public procurement system.
This push and pull strategy could be best executed through the creation of a new technology based business
model.

S&T for Rural India and Inclusive Growth302
DrDrDrDrDrinking Winking Winking Winking Winking Watatatatater Suppler Suppler Suppler Suppler Supply vis-a-vis Ty vis-a-vis Ty vis-a-vis Ty vis-a-vis Ty vis-a-vis Tececececechnologicalhnologicalhnologicalhnologicalhnological
IntIntIntIntIntererererervvvvventions fentions fentions fentions fentions for Social Emor Social Emor Social Emor Social Emor Social Empopopopopowwwwwerererererment ofment ofment ofment ofment of
Rural IndiaRural IndiaRural IndiaRural IndiaRural India
India has the largest rural drinking water supply program in the world serving about 1.6 million habitations
spread over 15 diverse ecological regions and 742 million people. The provision of clean drinking water has
been given priority in the Constitution of India, with Article 47 conferring the duty of providing clean drinking
water and improving public health standards to the State. According to the National Water Policy for ensuring
sustainability of the systems, steps were initiated in 1999 to institutionalize community participation in the
implementation of rural drinking water supply schemes.
Ensuring water quality in the Rural Drinking Water Supply has remained the major bottleneck. The Government
of India had launched the National Rural Drinking Water Quality Monitoring and Surveillance Program in
February 2006. Moreover, in view of the problems of pollution of national water resources, the Ministry of
Environment & Forests has constituted the “Water Quality Assessment Authority” (WQAA). The Ministry
of Water Resources is assisting the WQAA in carrying out and coordinating its functions.
The States implement drinking water supply schemes. The Government of India supplements the efforts of
the States by providing financial assistance under the Accelerated Rural Water Supply Program (ARWSP).
Additional assistance is also available to the States for Rural Water Supply Program under various externally
aided projects. The entire program (ARWSP) was given a mission approach when the Technology Mission
on Drinking Water Management, called the National Drinking Water Mission (NDWM) was introduced as
one of the five Societal Missions in 1986. NDWM was renamed as Rajiv Gandhi National Drinking Water
Mission (RGNDWM) in 1991. The efforts of the Central and State governments are also backed by
international organizations such as the bilateral agencies of Japan, the United Kingdom, the United States,
Denmark, Sweden, Germany, Australia, Netherlands, etc., and multilaterals such as the World Bank, WHO,
UNICEF (Water and sanitation program-South Asia), UNDP and the European Union.
Progress achieved so far
As reported in a background paper by Water Aid, according to latest estimates, 94 per cent of the rural
population has access to safe drinking water. Data available with the Department of Drinking Water Supply
(DDWS), Ministry of Rural Development shows that of the 1.6 million rural habitations in the country, 1.06
million are fully covered (FC), 0.34 million are partially covered (PC) and 0.19 million are not covered (NC).
However, coverage refers to installed capacity, and not average actual supply over a sustained period or the
quality of water being supplied which is the most essential part (Water aid background paper, 2008).
Moreover, large incidences of slippage from “fully covered” to “partially/not covered” categories are another
issue. The per capita water supply also ranges from a low of 9 lpcd to a high of 584 lpcd. Till the 10th plan,
an estimated total of Rs. 1,105 billion was spent on providing safe drinking water. Thus, one would argue that
the expenditure is huge but despite such expenditure lack of safe and secure drinking water continues to be
a major hurdle and a national economic burden. Based on various gaps existing in the present rural drinking
water supply system in the country, the DDWS has very recently come up with a paradigm shift in policy

S&T for Rural India and Inclusive Growth 303
under which the ARWSP
has been renamed as
“National Rural Water
Supply Program
(NRWSP)”.
Providing access to water
has been considered
primarily important and
thus water quality
remained secondary. As a
result monitoring of the
impact on habitations
affected by poor water
quality “is not happening”.
The most serious
malfunction in
India’s water-
supply system is
its hazardous
quality and
gigantic cost to
human health.
India ranks 120th
out 122
c o u n t r i e s
monitored, in
poor potable
water-quality.
Groundwater is
the major source
of water in our
country with 85% of the population dependent on it. Even 80 % of the government’s supply is dependent on
groundwater. Arsenic contamination is now grim reality in almost the entire Gangetic belt while fluoride
contaminated drinking-water similarly affects 20 States. The problems of chemical contamination are prevalent
in India, with 1,95,813 habitations in the country affected by poor water quality (Water aid background
paper, 2008). For surface water the major quality problem is seasonal turbidity owing to bacteriological
contamination, reasons being anthropogenic. In 2005, a Central Pollution Control Board countrywide survey
found 66 per cent of samples had unacceptable organic values, while 44 per cent had coliform, occurring
generally from faeces. Fig 6-08.01 indicates the crisis that exits in safe drinking water supply in terms of
quality. It is surprising to note that states like Bihar and Haryana does not have any problem related to
chemical contamination.

S&T for Rural India and Inclusive Growth304
Health Cost
The health burden of poor water quality is enormous. It is estimated that around 37.7 million Indians
are affected by waterborne diseases annually (viral hepatitis, cholera, jaundice, typhoid are examples),
1.5 million children are estimated to die of diarrhoea alone and 73 million working days are lost due to
waterborne disease each year. The resulting economic burden is estimated at $600 million a year. Ten
million people are vulnerable to cancers from excessive arsenic and another 66 million are facing risk of
fluorosis, now endemic in 17 States. Fluorosis is affecting future generations too through pregnant mothers
whose anaemia is caused by fluorosis. Anaemia produces low birth-weight babies who in turn manifest their
mothers’ nutritional deficiencies through physical and mental deformities. Besides, there prevail health impacts
of drinking-water with other environmental pollutants such as industrial wastes. Fig 6-08.02 reflects on the
cases of water borne diseases like cholera and acute diarrhoea occurring in various states of India.
Role of Technology in Rural Water Supply
History stands
witness to man’s
use of varied
forms of
technology and
science, ranging
from the simplest
to the most
complicated, for
storing and
extracting water.
India has a
particularly strong
tradition of water
harvesting –
communities have
met their
minimum water
r e q u i r e m e n t s
effectively by
collecting rainwater locally, diverting and storing water from local streams and springs and tapping sub-
surface water. However, these traditional technologies and methods have fallen prey to inattention and
ignorance over time, and need to be revived and rejuvenated. On the other hand are the most modern, state-
of-the-art technologies and practices which could make a lot of difference in these water-stressed times.
Fig 6-08.03 and 6-08.04 provide an insight of how the S&T factor has grown in a span interval of six years
and also that across different states while treating the drinking water.
It is found that technology penetration has rarely taken place in rural India. On the contrary, the role of
technology is very significant in the expansion of drinking water supply coverage in rural India and to fulfill

S&T for Rural India and Inclusive Growth 305
the vision of making safe
drinking water available to
all people. Our scientists
have done monumental
works but very few know
about it. Therefore social
engineering is required to
enable technology to deliver
the desired results. For
water quality affected
habitations low cost
technologies are available in
the country and can be
employed for tackling
chemical and biological contamination problems. The Public Health Engineering Departments have to be
regularly updated on the knowledge of technologies, areas for R&D have to be identified and engineers
trained for successful implementation of technologies. There is also a need to enable them to formulate
projects in a better manner and seek release of funds from GoI.
In order to ensure sustainability of such technological innovations of public funded research organizations,
the financial participation of the user group is very essential. Depending on the site specific factors the cost
of water may vary. Subsidies may have to be provided depending on the economic conditions of the local
population. Sustainability emanates from acceptability which in turn is dependent on reliability, affordability
and adequacy. A DAE-CSIR program has been envisaged which involves deployment of technologies
developed by respective laboratories in a reliable and sustainable manner. The implementation involves
synergistic participation of DAE-CSIR laboratories, executing agencies and users, each with financial
contribution and commitment to ensure self-sustenance preferably with a multiplier effect.
Some Technological Success Stories
Many State Governments have reported success stories on ground water recharge, roof-water harvesting
and surface water collection. For example, in Gujarat, through various programs 87,179 check dams, 35,479
boriband and 1,71,400 khet-talavadi (farm ponds) have been constructed for ground water recharge and
dilution of contaminants. During the last 7 years, the State has built and taken up 3,585 recharge structures
which have resulted in rise of ground water levels from 0.5m to 12m in the vicinity of recharge structures.
Roof-water harvesting has been made compulsory for all government buildings in Tamil Nadu. In Karnataka,
roof-water harvesting is successfully implemented by an organization called BAIF in fluoride affected
habitations of Kolar and two other districts. Andhra Pradesh has enacted the AP Water, Land and Tree Act
in 2003, which specifies that permission is required to be taken to drill a bore hole if drilling is within 250m
radius of a drinking water source. Tie up with National Geophysical Research Institute (CSIR) is being done
for creation of water sanctuary. Restoration of one water tank in each village under National Rural Employment
Guarantee Act is proposed to ensure multiple sources of water and lead to drinking water security. Mizoram
and Lakshadweep are amongst the pioneers in roof-water harvesting structures. Roof-water harvesting has
also started in other States like Kerala, Bihar, Madhya Pradesh, etc. Maharashtra has come up with unique

S&T for Rural India and Inclusive Growth306
methods of unconventional blasting like bore blasting, stream blasting, etc. in order to enhance the percolation
rate of soils, enhance the aquifer capacity and/or create a secondary aquifer for ground water recharge.
The Government has also launched the ‘National Water Award’ and ‘Bhumijal Samvardhan Award’ to
encourage NGOs, Gram Panchayats/Urban Local Bodies for adopting innovative practices of ground water
augmentation through people’s participation. Moreover, the Government has constituted Advisory Council
for Artificial Recharge of Ground Water in April, 2006 to popularize the concept of Artificial Recharge
among all stake holders.
In summing up, one major problem is that the provisions for water are distributed across various ministries
and institutions. With several institutions involved in water supply, inter-sector coordination becomes critical
for the success of any program. The ownership of water is the core challenge of water management posed
at different scales: between the state and communities in general, between the Central government and
respective states or provinces and between local and state governments. When it comes to dealing with
maintaining water quality, the users and the communities have to play a key role in maintaining hygiene near
water sources.
Thus, policy issues to be addressed to improve rural drinking water supply scenario are:
i) To strengthen state-level institutions thus enabling more cost-effective rural-based services.
ii) Introducing a number of important innovations in technology, public administration, and policy, e.g.
Integrated Watershed Development Program (IWDP) is an important step in harvesting rainwater
in rural India.
iii) Good interdepartmental coordination by the project’s monitoring and coordination cell.
iv) Water augmentation: A combined strategy of reviving our water bodies and supplying treated sewage
for industrial use will more than adequately address the artificial water shortage.
The rural water supply component represents an effective marriage of initiatives from government departments
and beneficiaries: locally elected governing bodies identify groups of villagers who need improved water
supplies, and these groups take ownership of and maintain the completed hand-pumps. The government
departments provide key technical expertise to locate the best sites, supervise construction, certify the water
as satisfactory for drinking purposes, and provide spare parts. Several private bodies, NGOs are contributing
significantly to the development of this sector. Organizations like Water Aid, Water Partners, World Bank,
UNESCO, The Aga Khan Foundation, Naandi Foundation, Centre for Science and Environment have played
an important role in shaping the drinking water scenario of the country. Naandi Foundation has developed
and is implementing a holistic model that recognizes that demand for quality water exists and that by capitalizing
on communities’ willingness to pay, accountability can be enforced through a contractual relationship between
service providers and the local government. Water partner’s projects are funded through grant, loans or a
combination of grants and loans. Their loan program is the first of its kind with the idea of community based
water supply projects. By offering innovative financing methods through its Water Credit Initiative, Water

S&T for Rural India and Inclusive Growth 307
Partners empowers local communities to develop and sustain solutions to their own water needs. Taking
lessons from such initiatives, there is need to look at traditional ways of life and wisdom in water management
that have sustained over years and try to refine and upgrade the same with new scientific knowledge.
Neither the public nor the private sector can alone meet access, quality, financing and policy gaps. Government
institutions remain central but private sector should be a key partner. There is an urgent need to engage
along a spectrum of public private solutions. The National Rural Water Supply Program (NRWSP) to be
effective from April, 2009 onwards comes with lots of expectations.
RRRRRururururural Sanital Sanital Sanital Sanital Sanitation: A sation: A sation: A sation: A sation: A stttttep tep tep tep tep tooooowwwwwararararards acds acds acds acds achiehiehiehiehieving tving tving tving tving thehehehehe
MillenniumMillenniumMillenniumMillenniumMillennium DeDeDeDeDevvvvvelopment Goal Nelopment Goal Nelopment Goal Nelopment Goal Nelopment Goal No 7o 7o 7o 7o 7, T, T, T, T, Tararararargggggeeeeet 1t 1t 1t 1t 100000
If water is life, sanitation is surely a ‘way of life’ and access to such facilities surely has an impact on the
quality of human life and health. Environmental cleanliness and sanitation were subjects closest to Mahatma
Gandhi’s heart who proclaimed that “cleanliness is next only to godliness”. Lack of adequate sanitation is a
pressing challenge in rural India. Another major problem that the country faces today is the practice of
scavenging, which mostly engages women. There are 7,70,338 scavengers and their dependents in India.
They are the most suppressed class of the society, considered as untouchables and avoided by other
communities.
The first national program aimed at improving rural sanitation on a large scale, the Central Rural Sanitation
Program, was launched in 1986. Despite considerable investment, this approach failed to motivate and
sustain high levels of sanitation as it was based on the assumption that mere provision of sanitary facilities
would lead to increased coverage and usage. Recognizing the limitations of this approach, the Total Sanitation
Campaign (TSC) was launched in 1999. The TSC moves away from the infrastructure focused approach of
earlier programs and concentrates on promoting behavior changes. To add vigor to the TSC, in June 2003,

S&T for Rural India and Inclusive Growth308
GoI initiated an incentive scheme for fully sanitized and open defecation free Gram Panchayats, Blocks, and
Districts called the ‘Nirmal Gram Puraskar’. The incentive pattern is based on population criteria given in
Table 6-09.01. The incentive provision is for Panchayat Raj Institutions (PRI) as well as individuals and
organizations that are the driving force for full sanitation coverage.
Since its launch, the Nirmal Gram Puraskar (NGP) has been very successful as a fiscal incentive for
achievement of sanitation standards. From merely 40 Gram Panchayats from 6 states that received the prize
in 2005, the number went up to 4959 Panchayats from 22 states in 2007. In 2008, more than 30,000 Panchayats
were nominated for this prize and more 11,000 Panchayats have been selected for the award in 2008. NGPs
are popular, and the numbers have risen significantly over the past two years. However, issues of sustainability
need to be addressed, for the study shows that NGPs of Year 1 and 2 are slipping on a large scale. Reasons
included poor construction, construction under peer pressure, and minimal emphasis on behavior change.
The suggestions were that monitoring needs to be stronger and awards could be staggered.
The TSC is being implemented at a huge scale; 590 districts of 30 States/Union Territories (UTs). Against a
target of 108.5 million individual household toilets, as of October 2008 the number of toilets reported completed
is about 57 million. In addition, about 0.68 million school toilets, 14,540 sanitary complexes for women, and
222,267 anganwadi (pre-school) toilets have been constructed. The figures below give an idea of the
release of funds vis-à-vis coverage status of sanitation.
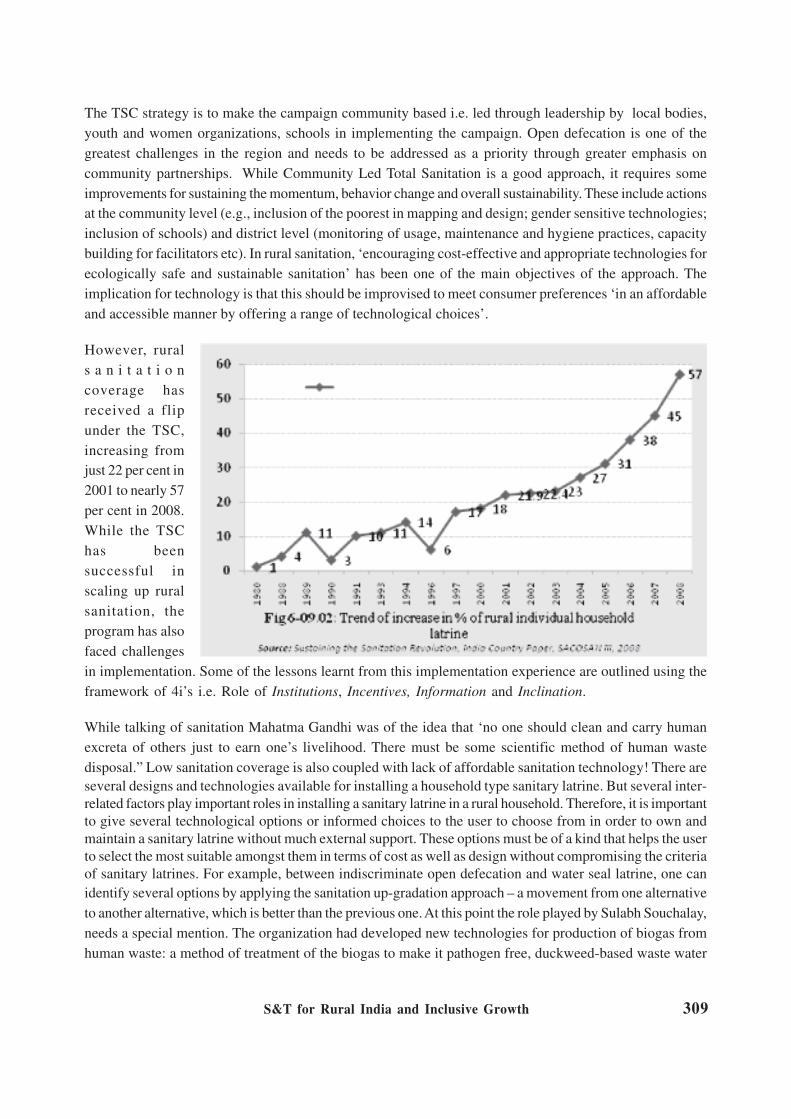
S&T for Rural India and Inclusive Growth 309
The TSC strategy is to make the campaign community based i.e. led through leadership by local bodies,
youth and women organizations, schools in implementing the campaign. Open defecation is one of the
greatest challenges in the region and needs to be addressed as a priority through greater emphasis on
community partnerships. While Community Led Total Sanitation is a good approach, it requires some
improvements for sustaining the momentum, behavior change and overall sustainability. These include actions
at the community level (e.g., inclusion of the poorest in mapping and design; gender sensitive technologies;
inclusion of schools) and district level (monitoring of usage, maintenance and hygiene practices, capacity
building for facilitators etc). In rural sanitation, ‘encouraging cost-effective and appropriate technologies for
ecologically safe and sustainable sanitation’ has been one of the main objectives of the approach. The
implication for technology is that this should be improvised to meet consumer preferences ‘in an affordable
and accessible manner by offering a range of technological choices’.
However, rural
s a n i t a t i o n
coverage has
received a flip
under the TSC,
increasing from
just 22 per cent in
2001 to nearly 57
per cent in 2008.
While the TSC
has been
successful in
scaling up rural
sanitation, the
program has also
faced challenges
in implementation. Some of the lessons learnt from this implementation experience are outlined using the
framework of 4i’s i.e. Role of Institutions, Incentives, Information and Inclination.
While talking of sanitation Mahatma Gandhi was of the idea that ‘no one should clean and carry human
excreta of others just to earn one’s livelihood. There must be some scientific method of human waste
disposal.” Low sanitation coverage is also coupled with lack of affordable sanitation technology! There are
several designs and technologies available for installing a household type sanitary latrine. But several inter-
related factors play important roles in installing a sanitary latrine in a rural household. Therefore, it is important
to give several technological options or informed choices to the user to choose from in order to own and
maintain a sanitary latrine without much external support. These options must be of a kind that helps the user
to select the most suitable amongst them in terms of cost as well as design without compromising the criteria
of sanitary latrines. For example, between indiscriminate open defecation and water seal latrine, one can
identify several options by applying the sanitation up-gradation approach – a movement from one alternative
to another alternative, which is better than the previous one. At this point the role played by Sulabh Souchalay,
needs a special mention. The organization had developed new technologies for production of biogas from
human waste: a method of treatment of the biogas to make it pathogen free, duckweed-based waste water

S&T for Rural India and Inclusive Growth310
treatment, Thermophilic Aerobic Composting etc. Sulabh has built over 7,500 community toilets with bath,
laundry and urinal facilities. Sulabh is now operating in 27 states and 5 union territories with over 50,000
trained and experienced workers. Moreover, for sustainable rehabilitation of liberated scavengers, the
programme ‘Nai Disha’- an innovative model for the liberated and rehabilitated women scavengers was
started by Sulabh.
To achieve on the holistic definition of sanitation issues related to solid and liquid waste management, use of
waste (human and animal) for generating power, awareness generation and capacity building on innovative
clean technologies need utmost importance. There is enough traditional knowledge on waste management in
the country and it is high time proper attention was given to initiatives that have been successful in creating
‘wealth’ from ‘waste’. There is a need to deepen our understanding about the linkages between climate
change and sanitation and to use the same for advocating policy change on sanitation. Here comes the role
of S&T in this sector. Ecological Sanitation which aims to promote the development, implementation and
dissemination of socially and culturally acceptable, sustainable, hygienically safe and ecologically sound
sanitation approaches can be applied (i) to identify appropriate wastewater handling approaches that satisfy
technology, cost and institutional framework requirements and enable maximizing the utilization of existing
pipelines and treatment facilities (ii) to recover nutrients from urine and faeces for agricultural purposes and
(iii) to contribute to the reduction of wastewater discharged to sewers through recycling of grey water. The
alternative paradigm of ecological sanitation offers the potential of sustainable sanitation for developing
countries. Thus, “sanitation” cannot be limited to toilets. The current mindset of “flush and forget” has to be
transformed into “wealth from waste”. This would require sustained capacity building inputs for all stakeholders
and awareness generation among the public. Convergence of several efforts of the Government, private

S&T for Rural India and Inclusive Growth 311
bodies and NGOs could probably help us to achieve the Millennium Development Goal to: “Halve by 2015
the proportion of people without sustainable access to safe drinking water and basic sanitation.”
Rural Energy Security in India: Reality ChecksRural Energy Security in India: Reality ChecksRural Energy Security in India: Reality ChecksRural Energy Security in India: Reality ChecksRural Energy Security in India: Reality Checks
Access to a steady supply of sufficient and clean energy is critical for all round development of every
person, irrespective of social and/or economic status and geographic location. However, one needs to
differentiate between the energy security of rural and urban areas because energy dynamics of both the
areas are quite different. Energy security perhaps is more important for the rural people because they are
very vulnerable, marginalized and lack access to most of the basic resources. Majority of rural households in
developing countries like India depend on traditional fuels like firewood to meet most of their energy
requirements, supplemented by small amounts of kerosene and electricity for lighting.
Two Perceptions that Need Attention
The adopted definition of electrification: According to the new definition (MOP, 2004), a village will be
considered electrified if 10% of the total number of households in the village use electricity, in addition to
other two criteria like availability of transformer in the village and electricity is provided to public places like
schools etc.
• The scope of the definition of an electrified village needs to be broadened further.
Misinterpretation of the rural energy needs: ‘Rural’ is usually equated with ‘agriculture’ and ‘rural energy’
with ‘cooking and lighting’; which certainly misses out the energy requirements of various other rural facets
like rural schools and rural enterprises etc. Most neglected policy dimension has been energy for manufacturing
in rural areas.

S&T for Rural India and Inclusive Growth312
• About 87% of the schools in the country are located in the rural areas.
• About 25.81 million or (61.3%) of the enterprises in India are located in the rural areas (Economic
Census 2005).
• Among Micro, Small and Medium Enterprises (MSME) alone, around 44.52% of the registered
units and around 54.68% unregistered units are in rural areas.
• Besides, there are thousands of rural artisans who operate as Own Account Enterprises (OAEs)
e.g. weavers whose productivity could be enhanced by supply of clean energy on a regular basis.
In a nutshell, there needs to be a paradigm shift especially,
• in the perception of rural energy needs,
• defining the goals as well as strategies of India’s energy security,
• shift from the centralized mega-thermal/hydro/nuclear plants etc. and
• more importantly concentrating in renewable and sustainable sources of energy
Pattern of Rural Energy Consumption
In rural areas, three major types of power consumption are prevalent:
1. Domestic consumption
• For cooking
• For lightening
2. Industrial consumption
• For Micro, Small and Medium Enterprises
• For Big Industry
3. On-farm energy consumption
• Energy consumption for farming
Consumption of energy in rural MSMEs: Two types of MSME units are available in India, Registered and
Un-Registered Units. Approximately 46% of un-registered and 35% of registered rural MSME have no
access to power. Further, the application of non-conventional energy (0.64-0.65%) in rural MSMEs is very
meagre.
Consumption of energy in Agriculture (rural): ‘Agriculture’ is always considered to be synonymous with
‘rural’, especially in countries like India. Agriculture consumes power both in the animate and non-animate

S&T for Rural India and Inclusive Growth 313
forms. During the first five year plan power consumption in Indian agriculture was 316 GWh (3.97% of total
power consumption in India). In 2005 total power consumption in agriculture stood at 88,555 GWh, which is
approximately 22.93% of total energy consumption in India. Gujarat (46%), Andhra Pradesh (43%) and
Haryana (45%) are the leading states regarding electricity power consumption in Agriculture (TERI energy
data directory & yearbook, 2005, P: 240).
Government Initiatives
Some of the government initiatives for rural energy security are:
National Rural Electrification Policy, 2006: It aims to provide electricity to all households by 2009,
though the time lag has been extended to 2012.
Integrated Rural Energy Program: It promotes applications of Renewable Energy technologies for cooking,
heating and lighting in the rural sector.
Rural Electrification Corporation (REC) Limited: It finances and promotes rural electrification projects
all over the country.
Sources for Rural Energy
Agri-waste: About 350 million tons of agricultural waste is produced every year which has a potential of
generating 17,000 MWe of power and can eventually save roughly an amount of Rs. 20,000 crores every
year. It has been estimated that the power potential has increased @ 8.75% during the period 1998 to 2003
(http://cgpl.iisc.ernet.in). Of the total power potential from agricultural waste, only 656.6 MW has been
harnessed as on 30.09.2008 (http://www.mnes.nic.in).
As paddy, cotton and wheat are the major residue generating crops, large agri-waste based biogas plants
should be set up in the areas growing these crops.

S&T for Rural India and Inclusive Growth314
Other biomass based energy: Biomass based energy generation has a good potential for our country
because of the rich biodiversity and a huge population. The potential sources of biomass energy are:
• Non-edible oil producing plants/trees-biofuel/bioenergy
• Wood biomass-lignocellulosic
• Forest litter biomass
• Bamboo energy
• Household/domestic waste
• Daily/weekly market waste
• Wastes from rural based industries
• Algal Energy
The Government of India through the Ministry of New and Renewable Energy Sources is implementing
several schemes to harness the potential of different types of renewable energy sources. Considerable
achievements have been made to generating power from non-edible oil producing plants and cogeneration
bagasse (994 MW). But more efforts are needed to explore potentiality of indigenous non-edible oil producing
trees for production of bio-fuel and bio-ethanol.
Virtually, no initiatives have been made to harness the energy potential of wood biomass, forest litter biomass,
bamboo energy and domestic & market waste; though some small scale take-ups are reported from different
parts of the country.
Solar Energy: Present state of exploitation of solar energy is insignificant in comparison to the estimated
potential in the country. One of the issues that need immediate and serious attention is the improvement of
efficiency and reduction of cost of solar energy devices and most importantly the search for alternative
materials/devices of trapping solar energy.
Wind Energy: The present installed capacity of wind power under the grid-interactive power system is
around 9,522 MW. In addition, 1,342 wind pumps have been installed. This installed capacity is far below the
estimated potential of about 45,000 MW. Small scale community level wind turbines can be set up with
government subsidy for the use of rural people.
Micro-Hydel Systems: Small hydro power projects are very viable especially in hilly areas like the North
East, Himachal Pradesh and Uttarakhand where the natural downward flow of water can be easily trapped
for generating power. The installed capacity of small hydro power projects of up to 25 MW capacities is
around 2221 MW. However, hydro power projects of smaller capacity (up to 3MW) are installed only for
about 240 MW. For the benefit of rural and remote areas there should be more projects of this kind. It is
important to mention here that the estimated potential of Small Hydro Power in the country is about 15,000
MW.

S&T for Rural India and Inclusive Growth 315
The Way Ahead
It is apparent that there is a stark difference between the energy requirements of rural and urban areas. It
is also evident that even after initiatives by the government; there still remains a gloomy scenario of energy
in the rural areas. To cover the gaps of energy requirements of all the rural sectors like domestic consumption,
agriculture, small scale industries (MSMEs) - demand-driven S&T interventions are essential. Moreover all
the initiatives should involve full community participation to ensure the success of the endeavours.
Applications of Geospatial InformationApplications of Geospatial InformationApplications of Geospatial InformationApplications of Geospatial InformationApplications of Geospatial Information
Technologies for Rural Development & InclusiveTechnologies for Rural Development & InclusiveTechnologies for Rural Development & InclusiveTechnologies for Rural Development & InclusiveTechnologies for Rural Development & Inclusive
GrGrGrGrGrooooowtwtwtwtwth in Indiah in Indiah in Indiah in Indiah in India
The advent of geospatial information technologies including Remote Sensing (RS), Geographic Information
System (GIS) and Global Positioning System (GPS), individually as well as jointly, are playing a significant
role in development and inclusive growth in India. The applications of remote sensing include forest and
wastelands mapping, land-use/land-cover mapping , land-form and land-degradation studies, agriculture and
soil mapping, ecology and geo-sciences and geo-morphologic mapping, and mineral, oil and water explorations,
coastal and ocean resources studies, environmental monitoring, disaster management, urban area studies
and environmental impact assessment, etc.
The Government of India had set-up the National Natural Resources Management System (NNRMS) in
1983, after recognizing the need and importance of natural resources management. The Indian Remote
Sensing (IRS) satellite system was India’s first domestic dedicated earth resources satellite program. The
IRS-P4 satellite (also known as the Oceansat-1), launched on 26 May 1999, is currently in orbit. It has a
Multi-frequency Scanning Microwave Radiometer (MSMR) and a nine-band Ocean Color Monitor (OCM)
which has opened new vistas in ocean studies. The data collected from ocean color monitoring is used for
conducting fisheries surveys and development of a fisheries forecast model. The satellite records the chlorophyll
concentrations in the oceans which help predict biological productivity in the oceans. The monitoring has
proved quite useful in coastal processes like sediment dynamics, dynamics of estuaries and tidal inlets,
prediction of shore time changes, circulation & dispersal pattern, up-welling of coastal and oceanic fronts
and surface currents. The satellite has had a great impact on environment studies as it has proved to be of
great use in learning about marine pollution and oil slicks. Also important is its use in coral reef studies.
Subsequently, IRS-P6 (Resourcesat-1) was launched in October 2003 and high resolution satellite IRS-P5
(Cartosat-1) on May 5, 2005. Thus, over the years, Department of Space (DOS) has built-up a strong R&D
and technological base for implementing the space program.
Some Applications of Geospatial Technologies
GIS technology has become an integral tool in a number of applications, including land use, wastelands,

S&T for Rural India and Inclusive Growth316
urban planning, water exploration, environmental conservation & management, eco-system studies, etc.
The GPS has helped improve the accuracy of data, as the availability of useful digital data, remote sensing
or otherwise, is often limited and quite costly. Geo-spatial information technologies have applications in
various sectors and an example of water sector is explained below:
• Water Resources: The two most important areas for GIS applications are:
o Hydrological studies which include rainfall estimation, forecasting and monitoring, hydrological
modeling, urban hydrology and water balance models, and
o Watershed conservation, planning and management, including watershed delineation, quantitative
analysis of drainage network, watershed, geology, soil mapping, lake and reservoir sedimentation
studies.
• Drinking Water: Geospatial Technologies have emerged as powerful technological tools to identify
the location of drinking water wells and also rainwater harvesting structures.
• Water Quantity: The remote sensing / GIS investigations can narrow down the region of high-yielding
aquifers up to a minimum of 12 km, the exact location of bore-wells within that area has to be identified
by geophysical surveys and studies. Similarly, it can also be applied for studies on water quality including
Eradication of Guinea-Worm, Control of Brackishness in Water, Control of Iron, Control of Fluoride,
Control of Arsenic and Control of Nitrate.
Some Policy Implications
The Information Technology (IT) Policy of Government of India, adopted in 1999 emphasizes the availability
of spatial data to geospatial technologists, user community and industry. The areas which are receiving
priority attention include natural resources assessment, monitoring and management; watershed development,
environmental planning, urban services and land use planning.
Most states in India and several ministries and departments of the central and state governments have
initiated special Geo-spatial information technologies applications relating to ground-water studies, cadastral
mapping, power transmission and transportation infrastructure. The integration of socio-economic data with
spatial data is increasing. The implementation of GIS in research programme has raised a variety of conceptual
questions for both ecological and socio-economic sectors. In addition to these basic units of research, spatial
links between the two sectors and levels of data abstraction for the spatial database have to be defined.
Using the theoretical background of the hierarchical system approach and valuable experiences of spatial
data handling, a consistent spatial information database needs to be created. Despite problems with data
accuracy, logical consistency and completeness of data, a powerful tool for regional and local planning
should be developed which may serve as a framework for a variety of planning programmes at the local and
regional levels, as well as the transfer of know-how between governmental agencies and institutions using
an interactive approach.

S&T for Rural India and Inclusive Growth 317
GoGoGoGoGovvvvvererererernment Intnment Intnment Intnment Intnment Intererererervvvvvention in Fention in Fention in Fention in Fention in Focal Arocal Arocal Arocal Arocal Areas ofeas ofeas ofeas ofeas of
Traditional System of MedicineTraditional System of MedicineTraditional System of MedicineTraditional System of MedicineTraditional System of Medicine
In Indian traditional system of medicine, the knowledge about the drugs is largely centered on plants. At
present, about 90% collection of medicinal plants is from the wild source and 70% of the plant collections
involve destructive harvesting. Due to this, many useful plant species are becoming endangered or threatened.
The government is presently emphasizing on two basic essentials i.e. firstly on conservation, secondly on
cultivation so as to increase the production of raw materials without destroying the natural habitat.
Conservation
The raw materials for these traditional systems are largely native plant species growing in the forests (about
95%). So in order to maintain a sustainable supply of the raw materials from the forests, overharvesting has
to be stopped and conservation of forests has to be done.
Cultivation
Cultivation of medicinal plants is also of critical importance to offset the uncontrolled collection of large
quantities leading to destruction of many forest medicinal plants. It is the only method of choice for long term
management and ex situ conservation of medicinal plants. The cultivation can be done through herbal gardens,
nurseries, cultivation in fields, tissue culture etc.
XI Five Year Plan
Key interventions and strategies in the Eleventh Five Year Plan are
• Ensuring conservation of medicinal plants, gene pools as well as promoting cultivation of species
used in high trade and establishment of medicinal plants processing zones.
• Strengthening regulatory mechanism for ensuring quality control, R&D, and processing technology
involving accredited laboratories in the government and non-government sector.
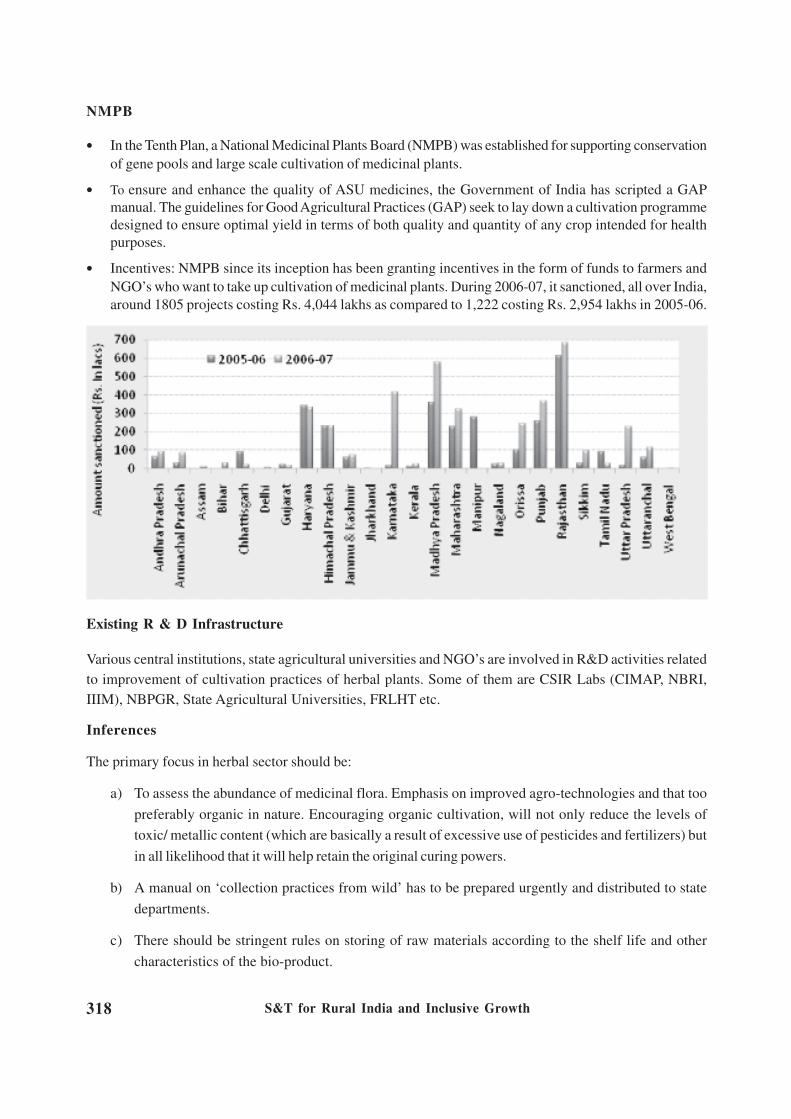
S&T for Rural India and Inclusive Growth318
NMPB
• In the Tenth Plan, a National Medicinal Plants Board (NMPB) was established for supporting conservation
of gene pools and large scale cultivation of medicinal plants.
• To ensure and enhance the quality of ASU medicines, the Government of India has scripted a GAP
manual. The guidelines for Good Agricultural Practices (GAP) seek to lay down a cultivation programme
designed to ensure optimal yield in terms of both quality and quantity of any crop intended for health
purposes.
• Incentives: NMPB since its inception has been granting incentives in the form of funds to farmers and
NGO’s who want to take up cultivation of medicinal plants. During 2006-07, it sanctioned, all over India,
around 1805 projects costing Rs. 4,044 lakhs as compared to 1,222 costing Rs. 2,954 lakhs in 2005-06.
Existing R & D Infrastructure
Various central institutions, state agricultural universities and NGO’s are involved in R&D activities related
to improvement of cultivation practices of herbal plants. Some of them are CSIR Labs (CIMAP, NBRI,
IIIM), NBPGR, State Agricultural Universities, FRLHT etc.
Inferences
The primary focus in herbal sector should be:
a) To assess the abundance of medicinal flora. Emphasis on improved agro-technologies and that too
preferably organic in nature. Encouraging organic cultivation, will not only reduce the levels of
toxic/ metallic content (which are basically a result of excessive use of pesticides and fertilizers) but
in all likelihood that it will help retain the original curing powers.
b) A manual on ‘collection practices from wild’ has to be prepared urgently and distributed to state
departments.
c) There should be stringent rules on storing of raw materials according to the shelf life and other
characteristics of the bio-product.

S&T for Rural India and Inclusive Growth 319
d) In current scenario when the number of medicinal plants is declining in their natural habitat because
of over collection from the wild, it needs to be thought over and discussed whether ‘forest rights act
2006’ is practicable? Won’t it accelerate the depletion of already endangered plants?
It can be construed that improper and unscientific method of collection, indiscriminate and over exploitation,
shrinking homelands for the herbs, their conservation and sustainable use are the major problems plaguing
this sector. Indeed the government is catching up on solving these existing problems of the herbal industry;
but with mounting universal interest, increasing potential and prospects in herbal industry, some urgent
initiatives need to be taken otherwise the situation will deteriorate further.
Impact of Science & Technology on IndianImpact of Science & Technology on IndianImpact of Science & Technology on IndianImpact of Science & Technology on IndianImpact of Science & Technology on Indian
Fisheries SectorFisheries SectorFisheries SectorFisheries SectorFisheries Sector
Fisheries sector, a sunrise sector in India, has recorded faster growth than that of crop and livestock sectors.
The sector contributes to the livelihood of a large section of economically-underprivileged population of the
country. It has been recognized as a powerful income and employment generator as it stimulates growth of
a number of subsidiary industries and is a source of cheap and nutritious food besides being a foreign
exchange earner. With the changing consumption pattern, emerging market forces and technological
developments, it has assumed added importance in India. It is undergoing rapid transformation and the policy
support, production strategies, public investment in infrastructure, and research and extension for fisheries
have significantly contributed to the increased fish production. Particularly, after the mid-1980s, the development
of carp poly-culture technology has completely transformed the traditional backyard activity into a booming
commercial enterprise.
Fish production in India has touched 6.87 million tonnes in 2006-07 from a mere 0.75 million tonnes in 1950-
1951. The share of India in global fish production has grown gradually from about 2.66% during the 1960s
and 1970s to 4.58% in 2006-07. It shows that growth in fish production in India has been at a faster rate than
in world; mainly due to increasing contribution from inland fisheries. In the initial years, marine sector used
to contribute more to total fish production then inland sector. In the 1950-51, marine production contributed
about 71.01%, which fell gradually to 42.77% in 2005-06, while inland sector started contributing from 28.99
in 1950-51 to about 57.23% in 2005-06. In fact, by the year 2000, its share crossed 50% and continues to improve.
With fisheries sector comprising marine fisheries, freshwater and brackish water aquaculture and inland
fisheries consisting of tanks and reservoir, the potentiality of this sector as a whole remains to be fully tapped
and it remains a sector of much promise. The fisheries sector is a complex enterprise that functions under
integrated networks of natural resources, other enterprises with forward and backward linkages with fisheries
and other socio-political variables. The major functions of fisheries enterprises, viz., production, transportation,
storage and processing involve value addition from labour, capital and management, which significantly
influence the rapid economic development of the country.

S&T for Rural India and Inclusive Growth320
In the last 25 years, unlike agriculture, the contribution of fisheries sector to GDP continued to grow at a
rapid pace because of the expansion of culture fisheries enterprise. The contribution of fisheries sector to
the total GDP has gone up from 0.75% in 1980-81 to 1.04% in 2004-05 (at current prices). Similarly, the
share of fisheries in agriculture GDP (AgGDP) has increased robustly from 2.17% in 1980-81 to 5.93% in
2004-05. This sector is in fact pushing the agricultural growth upward for the past 5 and half decades.
Expansion of fleet capacity, technological innovation, and increases in investment all led to explosive growth
in the exploitation of marine fisheries through the 1960s, 1970s and 1980s. But from the late 90s onwards,
marine fisheries production has reached a plateau and it seems that it can register only marginal increase in
the near future. With most wild fisheries near maximum sustainable exploitation levels, capture fishing will
most likely grow slowly.
On the other hand, inland fish production has been constantly rising. The inland fisheries include both capture
and culture fisheries. Capture fisheries were the major sources of inland fish production till mid-1980s. But
the fish production from natural waters like rivers, lakes, etc. followed a declining trend, primarily, due to
proliferation of water control structures such as dam and habitat destruction due to human interference and
settlement near and surrounding water bodies. Depleting resources, energy crisis and resultant high cost of
fishing etc. have led to increased realization of the potential and versatility of aquaculture on a sustainable
and cost-effective alternative to capture fisheries. Inland aquaculture activities are gaining importance in
some states like Uttar Pradesh, Andhra Pradesh, and Punjab etc. in recent years.
In the coming decades, aquaculture will most likely be the greatest source of increased fish production, as
fish farmers expand the water surface area under cultivation and increase yields per unit of area cultivated.
Greater use of compounded aquaculture feeds along with improvements in rearing technology and selective
breeding have the potential to significantly increase the productivity of many forms of aquaculture.
But the sector must overcome several major challenges, if it has to sustain the rapid growth of the past
years.
• Aquaculture has to face competition from other user of land and water, as these resources would
become more scarce in future
• Marine sector would face energy crisis as it would need fossil fuels for further expansion.
• Aquaculture production would be restrained by diseases as the sector expands.
• The availability of fish meal, fish oil and wild caught trash fish as feed inputs may also become a
limiting factor.
The growth rate analysis for various states from 1990-91 to 2005-06 shows that fish production had a
significant growth in all states and Union Territories except Goa, Karnataka and Tripura in case of states and
Andaman & Nicobar Islands, Dadar & Nagar Haveli, Daman & Diu and Puducherry in case of Union
Territories. In some of the states like Andhra Pradesh, Maharashtra, Orissa, Tamil Nadu and West Bengal,
the growth of inland fisheries was found to be higher than that of marine fisheries. But in Gujarat and Tamil
Nadu, marine fisheries growth was observed to be more than that of inland fisheries, though the latter is
negative and non-significant.

S&T for Rural India and Inclusive Growth 321
Allocation of funds to a particular sector is an indication of a push given for development of the sector. The
outlay for fisheries sector was about Rs. 5.13 crore in the I Five Year Plan and it went up to Rs. 2,060.54
crore in the X plan. Its share in the total plan outlay was hovering from 0.26% in I Plan to 0.52% in IV Plan
and decreasing thereafter continuously and it received only 0.14% of total outlays in X Plan. In spite of this,
the sector has been growing at an annual growth rate of about 5% over the last two and half decades.
Considering the general importance given to agricultural sector, the preference received by the fisheries
sub-sector in the plan outlays is still reasonable.
Fisheries sector witnessed a spectacular growth of over 800% in last five and half decades of planning &
development, for which technologies were the main drivers of growth. At present, fisheries research is
carried out by a huge network of institutes under different organizations, viz., ICAR, SAUs, CSIR, DOD,
DST, DBT, UGC, IITs, IIMs, Ministry of Agriculture, Ministry of Commerce, Ministry of Food Processing
Industries, several voluntary agencies / private industries etc. Most of the productivity enhancing technologies
have largely come from the research investment made by ICAR/DARE, which is the main agency responsible
for developing & disseminating technically feasible, economically viable & environmentally sustainable
technologies for the development of agricultural & allied sectors, including fisheries in our country. The
outlay for fisheries research in total agricultural research has grown from 2.7% in IV Five Year Plan to 6 %
in IX Five Year Plan, though it again dropped to 3.1% in X Plan. Overall, this showed the increasing importance
accorded to this sector to exploit the still under-exploited areas.
Among the two major sub-sector of fisheries sector, it was found that the importance accorded to research
is more than that of development over different plan periods. The share of research allocation rose from 3%
in IV Plan to about 7% in X Plan. Increasing importance accorded to research over development programmes
by the Government, shows that the planners are convinced that technologies are driving the growth in this
sector, which need to be nurtured to achieve the desired 4% growth in agriculture in the XI Plan.
It was found that investment on both fisheries research and development would be financially feasible and
beneficial to the society. An earlier study conducted by ICAR and World Fish Centre showed that the net
present value (NPV) was estimated to be Rs. 82 to 176 billion under various TFP scenarios. The internal
rate of return (IRR) from investment would be in the range of 42 to 55 percent. The benefit-cost ratio would
vary between 2.1 and 3.4.
To sustain this growth of the sector in general, technology, infrastructure and market would play a major role
apart from enhanced investment in research and development. Technology had been the main factors
responsible for the phenomenal growth of the aquaculture, particularly after the advent of carp poly-culture
and composite fish culture in the late 70s. Similarly, major investments on infrastructure such as construction
of mini harbors, jetties, landing centers, introduction of trawlers and mechanized vessels, supply of nets, etc.
led to increased catch and contribution from capture fisheries sector. However, market has not been able to
play a major driver for the growth of the sector so far. To un-tap the potential of the sector, market may take
the lead in furthering the growth, especially in the emergence of aquaculture sector.

S&T for Rural India and Inclusive Growth322
MushrMushrMushrMushrMushrooms: The vooms: The vooms: The vooms: The vooms: The vegegegegegeeeeetttttable of futurable of futurable of futurable of futurable of futureeeee
In India, mushroom is a unique non-traditional cash crop
grown indoors, both as a seasonal crop and round-the-
year under controlled environmental conditions. About
2000 species of fungi are used as food by tribes and
societies, however, only a few are cultivated. Climatic
conditions in India are favorable for natural occurrence
of mushrooms and some of them are regularly collected
and used as food by natives, particularly those belonging to tribes. Common mushrooms collected from
nature are species of Astraeus, Auricularia, Calvatia, Cantharellus, Lycoperdon, Morchella,
Schizophyllum, Termitomyces, Tuber etc.
Sustenance from Wild Collection
There is a wide scope to tap the potential in and outside our forests for providing sustained livelihood and
profit to the people through systematic collection and processing of wild mushrooms, which is till today
limited to the collection of morels only.
Value added products that can use Mushrooms
Bakery products (biscuits, bread, cakes), pickles,
chutneys, nuggets, papads & fast food items
like burgers, cutlets and pizza etc.
World
World production: 3 million tones
Market value: US $ 10 billion
Major Exporting countries
a) Fresh Mushrooms: Netherland, Poland, Ireland, Belgium
b) Preserved Mushrooms: China (41.82%), Netherland,
Spain
Major Importing countries
a) Fresh Mushrooms: U.K., Germany, USA, France
b) Preserved Mushrooms: Germany, USA, France
India
• India ranks 54th in world production & 6th as exporter
• Per capita consumption: 25g/year
• Production: 48000 tonnes /annum
• Major states: Punjab, H.P., Haryana
• Three varieties: Button, Paddy Straw & Oyster
• Value of Export of preserved Mushrooms (2006-07):
Rs 108 Crores
• Value of Export of fresh Mushrooms (2006-07): Rs 4.2
Crores
• Largest market of Indian Mushrooms: USA (69.52 %)
Medicinal properties
• Rich in Folic acid,
polysachharides, ergosterol,
higher K:Na ratio & fibre
content
• Antitumour, anticancer,
antimalarial, antifungal &
antiviral
• Counteracts pernicious anemia
& hypertension
• Delight for diabetics

S&T for Rural India and Inclusive Growth 323
Sustenance from Cultivation
Mushroom cultivation also provides employment generation. There is ample scope to earn more from mushroom
cultivation using some innovation like attractive packaging for longer shelf-life, processing units for canned
items, value addition and new products such as mushroom nuggets (burries), biscuits, papads, pickles, soup
powder, etc.
Food Security
Mushrooms are of excellent food value as they provide a full protein food containing all the twenty one
amino acids besides containing useful amount of fats, vitamins and minerals. Mushroom protein being easily
digestible (70-90%) is considered superior to vegetable proteins. Two essential amino acids lysine and
tryptophan, present in mushrooms in large amounts, are not even found in cereals. Being low in caloric value
(300–390 Kcal/100 g dry wt), low fat and high protein, they are considered as the ‘delight of diabetic
patients’. Folic acid and Vitamin B-12 which are normally absent in vegetarian foods are present in mushrooms
(3g fresh mushroom can supply 1 micro gram vitamin B12; recommended for daily uptake).
At present we have the lowest rate of protein consumption and due to population explosion the problem of
protein deficiency will become more acute. Under prevailing circumstances all possible sources of protein
products will have to be exploited to save the country from hunger and malnutrition. Edible mushrooms can
therefore be used as a weapon against starvation because of their high protein and vitamin content. Mushrooms
can in a way contribute to food security by being easily available, affordable and usable.
Major Constraints
• Mushrooms are not popular in India.
• Being highly perishable, lack of immediate access to markets is a major bottleneck in mushroom
farming.
• Lack of storage facilities like processing units, cold storage, refrigerated transport etc.
Horticulture: Post Harvest ManagementHorticulture: Post Harvest ManagementHorticulture: Post Harvest ManagementHorticulture: Post Harvest ManagementHorticulture: Post Harvest Management
Horticultural crops form a significant part of total agricultural produce in the country and have become key
drivers for economic development in many of the states in the country, and they contribute 29.5 per cent to
GDP of agriculture (Economic Survey 2007-08). These crops play a unique role in India’s economy by
improving the income of the rural people. Cultivation of these crops is labor intensive and as such they
generate lot of employment opportunities for the rural population. Fruits and vegetables are fastest growing
sectors within horticulture. India produces around 111.77 million MTs of vegetables and 57.73 million MTs of
fruits (National Horticulture Board), which accounts for nearly 11.90% and 10.90% of world production of

S&T for Rural India and Inclusive Growth324
vegetables and fruits, respectively and the country ranks second in the world. Fruits and vegetables combined
form the major contributor to total horticulture production and show a constant linear increase in production
(Fig. 6-15.01).
In the world production of fruits India is the biggest producer of banana and mango and second largest
producer of lime.
Post Harvest Research
Joint efforts of R&D institutions, farmers, government agencies with a strong post harvest infrastructure for
post harvest management and trade has resulted in India emerging as a major producer of fruits and vegetables
in the world.
Realizing the need for strong Post Harvest Management (PHM), several initiatives have been implemented:
• Establishment of packaging houses in different states which have facilities of international standards
for grading and packing of fruits and vegetable.
• Appropriate pre-treatments; like curing, hot water treatment, fungicide application, waxing pre-
cooling, packaging, storage (cold storages) have been standardized.
• Drafting of the National Food Processing Policy and Act.
• Reduction of Central Excise Exemption on Processed Products of Fruits and Vegetables.
• Establishment of Food Parks and Cooperative Food Parks.

S&T for Rural India and Inclusive Growth 325
• Establishment of Agri-Export Zones.
• Value addition.
For rural handling of farm inputs and outputs, Horticulture mission seeks to develop and make available farm
and village level technologies. All India Coordinated Research Project (AICRP) centers for Post Harvest
Technologies, Central Food Technological Research Institute (CFTRI) (CSIR) and several other organizations
involved for PHM aim to develop location and crop specific post harvest technologies and equipment to
minimize quantitative and qualitative post harvest losses and also to develop technologies for better economic
growth. Several field level technologies like cleaners, graders, dryers, decorticators etc were successfully
developed for farmers by various organizations and some are highlighted in Box.
Looking into the present agricultural production and post production scenario in India, the most appropriate
action for employment generation in rural sector is primary processing and value addition in production
catchments.
Fruits and Vegetable Processing
The Food Processing Industry sector in India is one of the largest in terms of production, consumption,
export and growth prospects. The utilization of fruits and vegetables for processing is estimated to be
around 2.20 percent of the total production. Over the last few years, there has been a positive growth in
ready to serve beverages, fruit juices and pulps, dehydrated and frozen fruits and vegetable products, tomato
products, pickles, convenience veg-spice pastes, processed mushrooms, and curried vegetables. Production
of juices and value-added products including jams, jellies, pickles, canned products etc. has become a
commercial success and all the R&D institutes & private sector are engaged in development of new innovative
products for marketing and commercialization (Box). Several significant technologies developed by Central
Institute of Post Harvest Engineering & Technology, Defence Food Research Laboratory, Indian Institute
of Horticultural Research, Indian Agricultural Research Institute, G.B. Pant University of Agriculture &
Technology, Himachal Pradesh Krishi Viswa Vidyalaya, Central Institute of Post Harvest Engineering &
Technology (CIPHET) have commercialized several rural based value added technologies and popularized
food processing technologies among the farmers and entrepreneurs (Box).

S&T for Rural India and Inclusive Growth326
Recent Policy Initiatives
• National Bank for Agriculture and Rural Development (NABARD) has set aside Rs. 1,000 crore,
especially for agro-processing infrastructure and market development.
• Excise duty on processed fruit and vegetables has been brought down from 16 percent to zero
percent in the budget, 2001-2002.
• Presently, food and food processing is regulated by 13 different laws and regulatory orders.
• All Fruit and Vegetable Products exempt from Central Excise Duty.
• New Exim Policy to set up exclusive Agro Export Processing Zones with fresh incentives.
• Ministry of Food Processing Industries is promoting Food Parks - an integrated processing concept
with common facilities and marketing.
• Specific Concessions for EOUs
• Full duty exemption on all imports
• Tax holiday for any 5 consecutive years
• Permissions to have up to 100% foreign equity
• Use of foreign brands freely permitted

S&T for Rural India and Inclusive Growth 327
EXIM Scenario
Fresh fruits and vegetables comprise almost 35% of the world trade in horticulture, out of which, almost
two-third is accounted for by four items, namely, citrus, banana, apple and grape. The other important items
are mangoes, papaya. Among the vegetables, which account for about 22% in the world trade in horticulture,
the major items are tomato, onion, potato, bean, pea, mushroom, asparagus and capsicum. Processed fruits
and vegetables account for about 20% and 17% of the world horticultural trade, respectively.
Major exports from India
Fruits: Mango, Grapes, Orange, Apple, Banana, Other Citrus Fruits and Lemon.
Vegetables: Onion, Potato, Tomato, Pumpkins
India’s major export partners
Fresh Fruits & Vegetables: UAE, Bangladesh, Malaysia, UK, Sri Lanka, Netherlands, Pakistan,
Processed Fruits &Vegetables: USA, UAE, Bangladesh, Russia, Netherlands, Nepal, UK, France, Sri Lanka,
Malaysia, Kuwait, Canada, Germany
Source: DGCIS Annual Export
For the last 10 years, Indian export statistics clearly reveal the progressive growth of exports (to World) in
the fresh as well as processed fruits and vegetables (Fig 6-15.02) and the major export partners for India is
highlighted in Box.
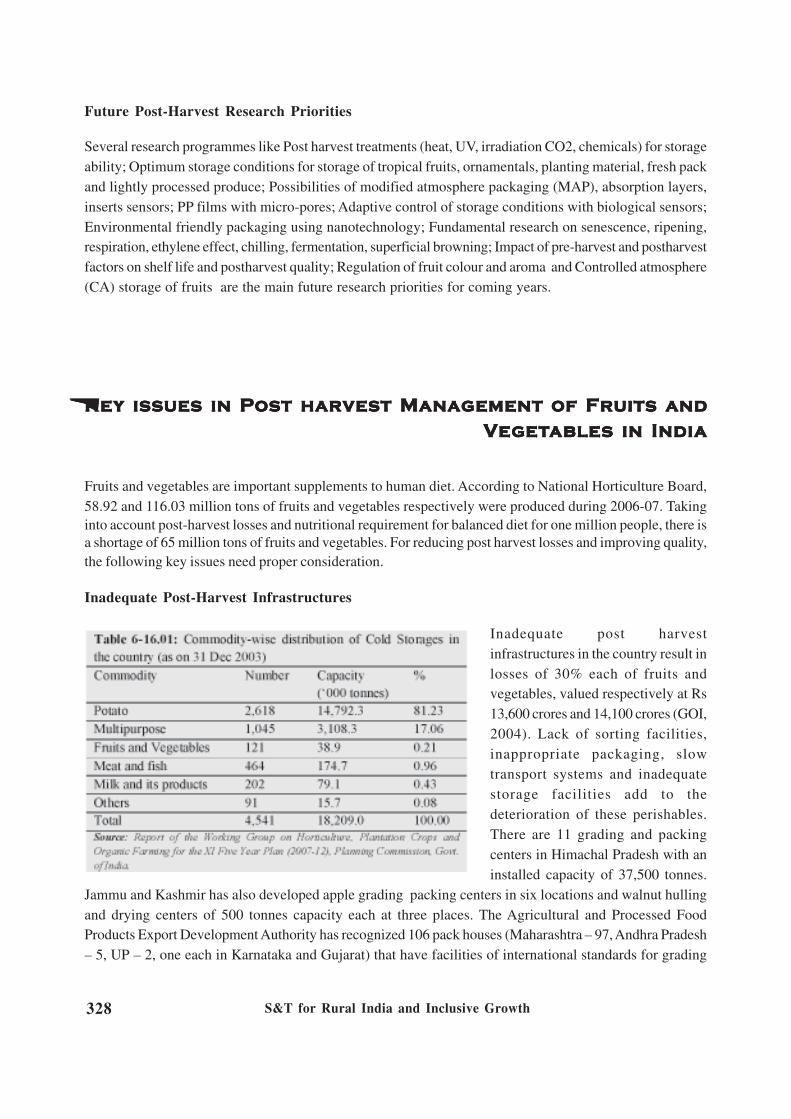
S&T for Rural India and Inclusive Growth328
Future Post-Harvest Research Priorities
Several research programmes like Post harvest treatments (heat, UV, irradiation CO2, chemicals) for storage
ability; Optimum storage conditions for storage of tropical fruits, ornamentals, planting material, fresh pack
and lightly processed produce; Possibilities of modified atmosphere packaging (MAP), absorption layers,
inserts sensors; PP films with micro-pores; Adaptive control of storage conditions with biological sensors;
Environmental friendly packaging using nanotechnology; Fundamental research on senescence, ripening,
respiration, ethylene effect, chilling, fermentation, superficial browning; Impact of pre-harvest and postharvest
factors on shelf life and postharvest quality; Regulation of fruit colour and aroma and Controlled atmosphere
(CA) storage of fruits are the main future research priorities for coming years.
Key issues in Post harvest Management of Fruits andKey issues in Post harvest Management of Fruits andKey issues in Post harvest Management of Fruits andKey issues in Post harvest Management of Fruits andKey issues in Post harvest Management of Fruits and
VVVVVegegegegegeeeeetttttables in Indiaables in Indiaables in Indiaables in Indiaables in India
Fruits and vegetables are important supplements to human diet. According to National Horticulture Board,
58.92 and 116.03 million tons of fruits and vegetables respectively were produced during 2006-07. Taking
into account post-harvest losses and nutritional requirement for balanced diet for one million people, there is
a shortage of 65 million tons of fruits and vegetables. For reducing post harvest losses and improving quality,
the following key issues need proper consideration.
Inadequate Post-Harvest Infrastructures
Inadequate post harvest
infrastructures in the country result in
losses of 30% each of fruits and
vegetables, valued respectively at Rs
13,600 crores and 14,100 crores (GOI,
2004). Lack of sorting facilities,
inappropriate packaging, slow
transport systems and inadequate
storage facilities add to the
deterioration of these perishables.
There are 11 grading and packing
centers in Himachal Pradesh with an
installed capacity of 37,500 tonnes.
Jammu and Kashmir has also developed apple grading packing centers in six locations and walnut hulling
and drying centers of 500 tonnes capacity each at three places. The Agricultural and Processed Food
Products Export Development Authority has recognized 106 pack houses (Maharashtra – 97, Andhra Pradesh
– 5, UP – 2, one each in Karnataka and Gujarat) that have facilities of international standards for grading

S&T for Rural India and Inclusive Growth 329
and packing of fruits and vegetables particularly for exports. As on 31 December 2003 (See Inbox) the
capacity of cold storage in the country is 18.21 million tonnes (about 10 % of total production).
Lack of Processing Facilities
In 1996, there were more than 4,000 processing units of various capacities in the country. Of these, 70% are
in small scale and unorganized sector. Less than 2% of fruits and vegetables in India are being processed. A
boost to 10% by 2010 would require an investment of Rs 1,40,000 crores, that would most likely generate
direct and indirect employment for 7.7 and 30 million people, respectively. The constraints perceived in the
growth of food processing are: cost of processed food is high, unavailability of quality raw material, inadequate
infrastructure, high packaging costs, unavailability of timely credit, technological obsolescence, long and
fragmented supply chain, taxation on processed foods and processed food quality monitoring & certification
problems.
Pesticidal Contamination
Consumption of pesticides in India has increased from 2,353 MT in 1955-56 to 40,672 MT in 2004-05. The
consumption of pesticides by vegetables in India is 9%. Major vegetables like tomato, okra, cabbage, brinjal,
capsicum, potato and cauliflower showed pesticidal contamination with organochlorines, organophosphates,
synthetic pyrethroids and carbamate insecticides during 1988-2000. Among these, 61% samples were found
contaminated, with about 11 per cent samples having residues above MRL. During 1998-99, out of the 180
samples of mango, grapes, berries, guava, ber, orange, sapota, pomegranate analyzed for fungicides, gibberellic
acid insecticides, 55% were found contaminated with pesticide residues and 6% exceeded their MRL values.
Plant Breeding for Quality
The current focus of plant breeding in India is on higher yield, disease resistance, herbicide resistance,
drought and salinity tolerance and to some extent quality. The focus now should be on biochemical qualities
such as proteins, vitamins, sugar, dry matter, flavor, alkaloids, flavonoids, etc.
LivLivLivLivLivesesesesestttttococococock in Mixk in Mixk in Mixk in Mixk in Mixed Fed Fed Fed Fed Farararararming: A Leming: A Leming: A Leming: A Leming: A Levvvvverererereraging Asseaging Asseaging Asseaging Asseaging Asset ft ft ft ft fororororor
Inclusive Rural DInclusive Rural DInclusive Rural DInclusive Rural DInclusive Rural Development in Indiaevelopment in Indiaevelopment in Indiaevelopment in Indiaevelopment in India
During 1997 to 2003, the total livestock population has decreased by around 14.1%. Among cattle, the
population of indigenous breed has decreased by around 7.6% while crossbreed cattle shows an increase of
12.6%. There are only 30 breeds of cattle and 6 breeds of buffalo registered along with the National Bureau
of Animal Genetic Resources (NBAGR), Karnal. India’s total milk production as on 2004 stands at 97.1 MT
(Million Tonnes) which accounts for 14.9 % of the global milk production. Annual growth rate of milk
production was 4.11% during 1990-91 to 2000-01. The per capita availability of milk in India is 241 gm/day
which is much less than many developed countries like USA (661 gm/day), UK (656 gm/day). The value of

S&T for Rural India and Inclusive Growth330
consumption of milk and milk products for 30 day period has increased from Rs. 5.29 (1977-78) to Rs 47.60
(2003-04) for rural India. Likewise, the value of meat production from beef has also increased over the
years indicating the importance of livestock for rural people.
Production of Eggs, Milk and Meat Requirement:
From the graph below, we have an idea of projected meat consumption in 2020. For India the consumption
reaches 8 million tons in 2020 (just double from 1993). This rate is almost the same as for the rest of the
world. We observed a declining trend of employment in livestock sector from 4.88% in the year 1983 to
3.05% in the year 2000.

S&T for Rural India and Inclusive Growth 331
Status of Livestock Asset according to Land Holding Capacity
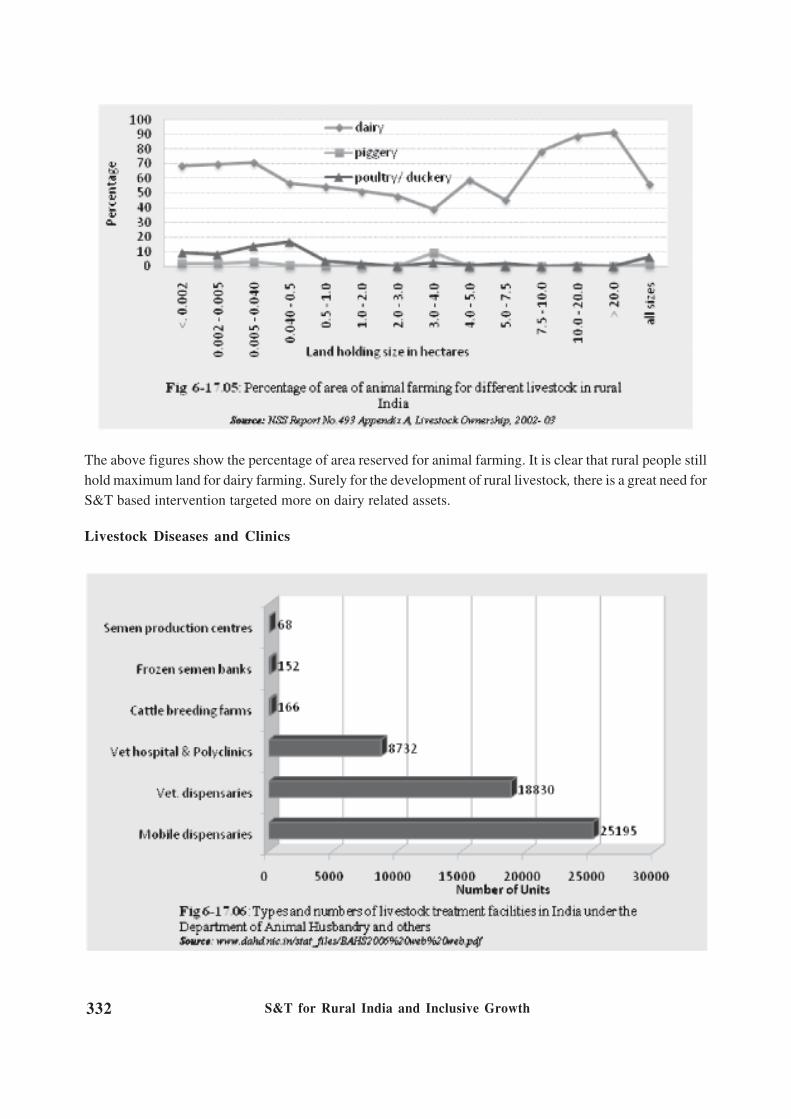
S&T for Rural India and Inclusive Growth332
The above figures show the percentage of area reserved for animal farming. It is clear that rural people still
hold maximum land for dairy farming. Surely for the development of rural livestock, there is a great need for
S&T based intervention targeted more on dairy related assets.
Livestock Diseases and Clinics

S&T for Rural India and Inclusive Growth 333
Total number of buffalo breeding farms under Animal Husbandry Department (AHD) is 26. And the numbers
of Gaushalas under AHD is 870 and from other department is 2,215. Diseases are the main problems for the
Livestock Health & Disease Control (LH & DC): macro-management scheme called “Livestock Health
and Disease Control” is being implemented with an outlay of Rs. 525.00 crores.
Key Points to Focus on
• Livestock in general and cattle and buffalo in particular are important sources of livelihood for rural
people. While the available land is unevenly distributed, the livestock resources are equitably distributed
is a unique feature for rural India. These resources once managed properly with special emphasis on
value addition and integrated market approach can bring change in rural economy. We must be careful
about the entry of corporate sector, by ensuring the stake of the small dairy farmers. The AMUL as a
model could prove instructive in future, without proper cooperative mode and inclusion of milk producers
as Chairman and Board member the effort cannot achieve the success.
• Expansion of veterinary services must be in public sector mode because of low paying capacity of
small dairy farmers.
• Downsizing of dairy technology is one of the most sought technological interventions. TIFAC has
provided support to Gujrat farmers in downsizing Chilling Plant.
• Milk Marketing is still handled by unorganized sector. This should change with proper introduction of
cooperatives to maintain safety standards/quality for milk consumption and also to help small dairy
farmers.
• As per MSME Census 2001-02, only 0.15% of the total registered MSMEs are related to dairy products
(like manufacturing of ghee, khoa, ice-cream, sweet meats) in rural India. To increase rural employment,
we need to emphasize setting up small dairy related processing units.
• More VSAT and Telemedicine centers for quick remedy of livestock diseases in remote villages.
• Multi-skilled veterinary training centers are a unique method to take care of the veterinary problems in
rural India’ including marketing of veterinary by-products.
• Livestock can also be used as an asset generator as well as the pledgeable in case of emergency.
• Multi skilled veterinary training centers is a unique method to take care of the veterinary problems in
rural India including marketing of veterinary by-products.
• Making a national database on dairy byproducts like khoa, ghee, paneer etc produced by unorganized
sector of dairy product producer can help to standardize and analyze the products mainly consumed by
huge number of middle class people in India.

S&T for Rural India and Inclusive Growth334
Sericulture Industry in India –Sericulture Industry in India –Sericulture Industry in India –Sericulture Industry in India –Sericulture Industry in India – A Review A Review A Review A Review A Review
Sericulture is both an art and a science of raising silkworms for silk production. It is a farm-based, labor
intensive and commercially attractive economic activity. At present it exists as cottage and small-scale
industry. A brief overview of the present status of the sericulture industry in India, its trends, position in
global sericulture as well as science and technological achievements and some critical issues like potentiality
of the sector in national economy, rural development, women empowerment and employment generation
have been identified to underline the importance of the sector as an instrument of poverty alleviation in India
and finally some possible approaches have been suggested for sericulture development in India.
Present Status
India is the second largest producer of raw silk after China and the biggest consumer of raw silk and silk
fabrics. Currently, the domestic demand for silk, considering all varieties, is nearly 25,000 MTs, of which only
around 18,475 MTs (2006-07) gets produced, the rest being imported mainly from China.
Types of Silk
India is a home to a
vast variety of silk
secreting fauna
which also includes
an amazing diversity
of silk moths. This
includes all the five
commercially traded
varieties of natural
silks namely,
Mulberry, Tropical
Tasar, Oak Tasar, Eri
and Muga. Indian
domestic silk market
is mainly multivoltine
mulberry silk oriented. Variety-wise share of raw silk production during the year 2007-08 has been depicted
in Fig 6-18.01.
Science, Technology and Trends
Over the last few decades, Indian silk industry has registered an impressive growth, both horizontally and
vertically. The age old multivoltine hybrids have been replaced by multivoltine × bivoltine and bivoltine
hybrids with a quantum jump in the raw silk productivity. Average yield of 25 kgs of cocoons / 100 dfls in the
recent past, have increased to current range of 60 – 65 kgs / 100 dfls. The new technology, besides doubling
yields has also led to qualitative improvements in cocoon production with considerably reduced renditta. Silk
statistics of India is presented in Table 6-18.01.

S&T for Rural India and Inclusive Growth 335
India has a large domestic market for silk goods and about 85% of silk goods produced are sold in the
domestic market. However, India exports approximately 15% of its output of all types of silk goods (including
value-added items). The export of silk products has been showing a steady growth and the export earnings
showed a rapid increase during the last decade (Fig 6-18.02).
Position in Global Sericulture
Global raw silk production was around 1,25,605 MTs in the year 2005-06, with China as the major player
with 81.65% share followed by India with around 14% (Table 6-18.02).

S&T for Rural India and Inclusive Growth336
Potentiality of the Sericulture Industry
Seri biodiversity: Among 34 mega biodiversity countries in the world, India is home to many species of
insects with a diverse silk moth fauna.
Sericulture and national economy: In India, sericulture related activities ensure the livelihood security of
over six million families spread over in some 59,000 villages across the country. The silk sector is also a
valuable foreign exchange earner for the country (Rs. 3,338 crores during 2006-07).
Sericulture and women empowerment: Sericulture provides ample opportunities for income for women in
the rural areas particularly in silkworm rearing and reeling activities. Involvement of women in different
activities of sericulture is about 53% (Table 6-18.03).
Sericulture and rural development: Sericulture being a farm-based enterprise is highly suited both for
large and small land holdings, with low capital investment. Largely, the silk goods are purchased by the urban
rich and middle-class consumers and it is estimated that around 57 % of the final value of silk fabrics flows
back to the primary producers in the rural areas.
Sericulture and employment generation: Raw silk production is the most appropriate tool to provide
gainful employment to the poorer sections of the society, as the net income ranges from Rs. 12,000 to 70,000
per annum depending upon the variety of the silk to be produced and the unit area (under host plants). It is
estimated that sericulture can generate employment @11 man-days per kg of mulberry raw silk production
(in on-farm and off-farm activities) throughout the year (Table 6-18.04).

S&T for Rural India and Inclusive Growth 337
Sericulture and new emerging area (value addition and product diversification): It is imperative that adequate
thrust on non-traditional uses of silk could create a positive pressure in the sector to concentrate on high
quality raw material for high value addition leading to a quantum leap forward.
The non-traditional areas are:
• Medical application
Ø Artificial skin
Ø Artificial blood vessels
Ø Artificial bone
Ø Suture threads
• Cosmetics such as facial masks, dermal lotions, powders etc.
• Liquid silk
• Interior home decor and handicrafts
Ø Wall papers
Ø Lampshades
Sericulture and higher profit: Several socio-economic studies have affirmed that the benefit-cost ratio in
sericulture is highest among comparable agricultural crops (Fig 6-18.03).

S&T for Rural India and Inclusive Growth338
Summing up
Indian silkworm breeds are multivoltine and though good progress has been achieved in multivoltine ×
bivoltine silk production, the quality still remains inferior to that of Chinese breeds which are bivoltine.
Recently, Central Silk Board has started a testing laboratory for Silk and Zari at Kancheepuram to facilitate
customers, producers and other stakeholders for spot non-destructive testing of silk and zari material. More
importantly, ‘Silk Mark’ Scheme has been introduced by Silk Mark Organization of India (SMOI), a registered
society, sponsored by Central Silk Board, Ministry of Textiles, Government of India. The Silk Mark is a
quality assurance label for the assurance of pure silk and in addition serves as a brand for generic promotion
of Pure Silk. The Silk Mark is under the process of registration as a Trade Mark.
Indian sericulture is not only vast, widely dispersed but also multidisciplinary in nature involving silkworm
seed sector, cocoon sector (cultivation of food plants and silkworm rearing) and post cocoon sector (silk
reeling, spinning, twisting, processing and weaving). Although collaborative research activities promoted
and implemented by the Central Silk Board in association with National level R&D Institutions, State Sericulture

S&T for Rural India and Inclusive Growth 339
Research and Development Institutes, Universities, Department of Science and Technology, Department of
Biotechnology, CSIR / ICAR / IARI / IITs / IIMs and other Private and International Research and
Development, have resulted in the development of appropriate technologies towards attaining higher quality
and productivity levels of Indian silk, there is however a big gap between the domestic demand and supply.
In spite of abundant natural resources, socio-economic benefits of the sector like generation of employment
for large sections of tribals and marginalized rural men and women, growing export market as well as large
domestic demand, a variety of problems have kept Indian sericulture from achieving its true potential. In this
context, some possible approaches have been suggested:
• Evolution of appropriate cost-effective technologies through focused research projects addressing
constraints and maximizing the production of quality eggs.
• Teaming up of sericulture scientists with molecular biologists, bio-engineers, immunologists, textile
technologists, clinicians, experts from industry and a host of other stakeholders in charting out a new
road map.
• Adoption of region and season specific approaches in the development of superior breeds / hybrids and
feed package of practices.
• Establishment of close linkage between forward and backward sub-systems for greater efficiency and
synergy as sericulture and silk industry is highly scattered and unorganized.
• Identification and promotion of potential clusters for Bivoltine and Vanya silk production in potential
traditional and non-traditional areas.
• Skill up-gradation through structured and specially designed training programmes.
• Establishment of linkages among the four identified production sub-systems viz., seed, cocoon, yarn
and fabric.
• Capacity building for production and supply of adequate quality planting material, silkworm seed, reeling
cocoons and silk yarn through promotion of large-scale production units with required techno-financial
support.
• Development and promotion of participatory extension system for effective adoption of technologies
by similar stakeholders.
• Protection to some extent of Indian silk market from Chinese cheap raw silk and fabrics by
implementation of anti-dumping duty.
• Effective utilization of by-products for value addition.

S&T for Rural India and Inclusive Growth340
PPPPPoooootttttential of Bio-pesential of Bio-pesential of Bio-pesential of Bio-pesential of Bio-pesticides in Indian Aticides in Indian Aticides in Indian Aticides in Indian Aticides in Indian Agggggrrrrriculturiculturiculturiculturicultureeeee
vis-a-vis Rural Developmentvis-a-vis Rural Developmentvis-a-vis Rural Developmentvis-a-vis Rural Developmentvis-a-vis Rural Development
Pest induced crop loss is on the rise despite increasing usage of pesticides. Fortunately, realization of the
negative effects of chemicals (including on humans) shifted the focus to more reliable, sustainable and
environment friendly agents of pest control - the Bio-pesticides. In spite of the claimed efficacy, their use,
however, has remained very low due to a number of socio-economic, technological and institutional constraints.
Nonetheless, rise in income levels coupled with increasing awareness of health related effects of chemicals
increased the demand for organic foods. In view of this demand and the government’s efforts to mitigate
climate change, bio-pesticides are going to play an important role in future pest management programmes.
The status of bio-pesticides as well as their future prospects for increasing agricultural production in general
and for sustainable rural development in particular is discussed here.
Scope of Bio-pesticides
A pesticide that is of biological origin is known as bio-pesticide. They are highly specific, affecting only the
targeted pest or closely related pests and do not harm humans or beneficial organisms, while chemical
pesticides are broad spectrum and known to affect non-target beneficial organisms including humans.
The striking feature of bio-pesticides is environment friendliness and easy biodegradability. In terms of
production and commercialization also, bio-pesticides have an edge over chemical pesticides because they
involve low research expenditure and have faster rates of product development.
Usage of Bio-pesticides
The global weighted average consumption level of bio-pesticides is about 1 kg/ha. With the global organic
farming area comprising about 24 million hectares, global bio-pesticide consumption is thus estimated at
about 24 million Kg.
Industry Overview
In 2005, bio-pesticides accounted about 2.5% of the total pesticide market, up from merely 0.2% during
2000. This share is expected to grow to about 4.2% by 2010 while the market value is estimated to reach
more than US $1 billion (BCC research). Orchards claim the largest share (55%) of the total bio-pesticides
used. Region wise, North America consumes the largest share (40%) followed by Europe and Oceanic
countries accounting for 20% each.
Factors affecting Growth of Bio-pesticides
Some factors which have restricted the growth of bio-pesticides are:
• Low reliability because of low stability

S&T for Rural India and Inclusive Growth 341
• Target specificity means more work for the farmers
• Slow action compared to synthetics
• Erratic availability of bio-pesticide in the market
• Regulatory system favorable to chemical pesticides
• Declining multiple/mixed cropping.
R & D Status of Bio-pesticides
In terms of research publications, India occupies 2nd position with 443 papers, which accounts for 13.23% of
the 3,348 global papers on bio-pesticides. The share of India in bio-pesticide related patents is only 3.55% of
the global holdings.
The average annual growth rate of global publication during the specified period is 51.1% while that of India
is 37.4%. In terms of patenting, Indian condition appears to be very poor. India has so far secured only 19
patents in bio-pesticides.
Bio-pesticides in India
Bio-pesticides represent only 2.89% (as on 2005) of the overall pesticides market in India and are expected
to exhibit an annual growth rate of about 2.3% in the coming years. In India, so far only 12 types of bio-
pesticides have been registered under the Insecticide Act, 1968. Neem based pesticides, Bacillus thuringensis,
NPV and Trichoderma are the major bio-pesticides produced and used in India.

S&T for Rural India and Inclusive Growth342
Consumption of bio-pesticides has increased from 219 MT in 1996-97 to 683 MT in 2000-01; about 85% of
the bio-pesticides used are Neem based products. Consumption of chemical pesticides has significantly
fallen from 56,114 MT to 43,584 MT during the same period.
Public Support System
The Indian government is promoting bio-pesticide usage through various rules, regulations, policies and
schemes. The Department of Biotechnology (DBT) spearheads the promotion of bio-pesticides, especially
research funding and production. The National Centre of Integrated Pest Management (NCIPM) looks
after plant protection needs in various agro-climatic zones of the country. Besides, it oversees the setting up
and running of State Bio-control Labs (SBCLs). There are around 38 such SBCLs across the country.
The Insecticide Act of 1968 has been amended to simplify the process of registration to allow speedier
development and production of bio-pesticide. The National Farmers Policy 2007 has recommended the
promotion of bio-pesticides for increasing agricultural production. It also says bio-pesticides would be treated
at par with the chemical pesticides in terms of support and promotion.
Bio-pesticides for Rural Development
Desired agricultural growth can be achieved in part through recognition and capitalization of the rich traditional
knowledge base of India, especially in bio-pesticides. Successful use of traditional knowledge includes
development of commercial pesticides from Azadirachta, Cymbopogon etc. Hundreds of plants like Mahua,
Tagetes, and Chenopodium etc await serious attention. The suggestion of National Commission on Farmers
to provide incentive/support for promoting the purchase of products developed using indigenous technologies
in areas including bio-pesticide appears to be a concrete approach to boost rural livelihood. But, the National
Farmers Policy 2007 does not reflect any such interventions. Working out a mechanism to certify traditional
bio-pesticides in the line of Public Guarantee System (PGS) of organic products is desirable. This certification
system should be integrated with the Panchayat System for administrative control. The research organizations
should contribute to the certification process by providing empirical evidences of the traditional practices.
Bio-pesticide has the potential to be developed into a rural industry like many other sectors. For instance
‘Natural dye’ has successfully emerged as a rural household industry in the villages adopted by Gandhigram
in Tamil Nadu. Likewise, the production of bio-pesticides can be a decentralized activity under the Ministry
of Rural development.
Opportunities
If we consider the global usage of 1 kg of bio-pesticide per hectare of organic farming area, India should be
consuming at least 1,00,000 MT of bio-pesticide instead of the present 2,890 MT. This indicates the huge
scope for growth of the bio-pesticide sector in India. Due to rising cost of developing new molecules and the
incapability of most Indian companies to invest such amounts, there should be greater growth in the bio-
pesticide sector. Rich biodiversity of India offers plenty of scope for natural biological control organisms as
well as natural plant based pesticides. Rich traditional knowledge base of the diverse indigenous communities
may provide valuable clues for developing effective bio-pesticides.

S&T for Rural India and Inclusive Growth 343
IndigIndigIndigIndigIndigenous Aenous Aenous Aenous Aenous Agggggrrrrriculturiculturiculturiculturicultural Syal Syal Syal Syal Syssssstttttems of Nems of Nems of Nems of Nems of Nororororortttttheasheasheasheasheast Indiat Indiat Indiat Indiat India
Certain indigenous agricultural systems found in Northeast India with their inbuilt sustainability offer tremendous
scope for addressing the ecological crisis and quest for sustainability today. They are presented here very
briefly.
Rice based farming system of the Apatanis
The economy base of the Apatanis community in the Lower Subansiri district of Arunachal Pradesh comprises
of sustainable integration of land, forests, water and farming systems. The farmers grow wet rice, integrated
with fish culture in terraces and finger millets on terrace bunds. Common carp (Cyprinus carpio), on
reaching 200 gm weight in four months time are harvested. The fish feed on phytoplankton and other
naturally available microorganisms. Every stream arising from the surrounding hills is tapped and diverted to
the terrace fields by a network of water channels. Agricultural wastes such as straw, pig and poultry
droppings, rice husks, kitchen waste, ash, weeds are decomposed in the fields. No modern agricultural
implements and inputs such as HYVs, fertilizers, pesticides, etc are used. Despite this they have been able
to sustain paddy yields of about 5.2 t/ha over the years. Domestic sewage directed to the fields adds organic
matter to the soil and also provides feed to the fishes. The hills surrounding the terraces are covered with
natural and plantation forests and these are conserved through taboos and strict penalties.
Zabo farming system of the Chakhesangs
The Zabo farming system is an integrated agricultural and forestry land use system found in Kikruma, a
Chakhesang tribe inhabited village in Phek district of Nagaland. The word ‘Zabo’ means impounding of
water. It is a viable practice of resource management and maintenance of ecological balance. The system
consists of a protected forestland towards the top of the hill, water-harvesting tanks in the middle and cattle
yard and wet rice terraces at the lower side. Fish fingerlings are raised in a small pit, dug in the middle of the
wet rice terraces of 0.2-0.8 ha in size. From one-hectare field, 3-4 tons of paddy and 50-60 kg of fish are
harvested.
Bamboo drip irrigation system of Meghalaya
Bamboo drip irrigation system, practiced mainly in the Jaintia and Khasi Hills of Meghalaya for the last 200
years is a useful irrigation system in a place where there is water scarcity and soils are poor in water holding
capacity, the topography is rocky and undulating and irrigation is required for crops that need relatively less
water. Water distribution is done with the use of bamboo channels, bamboo supports, water diversion pipes
and strips. Betel vines, arecanuts, black pepper are irrigated with this system in which water trickles or drips
drop by drop at the base of the crop. This is achieved by having holes at appropriate points on the water
distribution channels. Water from the natural stream located at a higher elevation is conveyed to the plantation
sites through gravitational flow with the use of bamboo channels. It takes about 15 days for 2 laborers to
install the system in a hectare of land. The maintenance cost is minimal.
Alder-based jhum system of the Angamis
The alder-based jhum system was developed in Khonoma village in Nagaland. It provides about 57 food
crops to supplement the staple crop rice. The root nodules of the Alder (Alnus nepalensis) plants improve
soil fertility by fixing atmospheric nitrogen into the soil. The fallen leaves act as mulches and add humus to

S&T for Rural India and Inclusive Growth344
soil. The wood is used as fuel-wood, for charcoal burning and in construction. The mature wood is used for
making luxury furniture. Alder saplings collected from nursery or wild forest are planted in a jhum field
located in hills above 1000 m. In the first year in a jhum plot, alder trees are pollarded at a height of 2 m from
the ground before or after the slash and burn operation. Mixed cropping is repeated in the second year. The
field is then left fallow for 2-4 years to allow the alder trees to grow for pollarding and cropping in the
subsequent cycle. Initial pollarding is done when young trees with bole circumference of about 50-80 cm are
pollarded for the first time, usually at the age of 7-10 years. Cyclical/subsequent pollarding is performed
after 4-6 years. During this operation, the pollarded stumps that coppice profusely are allowed to grow till
the harvest of the first year’s crop. On the second year, 4-5 selected shoots are retained and the rest
removed. These shoots are allowed to grow till the next jhum cycle and the same process is repeated. Thus
with the incorporation of alder trees in their jhum lands, the farmers are able to obtain higher productivity
while at the same time avoid loss of soil fertility.
FFFFFoodgoodgoodgoodgoodgrrrrrains: Seed Deains: Seed Deains: Seed Deains: Seed Deains: Seed Devvvvvelopment & Prelopment & Prelopment & Prelopment & Prelopment & Productionoductionoductionoductionoduction
India is a labor-abundant and land-scarce country. Agricultural growth therefore largely depends upon
raising productivity of the land. The generation and diffusion of new yield improving technologies is therefore
critical in sustaining agricultural growth. As varietal development is embedded in seeds, they are therefore
primarily responsible for triggering progress in agricultural sector.
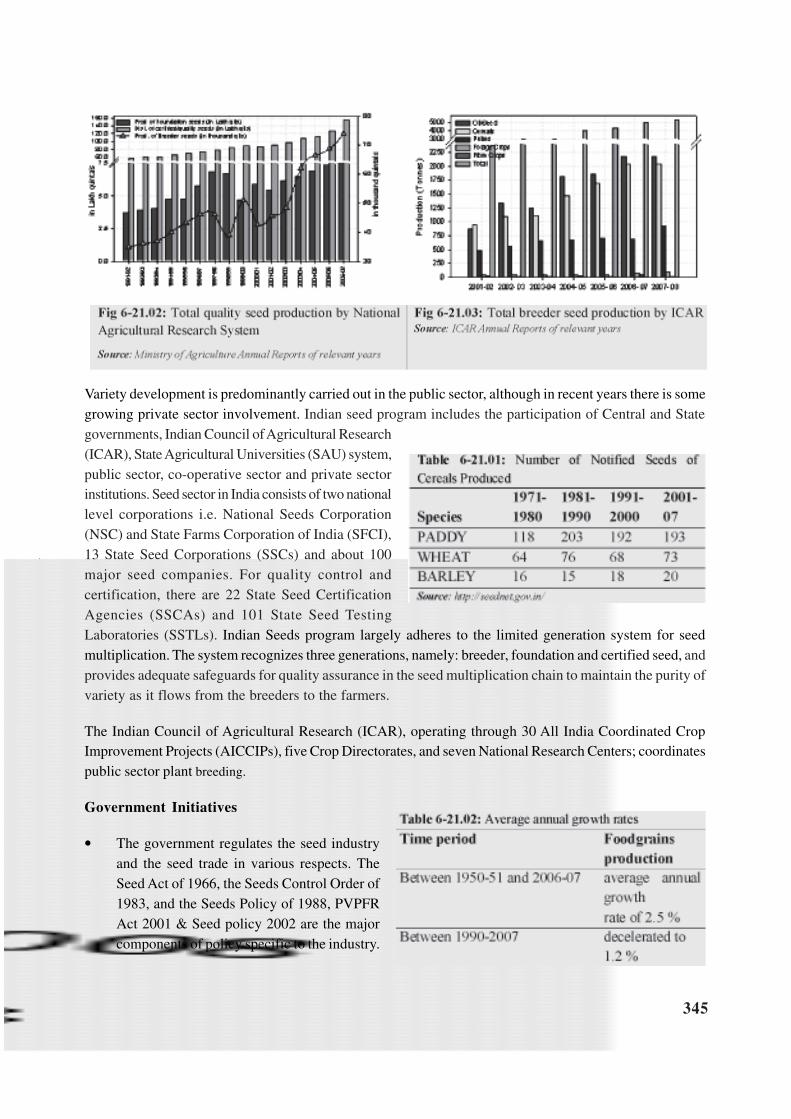
S&T for Rural India and Inclusive Growth 345
Variety development is predominantly carried out in the public sector, although in recent years there is some
growing private sector involvement. Indian seed program includes the participation of Central and State
governments, Indian Council of Agricultural Research
(ICAR), State Agricultural Universities (SAU) system,
public sector, co-operative sector and private sector
institutions. Seed sector in India consists of two national
level corporations i.e. National Seeds Corporation
(NSC) and State Farms Corporation of India (SFCI),
13 State Seed Corporations (SSCs) and about 100
major seed companies. For quality control and
certification, there are 22 State Seed Certification
Agencies (SSCAs) and 101 State Seed Testing
Laboratories (SSTLs). Indian Seeds program largely adheres to the limited generation system for seed
multiplication. The system recognizes three generations, namely: breeder, foundation and certified seed, and
provides adequate safeguards for quality assurance in the seed multiplication chain to maintain the purity of
variety as it flows from the breeders to the farmers.
The Indian Council of Agricultural Research (ICAR), operating through 30 All India Coordinated Crop
Improvement Projects (AICCIPs), five Crop Directorates, and seven National Research Centers; coordinates
public sector plant breeding.
Government Initiatives
• The government regulates the seed industry
and the seed trade in various respects. The
Seed Act of 1966, the Seeds Control Order of
1983, and the Seeds Policy of 1988, PVPFR
Act 2001 & Seed policy 2002 are the major
components of policy specific to the industry.

S&T for Rural India and Inclusive Growth346
• All India Coordinated Research Project (AICRP) on seed called “National Seed Project” initiated in
1979, has 35 breeder seed production centers and 23 seed technology research centers.
• Mega seed project captioned “Seed production in Agricultural Crops and Fisheries” with total outlay of
Rs.198.89 crores is the country’s biggest seed project under DSR coordination.
• Recent Programmes launched: National Food Security Mission (total outlay of Rs. 4,882.5 crore for XI
five year plan) and Rashtriya Krishi Vikas Yojana (Rs.25,000 crore for XI five year plan).
But recently a sharp decline in the rate of growth of foodgrains production (Table 6-21.02) is observed
which can be attributed to the slackening in the pace of rapid improvement in the yield levels pointing to the
need for some technological interventions. Some suggestions therefore are
R&D Focus
• Developing HYV for abiotic stress areas. The lack of suitable varieties for rain-fed upland and lowland
areas, flood prone or cold tolerant varieties is one of the major reasons why some areas are still
uncovered by modern varieties.
• Currently crucial aspect is biodiversity conservation, its enhancement and utilization such that indigenous
pure-lines are conserved without genetic mixing. Emphasis should therefore be on varietal improvement
of traditional wild varieties such that loss of biogenetic wealth is curbed.
Seed Strategy/Long Term Policy Framework
• Focus on improving inter and intra-sectoral linkages. Put together all resources for an outcome oriented
research program, especially in the area of using high-yielding varieties of seeds, extension support for
facilitating adoption of improved practices, and market access.
• Focus on areas which can be brought under HYV program, such that a paradigm shift can be made
from emphasis on technologically saturated areas to the areas untouched.
GM CrGM CrGM CrGM CrGM Crops: Pops: Pops: Pops: Pops: Poooootttttential fential fential fential fential for Second Gror Second Gror Second Gror Second Gror Second Green Reen Reen Reen Reen Reeeeevvvvvolution?olution?olution?olution?olution?
Genetically modified or “GM” crops are being considered as having the potential to bring about second
green revolution. India is currently working on 111 transgenic crop varieties of various vegetables, fruits,
spices, cereals, bamboo etc. Transgenic crops: brinjal, cabbage, castor, cauliflower, corn, groundnut, okra,
potato, rice and tomato are under field trials stage. But it is cotton which was the first GM crop to be
extensively worked upon and commercially released in India.

S&T for Rural India and Inclusive Growth 347
BT cotton in India
• First Bt cotton hybrid “Bollgard” released
in 2002
• Total cultivated area-6.2 million Ha
• India’s position 5th in Bt cultivation
• Private companies-16
• First indigenous cotton variety-
Developed by Central Institute of Cotton
Research “Bikaneri Narma”
Legal Institution
For approval of GMO, Genetic
Engineering Approval Committee
(GEAC) is the regulatory authority
under Ministry of Environment and
Forests. DBT brings out manuals of
guidelines specifying procedures for
regulatory process, activities involving
GMOs in research, use and application
from environmental safety angle. And
the mechanism of implementation of
these guidelines is through the
Recombinant DNA Advisory
Committee (RDAC) and Institutional
Bio-Safety Committee (IBSC).
For importing GMO, the permits are
issued by the director NBPGR with
prior approval from Review Committee
on Genetic Manipulation (RCGM).
Plant Quarantine (Regulation of Import
into India) Order, 2003 regulates the
import of GMO.
For a GM seed to be commercially released it has to go under various examinations conducted by IBSC,
RCGM, GEAC.
Time clearance to release a crop in India is minimum three years. This includes one year of multi-location
trials for generating bio-safety data monitored by RCGM, followed by two years of large-scale field trials
under the aegis of GEAC. Along with this, seeds are also provided to ICAR for assessing its agronomic
performance for a period of two years. If the reports are satisfactory then GEAC allows the company to
proceed with seed multiplication for commercial release.

S&T for Rural India and Inclusive Growth348
GM Foods
Processed GM foods are monitored and regulated by the Food Safety and Standards Authority of India,
which was established under the new Food Safety and Standards Act, 2006. It is an autonomous body under
health ministry.
Implications
It can be seen that area under genetically modified crops has increased substantially resulting in surge in
productivity. There is also an established regulatory mechanism regarding GM crops. But with all the systems
in place, still there are apprehensions about it.
It is generally major international and public
organizations which are advocating the use of
GM seeds. The Non-governmental
organizations like Center for Sustainable
Agriculture (CSA), Gene Campaign, Navdanya
and Bharat Krishak Samaj etc. are voicing their
concerns on the dubious reports of these
organizations. Even one of the eminent scientists
Dr. Pushpa Bhargava who founded Center of
Cellular and Molecular Biology and was
involved in setting up of DBT is against control
of agriculture by multinational companies.
According to their grass root and scientific
studies/ surveys they found that other than bio-
safety and environmental controversies
surrounding Bt cotton, the major implication is
the economic viability of its cultivation. The cost
of Bt cotton seeds being exorbitant for poor
Indian farmers (nearly three times more than
non-Bt seeds) has resulted in large debts. In
parlance to it NGOs point to a worrying rate of
suicide among cotton farmers, though no direct
correlation has been established as yet. This
has gained ire from the public in recent times.
Although it is too soon to be sure of overall
impacts of Bt cotton but with polarization of opinions between pro–GM government and industry and anti-
GM NGO activists, it’s a bit difficult to come to any conclusions on the overall efficacy of the
technology.

S&T for Rural India and Inclusive Growth 349
ICT in AICT in AICT in AICT in AICT in Agggggrrrrriculturiculturiculturiculturiculture Mare Mare Mare Mare Markkkkkeeeeetingtingtingtingting
“No country will reap the benefits of the network age by waiting for them to fall out of the sky.
Today’s technological transformations hinge on each country’s ability to unleash the creativity of its
people, enabling them to understand and master technology, to innovate and to adapt technology to
their own needs and opportunities.”
The Human Development Report, 2001
The Indian Agricultural Scenario
India with 127 different agro climatic zones, immense biodiversity and natural resources is one of the biggest
food grain and oilseed producers in the world. Small farms produce 41 % of India’s total grain (49% of rice,
40% of wheat, 29% of coarse cereals and 27% of pulses, and half of its fruits and vegetables) India’s
economic growth significantly depends on the health of the agriculture sector which provides employment to
62.5 % of the work force and contributes 18 % to GDP, earning 14.7 % export revenue. Like agriculture, the
subject of agricultural marketing is in the concurrent list of the Indian Constitution and is gaining importance.
Agricultural Marketing in India with the help of ICTs is undergoing a significant metamorphosis and
considerable opportunities have opened up. The Vision 2020 document of the Department of Agriculture and
Co-operation acts as catalyst towards the development of “Agriculture Online”. The various digital initiatives
undertaken by the Government are Agrisnet, Agris, Agmarknet, Dacnet, Vistarnet, Aphnet, Fishnet, Hortnet,
Seednet, Ppin, Coopnet, Fertnet, Arisnet, Afpinet, Arinet, Ndmnet etc. with their independent websites.
Regional Initiatives/Projects: AgriWatch; Krishi Vigyan Kendra’s; MSSRF’s “Mission 2007” (Village
Knowledge Centers); e-choupals; Hariyali Kisan Bazaar N. Delhi; Tata Kisan Kendra U. P., Haryana and
Punjab; Krishi Vipanan M.P.; Grasso PCO Project and Krishi Marata Vahini Karnataka; Kissan Kerala and
e-Krishi Kerala; NCDEX, MCX, Akashganga Gujarat; aAQUA Pune, Mahindra Kisan and Krishiworld
Maharashtra; Safal National Exchange of India Limited (SNX), Asha, Assam etc.
Major Recommendations
• As we know the future lies in rural computing, our rural ICT policies must be tailored according to our
requirements, integrated websites should be set up for all agencies of both State and Central governments
like APEDA, APMC, CWC, SWCs, CACP, CCI, DMI, FCI, JCI, KVKs, MPEDA, NAFED, TRIFED,
NCDC, NDDB, NHB, SAMBs.

S&T for Rural India and Inclusive Growth350
• Academic and research data in agriculture marketing needs to be digitalized in local languages.
• India needs to develop a structured nationwide common spot exchange.
http://agricoop.nic.in/
policy Incentives/
kisan Callfirst.htm

S&T for Rural India and Inclusive Growth 351
• Introduce electronic scientific grading of agricultural commodities in the markets.
• Tele-density in rural areas continues to be low. Increase in tele-density, as component of infrastructure
development should be taken up.
• Greater synergy between extension services and market is required.
• Strengthening of Agriculture Business Processes through e-Form, e-Document, Workflow Computing
should also be given importance.
• The involvement of a local partner in the delivery of the services will be significant for a disciplined
market.
MecMecMecMecMechanism of Dehanism of Dehanism of Dehanism of Dehanism of Devvvvveloping and Feloping and Feloping and Feloping and Feloping and Fixing Fixing Fixing Fixing Fixing Food Sood Sood Sood Sood Stttttandarandarandarandarandardsdsdsdsds
The food industry in India is undergoing a radical change. The advent of technology in the food sector in the
form of processing techniques has infused a new vigor; it has led to an increase in shelf life of products, new
fortified products and storage solutions etc. Due to these technological interventions, processed food is now
available from the place of production to far reaches, that too not only within the country but also across
international boundaries. To ensure that products that are produced for consumers are safe and of high
quality, food safety has become a growing concern across the world. Food standards are expected to
acquire greater importance, given growing consumer demand for products which are healthy and due to
increasing concerns about the quality of food.
Developing food standards:
The central government has constituted a committee
called the Central Committee for Food Standards
(CCFS) to advise it on matters related to standards.
The standards setting body “BIS” is the main
formulating body of Indian standards in line with
national domestic requirements. It sets voluntary
standards to indicate the quality of the product by the
use of ISI mark. While DMI formulates grade
standards known as “AGMARK” with relevant quality
definitions and grade designation marks.
Internationally, the “Codex Alimentarius
Commission (Codex)” is the international food
standards setting body under FAO and WHO, jointly.
The Codex follows the food standards programme recognized by the World Trade Agreements on Sanitary
In India
• Central Committee for food Standards
(CCFS)
• Bureau of Indian Standards (BIS)
• Directorate of Marketing and Inspection
(D.M.I.)
International body
Codex Alimentarius

S&T for Rural India and Inclusive Growth352
and Phytosanitary (SPS) and Technical Barriers to Trade (TBT), which is basically the reference point for
food standards applied in international trade.
Regulatory Bodies
Codex India: The Directorate General of Health
Services, Ministry of Health and Family Welfare has
been designated as the nodal ministry (National Codex
Contact Point, NCCP) for liaison with the Codex
Alimentarius Commission and to coordinate with the other concerned government departments at central
and state levels, food industry, consumers, traders, R&D institutions and its shadow committees.
QCI: a non-profit autonomous body, coordinates, guides and implements a national quality initiative through
its five bodies namely National Accreditation Board for Certification Bodies (NABCB), National Accreditation
Board for Education and Training (NABET), National Accreditation Board for Testing and Calibration
Laboratories (NABL), National Accreditation Board for Hospitals & Healthcare Providers (NABH) &
National Board for Quality Promotion (NBQP)
EIC: An apex body under Ministry of Commerce to provide for sound development of export trade through
quality control and pre-shipment inspection.
Food Safety Certification
The various food certification schemes running in India are:
QMSCS: as per IS/ISO 9001 was launched in September 1991
under the provisions of the Bureau of Indian Standards Act,
1986. The Scheme is being operated in accordance with ISO/
IEC Guide 62.
HACCP : a process control system that identifies and prevents
microbial, chemical and other hazards in food. BIS offers two
Certification schemes to the food industry.

S&T for Rural India and Inclusive Growth 353
• HACCP Stand-alone Certification against IS 15000:1998
• HACCP based Quality System Certification provides for two Certifications: one, Audit Certification
of Quality System against IS/ISO 9000 and the other Certification of HACCP against IS 15000:1998
Food Testing Infrastructure
According to a pilot study conducted by Ministry of Food Processing Industries, based on test capabilities,
equipments and infrastructure 312 laboratories from all over India were identified. Of the 312 laboratories
identified for the study only 127 labs replied to their questionnaire. The 127 labs were then categorized into
4 tiers namely National level (5 labs), Regional level (6 labs), State level (34 labs) and Local level (71 labs).
Suggestions
• The protocols to be developed for standardization of food
articles should keep in mind the actual users of these
standards, the environment, the culture and the present
infrastructure of the country where they are to be
implemented.
• Knowledge of the changing scenario of food standards
and their rigid requirements, typically, does not reach rural
India timely. Public knowledge of food standards is therefore quite limited and only few farmers are
aware of the procedures. So focus should be on assisting farmers to meet these standards.
• Ensure implementation of good hygiene and good management practices from farm to product level.
• Take a leading role in developing food standards and support other countries in developing standards
similar to ours.
TTTTTooooowwwwwararararards Ads Ads Ads Ads Agggggrrrrriculturiculturiculturiculturicultural Innoal Innoal Innoal Innoal Innovvvvvation Pation Pation Pation Pation Policyolicyolicyolicyolicy
Continuing focus on household food and nutrition security, decelerating growth in total and partial factor
productivity, unsustainable land and water use practices, economic and ecological access to food, especially
for the poor: are some of the agricultural development challenges. In order to address these challenges with
an emphasis on inclusiveness of the rural poor in the development process, the role of agricultural science
and technology assumes greater significance. This is primarily because of limited scope for cultivation area
expansion to produce more and also our reaching a stage where further exploitation of natural resources
would compromise sustainability of agricultural production systems. Therefore, Indian agriculture will have
to shift from resource or input-based growth to knowledge or science-based growth and development. In
this context, efficiency of agricultural science and technology systems should be enhanced to promote
technological innovations.
Lab accreditation through: NABL,
APEDA, EIC, BIS
Human Skill development: CFTRI,
IFTTC, IGNOU, ICAR, Industrial
Associations (CII, FICCI)

S&T for Rural India and Inclusive Growth354
Agricultural Research System
In India, concept of agricultural research is moving from supply driven to demand driven kind of interventions.
This paradigm shift entails a move from a process concept to some kind of output and outcomes. In this
context, the actors, creation and application of new knowledge, institutional innovations and policy issues
have become equally important. In India, there is an organised agricultural research system i.e., basically a
three-tier system. At the centre there is a network of organizations under the Indian Council of Agricultural
Research (ICAR). At state level there are the state agricultural universities (SAUs), and at the zonal level
(covering a couple of districts) there are zonal research stations controlled by SAUs (Fig 6-25.01). So this
is a very strong mechanism, establishing linkages between ICAR institutes, SAUs and private sector, for
profit as well as non-profit activities. These strong inter-institutional linkages of the Indian Agricultural
Research System link all the research institutions with farmers and development agencies.
Public funding is one of the major policy instruments for
promoting technological innovations and human resource
development. There has been a consistent upward trend
in public funding for agricultural research and education.
This is shown in Fig 6-25.02. However, composition of
the public funding from the centre and state governments
has changed over the years. Agricultural funding and
expenditure by centre and states systems are given in
Table 6-25.01. This is significant in terms of increasing
overall effectiveness of the system through

S&T for Rural India and Inclusive Growth 355
commercialization and transfer of improved technologies and thereby making research demand-driven, which
is a necessary condition for improving the capacity for agricultural innovations.
Committed fund for inter-institutional programmes is one instrument of developing the linkages and partnership
within the system. Now when we focus on the knowledge creation, which is one component of the innovation
system, what are the implications for agriculture R&D? First comes the question of resources. If we compare
how much India is investing in agriculture R&D, we see that it is 0.5% of agricultural GDP, which is much
below that spent by other developing and developed countries (Pal and Byerlee, 2006). So we need to
increase it, gradually, to at least one percent of Ag GDP and then rationalize the allocation by regions and
commodities. Eastern India still suffers from under-investment; additional resources should be invested there.
Capacity for Innovation: Role of Policy and Institutions
Another important issue is the increasing interaction between public policy, institutions and technology/
knowledge. There is a need to align policies and institutions to facilitate the flow of knowledge and technology
to the end users.
Governance and
management reforms now
focus on participatory
governance of technology
systems so that we are able
to bring the system close to
the end-users, and research
planning orientation has
now shifted to outcomes
rather than outlays. The
new IPR policy of ICAR
has emphasized on this,
through commercialization of technology and incentives provided to the scientists. Mechanisms for partnerships
like funding and intellectual property management provide incentive to work together and share the credit
among the partners.
There is a need to empower the farmers through provision of information and skills, so that they are able to
articulate their demand and respond to emerging opportunities through innovations. This can be achieved
only when we bring the extension system close to farmers and understand their behavior in sharing and
application of knowledge and technologies. Once this is done, farmers will be able to see where the
opportunities are and where they can use their resources, knowledge and skills to tap these opportunities.
Therefore there should be systematic efforts by public agencies, governments, and other agencies to develop
this capacity among the farmers. There have to be some kind of local knowledge centers or interest groups
so that they are able to integrate the knowledge available, pass it on to the farmers to make them understand
and apply it. So this is very important as seen in case of Bt cotton.
Inference
Agricultural innovations system necessitates adequate investment in R&D for accelerating flow of technologies

S&T for Rural India and Inclusive Growth356
and knowledge to end-users. This should be supported with facilitating policies and enabling institutions.
One should understand this policy-institution and technology interface and take appropriate corrective measures
to promote innovations. Finally, efforts should be made to understand behavior of farmers in terms of
access, application, and sharing of information, so that appropriate steps are taken to develop their capacity
through provision of information and skill development, which are necessary for enhancing rate of innovations
in Indian agriculture.

The country is entering the age of knowledge when increasing returns would be ubiquitous.
The democratic governance structures of this country have evolved, over the course of six decades,
sets of complex institutions systems and practices that bind or otherwise relate S&T to the other
spheres. With about four thousand research and development organizations, large organized
systems of knowledge production, millions of knowledge-workers and an even larger number of
citizens trying to engage in knowledge-based activities ranging from agriculture through
semi-skilled workers to industrial workers, coupled with the fact of the country being especially
gifted with immense diversity in natural resources -- the opportunity set of potential outcomes are
immense and invigorating.
The long twentieth century in Indian S&T based developmental experiments, in particular at
grass roots, has thrown up immense volumes of data, facts and artifacts. A crucial issue emerges.
The country very badly needs a strong mechanism to capture data related to S&T and innovation
right from the regulatory or executive levels to source-points where S&T output or innovations get
generated.
This Report presents several facets of Indian S&T. In lieu of attempting the development of a set of
traditionally known indicators of S&T, the attempt here has been to capture multiple facets of Indian
economy and society where S&T makes contributions. With unstated theoretical bases, contributors
presented research conclusions in the form of several portrayals. Given the fact that S&T interfacing
the economy and society has very large dimensions this Report could take up only a handful.
Such a collage offers albeit a picture of where Indian S&T is located.
This printed version is about one fourth of the full Report, available at http://www.nistads.res.in
The report is the first of its kind from this country. It is targeted at a wide readership ranging from
policy makers and advisors to academic readers as well as the common person. Following six
themes, with regard to S&T have been taken up in the report:
Human Resources
Financing
Structure, Infrastructure and Public Space
Industry
Output and Patents
Rural India and Inclusive Growth
4
4
4
4
4
4