Revisiting Solid Waste Management (SWM): a Case Study of Pakistan
Upload
khangminh22Category
view
1download
0
IMPLEMENTATION OF SWM RULES
SOLID WASTE MANAGEMENT STATUSCompliance of OA 606/2018
21rd July 2022
Government of Tamil Nadu

Solid Waste Management in Tamil Nadu
(Urban)
In Tamil Nadu, Municipal Administration and Water Supply Department has
the administrative control over 649 ULBs viz
Greater Chennai Corporation
Commissionerate of Town Panchayat (490 TPs)
Directorate of Municipal Administration (20 Corporation & 138
Municipalities)
Total Waste
Generation in TPD
Wet waste in
TPD
Dry waste in
TPD
Inert and silt
in TPD
14,995 8,084 5,471 1,440

Solid Waste Management status in Tamil Nadu
StatusAs on
July 2019
As on July
2020
As on
June 2021
As on June
2022
Quantity of waste generated in TPD 13,744 11,437 13,006 14,995
Quantity of Door to Door Collection
(TPD)
12,781 10,751 12,335 14,396
Quantity of waste segregated at
source (TPD)
11,270 8,120 10,404 12,147
Quantity of waste collected &
Transported (TPD)
13,744 11,437 13,006 14,995
Quantity of waste processed (TPD) 7,422 (54%) 5,947 (52%) 7,543 (58%) 9,310 (62%)
(Urban)

Segregation at source and D2D collection of waste
Currently the state has achieved an
96% door to door collection
81% source segregation.
100% of total waste is being collected
To achieve 100% collection and segregation, massive IEC awareness
campaign “Peoples movement for clean cities” is being conducted in all
ULBs

Segregation at source and D2D collection of waste

Waste Processing
In 2022, Out of 14,995 TPD of total waste generation, 9,310 TPD is processed
In 2019, Out of 13,744 TPD of total waste generation, 7,422 TPD processed
Wet waste processing
Out of 8,083 TPD of wet waste, 5542 TPD is processed
In 2019 - Out of 7,146 TPD of wet waste, 3,827 TPD processed
Processing Facilities 2019 2022
Nos Capacity (TPD) Nos Capacity (TPD)
Micro Composting centres 628 2198 995 3569
Bio CNG plant - - 1 100
Garden waste & tender coconut shells plant - - 4 320
Onsite composting centres 876 310 907 350
Biomethanation plants 104 244 107 259
Windrows &Vermi composting 485 1075 556 1,455
Total 2,093 3,827 2,570 6,053

Wet waste processing
MCC- Trichy
Windrows- Bathlagundu Vermi Composting- Ponnampatti Biomethenation plant- Coimbatore
Attur Municipality Thuraiyur Municipality

Wet waste processing - Approach to reduce gap
Gap in wet waste – 2,550 TPD
6 plants of Bio CNG with capacity of 600 TPD (100 TPD each) is under
implementation on PPP mode
Composting centers like MCC & windrows with capacity of 650 TPD in 215 ULBs
1,300 TPD of Bio CNG and windrow composting plant is sanctioned under SBM 2.0
Bio CNG - Chennai Komarapalayam MCC PN Palayam –Windrows

Wet Waste Processing – Greater Chennai Corporation
Windrow- Madhavaram (GCC) Manure sale to TANFED @ Madhavaram (GCC)
MCC – Tenampet (GCC)

Waste Processing – Dry waste
Dry waste disposal
1190 TPD of Saleable waste /recyclable waste collected from household and sold
out to local vendors and amount distributed to sanitary workers.
1700 TPD of combustible dry waste is being disposed in 439 nos of Material
Recovery Facilities/Resource recovery centres and sent to cement plants/
sugar mills/ power plants for co-processing.
880 TPD of Inert and drain silt is used for filling low lying areas
Gap in dry waste – 2,579 TPD
512 nos of Material Recovery Facilities with capacity of 3,620 TPD is sanctioned under SBM
2.0 to process the dry waste
In 2022, Out of 5,470 TPD of total waste generation, 2,890 TPD is processed
In 2019, Out of 5,223 TPD of total waste generation, 1,875 TPD processed

Disposal of Dry Waste to Vendors, Cement factories and Sugar Mills

Disposal of Legacy Waste - Biomining
No of Locations where legacy waste exist – 271* nos
The estimated quantity of legacy waste - 207 lakh cu.m
Biomining works taken up - 269 locations (19 Corporations, 95 Municipalities
and 121 Town Panchayats)
Work completed in 69 locations and cleared 32 lakh Cu.m
So far 360 acres of land has been reclaimed
* Biomining not feasible in Colachal and Kodaikanal municipality due to salt-pan & undulated hilly
terrain.

Plan of Action for 100% - Removal of Legacy waste
After completion of the biomining, about 1,500 acres of land will be
reclaimed & proposed to setup processing facilities and surplus land will be
developed as a green belt.
During 2022-23, it is proposed to takeup Green belt in 69 ULBs which covers
369 acres of reclaimed land.
S.NoNo. of
locations
Total quantity in
lakhs Cu.mProgress in Percentage
Probable Date of
Completion
1 40 25.02 > 75% 30.09.22
2 21 22.38 50 to 75% 31.12.22
3 18 2.84 25 to 50% 30.06.23
4 79 20.6 0-25% 31.12.23
5 42 1.03 Tender stage 31.12.23
6 2 (GCC)34
64
Perungudi – 30%
Kodangaiyur – DFR stage
31.03.24
31.12.24
200 174.67

Pammal Municipality Poonamallee Municipality
Idappadi Municipality Erode Corporation
Legacy waste disposal – Biomining sites

Legacy waste disposal – Biomining sites
Tenkarai Town panchayat
Marakkanam Town Panchayat
GCC -Pallikaranai

Legacy waste disposal – Biomining sites
Karur Municipality

Legacy waste disposal – Biomining sites
Chidambaram Municipality

Erode Corporation – Removal of Legacy waste from the bank of river Cauvery
Location – Viairapalayam river side
Total Legacy waste removed – 1.78 lakh cu.m Total area reclaimed - 7 acres
Legacy waste disposal – Biomining sites

Biomining Work in progress at Perungudi Site (Greater Chennai Corporation)
Total quantity of legacy
waste - 34 lakh cu.m
So far processed - 10.27
lakh cu.m (30%)
Total Area to be
reclaimed – 225 acres

Time frame
S.no Type of waste Probable date of achievement
1 Door to Door Collection 31.12.22
2 Wet waste processing 31.03.23
300 TPD Bio CNG (GCC) 31.03.23
300 TPD Bio CNG (GCC) 31.12.23
650 TPD of MCC & Windrows
(DMA+CTP)31.03.24
700 TPD of Windrows & 600 TPD
of Bio CNG (GCC)31.12.24
3 Dry waste processing 31.12.23
3,620 TPD of MRF 31.03.24
4 Biomining of legacy waste 198 locations - 31.12.23
2 locations (GCC) - 31.12.24

Gap generation and
processing
Quantity of
solid waste
processed
Quantity of solid
waste collected
Quantity of
solid waste
generated
1,572 Ton
1,965 Ton
1,474 Ton
491 Ton
Solid Waste Generation and Processing - Rural

SEGREGATION, COLLECTION AND TRANSPORTATION OF WASTE
• Basic SWM Infrastructure facilities are provided in all 12,525 Village
Panchayats in phased manner
• 66,130 Thooimai Kaavalars (Green warriors) have been engaged in 12,525
Village Panchayats for Door to Door collection of segregated waste
• The segregated waste are brought to the waste processing site through
Tricycles / Push Carts / E Carts provided in each Village Panchayat
22

SEGREGATION, COLLECTION AND TRANSPORTATION OF WASTE
• Secondary segregation done in the segregation shed. Bio degradable waste is processed in the
community compost pit and generated manure is processed in the Vermi compost unit in the
Village
• Micro Composting Centre’s are established through World Bank fund to treat the wet waste
generated effectively (287 Micro Composting Centre’s are established in the peri
urban/bigger Village Panchayats)
• Recyclable waste are sold to scrap dealers through Thooimai Kaavalars (Green warriors)
• Plastic waste is being shredded in Plastic Waste Management Unit and utilized for road
construction.
23

PLASTIC WASTE MANAGEMENT
24
SBM(G) phase II provides Rs.16 lakh per Block to establish Plastic Waste
Management unit
So far 130 Plastic Waste Management units are established.
One Plastic Waste Management per Block will be established.
Shredded plastic is blended with bitumen (5% to 8%) and it is used for road
construction
From January 2020, 130 MT of plastic waste are shredded and 140 kms of road
were laid.

PLASTIC WASTE MANAGEMENT

Good Models
Model cities & towns
Corporations Municipalities Town Panchayats
Erode – All wet waste
generated in the town are
converted into manure through
24 Micro composting centres.
The manure generated is given
to the farmers at free of cost
ThiruvannamalaiAbout 250 kg of Cloth waste are
collected every month from tailor
shops. The fabric waste collected by
municipal workers daily recycling of
waste clothes in to mats.
ChinnalapattiCloth waste left over from garment
factories are directly collected and
processed to produce colorful and
attractive door mats, bags, etc.
KadayanallurAbout 652 households are
successfully practicing home
composting.
The manure generated in each
household are used for own gardening
and also given to the neighbors at free
of cost.
AndiapattiThe total waste generated in the TP is
about 7 TPD. The wet waste is being
effectively processed through windrow
composting. The manure generated is
value added through vermi composting
and generating 2 MT per month and sold
at a cost Rs.8 per kg.
KarunguzhiCitric fruits collected from different juice shops are dried and powdered. This can be used for vessel washing
detergent. Flower waste collected from different places and dried. This can be powdered and sold for the purpose of
rangoli.

IEC - People’s Movement for Clean Cities
Sensitize people about solid waste management and make them aware about their
responsibility
Create awareness among the segregation of waste at source
Ensure non littering of public places
Quest for cleanliness among the citizens
Say No to Single Use Plastic (SUP)
My Waste, My Responsibility
“என் குப்பப - என் பபொறுப்பு”
To make the cities clean and to involve every citizen in journey towards Garbage free
cities People’s Movement for Clean Cities has been taken up on mass scale in Urban
Local Bodies.
Special campaign to create awareness about cleanliness on 2nd and 4th Saturday of
every month with the following objectives:

IEC - Launching of Campaign
Launch of the campaign by Hon’ble Chief Minister on 03.06.2022 at
Chennai.
Simultaneously, it was launched in all other ULBs.
Planned for 2nd and 4th Saturday of every month.

IEC - Launching of Campaign

1st Thematic activity - Peoples Movement
In continuation to the launch of Peoples movement on 03.06.2022 for
effective Implementation of the scheme, on June 11th i.e on second Saturday of
the month, Cleaning activity have been taken up at
Bus stands,
Parks,
Outside of Railway station,
Outside of Religious places,
Tourist Places,
TNHUD settlements,
slums,
Crematorium / Burial grounds.

1st Thematic activity - Peoples Movement
Total No. of Volunteers / Students / NGOs / RWAs
participated: 57,018
Total No. of Elected representatives/ VIPs participated: 9,351
Total No. of Locations mass cleaning activities done: 2,818
Total Weight of Wastes removed : 742 Tonnes
Total No. of persons downloaded Swachhata app : 16,005

Transformation of garbage vulnerable points

2nd Thematic activity - Peoples Movement
Sensitizing for Source segregation, Non-littering of public places & say No to SUP
Total No. of Volunteers / Students / NGOs / RWAs participated: 69,955
No of people sensitized through Volunteers/ NGOs / RWAs: 5,07,623
Total No. of Elected representatives/ VIPs participated: 9,452
Total No. of Hotspots cleared/put it into alternate use : 2,818
Total Weight of Wastes removed : 778 Tonnes
Total no.of shops sensitized on SUP :28,354
Quantity of plastic seized (in Kg) : 21.19 Tonnes
Total No. of persons downloaded Swachhata app :16,097

Sensitizing for Source segregation, Non-littering of public places & say No to SUP
2nd Thematic activity - Peoples Movement

Sensitizing for Source segregation, Non-littering of public places & say No to SUP
2nd Thematic activity - Peoples Movement

2nd Thematic activity - Peoples Movement
Sensitizing for Source segregation, Non-littering of public places & say No to SUP
Declaration by parents on Source segregation

3rd Thematic activity - Peoples Movement
Awareness campaign in Schools and Colleges
In addition to these events, every Wednesday the awareness campaign were planned
in Schools and College to sustain the movement

3rd Thematic activity - Peoples Movement
Awareness campaign in Schools and Colleges
As a result of 3 thematic activities, the quantity of segregated waste to processing
facilities has been increased to 5% - 8%.

PLASTIC WASTE MANAGEMENT CAMPAIGN
Plastic waste management campaign is started in rural
areas from 01.07.2022. Following activities are planned in the
campaign,
• Creating awareness on eradicating the use of Single Use
Plastic and promoting ‘Meendum Manjappai’
• Implementing Plastic Buyback Policy in all Village
Panchayats
• Transporting the collected plastic waste to Plastic Waste
Management Unit
• Sale of Shredded Plastic to Road Contractors
39

40
Plastic Waste Management
• From 01.01.2019, Government of Tamil Nadu issued orders banning of
manufacture, storage, transport, supply, sale and use of ‘use and throwaway
plastics’ (Single Use Plastics) vide G.O. Ms. No. 84 dated 25.06.2018.
• TNPCB taken steps to control production of SUP by issuing Closure direction and
disconnection of power supply to 174 industries. ULBs taken steps to seize
SUPs and imposed fine amount from January 2019 to May 2022 are as follows:
S.No. ULBs SEIZED SUP in
Tons
Fine Amount
Collected in Lakhs
01. Municipal Corporations 1012 600
02. Municipalities 634 265
03. Town Panchayat 122.37 143.24
04. Greater Chennai Corporation 365 222
Total 2133.37 1230.24

41
Plastic Ban Awareness Campaign: “MEENDUM MANJAPPAI”
• Government of Tamil Nadu has issued orders vide G.O. (Ms)
No. 116 of Environment, Climate Change & Forest (EC.2)
Department dated 27.11.2021
• To fight plastic pollution and eliminate single use
plastics, roadmap for single use plastic ban, activities for
“Meendum Manjappai” campaign and proposed plans
for successful implementation of the People’s campaign
on one time use and throwaway plastics
• Hon’ble Chief Minister of Tamilnadu launched a mega event
on 23.12.2021 by flagging off the “Meendum Manjappai”
campaign, launch of Manjappai logo to use traditional cloth
bag (manjappai) and also made an appeal to the public to use
cloth bags and to avoid single use plastics.
• Manjappai Vending Machine has been installed and the
same was inaugurated during World Environment Day, 2022
on 05.06.2022.
• The automatic machine dispenses a yellow cloth bag for 10 rupees
and has been promoted and conversely the use of plastic carry
bags among the general public is decreased.

42
Plastic Waste Management
MoEFCC Notification dated 12.08.2021 – SUP ban from 01.07.2022 Status
MOEF&CC notified Plastic Waste Management (Amendment) Rules, 2021 in
which certain Single Use Plastic items have been prohibited from 30.09.2021 and
plastic carry bags less than 120 microns from 31.12.2022.
Comply with
MANJAPPAI EXPRESS TRAIN
Manjappai Express Train to be launched this year.
Train will run throughout the State for 45 days.
Will have on board & off board awareness programmes on
SUP.
An Expo on Eco alternative proposed in August 2022
Awareness on Eco alternatives & encourage Eco alternative
industries
Stop usage of banned plastic items in all department offices
including district offices
Moving towards a plastic free Secretariat, Collectorates,
Police offices etc
WAY FORWARD

SEWAGE MANAGEMENT

Category Quantity of
sewage
generation
(in MLD)
Treatment
capacity in
( in MLD)
Current Gap
in treatment
(in MLD)
Utilization of treated sewage in MLD
Agriculture/
Horticulture
purpose
Industrial
purpose
Any other
purpose
CMWSSB
(Chennai)
743.00 745.00 - - 71.00 8.00
DMA 1698.73 994.31 704.42* 36.50 44.00 324.35
DTP 429.29 29.67 399.62** 6.82 - -
Total 2871.02 1768.98 1102.4 43.32 115 332.35
SEWAGE MANAGEMENT:
* 359.72 MLD (STPs - 359 MLD and FSTPs - 720 KLD are under construction) – will be completed by Dec 2022
** 12.52 MLD (STPs -12.52 MLD and 80 KLD FSTP are under construction) – One STP (Thiruporur) will be
completed by 30.9.2022; one STP at Sriperumbudur will be completed by Dec 2022.

Strategy for Used Water Management
In Tamil Nadu there were 664 ULBs, (now reorganized to 649 ULBs) of which
58 ULBs have functional underground sewerage systems
In 22 ULBs UGSS are uer various stages of implementation and in 17 Towns it
is under DPR stage.
The remaining 584 ULBs will be covered by onsite sanitation facility and
Feacal Sludge and Septage Management (FSSM) systems.
Underground Sewerage Systems is proposed in all Municipal Corporations, AMRUT
cities, District headquarters towns, and some other towns of tourist and religious
important places.
Cont……….

Strategy……..
46 ULBs are served by functional 25 FSTPs and 31 FSTPS covering 75 ULBs
are under implementation.
The remaining 463 ULBs are proposed to be covered by 339 FSTPs under SBM
2.0, either on cluster basis or on standalone basis.
The state has proposed FSTPs in 339 ULBs to serve 463 ULBs.
The cluster towns are within 15-20 kms of proposed FSTPs is neither any
sewage treatment plants or FSTPs
Enacted the amendment to District Municipality Act, CMWWSB Act,
Madurai and Coimbatore City Municipal Corporation Act - to exercise
Faecal Sludge and Septage management including issuance of license for
collection, transportation, treatment and disposal.
The State will ensure that the untreated wastewater does not enter into
waterbodies by implementing these works.

Strategy of State in Used Water Management
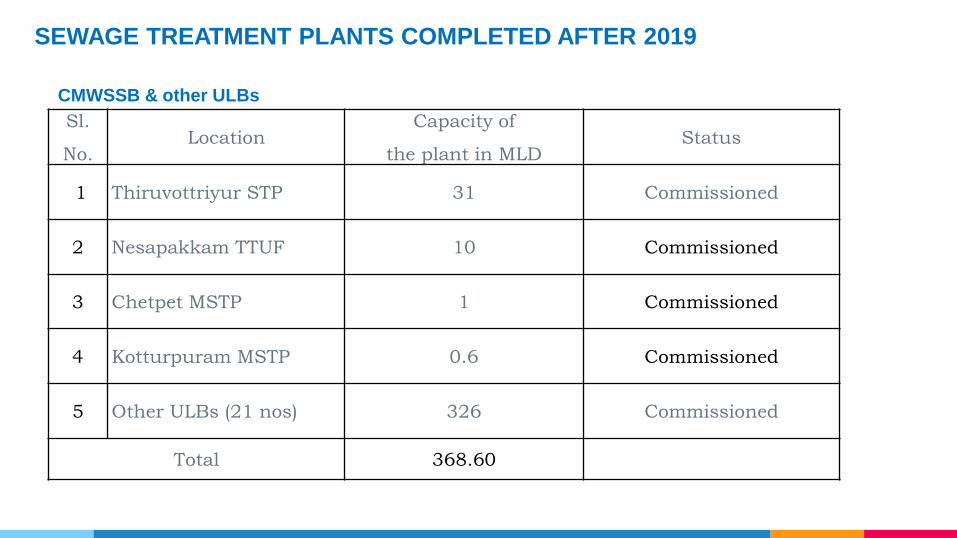
SEWAGE TREATMENT PLANTS COMPLETED AFTER 2019
Sl.
No.Location
Capacity of
the plant in MLDStatus
1 Thiruvottriyur STP 31 Commissioned
2 Nesapakkam TTUF 10 Commissioned
3 Chetpet MSTP 1 Commissioned
4 Kotturpuram MSTP 0.6 Commissioned
5 Other ULBs (21 nos) 326 Commissioned
Total 368.60
CMWSSB & other ULBs

SEWAGE TREATMENT PLANTS UNDER CONSTRUCTION - CMWSSB
No. Location
Capacity of
the plant in
MLD
Progress in %Expected Date of Completion
Timeline
1Sholinganallur STP (PHASE II) 54 90.00
Dec 2022 (36+18) 18 MLD
trial run in progress
2 Kodungaiyur STP Zone - I 120 73.25 Dec 2022
3 Kodungaiyur STP Zone - II 120 86.65 Dec 2022
4 Nesapakkam STP Zone - IV 50 78.25 Dec 2022
5 Perungudi STP Zone - V 60 54.20 Dec 2022
6 Perungudi TTUF 10 70.00 Dec 2022
7 Nungambakkam MSTP 1.2 70.20 Dec 2022
8 Langs Garden (TTUF) 10 48.50 Dec 2022
9 Todd Hunter Nagar MSTP 4 86.00 Nov 2022
Total 429.20

TERTIARY TREATMENT PLANTS COMPLETED AFTER 2019 - CMWSSB
Sl.
No.Location
Capacity of
the plant in MLDStatus
1 Kodungaiyur TTRO 45 Commissioned
2 Koyambedu TTRO 45 Commissioned
3 Nesapakkam TTUF 10 Commissioned
Total 100

TERTIARY TREATMENT PLANT UNDER CONSTRUCTION (CMWSSB)
No. Location
Capacity of
the plant in
MLD
Physical Progress in
%
Expected Date of
Completion Timeline
1Perungudi TTUF 10 70.00 Dec 2022
2Langs Garden (TTUF) 10 48.50 Dec 2022
Total 20

STP under Construction – Other Corporations and Municipalities
Sl.
No.Location
Capacity of
the plant Status
1 STP (17 Locations) 359.00 MLD Under construction
2 STP (15 locations) 272 MLD Proposed
3 FSTP (46 locations) 0.72 MLD Under construction
4 FSTP (24 locations) 0.37 MLD Proposed
Total 632.19 MLD
To monitor the quality parameters continuously as per CPCB directions, Installation of
online continuous effluent monitoring system (OCEMS) under progress in all completed
& ongoing STP’s.
• OCEMS will be installed in all the existing STPS by September 2022 and;
• In ongoing STPs it will be completed by December 2023

Sl.
No.Location
Capacity of
the plant Status
1 STP (2 locations) 12.52 MLD Under construction
2 FSTP (5 locations) 0.08 MLD Under construction
Total 12.52 MLD
• For small towns less than 1 lakh population - strengthening of sanitation services
will be done by improving on-site systems regulation and Fecel sludge management in
SBM 2.0. STP cum FSTP will be brought within the provison for the small volumes of
used water and to treat fecel sludge.
STP under Construction – Town Panchayats

Best Practices
For Urban:-
• People below the poverty line – sewer line connections are given to the premises less than
500 sq.ft at Rs. 100 per connection to improve hygiene and safe disposal of sewage.
• A total of 11,839 house sewer connections have been given after 2019 under this scheme.
• Septage Management - To collect fecal sludge from the added areas of the Greater
Chennai Corporation, served by septic tanks, CMWSSB has increased the number of
decanting points in Sewage Treatment Plants for collection and co-treatment.
• The collection of septage has been increased from 2.1 MLD in 2019 to 8.65 MLD at present
and co-treated at Nesapakkam, Perungudi and Shollinganallur.

For Rural:-
• Individual and community soak pits works are taken in all Village Panchayats for Grey
Water Management
• Under Swachh Bharat Mission (Grameen) Twin Leach Pit toilets are promoted to treat the
faecal sludge at onsite
• 5 Faecal Sludge Treatment Plants are proposed and under progress at Tiruvallur,
Kanchipuram, Chengalpattu, Coimbatore and Salem
• It is also planned to utilize the facilities of FSTPs located in the urban areas by mapping nearby
Villages (in a radius of 10-15 kms) for treating the faecal waste from septic tank toilets.
• Initially, 1035 Village Panchayats have been mapped with urban FSTPs.
Best Practice

Onsite Sanitation System - Rural
56
Individual Soak Pits - Keelmorappur Panchayat, Harur Block,
Dharmapuri District
Community Soak Pit - Brahmadesam Panchayat,
Bhavani Block, Erode District

Addressing Connecting Issues (Utilisation of full capacity
and reuse of treated water)
• Initially the House Service connections (HSC) were given on demand basis. So, the
anticipated HSCs connection could not be achieved.
• Now HSC to all the households in the town were included as a project component and HSC
being effected during the implementation itself. At present the considerable quantity of flow is
received at the STP.
• State Government have came out with a policy on reuse of treated wastewater during
December 2019.
• The policy envisages establishment of wastewater grids to promote the use of treated water for
industrial, agriculture or non drinking purpose domestic use.
• Presently the utilization of treated water is : -
Industries 115.00 MLD
Agriculture 43.32 MLD
Any other purpose 332.35 MLD

Reuse of treated used water by industries (Good Models) • Secondary treated reuse water to Industries – 25 MLD
• Tertiary treated reuse water to Industries – 46 MLD
• Tertiary (TTUF) treated reuse water to lakes – 8 MLD
Koyambedu TTRO Kodungaiyur TTRO
Utilization of treated used water has increased from 6% (32 MLD) in 2019 to 13% (79
MLD) at present

Utilisation – Treated used water (Good Models) • Sustainable Decentralised Circular water usage model - Tertiary treated reuse water
(STP (SBR) + Ultra Filtration lake and WTP)

Utilisation – Treated Used water (Good Models) • Tertiary treated reuse water discharged to urbanised lakes – 8 MLD
Nesapakkam STP (SBR) + TTUF - 10 MLD
(commissioned)
To Porur
Lake

• Sustainable Decentralised Circular water usage model - Tertiary treated reuse water
(STP (SBR) + Ultra Filtration lake and WTP)

Time frame
Actions plannedStatus &
NumbersCapacity MLD Timeline
Rough Cost
Estimate
STPs (CMWSSB) Under Construction (9
nos)430
Aug 2022 – 1 No.
Dec 2022 – 8
Nos.
.
747.44 Cr.
STPs (DMA)Under Constrution
(17 nos)359 June 2023
3637 cr
( including collection
system)
STPs (DMA) Proposed (15 nos) 272 Dec 2025
5297 cr
(including collection
system)
STPs (DTP) Under Construction (2
nos)12
Sept 2022
July 2023119.11 cr
Total 43 1073 9,800.55 cr
Copyright © 2022 FDOKUMEN