Scenarios to Reduce Electricity Consumption and CO2 Emission at Terminal 3 Soekarno-Hatta...
10
Procedia Environmental Sciences 17 (2013) 576 – 585 1878-0296 © 2013 The Authors. Published by Elsevier B.V. Selection and peer-review under responsibility of SUSTAIN conference’s committee and supported by Kyoto University; (OPIR), (GCOE-ES), (GCOE-HSE), (CSEAS), (RISH), (GCOE-ARS) and (GSS) as co-hosts. doi:10.1016/j.proenv.2013.02.073 Available online at www.sciencedirect.com The 3 rd International Conference on Sustain able Future for Human Security SUSTAIN 2012 Scenarios to r educe e lectri city c onsumption and CO 2 e mission at Terminal 3 Soekarno - Hatta International Airport Laksana Gema Perdamaian a , * , Rachmawan Budiarto a , Mohammad Kholid Ridwan a a Department of Engineering Physics, Faculty of Engineering, Universitas Gadjah Mada a Jalan Grafika 2 Yogyakarta 55281 Indonesia Abstract Electricity consumpti on in airport terminal buildings can be identified via Low Voltage Main Distribution Panel ( LVMDP ) which each of them serves individual distribution block. Total electricity consumption based on distribution blocks does not describe operational characteris tics of building systems. Utilization of building energy performance simulation software offers solution by providing electricity consumption data based on building systems. This research applied the method in simulating energy consumption and CO2 emission in Terminal 3 Soekarno - Hatta International Airport. Simulation result shows that total electricity consumption of Terminal 3 is 27700.107 GJ or 7.694 MWh per year, with 86.59% of that is consumed by HVAC system, 9.33% used by lighting system, 2.41% used by electricity equipment, and 1.76% consumed by transportation system. In order to achieve CO 2 emission reduction, three scenarios are simulat ed in this research, i.e. increasing temperature setpoint, AHU ( Air Handling Unit ) rescheduling, and window films replacement. Increasing temperature setpoint could reduce 247.179 ton of CO 2 emission per year. Increasing temperature combined with AHU rescheduling could reduce 286.611 ton of CO 2 emission per year. Window film replacement combined with increasing tempe rature setpoint and AHU rescheduling could reduce 289.966 ton of CO 2 emission per year. Keywords : Airport terminal; building energy simulation; electricity consumption; CO 2 emission reduction. * Corresponding author. Tel.: +0 - 000 - 000 - 0000 ; fax: +0 - 000 - 000 - 0000 . E - mail address: l[email protected] Available online at www.sciencedirect.com © 2013 The Authors. Published by Elsevier B.V. Selection and peer-review under responsibility of SUSTAIN conference’s committee and supported by Kyoto University; (OPIR), (GCOE-ES), (GCOE-HSE), (CSEAS), (RISH), (GCOE-ARS) and (GSS) as co-hosts.
-
Upload
independent -
Category
Documents
-
view
6 -
download
0
Transcript of Scenarios to Reduce Electricity Consumption and CO2 Emission at Terminal 3 Soekarno-Hatta...

Procedia Environmental Sciences 17 ( 2013 ) 576 – 585
1878-0296 © 2013 The Authors. Published by Elsevier B.V.Selection and peer-review under responsibility of SUSTAIN conference’s committee and supported by Kyoto University; (OPIR), (GCOE-ES), (GCOE-HSE), (CSEAS), (RISH), (GCOE-ARS) and (GSS) as co-hosts.doi: 10.1016/j.proenv.2013.02.073
Available online at www.sciencedirect.com
The 3rd International Conference on Sustainable Future for Human SecuritySUSTAIN 2012
Scenarios to reduce electricity consumption and CO2 emissionat Terminal 3 Soekarno-Hatta International Airport
Laksana Gema Perdamaian a,*, Rachmawan Budiartoa, Mohammad Kholid Ridwana
aDepartment of Engineering Physics, Faculty of Engineering, Universitas Gadjah Madaa
Jalan Grafika 2 Yogyakarta 55281 Indonesia
Abstract
Electricity consumption in airport terminal buildings can be identified via Low Voltage Main Distribution Panel(LVMDP) which each of them serves individual distribution block. Total electricity consumption based on distribution blocks does not describe operational characteristics of building systems. Utilization of building energy performance simulation software offers solution by providing electricity consumption data based on building systems. This research applied the method in simulating energy consumption and CO2 emission in Terminal 3Soekarno-Hatta International Airport. Simulation result shows that total electricity consumption of Terminal 3 is 27700.107 GJ or 7.694 MWh per year, with 86.59% of that is consumed by HVAC system, 9.33% used by lighting system, 2.41% used by electricity equipment, and 1.76% consumed by transportation system. In order to achieve CO2emission reduction, three scenarios are simulated in this research, i.e. increasing temperature setpoint, AHU (AirHandling Unit) rescheduling, and window films replacement. Increasing temperature setpoint could reduce 247.179ton of CO2 emission per year. Increasing temperature combined with AHU rescheduling could reduce 286.611 ton of CO2 emission per year. Window film replacement combined with increasing temperature setpoint and AHUrescheduling could reduce 289.966 ton of CO2 emission per year.
© 2012 The Authors. Published by Elsevier B.V.Selection and/or peer-review under responsibility of SUSTAIN conferences committee and supported by KyotoUniversity; (OPIR), (GCOE-ES), (GCOE-HSE), (CSEAS), (RISH), (GCOE-ARS) and (GSS) as co-hosts.
Keywords: Airport terminal; building energy simulation; electricity consumption; CO2 emission reduction.
* Corresponding author. Tel.: +0-000-000-0000 ; fax: +0-000-000-0000 .E-mail address: [email protected]
Available online at www.sciencedirect.com
© 2013 The Authors. Published by Elsevier B.V.Selection and peer-review under responsibility of SUSTAIN conference’s committee and supported by Kyoto University; (OPIR), (GCOE-ES), (GCOE-HSE), (CSEAS), (RISH), (GCOE-ARS) and (GSS) as co-hosts.

577 Laksana Gema Perdamaian et al. / Procedia Environmental Sciences 17 ( 2013 ) 576 – 585
1. Introduction
Soekarno-Hatta International Airport is a large hub for domestic and international flights. The growth of air traffic, mainly domestic traffic, gives large effect to the airport. Every year, passenger movement of the airport increases. The airport needs expansion to handle more than twenty million passengers which increases every year. On April 15, 2009, Soekarno-Hatta International Airport introduced new terminal to expand its capacity to meet the continuously improving passenger traffic. The new terminal bears the name Terminal 3 after the two older terminals, Terminal 1, which is established in 1982 and Terminal 2, which is opened in 1992.
On the other hand, people began concerned about energy efficiency and CO2 emission from all of life aspects, including air transport. As the business grows, there will be much more passengers which will triggers the increasing in number of flight, aircraft, ground activity, or even the terminal expansion. All of the increasing activities in air transportation will likely increasing the CO2 emission. Therefore, measures required to slow or reduce the growth of CO2 emission without hinder air transport growth must be applied.
One of the measures which can be applied for energy efficiency improvement in airport terminal is in electricity usage. In the Indonesian context, fossil fuel, especially coal, is still being the most widely used fuel to generate electricity, which means every kWh of electricity produced will emits certain amount of CO2. Thus, reduced consumption in electricity can affect indirectly to the reduction of CO2 emission
power plants. Electricity consumption in airport terminal buildings, like other large buildings, can be known via Low
Voltage Main Distribution Panel or LVMDP which serves one specific block of electricity distribution, hence recorded electricity consumption is based on distribution block. Overall electricity consumption based on distribution blocks does not describe operational characteristics of building systems. Utilization of building energy performance simulation software offers solution by providing electricity consumption data based on building systems and have a capability to simulate building electricity consumption in a specified long term, such as yearly, with a relatively short interval, such as hourly or daily. From the results, energy conservation effort can be developed.
2. Literature Review
Building energy consumption data obtained from simulation software can be used for various research objectives. Andarini, et.al. used building energy performance software to analyze a cooling load sensitivity with the variation of building variables [1]. Zeren implemented building energy simulation to find the dynamics of building energy consumption and to evaluate various energy conservation strategies, such as variation if building orientation and HVAC systems [2]. Zhu applied building energy simulation as a tool for energy auditing in the form of evaluating various energy conservation opportunities and their impact to overall building electricity consumption [3].
3. Fundamental Theory
Estimation process of energy consumed by buildings includes three basic components, i.e. space load, secondary equipment load, and primary equipment load calculations. Secondary equipment is equipment that distributes heating, cooling, or ventilating media to the conditioned space, whereas primary equipment is equipment that converts fuel or electricity to heating or cooling effect [4].

578 Laksana Gema Perdamaian et al. / Procedia Environmental Sciences 17 ( 2013 ) 576 – 585
3.1. Heat Balance Method
Heat balance method is a method for calculating sensible load which applies first law of thermodynamics or energy conservation law and principles of matrices algebra [4]. The basic assumption applied in the heat balance model is that air in every thermal zone can be modeled as well stirred with a uniform temperature [5].
Calculating space sensible load using heat balance method consists of four elements; they are outside-face heat balance, inside-face heat balance, zone air heat balance, and wall conduction process [5].
3.2. Occupant Cooling Load Estimation
Cooling load generated by occupant depends on occupancy rate of the building or thermal zone. Occupant dominating the airport terminal is airplane passengers, therefore estimation will be focused on the number of passengers.
Estimation of passenger rate at the airport terminal building is conducted based on IATA Arrival Earliness Distribution. Ahyudanari and Vandebona [6] used time blocks to calculate rate of passenger arrival to the check-in area. The length of each time block is ten minutes. Basically, IATA Arrival Earlines Distribution only valid for domestic flight. According to observation by Ashford (1976) in Ahyudanari and Vandebona [6], IATA Arrival Earliness Distribution can be used for international flight by way of postpone the time for 60 minutes.
Depending on the occupation pattern, areas of an airport terminal building can be divided to two types. The first type is an area which has queues of passengers inside and the second one is an area which does not have queues of passenger inside. Estimation of number of occupant in an area which has queues of passengers can be conducted using Equation (1). For an area which does not have passenger queues inside, estimation of number of occupant can be conducted using Equation (2).
(1)
(2)
where OA(t) = number of occupant in a specific area at time t, SA(t) = number of staffs at time t, OA(t) = number of occupant in a specific area at timet, PA,q(t) = number of queuing passengers during time t, PA,p(t) = number of queuing passengers being processed during time t, PA,i(t) = number of passengers entering area at time t, PA,o(t) = number of passengers exiting area at time t, SA(t) = number of staffs at time t
(3)
where Qo OA = number of occupant in a specific area, QW = cooling load rate of activites done by occupants (W).

579 Laksana Gema Perdamaian et al. / Procedia Environmental Sciences 17 ( 2013 ) 576 – 585
3.3. Energy Consumption and Cooling Rate Estimation of Lighting Systems
Electricity consumed by lighting systems is transformed to three fraction of heat, i.e. shortwave radiation, longwave radiation, and convection. The fractions can be distributed to the space (space fraction) or can be distributed to the plenum, interact with return air of the HVAC systems (plenum/return air fraction). Division of heat generated by lighting systems can be calculated using Equation 4 [7].
(4)
where fconv = convective fraction, fret = plenum/return air fraction, flw = longwave radiation fraction, and fsw = shortwave radiation fraction.
3.4. Energy Consumption and Cooling Rate Estimation of Transportation Systems
In this research, estimation of energy consumption and cooling load rate are done for two types of building transportation systems, escalator and lift. To obtain the cooling load rate estimation, power required by transportation system has to be estimated first.
Estimation of power required by escalator conducted using Equation (5).
(5)
where Pm,e = power required by motor of the escalator (watt), np,e(t) = number of passenger carried by the escalator Pm,e,H = power required to move handrail (watt), and
e = escalator system efficiency. Estimation of power required by lift system conducted using Equation 6 for upward-moving lift and
Equation 7 for downward-moving lift..
(6)
(7)
where Pml ml,c = mass of lift cab (kg), np,l = number of passengers, mp,l = total mass of passengers (kg), g = gravitational acceleration (9.81 m/s2), Al(t) = lift acceleration at time t (m/s2), Vl(t) = velocity of lift at time t (m/s), and mCW = counterweight mass (kg).

580 Laksana Gema Perdamaian et al. / Procedia Environmental Sciences 17 ( 2013 ) 576 – 585
Cooling load rate of transportation systems can be obtained using Equation (8)
(8)
where Qtr = cooling load of the transportation system (watt),
tr = transportation system efficiency, Ptr = power required by transportation system (watt).
3.5. Energy Consumption and Cooling Load Estimation of Electric Equipment
Electricity consumed by electric equipment is transformed to heat and work. Electricity which converted to heat is divided into three fractions, i.e. latent heat, wave radiation, and convection. Heat fraction division of the electric equipment can be obtained using equation (9) [7].
(9)
where fcv = convective heat fraction, fl = latent heat fraction, fr = radiation fraction, and fw = work fraction.
4. Implementation
Fig 1.Data input process to the software.
Secondary data
Assumption
Primary data
Data input
Building geometry and
construction and modeling
Occupant cooling load estimation
Lighting systems cooling load estimation
Transportation system cooling load estimation
Electric equipment
cooling load estimation
Building energy performance simulation software
Weather and environmental
data
Simulation result
581 Laksana Gema Perdamaian et al. / Procedia Environmental Sciences 17 ( 2013 ) 576 – 585
Data input for simulation software consists of primary data and secondary data. Primary data is obtained from direct measurement and observation and secondary data is obtained from equipment specification or interview with the building management staffs.
The research was conducted in October 2011, when the Terminal 3 was in very low load, because one of the client airlines was temporarily suspended. The number of occupant represents the low-load condition, not the ideal condition. The occupant pattern is assumed based on IATA Earliness Arrival Distribution. Cooling load of occupants is determined based on assumption that all of the occupants are in the same activity. The activity type depends on the area.
The cooling load of transportation system is obtained from calculation which combines assumptions and secondary data. Operation scheme of the transportation system is assumed appropriate with the occupation rate obtained from IATA Earliness Arrival Distribution-based calculation.
Electrical equipment calculated in this research includes office and entertainment equipment but not airport operational equipment such as baggage carousel and x-ray machine. The cooling load of the electric equipment is assumed based on the data obtained from ASHRAE 2009 Handbook of Fundamentals.
HVAC system sizing is not obtained from actual equipment specification but from autosizing which is a load-based sizing mechanism of the simulation software. Therefore, the electricity consumption of the HVAC system represents the amount of electricity needed by HVAC system based on the setpoint of the system, not the size or the specification of the equipment of the system.
5. Result and Discussion
5.1. Electricity Consumption of HVAC System
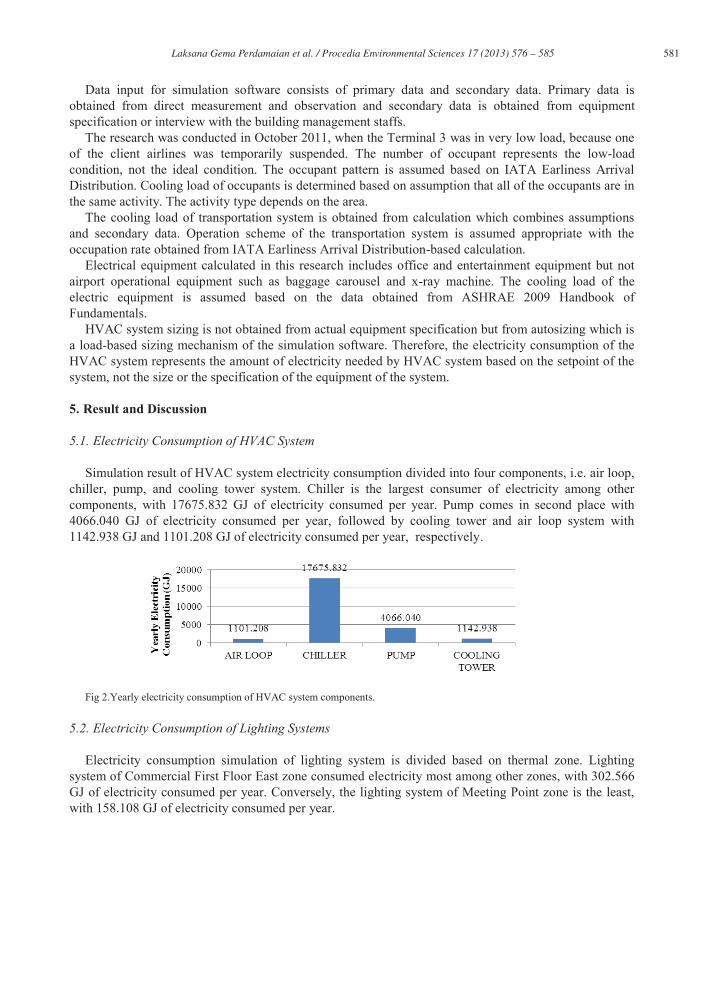
Simulation result of HVAC system electricity consumption divided into four components, i.e. air loop, chiller, pump, and cooling tower system. Chiller is the largest consumer of electricity among other components, with 17675.832 GJ of electricity consumed per year. Pump comes in second place with 4066.040 GJ of electricity consumed per year, followed by cooling tower and air loop system with 1142.938 GJ and 1101.208 GJ of electricity consumed per year, respectively.
Fig 2.Yearly electricity consumption of HVAC system components.
5.2. Electricity Consumption of Lighting Systems
Electricity consumption simulation of lighting system is divided based on thermal zone. Lighting system of Commercial First Floor East zone consumed electricity most among other zones, with 302.566 GJ of electricity consumed per year. Conversely, the lighting system of Meeting Point zone is the least, with 158.108 GJ of electricity consumed per year.

582 Laksana Gema Perdamaian et al. / Procedia Environmental Sciences 17 ( 2013 ) 576 – 585
Fig 3.Yearly electricity consumption of lighting system of zonelocated at the ground floor.
Fig 4. Yearly electricity consumption of lighting system of zonelocated at the first floor.
5.3. Electricity Consumption of Transportation Systems
Simulation of transportation system electricity consumption is divided based on unit of the system.There are five escalators and four lifts that are located at three zones.
Fig 5.Yearly electricity consumption of transportation system. Fig 6.Yearly electricity consumption of electric equipment.i l l i i i f i
583 Laksana Gema Perdamaian et al. / Procedia Environmental Sciences 17 ( 2013 ) 576 – 585
Transportation system which consumes largest is escalator connecting Meeting Point and CommercialFirst Floor East zone with 157.160 GJ of electricity consumed per year. Escalator connecting MeetingPoint and First Floor West zone comes in the second place with 143.812 GJ of electricity consumed per year. Two of these systems consume energy larger than other transportation system because they carry much more passengers than other systems. Transportation system which consumes smallest is Lift in Gate3 which connects Domestic Boarding Lounge zone with Gate 3, with 7.030 GJ of electricity consumedper year. This system also carries least passenger.
5.4. Electricity Consumption of Electric Equipment
Electricity consumption simulation of electric equipment is divided based on thermal zone. Each zonehas certain number and specific types of equipment, therefore it is possible to get different amount of energy consumption. All of the ten zones are simulated, except Baggage Claim West zone, because nocommercial activity and electric equipment are installed there.
Electric equipment installed at International Boarding Lounge zone consumes most among the others,with 170.834 GJ of electricity consumed per year, whereas electric equipment installed at Arrival West zone consumes least with 10.220 GJ of electricity consumed per year.
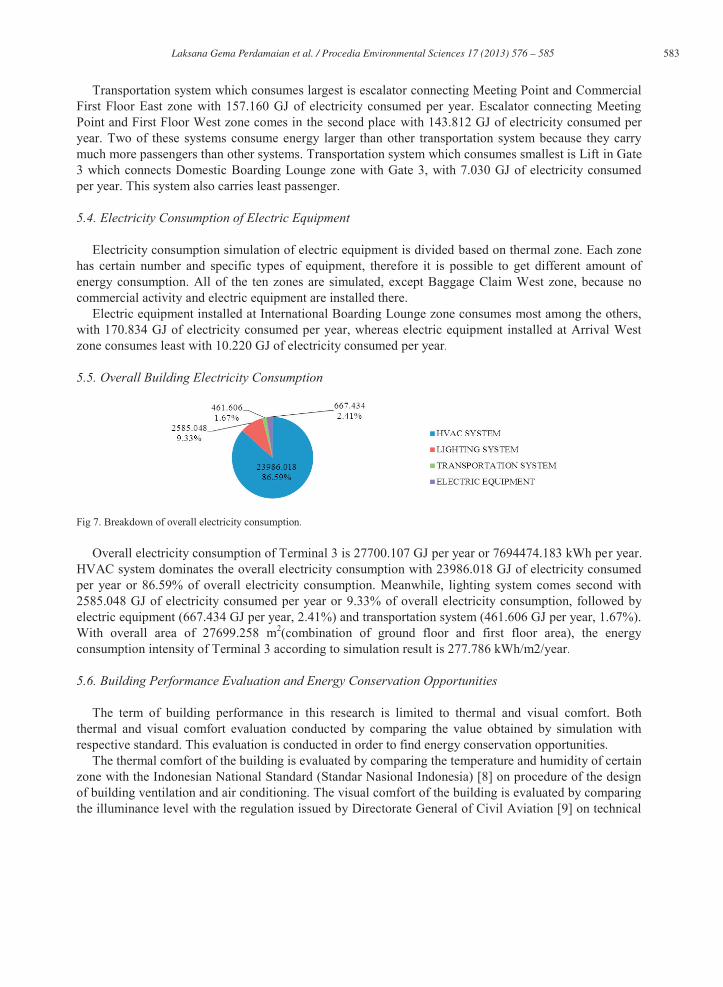
5.5. Overall Building Electricity Consumption
Fig 7. Breakdown of overall electricity consumption.
Overall electricity consumption of Terminal 3 is 27700.107 GJ per year or 7694474.183 kWh per year. HVAC system dominates the overall electricity consumption with 23986.018 GJ of electricity consumedper year or 86.59% of overall electricity consumption. Meanwhile, lighting system comes second with2585.048 GJ of electricity consumed per year or 9.33% of overall electricity consumption, followed by electric equipment (667.434 GJ per year, 2.41%) and transportation system (461.606 GJ per year, 1.67%).With overall area of 27699.258 m2(combination of ground floor and first floor area), the energyconsumption intensity of Terminal 3 according to simulation result is 277.786 kWh/m2/year.
5.6. Building Performance Evaluation and Energy Conservation Opportunities
The term of building performance in this research is limited to thermal and visual comfort. Both thermal and visual comfort evaluation conducted by comparing the value obtained by simulation withrespective standard. This evaluation is conducted in order to find energy conservation opportunities.
The thermal comfort of the building is evaluated by comparing the temperature and humidity of certain zone with the Indonesian National Standard (Standar Nasional Indonesia) [8] on procedure of the design of building ventilation and air conditioning. The visual comfort of the building is evaluated by comparingthe illuminance level with the regulation issued by Directorate General of Civil Aviation [9] on technical

584 Laksana Gema Perdamaian et al. / Procedia Environmental Sciences 17 ( 2013 ) 576 – 585
requirements of airport technical facility operation and by comparing the glare index with the maximum allowable glare index [7].
The first energy conservation effort is by increasing HVAC setpoint temperature. According to SNI 03-6572-2001, temperature value fit in the comfort zone for tropical climate such as Indonesia is between 20.5°C and 27.1°C. Range between 20.5°C and 22.8°C i
achieve the level of optimally comfortable, the setpoint temperature can be increased until 25.8°C. However, the new setpoint temperature proposed in this research is at 24.5°C. The upper limit value is not chosen in order to minimize the occurrence of temperature exceeds the limit of optimally comfortable level. The value 24.5°C is chosen because middle value between existing setpoint (23.5) and upper limit of optimally comfortable level (25.8) is 24.45, or can be rounded up to 24.5°C.
The second way to achieve energy conservation is by rescheduling AHU operation. Simulation result shows that some AHUs keep operating at low-occupation hours when there is no departure or arrival. This makes the temperature of the zone served by those AHU falls below comfortable limit (20.5°C) and at the same time, the electricity consumed by the AHU is useless.
The third mean to obtain reduction in energy consumption is by replacing window films. According to simulation result, glare occurs at zones located at the first floor. The glare index measured at those zones is over 22, whereas 22 is the maximum allowable glare index for office [7]. High glare index can causes visual discomfort. Therefore replacement of windows film in order to reduce glare is done. At the same time, this can reduce solar heat gain and hence can reduce electricity consumed by HVAC system.
5.7. CO2 Emission Reduction by Increasing Energy Efficiency
In the context of Java-Madura-Bali electricity grid network, every MWh produced is equal to the 0.741 ton of CO2 emitted [10]. Thus, every kWh electricity saving could give 0.741 kg of CO2 emission reduction.
5.8. Formulation and result of Energy Conservation and CO2 Emission Reduction Scenarios
Energy conservation efforts mentioned above are formulated to become three energy conservation scenarios, Scenario 1, Scenario 2, and Scenario 3. Scenario 1 consists of setpoint temperature increment. Scenario 2 consists of setpoint temperature increment combined with AHU rescheduling. Scenario 3 consists of setpoint temperature increment and AHU rescheduling combined with window film replacement.
Table 1. Formulation and result of Energy Conservation and CO2 Emission Reduction Scenarios.
Base Case Scenario 1 Scenario 2 Scenario 3 Electricity Consumed 27700.107 26482.144 26287.844 226271.312 Saving GJ - 1217.963 1412.263 1428.795
% - 4.40 5.10 5.16 Energy Use Index (kWh/m2) 277.786 265.572 263.624 263.458 CO2 Emission Reduction (ton/year) - 250.697 290.691 294.094
585 Laksana Gema Perdamaian et al. / Procedia Environmental Sciences 17 ( 2013 ) 576 – 585
6. Conclusion
1) Simulation based on assumptions predicts that overall electricity consumption of Terminal 3 Soekarno-Hatta International Airport is 27700.107 GJ or 7.694 MWh per year.
2) HVAC system consumed the largest portion (86.59%) of overall building electricity demand, with 23986.018 GJ per year. Comes in second place is lighting system, accounted for 9.33% of overall annual building electricity consumption, equivalent to 2585.048 GJ, followed by electric equipment (2.41%, 667.434 GJ), and transportation system (461.606 GJ per year, 1.67%) comes last.
3) According to that simulation, The Energy Use Index (EUI) of Terminal 3 Soekarno-Hatta International Airport is 277.786 kWh/m2/year.
4) Three energy conservation efforts are proposed, they are increment of temperature setpoint, AHU rescheduling, and window film replacement.
5) Implementation of Scenario 1 could reduce overall building electricity consumption 1217.963 GJ (4.40%) and decrease 250.697 ton of CO2 emission per year, whereas implementation of Scenario 2 could decrease building electricity consumption 1412.263 GJ (5.10%) and lower the emission of CO2 up to 290.691 ton per year and Scenario 3 could reduce building electricity consumption 1428.795 GJ (5.16%) and decrease 294.094 ton of CO2 emission per year.
References
[1] Building Simulation 2009, Eleventh International IBPSA Conference,
page 1887 1893, Glasgow, Scotland, 27 30 July 2009. [2] Fatma Tuba Ceyhan Zeren. Energy Performance Analysis of Adnan Menderes International Airport (ADM). Thesis, Graduate
. [3] - Energy and Buildings, 38: 421 428,
2006. [4] ASHRAE. 2009 ASHRAE Handbook Fundamentals (SI). American Society of Heating, Refrigeration, and Air Conditioning
Engineers Inc., Atlanta, Georgia, U.S., 2009. [5] Drury B. Crawley, Linda K. Lawrie, Frederick C. Winkelmann, W.F. Buhl, Y. Joe Huang, Curtis O. Pedersen, Richard K.
-generation Energy and Buildings, 33:319 311, 2001.
[6] - Journal of the Eastern Asia Society for Transportation Studies, 6 : 724 735, 2005.
[7] EnergyPlus Input-Output Reference. Technical document, University of Illinois, Urbana, Illinois, and Ernest Orlando Lawrence Berkeley National Laboratory, Berkeley, California, U.S., 2011.
[8] Tata Cara Perancangan Sistem Ventilasi dan Pengkondisian Udara pada Bangunan Gedung. Standar Nasional Indonesia (SNI) 03-6572-2001. Badan Standardisasi Nasional, Jakarta, 2001.
[9] Persyaratan Teknis Pengoperasian Fasilitas Teknik Bandar Udara. Peraturan Direktur Jenderal Perhubungan Udara Nomor SKEP/77/VI/2005, Direktorat Jenderal Perhubungan Udara, Kementerian Perhubungan Republik Indonesia, Jakarta, 2005.
[10] Informasi Terbaru Faktor Emisi untuk Proyek CDM pada Delapan Sistem Interkoneksi Tenaga Listrik di Indonesia. Surat Edaran Nomor B-06/KNMPB/DNPI/03/2012. Dewan Nasional Perubahan Iklim Republik Indonesia, Jakarta, 2012.